academic leadership retreat the campus economic and financial outlook chris cimino august 27, 2014
TRANSCRIPT
Academic Leadership Retreat
The Campus Economic and Financial Outlook
Chris CiminoAugust 27, 2014

1. Capital Funding2. Financial Overview3. Formula Funding Update4. Final Thoughts
The Campus Economic and Financial Outlook

1. Capital Funding2. Financial Overview3. Formula Funding Update4. Final Thoughts
The Campus Economic and Financial Outlook
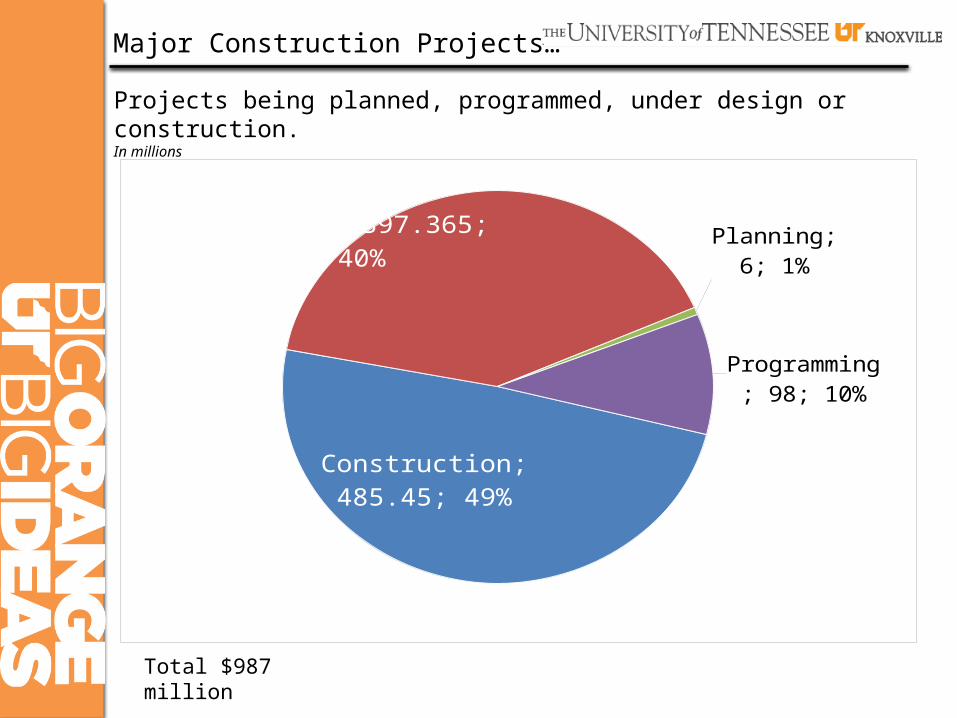
Major Construction Projects…
Projects being planned, programmed, under design or construction.In millions
Construction; 485.45; 49%
Design; 397.365; 40% Planning; 6; 1%
Programming; 98; 10%
Total $987 million
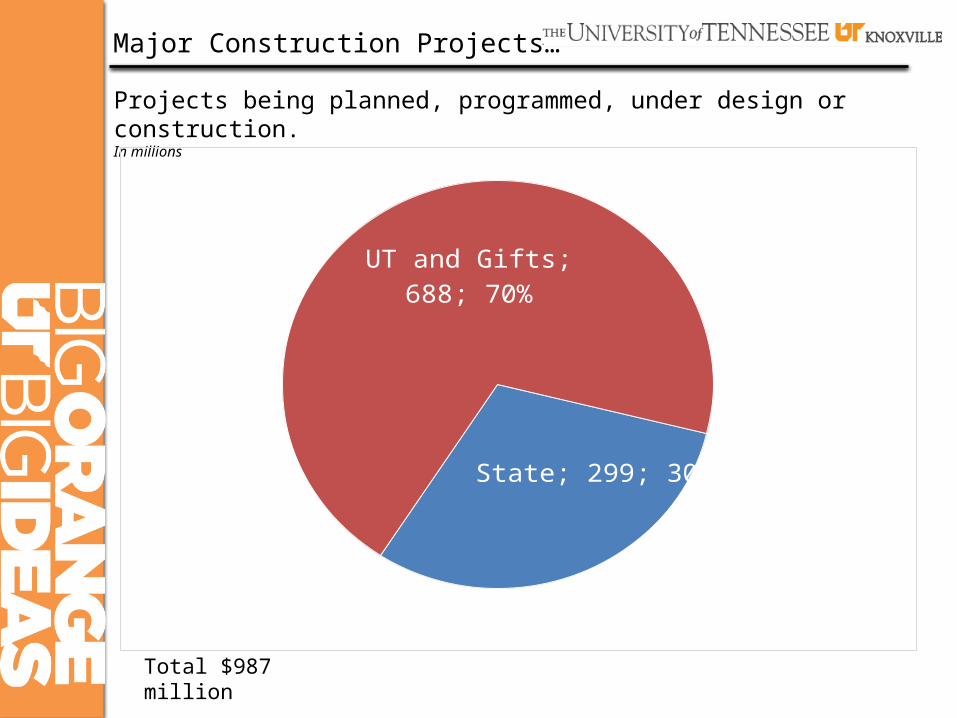
Major Construction Projects…
Projects being planned, programmed, under design or construction.In millions
State; 299; 30%
UT and Gifts; 688; 70%
Total $987 million

Capital Maintenance and Outlay
2001
2002
2003
2004
2005
2006
2007
2008
2009
2010
2011
2012
2013
2014
2015
-
10.00
20.00
30.00
40.00
50.00
60.00
70.00
80.00
-
-
-
-
30.
40
56.
60
45.
58
65.
00
-
-
-
-
75.
25
24.
00
- 3
.18
1.8
5 6.2
2
2.3
0
12.
34
7.2
0
3.7
5 7.8
0
- 3
.50 8.0
0
4.8
0 11.
00
6.0
0 14.
00
Outlay Maintenance

1. Capital Funding2. Financial Overview3. Formula Funding Update4. Final Thoughts
The Campus Economic and Financial Outlook

Tuition & Fees; 330.7;
30%
Appropria-tions; 188;
17%
Capital; 136; 12%
Grants & Contracts; 244.9; 22%
Sales & Ser-vices; 4.3; 0%
Other; 40.4; 4%
Auxiliaries; 171.9; 15%
FY 2014 TOTAL REVENUE WITH CAPITAL(shown in millions and percent of total)
band and sports camps, testing services, literary publications
F&A revenue, misc. rentals and sales, conference revenue
Total $1.12 billion
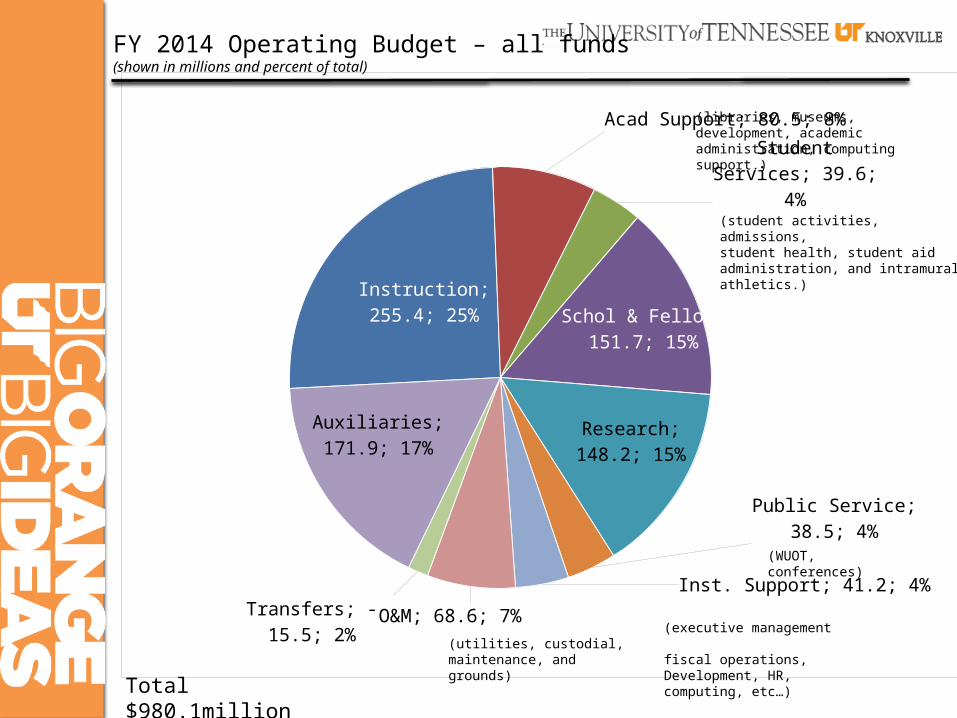
Instruction; 255.4; 25%
Acad Support; 80.5; 8%
Student Services; 39.6; 4%
Schol & Fellow; 151.7; 15%
Research; 148.2; 15%
Public Service; 38.5; 4%
Inst. Support; 41.2; 4%
O&M; 68.6; 7%Transfers; -15.5; 2%
Auxiliaries; 171.9; 17%
FY 2014 Operating Budget – all funds(shown in millions and percent of total)
(utilities, custodial, maintenance, and grounds)
(executive management fiscal operations, Development, HR, computing, etc…)
(student activities, admissions, student health, student aid administration, and intramural athletics.)
(libraries, museums, development, academic administration, computing support.)
(WUOT, conferences)
Total $980.1million

Where our revenues come from…
FY 2014 Auxiliary Units(shown in millions)
Total $172 million
Residence Halls; 42.6; 25%
Dining; 4.4; 3%
Bookstores; 18; 10%Parking; 9.5; 6%
Athletics; 95; 55%
Other; 2.9; 2%
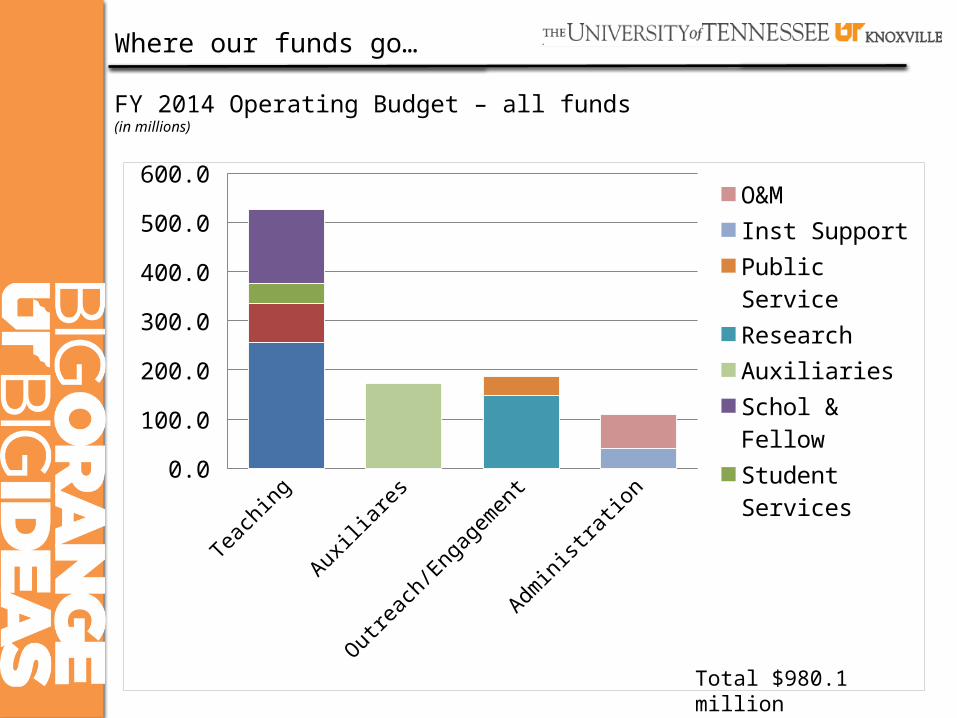
Where our funds go…
FY 2014 Operating Budget – all funds(in millions)
Teac
hing
Auxiliar
es
Outreac
h/Enga
gemen
t
Administrati
on0.0
100.0
200.0
300.0
400.0
500.0
600.0 O&M
Inst Support
Public Service
Research
Auxiliaries
Schol & Fellow
Student Services
Acad Support
Instruction
Total $980.1 million

330.7; 34%
188; 19%
244.9; 25%
171.9; 18%
44.6; 5%
Tuition & Fees Appropriations Grants & Contracts Auxiliaries Other
165.3; 26%
174.8; 27%
143.1; 22%
119.2; 19%
35.5; 6%
Total Budget Revenue Summary
FY 2014FY 2005
(shown in millions and percent of total)

FY 2014-15 Appropriations
Knoxville
FY 2014 Appropriations $ 174,335,300
Formula Outcomes $ 3,758,400
Group Health Insurance 916,900
401(k) Match 291,400
Waivers 589,300
Total FY 2015 Appropriation* $ 179,891,300
Chiller system improvements $ 5,000,000
Science and Engineering system upgrades 9,000,000
Total Proposed Capital Maintenance $ 14,000,000
*excludes access & diversity funds of $2.3 million
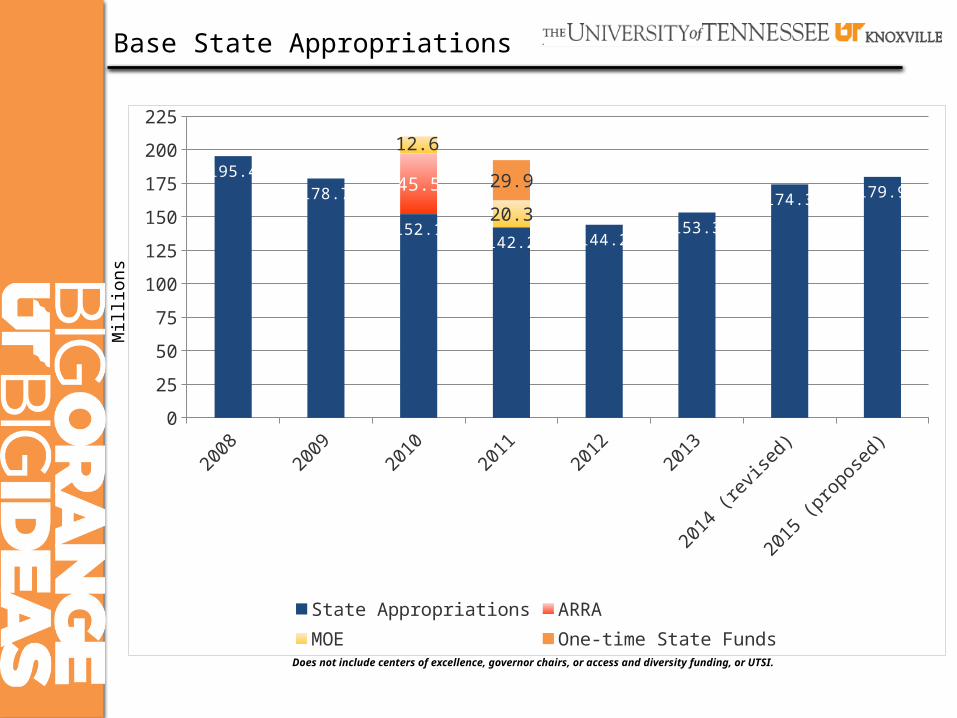
Does not include centers of excellence, governor chairs, or access and diversity funding, or UTSI.
Mill
ions
Base State Appropriations
20082009
20102011
20122013
2014 (revise
d)
2015 (pro
posed)0
25
50
75
100
125
150
175
200
225
195.4
178.7
152.1142.2 144.2
153.3
174.3 179.945.5
12.6
20.3
29.9
State Appropriations ARRA MOE One-time State Funds
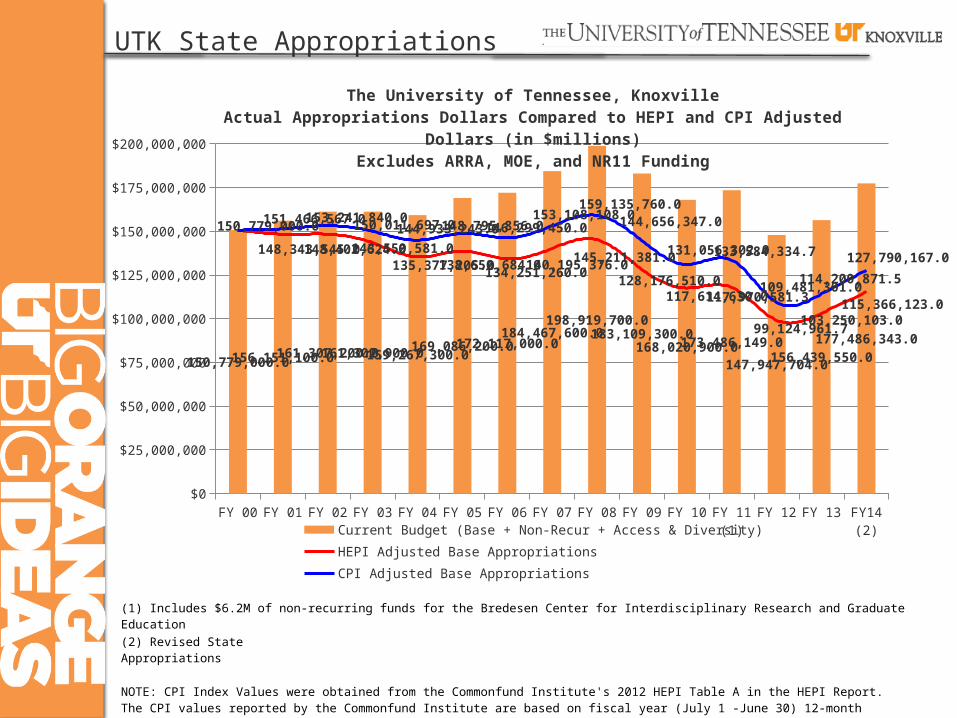
UTK State Appropriations
(1) Includes $6.2M of non-recurring funds for the Bredesen Center for Interdisciplinary Research and Graduate Education(2) Revised State Appropriations
NOTE: CPI Index Values were obtained from the Commonfund Institute's 2012 HEPI Table A in the HEPI Report. The CPI values reported by the Commonfund Institute are based on fiscal year (July 1 -June 30) 12-month averages rather than the annual published CPI values computed over the calendar 12 month period that are usually reported by the Bureau of Labor Statistics.
FY 00 FY 01 FY 02 FY 03 FY 04 FY 05 FY 06 FY 07 FY 08 FY 09 FY 10 FY 11 (1)
FY 12 FY 13 FY14 (2)
$0
$25,000,000
$50,000,000
$75,000,000
$100,000,000
$125,000,000
$150,000,000
$175,000,000
$200,000,000
150,779,000.0156,151,100.0161,307,200.0161,302,900.0159,267,300.0169,086,200.0172,117,000.0
184,467,600.0198,919,700.0
183,109,300.0168,020,900.0173,486,149.0
147,947,704.0156,439,550.0177,486,343.0
148,343,545.0148,402,624.0143,559,581.0135,377,205.0138,650,684.0134,251,260.0140,195,376.0145,211,381.0
128,176,510.0117,614,630.0117,970,581.3
99,124,961.7103,250,103.0
115,366,123.0
150,779,000.0151,466,567.0153,241,840.0150,011,697.0144,933,243.0148,795,856.0146,299,450.0153,108,108.0
159,135,760.0144,656,347.0
131,056,302.0133,584,334.7
109,481,301.0114,200,871.5
127,790,167.0
The University of Tennessee, KnoxvilleActual Appropriations Dollars Compared to HEPI and CPI Adjusted Dollars (in $millions)
Excludes ARRA, MOE, and NR11 Funding
Current Budget (Base + Non-Recur + Access & Diversity) HEPI Adjusted Base AppropriationsCPI Adjusted Base Appropriations
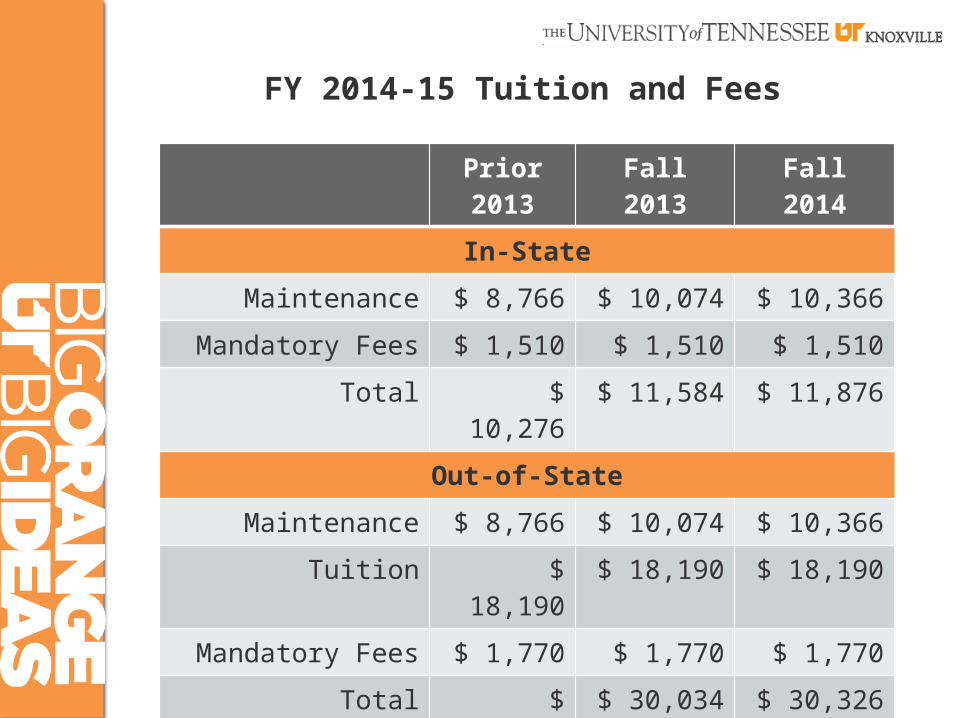
FY 2014-15 Tuition and Fees
Prior 2013 Fall 2013 Fall 2014
In-State
Maintenance $ 8,766 $ 10,074 $ 10,366
Mandatory Fees $ 1,510 $ 1,510 $ 1,510
Total $ 10,276 $ 11,584 $ 11,876
Out-of-State
Maintenance $ 8,766 $ 10,074 $ 10,366
Tuition $ 18,190 $ 18,190 $ 18,190
Mandatory Fees $ 1,770 $ 1,770 $ 1,770
Total $ 28,726 $ 30,034 $ 30,326
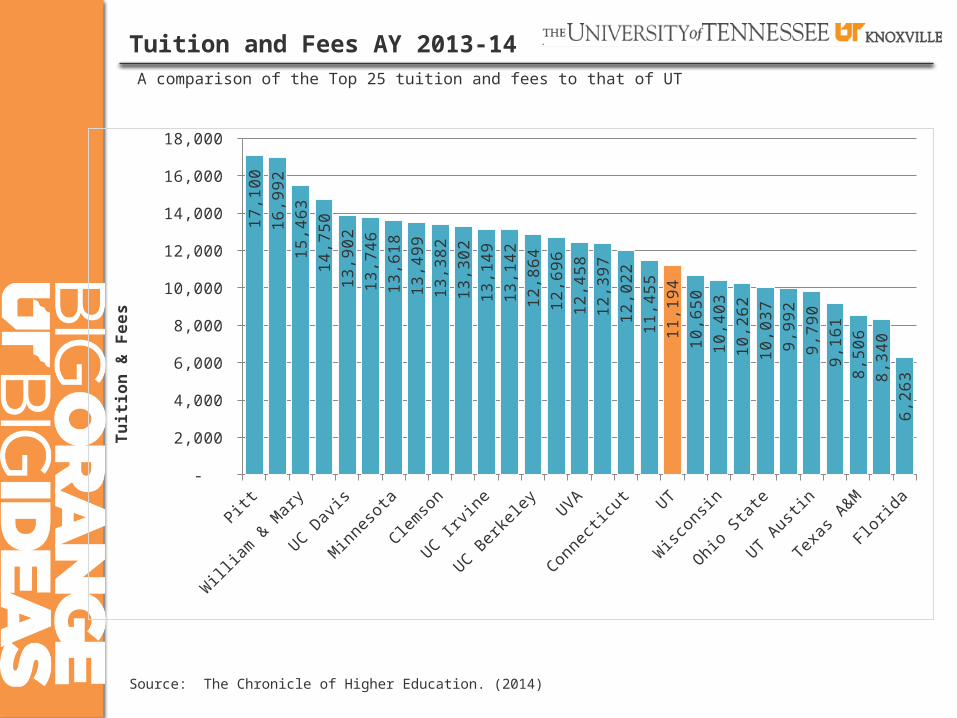
Tuition and Fees AY 2013-14A comparison of the Top 25 tuition and fees to that of UT
Source: The Chronicle of Higher Education. (2014)
Pitt
Penn State
Willi
am & M
ary
Illinois
UC Davis
UC Santa Barb
ara
Minneso
ta
Rutgers
Clemson
UC San D
iego
UC Irvin
e
Mich
igan
UC Berkeley
UCLA UVA
Wash
ington
Connecticu
t
Virginia Tech UT
GA Tech
Wisc
onsin
Georgia
Ohio State
Purdue
UT Austin
Maryl
and
Texas A
&MUNC
Florid
a -
2,000
4,000
6,000
8,000
10,000
12,000
14,000
16,000
18,000
17,
100
16,
992
15,
463
14,
750
13,
902
13,
746
13,
618
13,
499
13,
382
13,
302
13,
149
13,
142
12,
864
12,
696
12,
458
12,
397
12,
022
11,
455
11,
194
10,
650
10,
403
10,
262
10,
037
9,9
92
9,7
90
9,1
61
8,5
06
8,3
40
6,2
63
Tuiti
on &
Fee
s
$-
$5,000
$10,000
$15,000
$20,000
$25,000
$30,000
UC
Dav
is;
$9,7
51
Nor
th C
arol
ina;
$15
,749
UC
Irvi
ne;
$9,2
07
UC
San
Die
go;
$9,9
11
UCL
A; $
10,1
99
UC
SB;
$8,8
04
UC
Berk
eley
; $7
,309
Penn
Sta
te;
$4,7
33
Min
neso
ta;
$7,6
32
Mic
higa
n; $
7,27
7
Wis
cons
in;
$9,8
12
GA
Tech
; $9
,143
Mar
ylan
d; $
10,9
92
Illin
ois;
$5,
413
Rutg
ers;
$6,
558
W&
M;
$4,7
76
Geo
rgia
; $8
,451
Flor
ida;
$11
,658
Virg
inia
; $5
,280
Was
hing
ton;
$4,
901
UTK
; $6
,795
Ohi
o St
ate;
$5,
796
Clem
son;
$4,
415
Purd
ue;
$5,7
25
UT
Austi
n; $
5,80
9
A&M
; $5
,735
Pitt
sbur
gh;
$5,0
23
$13
,877
$7,
694
$14
,226
$13
,234
$12
,692
$13
,671
$14
,985
$16
,444
$13
,524
$13
,437
$10
,384
$10
,980
$8,
908
$14
,428
$13
,073
$13
,570
$9,
842
$6,
170
$12
,006
$12
,383
$9,
092
$10
,037
$11
,242
$9,
900
$9,
792
$8,
505
$6,
590
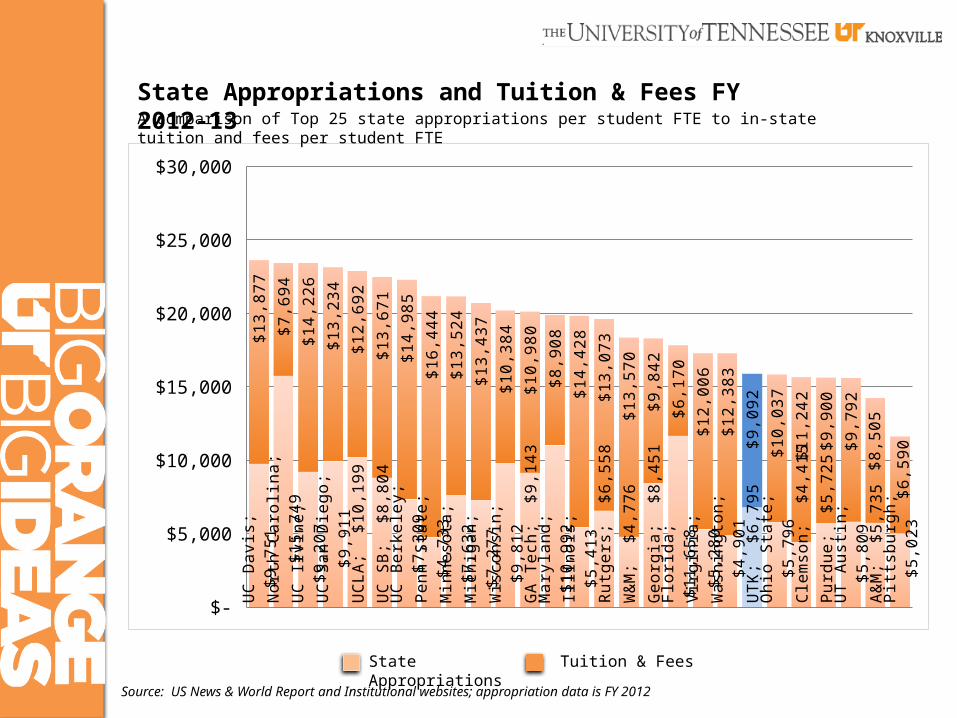
State Appropriations and Tuition & Fees FY 2012-13A comparison of Top 25 state appropriations per student FTE to in-state tuition and fees per student FTE
Source: US News & World Report and Institutional websites; appropriation data is FY 2012
Tuition & FeesState Appropriations

Undergraduate Mandatory Fees
19831985
19871989
19911993
19951997
19992001
20032005
20072009
20112013
$-
$200
$400
$600
$800
$1,000
$1,200
$1,400
$1,600
UPSF Technology Facilities Transit Study Abroad Library

Percent chance in tuition
1997-98
1998-99
1999-00
2000-01
2001-02
2002-03
2003-04
2004-05
2005-06
2006-07
2007-08
2008-09
2009-10
2010-11
2011-12
2012-13
20013-14
0.0%
2.0%
4.0%
6.0%
8.0%
10.0%
12.0%
14.0%
16.0%
8.0%
15.0%
4.6%
6.0%
9.0%
9.0%
6.0%
8.0%8.0%
15.0%
4.5%
8.0%
7.5%
9.0%
7.9%
13.0%
6.0%
12.0%
8.0%
Undergraduate Graduate

1. Capital Funding2. Financial Overview3. Formula Funding Update4. Final Thoughts
The Campus Economic and Financial Outlook

Old Formula
(((.01*instr)+(.125*as)+((ug/total fac units)*instr *.20)+(is*.10)+(GSF*RPSF(5.14))+(port bldgs * pbr (2.57)+(oldsf*oldsfr(1.71)+ar+3.11*sqft = utilities + asb+infl+(.10*quip inv)+ps+salary infl*total faculty units+clerical(.25*basic instr))*(infl))*.60)=basic request + perf score*.0545*basic request+access & diversity+legislative initiatives = FINAL NEED

Background to the new formula
• Prior formula was based on enrollment• Included a performance-based piece• In 2009, Gov. Phil Bredesen became
interested in educational reform• In 2010, Complete College TN Act mandated
new formula• THEC convened Formula Review Committee
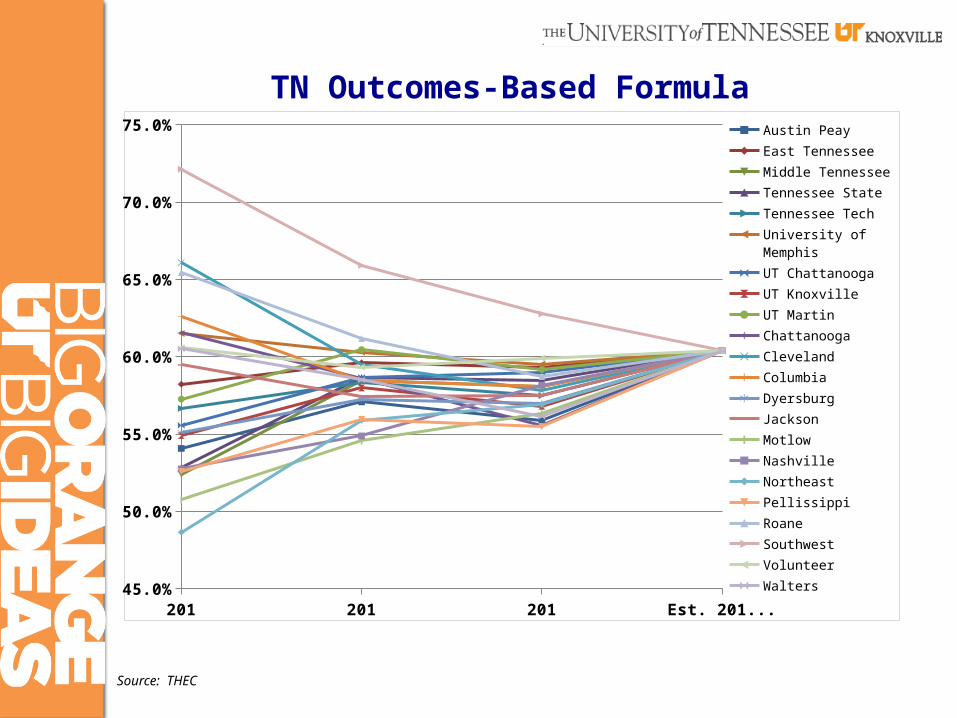
TN Outcomes-Based Formula
2010-11 2011-12 2012-13 Est. 2013-1445.0%
50.0%
55.0%
60.0%
65.0%
70.0%
75.0% Austin Peay
East Tennessee
Middle Tennessee
Tennessee State
Tennessee Tech
University of Memphis
UT Chattanooga
UT Knoxville
UT Martin
Chattanooga
Cleveland
Columbia
Dyersburg
Jackson
Motlow
Nashville
Northeast
Pellissippi
Roane
Southwest
Volunteer
Walters
Source: THEC
• Proper outcomes• Appropriate priorities• Subpopulation/Premium level• Fixed Costs• Out of State Tuition Component• Other
Funding Formula Principles

OutcomesStudent Progression: 24 Credit HoursStudent Progression: 48 Credit HoursStudent Progression: 72 Credit HoursBachelors DegreesMasters DegreesDoctoral/Law DegreesResearch/Grant FundingStudent TransfersDegrees per 100 FTEGraduation Rate

2010-11 2011-12 2012-13 2013-14 2014-15-5.0%
0.0%
5.0%
10.0%
15.0%
20.0%Cumulative Change in Appropriations at Universities Due to Formula
APSU ETSU
MTSU TSU
TTU UM
UTC UTK
UTM Total Funding

1. Capital Funding2. Financial Overview3. Formula Funding Update4. Final Thoughts
The Campus Economic and Financial Outlook

1. State support will continue to struggle2. Greater focus on efficiency (e.g. shared services)3. Space utilization / capacity across all areas4. Deferred maintenance5. Continue to build6. Alternative revenues in campus operations,
infrastructure, licensing, and procurement.
Final thoughts….

QUESTIONS?