acarp c21041 preparing a mine for ... - csiro publications
TRANSCRIPT

ENERGY FLAGSHIP/CLIMATE ADAPTATION FLAGSHIP
ACARP C21041
Preparing a mine for both drought and flood - Stage 1: a vulnerability and adaptive capacity study Jane H Hodgkinson, Micaela Grigorescu, Habib Alehossein
EP132938 APRIL 2013
ACARP C21041

Advanced Coal Portfolio/Climate Adaptation Flagship
Citation
Hodgkinson, J.H., Grigorescu, M., Alehossein, H., (2013) ACARP C21041, Preparing a mine for both drought and flood - Stage 1: a vulnerability and adaptive capacity study. CSIRO report EP132938 72pp
Copyright and disclaimer
© 2013 CSIRO To the extent permitted by law, all rights are reserved and no part of this publication covered by copyright may be reproduced or copied in any form or by any means except with the written permission of CSIRO.
Important disclaimer
CSIRO advises that the information contained in this publication comprises general statements based on scientific research. The reader is advised and needs to be aware that such information may be incomplete or unable to be used in any specific situation. No reliance or actions must therefore be made on that information without seeking prior expert professional, scientific and technical advice. To the extent permitted by law, CSIRO (including its employees and consultants) excludes all liability to any person for any consequences, including but not limited to all losses, damages, costs, expenses and any other compensation, arising directly or indirectly from using this publication (in part or in whole) and any information or material contained in it.

Preparing a mine for both drought and flood - Stage 1: a vulnerability and adaptive capacity study | i
Contents
Acknowledgments ............................................................................................................................................. iii
Executive summary............................................................................................................................................ iv
Part I Background 6
1 Introduction .......................................................................................................................................... 7
1.1 Previous work ............................................................................................................................. 7
1.2 Planned outcomes and project rationale ................................................................................. 10
1.3 The case-study .......................................................................................................................... 10
2 Methodology ....................................................................................................................................... 12
2.1 Introduction .............................................................................................................................. 12
2.2 Model design ............................................................................................................................ 13
2.3 Parameters and rationale ......................................................................................................... 13
2.4 Multi-criteria evaluation and models ....................................................................................... 25
2.5 Mine infrastructure ................................................................................................................... 28
2.6 Mine consultation and other considerations............................................................................ 29
2.7 Fault-tree analysis ..................................................................................................................... 30
2.8 Five-capitals analysis ................................................................................................................. 32
Part II Results and conclusions 34
3 Results ................................................................................................................................................. 35
3.1 Model results ............................................................................................................................ 35
3.2 Key hot-spots ............................................................................................................................ 37
3.3 Fault tree analysis ..................................................................................................................... 38
3.4 Adaptation options ................................................................................................................... 43
3.5 5-capitals assessment (5-CA) .................................................................................................... 45
3.6 Capacity to adapt ...................................................................................................................... 48
4 Discussion, conclusions and recommendations.................................................................................. 50
4.1 Further work ............................................................................................................................. 52
References ........................................................................................................................................................ 55
Appendix A ....................................................................................................................................................... 58
Appendix B ........................................................................................................................................................ 60
Appendix C ........................................................................................................................................................ 67
The CRATER quick how-to guide. ........................................................................................................ 67
Step 1 GIS-MCE.................................................................................................................................... 67
Step 2 FTA............................................................................................................................................ 68
Step 3 5-CA .......................................................................................................................................... 68

ii | C21041

Preparing a mine for both drought and flood - Stage 1: a vulnerability and adaptive capacity study | iii
Acknowledgments
The authors thank the funding body, ACARP, for providing the support and resources to perform this project in addition to the Geological Survey of Queensland for providing valuable in-kind support. We also acknowledge the generous and valuable support by the anonymous coal mine, in particular Claire Côte, Environmental Specialist and Bruce Gavin, Safety Specialist for providing data, time, expert input and continued encouragement throughout this project. The authors also acknowledge the support and interest of the ACARP monitors, Claire Côte, Carl Grant, Mahdi Mason, Stuart Ritchie and Keith Smith, and thank them very much for their valuable time and insights.

iv | C21041
Executive summary
This report describes a method developed to assess a mine’s vulnerability to extreme weather conditions and its adaptation options and capacity to adapt in order to reduce vulnerability. This method has been named CRATER (Climate Related Adaptation from Terrain Evaluation Results). The case-study described here is situated at a mine site in the Bowen Basin, Queensland.
The project was specifically designed to develop the decision making method, rather than to inform a single mine (the case-study) on how to adapt to reduce climate risk. Therefore, this report mainly focuses on the method, with some descriptive results and discussion. Nevertheless, the supporting mine has provided constructive feedback throughout the method development and on results. They have stated that the method has been useful and files will be used to inform both current and future activities and planning in addition to validating the cause of recent events.
Using CRATER, we have identified potential highest vulnerability areas (‘hot-spots’) for flood around the mine site, where early adaptation may be best focussed to reduce downtime and vulnerability. The 3-step approach uses a Geographic Information System (GIS) to perform:
multi-criteria evaluations by ranking natural conditions such as elevation, slope, drainage and soils, at the mine;
fault tree analysis to identify the reasons a failure occurs and the counter measures or adaptation option that are available; and
5-capitals analysis to assess the mines capacity to adapt using each adaptation option.
Mines may have risk management tools that identify risk reduction options. The tools selected here can augment those already in place and are useful for specifically working towards finding priorities, countermeasures and options best suited to the mine’s available capital. The methodology is transferrable to any mine with sufficient data, providing a practical decision making tool for other coal mines in Australia to perform a similar self-assessment. The results identify ‘no-regrets’ actions that, if taken, could not only reduce downtime related to an event, but may also enhance production and safety between such events, such as by providing more haulage routes, reduce risk to people and the environment through real time monitoring and improving emergency access.
Ranking systems have been widely used in science, research, and as decision making tools and have been used in this method, as it suited the assessment of combinations of both remotely-sensed and ground-borne data. Using a digital elevation model (DEM), drainage analysis and soil characteristics, each element is ranked according to vulnerability, calibrated against mine staff site-knowledge and evaluated in relation to infrastructure. This identified areas or processes most likely to fail under extreme rainfall and flooding conditions. The adaptive capacity of the mine site and mining company has been identified by assessing their resource availability, including technology, finances and staff capability.
The case-study at a mine site in the Bowen Basin has provided mine data and expertise for this project. The method was tested for flood as this type of event appears to have the most immediate (short notice) impact but could be applicable to any kind of extreme event including long-term or slow-to-develop drought conditions. The data was used primarily for the stage 1 of the three-part process to provide maps of areas that are most vulnerable (‘hot-spot’ maps). The following two stages were more ‘generic’ to avoid giving a mine-specific view of the method and to protect the mine’s confidential knowledge and information.

Preparing a mine for both drought and flood - Stage 1: a vulnerability and adaptive capacity study | v
The method presented in this report has focussed specifically on flood events. However, to incorporate or assess specifically for drought events, the same method can be used by augmenting the GIS data with a map of potential dust sources and locations that dust clouds form, for example, in addition to alternative water storage locations that can be accessed in an emergency, including in the event of a fire.
The results show that at the case-study mine site, there are a number of areas that are vulnerable to flood events, and three in particular were selected by the mine for further investigation. Those vulnerabilities extended to overland pipes being an environmental hazard during a flood, a number of buildings where personnel may be in danger and a major road/exit point. The adaptation options range from moving pipes or real-time water-flow monitoring, through to new evacuation procedures or raising buildings and roads. The supporting mine currently uses a risk analysis tool that can quantify the occurrence of the events and possible adaptations (root cause analysis) and commented that the FTA’s showed a logical thought process that leads to possible options for adaptation. The mine stated that past events validate the vulnerabilities identified in the analysis and the results are likely to be used to inform future planning. Another reviewer has stated that, where some mines may not have sufficient data to run CRATER as developed and presented here, there is still value in mines planning for such climatic events. Known or suspected ‘hot spots’ may be processed using steps 2 and 3 as a minimum to provide a concept of adaptation options and assess the mine’s capacity to adapt, although this was not tested during this project
This project has provided a framework that has been tested on and is now available to the Australian coal mining industry; the method will allow a mine to reduce climate or weather-related vulnerabilities in the future, in addition to reducing vulnerability to infrastructure, people, downtime and revenue. The method provides semi-quantitative information that can assist decision makers when designating investment for adaptation and improvement options for climate-related vulnerability reduction. It would be useful for assessing suitable sites for infrastructure at the pre-mining phase and can be re-run with new GIS data as mining progresses and the site is developed. Further developments of this method are required to re-test and refine the method and expand the areal extent of analysis to include multiple mine sites and mine to wash plant, port and ultimately, the client.
Backgrounds of each of the research team have been provided in Appendix A. A quick ‘how-to’ guide has been provided in Appendix C to identify the key steps to perform this methodology and should be used with the Methods section of this case-study to reproduce this process with new data and another site.

6 | C21041
Part I Background

Preparing a mine for both drought and flood - Stage 1: a vulnerability and adaptive capacity study | 7
1 Introduction
In recent years, coal mines have been encouraged to reduce water-use during prolonged drought. Simultaneously, changes to the regulatory environment led many mines to start operating under effectively a zero pit discharge situation. While this is not an issue in times of drought, it can be catastrophic in times of flood. Indeed, for the second time in three years, many coal mines in Australia have ceased production due to the onset of flooding rains. The impact of the change from El Niño to La Niña causing extreme changes in weather conditions was foreseeable but underestimated, emphasising a need for mines to more rapidly and more effectively adapt to both extreme flood and drought events over the mine’s life.
Typically, mines use historical data to perform flood risk mapping that may not be repeated due to infrequency of flood in the past. There is now broad acceptance that climate change will bring changes to climate patterns and extremes, so a method is required that allows a mine to reassess ‘hot spots’ prior to every wet season, as the mine site changes and the mining progresses.
As more intense or more frequent weather extremes are seen as part of the future weather pattern, authorities, insurance companies, shareholders and mining clients may expect mines to act on the knowledge of future climate and may, in future, disallow force majeure to be declared. This would mean mines, as part of their normal due diligence, need to adapt their plans to safely continue operations with reduced downtime following cyclone, flood, drought or other extreme events.
Hazard mapping around a mine would involve flood mapping, which requires creek hydrology data that is reasonably complex and includes lags and uncertainties. Resulting flood maps are, therefore, difficult to validate and calibrate, requiring a lot of work that can be time consuming and expensive. Additionally it requires technical expertise that is usually outsourced to consultants. As a result this is not repeated frequently and is unlikely to result in priorities to address or an explanation of what should be done to reduce vulnerability. Results would be expressed as probability of reaching a specific flood level under a range of scenarios and is rarely performed on a frequent or repeated basis. Processes are not available to transform the flood mapping results into adaptation strategies. Conversely, designing an adaptation strategy does not necessarily require the expensive flood map, as it can be done more cheaply and quickly with multiple criteria analysis shown here, that is fast and relies on data that is already available and can be performed routinely.
1.1 Previous work
Previous work performed at CSIRO through the Climate Adaptation Flagship has identified that adapting to naturally recurring or gradually changing climate patterns is rare in Australian mining and although some adaptation work is occurring, a suitable method for mine site assessments is currently lacking. Together with a paucity of evidence and knowledge relating to potential impacts and vulnerabilities, many mines remain vulnerable to fast- and slow-changing climate extremes. Insurance companies, customers, investors and mining companies are just some of the stakeholders who would benefit from reduced weather-related vulnerability at mine sites.
ACARP project C16035 (Côte et al. 2009) examined the complexity of water interactions in and around a mine site to assist mines with better water management and reduce uncertainty in the mine’s water balance. This knowledge was built on a previous ACARP project C15001 (Côte et al. 2010, Moran et al. 2006) that investigated the use of a systems model for improved performance of mine water management. A systems approach was found to be most appropriate because of the complex inter-connections between elements typical at a coal mine. The complex relationships extend throughout the mine and each element of the mine’s activities can be vulnerable to external

8 | C21041
impacts including climate and extreme events. A mine’s vulnerability to extreme weather and climate events was highlighted during the 2010-2011 wet season by the flooding that reduced coal-mining to almost a stand-still for several weeks. Along with other dynamic variables that a mine has to manage (such as hazards, equipment and revenue risk), the weather and climate in general poses a threat to the ongoing success of a mine.
For the past 3 years, the Climate Adaptation Flagship (CAF) of CSIRO has funded two projects to investigate the impact of climate on mining in Australia; one focuses on mining companies (led by Hodgkinson) and the other on mining communities (led by Loechel). The work to date has assessed views and actions in relation to past events and potential future climate impacts. The initial results have identified that mines typically respond with reactionary processes even where open cut mines are clearly vulnerable to extreme weather events. During such events, mines are typically reduced to either limited or no production. Mapping and addressing the management of variability in multiple ways across a mine will assist in reducing downtime and prioritising future adaptive or transformational work. Results have shown that few companies have performed a vulnerability assessment (prior to the Queensland floods in 2011) mainly due to a reported paucity of understanding and knowledge in the industry with regard to certainty or consideration of potential future risk and a lack of resources for performing any such assessment. Additionally, this may also be due to loss of skill-sets related to dealing with drainage and rainfall issues, having previously been exposed to long term drought, hence the importance of embedding a new methodology in to business practices to ensure mines will always be ready for an extreme event. Since mining industries typically re-adapt as new conditions occur, whether climatically, geologically or politically, new methods for assessing and adapting for future conditions have not yet been developed. A few large non-coal mining companies have been performing such work for over the past decade, but within coal mining, this appears to be an approach that may need to be demonstrated and tailored to Australian coal mines before it will be performed across the entire industry. Having already adapted to drought conditions a few years ago, the floods in Queensland have again highlighted the vulnerability of mines in Queensland and their need to be climate-ready.
Adaptation to climate extremes and the preparation of Australian industry and society for changed climate patterns has been the focus of considerable research through CSIRO, the federal government and other agencies (for example Park et al. 2011, Department of Climate Change 2010, PMSEIC 2007). However, mining in particular has only been investigated in Australia in the last two years and globally, only Canada has conducted a full investigation (Pearce et al. 2009). Whilst the Canadian study proved to be valuable in assessing their vulnerabilities and needs, the expected extreme weather events in Canada have different implications to those faced by the Australian industry. Thus, an independent Australian study was deemed necessary. The industry is well versed in dealing with extreme events, although adaptation is largely reactionary. However, changing climate patterns and unexpected combinations of weather extremes, such as the Queensland floods in the past 3 years after a threatening and prolonged drought, provide support that there is room for adaptation of methods and practices to relieve some levels of risk and reduce vulnerabilities and downtime for the industry in the future. The challenge is to identify the key areas requiring adaptation around a mine site and prioritising expenditure based on levels of certainty and vulnerability. The coal industry has been able to declare force majeure to relieve them of the need to deliver on promised contracts due to unforseen events. However, if a similar event occurs in the near future, it may not be deemed ‘unforeseeable’ and force majeure may be less easy to declare (McDonald, 2010); this would force a mine to deliver on a contract despite not being able to produce and thus purchasing the coal from the market may be the mine’s only option to fulfil the contract.
The Queensland Government’s former Department of Environment and Resource Management (DERM, now Environment Heritage and Protection EHP) guidelines (EPA 1994) for water management for example, state that a water management plan should identify and minimise actual and potential risks of harm to natural water flows posed by activities, in addition to defining management actions to minimise those vulnerabilities. The plan should minimise the quantity of water that is mine-affected and released by and from the project. Typically, a water management

Preparing a mine for both drought and flood - Stage 1: a vulnerability and adaptive capacity study | 9
plan would use historical data in determining potential events. As data are available for scenarios of the future that suggest there will be new climate, weather patterns and extremes (Whetton, 2011), incorporating future scenarios into planning may be prudent (for example VCCCAR 2011).
The CSIRO Climate Adaptation Flagship (CAF) has been investigating adaptation to climate extremes and change by the mining industry (Hodgkinson et al., 2009) as part of a larger initiative to identify future needs in Australian industry and society, in general. It was identified early that, unlike in many other sectors, little work has been performed or was being contemplated both in Australia and overseas, to specifically address risk to climate, both in the immediate and more distant future. Other CSIRO climate adaptation projects have recently performed adaptive capacity studies using the Five Capitals Model or Framework, originally used for modelling sustainable development and livelihoods (Ellis 2000). The method assesses the five resources available (natural, social, human, manufactured and financial) and can be used to envisage a sustainable future or to aid prioritisation of strategies that will lead to the envisaged future. The model was originally designed to show how resources may change over time and how the resources relate to sustainability in a society or the economy. This method has since been used more widely in various industries (for example Tanner, 2010, Brown et al., 2010, Porritt 2005, 2001, de Haan, 2000). Within the mining sector, this method has been used by CSIRO at workshops, asking mining companies and associated utilities companies to assess their five capitals in relation to their future needs, their capacity to adapt and the value of working cross-sector to take advantage of all resources available within the broader sector (Loechel et al. 2010). The method will be useful in this project to help mines to self-assess their own adaptive capacity by identifying what constrains or enables the mine to effectively manage production, safety and vulnerability using the five capitals, identifying where there may be needs, gaps and future opportunities.
Multi-criteria analysis or evaluation (MCE) considers the interaction of numerous and various conditions and inputs to allow an informed decision to be made in a complex system, such as across a mine site. Developed in the 1960s, there has been widespread use of this approach and there are many multi-criteria methods available today. For the purposes of this study, we will use spatial multi-criteria evaluation to allow cross-analysis of criteria, many of which may conflict, from both the natural and man-made environment in and around the mine site. First presented by Carver (1991), MCE was integrated with geographic information systems (GIS) to assist decision making with the means to evaluate various alternatives on the basis of multiple and conflicting criteria or objectives. The method has been used widely both individually and across the built- and natural environments (van Haaren and Fthenakis, 2011, Preda and Gimber, 2006, Preda, 2009, Qing et al., 2007, Chakhar and Mousseau, 2007), including flood damage risk management (Yang et al., 2011, Raaijmakers, 2006). The mining industry is familiar with GIS, so analysis in a geo-referenced environment suits existing industry skills.
Originally designed in the 1960s to study the safety of missile launch controllers, fault-tree analysis has since been developed further and used widely for establishing the reliability and safety of complex systems. For example, it has been used for analysing safety in aviation, the nuclear industry, in mining for equipment reliability, maintainability and safety (for example, Dhillon, 2008, Iverson et al., 2001, Lewis et al., 1979), and other industries for major hazard management. The method is a systematic procedure for deducing the basic causes of a fault event, where a single fault is situated at the top of a flow chart and expands to identify the multiple-contributors that can lead to that failure occurring. Each item is then ranked based on the possibilities and the likelihood of fault or failure occurrence. Additionally, possible control measures (i.e. means of adaptation) are then identified for each appropriate risk or vulnerability, providing a measure on how to control the vulnerability. Fault-tree analysis is well-suited to analysis of specific failure at a mine site, due to the complex system of operation and multiple levels, where failure can occur. This method will be used to analyse specific vulnerabilities that are identified as priorities, after multi-criteria analysis has been performed across the mine. Fault tree analysis and other similar methods such as root cause analysis or system failure conditions analysis is commonly used in the mining industry and therefore well adapted to industry skills.

10 | C21041
1.2 Planned outcomes and project rationale
Having discussed the project aims with the supporting mine and ACARP monitors, it was agreed that the primary focus, to develop and test the method, would be best achieved by focussing on either flood or drought events at this stage. This would enable a more defined focus and allow the project to be equally, developed for other event types at a later stage. It was agreed flooding will be the focus of this case-study as recent events will provide the most useful data.
The project aims to provide a framework that:
mines can integrate into their current risk assessment methodology
uses data that would typically be available at a mine
assesses locations within the mine site that may be vulnerable to flood caused by an extreme weather event
can narrow down areas of the mine where adaptation may provide the best saving of dollars and/or time
supports decision making for adaptation
may assist to reduce insurance costs
will assist a mine to reduce downtime caused by climatic events that ultimately will ease the impact such events have on the Australian GDP
can be realigned to assess for vulnerability to other extremes
increase client and shareholder confidence by way of reducing vulnerability.
The project aims to provide a report containing a methodology and example through a case-study in the Bowen Basin, a presentation to a relevant audience through a conference or workshop and a journal publication.
1.3 The case-study
A coal mine in the Bowen Basin, Queensland kindly provided a site study for this project but shall remain anonymous. The site studied (Figure 1.1) covers an area of 155 km2 with gently undulating to hilly terrain. Coal at this site is mined both at the surface and underground and is serviced by road and rail (for the purpose of this study surface mining is the main focus). The mean annual temperatures in the area range from approximately 15 to 30˚C. The hottest months are from October to March, and these are also the wettest.
Annual rainfall is around 650 mm (data from Clermont Post Office, Bowen Basin, Source BOM 2013). However, over the last 100 years, 25 years have experienced at least one month when 250 mm of rain fell during that single month, most frequently January and February but typically December to March although this has occurred as early as November (1917) and as late as April (1983). Some of those years were also generally much wetter than usual – annual rainfall of over one metre has occurred 11 times in the past 100 years. Although annual rainfall may not indicate that very wet months occurred, or whether it led to flooding, patterns of rainfall and historical data such as these from BOM and local data collection points may be used to assess risk of flooding at a mine site. Antecedent rain may lead to a wet landscape that may then flood if heavy, additional rainfall occurs. The value of historical data identifies that the region has been prone to heavy and intermittent rain events, and although past patterns may not be the same as those of the future, the extremes that cause risk are expected to increase.

Preparing a mine for both drought and flood - Stage 1: a vulnerability and adaptive capacity study | 11
Figure 1.1 Geological setting and mine infrastructure at the study site.
German Creek Formation
Qa-QLD
Back Creek Group
Duaringa Formation
Duaringa Formation
Fair Hill Formation
Td-QLD
Duaringa Formation
Qa-QLD
Fair Hill Formation
MacMillan Formation
Duaringa Formation
Qa-QLD
Duaringa Formation
MacMillan Formation
Ti-St Lawrence-YARROL/SCAG
Duaringa Formation
Ti-St Lawrence-YARROL/SCAG
Duaringa Formation
Legend
Underground infrastructure
Roads
Power lines
Railway
Buildings
Geological formations
Back Creek Group
Fair Hill Formation
German Creek Formation
MacMillan Formation
Duaringa Formation
Tertiary sediments
Tertiary volcanics
Quaternary sediments
0 5 102.5Km

12 | C21041
2 Methodology
The method has been designed so that it is repeatable at any scale that data is available and so that it can be reproduced at the same mine, as mining progresses and the dynamic environment changes. For the purposes of this project, available data was used for assessing a snap-shot in time. Using a digital elevation model (DEM) of the pits and surrounding areas within the study site, the spatial multi-criteria analysis method identifies the most vulnerable areas of production and the site. The multi-criteria analysis accounts for all naturally occurring data in a GIS format, providing a map ranked by relative vulnerability, each ranked relative to other elements of the mine site. The regions on the map where low-scoring (high vulnerability) areas on the MCE coincide spatially with critical processes or infrastructure of the mine have been termed ‘hot-spots’. The most critical hot-spots selected by the mine (the top three) have been analysed further using fault-tree analysis to assess the pathways to failure and identify adaptation options to reduce vulnerability. During this process, adaptation requirements were identified. Finally, the mine’s capacity to adapt to the most beneficial options has been assessed using the five capitals framework, again working with staff, both at the mine and off-site, but these have been made less mine-specific for the purposes of showing the way in which the results can be used. An outline of the steps taken, along with outcomes, is described here. Importantly, the solution is a generic method that can be applied to any mine in addition to broader parts of the mining process external to the mine including the community, delivery routes, utilities, larger catchments and other mines and may be limited only by the availability of data.
2.1 Introduction
Geographic information systems (GIS) have developed rapidly over the last two decades and they are now widely used for basic spatial analyses and visualisation; however, GIS are not often employed to their full potential and modelling of geo-referenced datasets is still limited.
Since Carver (1991) proposed and exemplified the use of GIS within the framework of a multiple criteria evaluation (MCE), this decision making approach has gained recognition and been used for land suitability assessments, ecological applications and management of natural resources. Although terrain attributes are essential to water movement and, therefore, relevant to all vulnerabilities related by water (i.e. floods), the use of GIS-MCE modelling in the establishment and planning of mine sites has never been reported.
To address this technical gap, the current study aims to develop a GIS-based MCE approach to assess water-related issues (specifically floods), to assist mine planning and reduce down-time in case of adverse weather conditions. The mine site used to develop the GIS-based MCE method is situated in the Bowen Basin of Queensland, but will remain confidential; however, the methodology can be readily applied to other sites where similar datasets are available for modelling.

Preparing a mine for both drought and flood - Stage 1: a vulnerability and adaptive capacity study | 13
2.2 Model design
The method employed for the assessment of the study area is a multiple criteria evaluation adapted after Carver (1991). The aim is to evaluate the flood vulnerability as a function of:
terrain attributes
soil character
drainage network
vegetation cover
The geoprocessing was carried out in a raster format and consisted of the summation of several data layers; the software employed was ArcMap 9.3. The data were gridded from point datasets or rasterised from polygon vector format information. Data intervals were established based on natural breaks in the dataset, unless otherwise stated. The data intervals were then ranked based on their relationship to the flood vulnerability and a final weighted score of vulnerability was calculated and plotted. The values of the final scores are higher for locations less likely to be affected by floods. Several evaluations were run using equally weighted parameters or weighted summations.
2.3 Parameters and rationale
The supporting mine provided a large number of datasets in AutoCad format, as .dxf files. The data included LIDAR point elevation data, drainage network and surface (roads, rail, buildings, water pipes, electricity lines) and underground infrastructure. The LIDAR datasets were divided in square tiles. After consultation with mine site staff, the extent of the study area was established and the tiled data were merged to obtain a complete coverage of the study area. All the .dxf files were then converted to ESRI shapes and used in the analysis (Figure 2.1).

14 | C21041
Figure 2.1 Aerial photograph of the study area (red line) in the context of LIDAR data tiles (black lines). Note that elevation data were not available for one tile in the east of the study area.
0 5 102.5Km
No LIDAR data

Preparing a mine for both drought and flood - Stage 1: a vulnerability and adaptive capacity study | 15
The LIDAR point elevation values were gridded to obtain a digital elevation model (DEM) of the study area. Due to the high density of measured points, a high resolution DEM could be produced, i.e. a 3 m DEM was deemed suitable for the analysis (Figure 2.2). The elevation ranges between 105 and 258 m. A close inspection of the data distribution revealed that most of the low elevations are in the mine pits that are, by their nature, a potential flood site and as such will be already a focus for drainage and hazard reduction practices. Therefore, assuming the pits are naturally strategically considered for vulnerability reduction, they have been discounted as part of this study. For the purpose of this assessment, 152 m is taken as the lowest elevation of the terrain, representing the lowest value within a drainage channel. Therefore, only the interval 152 to 258 m was included in the analysis; it was divided in 5 m intervals and then ranked from 1 to 7, in terms of flood vulnerability. The higher the rank, the less likely is for the area to be inundated (Table 2.1).
Figure 2.2 The 3 m DEM constructed from LIDAR elevation data. Lower resolution and limited accuracy is noted in the area where the elevation values were extrapolated over large distances due to missing values.
0 5 102.5Km
Legend
3m DEM
Elevation (m)
<152
152 - 160
161 - 165
166 - 170
171 - 175
176 - 180
181 - 185
186 - 190
191 - 195
196 - 200
201 - 205
206 - 258

16 | C21041
Table 2.1 Source, rationale for the use of model parameters and the data intervals with their respective rank.
Parameter Source / Procedure
Rationale Intervals or rank from previous studies
Comments Rank in this study
Weight (%) (only for MCE3)
Elevation (m)
Company LIDAR point elevation data
Grid generated using Topo to raster, ArcMap v. 9.3.1
Controls differences in potential energy and consequently water movement
<152 5 m intervals starting from 152 m, which is the lowest elevation of a creek channel
1 17
152-160 1
160-165 1
165-170 2
170-175 2
175-180 3
180-185 3
185-190 4
190-195 5
195-200 6
200-205 7
205-258 7
Slope (degree)
Elevation
Grid generated using Slope, ArcMap v. 9.3.1
Controls:
- water direction
- velocity
- overland runoff
- infiltration rate
0-3 Intervals based on natural breaks in values
7 17
4-6 6
7-12 5
13-20 4
21-29 5
30-40 6
>40 7
Drainage density
Company drainage data
Density grid calculated using Line density, ArcMap v. 9.3.1
Accounts for inundation from multiple creeks
0 - 0.0008 Magnitude per unit area of polylines that fall within a 2000 m radius around a 20 m cell
Natural breaks
7 17
0.0009 - 0.002 6
0.0021 - 0.0032 4
0.0033 - 0.0043 3
0.0044 - 0.0059 2
0.006 - 0.0078 2
0.0079 - 0.0102 1
Proximity to creeks
Company drainage data
Buffers generated using Multiple concentric buffers, ArcMap v. 9.3.1
Accounts for inundation from individual creeks
100 100 m buffers around drainage lines
1 13
200 2
300 3
400 4
500 5
600 6
700 7
>700 7

Preparing a mine for both drought and flood - Stage 1: a vulnerability and adaptive capacity study | 17
Parameter
Source / Procedure
Rationale
Intervals or rank from previous studies
Comments
Rank in this study
Weight (%) (only for MCE3)
Surface condition
L4 –ASRIS Level 4 Tracts and Land Unit Attribution, 1:250,000 or broader
L5 – ASRIS Level 5 Tracts, 1:50,000 – 1:250,000
Burgess, 2003
Rasterisation of vector data
Controls infiltration and overland runoff
6 Clayey surface, crusts 2 10
5 Hard setting, prone to sealing
3
3 Sandy surface, moderate sealing
5
1 Sandy surface, no slaking or sealing
7
Soil drainage L4 –ASRIS Level 4 Tracts and Land Unit Attribution, 1:250,000 or broader
L5 – ASRIS Level 5 Tracts, 1:50,000 – 1:250,000
Burgess, 2003
Rasterisation of vector data
Relates to pre-existing wetness
3
Most wet, imperfectly drained
4
7
4 Imperfectly drained to moderately well
5
5 Moderately well drained
drained
6
6 Least wet, well drained to moderately well drained
7
Soil permeability
Same as previous
Rasterisation of vector data
Controls infiltration and consequently runoff and drainage
4 Very slow 4 7
3 Moderate 5
2 Moderate to high 6
1 High 7
Vegetation DERM Vegetation Cover 2006b
Controls overland water movement and soil moisture
Cleared
Native vegetation
2
5
7

18 | C21041
Parameter Source / Procedure
Rationale Intervals or rank from previous studies
Comments Rank in this study
Weight (%) (only for MCE3)
Soil water availability
L4 –ASRIS Level 4 Tracts and Land Unit Attribution, 1:250,000 or broader
L5 – ASRIS Level 5 Tracts, 1:50,000 – 1:250,000
Burgess, 2003
Rasterisation of vector data
Relates to the depth of the most permeable layer and plant available water capacity (PAWC)
14 High PAWC 2 3
15 3
17 4
18 4
19 5
21 6
23 7
24 Low PAWC 7
Soil water erosion
Same as previous
Rasterisation of vector data
Refers to soil stability 16 Very unstable 1 3
15 1
12 3
10 4
9 4
8 5
2 Stable 7
A 3m slope grid was generated using the 3m DEM (Figure 2.3). The slope was expressed in degrees and ranged from flat to very steep terrain of more than 40o. The data were divided in 7 classes based on natural breaks in the population. Those were then ranked in relation to likely potential for inundation; the flat and the high slope terrain were deemed safer in terms of flooding, the former due to the ability of water to dissipate across the broad flat areas and run into lower lying gullies and valleys, and the latter due to high runoff.

Preparing a mine for both drought and flood - Stage 1: a vulnerability and adaptive capacity study | 19
Figure 2.3 The 3 m slope grid. The area is generally flat with more abrupt terrain on the pit banks and along some drainage lines
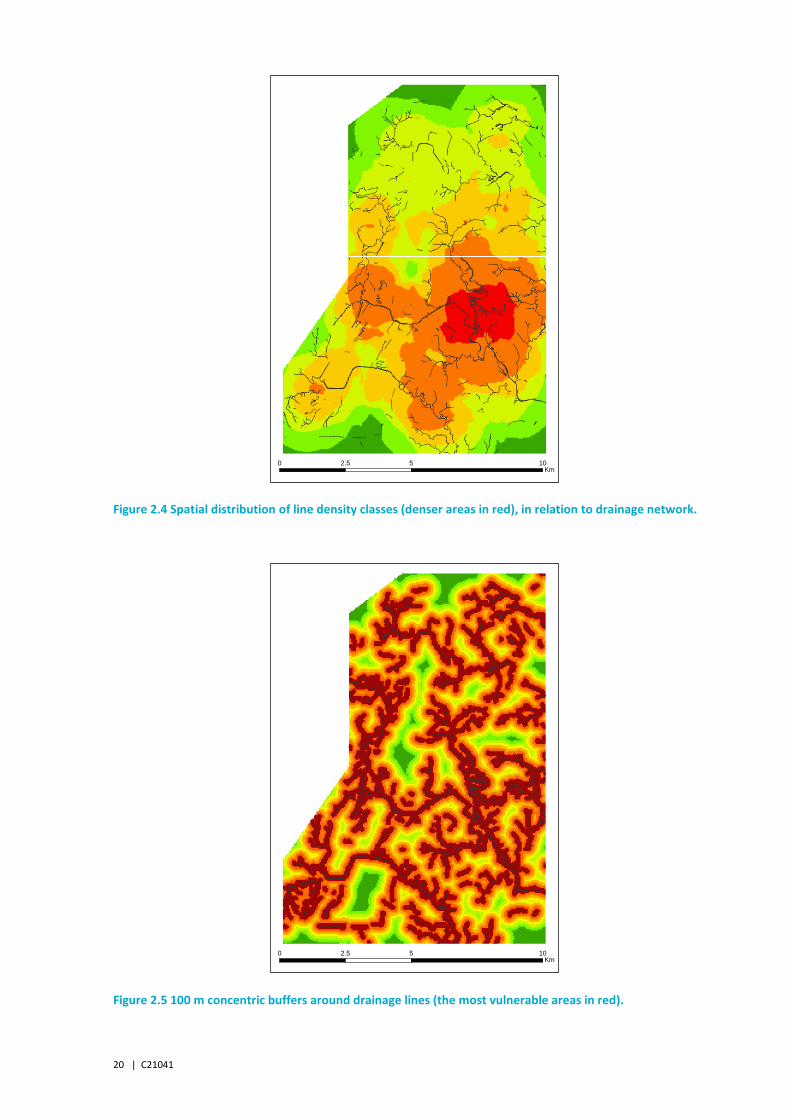
The drainage network is directly responsible for terrain inundation and therefore, it has been thoroughly assessed and introduced in the analysis as two separate parameters. To account for the combined effect of flooding from multiple creeks, a line density of the drainage network was calculated. This parameter represents the number of drainage lines per unit area; the calculation was extended over a radius of 2000 m, which adequately covered the study area. The grid values were divided into 7 classes, based on natural breaks, and then ranked accordingly; the highest drainage line density gave the greatest vulnerability in terms of multiple creek inundation (Figure 2.4). Proximity to creeks is the second drainage-related parameter included in the analysis. Due to the flat terrain, 100 m buffers were deemed suitable, as a way of assessing distances from creek channels. Eight classes were created (100 to 700 m buffers and the last, >700 m), which ensured a complete coverage of the study area. The 100 m concentric buffers were then rasterised and ranked, with lower distances from a creek, being considered the greatest vulnerability (Figure 2.5).
0 5 102.5Km
Legend
Slope
Degrees
0 - 3
4 - 6
7 - 12
13 - 20
21 - 29
30 - 40
>40
20 | C21041
Figure 2.4 Spatial distribution of line density classes (denser areas in red), in relation to drainage network.
Figure 2.5 100 m concentric buffers around drainage lines (the most vulnerable areas in red).
0 5 102.5Km
0 5 102.5Km

Preparing a mine for both drought and flood - Stage 1: a vulnerability and adaptive capacity study | 21
A detailed soil assessment by Burgess (2003) was used to extract relevant information on the surface material of the study area (Table 2.2). Five soil-related parameters were added to the analysis. The map produced by Burgess (2003) is part of L5 – Australian Soil Resource Information System (ASRIS) Level 5 Tracts, 1:50,000 – 1:250,000. The southern section of the area has not been covered by the high resolution sampling program carried out in 2003. The soil types for this area were taken from a lower resolution dataset, the L4 – ASRIS Level 4 Tracts and Land Unit Attribution, 1:250,000 or broader. The soil attributes for the lower part of the area were inferred using the neighbouring L5 data (Figure 2.6, Table 2.2).
Figure 2.6 Distribution of soil types within ASRIS L5. The northern section is L5 and highly detailed, while the southern section is part of L4. Soil descriptions are in Table 2.2 and detailed analysis in Burgess (2003).
KEY: Ac - Red podzolic soil, soloth; Ad – Solodic; Bb - Yellow earth; Bd - Solodized solonetz, soloth; Bn - Siliceous sand; Bu - Brown clay, grey clay; Bz – Lithosol; Cc - brown clay or red clay; Cw - Siliceous sand, lithosol; Fx - Solodized solonetz, solodic soil; FxLp - Solodic soil, solodized solonetz; Gm - Alluvial soil, earthy sand, siliceous sand; Hf - Solodized solonetz; Mi - Lithosol, red podzolic soil; Mw - Soloth, red podzolic soil; Pr - Solodic soil, solodized solonetz, soloth; Rn - red brown soil; Rp - Solodic soil, solodised solonetz; Rt - Solodic soil, solodized solonetz; Ss - Brown, black, sodosol; Wm - Siliceous sand, earthy sand, soloth, solodic; Ww - Grey clay, brown clay.
Bb
Bd
Bz
Fx
Bd
Hf
Mw Gm
Bd
Ac
Mw
Pr
Hf
Bz
Wm
Bb
Bb
Hf
Rp
Bb
Bd
Bu
Gm
Gm
Fx
Pr
Fx
Hf
Cw
Hf
BbWm
Pr
Rp
Hf
Ad
Cc
Bn
Rt
Rp
Bb
Fx
Bd
BdMi
Cw
BzRt
Rt
Wm
Fx
Pr
Ad
Bz
RtCw
Bn
Bb
Hf
Hf
Wm
Bz
FxLp
RtRt
Ac
Bb
Cw Bb
FxLp
Cw
Rp
FxLp
FxLp
Bb
Wm
Bz
Bb
Ad
Ss
Bu
Bb
Bb
Ww
Bz
Cw
Ss
Fx
Hf
Gm
Ac
RtRp
Rn
Rp
Ss
Wm
FxLp
Rt
Hf
0 5 102.5Km
Legend
Soil types
L4
Ac
Ad
Bb
Bd
Bn
Bu
Bz
Cc
Cw
Fx
FxLp
Gm
Hf
Mi
Mw
Pr
Rn
Rp
Rt
Ss
Wm
Ww

22 | C21041
Table 2.2 Soil type and description (L5 ASRIS dataset, Burgess, 2003).
Soils Parent rock Soil profile class Concept Great Soil Group Runoff Permeability Drainage
Ac Tertiary Anncrouye clay loamy surfaced Red podzolic soil, soloth Slow to rapid Very slow to slow Imperfectly drained to well drained
Ad Back Creek Group Adeline clay loamy surfaced Solodic Slow to moderately rapid
Very slow to slow Moderately well drained
Bb Tertiary Bul Bul clay loamy surfaced, hard setting
Yellow earth Slow to moderately rapid
Moderate Moderately well drained to well drained
Bd Tertiary Bundoora sandy surfaced, sodic texture, hard setting
Solodized solonetz, soloth Slow to moderately rapid
Very slow Imperfectly drained
Bn Quaternary Booroondarra loose, neutral, red uniform sand
Siliceous sand Very slow to slow Sand - high Sand - rapidly drained
Bu Back Creek Group Burradoo hard setting or firm pedal
Brown clay, grey clay Slow (or occasionally moderately rapid)
Slow (or occasionally very slow)
Moderately well drained
Bz Tertiary Bellarine stony, firm or hard setting, black or brown loam
Lithosol Moderate to very rapid
Moderate to high Well drained to rapidly drained
Cc Back Creek Group Carlo hard setting or firm pedal, non-cracking clay
brown clay or red clay Slow to moderately rapid
Slow to moderate Moderately well drained to well drained
Cw Back Creek Group Cherwell stony, loose, uniform coarse sand over quartzose sandstone
Siliceous sand, lithosol Slow to very rapid High Imperfectly drained to rapidly drained
Fx Quaternary Foxleigh bleached sandy surface, alkaline, mottled, brown to grey
Solodized solonetz, solodic soil
Slow to moderately rapid
Very slow Imperfectly drained to moderately well drained
FxLp Quaternary Foxleigh clay loamy phase
hard setting, loamy or clay loamy surfaced
Solodic soil, solodized solonetz
Slow to moderately rapid
Very slow Imperfectly drained to moderately well drained

Preparing a mine for both drought and flood - Stage 1: a vulnerability and adaptive capacity study | 23
Soils Parent rock Soil profile class Concept Great Soil Group Runoff Permeability Drainage
Gm Quaternary German deep, soft, brown uniform sand
Alluvial soil, earthy sand, siliceous sand
Very slow to slow Moderate to high Well drained to rapidly drained
Hf Back Creek Group Heyford sandy surfaced, gravelly, sodic texture contrast soil
Solodized solonetz Slow to moderately rapid
Very slow Imperfectly drained to moderately well drained
Mi intrusives Middlemount shallow, rocky, hard setting, acid, loam to clay loam
Lithosol, red podzolic soil Moderately rapid to very rapid
Moderate to high Moderately well drained to well drained
Mw Back Creek Group Maywin shallow, sand to clay loam
Soloth, red podzolic soil Slow to moderately rapid
Loam - moderate to high, Texture contrast - very slow to slow
Imperfectly drained, to moderately well drained
Pr Quaternary Parrot sandy surfaced Solodic soil, solodized solonetz, soloth
Slow Very slow to slow Imperfectly drained to moderately well drained
Rn Blackwater Group Red-one loamy or clay loamy surfaced, alkaline, red, texture contrast over lithic
red brown soil Slow or moderately rapid
Slow Moderately well drained
Rp Quaternary Roper hard setting, sandy to clay loamy surfaced
Solodic soil, solodised solonetz
Slow Very slow to slow Moderately well drained
Rt Tertiary-Quaternary Racetrack hard setting, clay loamy surfaced
Solodic soil, solodized solonetz
Slow to moderately rapid
Very slow Moderately well drained
Ss Back Creek Group Stateschool hard setting, clay loamy surfaced
Brown, black, sodosol Slow to moderately rapid
Very slow to slow Moderately well drained
Wm Tertiary Wyndham soft or loose, brown or yellow uniform sand
Siliceous sand, earthy sand, soloth, solodic
Very slow to slow Sand - high, Texture contrast - very slow
Sand - moderately well drained, Texture contrast - imperfectly drained
Ww Tertiary-Quaternary Warwick hard setting, firm pedal, sodic cracking clay
Grey clay, brown clay Slow on mounds and shelves
Very slow Imperfectly to moderately well drained

24 | C21041
The soil parameters included in the analysis are:
surface condition, related to soil type and the presence of crusts that can influence infiltration and overland runoff
drainage and wetness
permeability
water availability, referring to the thickness of the permeable layer and water availability to plans
erosion, related to soil type and stability
The classes defined by Burgess (2003) were ranked considering the relationship between each soil parameter and water movement, specifically overland runoff, infiltration and permeability (Table 2.1). Soil mechanics classification information was not available from this data but would be valuable if obtained.
Whether the land was vegetated or cleared was also considered to be relevant to water behaviour in the modelled area. This information was taken from a survey carried out in 2006. In the ranking process, it was considered that vegetation cover would impede surface runoff, so vegetated land was given a higher ranking than cleared land (Figure 2.7, Table 2.1).
Figure 2.7 Land cover based on DERM Vegetation Cover 2006b for Queensland, Version 6.0b.
0 5 102.5Km
Legend
Cleared
Vegetated

Preparing a mine for both drought and flood - Stage 1: a vulnerability and adaptive capacity study | 25
2.4 Multi-criteria evaluation and models
The MCE solutions represent an equally or weighted summation of all the parameters that trigger, control or influence the environmental issues being modelled, in this case floods (Figure 2.8).
Figure 2.8 Parameter summation to generate a MCE solution.
Several evaluations were run, although only three outputs (MCE1, MCE2 and MCE3) are presented here to allow for a comparative evaluation of MCE solutions (Table 2.3). The final results were divided in seven classes based on natural breaks in the data and qualified as follows: 1 - Extreme vulnerability, 2 - High vulnerability, 3 - High-Moderate vulnerability, 4 - Moderate vulnerability, 5 - Moderate-low vulnerability, 6 - Low vulnerability, 7 - Very low vulnerability.
MCE1 was run with 9 equally weighted parameters (Figure 2.9). After the addition of the drainage line density, MCE2 (Figure 2.10) was run with 10 equally weighted parameters. The last solution, MCE3 (Figure 2.11) also contains all 10 parameters, but a weighting scheme was applied; this was based on the likelihood that a parameter would influence behaviour as the terrain is inundated. Overall, the addition of line density increases the area of vulnerable land and it is deemed as representative of the worst case scenario. All the MCE solutions aim at providing a semi-quantitative assessment of all the available datasets pertinent to the issue being modelled.
MCE
Elevation * w1
+
Slope * w2
+
Soil * w3
+
Creeks * w4
+
Veg * w5
=
MCE
solution
Sum of weights = 100%
MCE
Elevation * w1
+
Slope * w2
+
Soil * w3
+
Creeks * w4
+
Veg * w5
=
MCE
solution
Sum of weights = 100%

26 | C21041
Table 2.3 MCE versions with their parameter list and weighting scheme.
MCE Parameters Weighting scheme (%)
MCE1
(n=9)
Elevation
Slope
Proximity to creeks
Surface condition
Soil drainage
Soil permeability
Vegetation
Soil water availability
Soil water erosion
Equally weighted
MCE2
(n=10)
Elevation
Slope
Drainage density
Proximity to creeks
Surface condition
Soil drainage
Soil permeability
Vegetation
Soil water availability
Soil water erosion
Equally weighted
MCE3
(n=10)
Elevation
Slope
Drainage density
Proximity to creeks
Surface condition
Soil drainage
Soil permeability
Vegetation
Soil water availability
Soil water erosion
17
17
17
13
10
7
7
7
3
3

Preparing a mine for both drought and flood - Stage 1: a vulnerability and adaptive capacity study | 27
Figure 2.9 MCE1 solution for nine equally weighted parameters.
Figure 2.10 MCE2 solution for ten equally weighted parameters.
0 5 102.5Km
Legend
MCE1
Hazard score
23 - 29 (extreme)
30 - 32 (high)
33 - 34 (high-moderate)
35 - 37 (moderate)
38 - 40 (moderate-low)
41 - 44 (low)
45 - 51 (very low)
0 5 102.5Km
Legend
MCE2
Hazard score
25 - 32 (extreme)
33 - 35 (high)
36 - 38 (high-moderate)
39 - 41 (moderate)
42 - 45 (moderate-low)
46 - 49 (low)
50 - 58 (very low)

28 | C21041
Figure 2.11 MCE3 solution of ten weighted parameters.
2.5 Mine infrastructure
Aerial photographs were provided by the mine from which up to date mine-infrastructure maps were digitised. These were augmented by additional knowledge and information from the mine staff. The mine also provided maps for roads, fibre-optics, pits, rail, pipelines and power lines.
The MCE resulting maps could then be overlain by combinations of, or all, layers of infrastructure.
0 5 102.5Km
Legend
MCE3
Hazard score
20 - 28 (extreme)
29 - 31 (high)
32 - 35 (high-moderate)
36 - 38 (moderate)
39 - 42 (moderate-low)
43 - 46 (low)
47 - 56 (very low)

Preparing a mine for both drought and flood - Stage 1: a vulnerability and adaptive capacity study | 29
2.6 Mine consultation and other considerations
Consultation with experienced mine staff was performed to ascertain the regions, equipment and processes that are most vulnerable to flood and associated vulnerabilities aligned with terrain hot-spots in the MCE model.
To identify the nature of the site’s drainage abilities and to ascertain that flooding does occur at this site when an extreme rainfall event occurs, flood gauge data was obtained from some of the creeks in the study area. Data was assessed over the time of the most recent floods in December 2010 to January 2011 across the region, to confirm that flooding was seen in such creeks. This was important to provide some context to the project from the point of view of a past event affecting the mine. It could not be used to validate the MCE, but was useful to confirm the mine’s ability to flood. Unfortunately, some of the mine site’s data collection equipment was washed away during those floods but sufficient data was available for validation purposes using a four month interval from October 2010 to January 2012. During that period, creeks were seen to show a lag after heavy rainfall events. For example in Figure 2.12, following initial high rainfall, the main creek required about 40 mm of rain over three days before it reacted and discharge increased. Although 30 mm of rain fell on the fourth day after discharge had dropped, the level remained low for around two days as the floodwater was able to disperse. However, discharge rose again despite there being no additional high rainfall in that time. This represents a lag in water moving through the system to this point and ‘backing-up’ of the system that can be slow to drain. Further analyses of these data was beyond the scope of this project but this serves to provide evidence of multiple pulses of flow through the creek as the system fills and drains at varying speeds. The creek data analysed was confirmed by the mine as originating from a period of severe flooding in the study area.
Figure 2.12 Red lines represent rainfall events and blue line represents creek discharge volumes in September 2010.
After completion of the MCE model, consultation with mine staff took place to assess which critical areas coincided with critical processes and infrastructure (hot-spots), in order to identify where reduction of vulnerability may be most significant to the mine. Consultation with the mine, around these maps provided a basis for assessing those areas that require adaptation to reduce vulnerability.
0
5
10
15
20
25
30
35
0
0.5
1
1.5
2
2.5
3
3.5
4
Rain
fall (
mm
)
Dis
ch
arg
e (
m3/s
)
Time of day
Rainfall and creek discharge Sep 2010
>23
29
30
24 Sep
26 Sep
2

30 | C21041
2.7 Fault-tree analysis
2.7.1 BACKGROUND
Fault-tree analysis (FTA) is typically carried out to identify the cause of a failure or a weakness in a system and to identify contributors to failure. It can also be used to assess reliability of safety in a proposed design or quantify failure probability and contributors. FTA is a top-down method and is highly successful in deducing causes of function failure occurring in a complex system. FTA attempts to model and analyse failure processes using Boolean logic and is composed of ‘logic diagrams’ that display the state of the system, to combine a series of lower-level events.
FTA was developed in 1962 at Bell Laboratories under contract for the U.S. Airforce Ballistics Systems Division (H.A.Watson); it is now used widely in engineering and included in several government standards including those of the nuclear power industry, NASA and across Europe.
Statistical probabilities are used in this methodology where failures typically occur at some constant failure rate and failure would occur depending on a rate and exposure time. Such information would be calculated by the engineers, management and environmental officers of the mine site, so basic failure mapping has been used here without utilising mathematical probability, in order to provide generic results and to simulate FTA for the purposes of this project.
The process that has been used consists of:
Definition of the undesired event (identified at a hot-spot from mapping in GIS, specifically MCE2)
Basic understanding of the system (geo engineering and mine consultation)
Fault tree construction
Evaluation of fault tree
Identified vulnerabilities that appear could be reduced
Control identified as adaptation options (in FTA terminology this is the ‘counter measure’)
Different versions of FTAs with varying levels of sophistication have been presented in the literature (for example Ericson, 2012; Vesley, 2013) and depending on the objectives of the analysis they may be qualitative or quantitative (Xing and Amari 2008; see also Stamatelatos et al., 2002). Nevertheless, they all follow the same principles and can identify events and failures leading to the undesired effect occurring in addition to countermeasures to reduce risk and failures.
Fault tree analysis is more frequently reserved for engineering problems and is less often used for systems where human actions may cause a fault. However, it can be used to supplement a root cause analysis (more frequently used in the mining domain) as it can be used to help find causes by reviewing decisions and assumptions made in design of a system, can determine probability of a scenario and can help select an appropriate solution (Gano 2007). For these reasons, and the reason that they provide a visual representation of the logic used in selecting adaptation options, FTA has been adopted for this study.
2.7.2 FTA PROCESS
The undesired, or ‘top-level’ event is connected, via ‘logic gates’, to identify the ways in which the top-level event can happen. In a typical FTA diagram (the ‘fault-tree’), tags are attached to each event box to identify the type of event it represents. To simplify the diagram for the purposes of this project, the tags have been omitted and different type event boxes have been used, each listed in the key to each FTA diagram.
Appendix B shows some of the tags that can be used in FTA but largely, for simplicity, have not been used in this project. Those used can be seen Figure 2.13, in the FTA figures in the results section and Appendix B.
Logic gates that can be used are typically: OR, AND, EXCLUSIVE OR, PRIORITY AND and INHIBIT. For the purpose of this project AND and OR have been used. Events typically identified in a FTA include top level event, fault, cause, root cause, house event and countermeasure. After consultation with the supporting

Preparing a mine for both drought and flood - Stage 1: a vulnerability and adaptive capacity study | 31
mine, we have elected to be less specific about definitions of causes, root causes and house events. This allows the outcome to be more aligned with the method of root cause analysis already used at the supporting mine whilst retaining the logic flow and its ability to identify new countermeasures provided by FTA in a visual representation. Definitions of the logic gates and events used in this project are summarised in Table 2.4.
Table 2.4 Definitions of events and logic gates used in this project for fault tree analysis
EVENT/LOGIC GATE MEANING
Event: Top level event the undesired event that needs to be resolved
Event: Fault events that occur as a result of combinations of causes, root causes and house events
Event: Cause events that contribute to the faulty occurring, or ones that lead to other causes or directly to faults
Event: Countermeasure an adaptation option to reduce the risk of events occurring or to remove faults or causes of faults in the tree
Logic gate: And if all of the connecting events must act together to produce the next event
Logic gate: Or
if each of the connecting events can contribute to the next event
KEY
Cause/Root cause/house event
Fault
Top level event
Counter measure
And
OR
Top level event
OR
Fault reduced by counter measure A
and B
Fault reduced by counter measure B
And
causeCause reduced by
counter measure Acause
Root cause reduced by counter measure
A
Root cause
And OR
And
House event – happens anyway
House event – happens anyway
Root cause
Counter measure BCounter measure A
Figure 2.13 Fault tree analysis process example showing flow from top level issue down trough faults, causes, root causes and house events.

32 | C21041
2.8 Five-capitals analysis
It is important that a mine has the capacity to carry out an adaptation plan and such an assessment will help successful decision making. A simple measure of adaptive capacity can be performed by assessing the five main capitals available for performing adaptation. The 5-capitals analysis tool has been developed in land and water projects (Nelson et al. 2010), but more recently it was applied to the mining context by CSIRO at climate adaptation in mining workshops (Loechel et al. 2011a, b). The five capitals that are assessed are human, social, natural, physical and financial. Table 2.5 shows the description and examples of the five capitals that may be applicable to adaptation for mines. The variables are then assessed on a scale of 0 to 5 and plotted on a spider-web (or radar) chart as shown in Figure 2.14.
At the mining workshops where the tool was presented to the mining audience, participants were asked to nominate both how much of each capital is currently available compared against how much of each is needed for the adaptation process. This provided a visual image of the areas that currently lack or have excess capital and help with the decision making process, either by providing a means to assessing where more capital is needed or by selecting an option that can be put into action with current capital. This method is used in this project to provide a visual tool for assessing the ‘best’ adaptation option under current conditions. However, the method could also be used based on ‘what if’ scenarios by providing a diagram of how capitals ‘may’ be distributed in the future and how the capitals may be needed for adopting a new plan under future conditions.
Table 2.5 Examples and descriptions of the 5 capitals for adaptation (after Loechel et al. 2011b)
Resource type Description Indicators Mining industry examples
Human capital Education, skills,
health
Qualified, experienced staff;
labour availability
No. of qualified staff
Social capital Social networks &
associations (claims
& obligations)
Connections to other human
and organisational
resources; institutions;
governance entities and
processes; culture and
heritage
Membership of mining
industry associations;
community organisations
Physical capital Means of production
and goods derived
from economic
production
Infrastructure, machines,
technology; resource
Roads, ports, energy supply
lines, earth-moving
equipment, mine housing
Financial capital Financial assets,
income streams,
access to credit
cash, shares; profit/loss
statements; lines of credit
Cash reserves; share price/
equity position; mine
income
Natural capital Land, water,
vegetation
Geographic features; land
area; access to water;
biodiversity
Exploration leases;
groundwater availability;
revegetation seedstock

Preparing a mine for both drought and flood - Stage 1: a vulnerability and adaptive capacity study | 33
Figure 2.14 Spider web or 'radar' chart to display the needs and available capacity to adapt in each of the capitals
0
1
2
3
4
5
HUMAN
SOCIAL
NATURALPHYSICAL
FINANCIAL
0
1
2
3
4
5
HUMAN
SOCIAL
NATURALPHYSICAL
FINANCIAL

34 | C21041
Part II Results and
conclusions

Preparing a mine for both drought and flood - Stage 1: a vulnerability and adaptive capacity study | 35
3 Results
3.1 Model results
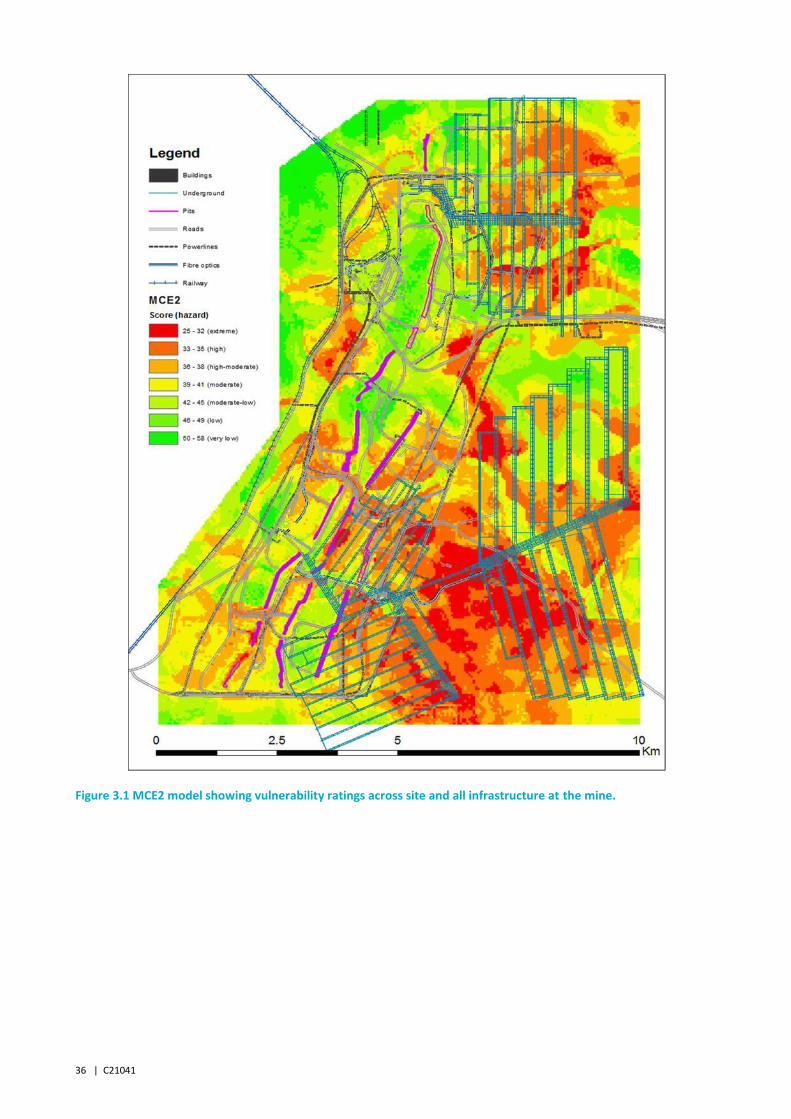
The resulting MCE models were assessed by mine staff for validation through knowledge of the mine and its flooding potential. MCE1 was calculated without drainage density in order to ascertain the importance of that feature; MCE1 was later discarded when the importance of the drainage density layer was confirmed. MCE2 and MCE3 that had different weighting schemes nevertheless provided similar results, although MCE3 showed less definition than MCE2 in some areas such as in the south where a much broader area is defined as high vulnerability/low score (Figure 3.1). Mine staff agreed that the map with less definition (MCE3) is valuable for general knowledge of vulnerable areas but that MCE2 detail is helpful for the purposes of moving on to the next stage in this project methodology.
As more definition is required to identify greatest vulnerability areas, MCE2 (based on 10 parameters equally weighted) has been selected for the next stage of this methodology. However, we would recommend that a mine performs a number of other MCE models with alternative parameters to define a combination of worst-case scenarios and definition in high-vulnerability areas, as a worst-case scenario will help define those regions also with least vulnerability and therefore most likely to be useful alternative locations if infrastructure can be moved.
36 | C21041
Figure 3.1 MCE2 model showing vulnerability ratings across site and all infrastructure at the mine.

Preparing a mine for both drought and flood - Stage 1: a vulnerability and adaptive capacity study | 37
3.2 Key hot-spots
The areas that showed up in red with very low scores were identified as being of extreme vulnerability and when overlain by the infrastructure GIS layers, the mine was able to identify the most critical areas, designated ‘hot-spots’ (Figure 3.2).
Figure 3.2 MCE2 model showing vulnerability scores across the mine site and the intersection of high vulnerability areas with infrastructure (“hot-spots” in black circles).

38 | C21041
Table 3.1 Critical areas where low MCE scores correspond with infrastructure, on a scale from 1 to 6
Hot-spot identifier Infrastructure at hot-spot Prioritised by Mine
(1 highest)
1 Roads, fibre optic, tracks, water pipeline 6
2 Roads, fibre optic, tracks, water pipeline 6
3 Roads, fibre optic, tracks, water pipeline, entry point to underground mine
4
4 Roads, main roads, fibre optic, building, tracks, critical ventilation fan for underground mine, several water pipelines cross
1
5 Roads, main road, fibre optic, buildings, tracks, underground mine, critical ventilation fan for underground mine, water pipelines
1
6 Roads, main roads, fibre optic, building, tracks, critical entry point to underground mine, water pipeline
1
Although a mine may elect to assess all hot-spots using the three stages of this method, for the purposes of this project, only the ‘top three’ hot-spots were evaluated in the next phases. Therefore, the mine was asked to prioritise the hot-spots identified in MCE2, where 1 was the highest priority. Notwithstanding the important nature of all hot-spots in general, the priority 1 hot-spots that were selected by the mine staff as absolutely critical for continuation with the next stage in testing this methodology are hot-spots 4 (HS4), 5 (HS5) and 6 (HS6) as described in Table 3.1 and shown in Figure 3.2.
From the infrastructure identified in the three hot-spots, possible vulnerabilities to those include the following:
Road rupture may cause diversions or loss of movement to vehicles around the site as critical through roads and exit roads must be available for evacuation or for bringing in critical equipment or emergency services. Track rupture may also cause disruption to movement of vehicles for production.
Loss of fibre optic cables will prevent communication (at this site, there is limited mobile phone coverage and all systems are communicating via fibre optics).
Damage to or loss of buildings may be inconvenient for continued production (i.e buildings that house vital supplies) or may be hazardous to personnel if they are occupied at the time of an event.
Pipeline rupture has the potential of flow into a creek causing the mine to become non-compliant with environmental standards.
Severe ventilation fan disruption or damage will be critical to underground mine staff safety and could lead to fatalities.
Damage to, isolation of, or flooding at entry points to underground mines may lead to ingress of water to a mine, may be hazardous for evacuating personnel or a danger for personnel requiring emergency assistance in the underground mine.
Combinations of each of these elements at each of the points may lead to complex and more hazardous situations and greater vulnerability to the mine.
3.3 Fault tree analysis
For the purposes of this project, a general level FTA has been performed for one issue that arises in each of the selected hot-spots, in order to illustrate the potential for using such a tool in the decision making

Preparing a mine for both drought and flood - Stage 1: a vulnerability and adaptive capacity study | 39
method. At a mine, a team could more thoroughly perform highly detailed fault tree analyses or similar for all issues arising at each hot-spot and for each part of infrastructure within that hot-spot, in order to assess every level of hazard and vulnerability at the hot-spots including compounding impacts, both within and external to it. It might be informed and quantified by previous risk analysis. Alternatively probability calculations and analysis could be performed during the FTA process to provide a more quantifiable selection process for adaptation option implementation. The FTAs provided here give only a very brief overview, and are purely descriptive; however, they are efficient at outlining causes and faults that lead to the top level events. The counter measures in each diagram are shown in a grey box at the bottom of the tree but are unattached to the tree itself, showing there to be no link between them and the logic flow for the top level event occurring. However, to show how each counter measure fits in to the tree, each is identified by a letter, A, B, C and so on, and each event in the fault tree contains the letter corresponding to the counter measure that may reduce or alleviate it.
3.3.1 FAULT TREE ANALYSIS, HOT-SPOT 4 (FTA HS4)
Environmental damage from mine water (burst pipes)
At hot-spot 4 (Figure 3.3), the top-level event of environmental damage caused by failed pipes was investigated. In this case, ‘house’ events (those that are not reliant on others and ‘occur anyway’) are the following facts:
heavy rainfall may occur
overland pipelines exist
those pipes require periodic maintenance
debris may exist upstream of the pipes
Causes of failure are that:
the downstream drainage is limited, leading to flooding
if debris is not cleared, it can be entrained by the flood and hit and possibly break pipes
if the weight and speed of moving water is in excess of the pipe strength, the pipe can be stressed or broken
if there is low access to the pipes, maintenance may be insufficient
if the pipe is in a floodable area the pipe will be vulnerable
These are areas that might be possible to improve on to reduce vulnerability.

40 | C21041
KEY
Heavy rainfallLow access to
overland pipe, E
Low/no pipe maintenance
E
Environmental damage from mine
water
No clearance of debris
C
Pipe vulnerableA, B, D, E, F
Debris gets entrained in
overland flowC, G
B: Increase/divert drainage
E: Increase access for maintenance
C: Clear debris or provide protection
form debris
D: Protect pipes from debris/fast
flowing water
Upstream debrisG
Limited downstream drainage, B
Overland pipes, D, F
FloodB
Pipe failsA, B, C, D, E, F
Fault
Top level event
Causes and contributing factors
Counter measure
Weight/speed of water in excess of pipe’s strength. A
Scheduled maintenance incomplete
Stress on pipeA, F
Pipe in floodable areaD, F
Flood/debris damages pipe
A, B, C, F, G
A: Increase pipe strength
F: Move pipes
And
OR
G: Inspection of upstream catchment
Engineering control fails to monitor or shut off water: H
H: Real-time pipe monitoring: cut off if water leaving A is
not reaching B
Scheduled maintenance due
Figure 3.3 Fault tree analysis diagram pipeline failure at hot-spot 4 (see Appendix B for enlarged version)

Preparing a mine for both drought and flood - Stage 1: a vulnerability and adaptive capacity study | 41
3.3.2 FAULT TREE ANALYSIS, HOT-SPOT 5 (FTA HS5)
Personnel safety and equipment damage (flooding/damage of multiple buildings)
At hot-spot 5 (Figure 3.4), the top level event of personnel safety and equipment damage was investigated. The house events include:
heavy rainfall
the location of buildings (and equipment) in a flood zone
insufficient drainage and discharge systems in place
The causes identified are that:
buildings’ floors may be too low
insufficient drainage would lead to flood
various defects to the building and its services can make the building and people in it vulnerable
the threat of ground movement caused by moving water and saturation during a flood
explosion hazards
The top level event could occur because of a combination of reduced safety of the building, people unable to evacuate and associated health and safety issues.
KEY
Personal safety/equipment damage
Loss of power, D, E
C: Auxiliary generators and
batteries
No waterproofing of buildings, sensitive
components, electrical , D, E
Landslide/erosion/sub/ up-sidence, E
Evacuation plans insufficient, A, B
B: Emergency and evacuation procedures
(Trigger Action Response Plan)
Building in flood zone and not raised
- vulnerable to flooding, E
Hydrochemical health pollution, B
Animal migratiuon (snakes etc), B
People unable to evacuate, A, B, E
Heavy rainfall and insufficient drainage
causing flood
Building vulnerable to damage, D, E
Buildings isolated, A, B, E
People unable to stay warm, dry, no supplies, A, B, C, E
Health and safety issues, A, B, C, D
Building safety reduced, B, D, E
E; Lift/move/improve buildings
A: Provide helicopter/boat/
lifejackets/floating structures
D: Remove electrification/power hazards
Electrification potential, D, E
Structural, electrical mechanical or
design defects, D, E
Fault
Top level event
Causes and contributing factors
Counter measure
And
OR
Figure 3.4 Fault tree analysis diagram for safety and equipment damage at hot-spot 5 (see Appendix B for enlarged version).

42 | C21041
3.3.3 FAULT TREE ANALYSIS, HOT-SPOT 6 (FTA HS6)
Road washout
The FTA for hot-spot 6 (Figure 3.5) investigated the risk of road washout causing production and safety hazards. Potential house events are:
heavy rainfall
presence of upstream sediment and debris
a lack of alternative transport or routes, so roads always needed
transport needed for continued production (moving coal)
personnel needing to evacuate
equipment and systems needing to be accessed by road
the need to secure and close down systems and equipment during a flood
The causes were that:
a lack of alarm systems and roadways being located in flood zones can mean an adequate system is not present to warn or prevent from inundation
the area’s drainage is inadequate during heavy rain so flooding will occur
the road can have various geotechnical issues that may render it vulnerable to damage
The main counter measures are likely to focus on those causes.

Preparing a mine for both drought and flood - Stage 1: a vulnerability and adaptive capacity study | 43
KEYProduction and safety hazards
Unstable retaining walls, F, G
Geotechnical failure potential, D, E, F, G
Unstable rock mass in road cut, F, G
Unstable fill in fill section D, E, F, G
Unstable road foundation and
materials F
No alternative transport, B, E, F, G
Personnel need to evacuate or need emergency help
Production and operations at risk,
A, B, C, D, E, F, G, H
Personnel at risk,A, B, C, D, E, F, G
Upstream debris and sediment
Roadway location or type incorrect, A, B
Lack of road flood monitoring/alarm,
A, C
Inadequate system to prevent road inundation, A
Area drainage inadequate, D
Area floods, F
Heavy rainfall
Road maintenace/modification
inadequate A, D, E
Roadway dysfunctional/
closed/hazardous, A, B, D, E, G
Production and systems/equipment require road access,
H
F: Relocate or modify
inappropriate roads
E: Increase road application with
routes to non-flood areas
D: Increase geotechnical and
drainage capability
G: Improve safety and resistance of routes to flood
damage
A: Install continuous monitoring to roads
B: Install flood emergency signs, maps, guidelines
C: Implement advanced traffic transport system
Inadequate road culvert/hydraulic
structures D
Fault
Top level event
Causes and contributing factors
Counter measure
And
OR
No access/exit to/from mine A-G
H: Install remote control operations,
systems control where possible
Figure 3.5 Fault tree analysis diagram for road damage at hot-spot 6 (see Appendix B for enlarged version)
3.4 Adaptation options
Performing the general hot-spot area assessments for one particular vulnerability at each of the 3 hot-spots allowed for adaptation options or counter measures to be identified. The counter measure selected will need to reduce the vulnerability of the top level event occurring by removing or reducing a cause or fault. Some counter measures identified have been included in the FTA diagrams and are listed below, but the lists are by no means exhaustive. The counter measures in each diagram are linked to the tree by a corresponding letter/code (A, B. C etc) to show may alleviate or assist each event.
3.4.1 HS4
increase pipe strength to withstand weight and speed of water and outside debris
increase or divert drainage
clear upstream debris frequently or provide pipeline with protection from moving debris
protect pipes from fast flowing water by creating a barrier
increase access to difficult to reach overland pipes for improved maintenance
move pipes to less flood-risk area, if feasible

44 | C21041
3.4.2 HS5
install state of the art monitoring system or alarm emergency system that will inform mine staff that buildings are becoming vulnerable
provide auxiliary buildings for use in an emergency
implement emergency procedures that allow people to evacuate early or are able to evacuate during or after flood
equip critical buildings with a boat, life jackets and access to the roof for rescue and install floating structures
install auxiliary generators and batteries where staff are likely to be stranded or must remain for maintenance
remove electrification or power hazards
lift or move buildings from threat of flood
3.4.3 HS6
install continuous monitoring to roads to inform mine staff of areas needing maintenance or those that have become inundated
install emergency signs that are visible during a flood for diversions, road markers, maps and emergency guide line signs
implement advanced traffic transport systems
increase geotechnical and drainage capacity to reduce flood threat
increase road application engineering standards for routes to non-flooded areas
relocate or modify inappropriate roads
improve safety and resistance of routes to flood damage
where roads are designed to be washed away to increase drainage during a flood, ensure roads will fail when needed (and only when needed).

Preparing a mine for both drought and flood - Stage 1: a vulnerability and adaptive capacity study | 45
3.5 5-capitals assessment (5-CA)
For each of the 3 hot-spots, we have selected two adaptation options and performed 5-capitals analysis on them. This is to show how a 5-CA can give a relatively quick visual analysis of the ‘capacity to adapt’ to given adaptation options and show how options may vary. Those selected here are for illustrative purposes and therefore, do not reflect their adaptive usefulness over others available that were not analysed. In reality, a 5-CA can be performed for all adaptation options that appear to be the most suitable. The 5-CA is typically qualitative but if required, each could be semi-quantitative if informed by either quantitative risk- or FTA-analyses.
Each image shows a blue line that represents the capital required to perform the adaptation option and the red line shows the capital available at present for that option. The difference between the two lines highlights where additional capital is required before the adaptation option can be carried out (alternatively the line may indicate that access capital is available for that option). The supporting mine suggested that for the purposes of showing these analyses, the red line should be equal for each diagram and the blue line is an estimate for illustration purposes only. No company information or costs of performing any of the adaptation options are implied in the figures shown here. The value of this method is that various options can be viewed side-by-side providing a visual aid to analysis of those options that are more easily carried out than others. It should be noted that the red line, may vary depending on the capital available for each specific adaptation option and may help to drive the decision making process. For example, if one option falls into a category where funding is already available at the mine, it may be preferred over an option that is in a category that has not been funded.
3.5.1 HS4
Adaptation options selected for HS4 were to increase the strength of the pipe and to protect the pipe. The 5-CA shows the difference between capital required and capital available for each of these two options shown in Figure 3.6 and suggest that protecting the pipe may be a more likely option.

46 | C21041
Figure 3.6 Capital required and capital available for two of the adaptation options for hot-spot 4.

Preparing a mine for both drought and flood - Stage 1: a vulnerability and adaptive capacity study | 47
3.5.2 HS5
Adaptation options selected were to install state of the art monitoring/alarm systems, and to provide floating structures, a boat and life jackets for assisting isolated staff at the buildings. The 5-CA diagram shows the difference between capital required and capital available for each of these two options in Figure 3.7. The analysis suggests that the option to provide floating structures and life jackets may be the most achievable option under current capital.
Figure 3.7 Capital required and capital available for two of the adaptation options for hot-spot 5.
3.5.3 HS6
Adaptation options selected for hot-spot 6 were to relocate or modify appropriate roads, install emergency signs, maps and guidelines visible during flood. The 5-CA diagram shows the difference between capital required and capital available for each of these two options in Figure 3.8.
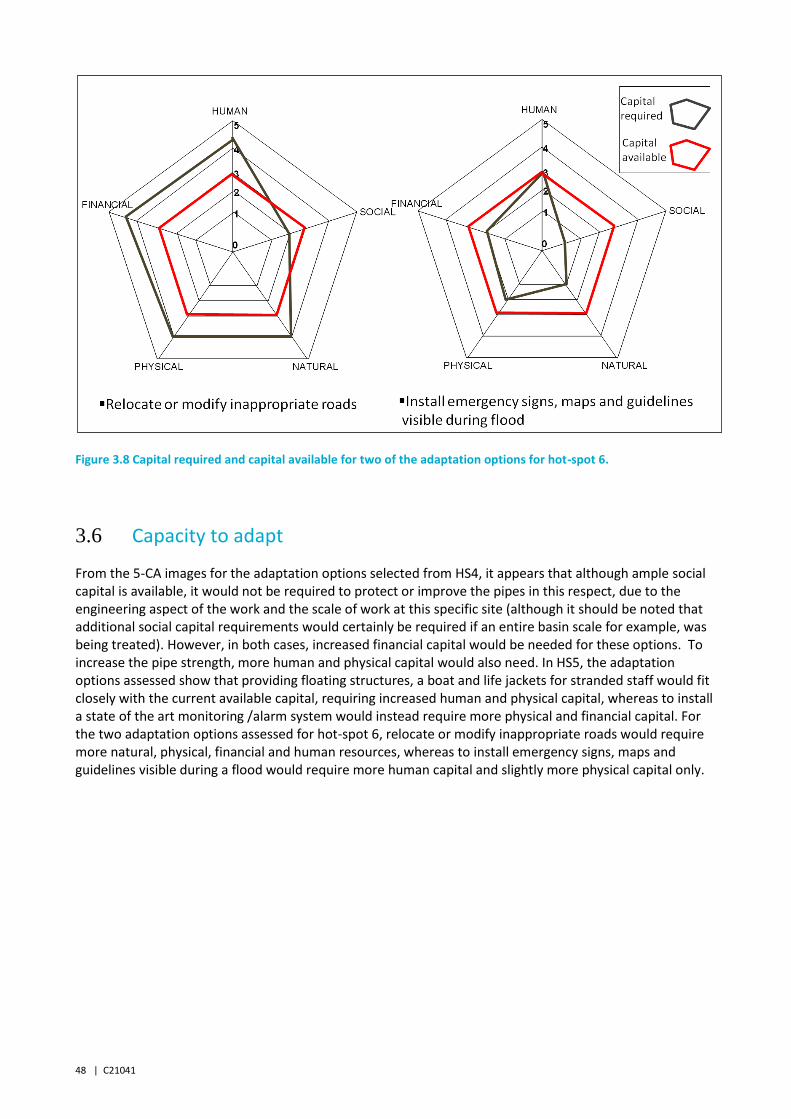
48 | C21041
Figure 3.8 Capital required and capital available for two of the adaptation options for hot-spot 6.
3.6 Capacity to adapt
From the 5-CA images for the adaptation options selected from HS4, it appears that although ample social capital is available, it would not be required to protect or improve the pipes in this respect, due to the engineering aspect of the work and the scale of work at this specific site (although it should be noted that additional social capital requirements would certainly be required if an entire basin scale for example, was being treated). However, in both cases, increased financial capital would be needed for these options. To increase the pipe strength, more human and physical capital would also need. In HS5, the adaptation options assessed show that providing floating structures, a boat and life jackets for stranded staff would fit closely with the current available capital, requiring increased human and physical capital, whereas to install a state of the art monitoring /alarm system would instead require more physical and financial capital. For the two adaptation options assessed for hot-spot 6, relocate or modify inappropriate roads would require more natural, physical, financial and human resources, whereas to install emergency signs, maps and guidelines visible during a flood would require more human capital and slightly more physical capital only.

Preparing a mine for both drought and flood - Stage 1: a vulnerability and adaptive capacity study | 49

50 | C21041
4 Discussion, conclusions and recommendations
The key outcome of this study is the Climate Related Adaptation from Terrain Evaluation Results (CRATER) methodology that identifies vulnerability to extreme flooding events across the mine. Additionally the method determines some key adaptation options and whether the mine has the ability to adapt. The CRATER method consists of a series of steps that may be used to augment a mine’s current decision making process by establishing a vulnerability analysis framework for both existing or new mines; the methodology can be implemented under current or future scenarios, the latter allowing a mine to perform ‘what-if’ scenarios. Importantly, this method allows the mine to reassess vulnerability and ‘hot spots’ prior to a wet season. Once the process has been performed once, new layers and data can be added as the mine site changes each year.
Due to an extreme weather event occurring at the supporting mine site during the latter stages of this project, the mine was unable to fully engage in the processes for steps 2 and 3, (FTA and 5-CA). The construction of the diagrams used here for steps 2 and 3 were completed in conjunction with geotechnical expertise at CSIRO augmented by less in-depth consultation with the supporting mine. Nevertheless, the purpose of this study has not been disadvantaged by this, as the aim was to show how the method can provide a set of visual aids for decision making that will identify the vulnerability of a mine and its capacity to adapt.
The results presented here are representative of a first-test of this method that identifies the main elements required to perform such a process. However, they are not prescriptive and would, at a mine site, require a more rigorous treatment by way of greater detail and input from mine site knowledge and data. Ways to improve the analysis and model outputs are:
if available, GIS data at 1 to 3 m resolution would provide greater mapping and MCE detail
digitised infrastructure could contain more details such as building use, location of energy sources and emergency supplies
soil mechanics data may further inform the process, providing for example, strength and stability of slopes and flood plains
MCE could be reiterated until a greater level of accuracy is obtained based on local data and knowledge and potentially compared with local stream stage data
fault tree analysis (FTA) or similar would be highly detailed to ensure compounding effects and elements at each hot-spot are assessed, constructed by a cross section of mine staff with knowledge and experience in potential issues across the mine
additionally, probability calculations can be used to quantify and better inform the FTA
FTA may be informed by in-house risk-analysis methods that quantify risk and calculate financial relationships between risks and countermeasures (‘how much will it cost to perform a countermeasure and how much will it cost to not perform it?’)
a more detailed assessment of the capacity to adapt can be performed through financial and cost benefit analysis, informed by a quantified FTA - such results can be plotted onto a 5-CA radar plot or can be performed as a result of a less detailed 5-CA comparisons.
The level of detail used in this case-study provides a good overview of a mine site’s vulnerable and less vulnerable areas, some adaptation options that can reduce vulnerability and the mine’s capacity to adapt, and can therefore act as a decision making tool that uses pre-existing data.
Data collation and preparation proved to be the most time consuming part of performing this method; an unexpected delay was encountered in collating the required information and data. Although most of the

Preparing a mine for both drought and flood - Stage 1: a vulnerability and adaptive capacity study | 51
data were available from the mine, its format, age and location was not consistent and collation, conversion and updating took a greater time than expected. Although most mines have or can get the data required for this method, its ease of use may vary from one mine site to another. For example, the soil data used in this study were particularly detailed due to a recent high resolution survey. That may not be the case elsewhere. Additionally, other soil data that were not available at this site, could be valuable such as soil mechanics classification such as gravelly clay (GC), silt (M), silty clay (MC) and so on, in addition to the ‘liquid limit’ or the ‘plastic limit’ of the soil, obtained from simple moisture content and strength test. Running a sensitivity analysis to ascertain the influence of soil character data in MCE models was beyond the scope of the current analysis, but it may be required when the method is tested on other sites lacking detailed pedological information. The CRATER method would work most efficiently at a mine with a well-organised data management system that includes a GIS database with good version and format control. This would allow the mine to perform fast, effective and frequent and updates as the mine develops and new data becomes available. As some mines may not have access to all data, it may be possible to run an MCE based on just stream and DEM data as a minimum to compare outputs with infrastructure locality. However, this has not been tested in this project and the potential influence that soil and vegetation have on flood should be considered when assessing results.
The method presented focussed specifically on flood events for this mine site as that was a major concern at the time. However, for drought events, the same method can be used and a map of potential dust sources and locations that dust clouds form can be integrated into the GIS, along with a map of potential additional water storage locations that can be accessed in an emergency, including in the event of a fire.
The supporting mine has provided positive feedback about the value of this process and the results provided to them, including the fact that the relevant mine data were now collated in GIS for aerial and spatial analysis. In particular, mine staff stated that various styles of MCEs provided different information for a number of purposes. The less defined MCE3 (Figure 2.11) showed more general areas of high vulnerability in a worst-case-scenario. The mine stated that MCE3 would be helpful to:
clearly identify the areas that need attention
facilitate communication of those high vulnerability areas
provide knowledge of risk to anyone with responsibility over those high vulnerability areas
provide consolidated data and maps over a high-vulnerability general area that can be communicated to all the departments that deal with that area, so that some responsibility for some of those vulnerabilities can be assigned.
Additionally the mine stated that it has a requirement to adhere to a new ‘Flood management Standard’ and that the work performed here provided information to assess performance against that standard.
The MCE2 map (Figure 2.10) would be most useful to:
drill down detail to more specific areas
prioritise action areas before the next wet season
provide more definition to decision making and responsibility assignment as MCE3
assign specific areas for assessment in more detail through fault-tree analysis
The main benefit of a mine performing this method is that pre-existing data can be used to assess vulnerabilities to extreme weather events and gain vital information for evaluating spending needs. Importantly, it also adds value to the data collection process, as high resolution data (i.e. LIDAR elevation) is expensive to acquire. The method and data requirements are well aligned with a mine’s existing capability and resources. Understanding the mine’s ability to adapt has been assessed on existing resources (i.e. people, equipment, funding). This improves decision making, both to prioritise actions and to select adaptation based on available resources. ArcGIS was used in this analysis; although other GIS or spatial analysis programs that can perform MCE may be used to identify hot-spots, we are only able to advise the

52 | C21041
use of ArcGIS for performing this method. FTA may be performed qualitatively or quantitatively; probability analysis may be included or excluded, depending on data and time variables; or FTA may be replaced by other top-down approaches to failure analysis that identify adaptation options, such as root cause analysis or Ishikawa diagrams, for example.
In dollar terms, this methodology could lead to savings for mines after adaptation by reducing downtime or equipment damage across their operation after an extreme event. There is also potential for a mine to reduce its insurance costs, if they have demonstrated they have taken action to reduce their vulnerability, whether it is a risk to operations, equipment damage or people. Recently, flooded mines have impacted significantly on GDP, so reduced downtime by having adapted operations in the future will be of value to the Australian economy, in general. Additionally, a mine that has shown its commitment to future operations in this way may be more attractive to investors and clients by showing commitment to maximum possible production under varying conditions. Reduced vulnerability increases confidence in both the company and the industry. Ultimately, if most of the Australian coal mines were to adapt operations to reduce downtime after an extreme event, it would be clear to investors that the intention for Australian coal mining to deliver would remain high. Performing this method on a new mine site may help identify the less risky areas to situate equipment and workings for optimum safety and continued production.
Upon presentation of this methodology at an ACARP meeting, an ACARP monitor from another mine site pointed out that the outcomes could appear to be ‘stating the obvious’. Importantly, it was stated that, even if it looks ‘obvious’, it needs to be documented and this does not appear to be already done. Such outcomes are not available from any other known method and the raw data alone cannot suggest such results, whereas this method provides a quantitative framework for analysis. The comments suggest the method provides an intuitive way of using the data and technology to provide something that mines will find useful; additionally, it can be slotted into pre-existing processes at a mine allowing current decision making to be augmented by this additional information.
4.1 Further work
The methodology requires further testing and can be adapted to consider the broader picture and assess other climate extreme vulnerabilities. Additional testing is required to identify its value in assessing vulnerability across more than one mine site or of the entire mining chain including other mines, the community, road, rail and ports, and identify potential barriers and adaptation options for continued production and delivery following or during extreme weather events. We envisage that the methodology may be tested first across more than one neighbouring site followed by an area that identifies pit-to-processing plant and pit-to-port. More quantitative analyses of steps 2 and 3 may also be included in a future project.
Outcomes of this project will be transferred to industry through this ACARP report, and through a presentation at a relevant industry meeting. A paper is also planned for presentation to the Australian Mining Journal or other appropriate publication.

Preparing a mine for both drought and flood - Stage 1: a vulnerability and adaptive capacity study | 53

54 | C21041

Preparing a mine for both drought and flood - Stage 1: a vulnerability and adaptive capacity study | 55
References
Bureau of Meteorology (BOM) 2013, Climate Data Online, Clermont Post Office, http://www.bom.gov.au/climate/data/index.shtml?bookmark=200&view=map
Brown, P.R., Nelson, R., Jacobs, B., Kokic, P., Tracey, J., Ahmed, M. and DeVoil, P., 2010, Enabling natural resource managers to self-assess their adaptive capacity, Agricultural Systems, 103, 562-568
Burgess J. W., 2003. Land Resource Assessment of the Windeyers Hill Area, Isaac–Connors and Mackenzie River Catchments, Central Queensland. QNRM02189 (2 volumes and soil map).
Carver S., 1991. Integrating multi-criteria evaluation with geographic information systems. International Journal of Geographical Information Systems 5, 321–339.
Chakhar, S. and Mousseau, V., 2007, Spatial multicriteria decision making, In: S. Shehkar and H. Xiong, Editors, Encyclopedia of geographic information science, Springer-Verlag, New York
de Haan, L.J., 2000, Globalization, localization and sustainable livelihood, Socioligia Ruralis, 40, 3.
Côte, C., Moran, C., Gozzard, E., Craven, A., Shih, J., 2009, Understanding leading practice in water management, ACARP Project C16035
Côte, C.M., Moran, C.J., Hedemann, C.J., Koch, C, 2010, Systems modelling for effective mine water management, Environmental Modelling and Software, 25, 1664-1671
Department of Climate Change, 2010, Adapting to Climate Change in Australia, An Australian Government Position Paper, Commonwealth of Australia, 17pp
Department of Environment and Resource Management, (DERM)2009. Vegetation Cover 2006b for Queensland, Version 6.0b (November 2009).
Dhillon, B.S. 2008, Mining Equipment Reliability, Maintainability and Safety (Springer series in Reliable Engineering). Springer-Verlag, London, 201 pp
Ellis, F., 2000, Rural Livelihoods and Diversity in Developing Countries, Oxford university Press, Oxford, UK
Ericson II, C., A., 2012, Fault Tree Analysis Primer, Create Space Inc, Charleston, NC, 136 pp
EPA 1994, Preparation of water management plans for mining activities, Guideline, Queensland Government Department of Environment and Resource Management, 5pp
Gano, D. L., 2008, Apollo Root Cause Analysis. A New Way of Thinking, Third Edition, Apollonian Publications 206pp
Hodgkinson, J.H. Littleboy. A., Howden. M., Moffat, K., Loechel, B. 2009, Climate Adaptation in the Australian Mining and Exploration Industries Project; Introduction and initial findings. Climate Adaptation Flagship report, Working Paper #5 CSIRO. (Published open material) 27pp
Iverson, S., Kerkering, J.C. and Coleman, P. 2001, Using fault tree analysis to focus mine safety research 108th Annual Exhibit and Meeting, Society for Mining, Metallurgy, and Exploration, Denver, CO, Feb. 26-28, 2001, 10 pp
Loechel, B., Hodgkinson, J.H., Moffat, K., Crimp, S., Littleboy, A., Howden, M., (2010) Goldfields-Esperance Regional Climate Vulnerability Workshop, Report on workshop outcomes
Lewis, H.W., Bunitz, R.J. Rowe, W.D. Kouts, H.J.C., von Hippel, F., Loewenstein, W.B. and Zachareiasen, F. 1979, Risk assessment review group report to the U.S. Nuclear Regulatory Commission, IEEE transactions on Nuclear Science, 5, 4686-4690

56 | C21041
Loechel B, Hodgkinson J. H, and Moffat K, 2011a. Pilbara Regional Mining Climate Change Adaptation Workshop: Report on workshop outcomes.
Loechel B, Hodgkinson J. H, Moffat K, Crimp, S., Littleboy, A., and Howden, M., 2011b. Goldfields-Esperance Regional Climate Vulnerability Workshop, report on workshop outcomes, CSIRO report EP106666 42pp
McDonald, J., 2010, Paying the price of adaptation: Compensation for climate change impacts. In: Adaptation to Climate Change: Law and Policy, by T. Bonyhady, A. Macintosh, and J. McDonald. Federation Press, 304pp
Moran, C, Côte, C and Macintosh, J, 2006, Northern Bowen Basin water and salt management practices, ACARP Project C15001 final report.
Nelson, R., Kokic, P., Crimp, S., Martin, P., Meinke, H., and Howden, M. (2010). The vulnerability of Australian agriculture to climate variability & change: Part I -Reconciling the supply and demand for integrated assessments. Environmental Science & Policy, 13,
PMSEIC Independent Working Group 2007, Climate Change in Australia: Regional Impacts and Adaptation – Managing the Risk for Australia, Report Prepared for the Prime Minister’s Science, Engineering and Innovation Council, Canberra, June.
Park S.E., Crimp S., Dowd A-M., Ashworth P., and Mendham E. 2011, Understanding climate change adaptation as a national challenge. CSIRO Climate Adaptation Flagship Working Paper No. 8, 32 pp
Pearce, T., Ford, J., D., Prno, J. and Duerden, F. 2009, Climate Change and Canadian mining: Opportunities for Adaptation, The David Suzuki Foundation, prepared by ArcticNorth Consulting 150 pp.
Porritt, J., 2001, the world in context: Beyond the business case for sustainable development, HRH the Prince of Wales’ business and Environment Programme, Cambridge, UK, 26pp
Porritt, J., 2005, Capitalism as if the World Matters, International Institute for Environment and Development, Earthscan, London, 336 pp
Preda, M 2009, GIS-based environmental vulnerability mapping of coastal settings, with application to southeast Queensland, Queensland coastal conference. Waves of Change, 12-15 May 2009, Queensland.
Preda M. and Gimber C., 2006, Analysis of nutrient export to waterways using a GIS-based multiple criteria approach. Environment Institute of Australia and New Zealand Conference, Adelaide, 18-20 September 2006.
Raaijmakers, R.J.J. 2006, A spatial multi criteria analysis methodology for the development of sustainable flood risk management in the Ebro Delta, MSc Thesis for the University of Twente, Department of Water Engineering and Management
Stamatelatos, M, Vesley, W., Dugan, J., Fragola, J., Minarick, J., Railsback, J., 2002, Fault Tree Handbook with Aerospace Applications, NASA Office of Safety and Mission Assurance, Washington, USA 218pphttp://www.itsmsolutions.com/newsletters/DITYvol4iss47.htm
Qing W., Preda M., Cox, M. and Bubb K., 2007, Spatial model of site index based on gamma-ray spectrometry and a digital elevation model for two Pinus species in Tuan Toolara State Forest, Qld, Australia. Canadian Journal of Forest Research 37(11), 2299-2312.
Tanner, A., 2010, Adapting to adopt sustainability: organisational change in UK water and sewerage companies, transitions to Sustainability, 4th International Conference on Sustainable Engineering and Science, Auckland, New Zealand, December 2010
van Haaren, R. and Fthenakis, 2011, GIS-based wind farm site selection using spatial multi-criteria analysis (SMCA): Evaluating the case for New York State, Renewable and Sustainable Energy Reviews, 15, 3332-3340

Preparing a mine for both drought and flood - Stage 1: a vulnerability and adaptive capacity study | 57
VCCCAR (Victorian Centre for Climate Change Adaptation Research), 2011, Scenario planning for Climate Adaptation (http://www.vcccar.org.au/files/vcccar/Scenario%20policy%20brief%20web%20version%20120711.pdf)
Vesley, B., 2013 (sighted) Fault Tree Analysis (FTA) Concepts and Applications, NASA HQ, online presentation available: http://www.hq.nasa.gov/office/codeq/risk/docs/ftacourse.pdf
Whetton, P., 2011, Future Australian Climate Scenarios, In: Climate Change: Science and Solutions for Australia (Eds) H. Cleugh, M. Stafford Smith, M. Battaglia, P. Graham, CSIRO, 168pp
Xing, L. and Amari, V, 2008, Fault Tree Analysis, in Handbook of Performability Engineering, Chapter 38, 26pages, Editor: Krishna, B. Misra, Springer-Verlag, http://www.itsmsolutions.com/newsletters/DITYvol4iss47.htm
Yang, M., Qian, X., Zhang, Y., Sheng, J., Shen, D. and Ge, Y., 2011, Spatial multicriteria decision analysis of flood risks in aging-dam management in China: a framework and case-study, International Journal of Environmental Research and Public Health, 8, 1368-1387

58 | C21041
Appendix A
RESEARCH TEAM
Jane Hodgkinson (ACARP Project Leader) Geologist, Data Analyst, CSIRO
Project development and management, assessment development, ranking, data collection and analysis, literature reviews and report writing.
Jane is a geoscientist and has worked at CSIRO for nearly 6 years, where she began in both mine-modelling and non-traditional statistical analysis of exploration and geological data. For the last 3 years, Jane has been broadly involved with a number of projects that tackle both climate change mitigation and adaptation specifically in the mining industry. Jane has also been involved with coal-related projects including coal-seam modelling and analysis of high sulphur coal. She was awarded her PhD for completing a study of geological control of the southeast Queensland landscape, performed using GIS, drainage analysis and seismic data.
Micaela Grigorescu (Preda), Geologist, Spatial analyst, DEEDI
GIS and multi-criteria analysis, ranking system development, data analysis, ranking and multi-criteria analysis, vulnerability assessment, reporting and reviewing results.
Micaela is Program Manager at Geological Survey of Queensland (DNRM). Micaela is a geoscientist with a PhD in environmental geology and has worked for 15 years in the public and private sector. Primarily, Micaela has been focussed on analysis of geochemical, geomorphological and geological data, and has used GIS as an analytical platform. Micaela has also been involved with a variety of environmental projects where she used GIS-based spatial analysis and developed project-specific multi-criteria evaluation tools that assess both natural and man-made infrastructure, in addition to the vulnerabilities likely to affect them. Currently, Micaela is involved with projects related to climate change and in charge of spatial gap-analyses and GIS-based modelling.
Habib Alehossein, Engineer, Scientist, CSIRO
Flood mitigation, drainage and FTA quantitative advisor and structural and geotechnical analyst, project development, adaptation-potential and -options advisor, engineering advisor.
Habib is a Sydney University graduate (PhD) and associate professor of geomechanics at UQ. He is a licensed professional civil & mining engineer, and a senior geotechnical engineer with more than 25 years experience in engineering construction, consulting, design, research and analysis in various engineering disciplines. In particular, he is a fluid-solid-soil-rock mechanics expert specialised (i) in prediction of ground response to mining and flooding, and (ii) in construction and design of ground support structures and hydraulic structures such as dams, tailing dams and flood mitigation systems. He has accumulated extensive research and development experience in the areas: (i) mathematical and numerical modelling, (ii) mining induced subsidence control, (iii) mine waste management and mechanics of mine backfill materials, (iv) concrete, soil, rock and slurry mechanics, (v) drill and blast and excavation engineering,(vi) novel rock cutting and drilling techniques and & technologies. He has been the manager or key researcher of many CSIRO industrial projects, including ACARP Project C16023 in 2009 on ground and subsidence control affected by mining.

Preparing a mine for both drought and flood - Stage 1: a vulnerability and adaptive capacity study | 59

60 | C21041
Appendix B
Fault tree analysis symbols used and their meanings (after Ericson 2012)
Symbol for text that is adjacent to node
Symbol inherent or primary failure of component – no more detail or definition available
Failure induced by external event – can be developed in more detail
An event or action expected to occur as part of normal system
operation
A symbol that can be used to define a special type of event as needed

Preparing a mine for both drought and flood - Stage 1: a vulnerability and adaptive capacity study | 61

62 | C21041

Preparing a mine for both drought and flood - Stage 1: a vulnerability and adaptive capacity study | 63
FTA HOT-SPOT 4 Enlarged view
KEY
Heavy rainfallLow access to
overland pipe, E
Low/no pipe maintenance
E
Environmental damage from mine
water
No clearance of debris
C
Pipe vulnerableA, B, D, E, F
Debris gets entrained in
overland flowC, G
B: Increase/divert drainage
E: Increase access for maintenance
C: Clear debris or provide protection
form debris
D: Protect pipes from debris/fast
flowing water
Upstream debrisG
Limited downstream drainage, B
Overland pipes, D, F
FloodB
Pipe failsA, B, C, D, E, F
Fault
Top level event
Causes and contributing factors
Counter measure
Weight/speed of water in excess of pipe’s strength. A
Scheduled maintenance incomplete
Stress on pipeA, F
Pipe in floodable areaD, F
Flood/debris damages pipe
A, B, C, F, G
A: Increase pipe strength
F: Move pipes
And
OR
G: Inspection of upstream catchment
Engineering control fails to monitor or shut off water: H
H: Real-time pipe monitoring: cut off if water leaving A is
not reaching B
Scheduled maintenance due
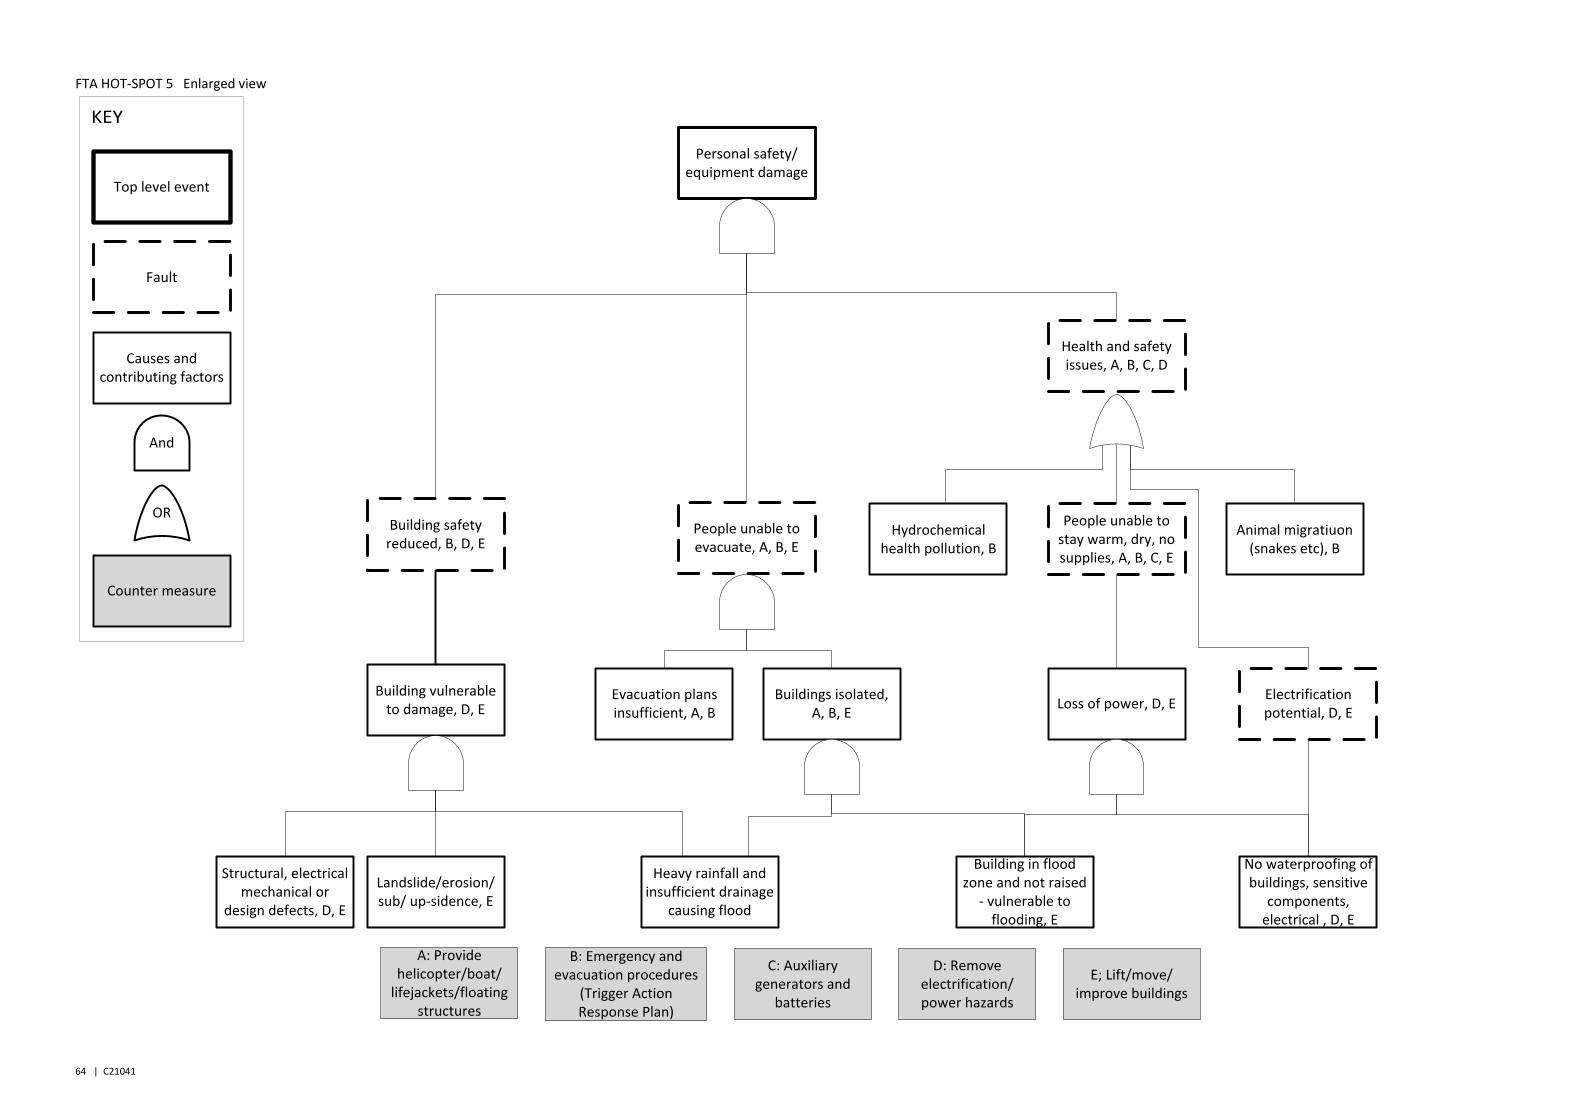
64 | C21041
FTA HOT-SPOT 5 Enlarged view
KEY
Personal safety/equipment damage
Loss of power, D, E
C: Auxiliary generators and
batteries
No waterproofing of buildings, sensitive
components, electrical , D, E
Landslide/erosion/sub/ up-sidence, E
Evacuation plans insufficient, A, B
B: Emergency and evacuation procedures
(Trigger Action Response Plan)
Building in flood zone and not raised
- vulnerable to flooding, E
Hydrochemical health pollution, B
Animal migratiuon (snakes etc), B
People unable to evacuate, A, B, E
Heavy rainfall and insufficient drainage
causing flood
Building vulnerable to damage, D, E
Buildings isolated, A, B, E
People unable to stay warm, dry, no supplies, A, B, C, E
Health and safety issues, A, B, C, D
Building safety reduced, B, D, E
E; Lift/move/improve buildings
A: Provide helicopter/boat/
lifejackets/floating structures
D: Remove electrification/power hazards
Electrification potential, D, E
Structural, electrical mechanical or
design defects, D, E
Fault
Top level event
Causes and contributing factors
Counter measure
And
OR

Preparing a mine for both drought and flood - Stage 1: a vulnerability and adaptive capacity study | 65
FTA HOT-SPOT 6 Enlarged view
KEYProduction and safety hazards
Unstable retaining walls, F, G
Geotechnical failure potential, D, E, F, G
Unstable rock mass in road cut, F, G
Unstable fill in fill section D, E, F, G
Unstable road foundation and
materials F
No alternative transport, B, E, F, G
Personnel need to evacuate or need emergency help
Production and operations at risk,
A, B, C, D, E, F, G, H
Personnel at risk,A, B, C, D, E, F, G
Upstream debris and sediment
Roadway location or type incorrect, A, B
Lack of road flood monitoring/alarm,
A, C
Inadequate system to prevent road inundation, A
Area drainage inadequate, D
Area floods, F
Heavy rainfall
Road maintenace/modification
inadequate A, D, E
Roadway dysfunctional/
closed/hazardous, A, B, D, E, G
Production and systems/equipment require road access,
H
F: Relocate or modify
inappropriate roads
E: Increase road application with
routes to non-flood areas
D: Increase geotechnical and
drainage capability
G: Improve safety and resistance of routes to flood
damage
A: Install continuous monitoring to roads
B: Install flood emergency signs, maps, guidelines
C: Implement advanced traffic transport system
Inadequate road culvert/hydraulic
structures D
Fault
Top level event
Causes and contributing factors
Counter measure
And
OR
No access/exit to/from mine A-G
H: Install remote control operations,
systems control where possible

66 | C21041
Preparing a mine for both drought and flood - Stage 1: a vulnerability and adaptive capacity study | 67
Appendix C
The CRATER quick how-to guide.
CRATER is a 3-step process:
1. GIS – MCE 2. FTA 3. 5-CA
Step 1 GIS-MCE
You will need:
A Geographic Information System software package that allows Multi-criteria Evaluation to be performed (preferably ESRI ArcGIS)
Geographical data of the mine site, ideally including a fine scale digital elevation model (DEM), stream map, vegetation map, soil map and data. Infrastructure and mine maps including underground infrastructure, entrances, pits, buildings, power lines, roads, railways, fibre optics. As a minimum, a DEM and stream map could be used along with infrastructure; however, when assessing results, the control that soil and vegetation can also have on flooding should be taken into consideration.
What to do:
Once data is in correct format, load all data into GIS workspace.
Using the DEM it is possible to derive a slope map.
Using a stream map, buffer zones around each stream can be added to create a new map that allows for cumulative drainage. Additionally, a density map of the drainage lines can be produced.
Recent aerial photographs can be used to digitally trace infrastructure to make additional mine maps.
When all data layers are produced, a ranking scheme has to be applied to each parameter; the ranks express the degree of control or influence of each parameter on flooding.
When data are ranked, assign weightings to each layer depending on its influence on drainage and flooding at the mine scale.
Perform several MCEs (varying ranking and weighting schemes) and assess resulting MCE maps vs known flooding records and images at the mine. When a realistic MCE is selected, colour the resulting map in a way that identifies clearly the lowest MCE scores, which show the highest vulnerability areas (eg. colour hot-spots red and choose cooler colours for lower vulnerability/hazard).
When hot-spots have been determined, identify the infrastructure within the hot-spot area that can be impacted. Discuss with mine staff, engineers, geotechnical staff and management the possible issues that can occur for infrastructure present and create a table of issues that can be assessed and/or mitigated in Step 2.

68 | C21041
Step 2 FTA
For each issue that may occur within the hot-spot, perform a fault tree analysis (FTA) by developing a fault tree using top-down logic to identify how a top level event may occur. Note that FTA can be performed with mathematical probabilities and may link with other FTAs for other issues, having cumulative impacts between trees. Performing the FTA will include identifying possible adaptation options that may reduce the risk of the top level event occurring. Selecting adaptation options for assessing in Step 3, its impact must also be considered, to avoid mal-adaptation where a change does not bring about further issues.
Step 3 5-CA
Where a counter measure has been considered as a real adaptation option, the mine’s ability to adapt can be quickly assessed. Using a ‘radar’ or ‘spider web’ diagram, the resources or ‘capitals’ available to the mine must be plotted vs those required to implement the adaptation option. Although this could be done mathematically/accurately, it is not designed as such and instead is only representative to show a relative view to compare options.
Together the hot-spot maps, the FTA and the 5CA provide a set of visuals that are designed to assist decision makers understand where there top issues may be at a mine, why an issue can occur, and the ways in which it could be tackled, including the most realistic option for the mine at a given point in time. What-if scenarios can also be played out with this method, using future mine models rather than current maps, using worst case scenario weighting for higher rainfall, introducing potential issues into the FTA and by trialling various resource availabilities in the 5CA.
For further information on each step and an example, see ACARP report for project C21041.


70 | C21041
CONTACT US
t 1300 363 400 +61 7 3327 4118 e [email protected] w www.csiro.au
YOUR CSIRO
Australia is founding its future on science and innovation. Its national science agency, CSIRO, is a powerhouse of ideas, technologies and skills for building prosperity, growth, health and sustainability. It serves governments, industries, business and communities across the nation.
FOR FURTHER INFORMATION
Earth Science and Resource Engineering Jane Hodgkinson t +61 7 3327 4118 e [email protected] w www.csiro.au/Coalportfolio www.csiro.au/ClimateAdaptationFlagship