accelerating growth - wpp
TRANSCRIPT
1WPP
CAPITAL MARKETS DAY
17 December 2020
ACCELERATING GROWTH

This presentation contains statements that are, or may be deemed to be, “forward-looking statements”. Forward-looking statements give the Group’s current expectations or forecasts of future events. An investor can identify these statements by the fact that they do not relate strictly to historical or current facts. They use words such as ‘anticipate’, ‘estimate’, ‘expect’, ‘intend’, ‘will’, ‘project’, ‘plan’, ‘believe’, ‘target’ and other words and terms of similar meaning in connection with any discussion of future operating or financial performance.
Other than in accordance with its legal or regulatory obligations (including under the Market Abuse Regulations, UK Listing Rules and the Disclosure Guidance and Transparency Rules of the Financial Conduct Authority), the Group undertakes no obligation to update any forward-looking statements, whether as a result of new information, future events or otherwise. Investors should, however, consult any additional disclosures that the Group may make in any documents which it publishes and/or files with the US Securities and Exchange Commission (SEC). All investors, wherever located, should take note of these disclosures. Accordingly, no assurance can be given that any particular expectation will be met and investors are cautioned not to place undue reliance on the forward-looking statements. Forward-looking statements are subject to assumptions, inherent risks and uncertainties, many of which relate to factors that are beyond the Group’s control or precise estimate. The Group cautions investors that a number of important factors, including those in this presentation, could cause actual results to differ materially from those expressed or implied in any forward-looking statement. Such factors include, but are not limited to, those discussed under Item 3.D ‘Risk factors’ in the Group’s Annual Report on Form 20-F for FY 2019 and any impacts of the COVID-19 pandemic. Any forward-looking statements made by or on behalf of the Group speak only as of the date they are made and are based upon the knowledge and information available to the Directors on the date of this presentation.
Nothing in this presentation should be construed as either an offer to sell or a solicitation of an offer to buy or sell WPP securities in any jurisdiction, or be treated or relied upon as a recommendation or advice by WPP.
The views expressed in this presentation contain information that has been derived from publicly available sources that have not been independently verified. No representation or warranty is made as to the accuracy, completeness or reliability of the information. This presentation should not be relied upon as a recommendation or forecast by WPP.
2
CAUTIONARY STATEMENT REGARDING FORWARD-LOOKING STATEMENTS

3WPP
WPP IS A
CREATIVE TRANSFORMATION COMPANY
4WPP
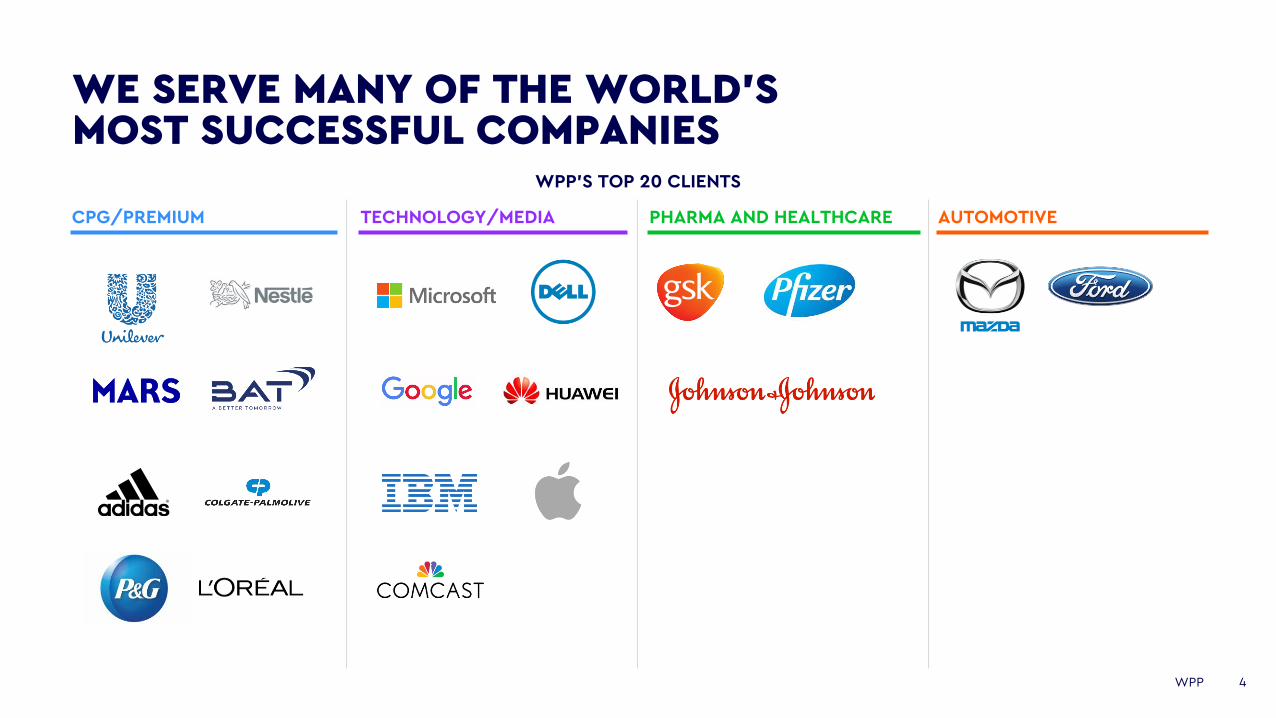
WE SERVE MANY OF THE WORLD’S MOST SUCCESSFUL COMPANIES
CPG/PREMIUM TECHNOLOGY/MEDIA PHARMA AND HEALTHCARE AUTOMOTIVE
WPP’S TOP 20 CLIENTS
5WPP
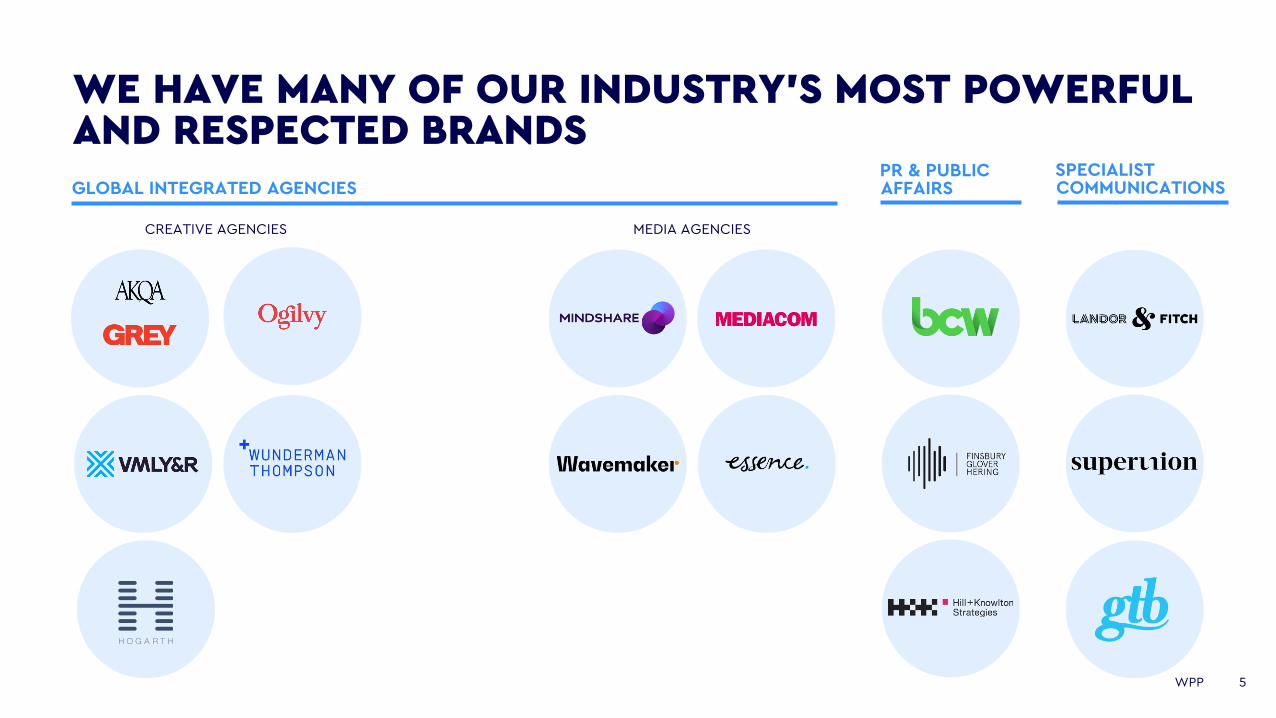
WE HAVE MANY OF OUR INDUSTRY’S MOST POWERFUL AND RESPECTED BRANDS
CREATIVE AGENCIES MEDIA AGENCIES
GLOBAL INTEGRATED AGENCIESPR & PUBLIC AFFAIRS
SPECIALIST COMMUNICATIONS
6WPP
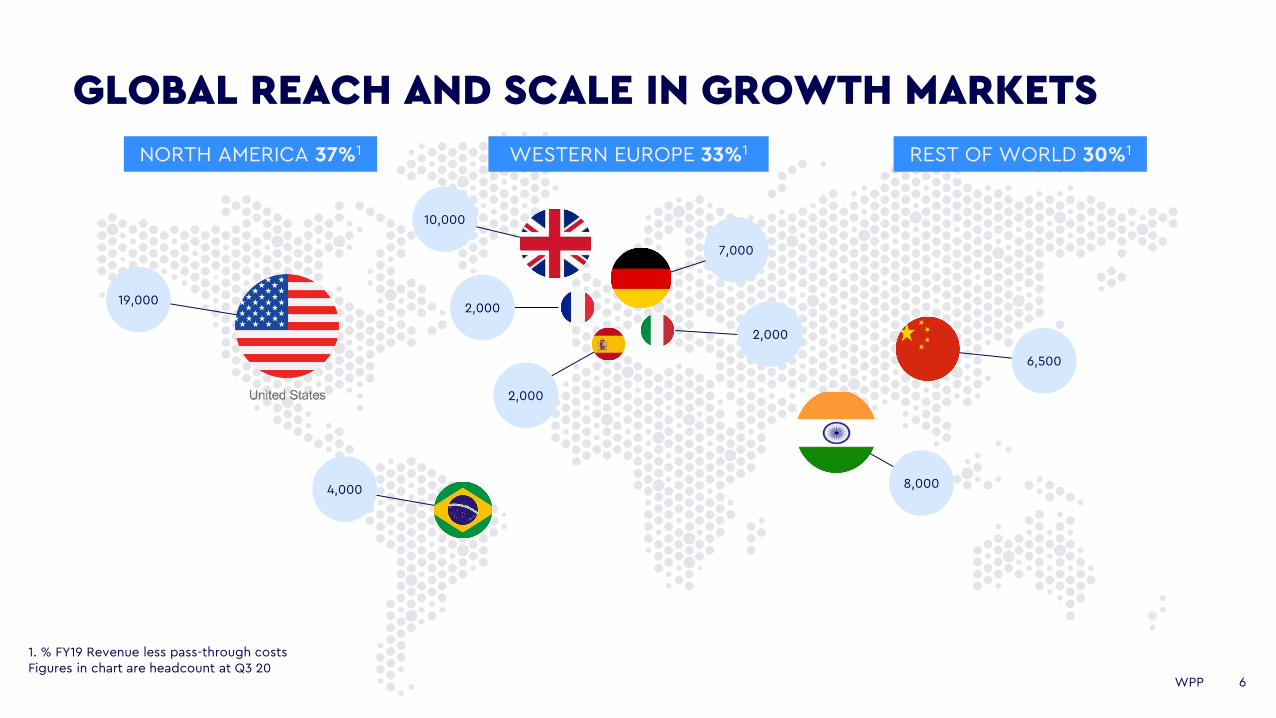
GLOBAL REACH AND SCALE IN GROWTH MARKETS
1. % FY19 Revenue less pass-through costs Figures in chart are headcount at Q3 20
19,000
4,000
2,000
2,000
2,000
10,000
7,000
8,000
6,500
NORTH AMERICA 37%1 WESTERN EUROPE 33%1 REST OF WORLD 30%1

7WPP
SIGNIFICANT STRENGTHS IN A TECHNOLOGY-DRIVEN WORLD
1. H1 20 figure2. YTD Sep-20
Top 3 Global partner to Adobe and Salesforce in marketing tech
Working on ecommerce with
76 100
OU
T O
F T
OP
clients
1.6BAudience pool updated
for planning and activation daily
>20kAccreditations in 2020 across
technology partners1
c.40%of media billings
are digital
25% $10B
c.$30BAnnual GMV over WPP-installed
commerce platforms
Of net sales attributable to clients in TMT sector2
Client billings across Google, Amazon and Facebook
7WPP
8WPP
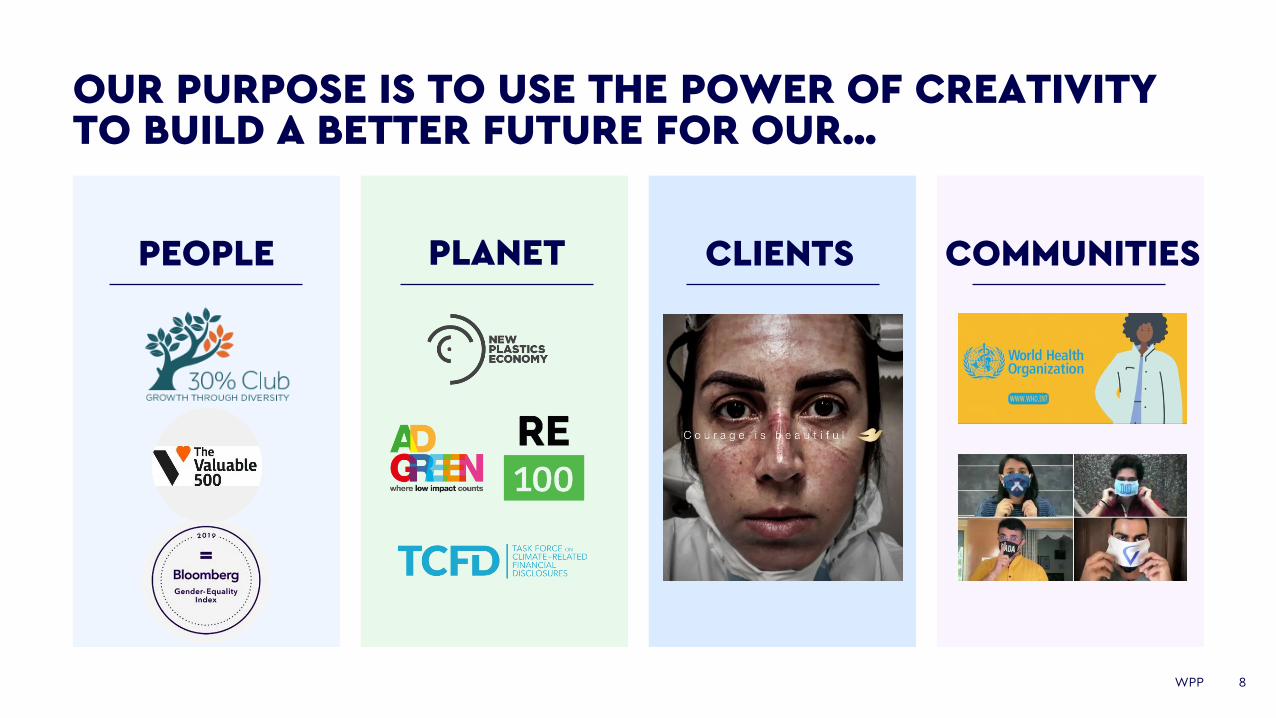
OUR PURPOSE IS TO USE THE POWER OF CREATIVITY TO BUILD A BETTER FUTURE FOR OUR…
PEOPLE PLANET CLIENTS COMMUNITIES

PROGRESS SINCE DECEMBER 2018
ACCELERATING GROWTH
ACCELERATING OUR GROWTH
• THE MARKET
• WPP’S STRATEGY
• BUILDING OUR CULTURE
• FINANCIAL PLAN
Q&A

PROGRESS SINCE DECEMBER 2018
11WPP
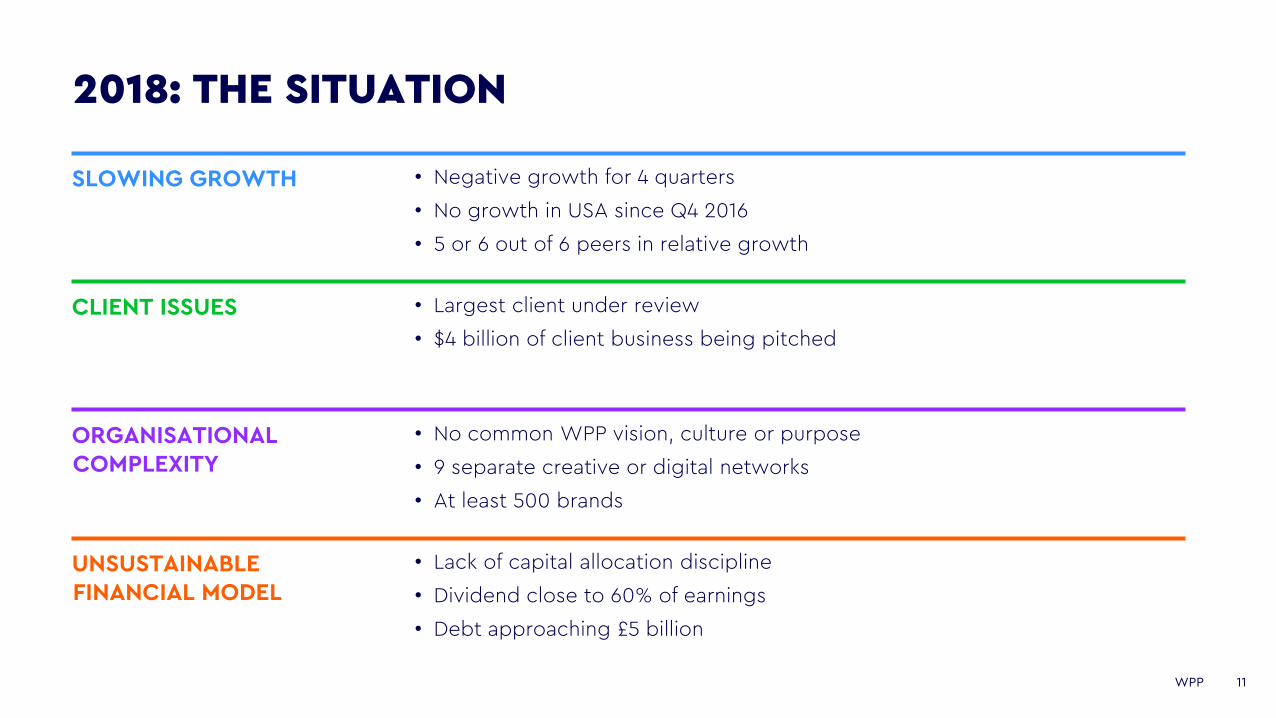
2018: THE SITUATION
• Negative growth for 4 quarters
• No growth in USA since Q4 2016
• 5 or 6 out of 6 peers in relative growth
SLOWING GROWTH
ORGANISATIONAL COMPLEXITY
• No common WPP vision, culture or purpose
• 9 separate creative or digital networks
• At least 500 brands
UNSUSTAINABLE FINANCIAL MODEL
• Lack of capital allocation discipline
• Dividend close to 60% of earnings
• Debt approaching £5 billion
• Largest client under review
• $4 billion of client business being pitched
CLIENT ISSUES

12WPP
12.0%
7.5%
22.9%
5.9%6.8%
3.0%3.0%
-3.5%
3.8%
-1.5%
1.0%
-4.9%
7.5%
-2.4%
-10%
-5%
0%
5%
10%
15%
20%
25%
5 yr CAGR to 2014 5 yr CAGR to 2019
WHILE MEDIA AND DIGITAL PERFORMED WELL, OUR CREATIVE AGENCIES STRUGGLED
BASIS OF PREP: All agencies exclude GTB and the effect of material intra-group transfers. Ogilvy excludes Geometry. All agencies include Hogarth.
RELATIVE GROWTH OF MAJOR AGENCIES(CONSTANT CURRENCY NET SALES GROWTH, INCLUDING M&A)
MEDIAGroupM
DIGITAL
VML
Wunderman
CREATIVE
JWT
Ogilvy
Y&R
Grey
13WPP
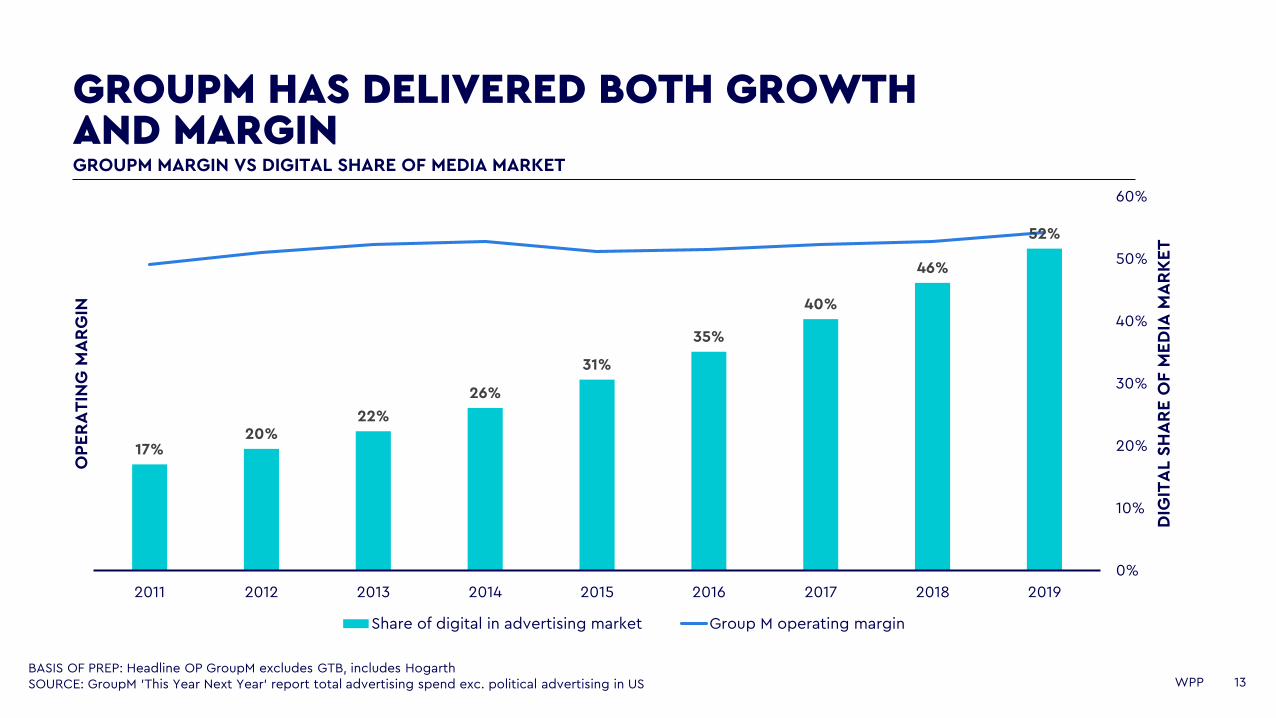
GROUPM HAS DELIVERED BOTH GROWTH AND MARGIN
BASIS OF PREP: Headline OP GroupM excludes GTB, includes HogarthSOURCE: GroupM 'This Year Next Year' report total advertising spend exc. political advertising in US
17%20%
22%
26%
31%
35%
40%
46%
52%
0%
10%
20%
30%
40%
50%
60%
2011 2012 2013 2014 2015 2016 2017 2018 2019
DIG
ITA
L S
HA
RE
OF M
ED
IA M
AR
KE
T
OP
ER
AT
ING
MA
RG
IN
Share of digital in advertising market Group M operating margin
GROUPM MARGIN VS DIGITAL SHARE OF MEDIA MARKET
14WPP
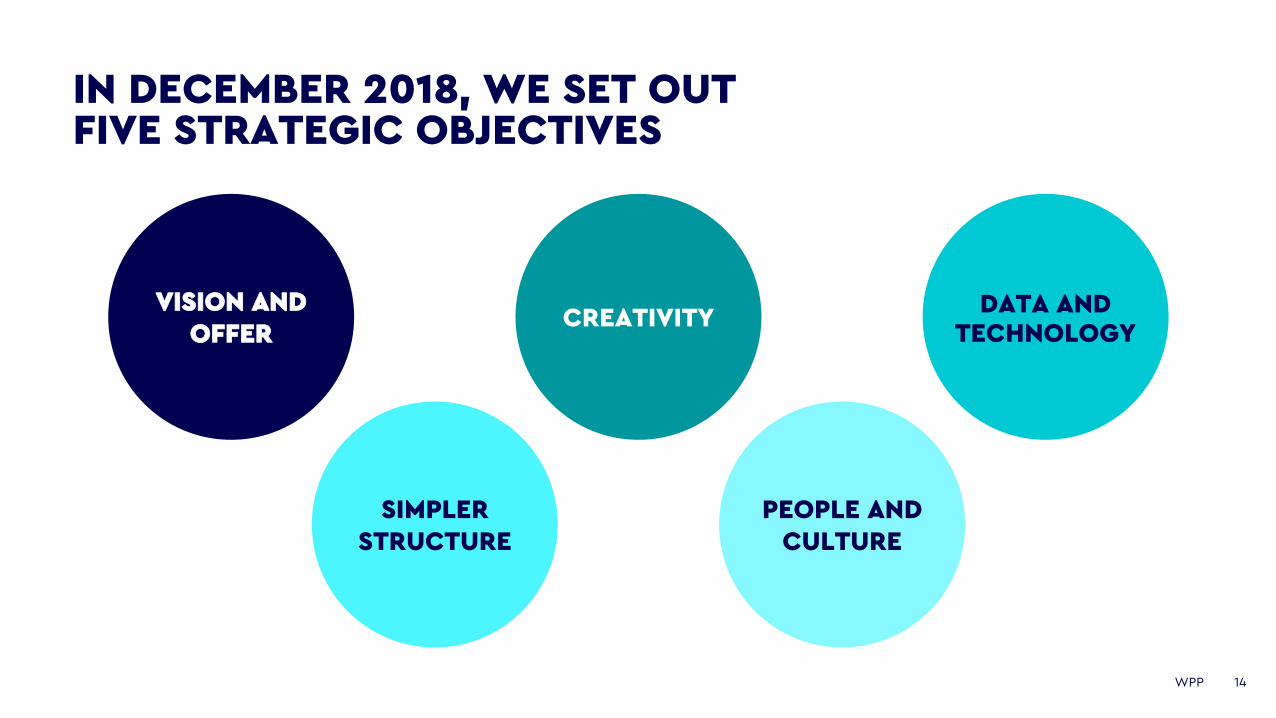
IN DECEMBER 2018, WE SET OUT FIVE STRATEGIC OBJECTIVES
CREATIVITYDATA AND
TECHNOLOGYVISION AND
OFFER
CULTURESIMPLER
STRUCTURESIMPLER
STRUCTUREPEOPLE AND
CULTURE
VISION AND OFFER
CREATIVITYDATA AND
TECHNOLOGY
15WPP
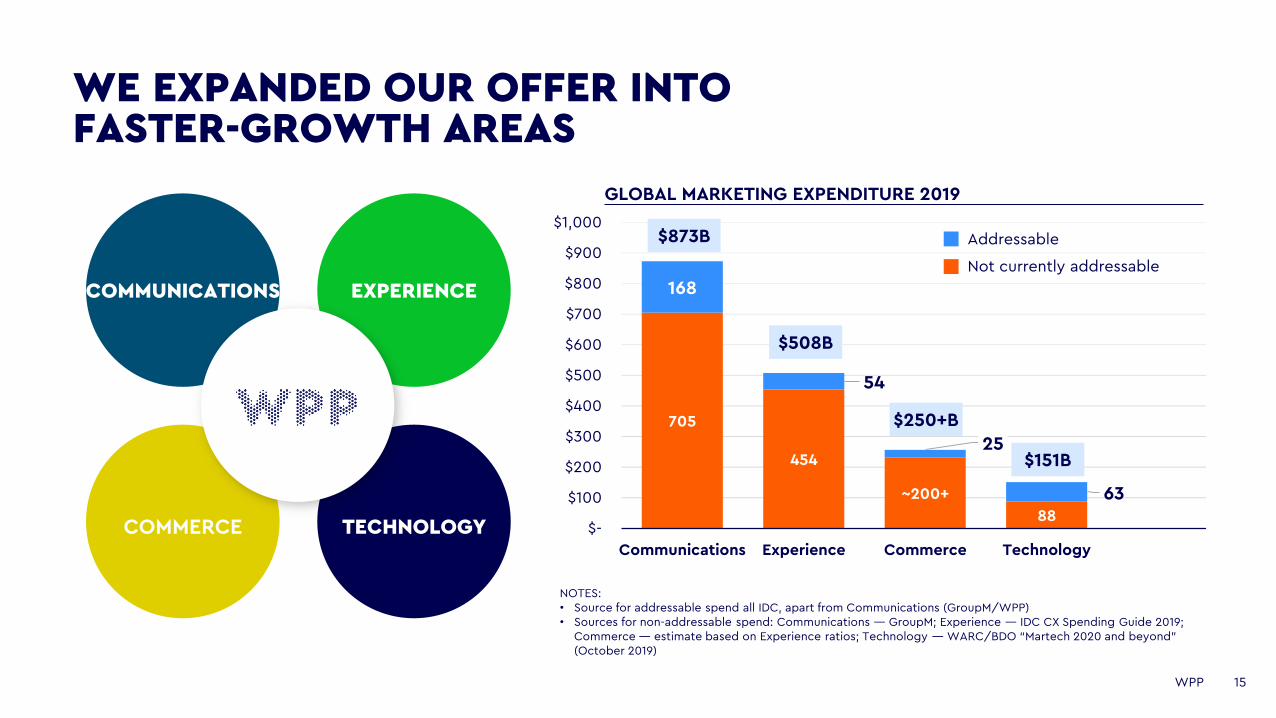
WE EXPANDED OUR OFFER INTO FASTER-GROWTH AREAS
705
454
~200+
88
168
54
25
63
$-
$100
$200
$300
$400
$500
$600
$700
$800
$900
$1,000
Communications Experience Commerce Technology
$873B
$508B
$250+B
$151B
NOTES:• Source for addressable spend all IDC, apart from Communications (GroupM/WPP)• Sources for non-addressable spend: Communications — GroupM; Experience — IDC CX Spending Guide 2019;
Commerce — estimate based on Experience ratios; Technology — WARC/BDO “Martech 2020 and beyond” (October 2019)
GLOBAL MARKETING EXPENDITURE 2019
Addressable
Not currently addressable
COMMUNICATIONS
COMMERCE
EXPERIENCE
TECHNOLOGY
16WPP
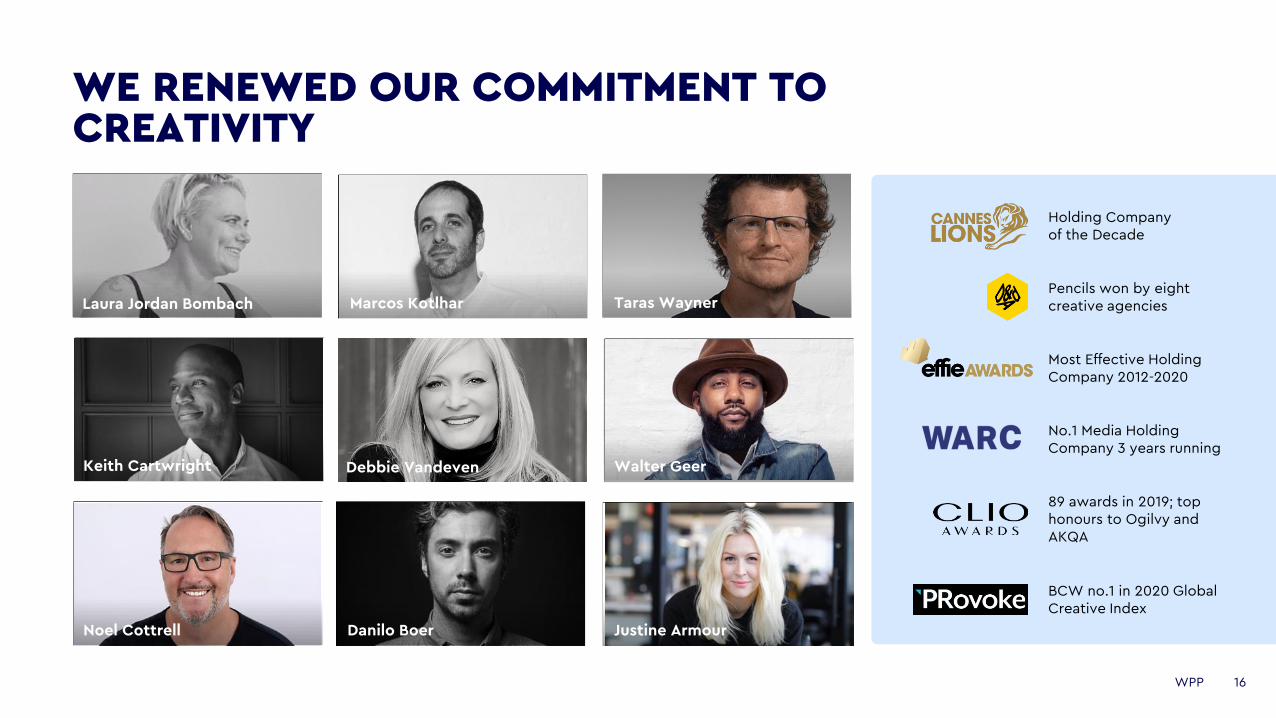
WE RENEWED OUR COMMITMENT TO CREATIVITY
Laura Jordan Bombach Marcos Kotlhar Taras Wayner
Holding Company of the Decade
Most Effective Holding Company 2012-2020
No.1 Media Holding Company 3 years running
89 awards in 2019; top honours to Ogilvy and AKQA
Pencils won by eight creative agencies
BCW no.1 in 2020 Global Creative Index
Walter GeerKeith Cartwright Debbie Vandeven
Noel Cottrell Danilo Boer Justine Armour
17WPP
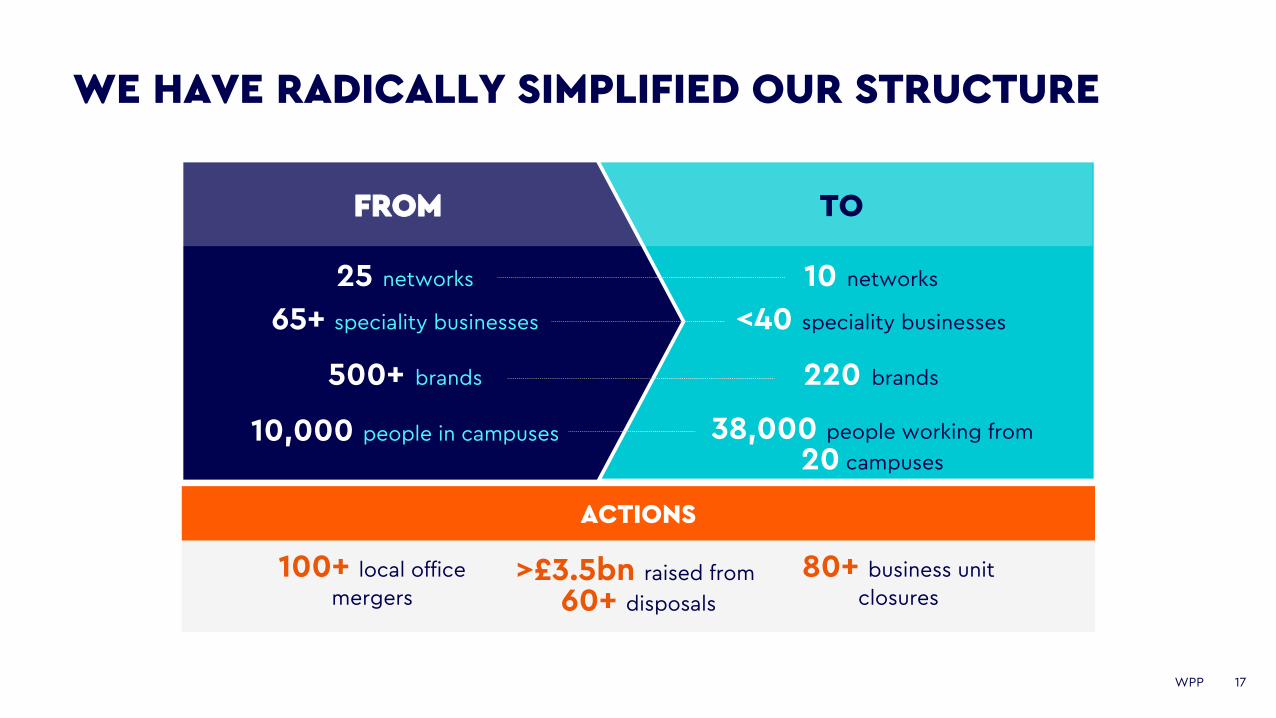
WE HAVE RADICALLY SIMPLIFIED OUR STRUCTURE
ACTIONS
100+ local office
mergers>£3.5bn raised from
60+ disposals
80+ business unit
closures
TOFROM
25 networks 10 networks
500+ brands 220 brands
65+ speciality businesses <40 speciality businesses
10,000 people in campuses 38,000 people working from
20 campuses
18WPP
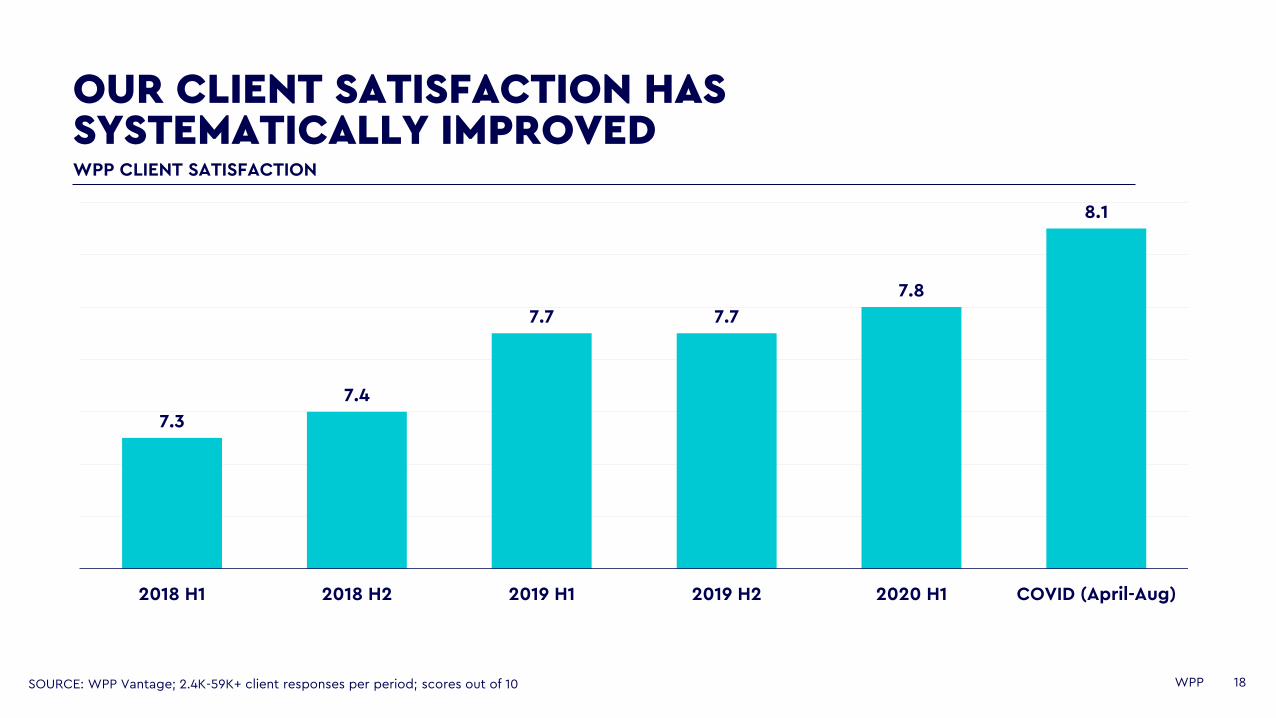
OUR CLIENT SATISFACTION HAS SYSTEMATICALLY IMPROVED
SOURCE: WPP Vantage; 2.4K-59K+ client responses per period; scores out of 10
7.3
7.4
7.7 7.7
7.8
8.1
6.8
7
7.2
7.4
7.6
7.8
8
8.2
2018 H1 2018 H2 2019 H1 2019 H2 2020 H1 COVID (April-Aug)
WPP CLIENT SATISFACTION

19WPP
WE HAVE WON AND RETAINED MAJOR CLIENTS
RANK OCTOBER
HOLDINGGROUP
ESTIMATED CREATIVE YTD REVENUE (USD $M)
ESTIMATED MEDIA YTD REVENUE (USD $M)
ESTIMATED OVERALL YTD REVENUE (USD $M) % AS OF 2019 REVENUE NO. OF WINS
1 WPP 286.9 269.6 556.6 3.3% 1,590
2 Publicis Groupe 109.1 148.6 257.7 2.2% 659
3 Omnicom 114.8 141.3 256.1 1.7% 778
4 Dentsu 107.6 77.3 185.0 1.9% 898
5 Interpublic 93.8 69.3 163.2 1.6% 442
Global / Oct 2020
20WPP
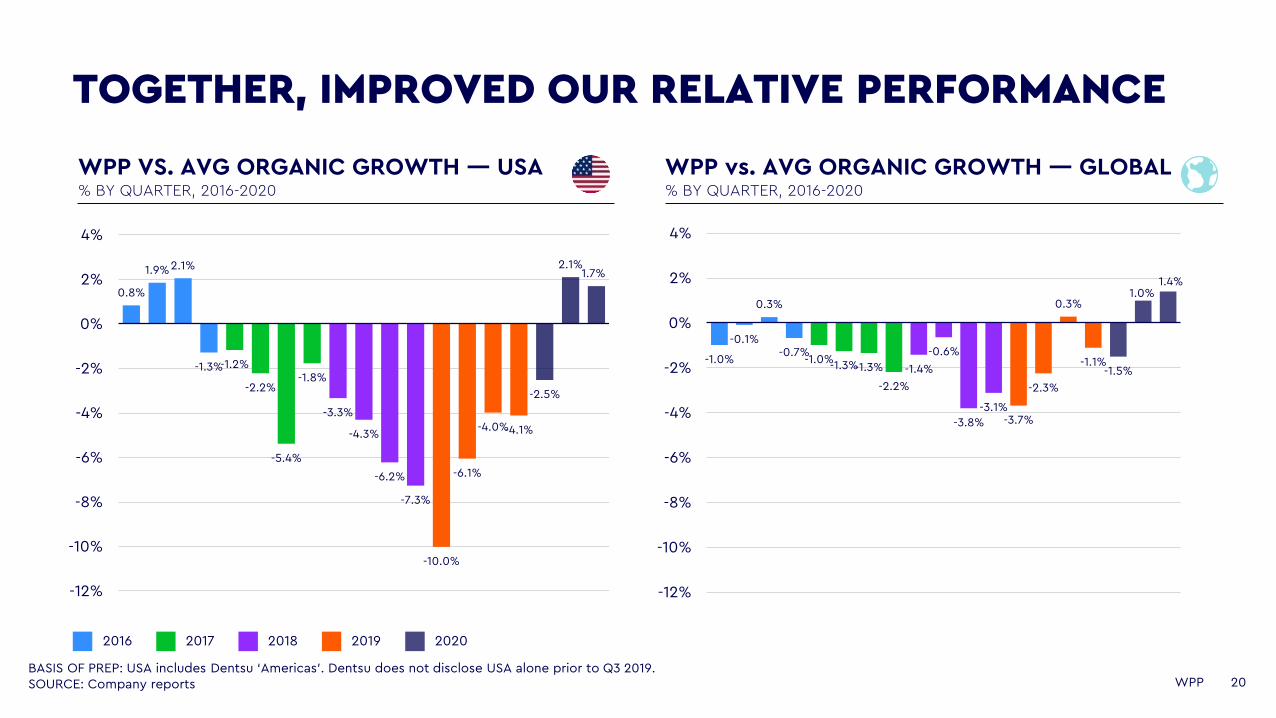
-1.0%
-0.1%
0.3%
-0.7%-1.0%
-1.3%-1.3%
-2.2%
-1.4%
-0.6%
-3.8%
-3.1%-3.7%
-2.3%
0.3%
-1.1%-1.5%
1.0%1.4%
-12%
-10%
-8%
-6%
-4%
-2%
0%
2%
4%
1Q16
2Q
16
3Q
16
4Q
16
1Q17
2Q
17
3Q
17
4Q
17
1Q18
2Q
18
3Q
18
4Q
18
1Q19
2Q
19
3Q
19
4Q
19
1Q2
0
2Q
20
3Q
20
TOGETHER, IMPROVED OUR RELATIVE PERFORMANCE
BASIS OF PREP: USA includes Dentsu ‘Americas’. Dentsu does not disclose USA alone prior to Q3 2019.SOURCE: Company reports
0.8%
1.9%2.1%
-1.3%-1.2%
-2.2%
-5.4%
-1.8%
-3.3%
-4.3%
-6.2%
-7.3%
-10.0%
-6.1%
-4.0%-4.1%
-2.5%
2.1%1.7%
-12%
-10%
-8%
-6%
-4%
-2%
0%
2%
4%
1Q16
2Q
16
3Q
16
4Q
16
1Q17
2Q
17
3Q
17
4Q
17
1Q18
2Q
18
3Q
18
4Q
18
1Q19
2Q
19
3Q
19
4Q
19
1Q2
0
2Q
20
3Q
20
2016 2017
WPP VS. AVG ORGANIC GROWTH — USA % BY QUARTER, 2016-2020
WPP vs. AVG ORGANIC GROWTH — GLOBAL% BY QUARTER, 2016-2020
2018 2019 2020
21WPP
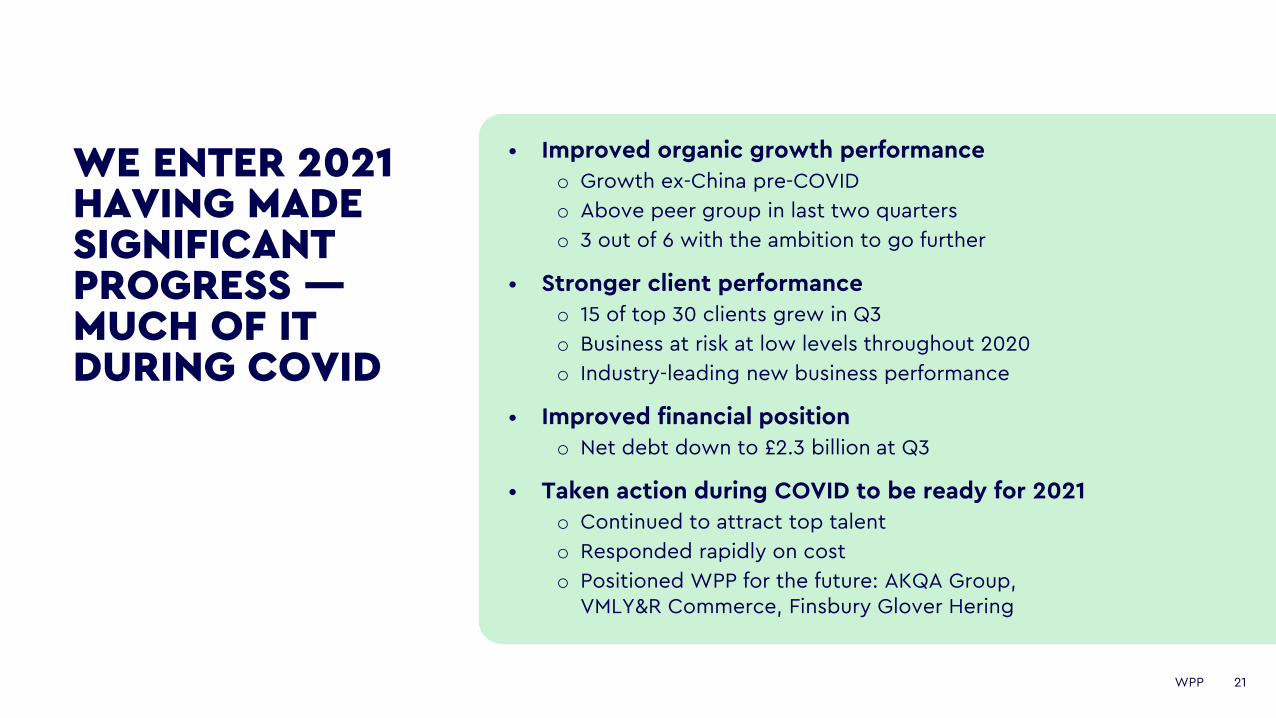
• Improved organic growth performance
o Growth ex-China pre-COVID
o Above peer group in last two quarters
o 3 out of 6 with the ambition to go further
• Stronger client performance
o 15 of top 30 clients grew in Q3
o Business at risk at low levels throughout 2020
o Industry-leading new business performance
• Improved financial position
o Net debt down to £2.3 billion at Q3
• Taken action during COVID to be ready for 2021
o Continued to attract top talent
o Responded rapidly on cost
o Positioned WPP for the future: AKQA Group, VMLY&R Commerce, Finsbury Glover Hering
WE ENTER 2021 HAVING MADE SIGNIFICANT PROGRESS —MUCH OF IT DURING COVID

ACCELERATING OUR GROWTH: THE MARKET
23WPP
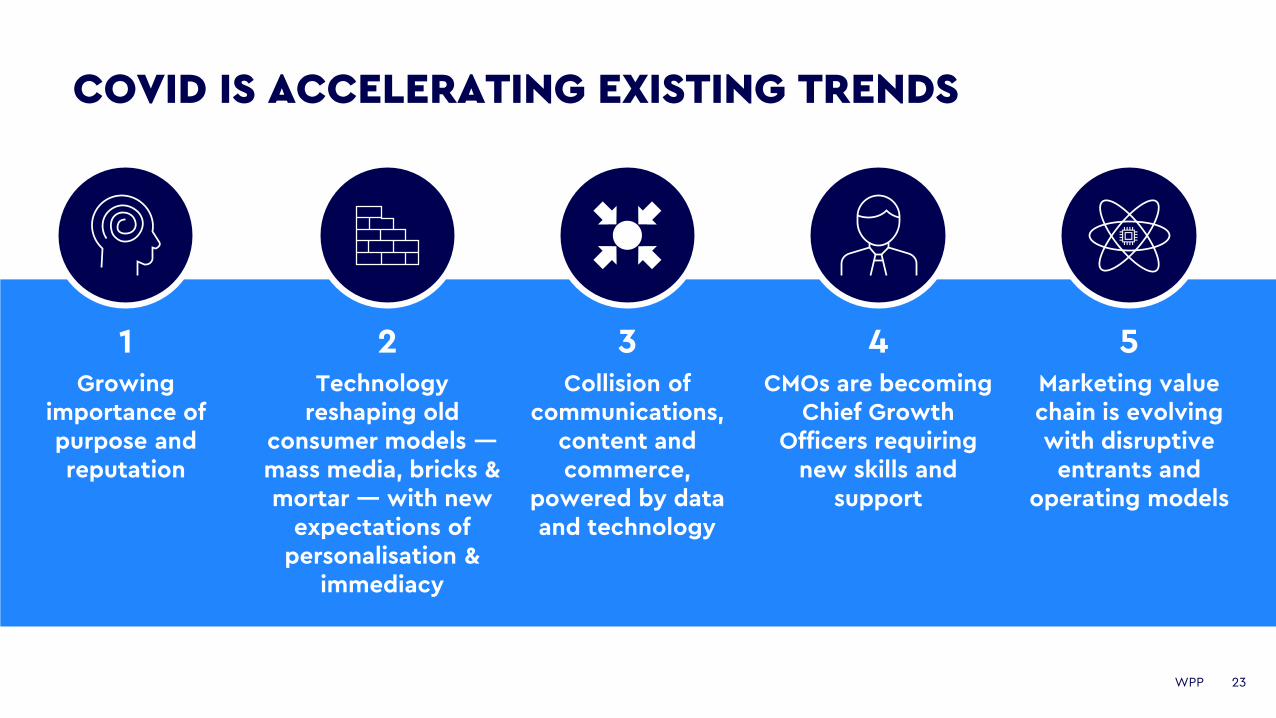
COVID IS ACCELERATING EXISTING TRENDS
1Growing
importance of purpose and reputation
4CMOs are becoming
Chief Growth Officers requiring
new skills and support
5Marketing value chain is evolving with disruptive
entrants and operating models
2Technology
reshaping old consumer models —mass media, bricks & mortar — with new
expectations of personalisation &
immediacy
3Collision of
communications, content and commerce,
powered by data and technology
24WPP
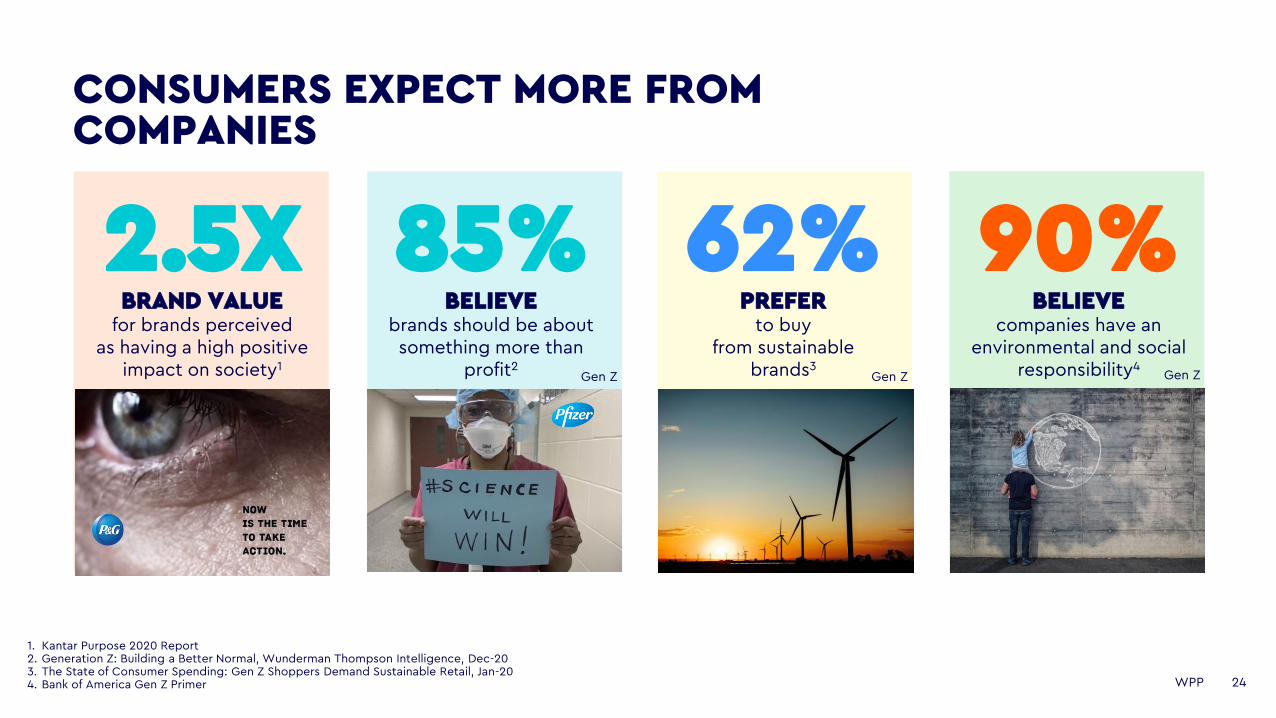
1. Kantar Purpose 2020 Report2. Generation Z: Building a Better Normal, Wunderman Thompson Intelligence, Dec-203. The State of Consumer Spending: Gen Z Shoppers Demand Sustainable Retail, Jan-204. Bank of America Gen Z Primer
CONSUMERS EXPECT MORE FROM COMPANIES
2.5XBRAND VALUE
for brands perceived as having a high positive
impact on society1
85%BELIEVE
brands should be about something more than
profit2
62%PREFER
to buy from sustainable
brands3
90%BELIEVE
companies have an environmental and social
responsibility4Gen Z Gen ZGen Z
25WPP
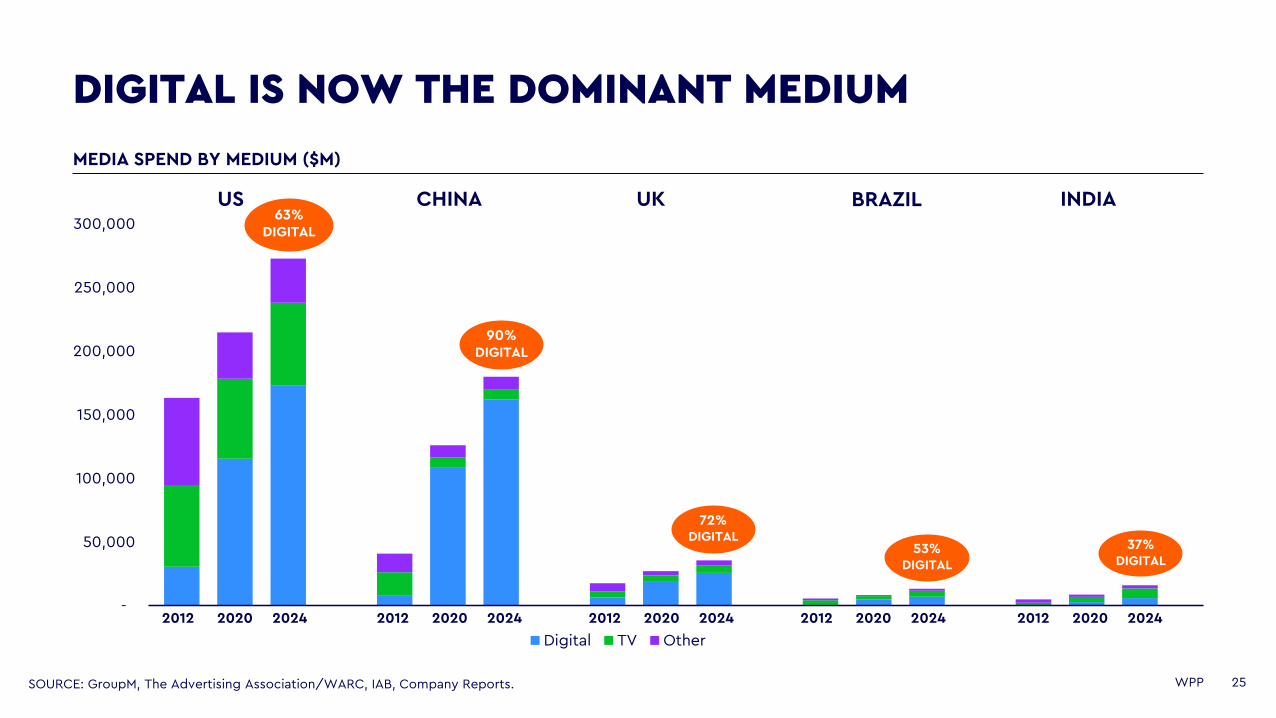
MEDIA SPEND BY MEDIUM ($M)
DIGITAL IS NOW THE DOMINANT MEDIUM
SOURCE: GroupM, The Advertising Association/WARC, IAB, Company Reports.
-
50,000
100,000
150,000
200,000
250,000
300,000
Digital TV Other
2012 2020 2024 2012 2020 2024 2012 2020 2024 2012 2020 2024 2012 2020 2024
UKUS CHINA BRAZIL INDIA63%
DIGITAL
90% DIGITAL
72% DIGITAL
53% DIGITAL
37% DIGITAL

26WPP
15%16%
18%
20%
31%
27%
9%10%
11%12%
16%
14%
5%
10%
15%
20%
25%
30%
35%
2017 2018 2019 Q1 20 Q2 20 Q3 20
UK US
ECOMMERCE HAS ACCELERATED DRAMATICALLY
SOURCE: US Consensus (Nov-20) and ONS Internet retail sales (UK). Q3 20 represents preliminary estimates.
ECOMMERCE AS % OF RETAIL SALES
PAGE 26
27WPP1. Digital TV Research
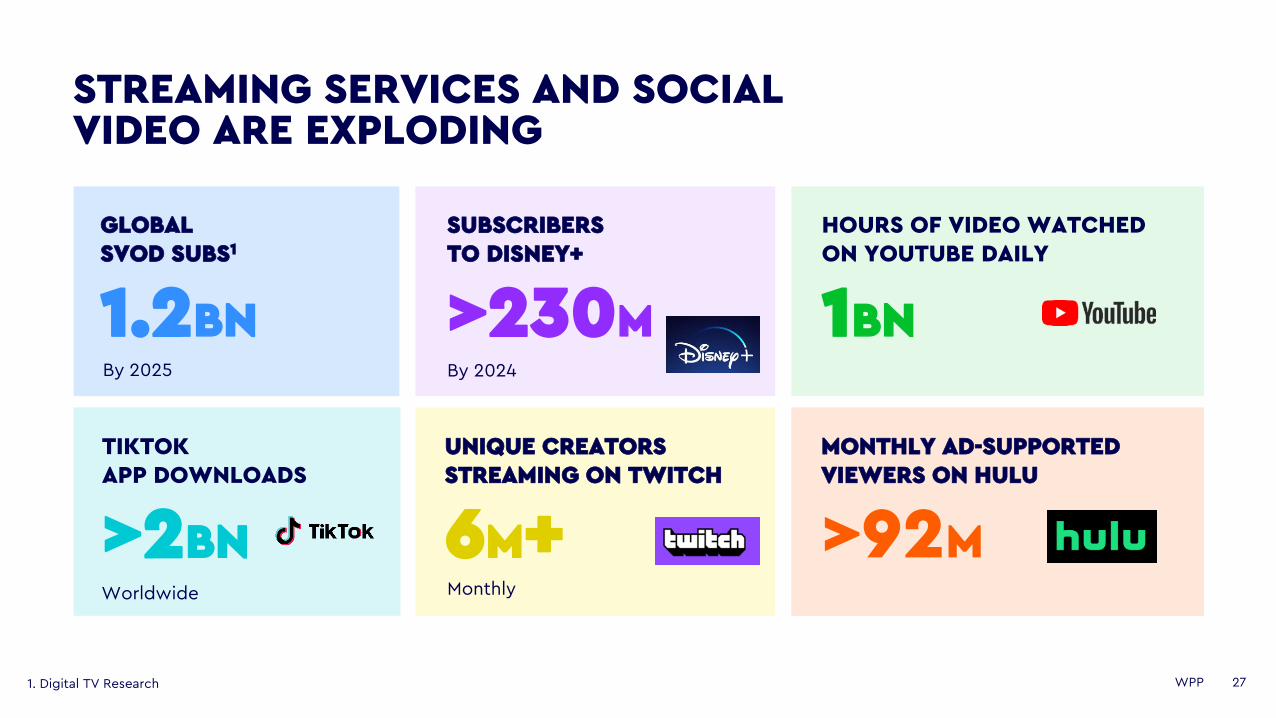
STREAMING SERVICES AND SOCIAL VIDEO ARE EXPLODING
GLOBAL SVOD SUBS1
1.2BNBy 2025
SUBSCRIBERS TO DISNEY+
>230MBy 2024
UNIQUE CREATORS STREAMING ON TWITCH
6M+Monthly
TIKTOK APP DOWNLOADS
>2BNWorldwide
HOURS OF VIDEO WATCHED ON YOUTUBE DAILY
1BN
MONTHLY AD-SUPPORTED VIEWERS ON HULU
>92M
28WPP
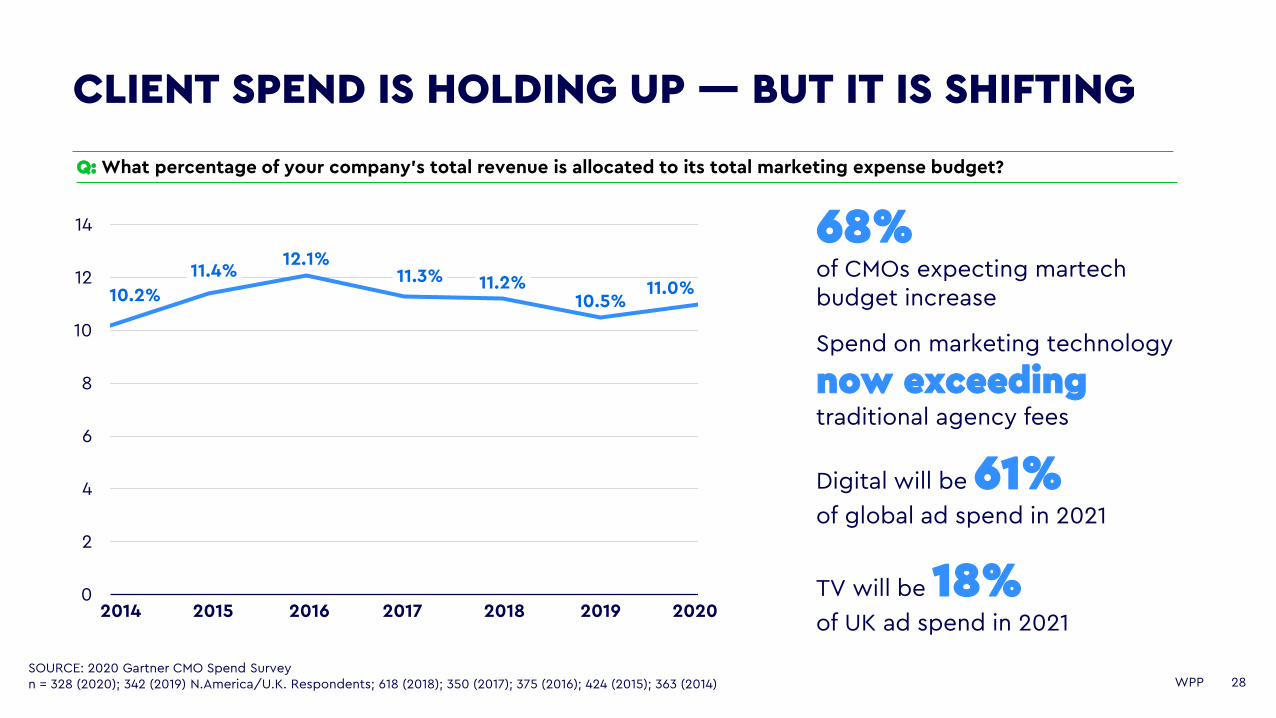
11.4%12.1%
11.3% 11.2%10.5%
11.0%
0
2
4
6
8
10
12
14
CLIENT SPEND IS HOLDING UP — BUT IT IS SHIFTING
SOURCE: 2020 Gartner CMO Spend Surveyn = 328 (2020); 342 (2019) N.America/U.K. Respondents; 618 (2018); 350 (2017); 375 (2016); 424 (2015); 363 (2014)
10.2%
Q: What percentage of your company’s total revenue is allocated to its total marketing expense budget?
68%of CMOs expecting martechbudget increase
Spend on marketing technology
now exceeding traditional agency fees
Digital will be 61%of global ad spend in 2021
202020162014 20192015 2017 2018TV will be 18%of UK ad spend in 2021
29WPP
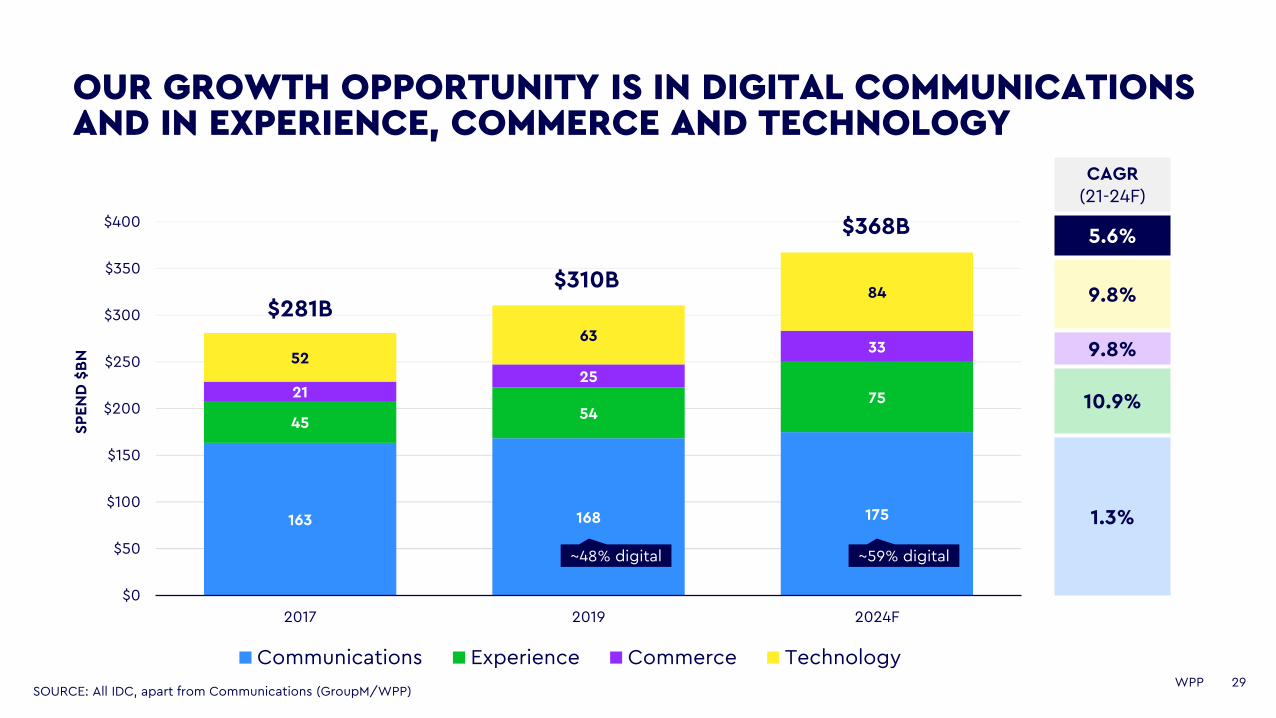
CAGR(21-24F)
5.6%
9.8%
9.8%
10.9%
1.3%
OUR GROWTH OPPORTUNITY IS IN DIGITAL COMMUNICATIONS AND IN EXPERIENCE, COMMERCE AND TECHNOLOGY
163 168 175
4554
752125
3352
63
84
$0
$50
$100
$150
$200
$250
$300
$350
$400
2017 2019 2024F
Communications Experience Commerce Technology
$281B
SP
EN
D $
BN
$368B
$310B
~48% digital ~59% digital
SOURCE: All IDC, apart from Communications (GroupM/WPP)

30WPP
5 MINS
COFFEE BREAKEXTRAORDINARY AWARDS
ACCELERATING OUR GROWTH: WPP’S STRATEGY
32WPP
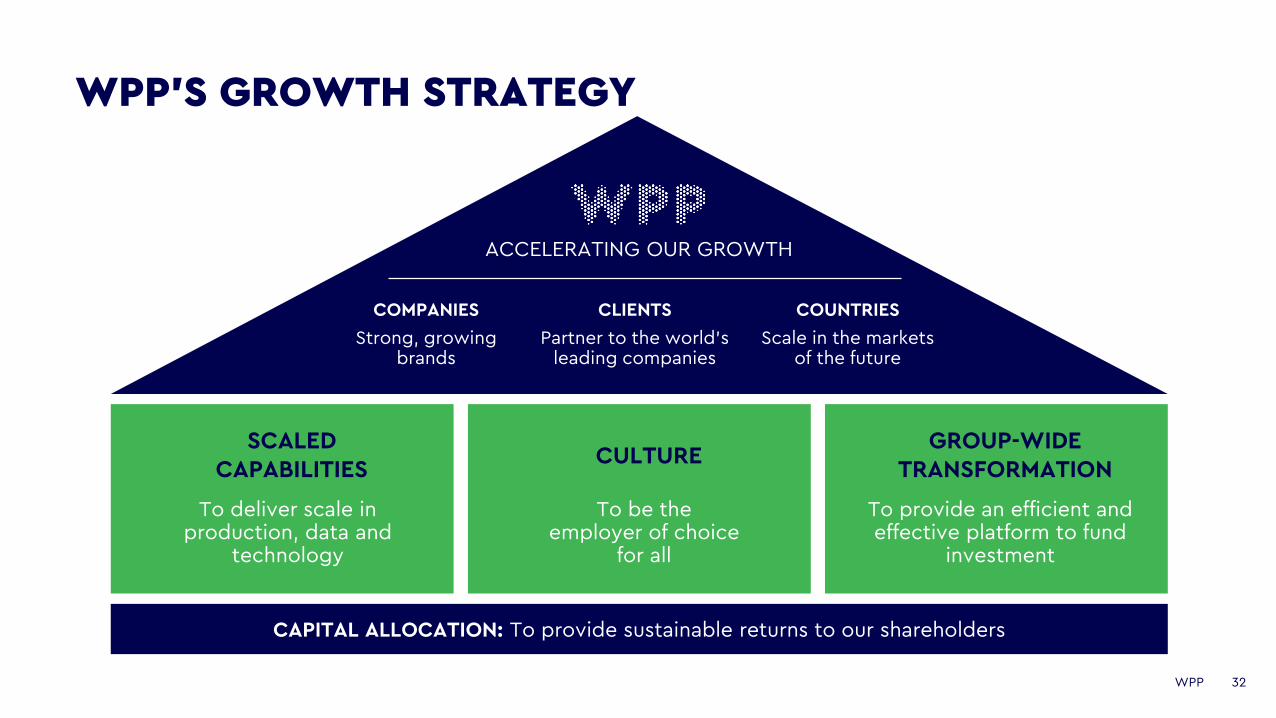
WPP’S GROWTH STRATEGY
SCALED CAPABILITIES
CAPITAL ALLOCATION: To provide sustainable returns to our shareholders
ACCELERATING OUR GROWTH
CULTUREGROUP-WIDE
TRANSFORMATION
To deliver scale in production, data and
technology
To be the employer of choice
for all
To provide an efficient and effective platform to fund
investment
COMPANIES
Strong, growing brands
CLIENTS
Partner to the world’s leading companies
COUNTRIES
Scale in the markets of the future
33WPP
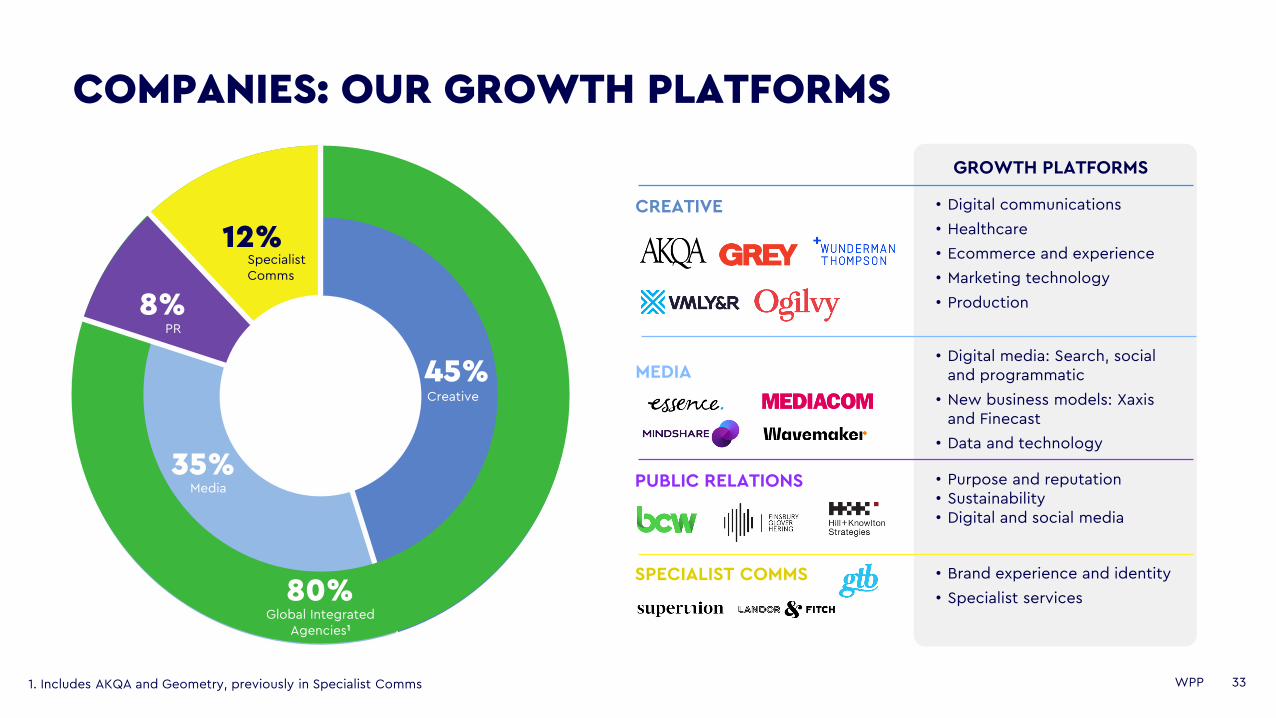
COMPANIES: OUR GROWTH PLATFORMS
1. Includes AKQA and Geometry, previously in Specialist Comms
INTEGRATED AGENCIES
GROWTH PLATFORMS
• Digital communications
• Healthcare
• Ecommerce and experience
• Marketing technology
• Production
• Digital media: Search, social and programmatic
• New business models: Xaxisand Finecast
• Data and technology
• Purpose and reputation• Sustainability• Digital and social media
• Brand experience and identity
• Specialist services
CREATIVE
MEDIA
PUBLIC RELATIONS
SPECIALIST COMMS
12%
8%
45%Creative
35%Media
80%Global Integrated
Agencies1
PR
Specialist Comms
34WPP
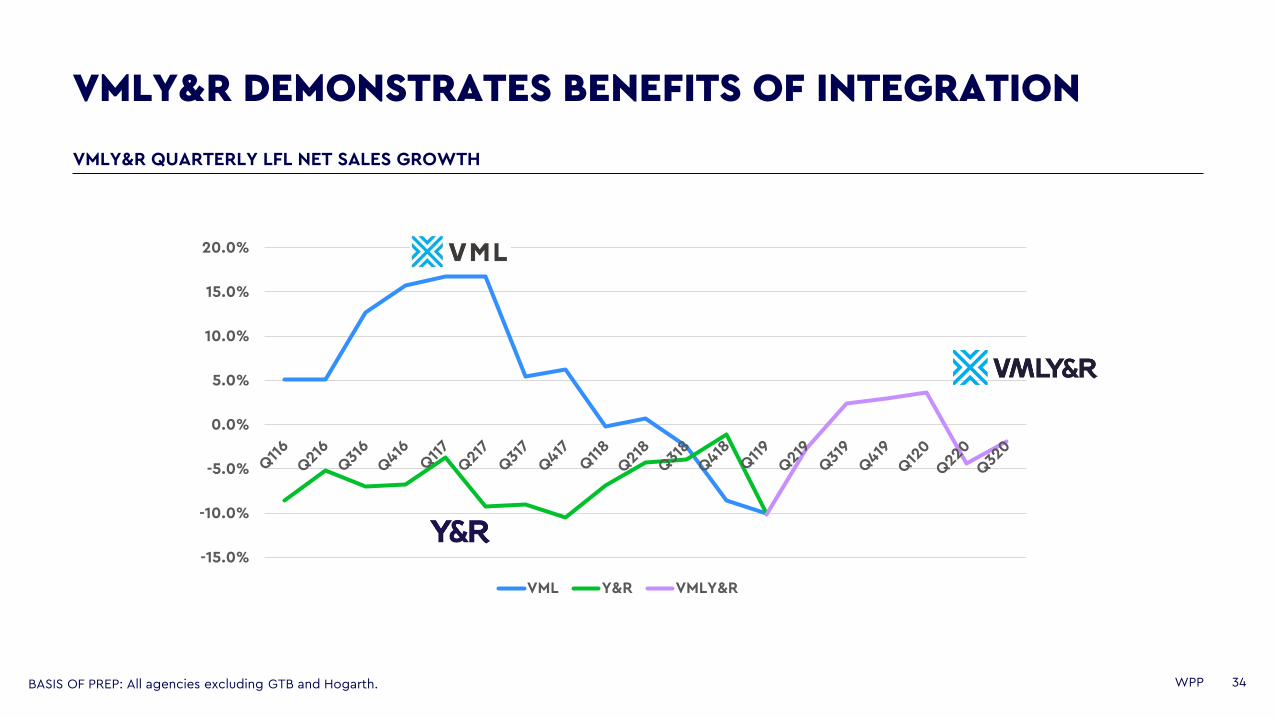
VMLY&R DEMONSTRATES BENEFITS OF INTEGRATION
BASIS OF PREP: All agencies excluding GTB and Hogarth.
VMLY&R QUARTERLY LFL NET SALES GROWTH
-15.0%
-10.0%
-5.0%
0.0%
5.0%
10.0%
15.0%
20.0%
VML Y&R VMLY&R
35WPP
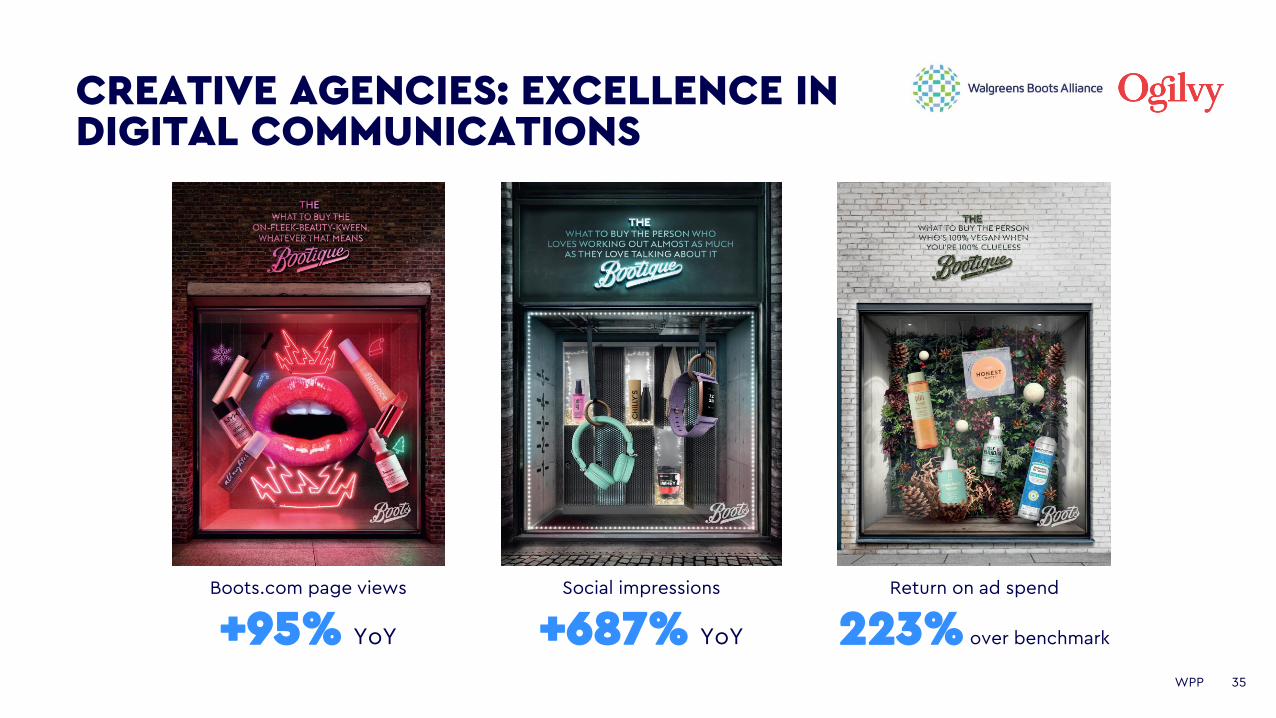
CREATIVE AGENCIES: EXCELLENCE IN DIGITAL COMMUNICATIONS
35
Boots.com page views
+95% YoY
Social impressions
+687% YoY
Return on ad spend
223% over benchmark
36WPP
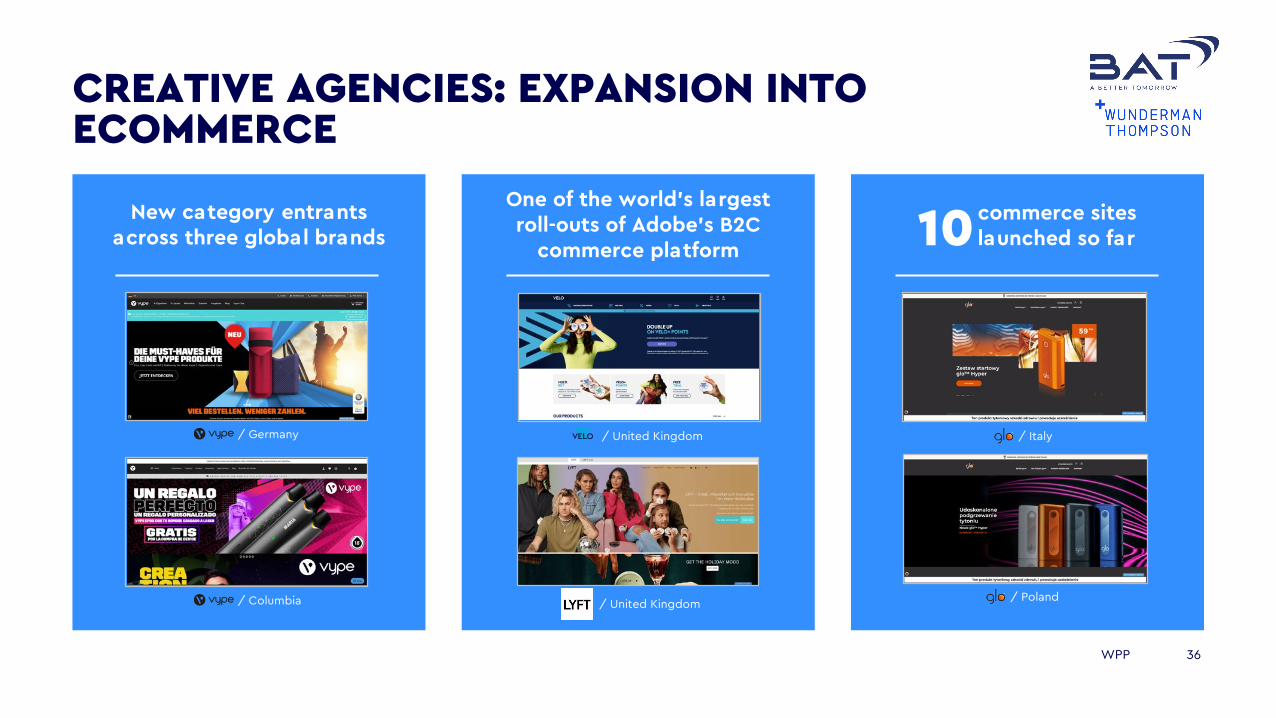
CREATIVE AGENCIES: EXPANSION INTO ECOMMERCE
New category entrants across three global brands
One of the world’s largest roll-outs of Adobe’s B2C
commerce platform 10commerce siteslaunched so far
/ Germany
/ Columbia
/ United Kingdom / Italy
/ Poland/ United Kingdom
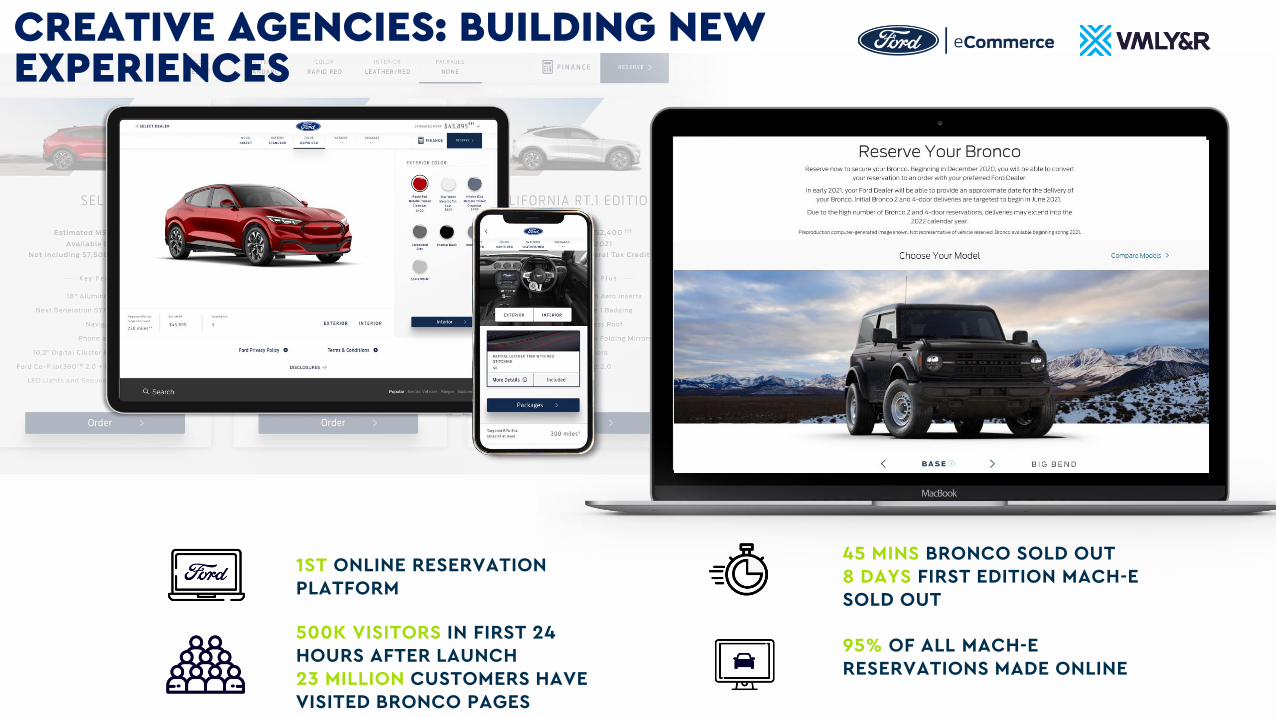
1ST ONLINE RESERVATION PLATFORM
500K VISITORS IN FIRST 24 HOURS AFTER LAUNCH 23 MILLION CUSTOMERS HAVE VISITED BRONCO PAGES
95% OF ALL MACH-E RESERVATIONS MADE ONLINE
45 MINS BRONCO SOLD OUT8 DAYS FIRST EDITION MACH-E SOLD OUT
CREATIVE AGENCIES: BUILDING NEW EXPERIENCES
38WPP
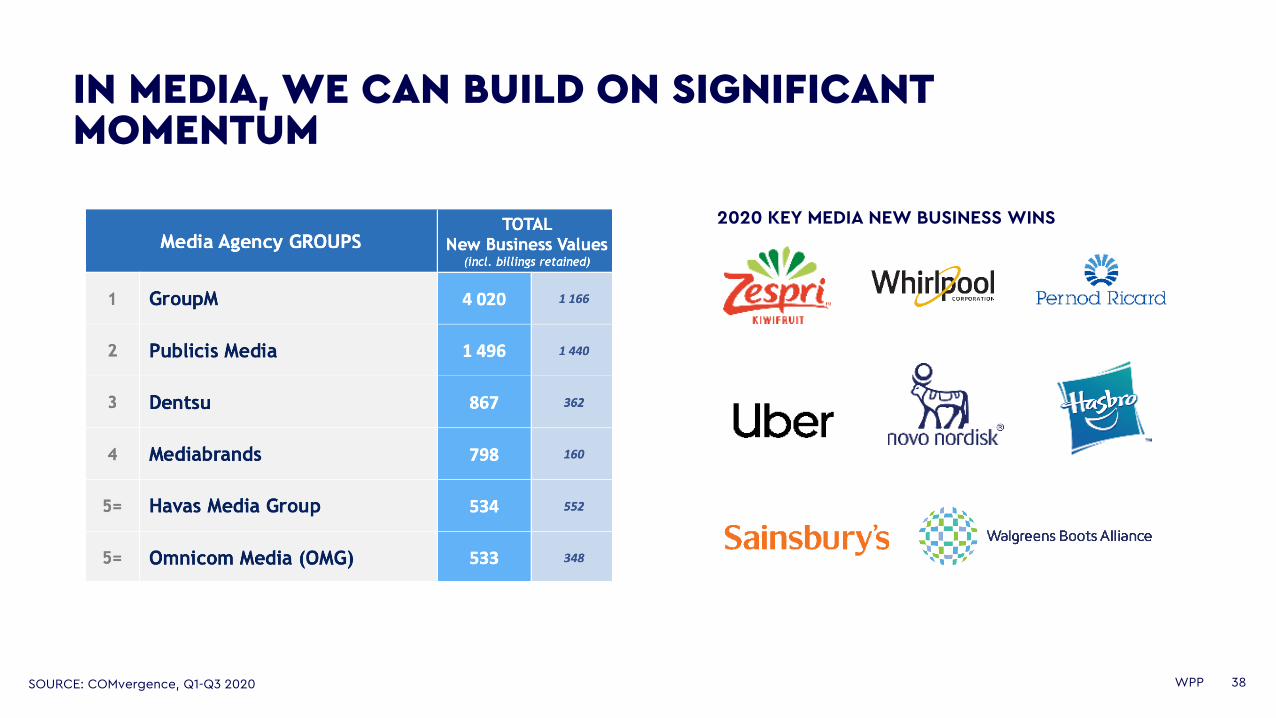
IN MEDIA, WE CAN BUILD ON SIGNIFICANT MOMENTUM
SOURCE: COMvergence, Q1-Q3 2020
2020 KEY MEDIA NEW BUSINESS WINS
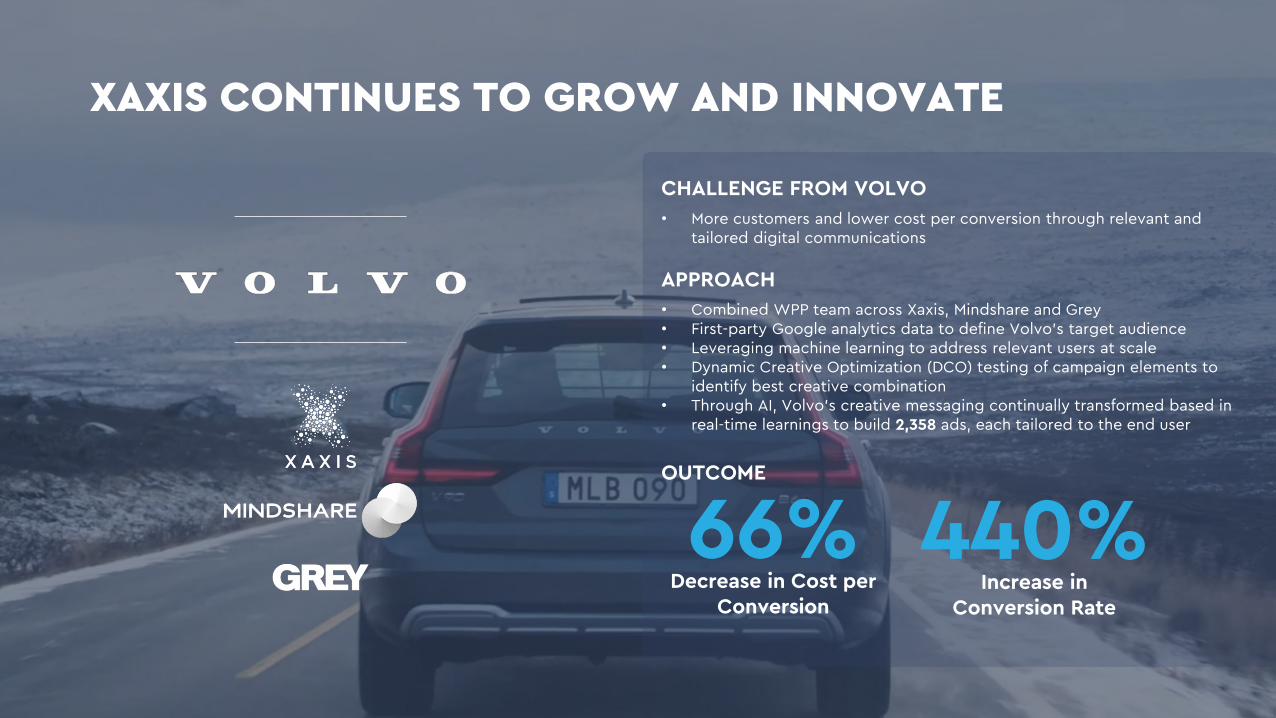
440%Increase in
Conversion Rate
CHALLENGE FROM VOLVO
• More customers and lower cost per conversion through relevant and tailored digital communications
APPROACH
• Combined WPP team across Xaxis, Mindshare and Grey• First-party Google analytics data to define Volvo’s target audience • Leveraging machine learning to address relevant users at scale• Dynamic Creative Optimization (DCO) testing of campaign elements to
identify best creative combination • Through AI, Volvo’s creative messaging continually transformed based in
real-time learnings to build 2,358 ads, each tailored to the end user
OUTCOME
66%Decrease in Cost per
Conversion
XAXIS CONTINUES TO GROW AND INNOVATE
40WPP
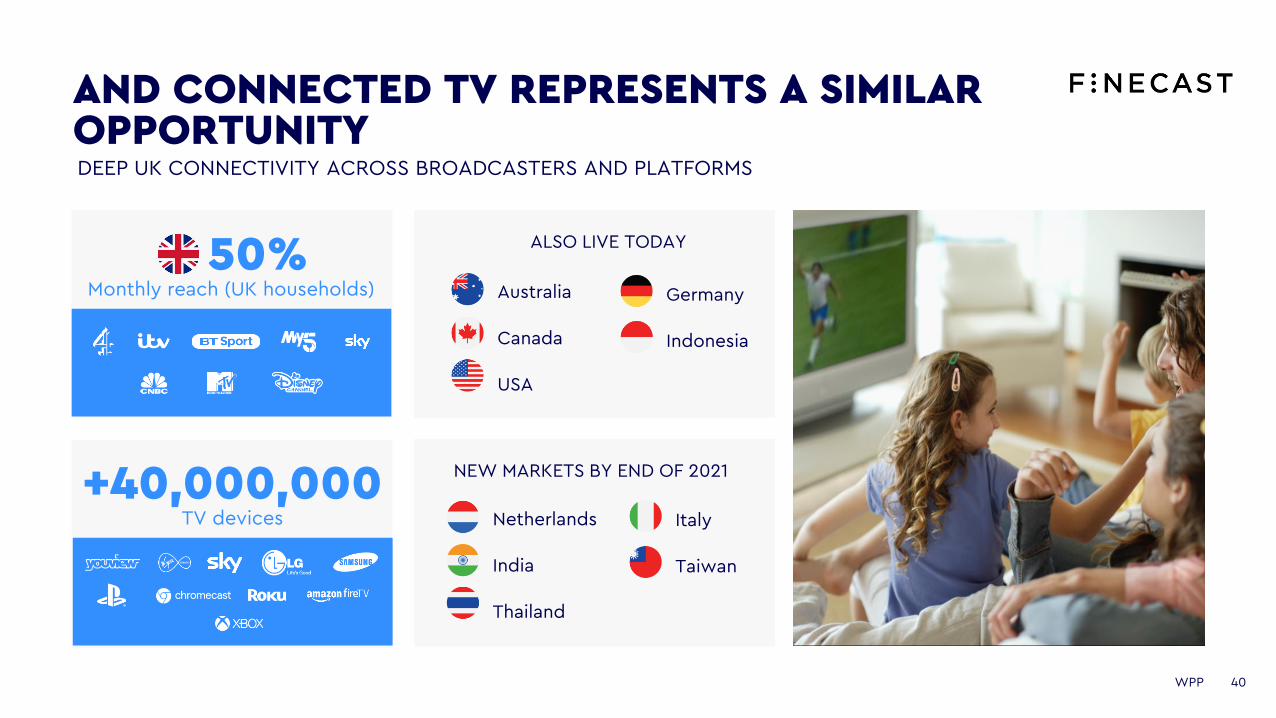
AND CONNECTED TV REPRESENTS A SIMILAR OPPORTUNITY
40
DEEP UK CONNECTIVITY ACROSS BROADCASTERS AND PLATFORMS
50%Monthly reach (UK households)
+40,000,000TV devices
ALSO LIVE TODAY
Australia
Canada
USA
Germany
Indonesia
NEW MARKETS BY END OF 2021
Netherlands
India
Thailand
Italy
Taiwan
41WPP
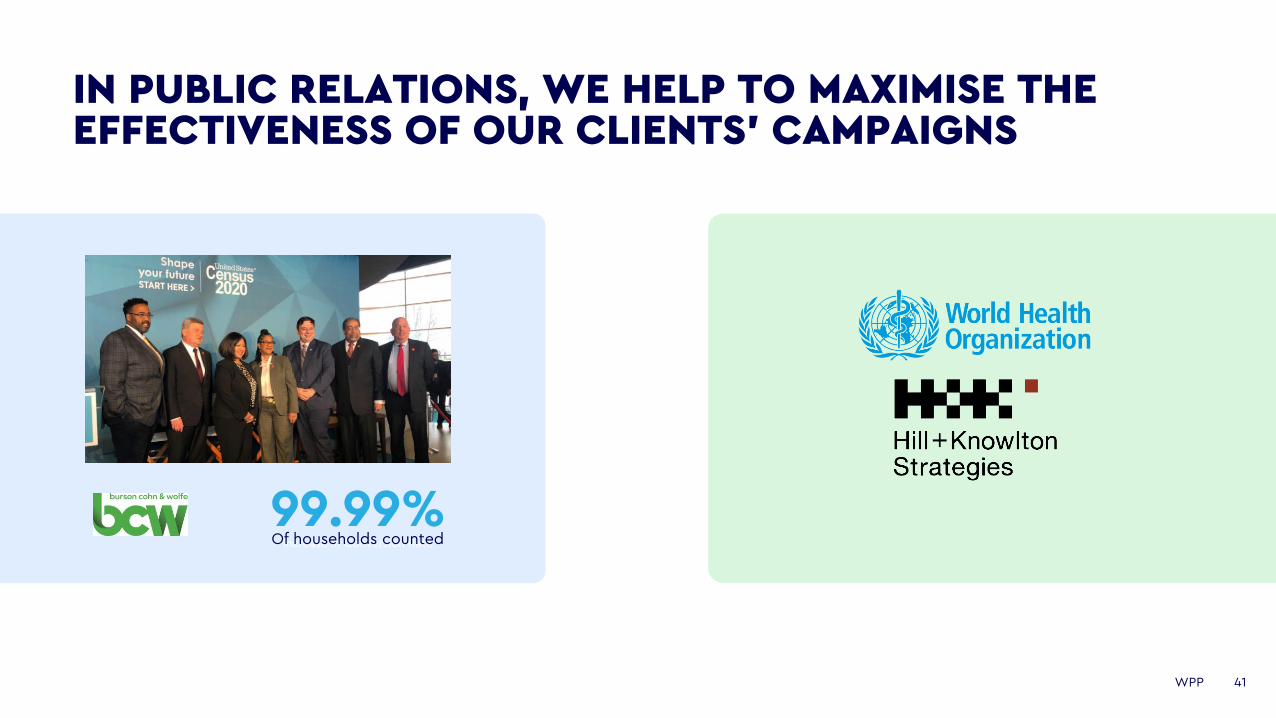
IN PUBLIC RELATIONS, WE HELP TO MAXIMISE THE EFFECTIVENESS OF OUR CLIENTS’ CAMPAIGNS
41
99.99%Increase in Conversion RateOf households counted
42
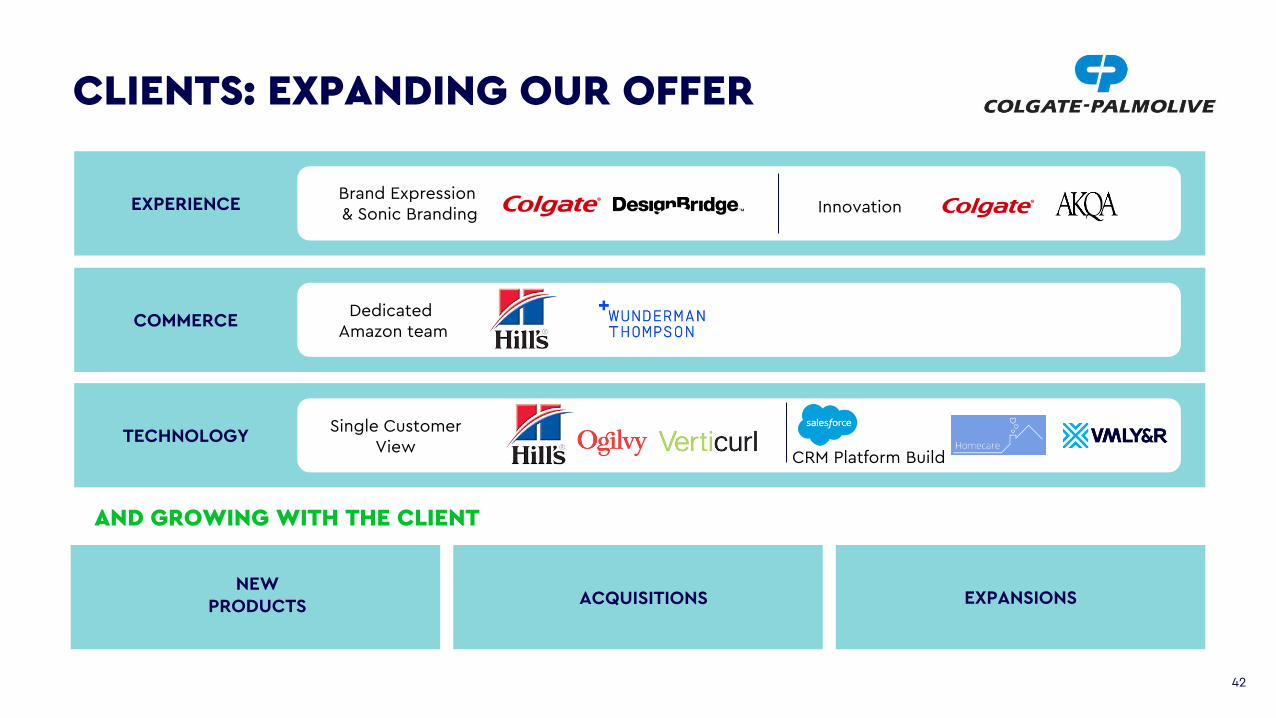
CLIENTS: EXPANDING OUR OFFER
AND GROWING WITH THE CLIENT
EXPERIENCEBrand Expression & Sonic Branding Innovation
COMMERCEDedicated
Amazon team
TECHNOLOGYSingle Customer
ViewCRM Platform Build
NEW PRODUCTS ACQUISITIONS EXPANSIONS
43WPP
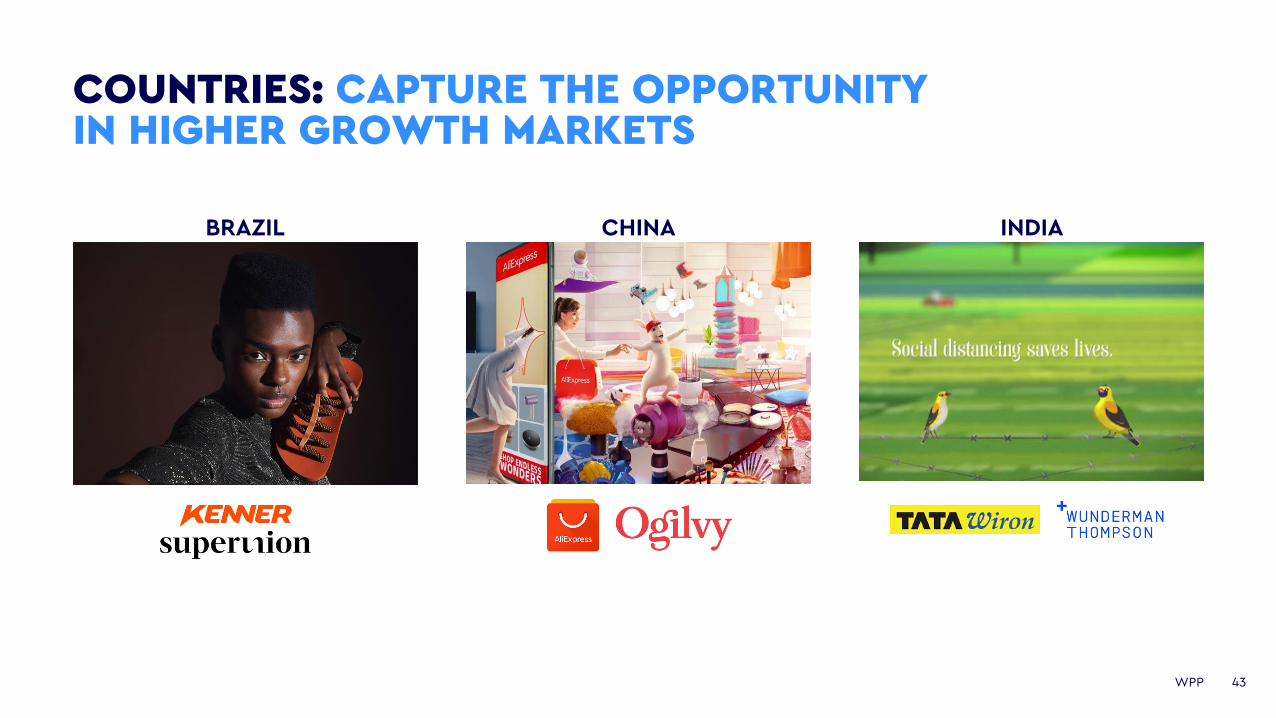
COUNTRIES: CAPTURE THE OPPORTUNITY IN HIGHER GROWTH MARKETS
CHINA
INDIA
BRAZIL INDIA
WPP
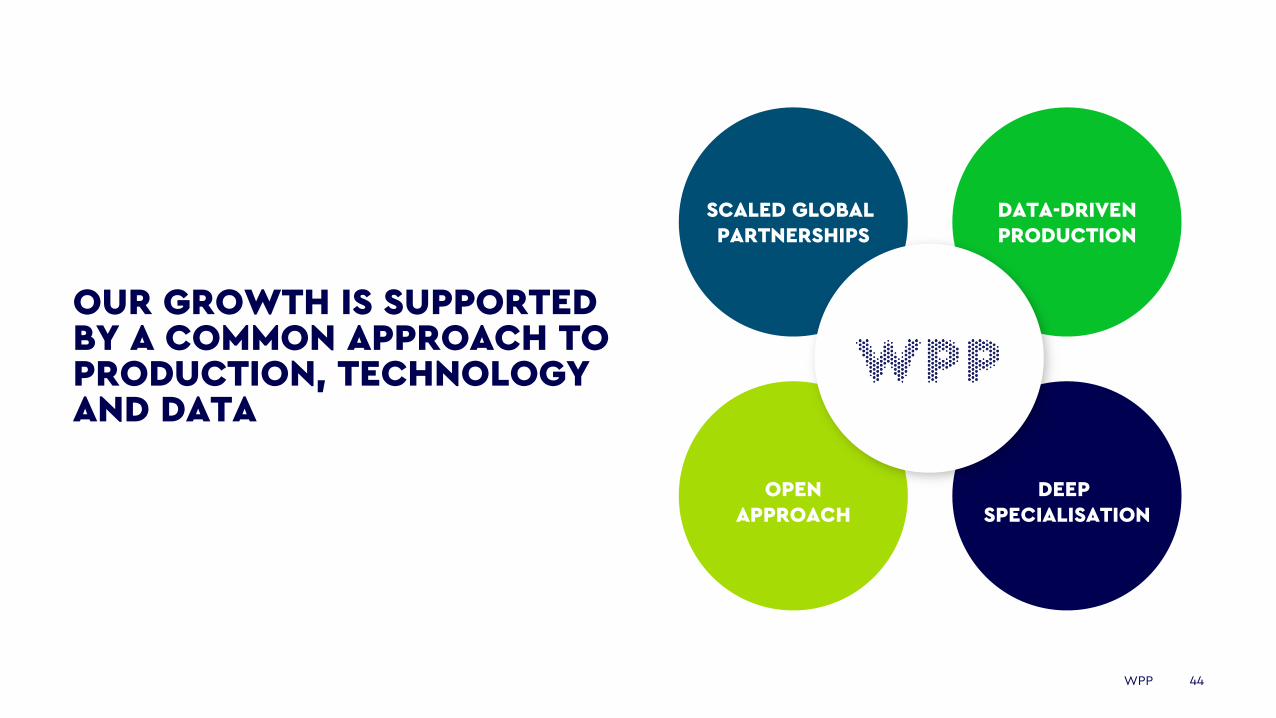
OUR GROWTH IS SUPPORTED BY A COMMON APPROACH TO PRODUCTION, TECHNOLOGY AND DATA
44
SCALED GLOBAL PARTNERSHIPS
OPENAPPROACH
DATA-DRIVENPRODUCTION
DEEP SPECIALISATION
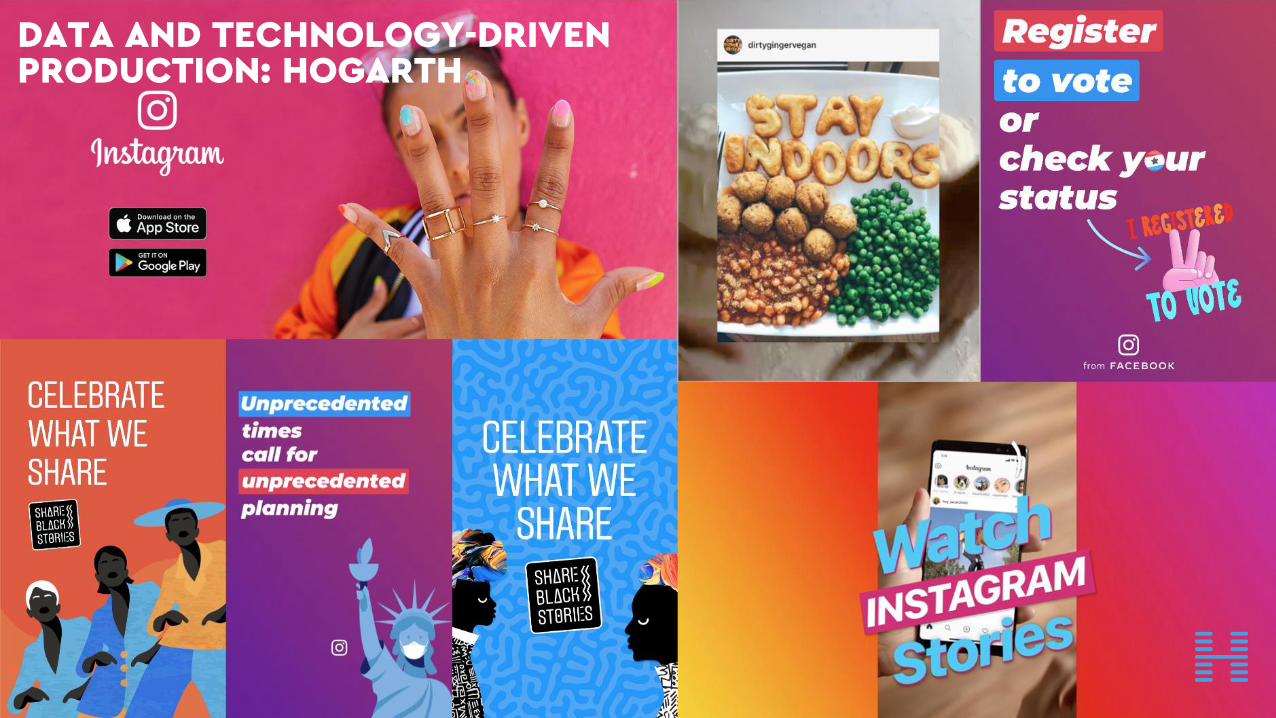
DATA AND TECHNOLOGY-DRIVEN PRODUCTION: HOGARTH
46WPP
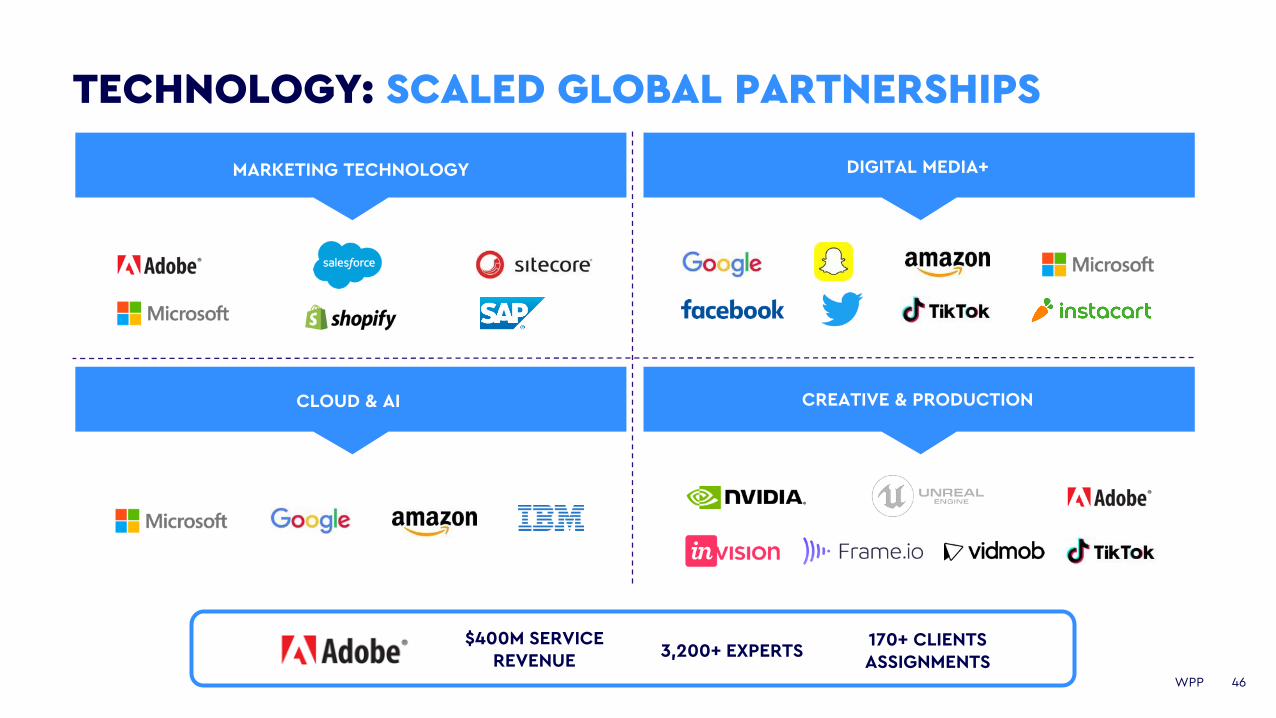
MARKETING TECHNOLOGY DIGITAL MEDIA+
CLOUD & AI CREATIVE & PRODUCTION
TECHNOLOGY: SCALED GLOBAL PARTNERSHIPS
$400M SERVICE REVENUE
3,200+ EXPERTS170+ CLIENTS ASSIGNMENTS
47WPP
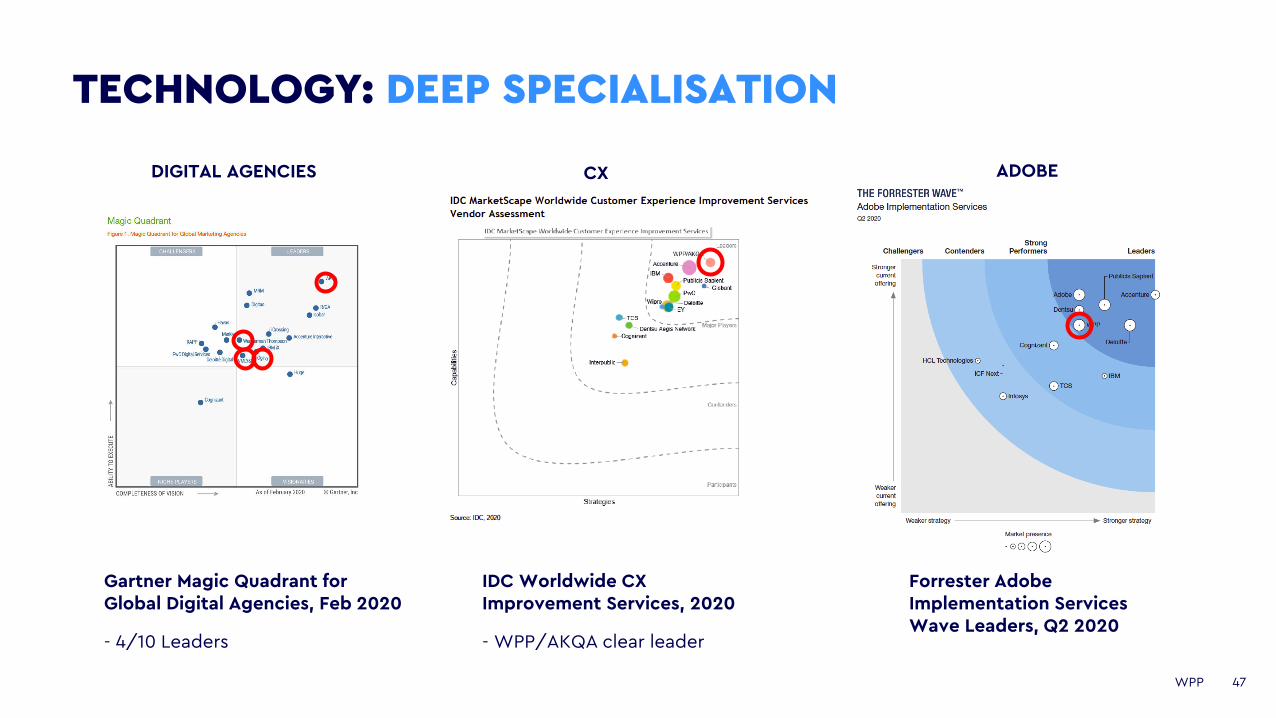
TECHNOLOGY: DEEP SPECIALISATION
Gartner Magic Quadrant for Global Digital Agencies, Feb 2020
- 4/10 Leaders
IDC Worldwide CX Improvement Services, 2020
- WPP/AKQA clear leader
Forrester Adobe Implementation Services Wave Leaders, Q2 2020
DIGITAL AGENCIES CX ADOBE
48WPP
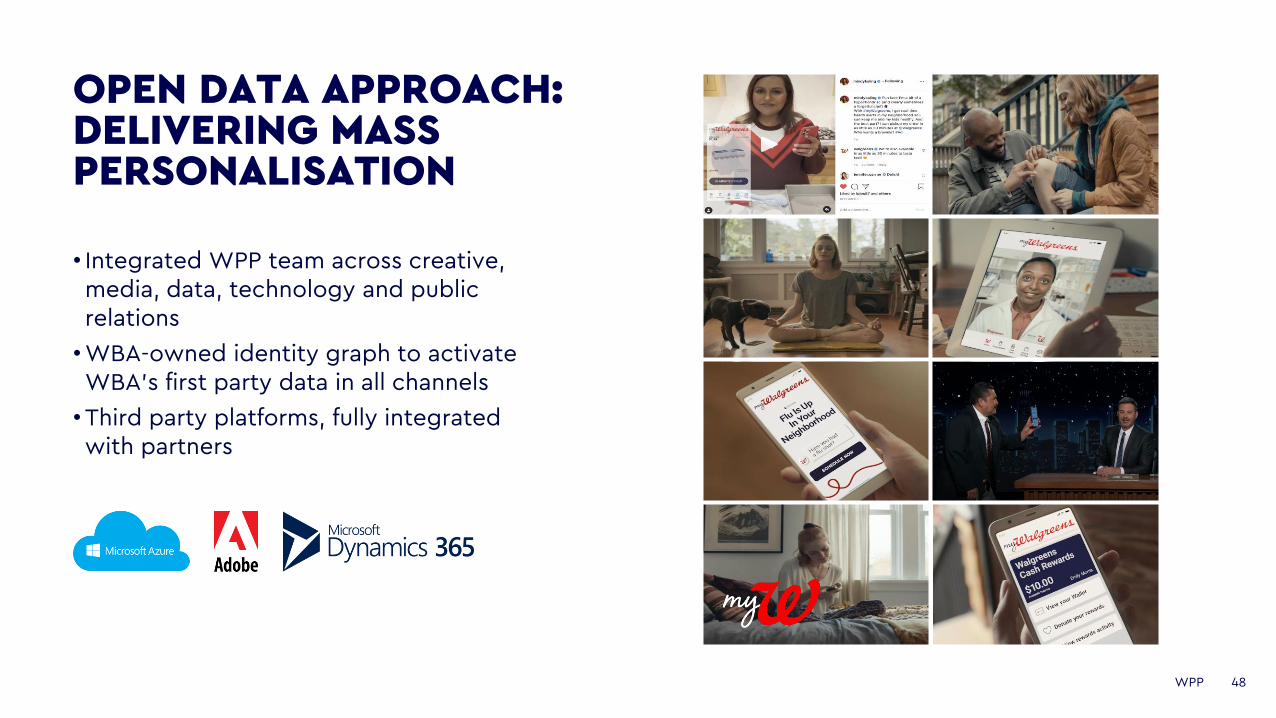
OPEN DATA APPROACH: DELIVERING MASS PERSONALISATION
• Integrated WPP team across creative, media, data, technology and public relations
•WBA-owned identity graph to activate WBA’s first party data in all channels
•Third party platforms, fully integrated with partners