acceleration of a freely falling picket...
TRANSCRIPT
Name _____________________ Date _________
p. 1 of 7 © 2009 PASCO scientific and University of Rochester
Acceleration of a Freely Falling Picket Fence Equipment Needed Qty Equipment Needed Qty Smart Pulley System (ME-6838) 1 Universal Table Clamp (ME-9376) 1 Picket Fence (ME-9377A) 1
What Do You Think?
The purpose of this activity is to determine the acceleration due to gravity by measuring the time of fall of a picket fence dropped through a photogate. Can an object have an increasing velocity and a constant acceleration? Can the velocity of an object be zero at the same instant its acceleration is non zero?
Answer the ‘What Do You Think?’ question(s) in the Laboratory Data Sheet section.
Background
Neglecting air resistance, an object falls a distance proportional to the square of the time. The acceleration of an object in free fall is commonly referred to as the acceleration due to gravity, and it is given the symbol g. The motion of such an object, starting from rest at the origin of our coordinate system, can be described by the following equations of motion
ay t( ) = −g
vy t( ) = −gt
y t( ) = − 12
gt2
The value of the gravitational acceleration is approximately 9.8 m/s2. For You To Do
In this experiment you drop a "picket fence" (a clear plastic strip with uniformly spaced opaque bands) through a photogate. Each opaque band on the picket fence blocks the photogate beam and the time from one blockage to the next becomes increasingly shorter. Knowing the distance between the leading edge of each opaque band, the Capstone program calculates the average speed of the picket fence from one band to the next. The slope of the graph of average speed versus time can be used to determine the acceleration of the falling object.
Physics 141, Lab 1, Experiment 1 Student Workbook
© 2009 PASCO scientific and University of Rochester p. 2 of 7
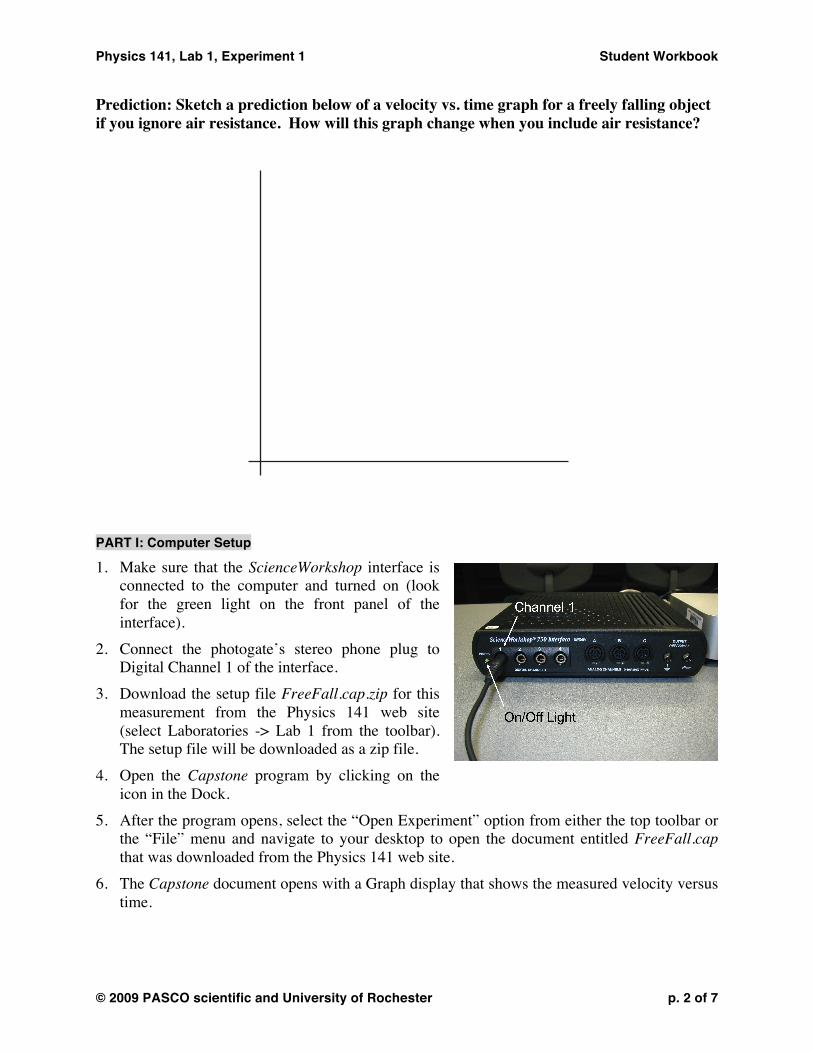
Prediction: Sketch a prediction below of a velocity vs. time graph for a freely falling object if you ignore air resistance. How will this graph change when you include air resistance?
PART I: Computer Setup
1. Make sure that the ScienceWorkshop interface is connected to the computer and turned on (look for the green light on the front panel of the interface).
2. Connect the photogate’s stereo phone plug to Digital Channel 1 of the interface.
3. Download the setup file FreeFall.cap.zip for this measurement from the Physics 141 web site (select Laboratories -> Lab 1 from the toolbar). The setup file will be downloaded as a zip file.
4. Open the Capstone program by clicking on the icon in the Dock.
5. After the program opens, select the “Open Experiment” option from either the top toolbar or the “File” menu and navigate to your desktop to open the document entitled FreeFall.cap that was downloaded from the Physics 141 web site.
6. The Capstone document opens with a Graph display that shows the measured velocity versus time.

Physics 141, Lab 1, Experiment 1 Student Workbook
© 2009 PASCO scientific and University of Rochester p. 3 of 7
7. Before proceeding, select “Save As” from the file menu to ensure that you can save the data you will collect. Use a new filename that clearly identifies this file as belonging to you (e.g. I may use as filename FreeFallFW101507.cap.)
8. Make sure that you save your work frequently so that you do not lose any large amount of data if computing problems occur.
ART II: Sensor Calibration and Equipment Setup
1. You do not need to calibrate the photogate. 2. The program assumes a 5 cm (0.05 m) spacing, leading-edge-to-leading-edge, for the opaque
bands on the picket fence. To change the default setting to another value, select “Hardware Setup” from the left toolbar, click on the picture of the photogate and then click on the photogate “Properties” symbol. A window will open that will allow you to change the “Flag Spacing.” Note that the spacing is measured in meters. Enter the correct value for the spacing of the opaque bands on your picket fence and click OK.
3. Set up the equipment as shown in the picture. Mount the smart-pulley photogate on the Pulley Mounting Rod. Turn the photogate head sideways so that you can drop a picket fence vertically from above the photogate and have the picket fence move through the photogate’s opening without hitting the photogate.
Trial Run of Data
1. Before recording data for later analysis, experiment with the photogate and picket fence.
2. When everything is ready, start recording data. Drop the picket fence vertically through the photogate. Data recording begins when the photogate beam is first blocked. Stop the recording once the picket fence has passed completely through the photogate.
3. Rescale the data to fill the Graph window (click on the button.) 4. Repeat these trial runs until your feel comfortable with the procedure and the picket fence
moves through the photogate without touching its sides. PART III: Data Recording
1. Prepare to drop the picket fence through the photogate beam again. Hold the picket fence at one end between your thumb and forefinger so the bottom edge of the picket fence is just above the photogate beam.
ME-9377A
PIC
KET
FEN
CE
®
Physics 141, Lab 1, Experiment 1 Student Workbook
© 2009 PASCO scientific and University of Rochester p. 4 of 7
2. Start recording data and then drop the picket fence through the photogate beam. Remember, data collection begins when the photogate beam is first blocked.
3. After the picket fence passes completely through the beam, stop recording. 4. Repeat this measurement 25 times. For each data set collected, carry out the analysis
described in the next section. Record in the results of each analysis in the tables at the end of this workbook. Note: any data sets collected when something went wrong (e.g. the picket fence hits the side of the photogate) should be ignored.
Analyzing the Data
1. Set up your Table display so it shows the values of position, velocity, and acceleration.
2. If necessary, rescale the Graph to fit the data (click on the button.) 3. Examine the plot of Velocity versus Time in the Graph display. Determine the slope of the
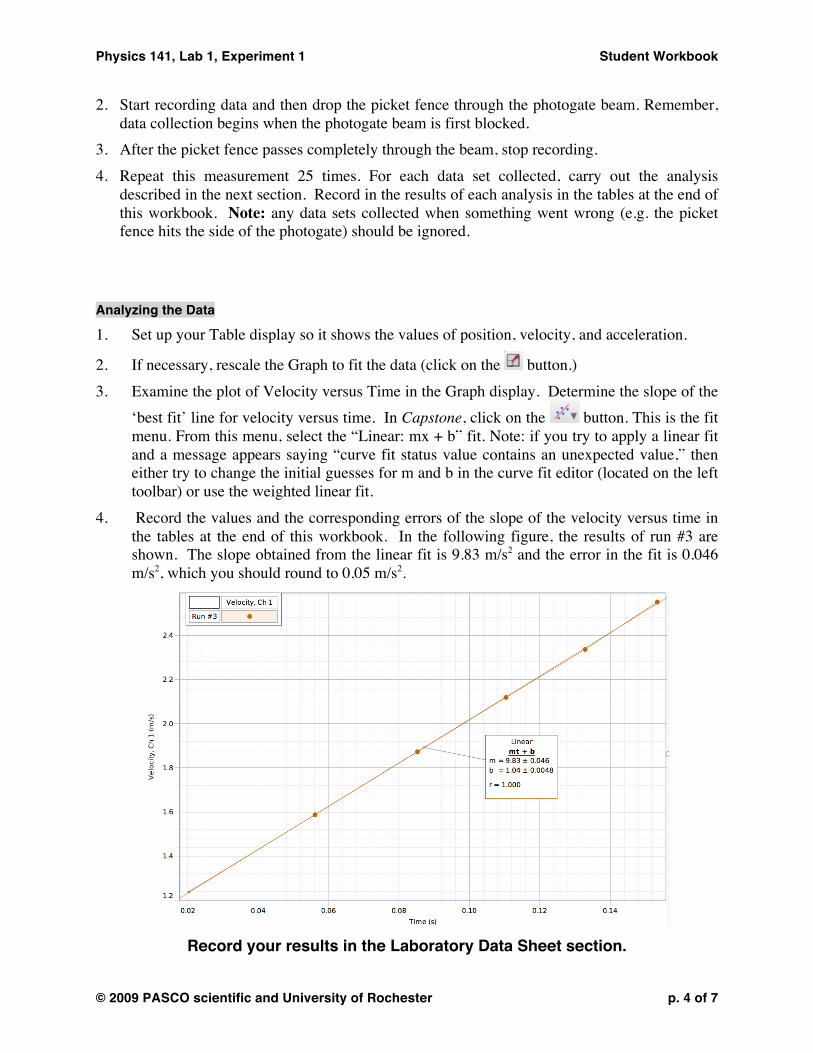
‘best fit’ line for velocity versus time. In Capstone, click on the button. This is the fit menu. From this menu, select the “Linear: mx + b” fit. Note: if you try to apply a linear fit and a message appears saying “curve fit status value contains an unexpected value,” then either try to change the initial guesses for m and b in the curve fit editor (located on the left toolbar) or use the weighted linear fit.
4. Record the values and the corresponding errors of the slope of the velocity versus time in the tables at the end of this workbook. In the following figure, the results of run #3 are shown. The slope obtained from the linear fit is 9.83 m/s2 and the error in the fit is 0.046 m/s2, which you should round to 0.05 m/s2.
Record your results in the Laboratory Data Sheet section.

Physics 141, Lab 1, Experiment 1 Student Workbook
© 2009 PASCO scientific and University of Rochester p. 5 of 7
Laboratory Data Sheet - Acceleration of a Freely Falling Picket Fence
What Do You Think?
Can an object have an increasing velocity and a constant acceleration? Can the velocity of an object be zero at the same instant its acceleration is non zero? Data Table
Trial Run # Slope v vs t (m/s2) Error Slope v vs t (m/s2)
1 2
3
4
5
6 7
8
9
10
11
12 13
14
15
16
17
18 19
20
Physics 141, Lab 1, Experiment 1 Student Workbook
© 2009 PASCO scientific and University of Rochester p. 6 of 7
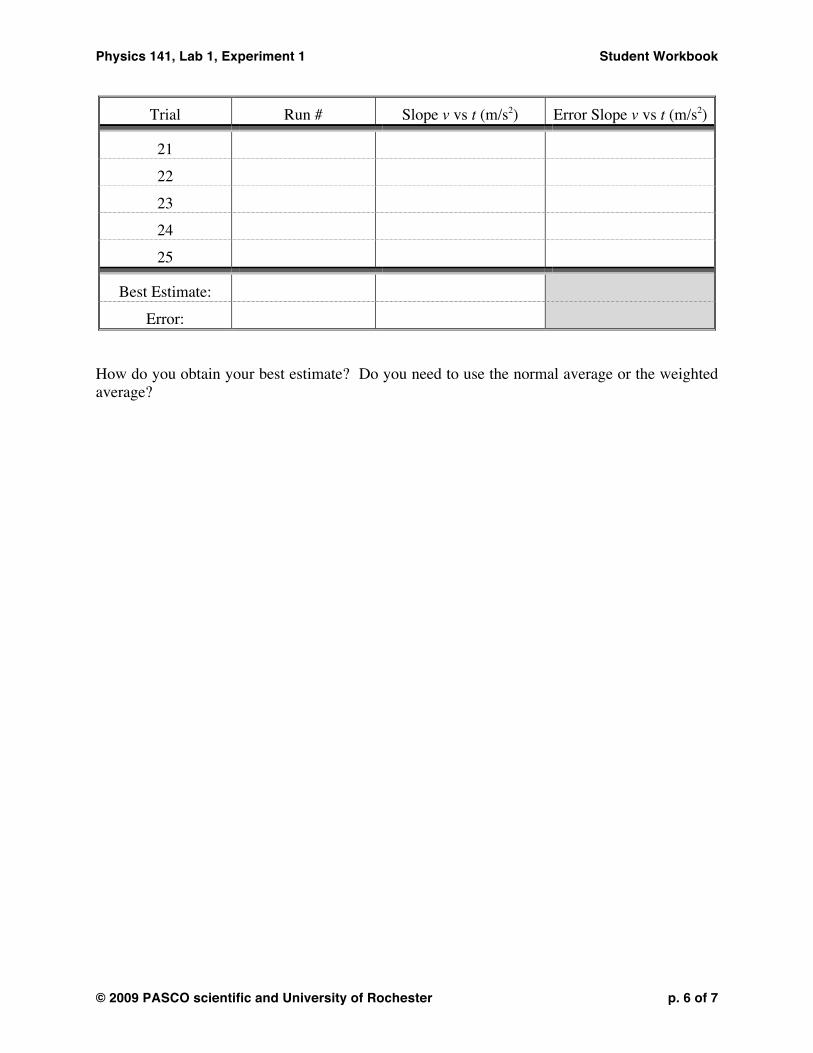
Trial Run # Slope v vs t (m/s2) Error Slope v vs t (m/s2)
21
22
23 24
25
Best Estimate:
Error:
How do you obtain your best estimate? Do you need to use the normal average or the weighted average?
Physics 141, Lab 1, Experiment 1 Student Workbook
© 2009 PASCO scientific and University of Rochester p. 7 of 7
Questions
1. How does the slope of your velocity versus time graph compare to the accepted value of the acceleration of a free falling object (g = 9.8 m/s2)? Do they agree within the error bars?
2. What factors do you think may cause the experimental value to be different from the
accepted value? 3. Determine whether releasing the picket fence from just above the photogate or from several
inches above the photogate makes any difference in the value of the acceleration. Note that the Table and Graph displays will show the most recently recorded run of data. To view a different run of data, click on the DATA symbol ( ) and select the data run you want from the list.