acceptable chloride ion limit in concrete
TRANSCRIPT

Final Report
ACCEPTABLE CHLORIDE ION LIMIT IN CONCRETE
by Zhifu Yang
Principal Investigator
and Marcus Knight
Co-Principal Investigator
School of Concrete and Construction Management Middle Tennessee State University
1301 East Main Street, Murfreesboro, TN 37132
MSA #: RES2016-25 Contract #: C16-0318
Prepared for Tennessee Department of Transportation
March, 2018
I

Disclaimer This research was funded through the State Research and Planning (SPR) Program by the Tennessee Department of Transportation and the Federal Highway Administration under RES #: 2016-25, Research Project Title: Acceptable Chloride Ion Limit in Concrete.
This document is disseminated under the sponsorship of the Tennessee Department of Transportation and the United States Department of Transportation in the interest of information exchange. The State of Tennessee and the United States Government assume no liability of its contents or use thereof.
The contents of this report reflect the views of the author(s) who are solely responsible for the facts and accuracy of the material presented. The contents do not necessarily reflect the official views of the Tennessee Department of Transportation or the United States Department of Transportation
II

1. Report No.FHWA-HRT-xx-xxx
2. Government Accession No. 3. Recipient’s Catalog No.
4. Title and SubtitleAcceptable Chloride Ion Limit in Concrete (RES2016-25)
5. Report Date March 31, 2018
6. Performing Organization Code:
7. Author(s) Zhifu Yang, Marcus Knight 8. Performing Organization Report No.
9. Performing Organization Name and AddressSchool of Concrete and Construction ManagementMiddle Tennessee State University1301 East Main StreetMurfreesboro, TN 37132USA
10. Work Unit No.11. Contract or Grant No.: C16-0318
12. Sponsoring Agency Name and AddressOffice of Research, Development, and TechnologyFederal Highway Administration6300 Georgetown PikeMcLean, VA 22101-2296
13. Type of Report and Period14. Sponsoring AgencyCode
15. Supplementary Notes
16. Abstract: The chloride-induced corrosion is one of the main forms of deterioration in the transportation system ofTennessee. The main goal of this research is to determine the critical chloride level that causes de-passivation of both reinforcing and prestressing steel in typical TDOT concrete mixes under various exposure conditions. It was found that steel de-passivation (rust initiation) typically occurred at the total chloride ion contents between 0.42% and 0.67% by weight of cementitious materials for unstressed prestressing strand, depending on the concrete mix and the exposure condition. When stressed, the prestressing strand seemed to de-passivate at a lower chloride level (e.g.0.24% by the weight of cementitious materials). Similarly, rust first appeared on rebar at a total chloride ion content of 0.43% to 0.56% by weight of cementitious materials, depending on the concrete mix and the exposure condition. The exposure condition greatly influenced the corrosion initiation and propagation. For the indoor exposure without moisture, active corrosion occurred, but stopped after 5 to 6 months exposure due to the lack of moisture. For the the indoor exposure with moisture supply or the field exposure with wet/dry cycles, corrosion was sustained when the chloride exceeded the limit. For the salt-water immersion, all corrosion activities were negligible due to the lack of oxygen. The background chloride in typical TDOT mixes with local materials was between 0.05% and 0.1% by the weight of cementitious materials. It was safe for typical reinforced concrete structures. However, cautions should be taken for prestressing concrete structures. The use of supplementary cementitious materials such as class F fly ash reduced or did not significantly affect the acceptable chloride ion limit in concrete; however, it did noticeably reducethe extent of rust. The acid-soluble method (ASTM C1152) provided results that were relatively more constant. The total chloride ion content by the weight of cementitious materials determined by acid-soluble method was preferredas the representation of chloride content in concrete.
17. Key WordsAcceptable Chloride Limit, Chloride Threshold,Corrosion, Linear Polarization Resistance, Acid-Soluble Chloride, Water-Soluble Chloride,Chloride Binding
18. Distribution Statement No restriction. This document is available to the public from the sponsoring agency at the website https://www.tn.gov/
19. Security Classif. (of this report)Unclassified
20. Security Classif. (of thispage) Unclassified
21. No. ofPages: 128
22. Price
Form DOT F 1700.7 (8-72) Reproduction of completed page authorized
III

Table of Contents 1.0 Introduction ............................................................................................................................... 1 2.0 Literature Review...................................................................................................................... 2
2.1 Representations of Acceptable Chloride Ion Limit .............................................................. 3 2.2 Factors Affecting Acceptable Chloride Ion Limit ................................................................ 4
2.2.1 Cementitious Materials .................................................................................................. 4 2.2.2. Steel – Concrete Interface ............................................................................................. 5 2.2.3 Other Factors .................................................................................................................. 5
2.3 Chloride Quantification Methods ......................................................................................... 6 2.3.1 Total Chloride Determination Methods ......................................................................... 6 2.3.2 Free Chloride Determination Methods .......................................................................... 6
2.4 Corrosion Detection Methods ............................................................................................... 7 2.4.1 Half-Cell Potential ......................................................................................................... 7 2.4.2 Linear Polarization Resistance ....................................................................................... 7 2.4.3 Electrochemical Impedance Spectroscopy (EIS) ........................................................... 7 2.4.4 Other Methods ............................................................................................................... 7
3.0 Experimental Programs ............................................................................................................. 8 3.1 Materials and Proportions ..................................................................................................... 8 3.2 Specimen Preparations .......................................................................................................... 9
3.2.1 Room Exposure Specimens without Wetting ................................................................ 9 3.2.2 Room Exposure Specimens with Bottom Wetting ...................................................... 10 3.2.3 Room Exposure Specimens with Stressed Prestressing Strand and Top Wetting/Drying............................................................................................................................................... 11 3.2.3 Field Exposure Specimens ........................................................................................... 13 3.2.4 High-Temperature Exposure with Moisture or Salt-Water Immersion ....................... 14
3.3 Corrosion Evaluation .......................................................................................................... 15 3.3.1 Linear Polarization Resistance ..................................................................................... 16 3.3.2 Visual Examination and Areas of Corrosion ............................................................... 17
3.4 Chloride Determination ...................................................................................................... 17 3.4.1 Water-Soluble Chloride Analysis (ASTM C1218) ...................................................... 18 3.4.2 Acid-Soluble Chloride Analysis (ASTM C1152) ........................................................ 19 3.4.3 Water-Extractable Chloride Analysis (Soxhlet method-ASTM C1524) ..................... 19
3.5 Acid Neutralization Capacity (ANC) of Concrete .............................................................. 21 4.0 Results and Analysis ............................................................................................................... 21
4.1 Acceptable Chloride Ion Limits of Rebar and Prestressing Strand for Different TDOT Mixes under Various Exposure Conditions .............................................................................. 22
4.1.1TDOT Class P Mix and Indoor Exposure without Wetting .......................................... 22 4.1.2 TDOT Class D Mix and Indoor Exposure with Bottom Wetting ................................ 38 4.1.3 TDOT Class D Mix and Field Exposure...................................................................... 40 4.1.4 TDOT Class D Mix and High Temperature (105°F) Exposure with Moisture ........... 44 4.1.5 TDOT Class D Mix and High-Temperature Salt-Solution Immersion ........................ 50 4.1.6 Effects of Niagara Escarpment (High-Chloride) Aggregates on Corrosion ................ 55 4.1.7 Indoor Exposure Specimens with Stressed Prestressing Strand and Top Wet/Dry Cycles .................................................................................................................................... 58
4.2 Chloride Assessment in Constituent Materials of Concrete ............................................... 62 4.3 Chloride Determination in Concretes Using ASTM Test Methods .................................... 62
IV

4.4 Chloride Binding and Release in TDOT Class P Mix ........................................................ 64 4.4.1 Development of pH in Suspensions and Acid Neutralization Capacity (ANC) of Concrete ................................................................................................................................ 64 4.4.2 Chloride Binding in TDOT Class P Mix ..................................................................... 66 4.4.4 Release of Bound Chloride .......................................................................................... 67
5.0 Guidelines for Developing TDOT Supplemental Specifications for Reinforced and Prestressed Concrete ..................................................................................................................... 69
5.1 Acceptable Chloride Ion Limit in TDOT Mix .................................................................... 69 5.2 Effects of Background Chlorides from Ingredient Materials on Acceptable Chloride Ion Limit .......................................................................................................................................... 71 5.3 Effects of Cementitious Materials on Corrosion and Acceptable Chloride Ion Limit in Concrete .................................................................................................................................... 71 5.4 Method for Analyzing Chloride Content in Concrete ......................................................... 72
Acknowledgements ....................................................................................................................... 72 References ..................................................................................................................................... 73 Appendix: Rebars and Strands after Exposure ............................................................................. 76
Series 1- TDOT class P mix, type I cement + 15% class F fly ash replacement, indoor exposure .................................................................................................................................... 76 Series 2- TDOT class P mix, type III cement + 15% class F fly ash replacement, indoor exposure .................................................................................................................................... 83 Series 3 - TDOT class P mix, type I cement + 15% class C fly ash replacement, indoor exposure .................................................................................................................................... 91 Series 4 - TDOT class P mix, type I cement + 15% class F fly ash replacement, field exposure................................................................................................................................................... 98 Series 5 - TDOT class D mix, type I cement, indoor exposure with bottom wetting ............. 100 Series 6 - TDOT class D mix, type I cement, field exposure ................................................. 105 Series 7 - TDOT class D mix, type I cement+ 20% class F fly ash replacement, field exposure................................................................................................................................................. 111 Series 8 - TDOT class D mix, type I cement, high-temperature exposure with moisture ...... 113 Series 9 - TDOT class D mix, type I cement + 20% class F fly ash, high-temperature exposure with moisture .......................................................................................................................... 116 Series 10 - TDOT class D mix, type I cement, high-temperature exposure with salt-water immersion ............................................................................................................................... 119 Series 11 - TDOT class D mix, type I cement + 20% class F fly ash replacement, high-temperature exposure with salt-water immersion ................................................................... 122 Series 12 - TDOT class D mix, type I cement+20% class C fly ash replacement, indoor exposure with top wet/dry cycles ............................................................................................ 124
V

1.0 Introduction The chloride-induced corrosion is one of the main forms of deterioration in the transportation system of Tennessee. The chlorides mainly come from deicing salts or cast-in chlorides such as accelerators, aggregates, or other constituent materials. When the chloride content exceeds a critical level, local breakdown of passive film of steel will occur, causing pitting corrosion. This critical chloride level can also be termed as the chloride threshold value or the acceptable chloride ion limit. Despite the importance of this acceptable limit, no general agreement has been reached due to different representations and measuring techniques of chloride as well as complex chemistry of concrete and corrosion behavior of steel. Conservative values are normally recommended by various organizations such as ACI and PCI because of the uncertainty of exact limit under different materials and environments. As a result, further studies are needed to determine a more reliable chloride ion limit for Tennessee transportation systems that takes into considerations of the nature of local materials (e.g., aggregates), structures (e.g., reinforced or pre-stressed), and environments (moisture and temperature). Although numerous studies on corrosion have been undertaken, no commonly accepted testing methods are available presently to determine the acceptable chloride limit in concrete. Several measuring techniques have been used, which includes water-soluble method, acid-soluble method, Soxhlet method, and X-ray fluorescence. None of these methods accurately describes the true amount of chlorides participating in corrosion. This is because the water-soluble or Soxhlet method (free chloride) may underestimate the chloride content due to the fact that parts of bound chlorides may be freed during the corrosion process as a result of acidification in the vicinity of steel. Conversely, the acid-soluble or X-ray fluorescence methods (total chloride) may overestimate the involvement of chloride in corrosion because some of bound chlorides may never be released in a concrete environment. One of the objectives of this study is to explore the advantages and drawbacks of these testing methods with the goal of identifying a more suitable test method for TDOT. While the role of chloride binding in corrosion is currently under debate, it is believed by the investigators that chloride binding increases the acceptable chloride limit in concrete. This study will also investigate the chloride binding mechanisms of various TDOT concrete mixtures. The primary objective is to determine how much the bound chloride can actually be released from these mixtures when the conditions change and how this chloride release in turn affect the acceptable chloride ion limit in concrete.
1

2.0 Literature Review Numerous research efforts have been made over the past decades on the chloride-induced steel corrosion in the reinforced concrete, many of which have investigated the critical chloride level that is necessary to breakdown the passivity film of steel1-7. However, the results are widely scattered8 and there are no general agreements on what level of chloride that is allowed in the reinforced concrete structures. The critical chloride content (reported as the total chloride ion content) for reinforced concrete specimens under outdoor exposure or field concrete structures varied from 0.1% to 1.96% by the weight of cementitious materials. For specimens under laboratory conditions, the values changed from 0.04% to 8.34%. This wide range of variations may be attributable to many reasons such as different threshold definitions, different evaluation techniques, different exposure conditions, as well as different material and specimen characteristics. For instances, there are two ways of defining the critical chloride content. Scientifically, the critical chloride content in concrete is defined as the lowest chloride content needed for de-passivating the steel. Practically, the critical chloride content is associated with the chloride level that causes visible rust in reinforced concrete structures. Clearly, the first definition is related to the initiation stage and more difficult to detect accurately, while the second definition correlates with the propagation stage and is easier to confirm because of the visible rust. However, the second definition may lead to a higher critical chloride content. In addition, many evaluation techniques have been used, including the corrosion detection techniques (e.g. visual examination, half-cell potential, linear polarization resistance, electrochemical impedance spectroscopy, etc.) and chloride quantification techniques (e.g. total chloride/acid soluble, free chloride/water-soluble, etc.). Similarly, several laboratory exposure conditions have been employed such as air exposure and air exposure with different moisture conditions (e.g. 60%, 95%, and 100% relative humidity, wet/dry cycles, and water-submerged). The material and specimen characteristics have also varied from test to test This includes pH buffering and chloride-binding capacity of cement paste, surface condition of steel, physical conditions of steel-concrete interface (e.g., air-entrapment), chloride source (cast-in or external), and W/Cm and permeability of concrete. Consequently, conservative values are typically recommended in various specifications and building codes. For examples, various ACI committees set the requirements for the acceptable chloride limit in new concrete constructions based on the types of structures (prestressed or reinforced) and exposure conditions as shown in Table 2.1. Some of these limits such as those for prestressed concrete or reinforced concrete with severe exposure may be too conservative. When they are implemented in a project specification, there will be no chance of using any ingredient materials that contain a significant amount of chlorides.
2

Table 2.1 Chloride limits for concrete in ACI committee documents Structures and exposure conditions Chloride limit allowed in new concrete, % by weight
of cement ACI 3189/ACI 30110 (Water-soluble)
ACI 22211 (Acid-soluble)
ACI 20112 (Water-soluble)
Prestressed concrete 0.06 0.08 0.06 Reinforced concrete in dry condition 1.0 No limit 1.0 Reinforced concrete in wet condition, but no external chloride (moderate exposure)
0.3 0.2 0.15
Reinforced concrete in wet condition with external chloride (severe exposure)
0.15 0.2 0.1
2.1 Representations of Acceptable Chloride Ion Limit The most common representation for the acceptable chloride ion limit in concrete is the total chloride content by weight of cement due to its simplicity and wide acceptance in standards13. It accounts for both the corrosion risk of bound chloride and the inhibitive effect of cement paste. This is important because the bound chloride may be released to participate in the corrosion process upon a local fall in pH14 and the cement hydration products such as calcium hydroxide provides inhibitive effects on the pH reduction15. As a result, this representation more accurately indicates the likelihood of corrosion. However, it assumes that all bound chlorides would pose a potential risk to corrosion, which may not be true.
Another representation for the acceptable chloride ion limit is the free chloride by weight of cement. It was most widely used in the early works16 because it was believed that in theory only free chloride directly contributed to the corrosion process with the assumption that bound chloride was removed from the pore solution and did not participate in the corrosion. This theory was challenged by late findings that bound chloride could be released free when there was a fall in pH of pore solution. Consequently, some of present standards and specifications do not use the free chloride as the only criterion for corrosion risk.
A more appropriate expression of acceptable chloride limit may be the ratio of chloride ion activity over the pH of pore solution (i.e. [Cl-]/[OH-]). It reflects both the contribution of free chloride to corrosion and the inhibitive effect of hydroxyl ion on corrosion. However, it ignores the inhibitive effect of other phases in cement paste as well as the potential release of bound chloride upon a decrease in hydroxyl concentration (i.e. a fall in pH)17-18. Moreover, this ratio becomes unreliable in the presence of silica fume19, in which a high [Cl-]/[OH-] does not necessarily mean a high risk of corrosion. This is because the use of silica fume increases the value of [Cl-]/[OH-] as a consequence of reduced chloride binding and pH, but it also slow down the ingress of aggressive agents such as moisture, oxygen, CO2, and Cl-, thus depressing the corrosion activities. Later, Sergi and Glass20 proposed to use the ratio of total chloride (acid-soluble) over the resistance to pH reduction (acid neutralization capacity), simply termed as Cl-
/H+. It considered all potential inhibitive phases in paste as well as both the free and bound
3

chlorides. It may be the best representation for the chloride ion limit in concrete. However, research is needed to further validate this approach.
It should be noted that accurate measurements of free chloride and pH value in pore solution of concrete are practically impossible and thus their exact values are normally unknown. In contrast, it is relatively simple to measure the total chloride content by the weight of cement or concrete.
2.2 Factors Affecting Acceptable Chloride Ion Limit Numerous factors affect the acceptable chloride ion limit, many of which are correlated. For example, chloride binding is associated with carbonation because carbonation reduces the calcium hydroxide content in paste and lowers the pH of concrete, causing the release of bound chloride. The following sections summarize the main factors that influence the acceptable chloride ion content in concrete.
2.2.1 Cementitious Materials Different types and amounts of cementitious materials have great impacts on the acceptable chloride ion limit by affecting the chloride binding and the pH of pore solution. Some cements such as type II and V have high C3A and C4AF that are able to bind chloride to form Friedel’s salt, which would increase the acceptable chloride ion limit in concrete21. On the other hand, the cement hydration products (C-S-H gel) can bind chloride22. An increase in cement content in concrete would increase the chloride binding and reduce the risk of corrosion. In addition, different cementitious materials may have different alkali contents, which leads to different resistances to the fall in pH. Therefore, the passive state of steel would become more stable in concrete with higher alkali contents, thus reducing the risk of corrosion.
Specifically, the use of supplementary cementitious materials (e.g. silica fume, fly ash, and slag) to partially replace cement may change the chloride binding, alkali content, pH of pore solution, and permeability of concrete. Adding silica fume for partial replacement of cement was reported to have a lower acceptable chloride ion limit and slightly increased the rate of corrosion23. Reasons were complex. For instances, silica fume reduced the chemical binding of chloride due to the reduced aluminate phase, but increased the physical adsorption of chloride due to the refinement of pores24-25. Moreover, silica fume addition reduced the alkalinity or pH of pore solution, thus reducing the bound chloride and destabilizing the passivity of steel26.
Similarly, the use of fly ash was reported to lower the acceptable chloride ion limit of reinforced concrete27,4. However, opposite results were also reported, in which fly ash increased the acceptable chloride ion limit28. The conflicting results may be attributed to the complicated effects of fly ash on the chloride-induced corrosion. Fly ash may contain aluminates, which increased the chloride binding29. Fly ash also refined the paste and improved the physical adsorption of chloride. All these would increase the acceptable chloride ion limit. However, the use of fly ash would reduce the alkali content and reduce the pH of pore solution, which would not only destabilize the passive film of steel, but also cause the release of bound chloride. All these would reduce the acceptable chloride ion limit30.
4

Likewise, conflicting results were reported for the blast furnace slag. some research works indicated a higher acceptable chloride ion limit for reinforced concrete specimens with the blast furnace slag28; while no significant influences were noted in other works when the slag was used4. The primary reason was again the two opposite effects of slag on corrosion. The use of slag increased chemical and physical binding of chlorides due to its C3A content as well as its refinement of paste through pozzolanic reaction31-32. However, adding slag reduced the pH value of pore solution due to the reduced alkaline content in concrete33.
In addition, the use of supplementary cementitious materials would reduce the permeability of concrete, thus slowing down the chloride transport and prolonging the time for corrosion initiation when the external source of chloride is involved34-36. It also reduced the availability of moisture and oxygen in concrete, thus depressing the corrosion.
2.2.2. Steel – Concrete Interface Many research works have reported that at the interfacial zone between steel and concrete, a dense layer of hydration products containing rich calcium hydroxide would form after the placement of concrete against the steel37-40. The presence of a solid layer of paste at the steel surface provided a physical barrier that limited the transport of chemicals and charges needed for the corrosion reactions41. This alkali-rich layer also provided protection for steel by resisting a fall in pH42. However, researchers also reported that there was no dense alkali-rich layer at the steel-concrete interface and the hydration products at the interface were same as those in the bulk43.
The presence of entrapped air voids or gap at the steel-concrete interface due to the lack of workability and/or consolidation significantly affected the onset of corrosion44-46. The main reason was that voids provided a good environment for corrosion due to easy transport and availability of ions, moisture and oxygen, as well as the lack of calcium hydroxide (adhesion of paste) protection. A strong relation between the paste coating and the acceptable chloride ion limit was observed47. In addition, ribbed steel bar was more susceptible to corrosion than the smooth steel bar possibly because voids or gap could be easily developed at the ribbed surface3.
The surface conditions of reinforcement such as pre-passivated, pre-rusted, sandblasted, polished, as-received (mill-scaled) also influenced the corrosion. It was reported that pre-passivated steel displayed highest acceptable chloride ion limit, while as-received exhibited the lowest48. Some studies reported that the polished steel surface showed an higher acceptable chloride ion limit than the as-received steel surface49; while other research works concluded that sandblasted bars demonstrated a higher acceptable chloride ion limit than as-received bars5. In particular, the re-passivation of steel might be postponed or stopped when the rebars were substantially pre-rusted50.
2.2.3 Other Factors The degree of hydration of cementitious materials as well as W/Cm affected the permeability of concrete, which in turn affected the transport of chloride, moisture and oxygen. As a result, High W/Cm or low degree of hydration increased the acceptable chloride ion limit by increasing the permeability of concrete7.
5

Exposure conditions such as moisture (or relative humidity), oxygen, and temperature affected the corrosion. Moisture and oxygen were essential to the corrosion process. High temperature accelerated the transport of chemicals and ions as well as the corrosion reactions. The moisture in concrete also affected the transport process in concrete. In a dry or fully saturated concrete, higher acceptable chloride ion limit was needed to initiate the corrosion because the moisture transport in a dry concrete or the oxygen transport in a saturated concrete was slow. The moisture content in concrete also affected the chloride binding and the release of bound chloride in concrete.
The use of corrosion inhibitors such as calcium nitrite mitigated the chloride-induced corrosion51-
53 by raising the acceptable chloride ion limit in concrete through modifying the surface chemistry of steel. However, some researchers reported that calcium nitrite did not significantly affect the acceptable chloride ion limit54.
The treatment of steel such as galvanization or epoxy coating increased the acceptable chloride ion limit in concrete. Galvanized steel delayed the onset of corrosion and reduced the corrosion rate55. Epoxy coated steel showed negligible corrosion rate56 and good long-term performance under corrosive environments57.
2.3 Chloride Quantification Methods 2.3.1 Total Chloride Determination Methods The acid extraction technique is typically employed to analyze the total chloride content in concrete. This technique was well-documented58-59and widely adopted in the practice. It involved the use of dilute nitric acid to dissolve the pulverized sample and to extract both free and bound chlorides into the solution. Then, the total chloride in the solution was measured using various techniques such as titration58, ion selective electrode, or spectrophotometric methods60. It was reported that in general, 70 to 90% of total chloride could be extracted depending on the concentration of nitric acid and the extraction time. A more accurate method for determining the total chloride content was the X-ray fluorescence61. However, it was costly and required special skills.
2.3.2 Free Chloride Determination Methods The free chloride (also referred as water-soluble chloride) was determined from a boiled suspension prepared by mixing the ground sample with distilled water62. The concentration of chloride in the suspension was measured by titration, potentiometry, or chloride ion selective electrode. The water-soluble chloride seemed to depend on the particle size of ground sample, extraction time, and temperature63. The free chloride may also be determined by the Soxhlet method64, in which the condensed water from vapor repeatedly extract the chloride from the concrete chips.
Another way of measuring the free chloride was the pore solution expression technique65-66, which involved the use of high pressure to extract the pore solution from the concrete paste. It was probably the most accurate method for determining the free chloride in concrete. However, the method may overestimate the free chloride due to the potential release of bound chloride under high pressure67. The application may also be limited when the concrete was dry or had a low W/C68. In addition, the free chloride in pore solution can be directly measured by
6

embedding the chloride ion selective electrode in concrete69. However, the measurement was localized and may not truly represent the overall chloride content in concrete.
2.4 Corrosion Detection Methods The diagnosis and monitoring of corrosion in reinforced concrete are fundamentally based on the electrochemical measurements. Various techniques such as half-cell potential, linear polarization resistance, galvanostatic pulse, and electrochemical impedance spectroscopy have been developed to detect the onset of corrosion and to monitor the propagation of corrosion.
2.4.1 Half-Cell Potential When the steel is corroding, excessive electrons will build up in the steel, causing substantially more negative potential in steel. Consequently, the commencement of corrosion can be detected by the potential measurement. A more negative potential is an indication of higher probability of corrosion. The half-cell potential method has been developed based on this principle, which measures the potential of steel when no current is applied (termed as “open-circuit potential”). This method was well-standardized70-72 and commonly used in both the research73-74 and the field75. However, the corrosion potential may be affected by other factors such as oxygen moisture. As a result, a higher negative potential may not indicate a higher corrosion; while an abrupt change in corrosion potential may be a better indication of steel de-passivation.
2.4.2 Linear Polarization Resistance The linear polarization resistance technique provides a more accurate way of quantifying the rate of corrosion by measuring the corrosion current density of steel. The relationship between the corrosion rate and the corrosion current density was described by the Stern-Geary equation76. It was a well-established technique77,72 and widely used in the research and the field evaluations78-
79. An active corrosion was defined when the sustained corrosion current density was greater than 0.1 µA/cm2 80,77. However, the measured corrosion density was an averaged value over the exposed area of embedded steel. The local corrosion rate at the pit may be substantially higher than the average value. Consequently, a shift in corrosion current density over time rather than the absolute value may be more accurately represent an active corrosion.
2.4.3 Electrochemical Impedance Spectroscopy (EIS) The corrosion rate of steel is calculated based on the Stern-Geary equation using polarization resistance. Besides the linear polarization resistance, several other methods have been developed to determine the polarization resistance including EIS, chronoamperometry, and galvanostatic pulse73. EIS involved the application of a small external AC voltage with a wide range of frequencies to the steel and measured the impedance spectrum, from which the charge transfer resistance (equivalent to polarization resistance) can be determined81.
2.4.4 Other Methods Visual examination and weight loss have been used to evaluate the extent of corrosion when steel is removed from the concrete after exposure. Visual examination was mainly used in the early work to assess the de-passivation of steel by checking whether or not there was rust appeared on the steel surface. The main disadvantage was its low accuracy because it was impossible to know when the corrosion occurred and how long it lasted. As a result, visual examination was typically used in combination with other techniques such as half-cell potential
7

and linear polarization resistance. Similarly, the weight loss method was mainly used to assess the extent of corrosion by measuring the weight reduction prior and after the exposure. It did not tell the onset and duration of corrosion.
3.0 Experimental Programs The main goal of this project is to assess the acceptable chloride ion limit in concrete that is used in the transportation structures in Tennessee. A variety of concrete specimens with reinforcing steel and prestressing strands were prepared based on the materials and proportions that are typically used in Tennessee transportation structures such as TDOT class P and class D mixes. These specimens contained various percentages of cast-in sodium chloride and then were exposed to different environments with different moisture or temperature conditions. The linear polarization resistance method was used in this study to investigate the corrosion activities and several ASTM test methods were introduced to analyze the water-soluble and acid-soluble chloride contents. The following sections describe in details the materials and proportions, specimen preparations, and testing methods used in this study. 3.1 Materials and Proportions The materials used for preparing concrete slabs for corrosion testing in this study mainly included Portland cement, supplementary cementitious materials, coarse aggregates, fine aggregate, rebar, and prestressing strand. Two types of Portland cements were used in the present work: type I and type III. The type I cement was provided by the Holcim (US) Inc. and its chemical and potential phase compositions are given in Table 3.1. Buzzi Inc. and Holcim (US) Inc. supplied the type III cements and their chemical and potential phase compositions are also summarized in Table 3.1. The supplementary cementitious materials in this study included class C and F fly ash. The Miller plant of the Headwaters Construction Materials provided the class C fly ash, while the Cumberland Fossil plant, SEFA Group manufactured the class F fly ash. Their chemical compositions are also summarized in Table 3.1. The coarse aggregates used in this study included crushed limestone and Niagara Escarpment coarse aggregate (high chloride). The fine aggregate included natural river sand, manufactured sand, and Niagara Escarpment fine aggregate (high chloride). The crushed limestone was supplied locally by Rogers group and it had a nominal maximum size of ½”, specific gravity of 2.63, and absorption of 1.32. The Niagara Escarpment coarse and fine aggregates as described in ASTM C1524 X1.2 were requested in this research. The Niagara Escarpment coarse aggregate had a nominal maximum size of ½”, specific gravity of 2.76, and absorption of 2.96. The Niagara Escarpment fine aggregate had specific gravity of 2.75 and absorption of 1.33%. The natural river sand was requested from a local supplier with specific gravity of 2.68 and absorption of 2.42%. The manufactured sand was a crushed limestone fine aggregate with specific gravity of 2.8 and absorption of 1.88%. The gradation of these aggregates is summarized in Table 3.2.
8

Table 3.1 Chemical compositions of Portland cement and fly ash used in this study Cementitious materials
Holcim Type I
Hilcim Type III
Buzzi Type III
Class F Fly Ash
Class C Fly Ash
Chemical compositions SiO2, % 20.6 42.8 78.87 Al2O3, % 4.9 18.1 20.36 Fe2O3, % 3.4 18.89 6.14 CaO, % 62.8 7.9 22.72 MgO, % 1.3 2.1 4.4 SO3, % 3.3 3.08 1.52 Loss on ignition, % 2.0 0.9 0.47 Others, %
Potential phase compositions C3S, % 48 C2S, % 23 C3A, % 7 C4AF, % 10
Table 3.2 Gradation of aggregates used in this study
3.2 Specimen Preparations 3.2.1 Room Exposure Specimens without Wetting Three series of concrete slabs with a dimension of 12”×12”×6” were prepared using a proportion similar to the TDOT class P mix. The materials and proportioning are summarized in Table 3.3. Each series consisted of 13 to 14 concrete slabs with the cast-in sodium chloride varying from 0% (control) to 3% by the weight of cementitious materials. In the first series, type I Portland cement and class F fly ash (15%wt. as a replacement of cement) were used, while the second
Sieve #
Percentage passing, %
Crushed limestone
Niagara Escarpment Coarse Agg.
Natural river sand
Manufactured sand
Niagara Escarpment Fine Agg.
3/4" 0 0 1/2" 6.80 50.78 3/8" 44.70 34.55 No. 4 37.63 12.43 2.31 14.22 0.17 No. 8 8.75 1.71 4.82 35.62 20.27 No. 16 8.29 20.92 27.91 No. 30 26.78 12.75 17.11 No. 50 51.25 8.17 12.13 No. 100 6.17 4.41 11.30 No. 200 0.19 1.63 7.64 Pan 2.12 0.54 0.19 2.29 3.49
9

series used type III cement and class F fly ash (15% replacement), and the third series involved the type I cement and the class C fly ash (15% replacement). Each slab also contained a rebar (½” in diameter×16” long) and a seven-wire prestressing strand (½” in diameter×16” long) located at 4” below the surface of concrete slab.
Table 3.3 TDOT class P mix proportioning used in this study Ingredient Materials Proportioning, per yd3
Holcim type I/ III cement 679 lbs. Class F/C fly ash 120 lbs. Limestone 1734 lbs. Sand 1176 lbs. Water 250 lbs. BASF Glenium 3030 40 fl oz. BASF Master Pozzolith 700 65 fl oz.
After mixing, the fresh concrete was cast into a 12”x12”x6” wooden mold and externally vibrated for 15 seconds. Before placement, a thin layer of oil was applied on the bottom and the sides of the mold to prevent the water absorption from the fresh concrete and to facilitate demolding. Then, the rebar and the strand were positioned at 4” below the surface through pre-drilled holes on the two opposite sides of the mold. The detailed information on the mold and the specimen dimension is shown in Figure 3.1a. After casting, the specimen was covered with the plastic sheet and initially cured for 24 hours at a temperature of approximately 73°F. It was then demolded and stored on the lab floor at a temperature of 73°F and a relative humidity of about 50% for corrosion testing as shown in Figure 3.1b.
12"12"
6"
4" 4" 4"
4"Strand Rebar
(a) Wooden mold and its dimension (b) Room curing specimen for corrosion testing
Figure 3.1 Preparation of room exposure specimen without wetting 3.2.2 Room Exposure Specimens with Bottom Wetting Ten concrete slabs (12”×12”×4”) with different percentages of cast-in sodium chloride were prepared following a proportion similar to the TDOT class D mix. The materials and proportioning are listed in Table 3.4. Each slab also consisted of a ½” rebar and a ½” prestressing strand that were positioned at the middle depth of the slab (i.e., 2” below the slab surface) with approximately 2” exposed at each end. The concrete slab preparation and the environmental exposure were similar to what was described in section 3.2.1 except that the
10

moisture was continuously supplied to the bottom of the slab by placing the slab on a pan that was filled with the tap water to approximately 1”. This water supply was designed to assess how the moisture availability affected the corrosion activity. A thinner concrete slab (4” instead of 6”) was used in this test for facilitating the wicking process (moisture transmission) through concrete. The specimen dimension and the bottom water supply of concrete slab are shown in Figure 3.2.
Table 3.4 TDOT class D mix proportioning used in this study
Ingredient Materials Proportioning
Holcim type I cement 496 lbs./ yd3 Class F/C fly ash 124 lbs./ yd3 Limestone 1904 lbs./ yd3 Sand 1140 lbs./ yd3 Water 232.5 lbs./ yd3 BASF Micro air 0.38 oz/cwt BASF Polyheed N 3 oz/cwt BASF Glenium 7500 2 oz/cwt
12"
12"
4" 4" 4"4"2"
Figure 3.2 Room exposure specimen with bottom wetting
3.2.3 Room Exposure Specimens with Stressed Prestressing Strand and Top Wetting/Drying The specimen preparation in this section included two parts. The first part was to prepare a base concrete slab with a stressed prestressing strand, which was mainly conducted in the Mid South Prestress plant, Pleasant View, TN. The central portion of the stressed strand was exposed by creating an empty slot at the center of base concrete slab. The fresh concrete for the base slab was supplied by the ready mix plant with a slump of 4”, a unit weight of 145lbs/ft3, an entrained air content of 4%, and a 28-day compressive strength of 6000 psi. Its mix proportion was cement: water: coarse aggregate :fine aggregate = 1:0.4 :3.5 :2.5. The cement used was the Holcim type I Portland cement. A crushed limestone with NMSA of 1” was used as the coarse aggregate; while natural river sand was used as the fine aggregate. Before casting, the mold (i.e. bed) was adjusted to 20” wide and 6” high and then divided into 36” long slots using wood boards. Figure 3.3a showed the preparation of bed for casting. In each slot, a 12” long× 8”
11

wide× 6” deep foam block was installed at the center. A prestressing steel strand run through the wood boards and the foam blocks from the predrilled holes and was positioned 2” above the bottom of bed as shown in Figure 3.3b. A 60000lbs tensile force was applied to the strand to generate a level of prestressing that was approximately 75% of the yield strength of steel strand. The stressed strand was then anchored on the two ends of the bed. After a thin layer of releasing agent (oil) was applied to the bottom and the sides of the bed, the fresh concrete was placed into each slot, internally vibrated, and finished as shown in Figure 3.3c. The concrete was covered and initially cured for 3 days. The foams and the wood boards were then removed and the stressed prestressing strand between each individual slot was cut. After demolding, each individual specimen (as shown in Figure 3.3d) was transferred to the MTSU concrete laboratory for the second portion preparation. The concrete that was used for preparing the second portion of specimen was similar to TDOT class D mix (Table 3.4). The cementitious materials used included the Holcim type I Portland cement and Headwater class C fly ash. The aggregate used consisted of crushed limestone coarse aggregate and natural river sand. Twelve batches of concrete were mixed with the cast-in sodium chloride varying from 0 to 4% by the weight of cementitious materials. Before mixing, sodium chloride was added into the mixing water and all materials were mixed in a rotating drum mixer following the standard procedure in ASTM C94. After mixing, the fresh concrete was transferred to the specimen preparation site and cast into the central slot to the level at which the stressed prestressing strand was located (approximately 2” above the bottom). Then, a rebar (11” long and ½” in diameter) and an unstressed strand (11” long and ½” in diameter) were placed on the top of fresh concrete and positioned 2” away from the stressed prestresssing strand at each side as shown in Figure 3.3e. After the alignment of rebar and unstressed prestressing strand, a 2” thick fresh concrete cover was cast on the top of steel and then finished. The specimen was then stored on the floor at about 73°F and 50% relative humidity as shown in Figure 3.3f. Water was occasionally added (normally once in two weeks) to the top of the central slot so that the top of concrete within the slot can keep a cycle of one week wet and one week dry. The corrosion measurement was conducted regularly to monitor the corrosion activity of rebar, unstressed strand, and the stressed strand.
12

Precast concrete for holding prestressing strand
Fresh concrete with cast-in chloride
Rebar
Prestressed strand
Unstressed strand
Steel wire
2"
2"
2"
2"
a b
c
e f
20"
36"
12"
8"
d
Figure 3.3 Specimen preparation for comparing corrosion among rebar, prestressed strand, and unstressed strand using cast-in sodium chloride: (a) Precast/prestressing concrete bed, (b) Close-up view of bed with stressed strand, (c) Pre-castingconcretefor holding stressed strand, (d) Precast concrete after demolding, (e) Placing concrete with cast-in chloride and setting rebar and unstressed strand, and (f) Air curing specimen with cast-in chloride, rebar, prestressed strand, and unstressed strand 3.2.3 Field Exposure Specimens Two series of concrete slabs were prepared in this section to study how the steel corrosion developed when the specimens were exposed to the field environment as shown in Figure 3.4. The first series consisted of 10 concrete slabs with different percentages of cast-in sodium chloride varying from 0 to 4% by the weight of cementitious materials. All slabs had the same
13

dimension as described in section 3.2.2 (i.e. 12”×12”×4” with rebar and strand positioned in the middle) and used a concrete mixture similar to the TDOT class D mix (Table 3.4) with only type I Portland cement as the cementitious materials (620 lbs/yd3). In those slabs, 8 of them used the crushed limestone as the coarse aggregate and the natural river sand as the fine aggregate; while 2 slabs used the Niagara Escarpment (high-chloride) coarse and fine aggregates. This was to determine whether or not the high-chloride aggregates influenced the corrosion activities. In the second series, 8 concrete slabs with the same dimension (12”×12”×4” with rebar and strand positioned in the middle) and various sodium chloride contents (0 to 3% by the weight of cementitious materials) were cast. The concrete mixture was similar to the first series except that 15% class F fly ash was used to partially replace the cement and no high-chloride aggregates were used.
Figure 3.4 Examples of field-exposed concrete specimens
In addition, 4 concrete slabs with the same dimension as described in section 3.2.1 (i.e. 12”×12”×6”with rebar and strand located at 4” below the surface) were placed using a concrete mixture similar to the TDOT class P mix. The main goal was to compare the different corrosion behavior between the field-exposure and the room-exposure. 3.2.4 High-Temperature Exposure with Moisture or Salt-Water Immersion Four series of concrete slabs with a dimension of 8”×7”×4” were prepared using TDOT class D mix (Table 3.4). Each series consisted of 8 concrete slabs with different percentages of cast-in sodium chloride ranging from 0 to 4.0% by the weight of cementitious materials. The first two series used the type I portland cement; while in the third and the fourth series, 20% class F fly ash was used to partially replace the portland cement. After mixing, the fresh concrete was cast into the wooden mold until it reached the middle depth of the mold. The fresh concrete was then consolidated by rodding. After consolidation, the rebar and the strand (both 6” long and ½” in diameter) were positioned 2” away from the side of the mold and 1” from both the front and the back of the mold. The rebar and the strand were connected to the outside of the mold through the stainless steel wires for the late corrosion measurement. After the positioning of steel, the fresh concrete was placed on the top portion of the mold, consolidated by rodding, and finished with a steel trowel. After finishing, the concrete slab was covered with the plastic sheet and initially cured at 73°F for 24 hours, and then demolded as shown in Figure 3.5.
14

Figure 3.5 An example of concrete slabs for high-temperature exposure
After demolding, the first and the third series of concrete slabs were placed in plastic containers and covered with wet burlaps. The containers together with the concrete slabs were then covered with the plastic lids and stored in a environmental chamber at 105°F and 50% RH for the corosion measurement as shown in Figure 3.6. The burlap typically became dry in approximately two weeks, but it was re-wetted biweekly so that the interior of the container was kept moist during the test. The second and the fourth series were also placed in plastic containers, but they were submerged in the 3%wt. sodium chloride solution. The containers were then covered with plastic lids and stored in an environmental chamber at 105°F for the corrosion measurement.
Figure 3.6 Concrete slabs stored at an environmental chamber at 105°F and 50% RH
3.3 Corrosion Evaluation During the exposure, the corrosion activities of rebar and strand in concrete specimens were monitored using the linear polarization resistance technique. After exposed for at least 6 months
15
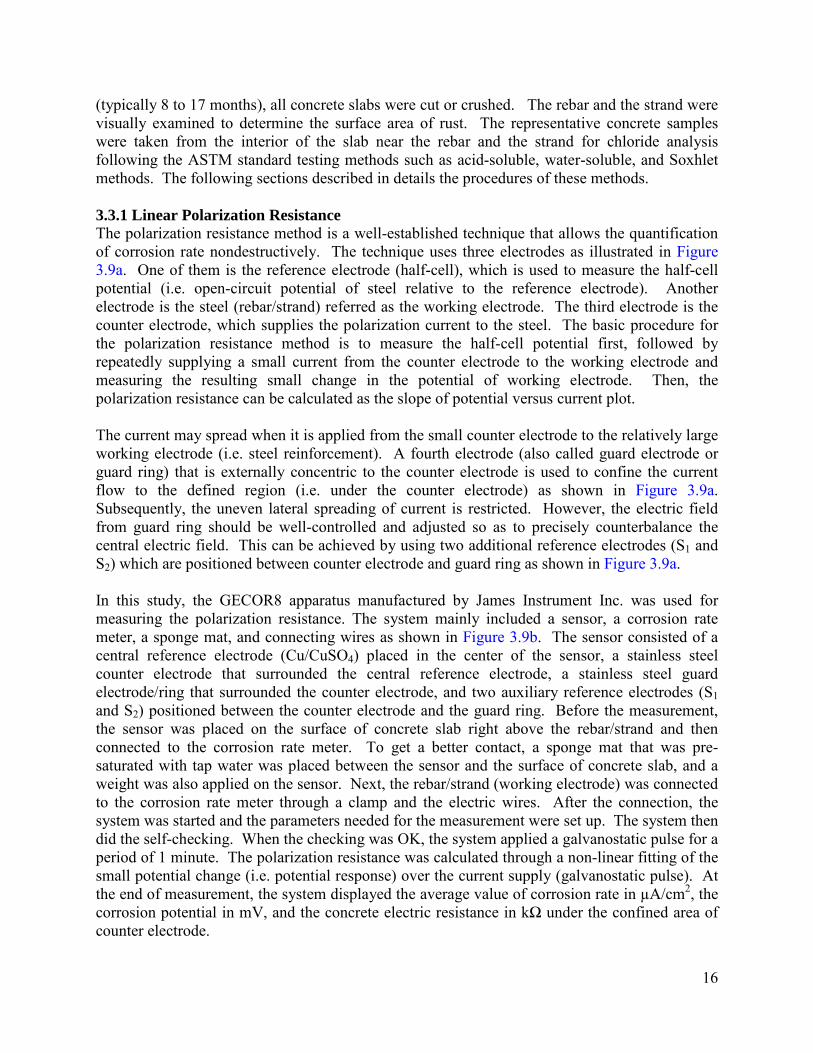
(typically 8 to 17 months), all concrete slabs were cut or crushed. The rebar and the strand were visually examined to determine the surface area of rust. The representative concrete samples were taken from the interior of the slab near the rebar and the strand for chloride analysis following the ASTM standard testing methods such as acid-soluble, water-soluble, and Soxhlet methods. The following sections described in details the procedures of these methods. 3.3.1 Linear Polarization Resistance The polarization resistance method is a well-established technique that allows the quantification of corrosion rate nondestructively. The technique uses three electrodes as illustrated in Figure 3.9a. One of them is the reference electrode (half-cell), which is used to measure the half-cell potential (i.e. open-circuit potential of steel relative to the reference electrode). Another electrode is the steel (rebar/strand) referred as the working electrode. The third electrode is the counter electrode, which supplies the polarization current to the steel. The basic procedure for the polarization resistance method is to measure the half-cell potential first, followed by repeatedly supplying a small current from the counter electrode to the working electrode and measuring the resulting small change in the potential of working electrode. Then, the polarization resistance can be calculated as the slope of potential versus current plot. The current may spread when it is applied from the small counter electrode to the relatively large working electrode (i.e. steel reinforcement). A fourth electrode (also called guard electrode or guard ring) that is externally concentric to the counter electrode is used to confine the current flow to the defined region (i.e. under the counter electrode) as shown in Figure 3.9a. Subsequently, the uneven lateral spreading of current is restricted. However, the electric field from guard ring should be well-controlled and adjusted so as to precisely counterbalance the central electric field. This can be achieved by using two additional reference electrodes (S1 and S2) which are positioned between counter electrode and guard ring as shown in Figure 3.9a. In this study, the GECOR8 apparatus manufactured by James Instrument Inc. was used for measuring the polarization resistance. The system mainly included a sensor, a corrosion rate meter, a sponge mat, and connecting wires as shown in Figure 3.9b. The sensor consisted of a central reference electrode (Cu/CuSO4) placed in the center of the sensor, a stainless steel counter electrode that surrounded the central reference electrode, a stainless steel guard electrode/ring that surrounded the counter electrode, and two auxiliary reference electrodes (S1 and S2) positioned between the counter electrode and the guard ring. Before the measurement, the sensor was placed on the surface of concrete slab right above the rebar/strand and then connected to the corrosion rate meter. To get a better contact, a sponge mat that was pre-saturated with tap water was placed between the sensor and the surface of concrete slab, and a weight was also applied on the sensor. Next, the rebar/strand (working electrode) was connected to the corrosion rate meter through a clamp and the electric wires. After the connection, the system was started and the parameters needed for the measurement were set up. The system then did the self-checking. When the checking was OK, the system applied a galvanostatic pulse for a period of 1 minute. The polarization resistance was calculated through a non-linear fitting of the small potential change (i.e. potential response) over the current supply (galvanostatic pulse). At the end of measurement, the system displayed the average value of corrosion rate in µA/cm2, the corrosion potential in mV, and the concrete electric resistance in kΩ under the confined area of counter electrode.
16

Figure 3.9 Test setup for linear polarization resistance method; (a) arrangement of electrodes;
and (b) polarization resistance measurement with GECOR8
3.3.2 Visual Examination and Areas of Corrosion For concrete slabs with cast-in chloride, they were manually crushed with a hammer after exposure to different moisture and temperature environments for at least 8 months as shown in Figure 3.10a. Visual examination was conducted on the rebar and the strand to determine the surface area of corrosion. Figure 3.9b shows an example of visual examination in which a small patch of rust on the strand was detected and the total area of rust on the surface of strand was then measured and recorded. The chloride content at which the rust first appeared is a direct indication of acceptable chloride ion limit in concrete.
Rust (a) A crushed concrete slab (b) An example of rusted strand
Figure 3.10 Visual examination of rebar and strand after corrosion testing
3.4 Chloride Determination After the concrete slabs were broken, some representative concrete samples (approximately 300g) near the corroded rebar or strand were taken and then crushed into small pieces with a hammer as shown in Figure 3.11a. The small pieces were further ground into powder until all particles were less than 600µm (i.e. passing No.30 sieve as shown in Figure 3.11b). These pulverized samples were then thoroughly blended by transferring from one glazed paper to another for at least 10 times. They were used for the water-soluble or the acid-soluble chloride
Concrete Slab
Steel
Guard RingS1 S2
ReferenceElectrode
Central Counter Electrode
Working Electrode
Corrosion Rate Meter
Sensor
Sponge
WorkingElectrode Corrosion Rate Meter
Concrete Slab
a b
17

analyses. The crushing and pulverizing process was conducted very carefully in this study to avoid any loss of particles.
(a) Crushed sample with hammer (b) Pulverized sample passing No.30 sieve
Figure 3.11Pulverized concrete samples for chloride analysis 3.4.1 Water-Soluble Chloride Analysis (ASTM C1218) The water-soluble chloride analysis was conducted following the procedure similar to the one described in the ASTM C1218. The main procedure is as follows: • Weigh approximately 10 g of well-blended pulverized concrete sample using a direct reading
balance with an accuracy of 0.0001g and place the sample into 250ml beaker. • Add 50mL distilled water into the beaker and cover the beaker with a watch glass • Place the beaker on a hot plate as shown in Figure 3.12a and heat the sample to boil for 5
minutes • Remove the sample from the hot plate and allow standing for 24 hours. • Filter the sample by suction through a 9-cm coarse-textured filter paper in a 250mL Buchner
funnel and filtration flask as shown in Figure 3.12b. The beaker and the filter paper were rinsed with a small amount of water.
• Transfer the filtrate to a 250mL beaker and rinse the flask with a small portion of water. • Add 3mL of diluted nitric acid (by mixing one portion of 70% nitric acid with one portion of
distilled water) as well as 3mL of hydrogen peroxide into the filtrate. Cover the beaker with a watch glass and rest for 2 minutes.
• Place the beaker on a hot plate to boil the filtrate for 3 to 5 seconds. • Remove the sample from the hot plate and let it cool to the room temperature. • Add 2mL standard 0.05N NaCl solution to the filtrate and thoroughly stir. • Gradually titrate the sample as shown in Figure 3.12c using the standard 0.05N silver nitrate
solution following the procedure described in the ASTM C114 section 2182 • Calculate the chloride percentage by the weight of concrete based on the procedure and the
equation given in ASTM C114.
18

Potentiometer
Buret with 0.05N AgNO3standard solution
Chloride Ion Selective Electrode
Clamp
Stand
Glass Rod
Beaker with solution (a)Hot plate to boil sample (b) Filtration system (c) Titration system
Figure 3.12Test setup for water-soluble chloride analysis
3.4.2 Acid-Soluble Chloride Analysis (ASTM C1152) The acid-soluble chloride analysis was performed in this study based on the procedure similar to the one described in ASTM C1152. The main procedure is as follows: • Weigh approximately 10g of pulverized concrete sample and transfer to a 250mL beaker. • Add 75mL distilled water to the beaker to disperse the sample. • Slowly add 12mL diluted nitric acid (by mixing one part of 70% nitric acid with one part of
distilled water) to the beaker and stir the sample with a glass rod to break all the lumps. A dosage of 12mL diluted nitric acid was used in this study instead of 25mL as recommended in ASTM C1152. This was because this dosage was sufficient to reduce the pH value of the solution to approximately 0.5 to 1.
• Add 3 mL hydrogen peroxide and 3 drops of methyl orange indicator and stir. The solution turned to pink.
• Cover the beaker with a watch glass and let it stand for 2 minutes. • Place the beaker on the hot plate and rapidly boil the sample for 3 to 5 seconds. • Remove the sample from the hot plate and cool it to the room temperature • Filter the sample with filter paper using suction (same as what was described in water-soluble
method above) • Pipet 2mL standard 0.05N sodium chloride solution into the sample and thoroughly stir. • Gradually titrate following the procedure described in ASTM C114-15 section 21. • Calculate the chloride percentage by mass of concrete based on the equation given in ASTM
C1152. 3.4.3 Water-Extractable Chloride Analysis (Soxhlet method-ASTM C1524) The water-extractable chloride analysis was conducted in this study as a means of determining the water-soluble chloride content in concrete or coarse aggregate. First, the concrete or coarse aggregate particles larger than 25mm were first crushed with a hammer so that all particles passed a 25 mm sieve. This crushing process should also be controlled so as not to generate powder materials. The sample was then dried in oven at 110°C for 2 hours. After cooling, a representative sample was taken by reducing the sample to approximately 200 to 500g using a
19

sample splitter. An example of the samples used in this study is shown in Figure 3.13a. The main steps for the Soxhlet method used in this study are as follows: • Weight at least 30g of concrete or coarse aggregate from a minimum of four points of the
representative sample using a balance with an accuracy of 0.001g, and transfer it to the sample holder in the Soxhlet extraction tube.
• Measure 200mL distilled water and add into the 250 mL boiling flask. • Assemble the boiling flask, the extraction tube, and the condenser as shown in Figure 3.13b,
and then connect the condenser to the cooling water supply and discharging system. • Place the boiling flask on the hot plate and turn on both the hot plate and the cooling water
supply and discharging system. • Adjust the heating rate so that each extraction cycle took approximately 20 minutes. One
cycle indicated the thimble filling and discharging of solution. • Continue the extraction for 24 hours and then transfer the solution to a 400mL beaker. Rinse
the boiling flask 3 times using 10mL distilled water and transfer the washing to the beaker. • Add 3 mL nitric acid (obtained by mixing one portion of 70% nitric acid with one portion of
distilled water). Add 3mL hydrogen peroxide to the extracted solution and stir. • Cover the beaker with a watch glass, put it on the hot plate, and rapidly boil the solution for 3
to 5 seconds. Remove the beaker from hot plate and let the solution cool to room temperature.
• Add 2mL standard 0.05N NaCl solution and stir • Gradually titrate based on the procedure in ASTM C114-15 section 21. • Calculate the chloride percentage by the mass of sample using the procedure and the equation
in ASTM C114-15 section 21.
30g Sample
Sample Holder
Siphon Tube
Condenser
250 mL Boiling Flask with 200 mLRegent Water
Cooling Water Inlet
CoolingWater Outlet
Hot Plate
Stand
Clamp
(a) Concrete sample (b) Soxhlet test setup
Figure 3.13 Soxhlet concrete sample and test setup
20

3.5 Acid Neutralization Capacity (ANC) of Concrete The acid neutralization capacity (i.e. the resistance of concrete to pH reduction) was analyzed in this study through evaluating how the pH value of concrete decreased with an increase in the acid addition. The pH dependent release mechanisms of bound chloride were also evaluated. The concrete sample was ground into very fine powders (less than 200µm). Then, 20 jars of concrete suspensions were prepared. Each suspension was produced by weighing 5g of fine concrete powders and mixing with 5mL distilled water in a jar. A predetermined quantity of diluted nitric acid (70% nitric acid : distilled water = 1:1 by volume) was slowly added to each suspension and agitated with a glass rod simultaneously as illustrated in Figure 3.14a. The volume of nitric acid varied from 0mL to 7mL with an increment of 0.25mL for the first 13 suspensions, and 0.5mL increment for the next 6 suspensions, and 1mL increment for the last suspension. Each jar was then tightly sealed and stored in the room at 73°F for a period of one week. A week was chosen in this study because the pH value of the solution reached a steady state in approximately a week based on the trial test results. After the pH electrode was calibrated using the buffer solutions, the pH value of each suspension was measured as illustrated in Figure 3.14b.
pH MeterpH Electrode
Glass jar with concrete solution
(a) Dissolution of concrete in nitric acid (b) pH measurement Figure 3.14 Preparation of solution and pH measurement for ANC analysis
4.0 Results and Analysis The main goal of this project was to determine the acceptable chloride ion limit in concrete for both rebar and prestressing strand embedded in typical TDOT concrete mixes. Various concrete slabs with different percentages of cast-in sodium chloride were prepared using materials and proportions that were similar to TDOT class P and D mixes. These slabs were then exposed to different environments such as room without wetting, room with bottom wetting, field, high temperature with wetting, and high temperature with salt-water immersion. The corrosion activities in both rebar and prestressing strand were monitored for at least 8 months. After the exposure, the slabs were crushed with a hammer and the rebar and the strand were visually examined to determine the extent of corrosion. Representative concrete samples were taken immediately after the breaking of concrete slabs for chloride analysis using water-soluble, acid-soluble, and Soxhlet methods. In addition, the acid neutralization capacity of these concrete
21

mixes was tested and the release mechanism of bound chloride was investigated. The following sections provide the results and analyses of all the tests performed in this study. 4.1 Acceptable Chloride Ion Limits of Rebar and Prestressing Strand for Different TDOT Mixes under Various Exposure Conditions Eleven series of tests were conducted in this project to evaluate the acceptable chloride ion limit for different TDOT structural concretes and exposure conditions. The test results are summarized in the following sections. 4.1.1TDOT Class P Mix and Indoor Exposure without Wetting Different cementitious materials such as type I Portland cement, type III Portland cement, class C fly ash, and class F fly ash were used in preparing the concrete specimens. These specimens were exposed to the indoor environment without moisture supply for approximately 17 months. The corrosion potential, corrosion rate, and the corroded area were plotted as a function of chloride content (cast-in sodium chloride and total chloride ion by weight of cementitious materials). The total chloride ion content was calculated by adding together the cast-in chloride ion and the background chloride ion of ingredient materials. Two examples of calculating the background chloride ion from ingredient materials are given in Tables 4.1.1 and 4.1.2 for TDOT class P and class D mixes respectively. The background chloride for typical TDOT class P mix was approximately 0.079% by weight of cementitious materials when 15% class F fly ash was used as a replacement of cement, or 0.051% for 15% class C fly ash replacement. The background chloride for typical TDOT class D mix was approximately 0.1% by weight of cementitious materials for 20% class F fly ash replacement, or 0.062% for no fly ash replacement or 20% class C fly ash replacement. Table 4.1.1 Calculation of total chloride from ingredient materials in typical TDOT class P mix Ingredients Proportions, lb/yd3 Chloride content, % Total chloride, lb/yd3 Holcim type I/III cement 679 0.017 0.115 Class F/C fly ash 120 0.2/0.01 0.240/0.012 Limestone coarse aggregate 1734 0.011 0.191 Natural river sand 1176 0.002 0.024 Water 250 0.025 0.063 Total chloride, lb/yd3 0.632/0.404 Total chloride (background), % by weight of cementitious materials 0.079/0.051
Table 4.1.2 Calculation of total chloride from ingredient materials in typical TDOT class D mix Ingredients Proportions, lb/yd3 Chloride content, % Total chloride, lb/yd3 Holcim type I cement 496 0.017 0.084 Class F/C fly ash 124 0.2/0.01 0.248/0.012 Limestone coarse aggregate 1904 0.011 0.209 Natural river sand 1140 0.002 0.023 Water 232.5 0.025 0.058
22

Total chloride, lb/yd3 0.632/0.387 Total chloride (background), % by weight of cementitious materials 0.1/0.062
The detailed information on the results and analysis is as follows: Type I Portland Cement + Class F Fly Ash Figure 4.1.1 presents the corrosion results of rebar and strand embedded in the concrete slabs made with TDOT class P mix using type I Portland cement and 15%wt class F fly ash as a replacement of cement and then exposed to a room environment at the temperature of 73°F and the relative humidity of approximately 50%.
Figures 4.1.1a to b illustrate the change of corrosion rate as a function of chloride content for a period of 17 months for the prestressing strand and the rebar respectively. The corrosion measurement was performed weekly for the first three months and each point in the figure was the average value of approximately four measurements in that month. In Figures 4.1.1a and b, a line was drawn at the value of 0.1 µA/cm2. This line represented a transition between the passive and the active corrosion. In general, the corrosion activity can be practically classified into four levels based on the value of corrosion rate77. When the corrosion rate (i.e. corrosion current density, Icorr) is below 0.1 µA/cm2, the corrosion activity is negligible and the steel is still in its passive state. A value between 0.1 and 0.5 µA/cm2 indicates active corrosion, but at a low level. A range of 0.5 to 1µA/cm2 means a moderate level of corrosion and a value of 1µA/cm2 or above suggests a high level of corrosion. The corrosion rate rarely exceeds 1µA/cm2 in the field due to the large dimension of concrete structures. A value of 10 µA/cm2 or higher was never detected in this study, which agreed well with what was described in the literature. As a result, a typical value for the active corrosion is between 0.1 and 1µA/cm2.
For the prestressing strand (Figure 4.1.1a), the corrosion rate measured at the very early age (24 hours (0.03 month) after mixing) was high (around 1µA/cm2) for slabs with the cast-in sodium chloride above 0.8%. All corrosion rates were above the active corrosion value (0.1µA/cm2) even for the slab with no (0%) cast-in sodium chloride. Obviously, these values did not truly represent the actual state of steel, which should still be in its passive state. This was because steel de-passivation did not take place instantly, but required some time. As a result, a high initial corrosion rate did not mean significant rust formation, but the combined effects of high moisture, high oxygen availability, and low concrete resistivity when the concrete was at its very early age. Within a week, the corrosion rate rapidly decreased. After 1 month exposure, some slabs with low cast-in NaCl contents (<1%) demonstrated negligible corrosion rates (below 0.1µA/cm2), indicating that the strand was re-passivated. For slabs with relatively higher cast-in NaCl contents (>1%), the corrosion was still active, but at a low rate. With further increasing the exposure time, the corrosion rate continued to decrease, but at a less and less pace. After approximately 5 to 6 months exposure, all corrosion rates fell below 0.1µA/cm2, implying that the corrosion activity of strand in all slabs (including those with high cast-in NaCl) was insignificant. After 17 months exposure, the corrosion rate of strand in all slabs was approaching
23

0.01µA/cm2, meaning that the corrosion might fully stop. The reduction in corrosion rate of strand when exposed to an indoor environment without wetting can be attributed to the moisture availability. Corrosion required three conditions: steel de-passivation, moisture, and oxygen. A high level of chloride would cause de-passivation; however, without moisture and oxygen, the corrosion could not proceed. When the concrete slab was exposed to an indoor environment without wetting, the moisture in concrete would become less and less available due to external drying and internal cement hydration, which in turn reduced the corrosion activities.
For rebar (Figure 4.1.1b), the corrosion rate in all concrete slabs was relatively lower (between 0.1 and 0.2 µA/cm2) when measured at the very early age (24 hours after mixing). For most slabs, this value slowly dropped to a negligible level (below 0.1µA/cm2) within 2 to 3 months. Only two slabs with high cast-in NaCl (2% and 2.5%) still displayed active corrosion after 3 months; however, these two slabs demonstrated a negligible corrosion (below 0.1µA/cm2) after 5 months. All corrosion rates were approaching 0.01µA/cm2 after 17 months exposure.
Figures 4.1.1c and d provide the results of corrosion potential for strand and rebar respectively. The corrosion potential (i.e. open-circuit potential or half-cell potential) is typically used to evaluate the likelihood of corrosion activities in steel. This is because steel with active corrosion would have substantially more negative potential than a passive steel. However, the continuation of corrosion requires the supply of oxygen and moisture. Consequently, a low potential does not necessarily mean an ongoing corrosion, but a high possibility of corrosion. Based on the criteria in ASTM C876, a potential more negative than -350mV using copper-copper sulfate reference electrode indicates a high probability (more than 90%) of corrosion; while a low probability (less than 10%) of corrosion can be defined when the potential is more positive than -200mV. If the potential is between -200 and -350mV, the corrosion is uncertain. It should be noted that this criterion is not suitable for room-exposed specimens without wetting, however, it was still employed in this study as a baseline to compare the corrosion behaviors of rebar and strand exposed to different environments.
Figure 4.1.1c shows the variation of corrosion potential of strand as a function of chloride content. It can be seen that for most strands, the corrosion potentials measured at the early age were at the uncertain region. Only for the 3% cast-in NaCl, the potential was at the high-risk region. With an increase in the exposure time, all corrosion potentials slowly decreased, but most of them were still at the uncertain region within the 3 months. Specifically, when the cast-in NaCl was low (e.g. below 1%), the corrosion potential was at the upper portion of uncertain region. When the cast-in NaCl was relatively high (e.g. between 1 and 2.5%), the corrosion potential was in the lower part of uncertain region. After approximately10-months exposure, most corrosion potentials (NaCl<2%) were reduced to the low risk region. After 17 months exposure, all specimens were in the low risk region except the one with 3% cast-in NaCl, which was still at the uncertain region.
In contrast, the corrosion potential of rebar was very different. Figure 4.1.1d illustrates the results of how cast-in NaCl content influenced the corrosion potentials of rebar. Clearly, almost all corrosion potentials were below -350mV (high corrosion risk region) when measured at the very early age (0.03 months). They rapidly reduced to the uncertain region within a month and
24

continued to decrease, but at a much slower rate. Similarly, for specimens with relatively low cast-in NaCl (<1%), corrosion potentials were concentrated on the upper portion of uncertain region. When cast-in NaCl was high (>1.5%), the corrosion potentials were primarily located at the lower side of uncertain region. After 17 months, specimens with cast-in NaCl less than 1.5% showed a low risk of corrosion; however, for specimens with high cast-in NaCl (>1.5), the corrosion was still uncertain.
Figures 4.1.1e and f provide the variation of the corroded area of steel as a function of chloride content. The corroded area provided direct information on whether or not the corrosion has occurred as well as the extent of corrosion. However, this method cannot accurately tell when the steel was de-passivated and whether the corrosion was sustained. This was because the appearance of rust did not necessarily mean a continued corrosion. The corroded area instead of the loss of weight or cross section was used in this study to represent the extent of corrosion because most corrosion only occurred at the steel surface. For most cases, the loss of weight or cross section was insignificant.
From Figure 4.1.1e, visible rust first appeared when the cast-in NaCl was 0.6%; while no rust was detected when the cast-in NaCl was below 0.5%. Above 0.6%, the corroded area increased rapidly with an increase in cast-in NaCl content. At 3% cast-in NaCl, approximately 50% strand surface showed visible rust. In contrast, no rust was seen on rebar when the cast-in NaCl was less than 0.6% and the rust was first observed on rebar at the cast-in NaCl content of 0.8% (Figure 4.1.1f). However, with an increase in the cast-in NaCl content from 0.8% to 3%, the corroded area of steel only increased slightly.
In comparing the results in Figure 4.1.1, the different corrosion behaviors between prestressing strand and rebar were obvious. The prestressing strand showed substantially higher corrosion rate at the early age (<3 months) particularly for specimens with higher cast-in NaCl (>1.0%); whereas for rebar, much lower corrosion rate was observed and it seemed that the cast-in NaCl content did not considerably affect the corrosion rate. These observations agreed well with what was seen in the visual examination. The prestressing strand exhibited very high corroded surface area particularly at high cast-in NaCl contents. However, very low corroded area was detected on the surface of rebar even in specimens with high cast-in NaCl contents. These findings indicated that in an indoor environment without wetting, chloride-induced corrosion may initially occur on the prestressing strand. One plausible explanation was that the free moisture in the fresh concrete may store in the free space between the wires of strand, which would be available later for promoting the corrosion activities. Once this moisture was consumed and there would be no significant difference in the corrosion rate between the strand and the rebar. This also explained why the corrosion rates of strand and rebar were very similar after 17 months exposure.
It was also interesting to note that the corrosion potential was not in agreement with the corrosion rate and the visual observation. For example, the prestressing strand, which had a higher corrosion rate and corroded area, was more likely to have more negative corrosion potential, but in fact, it showed less negative corrosion potential.
25

It should also be noted that although monthly average values were used in analyzing corrosion results, great variations or abrupt changes still occurred as can be seen from the Figure 4.1.1. This actually reflected that the chloride-induced corrosion was not a continuous process. High fluctuations in corrosion potentials or rates may occur within a short period of time such as hours due to the stop of an old corrosion site or reactivation of a new corrosion site. This was because local re-passivation or breakdown may take place as a result of frequent changes in moisture, temperature, oxygen, alkaline and pH, etc. Stable readings would occur when a sustained corrosion activity was established.
In conclusion, it is reasonable to propose that the acceptable chloride ion limit for TDOT class P mix made with type I cement and 15% class F fly ash replacement for indoor exposure without wetting is 0.44% (equivalent to 0.6% cast-in NaCl) by weight of cementitious materials for prestressing strand and 0.69% (1.0% cast-in NaCl) for rebar. Above these limits, noticeable rust took place on both rebar and strand. However, high limits can be specified for indoor exposure without wetting because no corrosion activities were sustained for both rebar and strand even at very high chloride contents such as 1.9% total Cl- (3% cast-in NaCl) due to the lack of moisture. It should be noted that the total chloride included the cast-in chloride and the background chloride from ingredient materials.
26
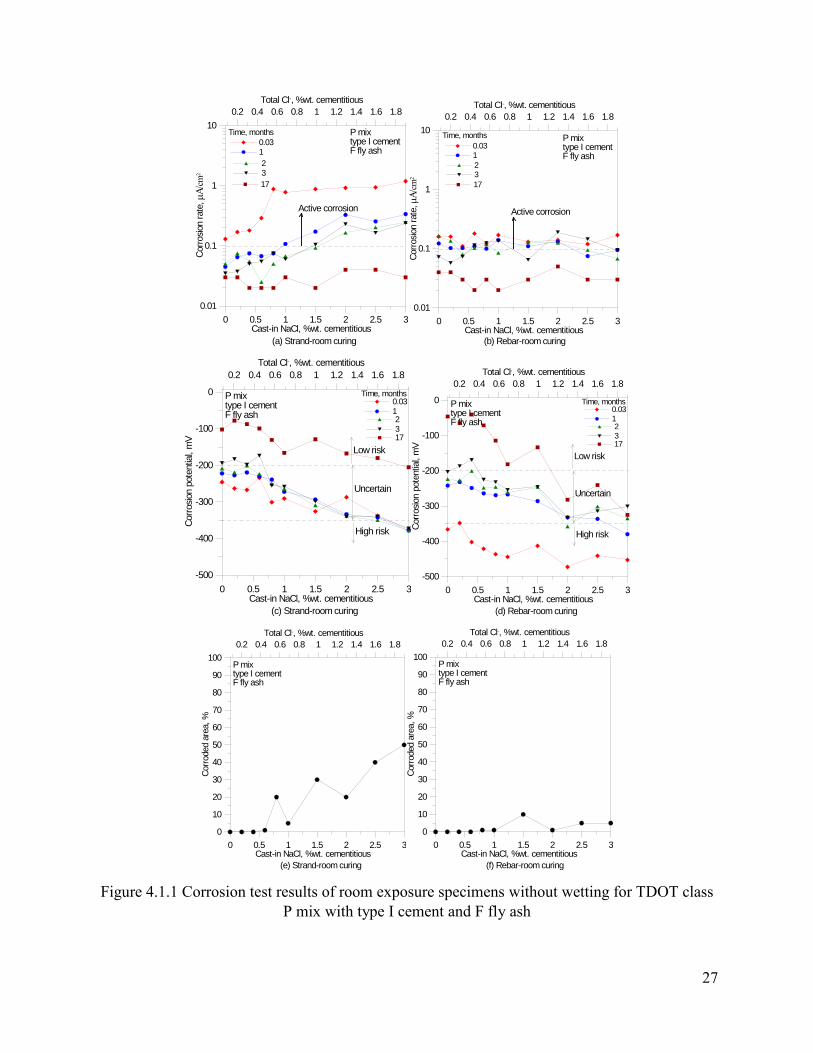
0 0.5 1 1.5 2 2.5 3Cast-in NaCl, %wt. cementitious
0.01
0.1
1
10
Corro
sion
rate
, mΑ/
cm2
0.0312317
0.2 0.4 0.6 0.8 1 1.2 1.4 1.6 1.8Total Cl-, %wt. cementitious
(a) Strand-room curing
Active corrosion
Time, months P mix type I cement F fly ash
0 0.5 1 1.5 2 2.5 3Cast-in NaCl, %wt. cementitious
0.01
0.1
1
10
Corro
sion
rate
, mΑ/
cm2
0.0312317
0.2 0.4 0.6 0.8 1 1.2 1.4 1.6 1.8Total Cl-, %wt. cementitious
(b) Rebar-room curing
Active corrosion
Time, months P mix type I cement F fly ash
0 0.5 1 1.5 2 2.5 3Cast-in NaCl, %wt. cementitious
-500
-400
-300
-200
-100
0
Corro
sion
pote
ntia
l, m
V
0.2 0.4 0.6 0.8 1 1.2 1.4 1.6 1.8Total Cl-, %wt. cementitious
0.0312317
(c) Strand-room curing
High risk
Uncertain
Low risk
Time, monthsP mix type I cement F fly ash
0 0.5 1 1.5 2 2.5 3Cast-in NaCl, %wt. cementitious
-500
-400
-300
-200
-100
0Co
rrosio
n po
tent
ial,
mV
0.2 0.4 0.6 0.8 1 1.2 1.4 1.6 1.8Total Cl-, %wt. cementitious
0.0312317
(d) Rebar-room curing
High risk
Uncertain
Low risk
Time, monthsP mix type I cement F fly ash
0 0.5 1 1.5 2 2.5 3Cast-in NaCl, %wt. cementitious
0
10
20
30
40
50
60
70
80
90
100
Corro
ded
area
, %
0.2 0.4 0.6 0.8 1 1.2 1.4 1.6 1.8Total Cl-, %wt. cementitious
(e) Strand-room curing
P mix type I cement F fly ash
0 0.5 1 1.5 2 2.5 3Cast-in NaCl, %wt. cementitious
0
10
20
30
40
50
60
70
80
90
100
Corro
ded
area
, %
0.2 0.4 0.6 0.8 1 1.2 1.4 1.6 1.8Total Cl-, %wt. cementitious
(f) Rebar-room curing
P mix type I cement F fly ash
Figure 4.1.1 Corrosion test results of room exposure specimens without wetting for TDOT class P mix with type I cement and F fly ash
27

Type III Portland Cement + Class F Fly Ash This project also investigated how different types of cement affected the corrosion behavior of prestressing strand and rebar. Figure 4.1.2 illustrates the corrosion test results for strands and rebars in concrete slabs made with type III cement. The materials, proportions, and exposure were same as compared with Figure 4.1.1 except that the type III cement was used instead of the type I cement in this test. In general, the specimens made with type III cement (Figure 4.1.2) demonstrates similar trends in corrosion behaviors as compared with these with type I cement (Figure 4.1.1). For examples, when type III cement was used, the strand also showed high corrosion rates at the very early time (0.03 months), but the rates quickly decreased to low or negligible levels within a month particularly for specimens with low cast-in NaCl contents (Figure 4.1.2a). The corrosion rates increased as the cast-in NaCl increased. In contrast, the rebar exhibited relatively lower corrosion rates even at the very beginning of exposure and there was no significant difference in the corrosion rates as the cast-in NaCl increased (Figure 4.1.2b). In addition, the corrosion rate measurements agreed well with the observations from the visual examination. Above a certain NaCl content (i.e. 0.8-1.0%), the corroded areas of strands increased rapidly as the NaCl content increased (Figures 4.1.2e). However, very small corroded area was observed on rebars even at very high cast-in NaCl contents, implying that the cast-in NaCl did not significantly affect the corrosion of rebars in an indoor environment (Figure 4.1.2f). Also, similar patterns were observed for the corrosion potential measurements (Figures 4.1.2c and d). For examples, rebars displayed much more negative potentials at the very early age (0.03 month) than strands. The potentials rapidly reduced to the uncertain region within a couple of weeks. However, the strands showed much less negative potentials even at the very early age. Although the trends between type I cement (Figure 4.1.1) and type III cement (Figure 4.1.2) were similar, different corrosion behaviors can still be observed. For examples, the initiation and the extent of corrosion/rust were different. For type I cement, visible rust was detected on strands at a cast-in NaCl level of approximately 0.6% and significant corroded area was observed on strand when the cast-in NaCl was higher than 0.6% (Figures 4.1.1e). Similarly, the rust was first seen on rebar when the cast-in NaCl increased to 0.8% and small patches of rust can be found on rebar especially near the edge of slab when the cast-in NaCl increased to 1% (Figures 4.1.1f). For type III cement, visible rust first appeared on strand when the cast-in NaCl increased to 0.8% and the substantial corroded area occurred when the cast-in NaCl was above 1% (Figures 4.1.2e). Likewise, the initiation of rust on rebar occurred at 0.8% cast-in NaCl content, but the corroded area was always low even at high cast-in NaCl contents (Figures 4.1.2f). In addition, the corrosion potential results were different especially when the cast-in NaCl content was low. For type III cement (Figure 4.1.2c), the corrosion potentials for low cast-in NaCl contents (<0.8%) were mainly in the low risk region after 1 month exposure, indicating that the passivation of strand was achieved within 1 month. However, for type I cement (Figure 4.1.1c), the majority of corrosion potentials for low cast-in NaCl levels (<0.8%) were still in the uncertain region even after 2 months exposure, implying that the passivation of strand was not yet fully achieved after 2 months. These findings indicated that a higher level of NaCl was needed to de-passivate the steel, and to initiate and propagate the corrosion when type III cement was used. In other words, type III
28

cement would be able to increase the acceptable chloride ion limit as compared with type I cement. One of the reasons was that type III cement used in this study contained a higher percentage of C3A and C4AF, which bound the chloride and formed Fridel’s salts (3CaO.Al2O3.CaCl2.10H2O and 3CaO.Fe2O3.CaCl2.10H2O). The binding of chloride reduced the free chloride in the concrete pore solution, which in turn reduced the risk of corrosion. The chemically bound chloride played an important role in corrosion process especially when the total chloride in concrete was low. As the cast-in NaCl content increased to a high level (>1.5%), the effect of chloride binding was not obvious. That was why at high NaCl levels, there were no noticeable differences in the corrosion behaviors between specimens with type I cement and type III cement.
It can be concluded that the acceptable chloride ion limit for TDOT class P mix made with type III cement and 15% class F fly ash replacement for indoor exposure without wetting is 0.69% (equivalent to 1.0% cast-in NaCl) by weight of cementitious materials for both prestressing strand and rebar. Above this limit, significant corrosion may occur especially on strand. However, high limits may be used because no corrosion was active after 5 to 6 months exposure for both rebar and strand at a total chloride ion level from 0% to 1.9% (equivalent to 0% to 3.0% cast-in NaCl).
29

0 0.5 1 1.5 2 2.5 3Cast-in NaCl, %wt. cementitious
0.01
0.1
1
10
Corro
sion
rate
, mΑ/
cm2
0.0312317
0.2 0.4 0.6 0.8 1 1.2 1.4 1.6 1.8Total Cl-, %wt. cementitious
(a) Strand-room curing
Active corrosion
Time, months P mix type III cement F fly ash
0 0.5 1 1.5 2 2.5 3Cast-in NaCl, %wt. cementitious
0.01
0.1
1
10
Corro
sion
rate
, mΑ/
cm2
0.0312317
0.2 0.4 0.6 0.8 1 1.2 1.4 1.6 1.8Total Cl-, %wt. cementitious
(b) Rebar-room curing
Active corrosion
Time, months P mix type III cement F fly ash
0 0.5 1 1.5 2 2.5 3Cast-in NaCl, %wt. cementitious
-500
-400
-300
-200
-100
0
Corro
sion
pote
ntia
l, m
V
0.2 0.4 0.6 0.8 1 1.2 1.4 1.6 1.8Total Cl-, %wt. cementitious
0.0312317
(c) Strand-room curing
High risk
Uncertain
Low risk
Time, monthsP mix type III cement F fly ash
0 0.5 1 1.5 2 2.5 3Cast-in NaCl, %wt. cementitious
-500
-400
-300
-200
-100
0Co
rrosio
n po
tent
ial,
mV
0.2 0.4 0.6 0.8 1 1.2 1.4 1.6 1.8Total Cl-, %wt. cementitious
0.0312317
(d) Rebar-room curing
High risk
Uncertain
Low risk
Time, monthsP mix type III cement F fly ash
0 0.5 1 1.5 2 2.5 3Cast-in NaCl, %wt. cementitious
0
10
20
30
40
50
60
70
80
90
100
Corro
ded
area
, %
0.2 0.4 0.6 0.8 1 1.2 1.4 1.6 1.8Total Cl-, %wt. cementitious
(e) Strand-room curing
P mix type III cement F fly ash
0 0.5 1 1.5 2 2.5 3Cast-in NaCl, %wt. cementitious
0
10
20
30
40
50
60
70
80
90
100
Corro
ded
area
, %
0.2 0.4 0.6 0.8 1 1.2 1.4 1.6 1.8Total Cl-, %wt. cementitious
(f) Rebar-room curing
P mix type III cement F fly ash
Figure 4.1.2 Corrosion test results of air-curing specimens for TDOT class P mix with type III
cement and F fly ash
30

Type I Portland Cement + Class C Fly Ash One goal of this study was to investigate how different types of fly ash affected the corrosion of prestressing strand and rebar in concrete. Figure 4.1.3 presents the corrosion results of strand and rebar in concrete slabs made with class C fly ash. The concrete specimens and the exposure conditions in Figure 4.1.3 were exactly same as those in Figure 4.1.1 except that fly ash was different. Generally, the corrosion results illustrated in both figures look very similar, meaning that the type of fly ash did not cause great changes in the corrosion behaviors. However, there were some differences. For example, the use of class C fly ash reduced the corroded area of strand at low cast-in NaCl levels and significant corroded area only occurred on strand at high cast-in NaCl levels (>1.5% as shown in Figure 4.1.3e). For class F fly ash, considerable increase in corroded area was noted at relatively low cast-in NaCl content (>0.6% as shown in Figure 4.1.1e). These observations on corroded areas were further confirmed by the corrosion rate measurements. For specimens with class C fly ash, the corrosion rate became negligible after only 1 month exposure even at high cast-in NaCl contents (1.5% in Figure 4.1.3a). For specimens with class F fly ash, negligible corrosion rates only occurred at low cast-in NaCl content(0.6% or less as shown in Figure 4.1.1a) after 1 month exposure. In addition, all specimens with class C fly ash showed negligible corrosion rates after 3 months exposure. However, some of the specimens with class F fly ash still had active corrosion when the cast-in NaCl was high (>1.5%). It should be noted that at the beginning of test (0.03 months after mixing), the corrosion rates for specimens with class C and F fly ashes were similar. As described above, these initial corrosion rates did not truly reflect the rust formation, but a mixed effect of moisture, oxygen, pH, and concrete resistivity. It became evident that the use of class C fly ash to replace class F fly ash reduced the rust formation of strand at low cast-in NaCl levels. As a result, class C fly ash would aide in increasing the acceptable chloride ion limit in concrete. One reason was that the class C fly ash used in this study contained C3A, which would bind the chloride. Another reason was that the class F fly ash used in this study contained some background chloride (0.2% by weight of fly ash), but the background chloride content in class C fly ash was negligible. The use of class F fly ash would add extra chloride in concrete, which would also contribute to the corrosion process. It was interesting to note that the rust was first seen at the cast-in NaCl level of 0.4% when the class C fly ash was used (Figure 4.1.3e); while for the class F fly ash, visible rust first appeared at a chloride level of 0.6% (Figure 4.1.1e). The use of class C fly ash resulted in the initiation of corrosion at a lower cast-in NaCl level. Obviously, this occurrence could not be explained by the fact that class C fly ash did not contain a significant amount of chloride, but contained C3A, which was able to bind chloride. Although the exact reason for this discrepancy was unclear, it was the hypothesis of the investigators that other factors such as pH or the steel-concrete interface may affect the corrosion process. For example, the presence of air voids at the steel-concrete interface would facilitate the de-passivation of steel at those sites due to the lack of alkaline protection and relatively easy movement of moisture in empty spaces. It should also be noted that despite of the initiation of corrosion at the 0.4% cast-in NaCl level for the class C fly ash, the corrosion activity soon stopped because the corroded area remained very low throughout the exposure.
31
Similar results also occurred for rebars (Figure 4.1.3f vs. Figure 4.1.1f). However, due to the absence of moisture in an indoor exposure, the differences were not significant. The acceptable chloride ion limit for TDOT class P mix made with type I cement and 15% class C fly ash replacement when exposure to indoor environment without wetting could be 0.66% (equivalent to 1.0% cast-in NaCl) by weight of cementitious materials for prestressing strand and 0.96% (equivalent to 1.5% cast-in NaCl) for rebar. High limits may be used because active corrosion lasted for approximately 5 to 6 months at specimens with high chloride levels (such as 2-3% cast-in NaCl) and no corrosion was sustained due to the absence of moisture.
32

0 0.5 1 1.5 2 2.5 3Cast-in NaCl, %wt. cementitious
0.01
0.1
1
10
Corro
sion
rate
, mΑ/
cm2
0.0312317
0.2 0.4 0.6 0.8 1 1.2 1.4 1.6 1.8Total Cl-, %wt. cementitious
(a) Strand-room curing
Active corrosion
Time, months P mix type I cement C fly ash
0 0.5 1 1.5 2 2.5 3Cast-in NaCl, %wt. cementitious
0.01
0.1
1
10
Corro
sion
rate
, mΑ/
cm2
0.0312317
0.2 0.4 0.6 0.8 1 1.2 1.4 1.6 1.8Total Cl-, %wt. cementitious
(b) Rebar-room curing
Active corrosion
Time, months P mix type I cement C fly ash
0 0.5 1 1.5 2 2.5 3Cast-in NaCl, %wt. cementitious
-500
-400
-300
-200
-100
0
Corro
sion
pote
ntia
l, m
V
0.2 0.4 0.6 0.8 1 1.2 1.4 1.6 1.8Total Cl-, %wt. cementitious
0.0312317
(c) Strand-room curing
High risk
Uncertain
Low risk
Time, monthsP mix type I cement C fly ash
0 0.5 1 1.5 2 2.5 3Cast-in NaCl, %wt. cementitious
-500
-400
-300
-200
-100
0Co
rrosio
n po
tent
ial,
mV
0.2 0.4 0.6 0.8 1 1.2 1.4 1.6 1.8Total Cl-, %wt. cementitious
0.0312317
(d) Rebar-room curing
High risk
Uncertain
Low risk
Time, monthsP mix type I cement C fly ash
0 0.5 1 1.5 2 2.5 3Cast-in NaCl, %wt. cementitious
0
10
20
30
40
50
60
70
80
90
100
Corro
ded
area
, %
0.2 0.4 0.6 0.8 1 1.2 1.4 1.6 1.8Total Cl-, %wt. cementitious
(e) Strand-room curing
P mix type I cement C fly ash
0 0.5 1 1.5 2 2.5 3Cast-in NaCl, %wt. cementitious
0
10
20
30
40
50
60
70
80
90
100
Corro
ded
area
, %
0.2 0.4 0.6 0.8 1 1.2 1.4 1.6 1.8Total Cl-, %wt. cementitious
(f) Rebar-room curing
P mix type I cement C fly ash
Figure 4.1.3 Corrosion test results of air-curing specimens for TDOT class P mix with type I cement and C fly ash
33

Room-Curing vs. Field-Curing In this project, specimens were also prepared to study how the indoor exposure and the field exposure affected the corrosion of strand and rebar for TDOT class P mix. The materials, proportions, and specimen preparation procedures were exactly same. The only difference was the exposure condition. The following two sections summarized the main findings for these tests. Prestressing Strand Figure 4.1.4 illustrates the corrosion results of prestressing strands in concrete slabs subjected to field and indoor environments. Clearly, the field exposure exhibited much more corroded area on the strand than the indoor room exposure without wetting (Figure 4.1.4e vs. Figure 4.1.4f). This was because under the field exposure, moisture was readily available due to the wet/dry cycles as well as the bottom water absorption from the ground soil. This same conclusion can also be reached by analyzing the corrosion rate and corrosion potential results. With the same length of exposure and the same cast-in NaCl content, the field specimens always demonstrated a higher corrosion rate and a lower corrosion potential than indoor specimens. This again indicated that the field exposure would result in more corrosion activities and higher risks of corrosion for prestressing strand in the TDOT class P mix. The rust initiated on strand at a low cast-in NaCl content (0.2-0.6%) and a substantial amount of rust was observed at a cast-in NaCl level of 0.6%, indicating that the field exposure facilitated and accelerated the corrosion process of strand. It can be concluded that field exposure reduced the acceptable chloride ion limit of prestressing strand in TDOT class P mix.
34
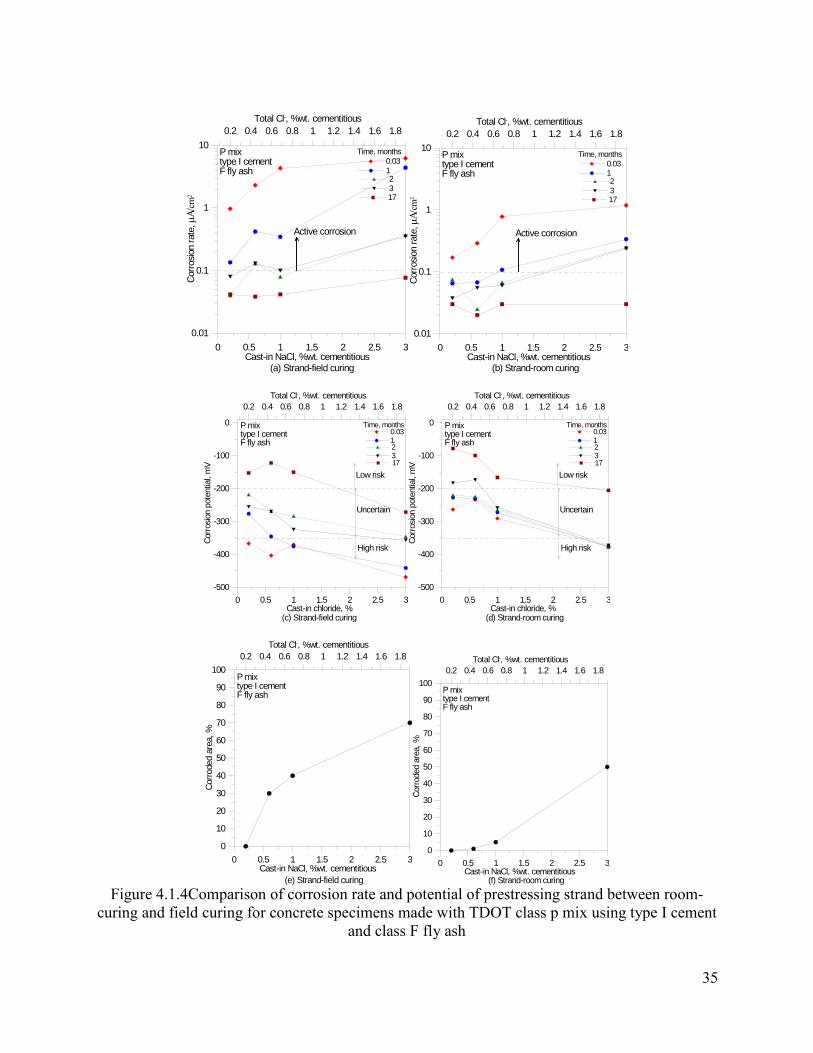
0 0.5 1 1.5 2 2.5 3Cast-in NaCl, %wt. cementitious
0.01
0.1
1
10
Corro
sion
rate
, mΑ/
cm2
0.2 0.4 0.6 0.8 1 1.2 1.4 1.6 1.8Total Cl-, %wt. cementitious
0.0312317
(a) Strand-field curing
Active corrosion
Time, monthsP mix type I cement F fly ash
0 0.5 1 1.5 2 2.5 3Cast-in NaCl, %wt. cementitious
0.01
0.1
1
10
Corro
sion
rate
, mΑ/
cm2
0.2 0.4 0.6 0.8 1 1.2 1.4 1.6 1.8Total Cl-, %wt. cementitious
0.0312317
(b) Strand-room curing
Active corrosion
Time, monthsP mix type I cement F fly ash
0 0.5 1 1.5 2 2.5 3Cast-in chloride, %
-500
-400
-300
-200
-100
0
Corro
sion
pote
ntia
l, m
V
0.2 0.4 0.6 0.8 1 1.2 1.4 1.6 1.8Total Cl-, %wt. cementitious
0.0312317
(c) Strand-field curing
High risk
Uncertain
Low risk
Time, monthsP mix type I cement F fly ash
0 0.5 1 1.5 2 2.5 3Cast-in chloride, %
-500
-400
-300
-200
-100
0Co
rrosio
n po
tent
ial,
mV
0.2 0.4 0.6 0.8 1 1.2 1.4 1.6 1.8Total Cl-, %wt. cementitious
0.0312317
(d) Strand-room curing
High risk
Uncertain
Low risk
Time, monthsP mix type I cement F fly ash
0 0.5 1 1.5 2 2.5 3Cast-in NaCl, %wt. cementitious
0
10
20
30
40
50
60
70
80
90
100
Corro
ded
area
, %
0.2 0.4 0.6 0.8 1 1.2 1.4 1.6 1.8Total Cl-, %wt. cementitious
(e) Strand-field curing
P mix type I cement F fly ash
0 0.5 1 1.5 2 2.5 3Cast-in NaCl, %wt. cementitious
0
10
20
30
40
50
60
70
80
90
100
Corro
ded
area
, %
0.2 0.4 0.6 0.8 1 1.2 1.4 1.6 1.8Total Cl-, %wt. cementitious
(f) Strand-room curing
P mix type I cement F fly ash
Figure 4.1.4Comparison of corrosion rate and potential of prestressing strand between room-
curing and field curing for concrete specimens made with TDOT class p mix using type I cement and class F fly ash
35

Conventional Rebar Figure 4.1.5 compares the corrosion results of rebar in concrete slabs that underwent the field and the indoor exposures respectively. Similarly, the field exposure caused higher corroded area on rebar than the indoor exposure (Figure 4.1.5e vs. Figure 4.1.5f). In addition, specimens exposed to the field constantly had higher corrosion rates (Figure 4.1.5a vs. Figure 4.1.5b) and lower corrosion potentials (Figure 4.1.5c vs. Figure 4.1.5d). This further proved that field exposure caused more corrosion activities as well as higher risk of corrosion. Specifically, for the specimen with 3% cast-in NaCl, the corrosion rate was always higher than 0.1 A/cm2 and the corrosion potential was always more negative than -350mV, indicating that a sustained corrosion process was developed on the rebar during the whole exposure (17 months). It can also be noticed that during the field exposure, the visible rust occurred on rebar at a cast-in NaCl content between 0.2% and 0.6% (Figure 4.1.5e), but during indoor exposure, the rust was first seen at a cast-in NaCl level of 0.8% (Figure 4.1.5f/Figure 4.1.1f). Therefore, the field exposure reduced the acceptable chloride ion limit of rebar for TDOT class P mix.
36
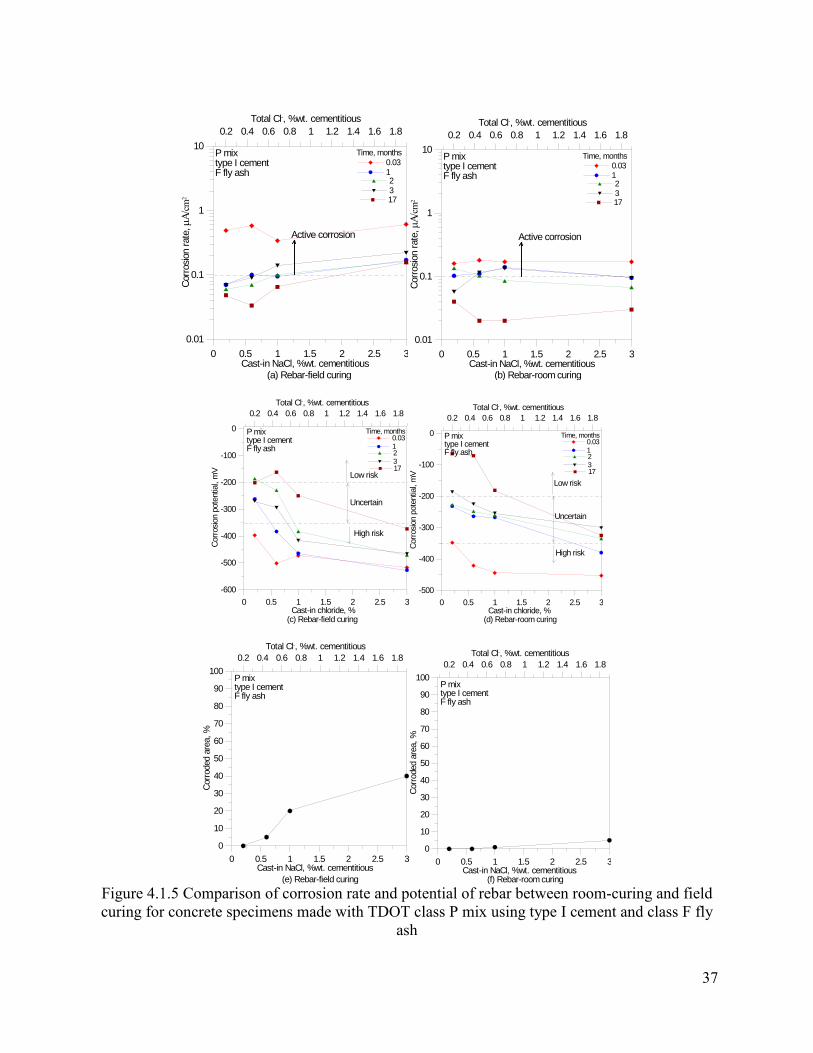
0 0.5 1 1.5 2 2.5 3Cast-in NaCl, %wt. cementitious
0.01
0.1
1
10
Corro
sion
rate
, mΑ/
cm2
0.2 0.4 0.6 0.8 1 1.2 1.4 1.6 1.8Total Cl-, %wt. cementitious
0.0312317
(a) Rebar-field curing
Active corrosion
Time, monthsP mix type I cement F fly ash
0 0.5 1 1.5 2 2.5 3Cast-in NaCl, %wt. cementitious
0.01
0.1
1
10
Corro
sion
rate
, mΑ/
cm2
0.2 0.4 0.6 0.8 1 1.2 1.4 1.6 1.8Total Cl-, %wt. cementitious
0.0312317
(b) Rebar-room curing
Active corrosion
Time, monthsP mix type I cement F fly ash
0 0.5 1 1.5 2 2.5 3Cast-in chloride, %
-600
-500
-400
-300
-200
-100
0
Corro
sion
pote
ntia
l, m
V
0.2 0.4 0.6 0.8 1 1.2 1.4 1.6 1.8Total Cl-, %wt. cementitious
0.0312317
(c) Rebar-field curing
High risk
Uncertain
Low risk
Time, monthsP mix type I cement F fly ash
0 0.5 1 1.5 2 2.5 3Cast-in chloride, %
-500
-400
-300
-200
-100
0
Corro
sion
pote
ntia
l, m
V0.2 0.4 0.6 0.8 1 1.2 1.4 1.6 1.8
Total Cl-, %wt. cementitious
0.0312317
(d) Rebar-room curing
High risk
Uncertain
Low risk
Time, monthsP mix type I cement F fly ash
0 0.5 1 1.5 2 2.5 3Cast-in NaCl, %wt. cementitious
0
10
20
30
40
50
60
70
80
90
100
Corro
ded
area
, %
0.2 0.4 0.6 0.8 1 1.2 1.4 1.6 1.8Total Cl-, %wt. cementitious
(e) Rebar-field curing
P mix type I cement F fly ash
0 0.5 1 1.5 2 2.5 3Cast-in NaCl, %wt. cementitious
0
10
20
30
40
50
60
70
80
90
100
Corro
ded
area
, %
0.2 0.4 0.6 0.8 1 1.2 1.4 1.6 1.8Total Cl-, %wt. cementitious
(f) Rebar-room curing
P mix type I cement F fly ash
Figure 4.1.5 Comparison of corrosion rate and potential of rebar between room-curing and field curing for concrete specimens made with TDOT class P mix using type I cement and class F fly
ash
37

4.1.2 TDOT Class D Mix and Indoor Exposure with Bottom Wetting The research work in this section investigated how moisture availability affected the acceptable chloride ion limit. Concrete slabs with type I cement and different cast-in NaCl contents (0-4%) following the TDOT class D mix proportion were seated in a pan and exposed to an indoor environment. Water was frequently supplied to the pan so that the bottom of concrete slabs was always contacted with water. The corrosion test results (corrosion rate, corrosion potential, and corroded area) for strand and rebar are summarized in Figure 4.1.6. After 12 months exposure, visual examination showed that both strand and rebar were substantially corroded as shown in Figures 4.1.6e and f. These visual observations also agreed well with corrosion rate measurements (Figure 4.1.6a and b) and corrosion potential measurements (Figures 4.1.6c and d). For prestressing strands, visible corrosion occurred at the cast-in NaCl content of 0.6% or above. Significant corrosion occurred when the cast-in NaCl was above 1%. Then, increasing the cast-in NaCl content would increase the corroded area of strand (Figure 4.1.6e). The results from corrosion rate and corrosion potential measurements also proved these findings. After 1 to 2 months exposure, the corrosion rates of strand quickly decreased to a negligible level when the cast-in NaCl was lower than 1%, indicating that the corrosion was inactive for these specimens. Likewise, the corrosion potential of specimens with the cast-in NaCl contents equal or less than 0.6% reduced to low risk region after 1 to 3 months exposure, implying that the strands were fully passivated. For specimens with high cast-in NaCl contents (>1.5%), all corrosion rates were almost above 0.1 µA/cm2 and all corrosion potentials were either in the high-risk region or the lower portion of uncertain region. This indicated that sustained corrosions may be established in the strands of these specimens during the exposure. That was why high corroded areas of strand were observed for these specimens. For rebar, no rust was observed at the cast-in NaCl content of 0.6%, but a noticeable area of rust was seen on rebar at the 1% cast-in NaCl level (Figure 4.1.6f). It was reasonable to propose that visible rust may first form at approximately 0.8% cast-in NaCl content. It was interesting to note that the highest corroded area occurred at the 2% cast-in NaCl content rather than 3% or 4%. This was also consistent with the corrosion rate and the corrosion potential measurements. Specimens with 2% cast-in NaCl content displayed a relatively high corrosion rate as well as more negative corrosion potential. In addition, for specimens with the cast-in NaCl above 1%, the corrosion rates were mostly above 0.1µA/cm2 and the corrosion potentials were all in the high-risk region. This suggested that sustained corrosion activities developed in these specimens during the exposure. It can be concluded that for the indoor exposure with bottom wetting, the initiation of corrosion was similar to that of indoor exposure without wetting; however, the extent of corrosion was different especially for rebar. Continuous moisture supply (wetting) sustained the corrosion activities. Therefore, the acceptable chloride ion limit for TDOT class D mix exposed to indoor environment with wetting could be 0.67% (equivalent to 1.0% cast-in NaCl) by the weight of cementitious materials for strand and 0.43% (equivalent to 0.6% cast-in NaCl) for rebar. Sustained corrosion activities would develop when the total chloride ion content exceeded these limits.
38

0 0.5 1 1.5 2 2.5 3 3.5 4Cast-in NaCl, %wt. cementitious
0.01
0.1
1
10
Corro
sion
rate
, mΑ/
cm2
0.2 0.4 0.6 0.8 1 1.2 1.4 1.6 1.8 2 2.2 2.4Total Cl-, %wt. cementitious
0.031236912
(a) Strand-room curing with wetting
Active corrosion
Time, months D mix type I cement
0 0.5 1 1.5 2 2.5 3 3.5 4Cast-in NaCl, %wt. cementitious
0.01
0.1
1
10
Corro
sion
rate
, mΑ/
cm2
0.2 0.4 0.6 0.8 1 1.2 1.4 1.6 1.8 2 2.2 2.4Total Cl-, %wt. cementitious
0.031236912
(b) Rebar-room curing with wetting
Active corrosion
Time, months D mix type I cement
0 0.5 1 1.5 2 2.5 3 3.5 4Cast-in NaCl, %wt. cementitious
-500
-400
-300
-200
-100
0
Corro
sion
pote
ntia
l, m
V
0.2 0.4 0.6 0.8 1 1.2 1.4 1.6 1.8 2 2.2 2.4Total Cl-, %wt. cementitious
0.031236912
(c) Strand-room curing with wetting
Low risk
Time, months
Uncertain
High risk
D mix type I cement
0 0.5 1 1.5 2 2.5 3 3.5 4Cast-in NaCl, %wt. cementitious
-600
-500
-400
-300
-200
-100
0Co
rrosio
n po
tent
ial,
mV
0.2 0.4 0.6 0.8 1 1.2 1.4 1.6 1.8 2 2.2 2.4Total Cl-, %wt. cementitious
0.031236912
(d) Rebar-room curing with wetting
Low risk
Time, months
Uncertain
High risk
D mix type I cement
0 0.5 1 1.5 2 2.5 3 3.5 4Cast-in NaCl, %wt. cementitious
0
10
20
30
40
50
60
70
80
90
100
Corro
ded
area
, %
0.2 0.4 0.6 0.8 1 1.2 1.4 1.6 1.8 2 2.2 2.4Total Cl-, %wt. cementitious
(e) Strand-room curing with wetting
D mix type I cement
0 0.5 1 1.5 2 2.5 3 3.5 4Cast-in NaCl, %wt. cementitious
0
10
20
30
40
50
60
70
80
90
100
Corro
ded
area
, %
0.2 0.4 0.6 0.8 1 1.2 1.4 1.6 1.8 2 2.2 2.4Total Cl-, %wt. cementitious
(f) Rebar-room curing with wetting
D mix type I cement
Figure 4.1.6 Corrosion test results of room-curing specimens with bottom water supply for TDOT class D mix with type I cement
39

4.1.3 TDOT Class D Mix and Field Exposure One main goal of this project was to determine the acceptable chloride ion limit in typical transportation structures in Tennessee. To achieve this goal, specimens were prepared using TDOT class D mix and then exposed to the field environment. As compared with indoor environment, field exposure typically involved wet/dry cycles as well as daily and seasonal temperature changes, which may influenced the corrosion activities of steel.
Type I Cement Concrete slabs with type I cement following TDOT class D mix proportions were prepared and exposed to the field environment for 12 months. Figure 4.1.7 presents the corrosion test results for both the prestressing strand and the rebar. Similarly, visible rust was first detected on both strand and rebar at a cast-in NaCl level between 0.6% and 1.0% (Figures 4.1.7e and f). For specimens with cast-in NaCl equal or less than 0.6%, the corrosion rates of strand and rebar rapidly dropped below 0.1µA/cm2 and corrosion potentials of strand and rebar were at the low-risk region after 1 to 2 months exposure. These suggested that corrosion was negligible and steel was passivated. Conversely, at high cast-in NaCl contents such as 3 to 4%, the corrosion rate of strand and rebar was mostly above 0.1µA/cm2 and the corrosion potential was at either high risk or uncertain region, meaning that a sustained corrosion process took place.
Additionally, the corrosion rate and the corrosion potential results for outdoor exposure (Figure 4.1.7) significantly changed with time. However, for indoor exposure with wetting (Figure 4.1.6), relatively small variations were observed as the time elapsed. In fact, all specimens in Figures 4.1.6 and 4.1.7 had the same materials and proportions, and were prepared with the same procedures. This different result can only be attributable to the exposure condition. One reason was that the indoor exposure with wetting (Figure 4.1.6) had relatively constant room temperature and continuous moisture supply; but under outdoor environment (Figure 4.1.7), temperature changed daily and seasonally, and the moisture varied with wet/dry cycles of the weather, which would cause fluctuations in the corrosion activities.
The acceptable chloride ion limit for TDOT class D mix made with type I cement and exposed to outdoor environment could be 0.97% (equivalent to 1.5% cast-in NaCl) by the weight of cementitious materials for strand and 0.43% (equivalent to 0.6% cast-in NaCl) for rebar. Above these limits, substantial corrosion would occur and sustained corrosion activities would develop.
40

0 0.5 1 1.5 2 2.5 3 3.5 4Cast-in NaCl, %wt. cementitious
0.01
0.1
1
10
Corro
sion
rate
, mΑ/
cm2
0.2 0.4 0.6 0.8 1 1.2 1.4 1.6 1.8 2 2.2 2.4Total Cl-, %wt. cementitious
0.031236912
(a) Strand-field curing
Active corrosion
Time, months D mix type I cement
0 0.5 1 1.5 2 2.5 3 3.5 4Cast-in NaCl, %wt. cementitious
0.01
0.1
1
10
Corro
sion
rate
, mΑ/
cm2
0.2 0.4 0.6 0.8 1 1.2 1.4 1.6 1.8 2 2.2 2.4Total Cl-, %wt. cementitious
0.031236912
(b) Rebar-field curing
Active corrosion
Time, months D mix type I cement
0 0.5 1 1.5 2 2.5 3 3.5 4Cast-in NaCl, %wt. cementitious
-500
-400
-300
-200
-100
0
Corro
sion
pote
ntia
l, m
V
0.2 0.4 0.6 0.8 1 1.2 1.4 1.6 1.8 2 2.2 2.4Total Cl-, %wt. cementitious
0.031236912
(c) Strand-field curing
Low risk
Time, months
Uncertain
High risk
D mix type I cement
0 0.5 1 1.5 2 2.5 3 3.5 4Cast-in NaCl, %wt. cementitious
-600
-500
-400
-300
-200
-100
0
Corro
sion
pote
ntia
l, m
V
0.2 0.4 0.6 0.8 1 1.2 1.4 1.6 1.8 2 2.2 2.4Total Cl-, %wt. cementitious
0.031236912
(d) Rebar-field curing
Low risk
Time, months
Uncertain
High risk
D mix type I cement
0 0.5 1 1.5 2 2.5 3 3.5 4Cast-in NaCl, %wt. cementitious
0
10
20
30
40
50
60
70
80
90
100
Corro
ded
area
, %
0.2 0.4 0.6 0.8 1 1.2 1.4 1.6 1.8 2 2.2 2.4Total Cl-, %wt. cementitious
(e) Strand-field curing
D mix type I cement
0 0.5 1 1.5 2 2.5 3 3.5 4Cast-in NaCl, %wt. cementitious
0
10
20
30
40
50
60
70
80
90
100
Corro
ded
area
, %
0.2 0.4 0.6 0.8 1 1.2 1.4 1.6 1.8 2 2.2 2.4Total Cl-, %wt. cementitious
(f) Rebar-field curing
D mix type I cement
Figure 4.1.7 Corrosion test results of field-exposure specimens for TDOT class D mix with type
I cement
41

Type I Cement + Class F Fly Ash This research investigated the effect of class F fly ash on the corrosion of strand and rebar in an outdoor environment. Figure 4.1.8 summarizes the corrosion test results for both strand and rebar. As compared with Figure 4.1.7, materials and proportions used in preparing the concrete slabs were similar except that class F fly ash (20%wt.) was used to partially replace the type I cement. In addition, longer strand and rebar were used in Figure 4.1.7 so that they were able to extend 1 to 2 inches to the outside of concrete slab for corrosion measurements. In Figure 4.1.8, relative shorter strand and rebar were employed and they were fully contained in the concrete slabs. Stainless steel wires were used to extend the steel to the outside of slab for corrosion measurements. From Figures 4.1.8 e and f, rust initiated on both strand and rebar at a cast-in NaCl content of 0.6%. As the cast-in NaCl increased to 1% or above, substantial corroded areas were developed on both strand and rebar. From Figures 4.1.8a and b, the corrosion soon became inactive when the cast-in NaCl was equal or less than 0.6% because the corrosion rates of both strand and rebar rapidly dropped to a negligible level within a month. Equally, the steel shortly returned to its passive state in concrete slabs with cast-in NaCl equal or less than 0.6% because the corrosion potentials of these specimens quickly increased to the low risk region or the upper portion of uncertain region (Figures 4.1.8c and d). These results agreed with the visual examination, in which no rust appeared on specimens with the cast-in NaCl equal or less than 0.6%. However, at high cast-in NaCl levels (more than 1%), specimens displayed active corrosion for at least 2 to 3 months (i.e. the corrosion rates were above the active level). They also demonstrated a medium to high risk of corrosion for the same period because the corrosion potentials were mostly in the high-risk region or at least at the lower portion of uncertain region. After 6 months exposure, all corrosion rates reduced to the negligible level (less than 0.1µA/cm2) and all corrosion potentials were located at the low-risk region or the upper portion of uncertain region. This indicated that the corrosion was either inactive or less likely even for specimens with a high cast-in NaCl content such as 3%. This meant that no sustained corrosion had developed due to the use of class F fly ash. The reduction in corrosion was in conflict with the facts that the class F fly ash in this study contained 0.2%wt chloride and the use of fly ash was likely to reduce the pH value of concrete. These would increase the risk of corrosion. However, the use of F fly ash was able to reduce the permeability of concrete because of pozzolanic reaction, which restricted the supply of moisture and oxygen, leading to the reduction or stop of corrosion. Another interesting note in this test was that the rust primarily formed at the two ends of steel particularly for rebar. In other tests (e.g. Figure 4.1.7), in which strand or rebar directly extended to the outside of concrete slab, rust typically appeared randomly on the steel. The exact reason was unknown. It was the hypothesis of the investigator that the stainless steel wires might facilitate the corrosion process of strand and rebar because the stainless steel contained other metals such as Ni and Cr. These metals were less active than iron. The presence of these metals may cause dissimilar metal corrosion, which promoted the rust formation. A more conservative value of 0.46% by weight of cementitious materials could be proposed as the acceptable chloride ion limit for both strand and rebar in TDOT class D mix with class F fly
42
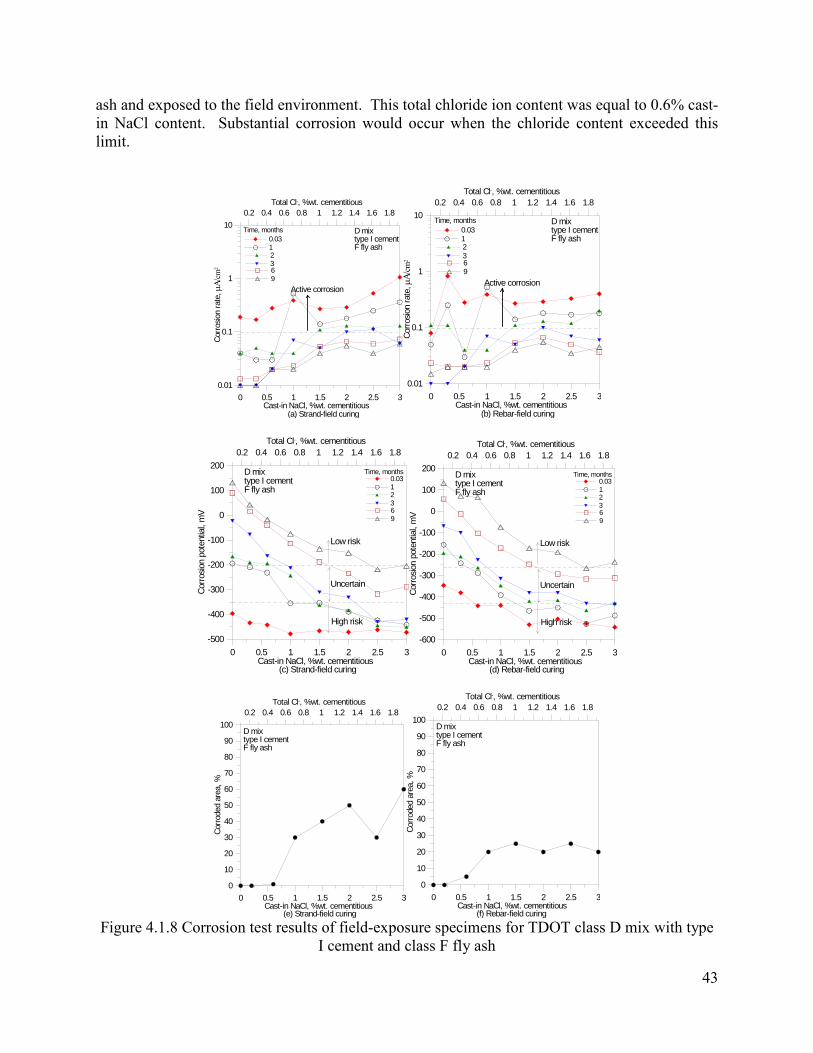
ash and exposed to the field environment. This total chloride ion content was equal to 0.6% cast-in NaCl content. Substantial corrosion would occur when the chloride content exceeded this limit.
0 0.5 1 1.5 2 2.5 3Cast-in NaCl, %wt. cementitious
0.01
0.1
1
10Co
rrosio
n ra
te, mΑ/
cm2
0.2 0.4 0.6 0.8 1 1.2 1.4 1.6 1.8Total Cl-, %wt. cementitious
0.0312369
(a) Strand-field curing
Active corrosion
Time, months D mix type I cementF fly ash
0 0.5 1 1.5 2 2.5 3Cast-in NaCl, %wt. cementitious
0.01
0.1
1
10
Corro
sion
rate
, mΑ/
cm2
0.2 0.4 0.6 0.8 1 1.2 1.4 1.6 1.8Total Cl-, %wt. cementitious
0.0312369
(b) Rebar-field curing
Active corrosion
Time, months D mix type I cementF fly ash
0 0.5 1 1.5 2 2.5 3Cast-in NaCl, %wt. cementitious
-500
-400
-300
-200
-100
0
100
200
Corro
sion
pote
ntia
l, m
V
0.2 0.4 0.6 0.8 1 1.2 1.4 1.6 1.8Total Cl-, %wt. cementitious
0.0312369
(c) Strand-field curing
Low risk
Time, months
Uncertain
High risk
D mix type I cementF fly ash
0 0.5 1 1.5 2 2.5 3Cast-in NaCl, %wt. cementitious
-600
-500
-400
-300
-200
-100
0
100
200
Corro
sion
pote
ntia
l, m
V
0.2 0.4 0.6 0.8 1 1.2 1.4 1.6 1.8Total Cl-, %wt. cementitious
0.0312369
(d) Rebar-field curing
Low risk
Time, months
Uncertain
High risk
D mix type I cementF fly ash
0 0.5 1 1.5 2 2.5 3Cast-in NaCl, %wt. cementitious
0
10
20
30
40
50
60
70
80
90
100
Corro
ded
area
, %
0.2 0.4 0.6 0.8 1 1.2 1.4 1.6 1.8Total Cl-, %wt. cementitious
(e) Strand-field curing
D mix type I cementF fly ash
0 0.5 1 1.5 2 2.5 3Cast-in NaCl, %wt. cementitious
0
10
20
30
40
50
60
70
80
90
100
Corro
ded
area
, %
0.2 0.4 0.6 0.8 1 1.2 1.4 1.6 1.8Total Cl-, %wt. cementitious
(f) Rebar-field curing
D mix type I cementF fly ash
Figure 4.1.8 Corrosion test results of field-exposure specimens for TDOT class D mix with type
I cement and class F fly ash
43
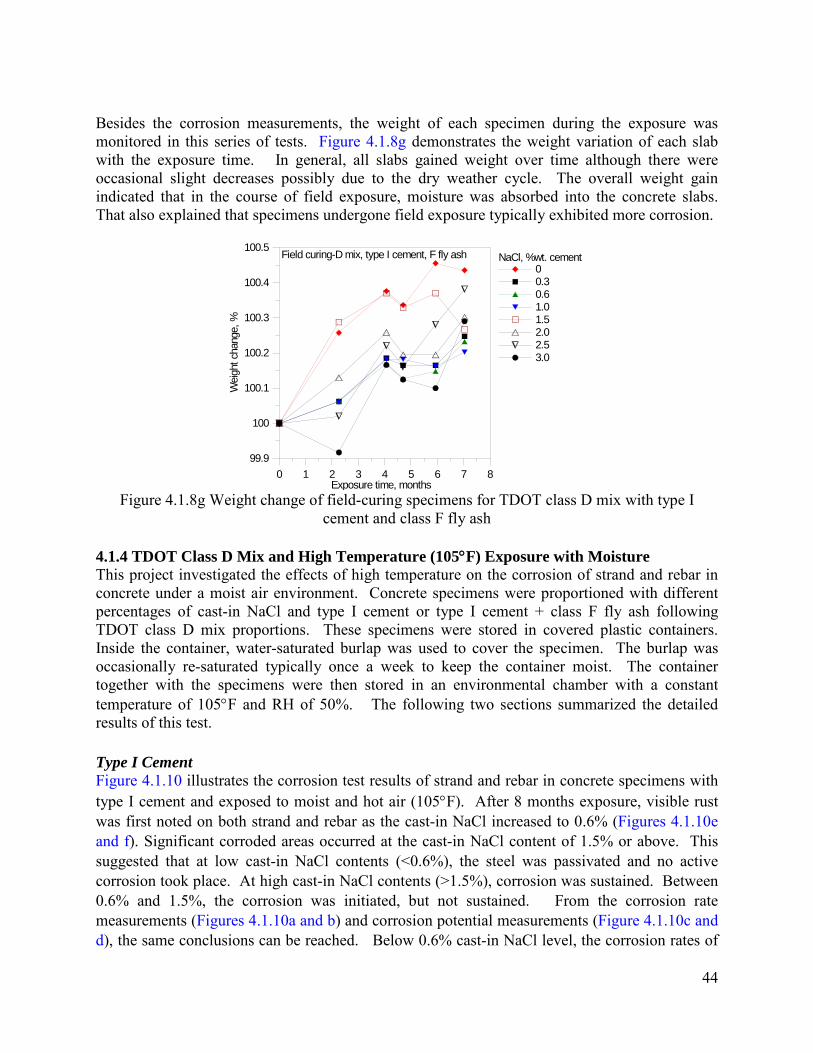
Besides the corrosion measurements, the weight of each specimen during the exposure was monitored in this series of tests. Figure 4.1.8g demonstrates the weight variation of each slab with the exposure time. In general, all slabs gained weight over time although there were occasional slight decreases possibly due to the dry weather cycle. The overall weight gain indicated that in the course of field exposure, moisture was absorbed into the concrete slabs. That also explained that specimens undergone field exposure typically exhibited more corrosion.
0 1 2 3 4 5 6 7 8Exposure time, months
99.9
100
100.1
100.2
100.3
100.4
100.5W
eigh
t cha
nge,
%
NaCl, %wt. cement00.30.61.01.52.02.53.0
Field curing-D mix, type I cement, F fly ash
Figure 4.1.8g Weight change of field-curing specimens for TDOT class D mix with type I
cement and class F fly ash 4.1.4 TDOT Class D Mix and High Temperature (105°F) Exposure with Moisture This project investigated the effects of high temperature on the corrosion of strand and rebar in concrete under a moist air environment. Concrete specimens were proportioned with different percentages of cast-in NaCl and type I cement or type I cement + class F fly ash following TDOT class D mix proportions. These specimens were stored in covered plastic containers. Inside the container, water-saturated burlap was used to cover the specimen. The burlap was occasionally re-saturated typically once a week to keep the container moist. The container together with the specimens were then stored in an environmental chamber with a constant temperature of 105°F and RH of 50%. The following two sections summarized the detailed results of this test. Type I Cement Figure 4.1.10 illustrates the corrosion test results of strand and rebar in concrete specimens with type I cement and exposed to moist and hot air (105°F). After 8 months exposure, visible rust was first noted on both strand and rebar as the cast-in NaCl increased to 0.6% (Figures 4.1.10e and f). Significant corroded areas occurred at the cast-in NaCl content of 1.5% or above. This suggested that at low cast-in NaCl contents (<0.6%), the steel was passivated and no active corrosion took place. At high cast-in NaCl contents (>1.5%), corrosion was sustained. Between 0.6% and 1.5%, the corrosion was initiated, but not sustained. From the corrosion rate measurements (Figures 4.1.10a and b) and corrosion potential measurements (Figure 4.1.10c and d), the same conclusions can be reached. Below 0.6% cast-in NaCl level, the corrosion rates of
44

both strand and rebar reduced to a negligible level (<0.1µA/cm2) within a month, which confirmed that corrosion shortly became inactive. Similarly, the corrosion potentials of both strand and rebar rapidly increased to the low risk region (more positive than -200mV) when the cast-in NaCl was below 0.6%, meaning that the steel soon became passivated. Above 1.5% cast-in NaCl level, the corrosion rates of strand and rebar were mostly at the active corrosion region and corrosion potentials of strand and rebar were primarily at the high-risk region, indicating that sustained corrosion might occur. Between 0.6% and 1.5% cast-in NaCl levels, the corrosion rates were at the active corrosion region at the early age (1-3 months), but later they reduced to the negligible level. This indicated that corrosion started, but did not continue. Likewise, the corrosion potentials were at the high-risk region within a couple of months, but they then increased to uncertain or low-risk regions meaning that corrosion either stopped or became undecided.
As compared with the findings from indoor or outdoor exposures, it seemed that high temperature did not significantly influence the acceptable chloride ion limit in concrete, but the passivation of steel occurred earlier. This may be attributable to the accelerated hydration reaction because of the high temperature, which generated more calcium hydroxide at the early age, thus promoting the early passivation of steel. In addition, it seemed that high temperature did not significantly increased the rust formation or corroded area of both strand and rebar even after 8 months exposure. It was surprising because high temperature was able to accelerate both anodic and cathodic reactions as well as promote the mobility of both oxygen and water. However, the test result did not reflect such facts. One plausible explanation was that the controlling factor for the corrosion in this study was the permeability of concrete. The TDOT class D mix itself had low permeability due to its low W/Cm. High temperature enabled the concrete to achieve its low permeability at an earlier time. The low permeability limited the movement of moisture and oxygen, thus limiting the corrosion activities.
Apparently, the acceptable chloride ion limit can be proposed as 0.67% (equivalent to 1.0% cast-in NaCl) for both strand and rebar used in the TDOT class D mix with only type I cement and exposed to the hot and moist environment.
45

0 0.5 1 1.5 2 2.5 3 3.5 4Cast-in NaCl, %wt. cementitious
0.01
0.1
1
10
Corro
sion
rate
, mΑ/
cm2
0.2 0.4 0.6 0.8 1 1.2 1.4 1.6 1.8 2 2.2 2.4Total Cl-, %wt. cementitious
0.03123468
(a) Strand-high temp. air curing
Active corrosion
Time, months D mix type I cement
0 0.5 1 1.5 2 2.5 3 3.5 4Cast-in NaCl, %wt. cementitious
0.01
0.1
1
10
Corro
sion
rate
, mΑ/
cm2
0.2 0.4 0.6 0.8 1 1.2 1.4 1.6 1.8 2 2.2 2.4Total Cl-, %wt. cementitious
0.03123468
(b) Rebar-high temp. air curing
Active corrosion
Time, months D mix type I cement
0 0.5 1 1.5 2 2.5 3 3.5 4Cast-in NaCl, %wt. cementitious
-600
-500
-400
-300
-200
-100
0
Corro
sion
pote
ntia
l, m
V
0.2 0.4 0.6 0.8 1 1.2 1.4 1.6 1.8 2 2.2 2.4Total Cl-, %wt. cementitious
0.03123468
(c) Strand-high temp. air curing
Low risk
Time, months
Uncertain
High risk
D mix type I cement
0 0.5 1 1.5 2 2.5 3 3.5 4Cast-in NaCl, %wt. cementitious
-600
-500
-400
-300
-200
-100
0Co
rrosio
n po
tent
ial,
mV
0.2 0.4 0.6 0.8 1 1.2 1.4 1.6 1.8 2 2.2 2.4Total Cl-, %wt. cementitious
0.03123468
(d) Rebar-high temp. air curing
Low risk
Time, months
Uncertain
High risk
D mix type I cement
0 0.5 1 1.5 2 2.5 3 3.5 4Cast-in NaCl, %wt. cementitious
0
10
20
30
40
50
60
70
80
90
100
Corro
ded
area
, %
0.2 0.4 0.6 0.8 1 1.2 1.4 1.6 1.8 2 2.2 2.4Total Cl-, %wt. cementitious
(e) Strand-high temp. air curing
D mix type I cement
0 0.5 1 1.5 2 2.5 3 3.5 4Cast-in NaCl, %wt. cementitious
0
10
20
30
40
50
60
70
80
90
100
Corro
ded
area
, %
0.2 0.4 0.6 0.8 1 1.2 1.4 1.6 1.8 2 2.2 2.4Total Cl-, %wt. cementitious
(f) Rebar-high temp. air curing
D mix type I cement
Figure 4.1.9 Corrosion test results of high temperature air-curing specimens for TDOT class D
mix with type I cement
46
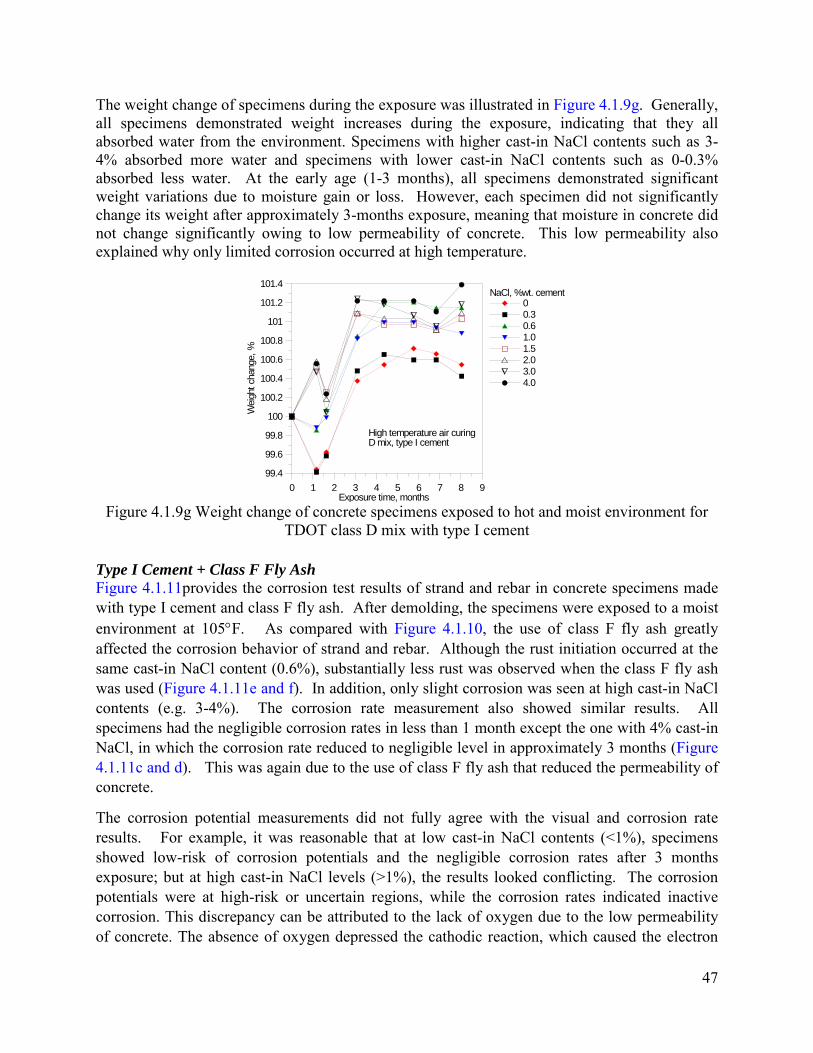
The weight change of specimens during the exposure was illustrated in Figure 4.1.9g. Generally, all specimens demonstrated weight increases during the exposure, indicating that they all absorbed water from the environment. Specimens with higher cast-in NaCl contents such as 3-4% absorbed more water and specimens with lower cast-in NaCl contents such as 0-0.3% absorbed less water. At the early age (1-3 months), all specimens demonstrated significant weight variations due to moisture gain or loss. However, each specimen did not significantly change its weight after approximately 3-months exposure, meaning that moisture in concrete did not change significantly owing to low permeability of concrete. This low permeability also explained why only limited corrosion occurred at high temperature.
0 1 2 3 4 5 6 7 8 9Exposure time, months
99.4
99.6
99.8
100
100.2
100.4
100.6
100.8
101
101.2
101.4
Wei
ght c
hang
e, %
NaCl, %wt. cement00.30.61.01.52.03.04.0
High temperature air curingD mix, type I cement
Figure 4.1.9g Weight change of concrete specimens exposed to hot and moist environment for
TDOT class D mix with type I cement
Type I Cement + Class F Fly Ash Figure 4.1.11provides the corrosion test results of strand and rebar in concrete specimens made with type I cement and class F fly ash. After demolding, the specimens were exposed to a moist environment at 105°F. As compared with Figure 4.1.10, the use of class F fly ash greatly affected the corrosion behavior of strand and rebar. Although the rust initiation occurred at the same cast-in NaCl content (0.6%), substantially less rust was observed when the class F fly ash was used (Figure 4.1.11e and f). In addition, only slight corrosion was seen at high cast-in NaCl contents (e.g. 3-4%). The corrosion rate measurement also showed similar results. All specimens had the negligible corrosion rates in less than 1 month except the one with 4% cast-in NaCl, in which the corrosion rate reduced to negligible level in approximately 3 months (Figure 4.1.11c and d). This was again due to the use of class F fly ash that reduced the permeability of concrete.
The corrosion potential measurements did not fully agree with the visual and corrosion rate results. For example, it was reasonable that at low cast-in NaCl contents (<1%), specimens showed low-risk of corrosion potentials and the negligible corrosion rates after 3 months exposure; but at high cast-in NaCl levels (>1%), the results looked conflicting. The corrosion potentials were at high-risk or uncertain regions, while the corrosion rates indicated inactive corrosion. This discrepancy can be attributed to the lack of oxygen due to the low permeability of concrete. The absence of oxygen depressed the cathodic reaction, which caused the electron
47

buildup leading to more negative potentials. The electron buildup would in turn restrain the anodic reaction, leading to the reduction or stop of corrosion process.
It was again reasonable to recommend that the acceptable chloride ion limit was 0.46% for both strand and rebar in the TDOT class D mix with type I cement and F fly ash and exposed to a hot (105°F) and moist environment.
48
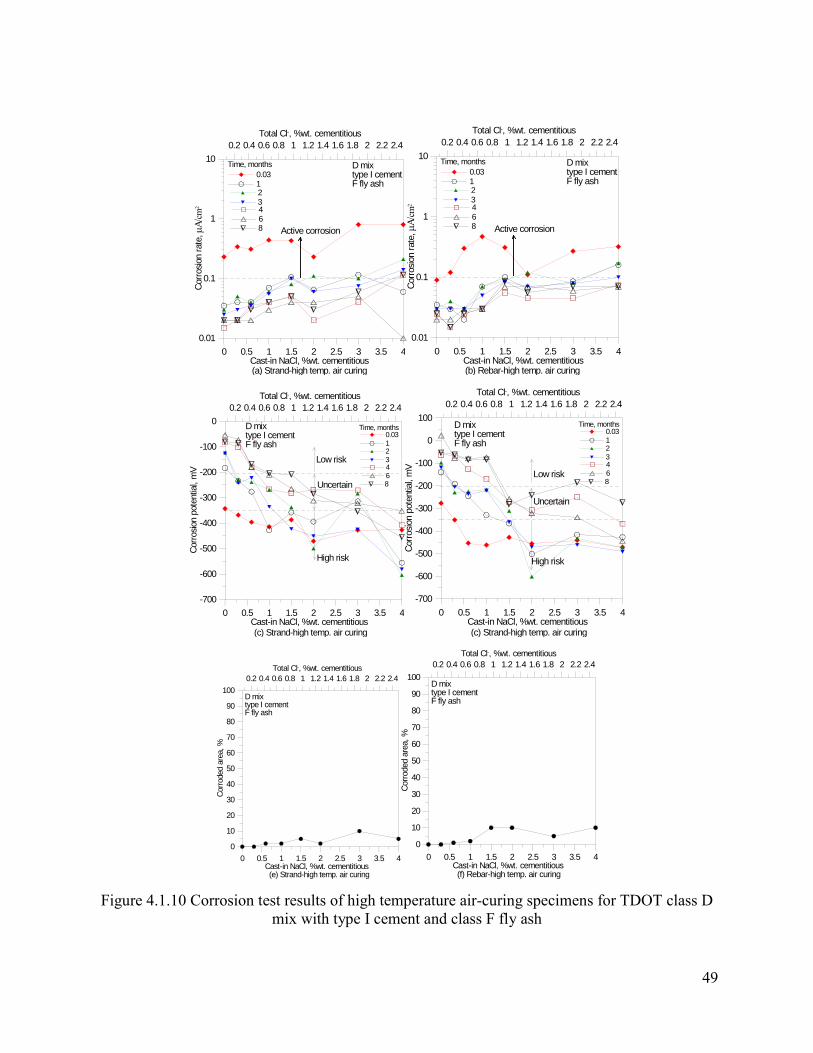
0 0.5 1 1.5 2 2.5 3 3.5 4Cast-in NaCl, %wt. cementitious
0.01
0.1
1
10
Corro
sion
rate
, mΑ/
cm2
0.2 0.4 0.6 0.8 1 1.2 1.4 1.6 1.8 2 2.2 2.4Total Cl-, %wt. cementitious
0.03123468
(a) Strand-high temp. air curing
Active corrosion
Time, months D mix type I cementF fly ash
0 0.5 1 1.5 2 2.5 3 3.5 4Cast-in NaCl, %wt. cementitious
0.01
0.1
1
10
Corro
sion
rate
, mΑ/
cm2
0.2 0.4 0.6 0.8 1 1.2 1.4 1.6 1.8 2 2.2 2.4Total Cl-, %wt. cementitious
0.03123468
(b) Rebar-high temp. air curing
Active corrosion
Time, months D mix type I cementF fly ash
0 0.5 1 1.5 2 2.5 3 3.5 4Cast-in NaCl, %wt. cementitious
-700
-600
-500
-400
-300
-200
-100
0
Corro
sion
pote
ntia
l, m
V
0.2 0.4 0.6 0.8 1 1.2 1.4 1.6 1.8 2 2.2 2.4Total Cl-, %wt. cementitious
0.03123468
(c) Strand-high temp. air curing
Low risk
Time, months
Uncertain
High risk
D mix type I cementF fly ash
0 0.5 1 1.5 2 2.5 3 3.5 4Cast-in NaCl, %wt. cementitious
-700
-600
-500
-400
-300
-200
-100
0
100Co
rrosio
n po
tent
ial,
mV
0.2 0.4 0.6 0.8 1 1.2 1.4 1.6 1.8 2 2.2 2.4Total Cl-, %wt. cementitious
0.03123468
(c) Strand-high temp. air curing
Low risk
Time, months
Uncertain
High risk
D mix type I cementF fly ash
0 0.5 1 1.5 2 2.5 3 3.5 4Cast-in NaCl, %wt. cementitious
0
10
20
30
40
50
60
70
80
90
100
Corro
ded
area
, %
0.2 0.4 0.6 0.8 1 1.2 1.4 1.6 1.8 2 2.2 2.4Total Cl-, %wt. cementitious
(e) Strand-high temp. air curing
D mix type I cementF fly ash
0 0.5 1 1.5 2 2.5 3 3.5 4Cast-in NaCl, %wt. cementitious
0
10
20
30
40
50
60
70
80
90
100
Corro
ded
area
, %
0.2 0.4 0.6 0.8 1 1.2 1.4 1.6 1.8 2 2.2 2.4Total Cl-, %wt. cementitious
(f) Rebar-high temp. air curing
D mix type I cementF fly ash
Figure 4.1.10 Corrosion test results of high temperature air-curing specimens for TDOT class D mix with type I cement and class F fly ash
49

Figure 4.1.10g presents the weight gain of all specimens during the exposure. Again, all specimens demonstrated overall weight gain, indicating that moisture was absorbed into the specimens. More moisture was absorbed into specimens with higher cast-in NaCl contents such as 3-4%; while less water was absorbed into specimens with lower cast-in NaCl contents such as 0-0.3%. At the early exposure (1-3 months), there was a significant weight change for all specimens due to moisture gain or loss in response to the wet/dry cycles of burlap and high permeability of early-age concrete. After approximately 3-months exposure, all specimens demonstrated slight weight change due to water-tightness of concrete. The water-tightness also restricted the corrosion activities even at high temperature. This also agreed with the corrosion rate measurement and the visual examination result. Almost all specimens exhibited low or negligible corrosion rates after 3 months exposure. No corrosion activities seemed sustained because all specimens displayed low corroded area without pitting after 8 months exposure.
0 1 2 3 4 5 6 7 8Exposure time, months
100
100.2
100.4
100.6
100.8
101
101.2
Wei
ght c
hang
e, %
NaCl, %wt. cementitious00.30.61.01.52.03.04.0
High temperature air curingD mix, type I cement, F fly ash
Figure 4.1.10g Weight gain of specimens exposed to hot and moist environment for TDOT class
D mix with type I cement and class F fly ash
4.1.5 TDOT Class D Mix and High-Temperature Salt-Solution Immersion Concrete specimens were prepared using different percentages of cast-in NaCl and type I cement or type I cement + class F fly ash following TDOT class D mix proportion. These specimens were stored in covered plastic containers filled with 3%wt. NaCl solution, and then placed in an environmental chamber with a constant temperature of 105°F and RH of 50%. The detailed results are summarized in the following two sections. Type I Cement The corrosion test results for strand and rebar in concrete specimens with different cast-in NaCl and 3%wt. NaCl solution immersion at105°F are provided in Figure 4.1.11. Interestingly, all specimens including those with high cast-in NaCl contents showed very slight corrosion (Figures 4.1.11e and f). This implied that the corrosion may initiate, but stop or proceed with very low (negligible) rates. This may be associated with the lack of oxygen at the steel-concrete interface as the oxygen diffusion through the solution and saturated concrete was very slow. The poor supply of oxygen due to the immersion dramatically slowed down the cathodic reaction, resulting in negligible corrosion. Without the sufficient advance of cathodic reaction, electrons were likely to accumulate on steel, causing more negative potentials. This was further proved by
50

the corrosion potential measurements (Figures 4.1.11c and d), in which all specimens exhibited very high negative corrosion potentials during the exposure. This slight corrosion was also in agreement with the corrosion rate measurements especially for rebar (Figure 4.1.11b). For example, almost all rebars showed very low corrosion rates after 1-month exposure. Interestingly, the corrosion rates of strand appeared contradictory, in which specimens with high cast-in NaCl contents constantly exhibited active corrosion during the whole exposure. Obviously, this high corrosion rate did not agree with the negligible rust formation. It may be due to a combined effect of high moisture and low concrete resistivity, similar to the measurement at the very early age (24 hours after mixing).
Due to external chloride supply, the rust even appeared on specimens with no cast-in NaCl. However, no sustained corrosion occurred on all specimens. As a result, the acceptable chloride ion limit could not be recommended for such exposure. A practical implication of this study is that for under-water structures such as the submerged parts of river or marine structures, the acceptable chloride ion limit can be substantially increased or become less important because the corrosion in such applications would be insignificant due to the lack of oxygen.
51

0 0.5 1 1.5 2 2.5 3 3.5 4Cast-in NaCl, %wt. cementitious
0.01
0.1
1
10
Corro
sion
rate
, mΑ/
cm2
0.2 0.4 0.6 0.8 1 1.2 1.4 1.6 1.8 2 2.2 2.4Total Cl-, %wt. cementitious
0.03123468
(a) Strand-immersion with 3%NaCl solution
Active corrosion
Time, months D mix type I cement
0 0.5 1 1.5 2 2.5 3 3.5 4Cast-in NaCl, %wt. cementitious
0.01
0.1
1
10
Corro
sion
rate
, mΑ/
cm2
0.2 0.4 0.6 0.8 1 1.2 1.4 1.6 1.8 2 2.2 2.4Total Cl-, %wt. cementitious
0.03123468
(b) Rebar-immersion with 3%NaCl solution
Active corrosion
Time, months D mix type I cement
0 0.5 1 1.5 2 2.5 3 3.5 4Cast-in NaCl, %wt. cementitious
-1000
-900
-800
-700
-600
-500
-400
-300
-200
-100
0
Corro
sion
pote
ntia
l, m
V
0.2 0.4 0.6 0.8 1 1.2 1.4 1.6 1.8 2 2.2 2.4Total Cl-, %wt. cementitious
0.03123468
(c) Strand-immersion with 3% NaCl solution
Low risk
Time, months
Uncertain
High risk
D mix type I cement
0 0.5 1 1.5 2 2.5 3 3.5 4Cast-in NaCl, %wt. cementitious
-600
-500
-400
-300
-200
-100
0
Corro
sion
pote
ntia
l, m
V0.2 0.4 0.6 0.8 1 1.2 1.4 1.6 1.8 2 2.2 2.4
Total Cl-, %wt. cementitious
0.03123468
(d) Rebar-immersion with 3% NaCl solution
Low risk
Time, months
Uncertain
High risk
D mix type I cement
0 0.5 1 1.5 2 2.5 3 3.5 4Cast-in NaCl, %wt. cementitious
0
10
20
30
40
50
60
70
80
90
100
Corro
ded
area
, %
0.2 0.4 0.6 0.8 1 1.2 1.4 1.6 1.8 2 2.2 2.4Total Cl-, %wt. cementitious
(e) Strand-immersion with 3% NaCl solution
D mix type I cement
0 0.5 1 1.5 2 2.5 3 3.5 4Cast-in NaCl, %wt. cementitious
0
10
20
30
40
50
60
70
80
90
100
Corro
ded
area
, %
0.2 0.4 0.6 0.8 1 1.2 1.4 1.6 1.8 2 2.2 2.4Total Cl-, %wt. cementitious
(f) Rebar-immersion with 3% NaCl solution
D mix type I cement
Figure 4.1.11 Corrosion test results of high temperature salt water-curing specimens for TDOT
class D mix with type I cement
52

Figure 4.1.11g shows the weight change of all specimens during the immersion in chloride solution. It can be seen that the chloride solution was continuous absorbed into concrete during the first 3 months. After 3 months exposure, the absorption became very slow possibly because the concrete was near saturation. Again, specimens with high cast-in NaCl contents absorbed more solution and specimens with low cast-in NaCl contents absorbed less solution. As the specimens became more and more saturated, the oxygen would become less and less available, and corrosion would become less and less active.
0 1 2 3 4 5 6 7 8 9Exposure time, months
100
100.2
100.4
100.6
100.8
101
101.2
101.4
101.6
Wei
ght c
hang
e, %
NaCl, %wt. cement00.30.61.01.52.03.04.0
High temperature 3% Cl- solution immersionD mix, type I cement
Figure 4.1.11g Weight change of high-temperature salt water-immersion specimens for TDOT
class D mix with type I cement
Type I Cement and Class F Fly Ash Figure 4.1.12 summarizes the corrosion test results for strand and rebar. The materials and proportions, the specimen preparation, and the exposure condition were exactly same as compared with those in Figure 4.1.11 except that 20% class F fly ash was used to partially replace type I cement. Visible rust was hardly detected on all strands even at high cast-in NaCl contents (Figure 4.1.12e). This observation again verified that the use of class F fly ash was able to further reduce the corrosion. This was because corroded areas can be observed on strand when only type I cement was used (Figure 4.1.11e). For rebar, similar results were found and the effect of class F fly ash was not obvious (Figure 4.1.12f). Again, due to the poor availability of oxygen as a consequence of immersion, all specimens demonstrated negligible corrosion rates (Figures 4.1.12a and b) and high negative corrosion potentials (Figures 4.1.12c and d). The acceptable chloride ion limit was not applicable for this exposure condition.
53

0 0.5 1 1.5 2 2.5 3 3.5 4Cast-in NaCl, %wt. cementitious
0.01
0.1
1
10
Corro
sion
rate
, mΑ/
cm2
0.2 0.4 0.6 0.8 1 1.2 1.4 1.6 1.8 2 2.2 2.4Total Cl-, %wt. cementitious
0.03123468
(a) Strand-immersion with 3% NaCl solution
Active corrosion
Time, months D mix type I cementF fly ash
0 0.5 1 1.5 2 2.5 3 3.5 4Cast-in NaCl, %wt. cementitious
0.01
0.1
1
10
Corro
sion
rate
, mΑ/
cm2
0.2 0.4 0.6 0.8 1 1.2 1.4 1.6 1.8 2 2.2 2.4Total Cl-, %wt. cementitious
0.03123468
(b) Rebar-immersion with 3% NaCl solution
Active corrosion
Time, months D mix type I cementF fly ash
0 0.5 1 1.5 2 2.5 3 3.5 4Cast-in NaCl, %wt. cementitious
-900
-800
-700
-600
-500
-400
-300
-200
-100
0
Corro
sion
pote
ntia
l, m
V
0.2 0.4 0.6 0.8 1 1.2 1.4 1.6 1.8 2 2.2 2.4Total Cl-, %wt. cementitious
0.03123468
(c) Strand-immersion with 3% NaCl solution
Low risk
Time, months
Uncertain
High risk
D mix type I cementF fly ash
0 0.5 1 1.5 2 2.5 3 3.5 4Cast-in NaCl, %wt. cementitious
-800
-700
-600
-500
-400
-300
-200
-100
0
Corro
sion
pote
ntia
l, m
V
0.2 0.4 0.6 0.8 1 1.2 1.4 1.6 1.8 2 2.2 2.4Total Cl-, %wt. cementitious
0.03123468
(d) Rebar-immersion with 3% NaCl solution
Low risk
Time, months
Uncertain
High risk
D mix type I cementF fly ash
0 0.5 1 1.5 2 2.5 3 3.5 4Cast-in NaCl, %wt. cementitious
0
10
20
30
40
50
60
70
80
90
100
Corro
ded
area
, %
0.2 0.4 0.6 0.8 1 1.2 1.4 1.6 1.8 2 2.2 2.4Total Cl-, %wt. cementitious
(e) Strand-immersion with 3% NaCl solution
D mix type I cementF fly ash
0 0.5 1 1.5 2 2.5 3 3.5 4Cast-in NaCl, %wt. cementitious
0
10
20
30
40
50
60
70
80
90
100
Corro
ded
area
, %
0.2 0.4 0.6 0.8 1 1.2 1.4 1.6 1.8 2 2.2 2.4Total Cl-, %wt. cementitious
(f) Rebar-immersion with 3% NaCl solution
D mix type I cementF fly ash
Figure 4.1.12 Corrosion test results of high temperature salt water-curing specimens for TDOT
class D mix with type I cement and class F fly ash
Figure 4.1.12g illustrates the weight change of concrete specimens with type I cement and class F fly ash during the exposure with chloride solution immersion. Again, the chloride solution
54

was quickly absorbed into concrete during the first 3 months. Then, the absorption became very slow indicating that the concrete was near saturation. Again, high absorption occurred on specimens with high cast-in NaCl contents. For specimens with low cast-in NaCl contents, the total absorption was relatively low. An increase in the saturation level led to the poor oxygen supply and less corrosion activities.
0 1 2 3 4 5 6 7 8Exposure time, months
100
100.2
100.4
100.6
100.8
101
101.2
101.4
101.6
Wei
ght c
hang
e, %
NaCl, %wt. cementitious00.30.61.01.52.03.04.0
High temperature 3% Cl- solution immersionD mix, type I cement, F fly ash
Figure 4.1.12g Weight change of high-temperature salt water-immersion specimens for TDOT
class D mix with type I cement and class F fly ash
4.1.6 Effects of Niagara Escarpment (High-Chloride) Aggregates on Corrosion The effect of high chloride aggregates on corrosion was investigated in this research and the results are illustrated in Figures 4.1.13 to 4.1.15. In general, there was no clear trend on whether or not the use of Niagara Escarpment aggregates would cause higher risks of corrosion. It appeared that at a low cast-in NaCl content (e.g. 0.6%) and the field exposure, the Niagara Escarpment aggregates slightly increased the corroded area (Figure 4.1.13). However, this finding was only based on limited specimens and more research may be needed to verify this result. It was interesting to note that at a high cast-in NaCl content (e.g. 2%) and the room exposure with wetting (i.e. bottom absorption), the use of normal aggregates resulted in more corroded area. This indicated that other factors such as permeability of concrete other than aggregates might play more roles that were important to the corrosion process.
55

0
5
10
15
20
25
30
Corro
ded
area
, %
0.6%NaCl 2.0%NaCl 0.6%NaCl 2.0%NaCl
NormalAgg.
High Cl-Agg. Normal
Agg.
Strand
Room exposure w/ wetting Field exposure
NormalAgg.
NormalAgg.
High Cl-Agg.
High Cl-Agg.
High Cl-Agg.
0
5
10
15
20
25
30
Corro
ded
area
, %
0.6%NaCl 2.0%NaCl 0.6%NaCl 2.0%NaCl
NormalAgg.
High Cl-Agg.
NormalAgg.
Rebar
Room exposure w/ wetting Field exposure
NormalAgg.
NormalAgg.
High Cl-Agg.
High Cl-Agg.
High Cl-Agg.
(a) Prestressing strand (b) Rebar
Figure 4.1.13 Corroded area of prestressing strand and rebar in concrete with different aggregates
The results from visual examination (corroded area) agreed well with the corrosion rate measurements as shown in Figure 4.1.14. At a low cast-in NaCl content (0.6% in Figures 4.1.14 a and b), specimens with high-chloride aggregate under field exposure exhibited relatively higher corrosion rates. At a high cast-in NaCl content (2% in Figures 4.1.14 c and d), specimens with normal aggregates under room exposure displayed averagely higher corrosion rates.
56

0 2 4 6 8 10 12Exposure time, months
0.01
0.1
1
10
Corro
sion
rate
, mΑ/
cm2
Normal agg.-field curingHigh Chloride agg.-field curingNormal agg.-room curingHigh chloride agg.-room curing
(a) Strand-0.6%wt. NaCl
Active corrosion
0 2 4 6 8 10 12Exposure time, months
0.01
0.1
1
10
Corro
sion
rate
, mΑ/
cm2
Normal agg.-field curingHigh Chloride agg.-field curingNormal agg.-room curingHigh chloride agg.-room curing
(b) Rebar-0.6%wt. NaCl
Active corrosion
0 2 4 6 8 10 12Exposure time, months
0.01
0.1
1
10
Corro
sion
rate
, mΑ/
cm2
Normal agg.-field curingHigh Chloride agg.-field curingNormal agg.-room curingHigh chloride agg.-room curing
(c) Strand-2.0%wt. NaCl
Active corrosion
0 2 4 6 8 10 12Exposure time, months
0.01
0.1
1
10
Corro
sion
rate
, mΑ/
cm2
Normal agg.-field curingHigh Chloride agg.-field curingNormal agg.-room curingHigh chloride agg.-room curing
(d) Rebar-2.0%wt. NaCl
Active corrosion
Figure 4.1.14 Corrosion rate of TDOT class D mix with different types of aggregates
Figure 4.1.15 showed the results for the corrosion potential measurements for specimens with different types of aggregates. Again, high-chloride aggregates did not demonstrate higher risks of corrosion. However, at a high cast-in NaCl content (2% in Figures 4.1.15 c and d), specimens with normal aggregates under room exposure with wetting showed relatively more negative potentials, meaning that they had higher risks of corrosion.
57

0 2 4 6 8 10 12Exposure time, months
-500
-400
-300
-200
-100
0Co
rrosio
n po
tent
ial,
mV
Normal agg.-field curingHigh Chloride agg.-field curingNormal agg.-room curingHigh chloride agg.-room curing
(a) Strand-0.6%wt. NaCl
Low risk
High risk
Uncertain
0 2 4 6 8 10 12Exposure time, months
-500
-400
-300
-200
-100
0
Corro
sion
pote
ntia
l, m
V
Normal agg.-field curingHigh Chloride agg.-field curingNormal agg.-room curingHigh chloride agg.-room curing
(b) Rebar-0.6%wt. NaCl
Low risk
High risk
Uncertain
0 2 4 6 8 10 12Exposure time, months
-500
-400
-300
-200
-100
0
Corro
sion
pote
ntia
l, m
V
Normal agg.-field curingHigh Chloride agg.-field curingNormal agg.-room curingHigh chloride agg.-room curing
(c) Strand-2.0%wt. NaCl
Low risk
High risk
Uncertain
0 2 4 6 8 10 12Exposure time, months
-500
-400
-300
-200
-100
0
Corro
sion
pote
ntia
l, m
V
Normal agg.-field curingHigh Chloride agg.-field curingNormal agg.-room curingHigh chloride agg.-room curing
(d) Rebar-2.0%wt. NaCl
Low risk
High risk
Uncertain
Figure 4.1.15 Corrosion potential of TDOT class D mix with different types of aggregates
4.1.7 Indoor Exposure Specimens with Stressed Prestressing Strand and Top Wet/Dry Cycles In this section, the research work mainly focused on investigating the corrosion behavior of stressed prestressing strand and comparing how it differed from those of unstressed prestressing strand and rebar. Each test specimen consisted of a stressed strand, an unstressed strand, and a rebar. They were all embedded in a concrete mixture with type I cement, class C fly ash, and different percentages of cast-in NaCl (0 to 4% by weight of cementitious materials) following the TDOT class D mix proportion. All specimens were then exposed to an indoor environment with approximately a 7-days wet and 7-days dry cycle through water ponding. The corrosion test
58
results (corrosion rate, corrosion potential, and corroded area) for the stressed strand, unstressed strand, and rebar are summarized in Figure 4.1.16. After 9-months exposure, visual examination showed that visible rust occurred on almost all specimens including those with low or no cast-in NaCl contents as shown in Figures 4.1.16 g to i. However, significant rust formation took place when the cast-in NaCl was equal or higher than 0.6% for both unstressed prestressing strand and rebar, which was similar to the results observed in the above sections. Surprisingly, visible rust (tiny patches) initiated at the surface of both rebar and unstressed strand at very low (0.3%) or no cast-in NaCl contents. One possible reason was that in the preparation of central portion of the specimen, the fresh concrete had a relatively low workability (1-2” slump) and only rodding was used to consolidate the concrete. Vibration was not used because the closely spaced steel in the central portion did not allow for internal vibration, while the external vibration table was not applicable due to the heavy weight of whole specimen. As a result, entrapped air voids or gap may occur at the steel and concrete interface. The presence of oxygen and moisture as well as the lack of alkali (paste) protection at the voids at the early age facilitated the initiation of corrosion, but the corrosion was not sustained due to the lack of continuous supply of oxygen and water. For stressed prestressing strand, it appeared that at the same cast-in NaCl level, more rusted areas were observed as compared with unstressed prestressing strand and rebar, indicating that the stressed prestressing strand was more susceptible to corrosion. Similarly, significant increase in corroded area occurred on the stressed prestressing strand when the cast-in NaCl was high than 0.6%. In particular, approximately 5% of corroded areas were noted on the stressed prestressing strand at very low (0.3%) or no cast-in NaCl contents. This was unreasonable and did not occur on unstressed strand and rebar in this study. One reason was that these rusts may come from the pre-existing rusts on the stressed strand (as can be noticed in Figure 3.3e in the section 3.2.3 in this study). Patches of slight rusting were formed before the casting of central portion of specimen (as shown in Figures 3.3 a to d) when the stressed strand was exposed to air without the protection of concrete during the placing, curing, transportation, and storage of the base concrete slab. Typically, these pre-existing rusts would disappear after the strand was fully covered with concrete because the alkali in concrete would help to restore the passive film of steel. In the present work, some of this pre-existing rust may be remained due to the presence of voids at the strand-concrete interface resulting from the lack of vibration. This explanation also agreed with the visual observation, in which some rusted areas on these strands did not have old concrete paste adhesion at these areas, implying the presence of gaps or voids at these pre-rusting places. It is felt by the investigators that more research may be needed to further verify these observations. In addition, the corrosion rate and potential measurements provided supplemental information on the corrosion development in unstressed strand, stressed strand, and rebar (Figure 4.1.16). For unstressed strand, active corrosion occur at the early age (1 month) on specimens with cast-in NaCl contents of 0.6% or above (Figure 4.1.16a). After 2 months exposure, the corrosion became inactive for specimens with cast-in NaCl contents of less than 2%, indicating that corrosion was not sustained. After 6 months exposure, active corrosion was detected on specimens with high cast-in NaCl contents (>2%), meaning that the corrosion on these specimens was sustained. Similarly, specimens with low cast-in NaCl contents (<1%) exhibited low risk of corrosion after 1 month exposure based on the corrosion potential measurements
59

(Figures 4.1.16d). Possible or high risk of corrosion might take place after 6 months exposure on specimens with high cast-in NaCl contents (>2%). This also agreed with the results from the visual examination, in which rust area increased substantially and severe pitting was developed as the cast-in NaCl increased to 2%. For stressed prestressing strand, specimens with cast-in NaCl contents equal or greater than 0.3% showed active corrosion at the early age (1 month) and corrosion on the control specimen (0% cast-in NaCl) was inactive (Figures 4.1.16e). After 2 to 3 months exposure, specimens with cast-in NaCl contents equal or less than 0.6% showed inactive corrosion, meaning that corrosion was not sustained at low cast-in NaCl levels (0.3 and 0.6%). After 6 months exposure, active corrosion was detected on specimens with cast-in NaCl equal or greater than 2%, implying that these specimens had sustained corrosion. The corrosion rate measurement was roughly in agreement with the visual examination, in which high rust area and severe pitting (sustained corrosion) were observed. Unexpectedly, the stressed prestressing strands exhibited less negative potentials as compared with the unstressed prestressing strand (Figure 4.1.16e vs.Figure 4.1.16d), indicating that the stressed strand had less risk of corrosion at the same chloride level. This was opposite to the corrosion rate measurement and the visual examination. Although the exact reason for this discrepancy was unclear, one plausible explanation could be that the stressed strand in this study was much longer than that of unstressed strand (36” vs. 10.5”). The length of strand may affect the potential. For the rebar, active corrosion was detected on all specimens at the early age (1 month) (Figure 4.16c). Specimens with very low or no cast-in NaCl (0 to 0.3%) showed active corrosion at the early age due to again the presence of voids at the concrete-rebar interface, but these corrosion soon stopped (within a month) because the moisture and oxygen at the voids were consumed. After 2 to 3 months exposure, active corrosion only occurred at specimens with cast-in NaCl contents greater than 1%. After 5 to 7 months exposure, active corrosion possibly took place at specimens with high cast-in NaCl contents (≥2%), indicating that sustained corrosion may occur on these specimens. These results agreed fairly well with the visual observations. For example, tiny patches of rust (<1%) were seen on rebar surfaces for specimens with 0% and 0.3% cast-in NaCl contents, but they were so small and may not truly be caused by chloride. Noticeable rust (>5% in corroded area) were observed, which corresponded to a longer corrosion activities (agreed with 2 to 3 months active corrosion detected by the corrosion rate measurement). Relatively high rust area (15-20%) was noted on the rebar surface when the cast-in NaCl was equal or greater than 2%. Particularly, localized pit corrosion was seen on the rebar in these specimens. This agreed with the corrosion rate measurement, in which active corrosion was detected after 5 months exposure in specimens with cast-in NaCl contents of 2% or above, indicating that possible sustained corrosion occurred in these specimens. The corrosion potential measurement (Figure 3.1.16f) also confirmed this observation. For example, the corrosion potentials for specimens with high cast-in NaCl contents (≥ 2%) were still in the high-risk or uncertain regions after 5 months exposure.
Based on the results in this section, the acceptable chloride ion limit for rebar and unstressed strand can be 0.43% by the weight of cementitious materials, which was equivalent to 0.6% of cast-in NaCl content. For stressed prestressing strand, a lower chloride ion limit such as 0.24% (equivalent to 0.3% cast-in NaCl) may be used.
60

0 0.5 1 1.5 2 2.5 3 3.5 4Cast-in NaCl, %wt. cementitious
0.01
0.1
1
10
Corro
sion
rate
, mΑ/
cm2
0.2 0.4 0.6 0.8 1 1.2 1.4 1.6 1.8 2 2.2 2.4Total Cl-, %wt. cementitious
0.13123579
(a) Unstressed strand
Active corrosion
Time, months D mix type I cement+C fly ash
0 0.5 1 1.5 2 2.5 3 3.5 4Cast-in NaCl, %wt. cementitious
0.01
0.1
1
10
Corro
sion
rate
, mΑ/
cm2
0.2 0.4 0.6 0.8 1 1.2 1.4 1.6 1.8 2 2.2 2.4Total Cl-, %wt. cementitious
0.13123579
(b) Stressed strand
Active corrosion
Time, months D mix type I cement+C fly ash
0 0.5 1 1.5 2 2.5 3 3.5 4Cast-in NaCl, %wt. cementitious
0.01
0.1
1
10
Corro
sion
rate
, mΑ/
cm2
0.2 0.4 0.6 0.8 1 1.2 1.4 1.6 1.8 2 2.2 2.4Total Cl-, %wt. cementitious
0.13123579
(c) Rebar
Active corrosion
Time, months D mix type I cement+C fly ash
0 0.5 1 1.5 2 2.5 3 3.5 4Cast-in NaCl, %wt. cementitious
-500
-400
-300
-200
-100
0
100
Corro
sion
pote
ntia
l, m
V
0.2 0.4 0.6 0.8 1 1.2 1.4 1.6 1.8 2 2.2 2.4Total Cl-, %wt. cementitious
0.13123579
(d) Unstressed strand
Low risk
Time, monthsD mix type I cement+C fly ash
High risk
Uncertain
0 0.5 1 1.5 2 2.5 3 3.5 4Cast-in NaCl, %wt. cementitious
-600
-500
-400
-300
-200
-100
0
100
Corro
sion
pote
ntia
l, m
V
0.2 0.4 0.6 0.8 1 1.2 1.4 1.6 1.8 2 2.2 2.4Total Cl-, %wt. cementitious
0.13123579
(e) Stressed strand
Low risk
Time, monthsD mix type I cement+C fly ash
High risk
Uncertain
0 0.5 1 1.5 2 2.5 3 3.5 4Cast-in NaCl, %wt. cementitious
-600
-500
-400
-300
-200
-100
0
100
Corro
sion
pote
ntia
l, m
V
0.2 0.4 0.6 0.8 1 1.2 1.4 1.6 1.8 2 2.2 2.4Total Cl-, %wt. cementitious
0.13123579
(f) Rebar
Low risk
Time, monthsD mix type I cement+C fly ash
High risk
Uncertain
0 0.5 1 1.5 2 2.5 3 3.5 4Cast-in NaCl, %wt. cementitious
0
10
20
30
40
50
60
70
80
90
100
Corro
ded
area
, %
0.2 0.4 0.6 0.8 1 1.2 1.4 1.6 1.8 2 2.2 2.4Total Cl-, %wt. cementitious
(g) Unstressed strand
D mix type I cementC fly ash
0 0.5 1 1.5 2 2.5 3 3.5 4Cast-in NaCl, %wt. cementitious
0
10
20
30
40
50
60
70
80
90
100
Corro
ded
area
, %
0.2 0.4 0.6 0.8 1 1.2 1.4 1.6 1.8 2 2.2 2.4Total Cl-, %wt. cementitious
(h) Stressed strand
D mix type I cementC fly ash
0 0.5 1 1.5 2 2.5 3 3.5 4Cast-in NaCl, %wt. cementitious
0
10
20
30
40
50
60
70
80
90
100
Corro
ded
area
, %
0.2 0.4 0.6 0.8 1 1.2 1.4 1.6 1.8 2 2.2 2.4Total Cl-, %wt. cementitious
(I) Rebar
D mix type I cementC fly ash
Figure 4.1.16 Corrosion test results of specimens with stressed prestressing strand for TDOT
class D mix with type I cement and class C fly ash
61

4.2 Chloride Assessment in Constituent Materials of Concrete The chloride contents in all ingredient materials used in this study were evaluated using ASTM C1218 (water-soluble) and ASTM C1152 (acid-soluble) methods. In addition, the chloride content in coarse aggregate was measured using ASTM C1524 (Soxhlet) method. The results are summarized in Table 4.2.1. Clearly, the chloride content determined by acid-soluble method was higher than that by water-soluble and Soxhlet methods. It can also be noted that the SEFA class F fly ash contained the highest chloride content (0.2%wt.) in this study, most of which was water-soluble chloride. The chloride contents in both high-chloride coarse and fine aggregates were higher than those in normal limestone and sand, but all values were low (<0.083%). The chloride contents in both coarse aggregates determined by Soxhlet method were the lowest. Table 4.2.1 Chloride contents in ingredient materials of concrete
Ingredient materials Acid-soluble chloride, %
Water-soluble chloride, %
Soxhlet chloride, %
Buzzi type III 0.018 0.0011 Holcim type III 0.017 0.012 Holcim type I 0.017 0.013 Class C fly ash 0.01 0.003 Class F fly ash 0.20 0.181 Niagara Escarpment Coarse Agg. 0.053 0.04 0.004 Niagara Escarpment Sand 0.083 0.026 Limestone Coarse Agg. 0.011 0.003 0.002 Natural River Sand 0.002 0.001 4.3 Chloride Determination in Concretes Using ASTM Test Methods The background chloride from the ingredient materials would contribute to the total chloride content in concrete. In the present work, the background chloride was calculated from the materials and proportions that were used in this study. The background chloride was approximately 0.079% by weight of cementitious materials when 15% class F fly ash was used as a replacement of cement, or 0.051% for 15% class C fly ash replacement. Concrete samples were selected from the slabs with different cementitious materials and cast-in NaCl contents. The first series of tests involved the use of concrete slabs with type I cement and 15% class F fly ash replacement to prepare the samples (I-F1 to I-F4). Each sample had a cast-in NaCl content of 0.05%, 0.8%, 1.5%, and 3.0% by weight of cementitious materials respectively, which was equivalent to an added chloride ion content of 0.03%, 0.49%, 0.91%, and 1.82% by weight of cementitious materials. The second series of tests (III-F1 to III-F2) used the concrete slabs with type III cement and 15% class F fly ash replacement. The cast-in NaCl content or the equivalent added chloride ion content was same as that in the first series. In the third series (I-C1 to I-C4), concrete slabs with type I cement and 15% class C fly ash replacement were used in preparing the samples and the added chloride ion contents in these samples were same as those in the first and the second series. The total chloride content by weight of cementitious materials was calculated by summarizing the added chloride ion (calculated from the cast-in NaCl) and the background chloride ion from ingredient materials. The acid-soluble and water-soluble chloride contents in each sample were determined following the procedures described in ASTM C1152
62

and ASTM C1218 respectively. For each sample, the acid-soluble and water-soluble chlorides were measured two times and the average value was used for the data analysis in this study. In addition, the Soxhlet method (ASTM C1254) was performed on concrete in the first series to evaluate the water-extractable chloride content in concrete. Table 4.3.2 summarizes all the results from both the calculation and the tests. The acid-soluble chloride was close to the total chloride with the ratio of acid-soluble over total being close to 1.0, indicating that the acid-soluble test can be a relatively reliable method to assess the total chloride content in concrete. However, there were some deviations especially when the chloride content in concrete was very low (e.g. 0.1%). A lower ratio (acid-soluble over total) less than 1.0 may indicate that some chlorides were permanently bound to the hydration products such as C-S-H gel and not released after the addition of nitric acid. A higher ratio more than 1.0 may be attributed to the heterogeneity of concrete. Although cautions were taken during the sampling, it would be impossible to attain a uniform sample that perfectly represented the average composition of concrete particularly in the presence of coarse aggregate. For example, when the sample contained a slightly higher paste content than the average of concrete, the acid-soluble chloride would be higher than the total chloride calculated with the assumption of homogeneous concrete. Water-soluble chloride increased with an increase in the total chloride content in concrete. Averagely, the water-soluble chloride was approximately 60% of the total chloride. However, this ratio changed with the total chloride content in concrete as well as the types of cementitious materials. The ratio increased as the total chloride in concrete increased, meaning that at a high chloride content, more portions of this chloride were able to dissolve into water and less portions of this chloride would bond to the hydration products. This was more obvious when the type I cement together with class F fly ash replacement was used; while it was less obvious when the class C fly ash was used. Similarly, the water-extractable chloride determined by the Soxhlet method also increased as the total chloride in concrete increased. On average, approximately 55% of total chloride in concrete can be extracted using the Soxhlet method, which was slightly lower than that using the water-soluble method (60%). It appeared that the ratio of water-extractable over total chloride first increased and then decreased as the total chloride in concrete increased. This trend was different from that by the water-soluble method. The difference may be related to the sample used in Soxhlet method, which consisted of relatively big particles. The movement of free chloride within the big particle would require time and some of free chlorides might remain in the particle after the test due to the limited test time (24 hours), leading to the lower ratio. This indicated that the Soxhlet method was less advantageous in analyzing the chloride content particularly when the concrete contained a high chloride concentration.
63

Table 4.3.1 Chloride contents in concrete determined by ASTM methods
Specimen ID
Chloride added, %
Background, %
Total chloride, %
Acid-soluble chloride, % (acid-soluble/total)
Water-soluble chloride, % (water-soluble/total)
Soxhlet, % (Soxhlet/total)
I-F1 0.03
0.079
0.11 0.092 (0.85) 0.028 (0.26) 0.043 (0.39) I-F2 0.49 0.56 0.55 (0.95) 0.385 (0.66) 0.364 (0.64) I-F3 0.91 0.99 0.96 (0.98) 0.73 (0.74) 0.680 (0.69) I-F4 1.82 1.90 2.06 (1.08) 1.53 (0.81) 0.893 (0.47) III-F1 0.03
0.079
0.11 0.124 (1.14) 0.055 (0.45) III-F2 0.49 0.56 0.561 (0.99) 0.372 (0.66) III-F3 0.91 0.99 0.949 (0.96) 0.628 (0.64) III-F4 1.82 1.90 1.889 (1.0) 1.31 (0.69) I-C1 0.03
0.051
0.08 0.098 (1.21) 0.041 (0.51) I-C2 0.49 0.54 0.565 (1.05) 0.309 (0.58) I-C3 0.91 0.96 0.968 (1.01) 0.623 (0.65) I-C4 1.82 1.87 1.899 (1.02) 1.209 (0.65)
4.4 Chloride Binding and Release in TDOT Class P Mix Many phases in the cement hydration products are able to bind the chloride, thus reducing its mobility as well as its availability in the pore solution. This reduces the acceptable chloride ion limit in concrete. However, at an altered environment such as a local fall in pH, the equilibrium between the free and bound chlorides would be disturbed and the bound chloride could be released, presenting a corrosion risk. The mechanisms of binding and release of chlorides in the hydration products are complicated because many factors including C3A, supplementary cementitious materials, and pH may affect this process. One goal of this work was to try to characterize the binding and release mechanisms of chloride in typical TDOT mixes. In the present study, specimens from indoor exposure without wetting using TDOT class P mix were chosen for the characterization partly because these concrete slabs had the least potentials to exchange the chloride with the environment. 4.4.1 Development of pH in Suspensions and Acid Neutralization Capacity (ANC) of Concrete Twenty concrete suspensions were prepared by first mixing 5g powdered concrete samples with 5ml distilled water and then adding different amounts (moles per pound of concrete) of nitric acid. The pH value of each suspension was measured with time for approximately two weeks. Figure 4.4.1 depicts an example of how the pH value changed as a function of time and acid concentration. All samples were taken from the concrete slab made with 0.8% cast-in chloride, type I cement, and 15%wt of class F fly ash replacement and exposed to an indoor environment without wetting for 17 months. For each suspension, the pH value increased with time. At the early time (less than a week), the pH value increased relatively quickly owing to the rapid dissolving of alkali such as sodium and potassium oxides as well as calcium hydroxide into the
64

solution; however, a slow growth in pH occurred after a week indicating that the dissolution of alkali approached equilibrium. In the rest of this study, the pH value measured at approximately a week was used for evaluation. It can also be noted that increasing the concentration of acid in suspension reduced the pH value. In each curve, there were some regions with very slow decrease in pH as the acid concentration increased, thus forming some plateaus. Undoubtedly, these plateaus depicted the high resistance of cement matrix to the pH reduction, which is termed as the Acid Neutralization Capacity (ANC) of concrete. Clearly, the ANC measures the buffering capacity of concrete in resisting the acidic environmental attacks such as carbonation. The higher the ANC, the more resistance of concrete to acid attack such as carbonation and thus to corrosion.
0 1 2 3 4 5 6Equivalent concentration of acid, mol/lb
0123456789
10111213
pH o
f sus
pens
ion
1 day2 days5 days8 days12 days15 days
TDOT class P mixType I cementF Fly AshTotal Cl- 0.61%wt. cementitious
Figure 4.4.1 Variations of pH in suspension with time and acid concentration
The ANC was calculated in this study by dividing the amount of acid added in mole per pound of concrete by the change in pH value of suspension. Figure 4.4.2 provides an example of the result. A strong peak represented a high ANC at a particular pH value, indicating that the concrete has a high buffering capacity to resist the pH fall or to prevent the corrosion initiation. The very sharp peak (such as the second peak in Figure 4.4.2) did not truly mean that the ANC of concrete at that particular pH was extremely high. This occurred because the shape of the curve was strongly affected by a small deviation in the pH measurement. In this study, very sharp peaks were smoothed so that the maximum value for the resistance to pH reduction was approximately less than 5mol/lb. This value was chosen because most of the samples (>90%) showed the maximum peak of less than 5mol/lb. In rare cases (less than 5%), negative ANC may occur meaning that adding acid to sample will increase its pH value. This was impossible and again may be attributable to the small deviation in the pH measurement. The negative points were also smoothed during the data analysis. The inhibitive property of concrete primarily came from the hydrated phases of cement (paste), which included calcium hydroxide (CH) and C-S-H gel, as well as a small amount of alkali in the cement such as Sodium and Potassium Oxides (Na2O and K2O). When the nitric acid was added
65

to the suspension, the alkali including CH will first react. As a result, the first peak (typically occurred at a pH=12 or above) may relate to alkali dissolution and reaction. The next possible phase that resisted the pH fall was the C-S-H gel. It was reported that the equilibrium pH between C-S-H gel and its solution was from 10.5 to 12.583. Therefore, it was reasonable to postulate that the peaks after the first and before the pH value of 10.5 can be associated with the decomposition of C-S-H gel. In addition, the limestone aggregate used in this study reacted with nitric acid and released the carbon dioxide gas. Although cautions were taken during the sample preparation such as slowly adding the nitric acid to the suspension, the gas evolution still occurred even at relatively high pH values possibly due to the high percentage of limestone in concrete samples. The reaction between the nitric acid and limestone aggregate caused deviations in the ANC of concrete matrix, which might contribute to additional peaks in this study.
13 12 11 10 9 8 7 6 5 4 3pH
0
4
8
12
16
20
Resis
tanc
e to
pH
redu
ctio
n, m
ol/lb
TDOT class P mixType I cementF fly ashTotal Cl- 0.61%wt. cementitious
Figure 4.4.2 Variations of ANC with pH in suspension
4.4.2 Chloride Binding in TDOT Class P Mix Chloride binding is an interaction between the cement hydrated phases and the chloride ion. Although the exact chloride binding in concrete was not fully understood, several phases such as tri-calcium aluminate (C3A), tetra-calcium aluminoferrite (C4AF), and calcium silicate hydrate (C-S-H) gel in the concrete matrix were believed to bind the chloride. The C3A and C4AF would chemically bind the chloride to form Friedel salts (3CaO.Al2O3.CaCl2.10H2O-calcium chloroaluminate) and ferrite analogues of Friedel salts (3CaO.Fe2O3.CaCl2.10H2O) respectively. The results in this study confirmed this mechanism. Table 4.4.1 and Figure 4.4.2 compared the bound chloride between different cementitious materials. The bound chloride was calculated by subtracting the total chloride by the free chloride. Obviously, the high bound chloride was noted in series 2 specimens with type III cement and series 3 specimens with class C fly ash particularly at high total chloride contents. This was because type III cement/class C fly ash contained higher percentages of C3A+C4AF as compared with type I cement/class F fly ash.
66

Another phase that bound the chloride in the concrete matrix was C-S-H gel, which roughly accounted for 50% of chloride binding capacity of concrete14-15. When more sodium chloride was cast into concrete, the amount of bound chloride would increase, but the relationship was not linear and the ratio of bound chloride over total was observed to decrease. Table 4.4.1 Bound chloride analysis in TDOT class P mix
Specimen ID Total chloride, % Water-soluble chloride, % Bound chloride, % Bound /total
Series 1: type I cement + F fly ash I-F-1 0.109 0.028 0.081 0.74 I-F-2 0.564 0.385 0.179 0.32 I-F-3 0.989 0.73 0.259 0.26 I-F-4 1.899 1.53 0.369 0.19 Series 2: type III cement + F fly ash III-F-1 0.109 0.055 0.055 0.5 III-F-2 0.564 0.372 0.192 0.34 III-F-3 0.989 0.628 0.361 0.36 III-F-4 1.899 1.310 0.589 0.31 Series 3: type I cement + C fly ash I-C-1 0.081 0.041 0.040 0.49 I-C-2 0.536 0.309 0.227 0.42 I-C-3 0.961 0.623 0.338 0.35 I-C-4 1.871 1.209 0.662 0.35
1 2 3 4Specimen ID
0
0.2
0.4
0.6
0.8
1
1.2
1.4
1.6
1.8
2
Chlo
ride,
%wt
. cem
entit
ious Total
Water-soluble
Bound
Type I cementF fly ash
1 2 3 4Specimen ID
0
0.2
0.4
0.6
0.8
1
1.2
1.4
1.6
1.8
2
Chlo
ride,
%wt
. cem
entit
ious Total
Water-soluble
Bound
Type III cementF fly ash
1 2 3 4Specimen ID
0
0.2
0.4
0.6
0.8
1
1.2
1.4
1.6
1.8
2
Chlo
ride,
%wt
. cem
entit
ious Total
Water-soluble
Bound
Type I cementC fly ash
(a) Type I cement + F fly ash (b) Type III cement + F fly ash (c) Type I cement + C fly ash
Figure 4.4.2 Bound chloride in concrete specimens with different types of cementitious materials following TDOT class P mix proportioning
4.4.4 Release of Bound Chloride Conventionally, it has been thought that the chemically bound chloride would not directly participate in the corrosion process. However, many solid phases of cement hydration products may dissolve upon a local fall in pH, leading to the release of bound chloride. As a result, the bound chloride actually serves as a reservoir in concrete that poses a corrosion risk to the
67
reinforcement. In this research, it was found that the bound chloride was gradually released with a decrease in pH value of the suspension. Almost a linear relationship can be noted between the soluble chloride and the pH when the pH was above as shown in Figures 4.4.3 and 4.4.4. When the pH dropped to approximately 10.5, the curves became flat, indicating that adding more acid did not increase the soluble chloride content. This suggested that the majority of bound chloride was released when the pH fell to 10.5. One phase that released chloride was the Friedel’s salts in the paste. The equilibrium pH values between the Friedel’s salts and the solution were from 11.99 to 12.1484. As a result, the early increase in soluble chloride particularly at pH values between 11.99 and 12.14 may be attributable to the dissolution of Friedel’s salts. Another phase that contributed to the release of bound chloride was the C-S-H gel. The equilibrium pH values between C-S-H gel and its solution varied widely from 12.5 to 10.5 depending on the internal structure of C-S-H gel and the concentration of other species such as calcium ion in the solution. Consequently, it was reasonable to attribute the increase in soluble chloride especially between pH values of 11.99 and 10.5 to the decomposition of C-S-H gel83. After the dissolution of C-S-H gel, there would be no significant change in soluble chloride content upon a further fall in pH. This also explained why the curve reached a plateau when pH was below 10.5. It should be noted that the complex assemblages of paste may complicate the chloride release mechanisms. For example, Friedel’s salts may be encapsulated in the C-S-H gel owing to random alignment of cement hydration products, which would delay the dissolution of Friedel’s salt until the C-S-H gel was dissolved.
From Figures 4.4.3 and 4.4.4, the ANC (resistance to pH reduction) of concrete influenced the release of bound chloride. The presence of a peak in the ANC curve either slowed down or reduced the release of bound chloride. In other words, concrete with higher ANC would be less likely to release its bound chloride, thus producing less risk to corrosion. For concretes with same cementitious materials, similar patterns of ANC were observed. For instances, concrete samples with type I cement and F fly ash (Figures 4.4.3a to c) typically exhibited 3 main peaks at the pH values of approximately 12±0.2, 11±0.2, and 10±0.2. Each peak represented the presence of a special phase in the concrete matrix that was able to resist the pH fall. However, there were some differences not only in the magnitude of the peak, but also in the position of the peak. Variations may come from many aspects. For example, the alkali such as Na2O, K2O, and CH may be encapsulated in C-S-H gel, which may delay the dissolution of these alkalis, thus reducing the magnitude of first peak and increasing the magnitude of second peak.
In addition, similar patterns in ANC were noted for concretes with type III cement and F fly ash (Figures 4.4.4a to c). However, these patterns (magnitude and position of peaks) were quite different from those observed in Figure 4.4.3. This implied that the type of cement (type I vs. type III) had some effects on the ANC of concrete. On the other hand, the total ANC (corresponding to the area underneath the curve) of each sample was similar, indicating all the concretes in this study had similar overall resistance to the pH reduction (i.e. resistance to corrosion).
68

13 12 11 10 9 8 7 6 5 4pH
0
1
2
3
4
5
Resis
tanc
e to
pH
redu
ctio
n, m
ol/lb
0.04
0.06
0.08
0.1
0.12
0.14
Solu
ble
chlo
ride,
%wt
.
Resistance to pH reductionAcid-soluble chloride, %wt.
TDOT Class P MixType I Cement + F Fly Ash0.11% Total Cl-
13 12 11 10 9 8 7 6 5pH
0
1
2
3
4
5
Resis
tanc
e to
pH
redu
ctio
n, m
ol/lb
0.65
0.7
0.75
0.8
0.85
0.9
0.95
1
1.05
Solu
ble
chlo
ride,
%wt
.
Resistance to pH reductionAcid-soluble chloride, %wt.
TDOT Class P MixType I Cement + F Fly Ash0.99% Total Cl-
13 12 11 10 9 8 7 6 5 4pH
0
1
2
3
4
5
Resis
tanc
e to
pH
redu
ctio
n, m
ol/lb
1.3
1.4
1.5
1.6
1.7
1.8
1.9
2
Solu
ble
chlo
ride,
%wt
.
Resistance to pH reductionAcid-soluble chloride, %wt.
TDOT Class P MixType I Cement + F Fly Ash1.9% Total Cl-
(a) 0.11% total chloride (b) 0.99% total chloride (c) 1.9% total chloride Figure 4.4.3 Release of bound chloride vs. pH of suspension and ANC for concrete specimens
with type I cement and F fly ash
13 12 11 10 9 8 7 6 5 4pH
0
1
2
3
4
5
Resis
tanc
e to
pH
redu
ctio
n, m
ol/lb
0.35
0.4
0.45
0.5
0.55
0.6
0.65
Solu
ble
chlo
ride,
%wt
.
Resistance to pH reductionAcid-soluble chloride, %wt.
TDOT Class P MixType III Cement + F Fly Ash0.564% Total Cl-
13 12 11 10 9 8 7 6 5 4pH
0
1
2
3
4
5
Resis
tanc
e to
pH
redu
ctio
n, m
ol/lb
0.65
0.7
0.75
0.8
0.85
0.9
0.95
1
Solu
ble
chlo
ride,
%wt
.
Resistance to pH reductionAcid-soluble chloride, %wt.
TDOT Class P MixType III Cement + F Fly Ash0.989% Total Cl-
13 12 11 10 9 8 7 6 5 4pH
0
1
2
3
4
5
Resis
tanc
e to
pH
redu
ctio
n, m
ol/lb
1.3
1.4
1.5
1.6
1.7
1.8
1.9
2
Solu
ble
chlo
ride,
%wt
.
Resistance to pH reductionAcid-soluble chloride, %wt.
TDOT Class P MixType III Cement + F Fly Ash1.899% Total Cl-
(a) 0.564% total chloride (b) 0.989% total chloride (c) 1.899% total chloride Figure 4.4.4 Release of bound chloride vs. pH of suspension and ANC for concrete specimens
with type III cement and F fly ash
5.0 Guidelines for Developing TDOT Supplemental Specifications for Reinforced and Prestressed Concrete 5.1 Acceptable Chloride Ion Limit in TDOT Mix From this study, it can be concluded that the acceptable chloride limit varied with the materials and proportions, types of steel (rebar, unstressed prestressing strand, and stressed prestressing strand), as well as exposure conditions. Table 5.1 summarizes the main results obtained in this study on the acceptable chloride limits of rebar and prestressing strand for different concrete mixes and exposure conditions.
69
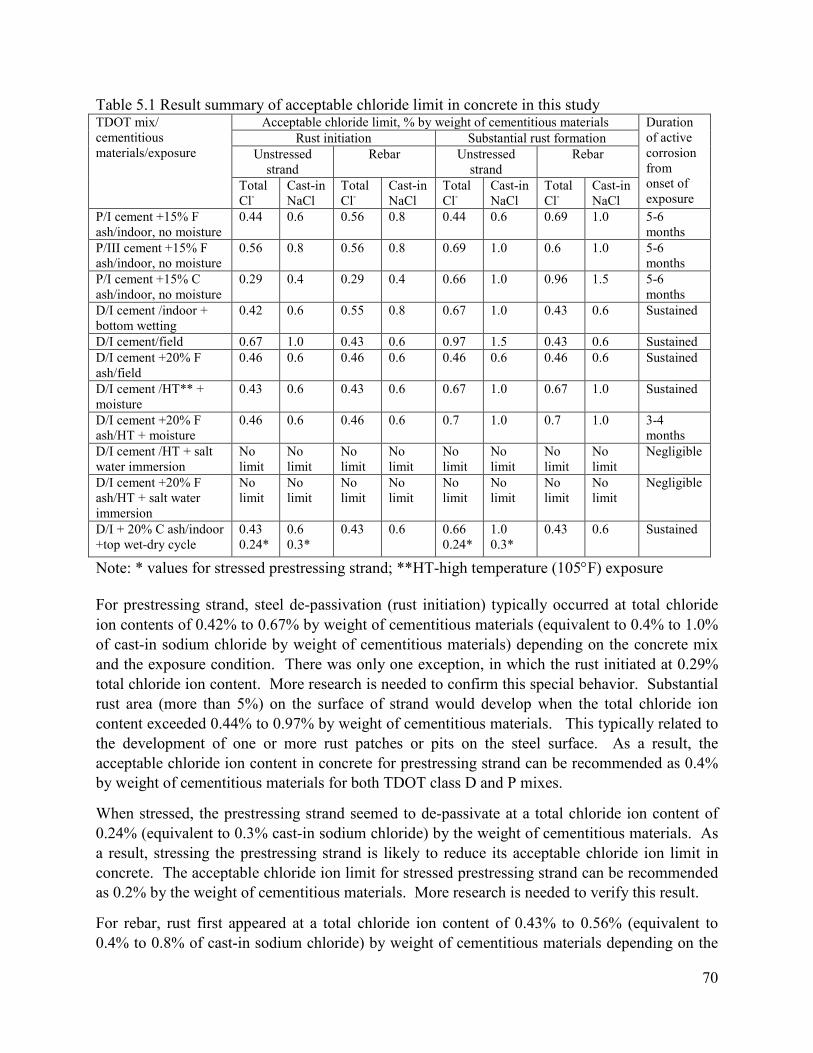
Table 5.1 Result summary of acceptable chloride limit in concrete in this study TDOT mix/ cementitious materials/exposure
Acceptable chloride limit, % by weight of cementitious materials Duration of active corrosion from onset of exposure
Rust initiation Substantial rust formation Unstressed
strand Rebar Unstressed
strand Rebar
Total Cl-
Cast-in NaCl
Total Cl-
Cast-in NaCl
Total Cl-
Cast-in NaCl
Total Cl-
Cast-in NaCl
P/I cement +15% F ash/indoor, no moisture
0.44 0.6 0.56 0.8 0.44 0.6 0.69 1.0 5-6 months
P/III cement +15% F ash/indoor, no moisture
0.56 0.8 0.56 0.8 0.69 1.0 0.6 1.0 5-6 months
P/I cement +15% C ash/indoor, no moisture
0.29 0.4 0.29 0.4 0.66 1.0 0.96 1.5 5-6 months
D/I cement /indoor + bottom wetting
0.42 0.6 0.55 0.8 0.67 1.0 0.43 0.6 Sustained
D/I cement/field 0.67 1.0 0.43 0.6 0.97 1.5 0.43 0.6 Sustained D/I cement +20% F ash/field
0.46 0.6 0.46 0.6 0.46 0.6 0.46 0.6 Sustained
D/I cement /HT** + moisture
0.43 0.6 0.43 0.6 0.67 1.0 0.67 1.0 Sustained
D/I cement +20% F ash/HT + moisture
0.46 0.6 0.46 0.6 0.7 1.0 0.7 1.0 3-4 months
D/I cement /HT + salt water immersion
No limit
No limit
No limit
No limit
No limit
No limit
No limit
No limit
Negligible
D/I cement +20% F ash/HT + salt water immersion
No limit
No limit
No limit
No limit
No limit
No limit
No limit
No limit
Negligible
D/I + 20% C ash/indoor +top wet-dry cycle
0.43 0.24*
0.6 0.3*
0.43 0.6 0.66 0.24*
1.0 0.3*
0.43 0.6 Sustained
Note: * values for stressed prestressing strand; **HT-high temperature (105°F) exposure For prestressing strand, steel de-passivation (rust initiation) typically occurred at total chloride ion contents of 0.42% to 0.67% by weight of cementitious materials (equivalent to 0.4% to 1.0% of cast-in sodium chloride by weight of cementitious materials) depending on the concrete mix and the exposure condition. There was only one exception, in which the rust initiated at 0.29% total chloride ion content. More research is needed to confirm this special behavior. Substantial rust area (more than 5%) on the surface of strand would develop when the total chloride ion content exceeded 0.44% to 0.97% by weight of cementitious materials. This typically related to the development of one or more rust patches or pits on the steel surface. As a result, the acceptable chloride ion content in concrete for prestressing strand can be recommended as 0.4% by weight of cementitious materials for both TDOT class D and P mixes.
When stressed, the prestressing strand seemed to de-passivate at a total chloride ion content of 0.24% (equivalent to 0.3% cast-in sodium chloride) by the weight of cementitious materials. As a result, stressing the prestressing strand is likely to reduce its acceptable chloride ion limit in concrete. The acceptable chloride ion limit for stressed prestressing strand can be recommended as 0.2% by the weight of cementitious materials. More research is needed to verify this result.
For rebar, rust first appeared at a total chloride ion content of 0.43% to 0.56% (equivalent to 0.4% to 0.8% of cast-in sodium chloride) by weight of cementitious materials depending on the
70

concrete mix and the exposure condition. Again, there was one special case, in which the rust first occurred at the total chloride ion content of 0.29%. More research is needed to confirm this special result. Substantial rust would form on steel surface when the total chloride ion content was higher than 0.43% to 0.96% (equivalent to 0.6% to 1.5% of cast-in sodium chloride) by weight of cementitious materials depending on the concrete mix and the exposure condition. Again, the substantial rust formation typically corresponded to one or more patches or pits of rust developed on the steel surface.
The exposure conditions greatly influenced the corrosion initiation and propagation. For indoor exposure without moisture, active corrosion occurred but did not sustain. Almost all corrosion activities stopped after 5 to 6 months exposure based on the nondestructive testing evaluation (i.e. the linear polarization resistance method). A practical implication of these findings is that for structures without direct contact with water such as interior wall or columns as well as some bridge piers or girders, higher acceptable chloride ion limits may be used. For indoor exposure with moisture supply or field exposure with wet/dry cycles, corrosion was sustained when the chloride ion content exceeded the limit. The acceptable chloride ion limit should be strictly specified for these applications. For salt-water immersion, all corrosion activities were negligible due to the lack of oxygen. The practical implication is that for underwater or marine structures, the acceptable chloride ion limit can be set much higher or unlimited. 5.2 Effects of Background Chlorides from Ingredient Materials on Acceptable Chloride Ion Limit The background chloride ion content for TDOT class D and P mixes was between 0.05% to 0.1% by the weight of cementitious materials. These values were much lower than the acceptable chloride ion limit (0.4%) recommended for rebar and unstressed prestressing strand. As a result, normal ingredient materials were safe for TDOT reinforced concrete structures. However, cautions should be taken for prestressing concrete structures since the acceptable chloride ion limit for stressed prestressing strand was lower (e.g. 0.2% recommended in this study). Any ingredient materials with a high chloride content such as the class F fly ash used in this study, which contained 0.2%wt chloride ion, should not be allowed particularly at a high dosage.
The Niagara Escarpment aggregate (high-chloride) did not noticeably affect the corrosion or the acceptable chloride ion limit in concrete. Although its chloride content was 5 to 6 times higher than that of normal limestone or sand, it was still very low (0.05 to 0.08% acid-soluble). As a result, its effect on corrosion was insignificant.
5.3 Effects of Cementitious Materials on Corrosion and Acceptable Chloride Ion Limit in Concrete The use of type III cement would increase the acceptable chloride ion limit in concrete as compared with type I cement. The primary reason was that type III cement had higher chloride-binding capacity due to its higher aluminate content. The use of supplementary cementitious materials such as class F fly ash in this study reduced or did not significantly affect the acceptable chloride ion limit in concrete; however, it did noticeably reduce the extent of corrosion. The main reason was that the class F fly ash reduced the pH value of concrete, thereby causing the release of bound chloride and promoting corrosion. On the other hand, class F fly ash reduced the permeability of concrete, thus reducing the moisture and oxygen supply
71

and depressing the corrosion activities. As a result, supplementary cementitious materials were still beneficial in controlling the corrosion propagation and thus recommended for TDOT applications. 5.4 Method for Analyzing Chloride Content in Concrete The acid-soluble method (ASTM C1152) provided results that were relatively more constant. It was also simple and fast as compared with the Soxhlet method. Therefore, it is recommended for future TDOT chloride analysis. The total chloride ion content by the weight of cementitious materials determined by acid-soluble method is also recommended for TDOT as the representation of chloride content in concrete.
Acknowledgements The authors acknowledge the financial support from the Tennessee Department of Transportation (TDOT) and the Federal Highway Administration (FHWA) through the research project MSA#: RES2016-25. They are also grateful for the time and the contribution of the TDOT Study Advisory Committee: Mr. Brian Egan, Mr. Wayne J. Seger, Mr. Ted Kniazewycz, Ms. Heather P. Hall, Mr. Houston Walker, Mr. Michael J. Mellons, and Mr. Derek Gaw. A part of this project was performed at the Mid South Prestress plant, Pleasant View, TN. The authors acknowledge the support from the plant, particularly Mr. Wyatt Dinsmore, for preparing the prestressed concrete specimens. This research was mainly conducted in the concrete laboratory of the School of Concrete and Construction Management, Middle Tennessee State University. The authors acknowledge the support and the assistance from the former lab manager Mr. Jason Crabtree and the current lab manager Mr. Kevin Overall in material request, and specimen preparation and testing. A part of this work was performed through the Senior Concrete Laboratory class at the Middle Tennessee State University; as such the authors acknowledge the assistance from the students for the specimen preparation and testing.
72

References 1. ACI SP308, 2016, “Chloride Thresholds and Limits for New Construction” Editors: David Tepke, David Trejo, and
O. BurkanIsgor, American Concrete Institute, June 2016, 136pp. 2. Hope, B.B.and A.K.C. Ip, 1987, “Chloride corrosion threshold in concrete,” ACI Materials Journal, July-August,
pp306-314. 3. Alonso,C., C. Andrade, M. Castellote, and P. Castro, 2000, “Chloride threshold values to depassivate reinforcing
bars embedded in a standardized OPC mortar.” Cement and Concrete Research, vol. 30, pp1047-1055. 4. Oh, B.H., S.Y.Jang, and Y.S. Shin, 2003, “Experimental investigation of the threshold chloride concentration for
corrosion initiation in reinforced concrete structures,” Magazine of Concrete Research, vol. 55, pp.117-124. 5. Manera, M., Q. Vennesland, and L. Bertolini, 2008, “Chloride threshold for rebar corrosion in concrete with
addition of silica fume,” Corrosion Science vol.50, pp.554-560. 6. Ann,K. Y. and H. Song, 2007, “Chloride threshold level for corrosion of steel in concrete,” Corrosion Science
Vol.49, pp.4113-4133. 7. Poupard,O., A. Ait-Mokhtar, and P. Dumargue, 2004, “Corrosion by chlorides in reinforced concrete: determination
of chloride concentration threshold by impedance spectroscopy,” Cement and Concrete Research, vol. 34, pp.991-1000.
8. Angst,U., B. Elsener, C. K. Larsen, and Ø.Vennesland, 2009, “Critical chloride content in reinforced concrete - A review,” Cement and Concrete Research, vol. 39, pp.1122–1138.
9. ACI Committee 318, 2014, “Building Code Requirements for Structural Concrete, and Commentary” ACI 318-14 and ACI 318R-14, American Concrete Institute, 2014, 519 pp.
10. ACI Committee 301, 2010, “Specifications for Structural Concrete,” ACI 301-10, American Concrete Institute, Farmington Hills, MI, 77 pp.
11. ACI Committee 222, 2010, “Protection of Metals in Concrete against Corrosion,” ACI 222R-01, American Concrete Institute, Farmington Hills, MI, 41 pp.
12. ACI Committee 201, 2010, “Guide to Durable Concrete,” ACI 201R-08, American Concrete Institute, Farmington Hills, MI, 49 pp.
13. Andrade, C. and M. Castellote, 2002, “Recommendation of RILEM TC 178-TMC: Testing and modelling chloride penetration in concrete: analysis of total chloride content in concrete,” Materials and Structures, vol. 35, pp. 583-585.
14. Glass, G.K., B. Reddy, N.R. Buenfeld, 2000, “The participation of bound chloride in passive film breakdown on steel in concrete,” Corrosion Science, vol. 42, pp.2013-2021.
15. Glass, G.K., B. Reddy, and N.R. Buenfeld, 2000, “Corrosion inhibition in concrete arising from its acid neutralization capacity,” Corrosion Science vol. 42, pp.1587-1598.
16. Hope, B.B., J.A. Page, and J.S. Poland, 1985, “The determination of chloride content of concrete,” Cement and Concrete Research, vol.15, pp.863-870.
17. Page, C.L., and K.W.J. Treadaway, 1982, “Aspects of the electrochemistry of steel in concrete,” Nature, vol. 297, pp.109- 115.
18. Tritthart, J., 1989, “Chloride binding: II. The influence of the hydroxide concentration in the pore solution of hardened cement paste on chloride binding,” Cement and Concrete Research, vol. 19, pp.683-691.
19. Page, C.L. and J. Havdahl, 1985, “Electrochemical monitoring of corrosion of steel in microsilica cement pastes,” Materials and Structures, vol.18, pp.41-47.
20. Sergi, G. and G.K. Glass, 2000, “A method of ranking the aggressive nature of chloride contaminated concrete,” Corrosion Science, vol. 42, pp.2043-2049.
21. Hussain, S.E., S. Rasheeduzafar, A. AI-Musallam, and A.S. AI-Gahtani, 1995, “Factors affecting threshold chloride for reinforcement corrosion in concrete,” Cement and Concrete Research, vol. 25, pp.1543-1555.
22. Tang, L. and L.-O. Nilsson, 1993, “Chloride binding capacity and binding isotherms of OPC pastes and mortars,” Cement and Concrete Research, vol. 23, pp.247-253.
23. Al-Saleh, S.A., 2015, “Analysis of Chloride Content in Concrete,” Case Study in Construction Materials, Vol.3, pp.78-82..
73

24. Page, C.L., and O. Vennesland, 1983, “Pore solution composition and chloride binding capacity of silica fume-cement pastes,” Materials and Structures, vol.19, pp.19-25.
25. Arya, C., N.R. Buenfeld, and J.B. Newman, 1990, “Factors influencing chloride-binding in concrete,” Cement and Concrete Research, vol. 20, pp.291-300.
26. Byfors, K., 1987, “Influence of silica fume and fly ash on chloride diffusion and pH values in cement paste,” Cement and Concrete Research, vol.17, pp.115-130.
27. Thomas, M., 1996, “Chloride threshold in marine concrete,” Cement and Concrete Research, vol. 26, pp.513-519. 28. Breit, W. and P. Schiessl, 1997, “Investigation on the threshold value of the critical chloride content,” Fourth CANMET/ACI Conference on Durability of Concrete, ACI SP70, Detroit, USA, vol. 2, pp. 363-372. 29. Dhir, R.K. and M.R. Jones, 1999, “Development of chloride-resisting concrete using fly ash,” Fuel, vol.78,
pp.137-142. 30. Diamond, S., 1981, “Effects of two Danish fly ashes on alkali contents of pore solutions of cement – fly ash
pastes,” Cement and Concrete Research, vol.11, pp.383-394. 31. Dhir, R.K., M.A.K. El-Mohr, and T.D. Dyer, 1996, “Chloride binding in GGBS concrete,” Cement and Concrete Research, vol.26, pp.1767-1773. 32. Luo, R., Y. Cai, C. Wang, and X. Huang, 2003, “Study of chloride binding and diffusion in GGBS concrete,”
Cement and Concrete Research, vol.33, pp.1-7. 33. Cheng, A., R. Huang, J.-K. Wu, and C.-H. Chen, 2005, “Influence of GGBS on durability and corrosion behavior
of reinforced concrete,” Materials Chemistry and Physics, vol. 93, pp.404-411. 34. Hussain, S.E. and S. Rasheeduzafar, 1994, “Corrosion resistance performance of fly ash blended cement
concrete,” ACI Material Journal, vol.91, pp.264-273. 35. Bamforth, P.B., 1999, “The derivation of input data for modelling chloride ingress from eight-years UK coastal
exposure trials,” Magazine of Concrete Research, vol.51, pp.87-96. 36. Dehwah, H.A.F., S.A. Austin, and M. Maslehnddin, 2002, “Chloride-induced reinforcement corrosion in blended cement concretes exposed to chloride-sulphate environments,” Magazine of Concrete Research, vol.54, pp.355-364. 37. Page, C.L., 1975, “Mechanism of corrosion protection in reinforced concrete marine structure,” Nature, vol. 256,
pp.514-515. 38. Al Khalaf, M.N. and C.L. Page, 1979, “Steel/mortar interfaces: microstructural features and mode of failure,”
Cement and Concrete Research, vol.9, pp.197-207. 39. Yue, L. and H. Shuguang, 2001, “The microstructure of the interfacial transition zone between steel and cement
paste,” Cement and Concrete Research, vol.31, pp.385-388. 40. Horne, A.T., I.G. Richardson, and R.M.D. Brydson, 2007, “Quantitative analysis of the microstructure of
interfaces in steel reinforced concrete,” Cement and Concrete Research, vol.37, pp.1613-1623. 41. Page, C.L., N.R. Short, and A. El Tarras, 1981, “Diffusion of chloride ions in hardened cement pastes,” Cement
and Concrete Research, vol.11, pp.395-406. 42. Gunay, H.B., P. Ghods, O.B. Isgor, G.J.C. Carpenter, and X. Wu, 2013, :Characterization of atomic structure of
oxide films on carbon steel in simulated concrete pore solutions using EELS,” Applied Surface Science, vol. 274, pp. 195-202.
43. Glass, G.K., R. Yang, T. Dickhaus, and N.R. Buenfeld, 2001, “Backscattered electron imaging of the steel-concrete interface,” Corrosion Science, vol.43, pp.605-610.
44. Mohammed, T.U., H. Hamada, and T. Yamaji, 2004, “Performance of seawater-mixed concrete in the tidal environment,” Cement and Concrete Research, vol.34, pp.593-601.
45. Castel, A., T. Vidal, R. Francois, and G. Arliguie, 2003, “Influence of steel-concrete interface quality on reinforcement corrosion induced by chlorides,” Magazine of Concrete Research, vol. 55, pp.151-159.
46. Soylev, T.A. and R. Francois, 2003, “Quality of steel in concrete interface and corrosion of reinforcing steel,” Cement and Concrete Research, vol.33, pp.1407-1415.
47. Yonesawa, T., V. Ashworth, and R.P.M. Procter, 1988, “Pore solution composition and chloride effects on the corrosion of steel in concrete,” Corrosion, vol.44, pp.489-499.
74
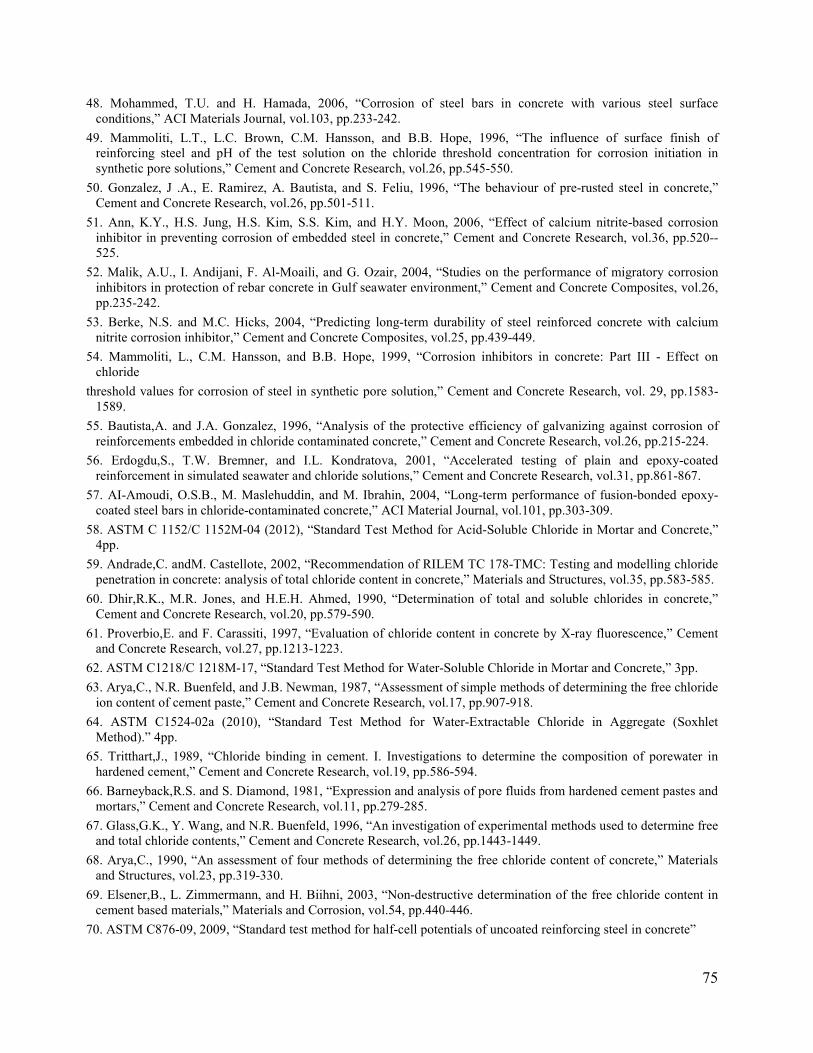
48. Mohammed, T.U. and H. Hamada, 2006, “Corrosion of steel bars in concrete with various steel surface conditions,” ACI Materials Journal, vol.103, pp.233-242.
49. Mammoliti, L.T., L.C. Brown, C.M. Hansson, and B.B. Hope, 1996, “The influence of surface finish of reinforcing steel and pH of the test solution on the chloride threshold concentration for corrosion initiation in synthetic pore solutions,” Cement and Concrete Research, vol.26, pp.545-550.
50. Gonzalez, J .A., E. Ramirez, A. Bautista, and S. Feliu, 1996, “The behaviour of pre-rusted steel in concrete,” Cement and Concrete Research, vol.26, pp.501-511.
51. Ann, K.Y., H.S. Jung, H.S. Kim, S.S. Kim, and H.Y. Moon, 2006, “Effect of calcium nitrite-based corrosion inhibitor in preventing corrosion of embedded steel in concrete,” Cement and Concrete Research, vol.36, pp.520--525.
52. Malik, A.U., I. Andijani, F. Al-Moaili, and G. Ozair, 2004, “Studies on the performance of migratory corrosion inhibitors in protection of rebar concrete in Gulf seawater environment,” Cement and Concrete Composites, vol.26, pp.235-242.
53. Berke, N.S. and M.C. Hicks, 2004, “Predicting long-term durability of steel reinforced concrete with calcium nitrite corrosion inhibitor,” Cement and Concrete Composites, vol.25, pp.439-449.
54. Mammoliti, L., C.M. Hansson, and B.B. Hope, 1999, “Corrosion inhibitors in concrete: Part III - Effect on chloride
threshold values for corrosion of steel in synthetic pore solution,” Cement and Concrete Research, vol. 29, pp.1583-1589.
55. Bautista,A. and J.A. Gonzalez, 1996, “Analysis of the protective efficiency of galvanizing against corrosion of reinforcements embedded in chloride contaminated concrete,” Cement and Concrete Research, vol.26, pp.215-224.
56. Erdogdu,S., T.W. Bremner, and I.L. Kondratova, 2001, “Accelerated testing of plain and epoxy-coated reinforcement in simulated seawater and chloride solutions,” Cement and Concrete Research, vol.31, pp.861-867.
57. AI-Amoudi, O.S.B., M. Maslehuddin, and M. Ibrahin, 2004, “Long-term performance of fusion-bonded epoxy-coated steel bars in chloride-contaminated concrete,” ACI Material Journal, vol.101, pp.303-309.
58. ASTM C 1152/C 1152M-04 (2012), “Standard Test Method for Acid-Soluble Chloride in Mortar and Concrete,” 4pp.
59. Andrade,C. andM. Castellote, 2002, “Recommendation of RILEM TC 178-TMC: Testing and modelling chloride penetration in concrete: analysis of total chloride content in concrete,” Materials and Structures, vol.35, pp.583-585.
60. Dhir,R.K., M.R. Jones, and H.E.H. Ahmed, 1990, “Determination of total and soluble chlorides in concrete,” Cement and Concrete Research, vol.20, pp.579-590.
61. Proverbio,E. and F. Carassiti, 1997, “Evaluation of chloride content in concrete by X-ray fluorescence,” Cement and Concrete Research, vol.27, pp.1213-1223.
62. ASTM C1218/C 1218M-17, “Standard Test Method for Water-Soluble Chloride in Mortar and Concrete,” 3pp. 63. Arya,C., N.R. Buenfeld, and J.B. Newman, 1987, “Assessment of simple methods of determining the free chloride
ion content of cement paste,” Cement and Concrete Research, vol.17, pp.907-918. 64. ASTM C1524-02a (2010), “Standard Test Method for Water-Extractable Chloride in Aggregate (Soxhlet
Method).” 4pp. 65. Tritthart,J., 1989, “Chloride binding in cement. I. Investigations to determine the composition of porewater in
hardened cement,” Cement and Concrete Research, vol.19, pp.586-594. 66. Barneyback,R.S. and S. Diamond, 1981, “Expression and analysis of pore fluids from hardened cement pastes and
mortars,” Cement and Concrete Research, vol.11, pp.279-285. 67. Glass,G.K., Y. Wang, and N.R. Buenfeld, 1996, “An investigation of experimental methods used to determine free
and total chloride contents,” Cement and Concrete Research, vol.26, pp.1443-1449. 68. Arya,C., 1990, “An assessment of four methods of determining the free chloride content of concrete,” Materials
and Structures, vol.23, pp.319-330. 69. Elsener,B., L. Zimmermann, and H. Biihni, 2003, “Non-destructive determination of the free chloride content in
cement based materials,” Materials and Corrosion, vol.54, pp.440-446. 70. ASTM C876-09, 2009, “Standard test method for half-cell potentials of uncoated reinforcing steel in concrete”
75

71. Elsener, B. 2003, “RILEM TC-154-EMC: electrochemical techniques for measuring metallic corrosion – recommendation-half-cell potential measurements-potential mapping on reinforced concrete structures,” Materials and Structures, vol. 36, pp.461-471.
72. Carino, N.J., 1999, “Nondestructive techniques to investigate corrosion status in concrete structures,” ASCE Journal of Performance of Constructed Facilities, August, pp.96-106.
73. Videm, K., 2007, “Electrochemical studies of steel in cement mortar containing chloride and micro-silica,” Corrosion Science, vol.49, pp.1702-1717.
74. Bouteiller, V., C. Cremona, V. Baroghel-Bouny, and A. Maloula, 2012, “Corrosion initiation of reinforced concretes based on Portland or GGBS cements: Chloride contents and electrochemical characterizations versus time,” Cement and Concrete Research, vol.42, pp.1456-1467.
75. Stratfull, R.F., W.J. Jurkovich, and D.L. Spellman, 1975, “Corrosion testing of bridge decks,” Transportation Research Record, vol.539, pp.50-59.
76. Stern, M. and A.L. Geary, 1957, “Electrochemical polarization. I. A theoretical analysis of the shape of polarization curves,” Journal of the Electrochemical Society vol. 104, pp.56-63.
77. Andrade, C and C. Alonso, 2004, “Test Methods for on-site corrosion rate measurement of steel reinforcement in concrete by means of the polarization resistance method,” RILEM TC-EMC, Materials and Structures, Vol.37, pp.623-643.
78. Vazquez, D.R., Y.A. Villagran Zaccardi, C.J. Zega, M.E. Sosa, and G.S. Duffo, 2015, “Implementation of different techniques for monitoring the corrosion of rebars embedded in concretes made with ordinary and pozzolanic cements,” Procedia Materials Science, vol. 8, pp73-81.
79. Li, F., Y. Yuan, and C.-Q. Li, 2011, “Corrosion Propagation of prestressing steel strands in concrete subject to chloride attack,” Construction and Building Materials, Vol. 25, pp.3878-3885.
80. Alonso, C., C. Andrade, M. Castellote, and P. Castro, 2001, “Reply to the discussion by T.U. Mohammed and H. Hamada of the paper “Chloride threshold values to depassivate reinforcing bars embedded in a standardized OPC mortar,”” Cement and Concrete Research, vol.31, pp.839-840.
81. Hope, B.B., J.A. Page, and A.K.C. Ip, 1986, “Corrosion rates of steel in concrete,” Cement and Concrete Research, vol.16, pp.771-781.
82. ASTM C114-15, “Standard Test Methods for Chemical Analysis of Hydraulic Cement,” 32pp. 83. Atkins, M., D.G Bennett, AC Dawes, F.P. Glasser, A. Kindness, 1992, “A thermodynamic model for blended
cements,” Cement and Concrete Research, 22(2-3), pp.497-502. 84. Birnin-Yauri, U.A., and F.P. Glasser, 1998, “Freidel’s salt, Ca2Al(OH)6(Cl,OH).2H2O: its solid solutions and their
role in chloride binding,”Cement and Concrete Research, Vol. 28, No. 12, pp.1713–1723.
Appendix: Rebars and Strands after Exposure Series 1- TDOT class P mix, type I cement + 15% class F fly ash replacement, indoor exposure #1-1 (0% cast-in NaCl)
76

#1-2 (0.05% cast-in NaCl)
#1-3 (0.1% cast-in NaCl)
77

#1-4 (0.2% cast-in NaCl)
#1-5 (0.25% cast-in NaCl)
#1-6 (0.3% cast-in NaCl)
78

#1-7 (0.4% cast-in NaCl)
#1-8 (0.5% cast-in NaCl)
79

#1-9 (0.6% cast-in NaCl)
#1-10 (0.8% cast-in NaCl)
80

#1-11 (1.0% cast-in NaCl)
#1-12 (1.5% cast-in NaCl)
#1-13 (2.0% cast-in NaCl)
81

#1-14 (2.5% cast-in NaCl)
#1-15 (3.0% cast-in NaCl)
82

Series 2- TDOT class P mix, type III cement + 15% class F fly ash replacement, indoor exposure #2-1 (0% cast-in NaCl)
#2-2 (0.05% cast-in NaCl)
83

#2-3 (0.1% cast-in NaCl)
#2-4 (0.2% cast-in NaCl)
84

#2-5 (0.3% cast-in NaCl)
#2-6 (0.4% cast-in NaCl)
85

#2-7 (0.4% cast-in NaCl)
#2-8 (0.6% cast-in NaCl)
86

#2-9 (0.8% cast-in NaCl)
#2-10 (1.0% cast-in NaCl)
87

#2-11 (1.5% cast-in NaCl)
#2-12 (2.0% cast-in NaCl)
88

89

#2-13 (2.5% cast-in NaCl)
#2-14 (3.0% cast-in NaCl)
90

Series 3 - TDOT class P mix, type I cement + 15% class C fly ash replacement, indoor exposure #3-1 (0% cast-in NaCl)
#3-2 (0.05% cast-in NaCl)
91
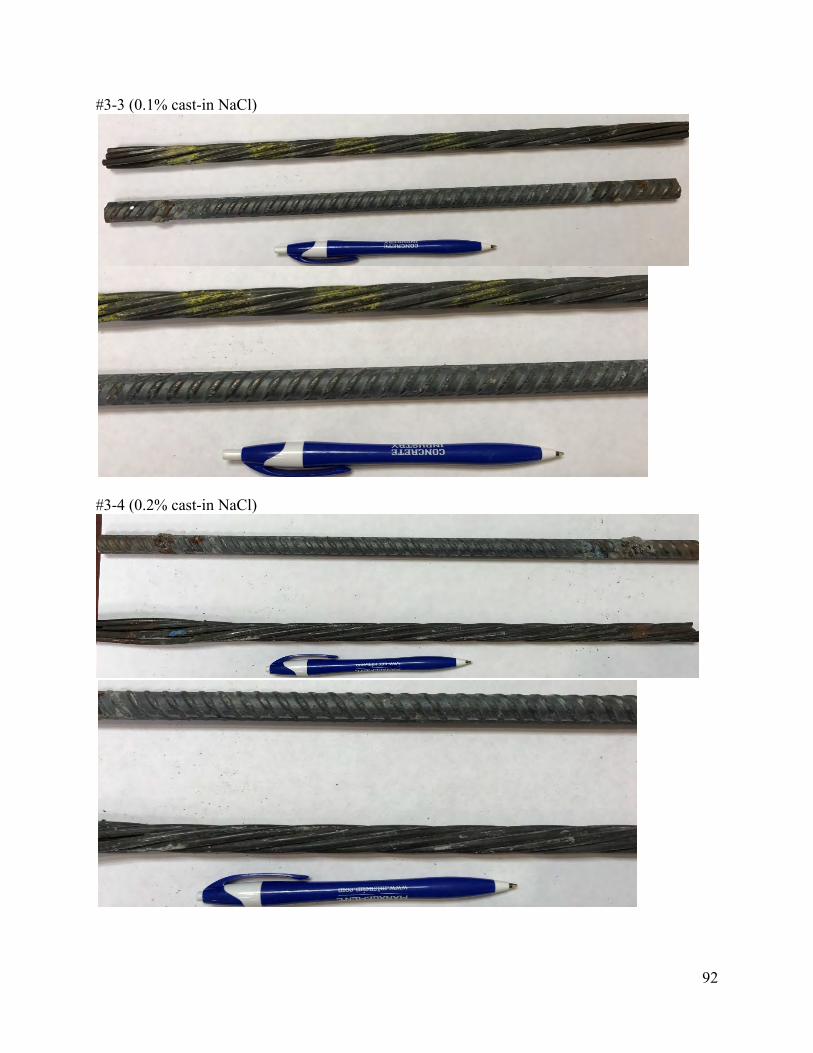
#3-3 (0.1% cast-in NaCl)
#3-4 (0.2% cast-in NaCl)
92

#3-5 (0.5% cast-in NaCl)
#3-6 (0.4% cast-in NaCl)
93

#3-7 (0.5% cast-in NaCl)
#3-8 (0.6% cast-in NaCl)
94

#3-9 (0.8% cast-in NaCl)
#3-10 (1.0% cast-in NaCl)
95

#3-11(1.5% cast-in NaCl)
#3-12 (2.0% cast-in NaCl)
96

#3-13 (2.5% cast-in NaCl)
#3-14 (3.0% cast-in NaCl)
97
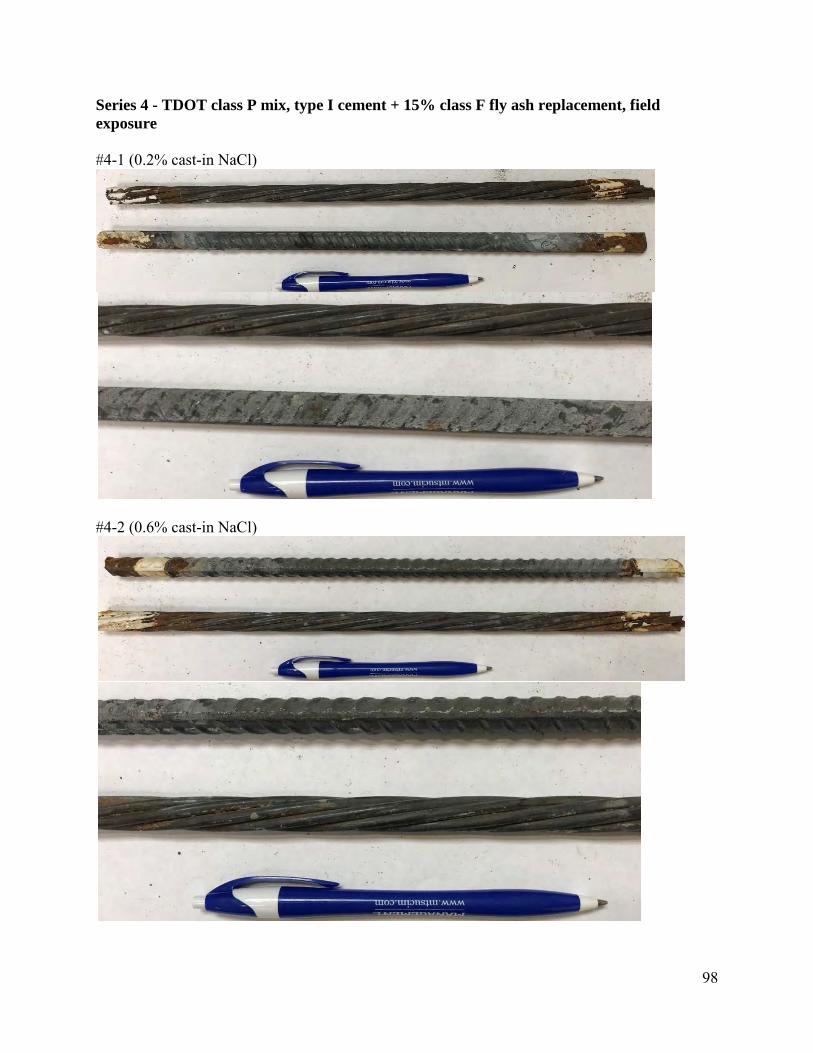
Series 4 - TDOT class P mix, type I cement + 15% class F fly ash replacement, field exposure #4-1 (0.2% cast-in NaCl)
#4-2 (0.6% cast-in NaCl)
98

#4-3 (1.0% cast-in NaCl)
#4-4 (3.0% cast-in NaCl)
99

Series 5 - TDOT class D mix, type I cement, indoor exposure with bottom wetting #5-1 (0.3% cast-in NaCl)
#5-2 (0.6% cast-in NaCl)
100

#5-3 (1.0% cast-in NaCl)
#5-4 (1.5% cast-in NaCl)
101

#5-5 (2.0% cast-in NaCl)
102

#5-6 (2.5% cast-in NaCl)
#5-7 (3.0% cast-in NaCl)
103

#5-8 (4.0% cast-in NaCl)
#5-9 (0.6% cast-in NaCl, high-chloride aggregate)
104
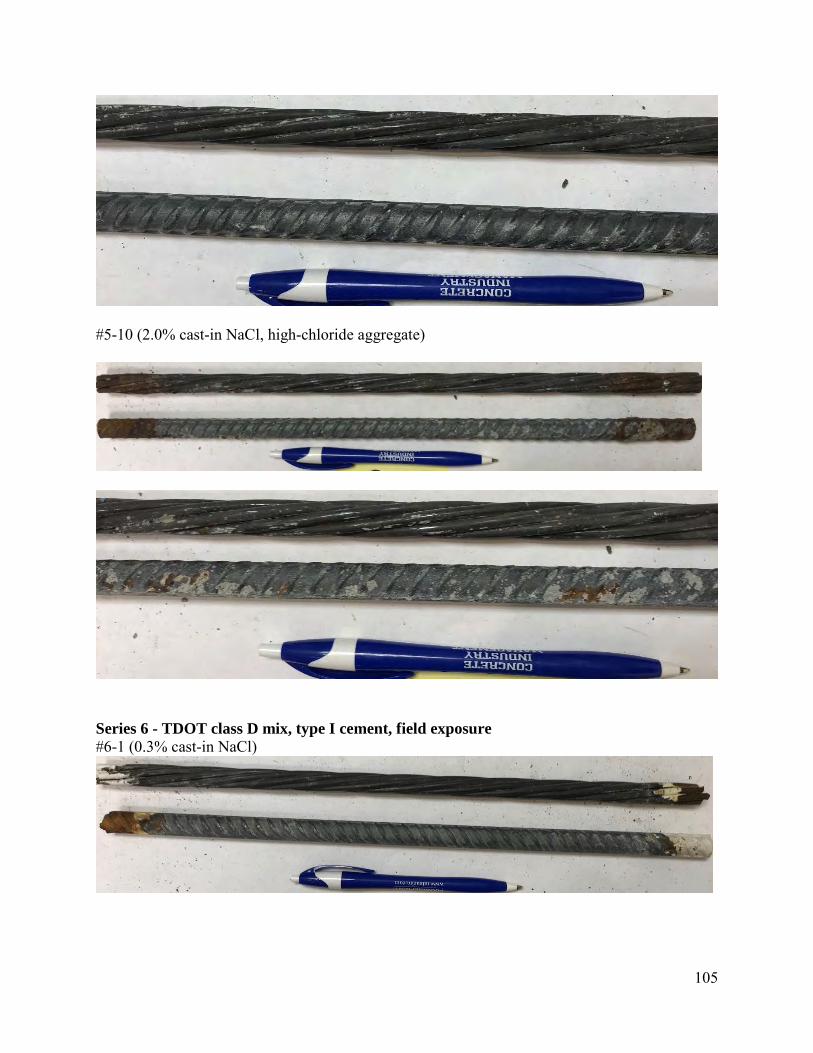
#5-10 (2.0% cast-in NaCl, high-chloride aggregate)
Series 6 - TDOT class D mix, type I cement, field exposure #6-1 (0.3% cast-in NaCl)
105

#6-2 (0.6% cast-in NaCl)
106

#6-3 (1.0% cast-in NaCl)
#6-4 (1.5% cast-in NaCl)
107

#6-5 (2.0% cast-in NaCl)
#6-6 (2.5% cast-in NaCl)
108

#6-7 (3.0% cast-in NaCl)
#6-8 (4.0% cast-in NaCl)
109
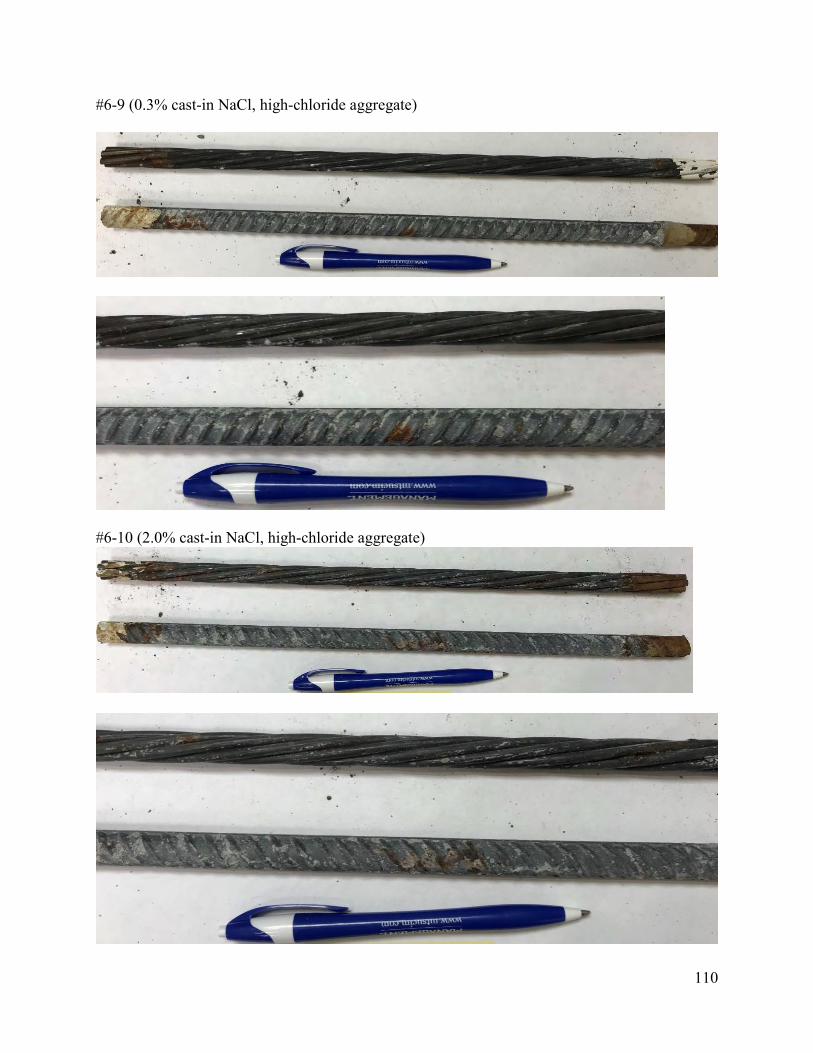
#6-9 (0.3% cast-in NaCl, high-chloride aggregate)
#6-10 (2.0% cast-in NaCl, high-chloride aggregate)
110
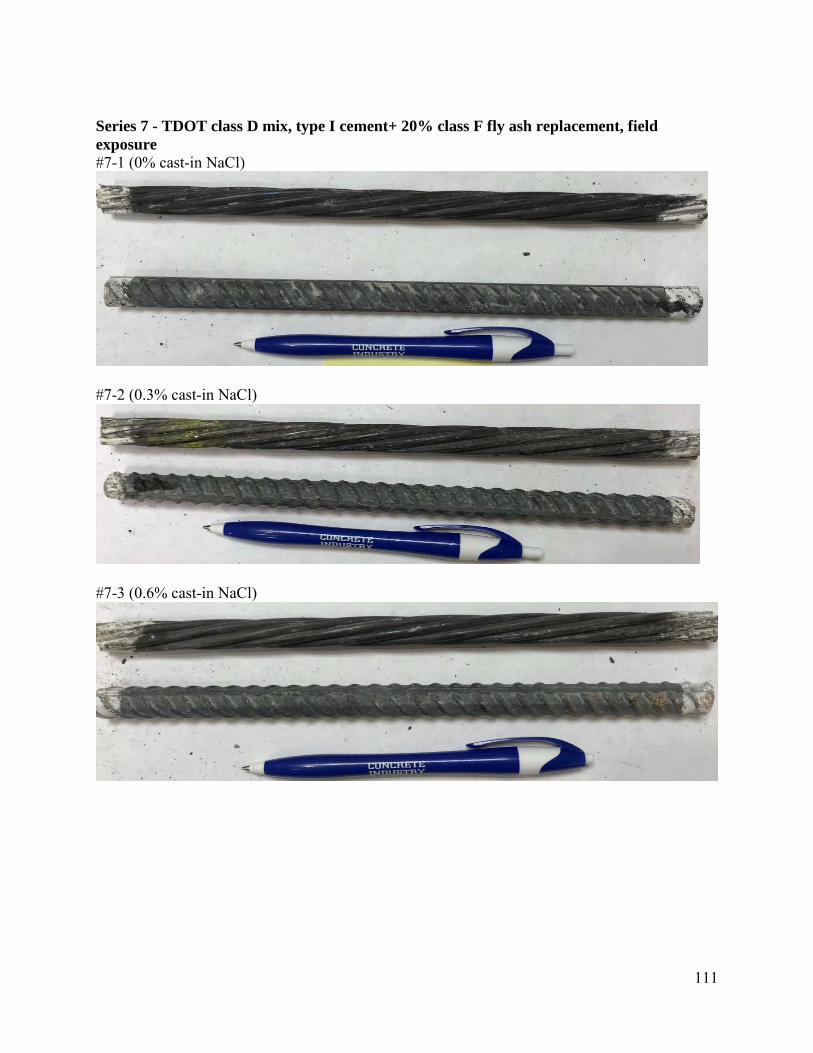
Series 7 - TDOT class D mix, type I cement+ 20% class F fly ash replacement, field exposure #7-1 (0% cast-in NaCl)
#7-2 (0.3% cast-in NaCl)
#7-3 (0.6% cast-in NaCl)
111

#7-4 (1.0% cast-in NaCl)
#7-5 (1.5% cast-in NaCl)
#7-6 (2.0% cast-in NaCl)
#7-7 (2.5% cast-in NaCl)
112

#7-8 (3.0% cast-in NaCl)
Series 8 - TDOT class D mix, type I cement, high-temperature exposure with moisture #8-1 (0% cast-in NaCl)
#8-2 (0.3% cast-in NaCl)
113

#8-3 (0.6% cast-in NaCl)
#8-4 (1.0% cast-in NaCl)
#8-5 (1.5% cast-in NaCl)
114

#8-6 (2.0% cast-in NaCl)
#8-7 (3.0% cast-in NaCl)
#8-8 (4.0% cast-in NaCl)
115

Series 9 - TDOT class D mix, type I cement + 20% class F fly ash, high-temperature exposure with moisture #9-1 (0% cast-in NaCl)
#9-2 (0.3% cast-in NaCl)
#9-3 (0.6% cast-in NaCl)
116

#9-4 (1.0% cast-in NaCl)
#9-5 (1.5% cast-in NaCl)
#9-6 (2.0% cast-in NaCl)
117

#9-7 (3.0% cast-in NaCl)
#9-8 (4.0% cast-in NaCl)
118

Series 10 - TDOT class D mix, type I cement, high-temperature exposure with salt-water immersion #10-1 (0% cast-in NaCl)
#10-2 (0.3% cast-in NaCl)
#10-3 (0.6% cast-in NaCl)
119

#10-4 (1.0% cast-in NaCl)
#10-5 (1.5% cast-in NaCl)
#10-6 (2.0% cast-in NaCl)
120

#10-7 (3.0% cast-in NaCl)
#10-8 (4.0% cast-in NaCl)
121

Series 11 - TDOT class D mix, type I cement + 20% class F fly ash replacement, high-temperature exposure with salt-water immersion #11-1 (0% cast-in NaCl)
#11-2 (0.3% cast-in NaCl)
#11-3 (0.6% cast-in NaCl)
122

#11-4 (1.0% cast-in NaCl)
#11-5 (1.5% cast-in NaCl)
#11-6 (2.0% cast-in NaCl)
123

#11-7 (3.0% cast-in NaCl)
#11-8 (4.0% cast-in NaCl)
Series 12 - TDOT class D mix, type I cement+20% class C fly ash replacement, indoor exposure with top wet/dry cycles #12-1 (0% cast-in NaCl) Unstressed strand
Stressed strand
124

Rebar
#12-2 (0.3% cast-in NaCl) Unstressed strand
Stressed strand
Rebar
#12-3 (0.6% cast-in NaCl) Unstressed strand
Stressed strand
125

Rebar
#12-4 (1.0% cast-in NaCl) Unstressed strand
Stressed strand
Rebar
#12-5 (1.5% cast-in NaCl) Unstressed strand
Stressed strand
126

Rebar
#12-6 (2.0% cast-in NaCl) Unstressed strand
Stressed strand
Rebar
#12-7 (2.5% cast-in NaCl) Unstressed strand
127

Stressed strand
Rebar
#12-8 (3.0% cast-in NaCl) Unstressed strand
Stressed strand
Rebar
128

#12-9 (3.0% cast-in NaCl) Unstressed strand
Stressed strand
Rebar
129