accounting beta as ex ante uncertainty … beta, price to book value ratio and price earnings ratio....
TRANSCRIPT
AKPM-13 1
ACCOUNTING BETA AS EX ANTE UNCERTAINTY PROXY IN INITIAL PUBLIC OFFERINGS
TATANG ARY GUMANTI, M.BUS.ACC., PH.D.
DWI VENITA WIANDANI, SE Universitas Jember
ABSTRACT
The purpose of this study is to examine the relation between accounting measures of total firm risk and the level f underpricing of initial public offerings (IPOs). A number of studies have shown an association between market and accounting betas. However, most of the studies are performed using a sample of large established firms for which both accounting and market betas can be computed. In case of IPO firms, market betas cannot be computed due to the data limitations associated with private firms. Due to limited information available prior to IPO dates, in particular financial reports, one has to use a proxy to measure risk in an IPO. Accounting variables have been prominently known as potential proxy for ex ante uncertainty in an IPO.
Using a sample of 90 IPOs that went public during 1991-1997 at the Jakarta Stock Exchange, this study finds that the level of underpricing is determined by accounting beta, price to book value ratio and price earnings ratio. The IPO issue size has negative but insignificant association with the level of underpricing. Keywords: Initial public offerings (IPO), accounting beta, ex ante uncertainty,
underpricing,
AKPM-13 2
1. Introduction
Theoretical and empirical evidence has indicated that certain accounting
measures can be used as proxies for total firm risk, that is, they could determine the
riskiness of a corporation (Lev, 1974; Bowman, 1979; DeAngelo, 1990, among others).
The literature also suggests that accounting information is relevant in determining the
value and thus the riskiness of a corporation through the use of accounting analysis
(Brealy and Myers, 1996; Benninga and Sarig, 1997; White et al., 1998, among others).
Since most of the information available in the prospectus is accounting information, it is
arguable that this information represents a potential source for assessing the quality of
the issuing firm.
Some have also advocated the possibility of using accounting information in
assessing the value of firm making an IPO (Beaver et al., 1970; Foster, 1986; Lev,
1989; Berstein and Wild, 1998; Noland and Pavlik, 1998). Moreover, Ryan (1997),
based on his survey relating accounting numbers and company risk, notes the possibility
of incorporating accounting information for measuring the risk of a firm making an IPO
in the absence of ex post risk measures prior to the offering. Thus, the focus of the
current study is to examine whether accounting measures of total firm risk are
associated with the uncertainty surrounding an IPO.
Thus, it seems clear that in the absence of publicly available accounting
information, i.e., financial performance, prior to the offering, accounting variables
become the most reliable source of information in judging the riskiness of an IPO apart
form other non-accounting information. The utilization of accounting information for
risk measure in the IPO setting is theoretically acceptable. However, potential investor
AKPM-13 3
could not only rely solely to accounting variables as the information is not free from
possible accounting discretion (see Aharony et al., 1993; Friedland, 1994; Theo et al.
1998).
Downes and Heinkel (1982), Hughes (1986), Titman and Trueman (1986),
Krinsky and Rotenberg (1989), Kim et al. (1994, 1995), Klein (1996), and Kim and
Ritter (1999), amongst others, have provided analytical and empirical evidence of the
association between accounting numbers and the value of IPOs. In particular Kim et al.
(1995) and Klein (1996) show that information in the prospectus is value relevant
concerning the IPO.
Gumanti (2003) provide a review on the usefulness of accounting information in
pricing an IPO. Gumanti comes to a conclusion that certain accounting measures can be
used as proxies for total firm risk. This is supported in many literature such as Brealy
and Myers (1996), Benninga and Sarig (1997), and White et al. (2003) and empirical
evidence (Beaver et al., 1970; Foster, 1986; Lev, 1989; Berstein & Wild, 1998; Noland
& Pelvik, 1998; Ryan, 1997).
IPO setting offers a fruitful area for exploration given many aspects that are
associated with managerial decisions. Empirical evidence suggests that the IPOs of
common stocks are, on average, underpriced. Loughran et al. (1994) show that
underpricing is a widespread phenomenon and is evidenced across many capital
markets. The IPO underpricing theories assert that the pre-trading or ex ante uncertainty
about the aftermarket price is the driving factor for the extent of underpricing. The
existing theories come to a similar implication that underpricing is positively related to
the ex ante uncertainty about the aftermarket price of the issue. In other words, the
expected amount of underpricing increases as the uncertainty about the aftermarket of
AKPM-13 4
the issue increases. Empirical support for this positive association has been shown in
many research papers.
This paper examines the association between accounting measures of total firm
risk and the degree of underpricing of common stocks. Five accounting risk measures
are examined, namely accounting beta, return on assets, gross proceeds of the issue,
price to book value of equity ratio, and price earnings ratio. The paper is able to draw
conclusion that the accounting information risk measures are value relevant for
determination of the pricing efficiency in IPO.
This paper is organised as follows. Section two presents the review of existing
literature and provides the prediction of the variables being examined. This is followed
by the research method used in the study consisting of the data and variables
measurement. Section four presents empirical results. Final section concludes and
provides direction for future studies.
2. Literature Review
Beaver et al. (1970) examine the relationship between accounting information
and total and systematic risk. They posit that accounting information also has value
relevance given that the accounting system generates information that could be
considered as a measure of risk. They argue that accounting risk measures can be
employed as surrogates for total variability of returns that reflect either the systematic or
individual risk components. As accounting information can reflect a firm’s risk, it is
reasonable to use them as surrogates for firms’ systematic risk. To test their hypothesis,
Beaver et al. ran regressions between markets determined systematic risk and selected
accounting risk measures and found that dividend payout ratio, asset growth, financial
leverage, liquidity, asset size, earning variability, and earnings covariability are related
AKPM-13 5
to the market-based risk measure. Beaver et al. go on to assert that accounting
information implicitly supplies assistance for risk assessment. Belkaoui (1978), Eskew
(1979) and Dhingra (1982) also found that their selected accounting measures have
superior ability in predicting systematic risk.
Myers (1977) identifies four accounting measures, namely the covariance of
earnings, earnings variability, financial leverage, and growth that are related to the
measures of market systematic risk (beta) (p. 60-64). Myers asserts that size is also a
measure of total risk, i.e. large firms will have lower total risk. Ryan (1997) concludes
that the variables that consistently relate to systematic equity risk are earnings
variability, sources of operating risk, financial leverage, and operating leverage.
Foster (1986) asserts “there are many contexts in which estimates need to be
placed on the value of companies that are not traded on organized markets, for example
… (b) when determining the price at which a company could go public…” (p. 422).
Berstein and Wild (1998) suggest “Reliable estimates of value enable us to make
buy/sell/hold decisions regarding securities, … determine prices for public offerings of
a company’s securities” (p. 641). Berstein and Wild also suggest the use of financial
fundamental ratios in estimating equity values of companies whose stocks are not traded
in active markets. Thus, the literature suggests that accounting numbers are potentially
useful in the process of price determination of IPOs. Gumanti (2003) provides a review
on the importance of accounting information (variables) in explaining the variation of
uncertainty surrounding an IPO.
Many researchers have presented evidence of underpricing of initial public
offerings (IPOs). The underpricing, measured by the first day return of the new stocks,
on average, exceeds 15 percent (See Gumanti, 2000 for a comparison of the level of
AKPM-13 6
initial returns among various countries), even in some emerging markets, the figures
reach more than 100 percent. This percentage represents a one day return generated
from participating in the IPOs (assuming that investors purchase stocks in every IPO).
This underpricing is a widespread phenomenon and called as an anomaly. Several
theoretical models have been presented in the literature to explain why on average IPO
is underpriced. One prominent model is Rock (1986) and its extension by Beatty and
Ritter (1986). The theory suggest that the degree of IPOs underpricing is associated
with the ex ante uncertainty (risk) of the IPOs after market clearing price. Since the ex
ante uncertainty is not observable, proxies for it must be employed. Several variables in
the literature are used as proxies for ex ante uncertainty. This study focuses on
accounting risk measures proxy for ex ante uncertainty.
Given that accounting risk measures can proxy for total firm risk and given also
that systematic risk and total risk are correlated, accounting risk measures that are
related to systematic risk must also relate to unsystematic risk. Thus, it can be argued
that accounting information, in particular accounting risk measures, are potential
determinants for the riskiness of a security, and thus a company.
Kulkarni et al. (1991) advocate a technique for establishing a linkage of
accounting betas and the divisional hurdle rate of a multi-product firm by using
accounting betas as proxies for market betas when market data is unattainable. This
initial starting point is advanced by Almisher and Kish (2000) who examine the
relationship between accounting beta, as a measure for risk, and the level of initial
returns in an IPO setting. The central question of Almisher and Kish is that can market
(systematic) risk within the field of initial public offerings (IPOs) be surrogated by with
accounting data that reflects only the historical performance of the firm?
AKPM-13 7
Almisher and Kish (2000) could be the first to examine whether the accounting
beta is useful for assessing the risk of firms going public for the first time (i.e., when
evaluating initial public offerings). One of the shortcomings of this line of IPO research
is that the absence of a market beta for privately held firms. Thus, it is impossible to
directly test the association between market and accounting beta for the privately held
firms. To overcome this, a test must be established in order to examine whether
accounting beta conveys any ex ante information about the risk of IPO firms.
Almisher and Kish (2000) examine the association between accounting beta and
initial return of IPOs. Using a sample of 701 IPOs that went public in two different
markets, namely NASDAC and OTC and a combination of both markets, they find that
a positive association was found between accounting beta and IPOs’ initial returns.
They come to a conclusion that accounting beta can be used as proxy for ex ante
uncertainty in IPO setting. Thus, in the case of IPO setting, accounting beta seems to be
a reliable measure of risk that could be of significant value in determining the riskiness
of firm making an IPO.
Gumanti (2005) shows that there is positive association between accounting beta
and IPOs’ initial returns of IPO firms that went public at the Jakarta Stock Exchange
during 1991-1997. Gumanti’s study supports the finding of Almisher and Kish (2000)
using US market. This positive relationship implies that the higher the risk faced by
IPO, as indicated by accounting beta, the higher will be the level of undepricing because
IPO investors demand greater reward for the risk they are bearing. Similar to previous
findings, this study predicts that a positive relationship will exist between the level of
underpricing and accounting beta.
AKPM-13 8
Profitability has been regarded as a potential proxy for the riskiness of an IPO
(Beatty and Zajac, 1995). It is also not uncommon that a profitable IPO firm is more
attractive than a less profitable one. An IPO firm with a positive profit is regarded as
being exposed to greater risk. The regulators of Indonesian IPOs appear to be concerned
with level of profitability. One of the common stock listing requirement requires that
firms wishing to make an IPO must have posted operating profits in the last two fiscal
years of operation. Thus, it seems that profitability is considered crucial in Indonesian
IPOs. However, as has been stated in the requirement, an IPO firm may not be required
to have posted a profit when it has just started the business. Sterling (1987) points out
that one of the key factors to the success of an IPO is that the issuing firm must have a
good quality of earnings. Hall and Renner (1988) also assert that the success of IPOs
usually rests on earnings trends. Pettway and Kaneko (1996) find a positive but
insignificant relationship in their study of Japanese IPOs. Michaely and Shaw (1998)
also report a similar finding using US’s IPOs. Empirical evidence also shows that
earnings manipulation is not uncommon in IPO setting (Teoh et al. 1998). Thus, issuers
of IPO have strong motivation to boost reported earnings in order to be successful in
selling their stocks. This study predicts a positive relationship between the level of IPO
firm profitability and the degree of underpricing.
Ritter (1991) shows that the level of underpricing is inversely related to the size
of the issue for which smaller IPO will be underpriced more than higher one. Ritter
argues that smaller IPO is characterised with new established firm and tends to be more
volatile. Various studies have supported this prediction, for example Beatty and Ritter
(1989), Clarkson and Merkley (1994), and How et al. (1995). This study predicts a
AKPM-13 9
negative association between the issue size (gross proceeds) and the level of
underpricing.
Kim et al. (1995) and Klein (1996) show that book value of equity and earnings
per share are positively related to the value of an IPO. These studies use the offer price
as the dependent variables and regresses it with various explanatory variables and
reported positive and significant relationship with book value of equity and earnings per
share. This means higher offer price is determined by higher book value and higher
earnings. High quality IPO firm, as indicated by higher book value and earnings, will be
able to sell its stock with higher price. Conversely, lower quality IPO firm will sell its
stock at a lower price. IPO with higher book value of equity could regarded as having
higher quality since higher book value of equity and earnings is indicative that the firm
is being able to survive and exist in the market. However, care should be taken into
account when the issue is advanced to price to book value of equity ratio (PBV) and
price to earnings ratio (PER) are used in the model, because IPO may have negative or
small EPS but is offering just about average price will have higher PBV and PER or
IPO with relatively higher earnings or book value of equity but is selling its stock at just
above the average price will have lower or average PBV and PER. Thus, there seems to
be unclear prediction of these two variables.
3. Research Method
3.1 Data
From January 1991 through December 1997, 166 companies conducted initial
public offerings at the Jakarta Stock Exchange, representing the population of this
study. The sample of this study is drawn from the above population of IPOs based on
the following criteria:
AKPM-13 10
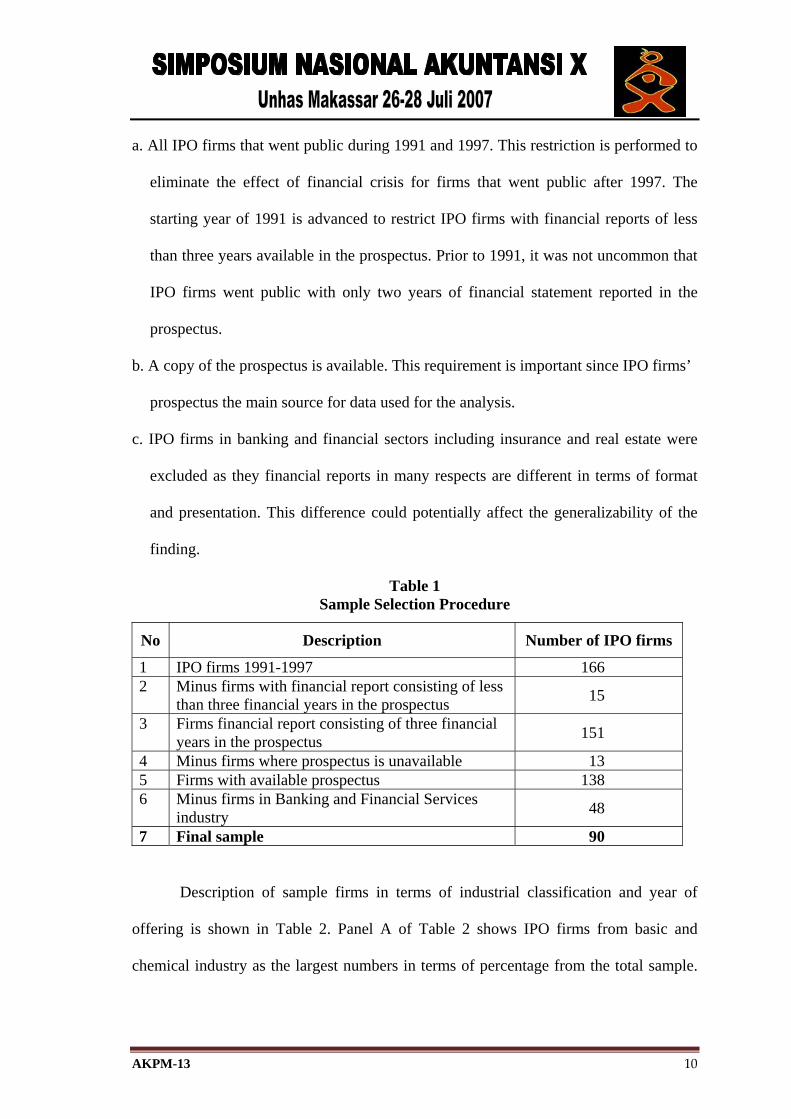
a. All IPO firms that went public during 1991 and 1997. This restriction is performed to
eliminate the effect of financial crisis for firms that went public after 1997. The
starting year of 1991 is advanced to restrict IPO firms with financial reports of less
than three years available in the prospectus. Prior to 1991, it was not uncommon that
IPO firms went public with only two years of financial statement reported in the
prospectus.
b. A copy of the prospectus is available. This requirement is important since IPO firms’
prospectus the main source for data used for the analysis.
c. IPO firms in banking and financial sectors including insurance and real estate were
excluded as they financial reports in many respects are different in terms of format
and presentation. This difference could potentially affect the generalizability of the
finding.
Table 1 Sample Selection Procedure
No Description Number of IPO firms
1 IPO firms 1991-1997 166 2 Minus firms with financial report consisting of less
than three financial years in the prospectus 15
3 Firms financial report consisting of three financial years in the prospectus 151
4 Minus firms where prospectus is unavailable 13 5 Firms with available prospectus 138 6 Minus firms in Banking and Financial Services
industry 48
7 Final sample 90
Description of sample firms in terms of industrial classification and year of
offering is shown in Table 2. Panel A of Table 2 shows IPO firms from basic and
chemical industry as the largest numbers in terms of percentage from the total sample.
AKPM-13 11
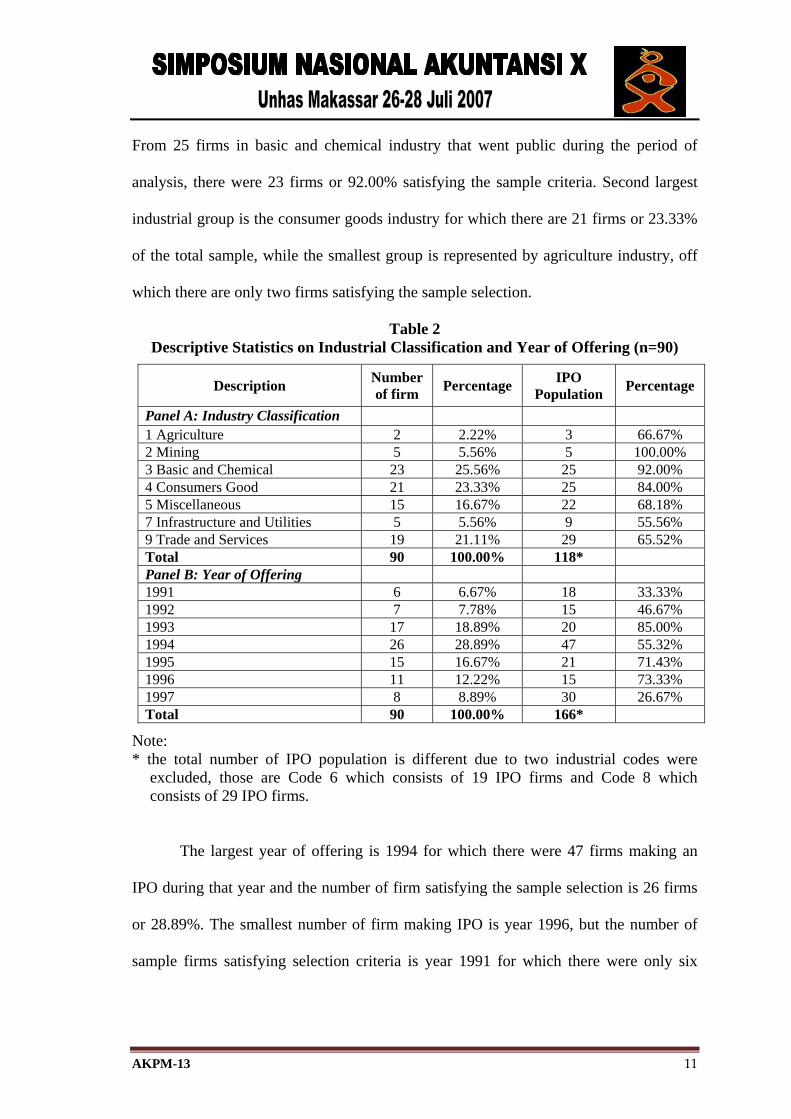
From 25 firms in basic and chemical industry that went public during the period of
analysis, there were 23 firms or 92.00% satisfying the sample criteria. Second largest
industrial group is the consumer goods industry for which there are 21 firms or 23.33%
of the total sample, while the smallest group is represented by agriculture industry, off
which there are only two firms satisfying the sample selection.
Table 2 Descriptive Statistics on Industrial Classification and Year of Offering (n=90)
Description Number of firm Percentage IPO
Population Percentage
Panel A: Industry Classification 1 Agriculture 2 2.22% 3 66.67% 2 Mining 5 5.56% 5 100.00% 3 Basic and Chemical 23 25.56% 25 92.00% 4 Consumers Good 21 23.33% 25 84.00% 5 Miscellaneous 15 16.67% 22 68.18% 7 Infrastructure and Utilities 5 5.56% 9 55.56% 9 Trade and Services 19 21.11% 29 65.52% Total 90 100.00% 118* Panel B: Year of Offering 1991 6 6.67% 18 33.33% 1992 7 7.78% 15 46.67% 1993 17 18.89% 20 85.00% 1994 26 28.89% 47 55.32% 1995 15 16.67% 21 71.43% 1996 11 12.22% 15 73.33% 1997 8 8.89% 30 26.67% Total 90 100.00% 166*
Note: * the total number of IPO population is different due to two industrial codes were
excluded, those are Code 6 which consists of 19 IPO firms and Code 8 which consists of 29 IPO firms.
The largest year of offering is 1994 for which there were 47 firms making an
IPO during that year and the number of firm satisfying the sample selection is 26 firms
or 28.89%. The smallest number of firm making IPO is year 1996, but the number of
sample firms satisfying selection criteria is year 1991 for which there were only six
AKPM-13 12
firms representing the total of 18 firms that went public during that year. Gumanti
(2000) regards years 1993 and 1994 as the booming of Indonesian IPO market, known
as the bull market, after two previous years of low number of IPOs, known as the bear
market.
3.2 Measurement of Variables
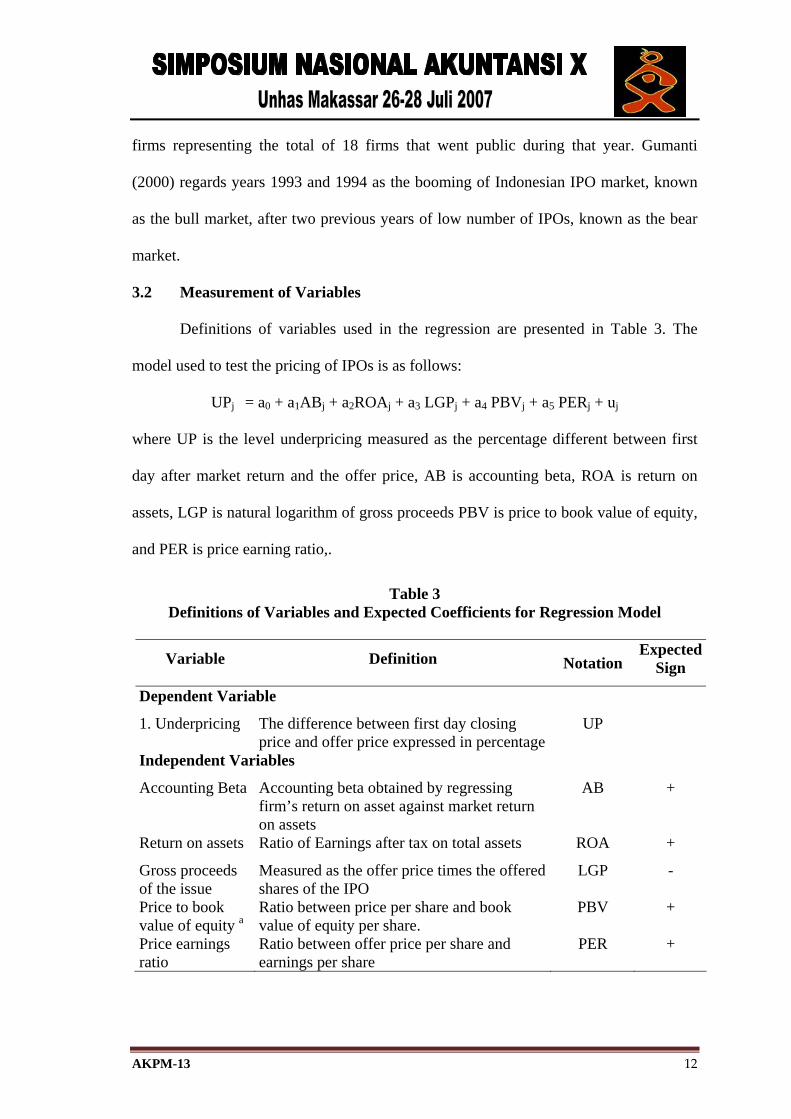
Definitions of variables used in the regression are presented in Table 3. The
model used to test the pricing of IPOs is as follows:
UPj = a0 + a1ABj + a2ROAj + a3 LGPj + a4 PBVj + a5 PERj + uj
where UP is the level underpricing measured as the percentage different between first
day after market return and the offer price, AB is accounting beta, ROA is return on
assets, LGP is natural logarithm of gross proceeds PBV is price to book value of equity,
and PER is price earning ratio,.
Table 3 Definitions of Variables and Expected Coefficients for Regression Model
Variable Definition Notation Expected
Sign
Dependent Variable
1. Underpricing The difference between first day closing price and offer price expressed in percentage
UP
Independent Variables
Accounting Beta Accounting beta obtained by regressing firm’s return on asset against market return on assets
AB +
Return on assets Ratio of Earnings after tax on total assets ROA +
Gross proceeds of the issue
Measured as the offer price times the offered shares of the IPO
LGP -
Price to book value of equity a
Ratio between price per share and book value of equity per share.
PBV +
Price earnings ratio
Ratio between offer price per share and earnings per share
PER +
AKPM-13 13
a Post-offering book value of equity per share is measured as the ratio of offer price to book value of equity per share.
4. Empirical Results
4.1 General Profile and Descriptive Statistics of the Sample
Accounting betas are calculated for the firms using one measure of return,
namely return on assets (ROA) and one market proxies. As mentioned earlier, the return
for each firm is regressed against the return for the market proxy to calculate the
accounting betas.
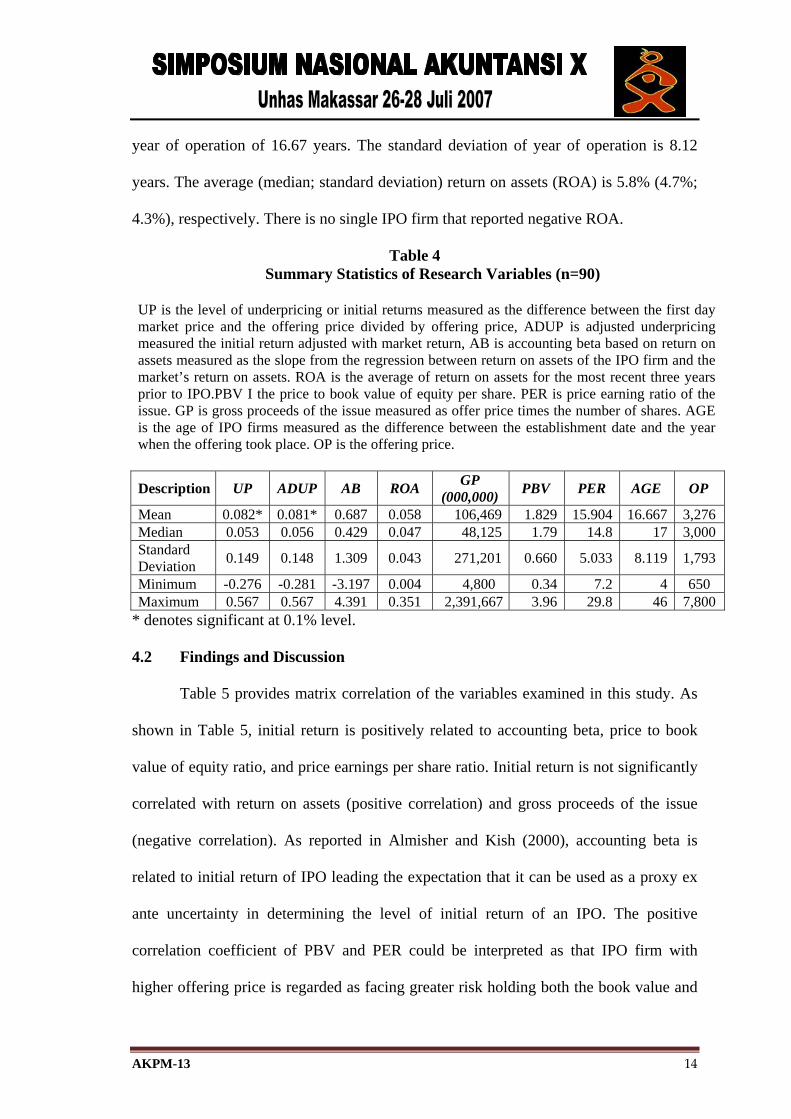
Table 4 reports summary statistics for various variables of these 90 firms. The
mean (median; standard deviation) for accounting beta when return on assets is used is
0.687 (0.429; 1.309). The mean (median; standard deviation) raw underpricing of the
sample firms is 8.2% (5.3%; 14.9%), whilst for adjusted underpricing the mean
(median; standard deviation) is 8.1% (5.6%; 14.8%). The correlation, not reported in the
table, between these two measures of underpricing is 99.5% (p=0.000), indicating that
the use of either the raw or adjusted initial return would not qualitatively change the
results of analysis.
The reported level of underpricing in Table 4 is lower than a number of studies
in various emerging countries as shown in Gumanti (2003) and is statistically
significant at 0.1% level.. It also lower than average initial returns reported in Gumanti
(2000) or Nasirwan (2001). Nevertheless, this study confirms the widely phenomenon
in IPO setting that on average the newly issued stock market is underpriced (Ritter,
1991). The offer price of IPO firms ranges from the lowest of Rp 650 to the highest of
Rp7,800 with an average of Rp 3,276 and a standard deviation of Rp 1,793. This finding
indicates that there is a great variation of the offer price. The sample firms have average
AKPM-13 14
year of operation of 16.67 years. The standard deviation of year of operation is 8.12
years. The average (median; standard deviation) return on assets (ROA) is 5.8% (4.7%;
4.3%), respectively. There is no single IPO firm that reported negative ROA.
Table 4 Summary Statistics of Research Variables (n=90)
UP is the level of underpricing or initial returns measured as the difference between the first day market price and the offering price divided by offering price, ADUP is adjusted underpricing measured the initial return adjusted with market return, AB is accounting beta based on return on assets measured as the slope from the regression between return on assets of the IPO firm and the market’s return on assets. ROA is the average of return on assets for the most recent three years prior to IPO.PBV I the price to book value of equity per share. PER is price earning ratio of the issue. GP is gross proceeds of the issue measured as offer price times the number of shares. AGE is the age of IPO firms measured as the difference between the establishment date and the year when the offering took place. OP is the offering price.
Description UP ADUP AB ROA GP
(000,000) PBV PER AGE OP
Mean 0.082* 0.081* 0.687 0.058 106,469 1.829 15.904 16.667 3,276 Median 0.053 0.056 0.429 0.047 48,125 1.79 14.8 17 3,000 Standard Deviation 0.149 0.148 1.309 0.043 271,201 0.660 5.033 8.119 1,793
Minimum -0.276 -0.281 -3.197 0.004 4,800 0.34 7.2 4 650 Maximum 0.567 0.567 4.391 0.351 2,391,667 3.96 29.8 46 7,800
* denotes significant at 0.1% level.
4.2 Findings and Discussion
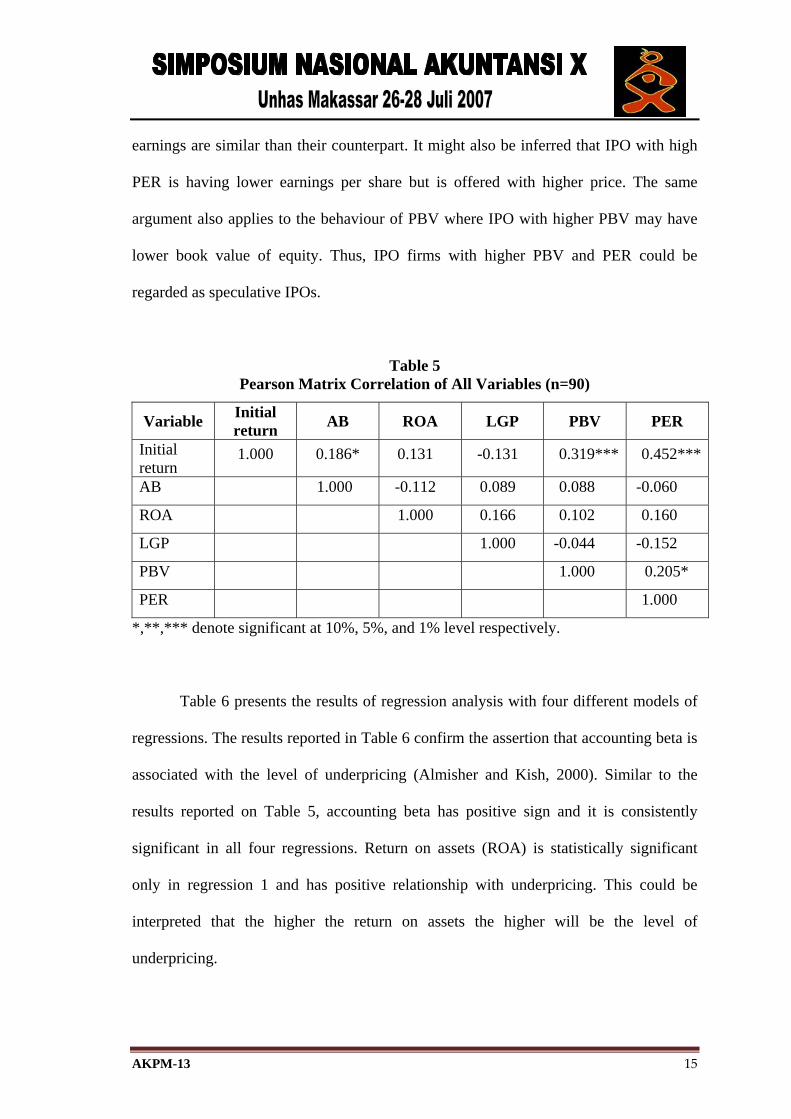
Table 5 provides matrix correlation of the variables examined in this study. As
shown in Table 5, initial return is positively related to accounting beta, price to book
value of equity ratio, and price earnings per share ratio. Initial return is not significantly
correlated with return on assets (positive correlation) and gross proceeds of the issue
(negative correlation). As reported in Almisher and Kish (2000), accounting beta is
related to initial return of IPO leading the expectation that it can be used as a proxy ex
ante uncertainty in determining the level of initial return of an IPO. The positive
correlation coefficient of PBV and PER could be interpreted as that IPO firm with
higher offering price is regarded as facing greater risk holding both the book value and
AKPM-13 15
earnings are similar than their counterpart. It might also be inferred that IPO with high
PER is having lower earnings per share but is offered with higher price. The same
argument also applies to the behaviour of PBV where IPO with higher PBV may have
lower book value of equity. Thus, IPO firms with higher PBV and PER could be
regarded as speculative IPOs.
Table 5 Pearson Matrix Correlation of All Variables (n=90)
Variable Initial return AB ROA LGP PBV PER
Initial return
1.000 0.186* 0.131 -0.131 0.319*** 0.452***
AB 1.000 -0.112 0.089 0.088 -0.060
ROA 1.000 0.166 0.102 0.160
LGP 1.000 -0.044 -0.152
PBV 1.000 0.205*
PER 1.000
*,**,*** denote significant at 10%, 5%, and 1% level respectively.
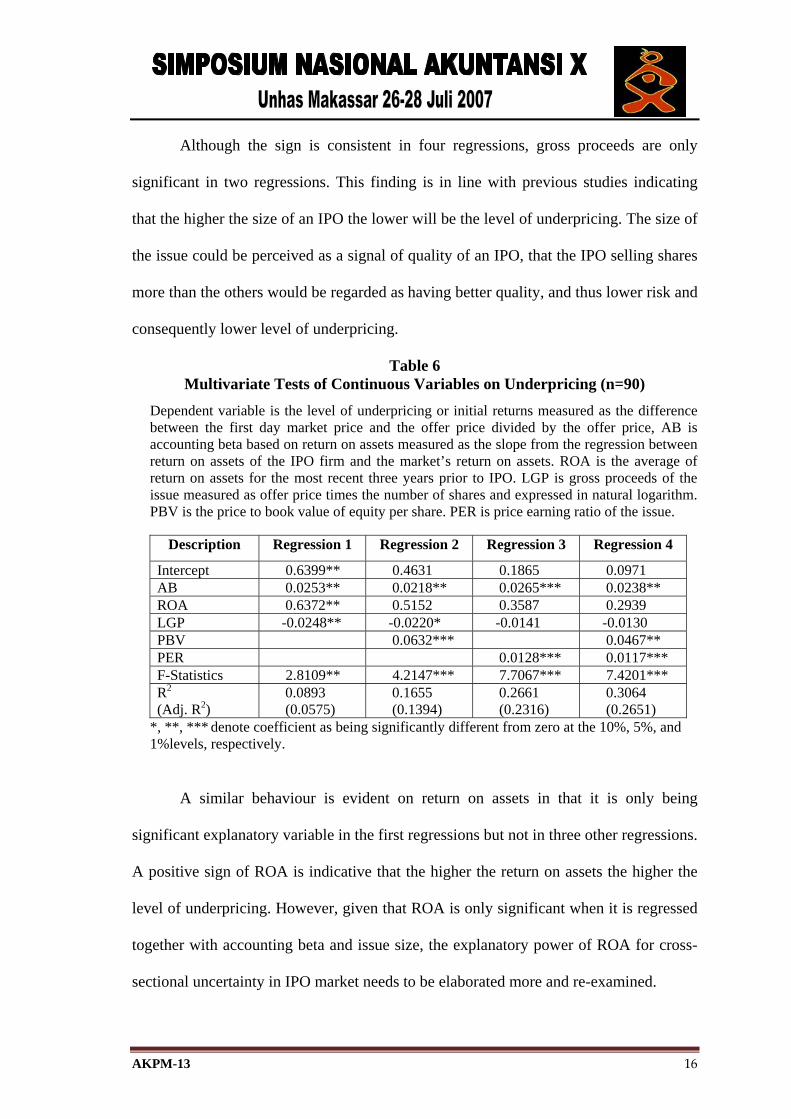
Table 6 presents the results of regression analysis with four different models of
regressions. The results reported in Table 6 confirm the assertion that accounting beta is
associated with the level of underpricing (Almisher and Kish, 2000). Similar to the
results reported on Table 5, accounting beta has positive sign and it is consistently
significant in all four regressions. Return on assets (ROA) is statistically significant
only in regression 1 and has positive relationship with underpricing. This could be
interpreted that the higher the return on assets the higher will be the level of
underpricing.
AKPM-13 16
Although the sign is consistent in four regressions, gross proceeds are only
significant in two regressions. This finding is in line with previous studies indicating
that the higher the size of an IPO the lower will be the level of underpricing. The size of
the issue could be perceived as a signal of quality of an IPO, that the IPO selling shares
more than the others would be regarded as having better quality, and thus lower risk and
consequently lower level of underpricing.
Table 6 Multivariate Tests of Continuous Variables on Underpricing (n=90)
Dependent variable is the level of underpricing or initial returns measured as the difference between the first day market price and the offer price divided by the offer price, AB is accounting beta based on return on assets measured as the slope from the regression between return on assets of the IPO firm and the market’s return on assets. ROA is the average of return on assets for the most recent three years prior to IPO. LGP is gross proceeds of the issue measured as offer price times the number of shares and expressed in natural logarithm. PBV is the price to book value of equity per share. PER is price earning ratio of the issue.
Description Regression 1 Regression 2 Regression 3 Regression 4
Intercept 0.6399** 0.4631 0.1865 0.0971 AB 0.0253** 0.0218** 0.0265*** 0.0238** ROA 0.6372** 0.5152 0.3587 0.2939 LGP -0.0248** -0.0220* -0.0141 -0.0130 PBV 0.0632*** 0.0467** PER 0.0128*** 0.0117*** F-Statistics 2.8109** 4.2147*** 7.7067*** 7.4201*** R2 (Adj. R2)
0.0893 (0.0575)
0.1655 (0.1394)
0.2661 (0.2316)
0.3064 (0.2651)
*, **, *** denote coefficient as being significantly different from zero at the 10%, 5%, and 1%levels, respectively.
A similar behaviour is evident on return on assets in that it is only being
significant explanatory variable in the first regressions but not in three other regressions.
A positive sign of ROA is indicative that the higher the return on assets the higher the
level of underpricing. However, given that ROA is only significant when it is regressed
together with accounting beta and issue size, the explanatory power of ROA for cross-
sectional uncertainty in IPO market needs to be elaborated more and re-examined.
AKPM-13 17
Price to book value of equity ratio (PBV) or price earnings ratio (PER) is
significant not only when they are not in the same model, but also when they are
included in the same regression. The coefficients for both variables are positive leading
to argue that the higher the level of price of the issue, either over the book value per
share or earnings per share, the higher will be the level of underpricing. This finding
could be interpreted that IPO firms with higher PBV and PER to be more speculative
than those with smaller PBV or PER. Thus, PBV and PER could be perceived as a
signal for higher risk IPO.
The findings reported in this study provide strong support for the notion that
accounting risk measures are relevant for determination of IPO price. The current study
is in line with Gumanti (2000; 2003) who finds that some accounting information can
be used as the proxy for ex ante uncertainty surrounding the IPO. The findings reported
here should be taken with some considerations given that it does not incorporate the
possible effect of earnings management. Accounting risk measured used in this study
may have been affected by managers’ attempt to boost reported earnings. For example,
Teoh et al. (1998) find strong support that earnings management prior to the IPO date is
prominent. Study using Indonesian IPO however does not show strong support that
earnings management is common in IPO setting (Gumanti, 2001).
5. Summary and Conclusions
Kim et al. (1995) and Klein (1996) assert that financial or accounting variables
are value relevant in determining the IPO. They have been able to confirm the
suggestion advocated by Lev (1989:179) that “the role of financial variables in the
valuation of new public firms (initial public offerings). The findings reported in this
study show that accounting risk measures are related to the level of underpricing in
AKPM-13 18
Indonesian initial public offerings. In particular, accounting beta and price earnings
ratio are positively related to the level of underpricing.
This study focuses its analysis on the role of accounting information in
determining the value of an IPO. Dyckman and Morse (1986) assert that accounting
information does not have a monopoly in supplying information to the market. Thus, the
selected accounting risk proxies examined in this study may not capture all of the
effects of company risks. Specification error may also be present, and, thus, the exact
contribution of each of the accounting risk proxies is not warranted. Anderson et al.
(1995) note that the success in testing the underpricing equilibrium depends heavily on
the success in selecting the proxies, it may be argued that the selected accounting risk
proxies examined in this study may not represent all the possible risks relating to the
issuing firm. Thus, another avenue for future study would be to test the model in other
IPO settings, or the inclusion of other accounting risk measures or using non accounting
risk measures or a combination of it. The most frequently use explanatory variables in
the cross-sectional study of IPO underpricing, amongst other, are financial leverage,
operating leverage, ownership retention, underwriter quality, auditor quality, market
condition, aftermarket risk measure, age of the firm, or industry classification.
AKPM-13 19
REFERENCES
Almisher, M.A. and R.J. Kish. (2000), “Accounting Betas – An Ex Anti Proxy For Risk
within the IPO Market,” Journal of Management and Strategic Decisions, 13: 23-
34.
Anderson, S.C., T.R. Beard, and I.A. Born. (1995), Initial Public Offerings: Findings
and Theories, Boston, Kluwer Academic Publishers.
Beatty, R. and J. Ritter. (1986), “Investment Banking, Reputation, and the Underpricing
of Initial Public Offerings,” Journal of Financial Economics 20: 213-232.
Beatty, R. P and E. J. Zajac. (1995), Managerial incentives, monitoring, and risk bearing
in initial public offering firms. Journal of Applied Corporate Finance 8 (2): 87-
96.
Beaver, W.H., P. Kettler, and M. Scholes. (1970), The association between market-
determined and accounting determined risk measures, Accounting Review, 45 (3):
654-682.
Belkaoui, A. (1978, Winter), Accounting determinants of systematic risk in Canadian
common stocks: A multivariate approach, Accounting and Business Research, 6,
3-10.
Benninga, S.Z. and O.H. Sarig. (1997), Corporate Finance: A Valuation Approach,
New York, McGraw-Hill.
Berstein, L.A. and J.J. Wild. (1998), Financial Statement Analysis: Theory, Application,
and Interpretation, 6th ed., Singapore, McGraw Hill.
Brealy, R.A. and S.C., Myers. (1996), Principles of Corporate Finance, 5th ed.,
McGraw-Hill.
AKPM-13 20
Dhingra, H.L. (1982, Summer), The impact of accounting variables on stock market
measures of risks, Accounting and Business Research, 10, 193-205.
Downes, D.H. and R. Heinkel. (1982), Signalling and the valuation of unseasoned new
issues, Journal of Finance, 37 (1): 1-10.
Eskew, R.K. (1979), The forecasting ability of accounting risk measures: Some
additional evidence, Accounting Review, 54 (1), 107-118.
Foster, G.R. (1986), Financial Statement Analysis, 2nd ed., New-Jersey, Prentice Hall.
Gumanti, T.A. (2001). Earnings management dalam penawaran saham perdana di Bursa
Efek Jakarta, Jurnal Riset Akuntansi Indonesia, 4(2): 165-183.
Gumanti, T.A. (2003). Can Accounting Information Act as A Proxy for Ex Unte
Uncertainty in Initial Public Offerings. Gadjah Mada International Journal of
Business. 5 (2): 249-269.
Gumanti, T.A., Accounting Information and the Underpricing of Indonesian Initial
Public Offerings, Unpublished Dissertation, Edith Cowan University, Perth,
Western Australia, 2000.
Gumanti, T.A., and A. Ariyanto. (2005), Can accounting beta act as a proxy for ex ante
uncertainty in initial public offerings: Empirical evidence at the Jakarta Stock
Exchange, Paper presented at Simposium nasional Akunansi, 8, Solo.
Hall, W.D., and A. J. Renner. (1988), Lessons that auditors ignore at their own risk.
Journal of Accountancy (July): 50-58.
How, J.C., H.Y. Izan, and G.S. Moore. (1995). Differential information and the
underpricing of initial public offerings: Australian evidence, Accounting and
Finance, May: 87-105.
AKPM-13 21
Hughes, J.S. (1986), Signaling by direct disclosures under asymmetric information,
Journal of Accounting and Economics, 5: 119-142.
Kim, J., I. Krinsky, and J. Lee. (1994), The valuation of initial public offerings and
accounting disclosures in prospectuses: New evidence from Korea, The
International Journal of Accounting, 29: 46-61.
Kim, J., I. Krinsky, and J. Lee. (1995), The role of financial variables in the pricing of
Korean initial public offerings, Pacific-Basin Finance Journal, 3: 449-464.
Kim, M. and J.R. Ritter. (1999), Valuing IPOs, Journal of Financial Economics, 53:
409-437.
Klein, A. (1996, Fall), Can investors use the prospectus to price initial public offerings,
Journal of Financial Statement Analysis, 2: 23-39.
Krinsky, I. and W. Rotenberg. (1989), The valuation of initial public offerings.
Contemporary Accounting Research, 5 (2): 501-515.
Kulkarni, M.,M. Powers and D. Shannon, (1991) “The Use of Segment Earnings Betas
in the Formation of Divisional Hurdle Rates,” Journal of Business Finance and
Accounting 18: 497- 512.
Lee, P.J., Taylor, S.L. & Walter, T.S. (1996), Expected and realised returns for
Singaporean initial public offerings: Initial and long run analysis, Pacific-Basin
Finance Journal, 4:153-180.
Leland, H.E. and D.H. Pyle. (1977), Information asymmetric, financial structure, and
financial intermediations. Journal of Finance, 32 (2): 371-387.
Lev, B. (1974), On the association between operating leverage and risk, Journal of
Financial and Quantitative Analysis, 9 (3): 627-641.
AKPM-13 22
Lev, B. (1989), On the usefulness of earnings and earnings research: Lessons and
directions from two decades of empirical research, Journal of Accounting
Research, 153-192.
Loughran,T., J. R. Ritter, and K. Rydqvist. (1994). Initial Public Offerings:
International Insights. Pacific-Basin Finance Journal 2:2/3, 165-199.
Michaely, R., and W. H. Shaw. (1998), Underwriter choice, institutional holdings, and
future IPO performance. In Advances in Quantitative Analysis of Finance and
Accounting. Vol. 6. pp. 137-149. Edited by C. Lee.
Noland, T.R. and R.M. Pavlik. (1998) “The Underpricing of initial public offerings:
Review, critique, and integration”, in C. Lee (Ed.), Advances in Quantitative
Analysis of Finance and Accounting, 6: 73-102.
Pettway, R.H., and T. Keneko. (1996). The effects of removing price limits and
introducing auctions upon short term IPO returns:The case of Japanese IPOs,
Pacific-Basin Finance Journal 4: 241-258.
Ritter, J.R. (1991), The long run performance of initial public offerings, Journal of
Finance, 46: 3-27.
Rock, K. (1986) “Why New Issues are Underpriced,” Journal of Financial Economics
15: 187- 212.
Ryan, S.G. (1997), A survey of research relating accounting numbers to systematic
equity risk, with implication for risk disclosure policy and future research,
Accounting Horizons, 11 (2): 82-95.
Teoh, S.H., I. Welch, and T.J. Wong. (1998), Earnings Management and the Long-Run
Performance of Initial Public Offerings. Journal of Finance 53(6): 1935-1974.
AKPM-13 23
Titman, S. & Trueman, B. (1986), Information quality and the valuation of new issues,
Journal of Accounting and Economics: 159-172.
White, G.I., A.C. Sondhi, , and D. Fried. (2003), The Analysis and Use of Financial
Statements, 3rd ed., New York, John Wiley & Sons, Inc.