price-book value ratio: definition - new yorkpeople.stern.nyu.edu/adamodar/pdfiles/pbv.pdf ·...
TRANSCRIPT
Price-Book Value Ratio: DefinitionPrice-Book Value Ratio: Definition
l The price/book value ratio is the ratio of the market value of equity to the book value of equity, i.e., the measure of shareholders’ equity in the balance sheet.
l Price/Book Value = Market Value of Equity
Book Value of Equity
l Consistency Tests:– If the market value of equity refers to the market value of equity of
common stock outstanding, the book value of common equity should be used in the denominator.
– If there is more that one class of common stock outstanding, the market values of all classes (even the non-traded classes) needs to be factored in.
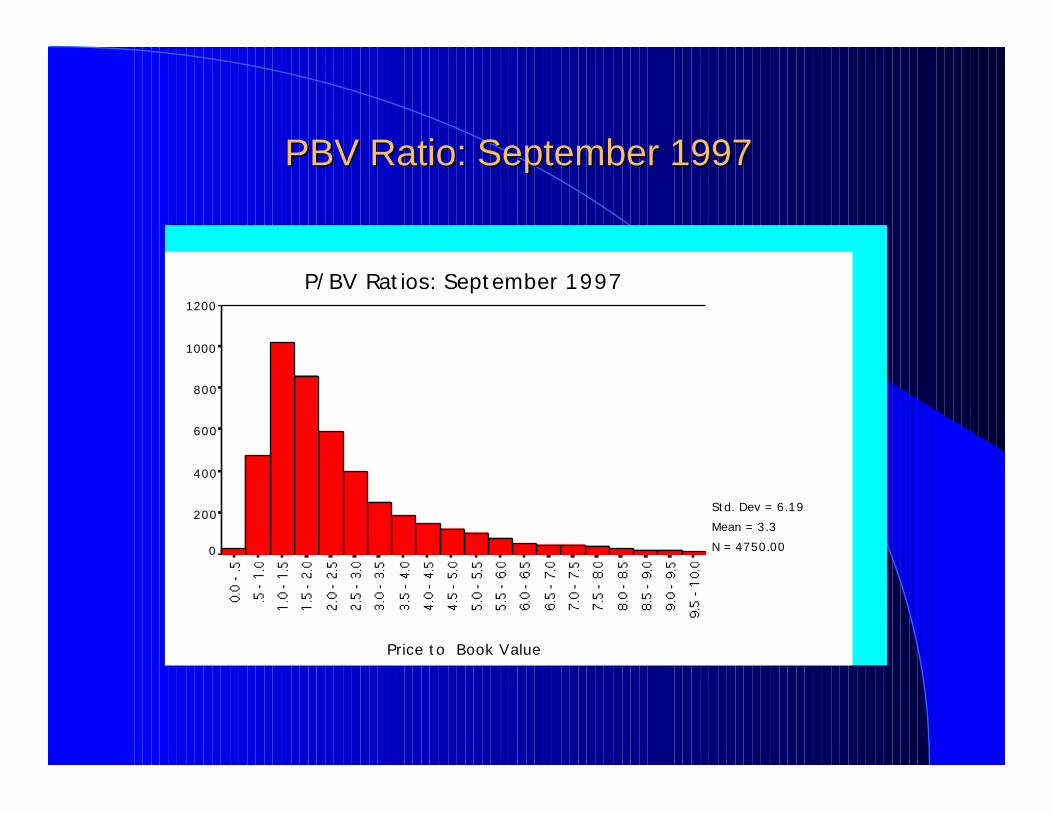
PBV Ratio: September 1997PBV Ratio: September 1997
Std. Dev = 6.19
Mean = 3.3
N = 4750.00
Price to Book Value
P/BV Ratios: September 19971200
1000
800
600
400
200
0
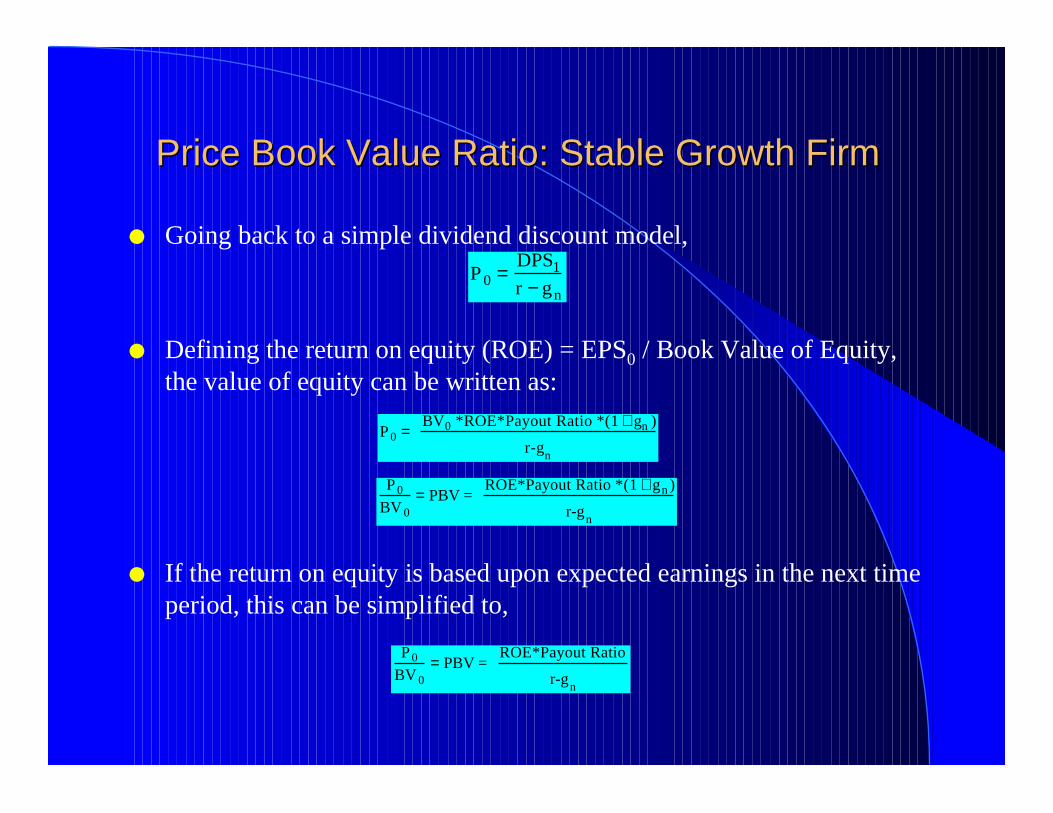
Price Book Value Ratio: Stable Growth FirmPrice Book Value Ratio: Stable Growth Firm
l Going back to a simple dividend discount model,
l Defining the return on equity (ROE) = EPS0 / Book Value of Equity, the value of equity can be written as:
l If the return on equity is based upon expected earnings in the next time period, this can be simplified to,
P0 =DPS1
r − gn
P 0 = BV0 *ROE*Payout Ratio *(1 + gn )
r-gn
P 0
BV 0= PBV =
ROE*Payout Ratio *(1 + gn )
r-gn
P 0
BV 0= PBV =
ROE*Payout Ratio
r-gn
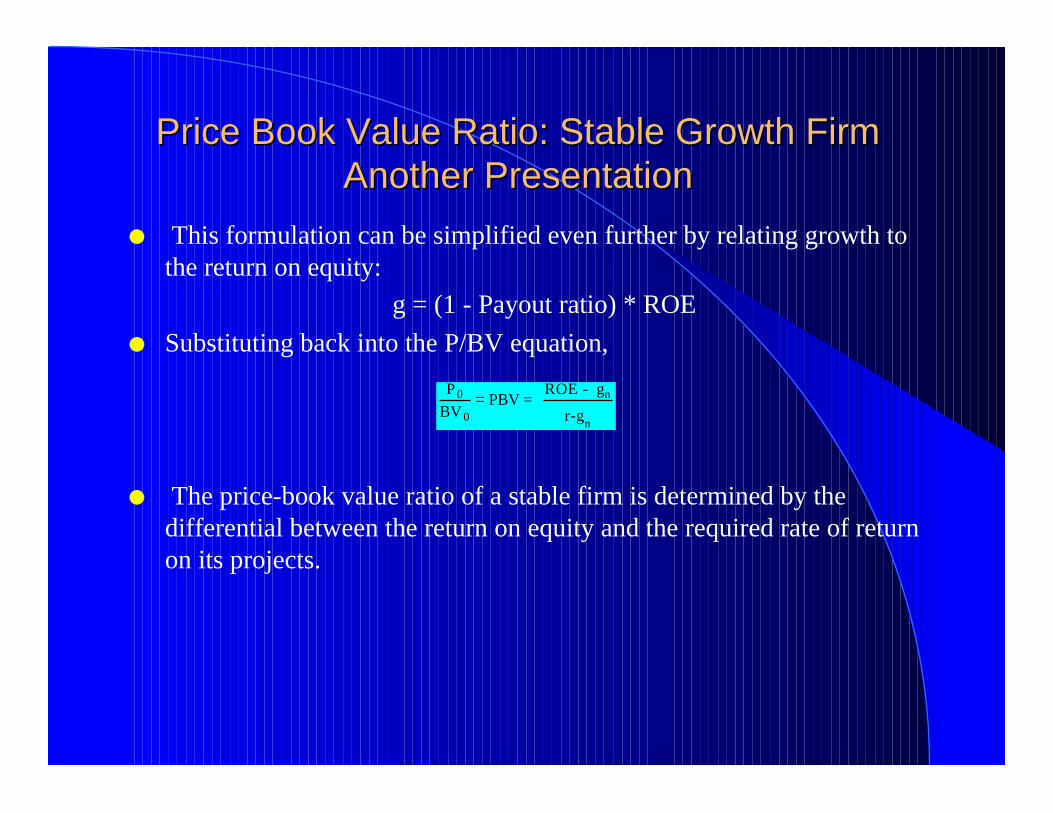
Price Book Value Ratio: Stable Growth FirmPrice Book Value Ratio: Stable Growth FirmAnother PresentationAnother Presentation
l This formulation can be simplified even further by relating growth to the return on equity:
g = (1 - Payout ratio) * ROE
l Substituting back into the P/BV equation,
l The price-book value ratio of a stable firm is determined by the differential between the return on equity and the required rate of return on its projects.
P 0
BV 0= PBV =
ROE - gn
r-gn
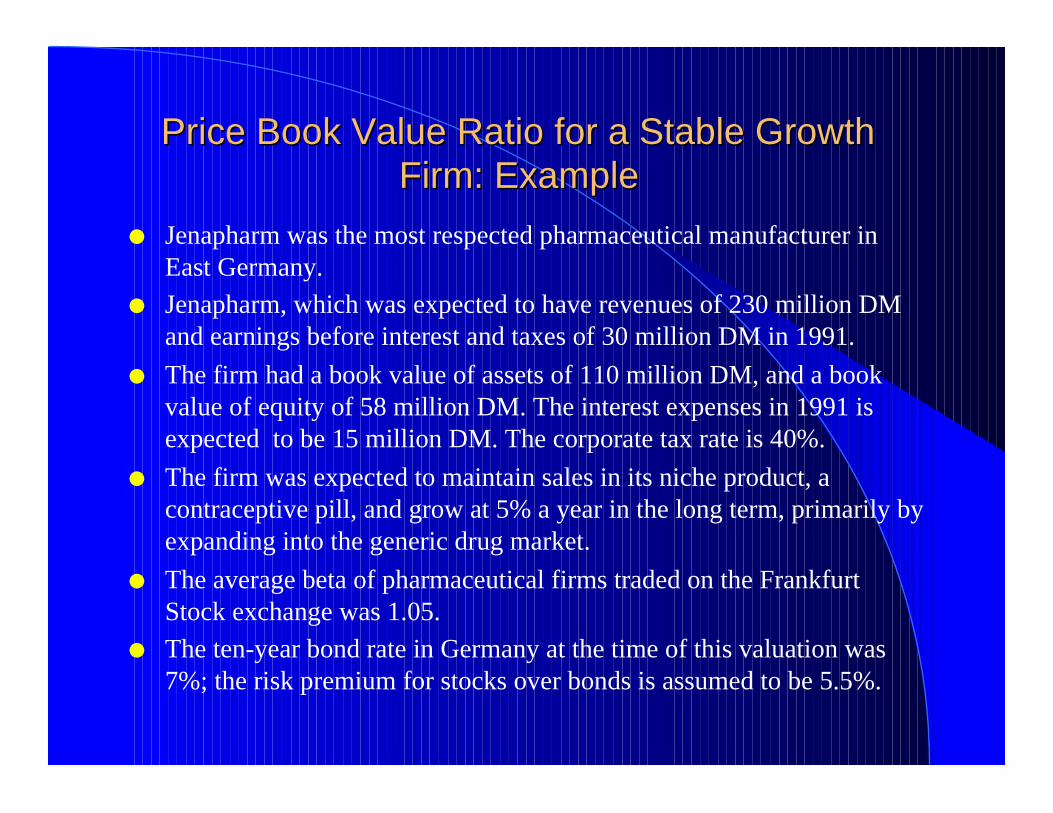
Price Book Value Ratio for a Stable Growth Price Book Value Ratio for a Stable Growth Firm: ExampleFirm: Example
l Jenapharm was the most respected pharmaceutical manufacturer in East Germany.
l Jenapharm, which was expected to have revenues of 230 million DM and earnings before interest and taxes of 30 million DM in 1991.
l The firm had a book value of assets of 110 million DM, and a book value of equity of 58 million DM. The interest expenses in 1991 is expected to be 15 million DM. The corporate tax rate is 40%.
l The firm was expected to maintain sales in its niche product, a contraceptive pill, and grow at 5% a year in the long term, primarily by expanding into the generic drug market.
l The average beta of pharmaceutical firms traded on the Frankfurt Stock exchange was 1.05.
l The ten-year bond rate in Germany at the time of this valuation was 7%; the risk premium for stocks over bonds is assumed to be 5.5%.
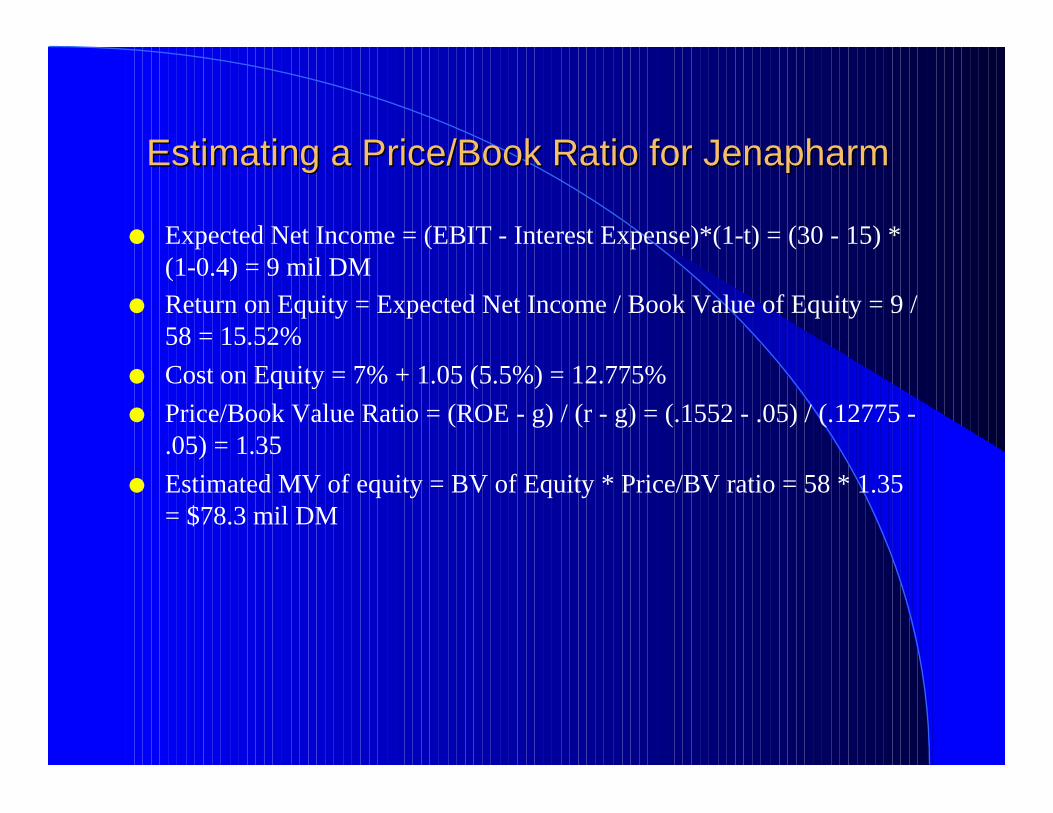
Estimating a Price/Book Ratio for JenapharmEstimating a Price/Book Ratio for Jenapharm
l Expected Net Income = (EBIT - Interest Expense)*(1-t) = (30 - 15) *(1-0.4) = 9 mil DM
l Return on Equity = Expected Net Income / Book Value of Equity = 9 / 58 = 15.52%
l Cost on Equity = 7% + 1.05 (5.5%) = 12.775%
l Price/Book Value Ratio = (ROE - g) / (r - g) = (.1552 - .05) / (.12775 - .05) = 1.35
l Estimated MV of equity = BV of Equity * Price/BV ratio = 58 * 1.35 = $78.3 mil DM
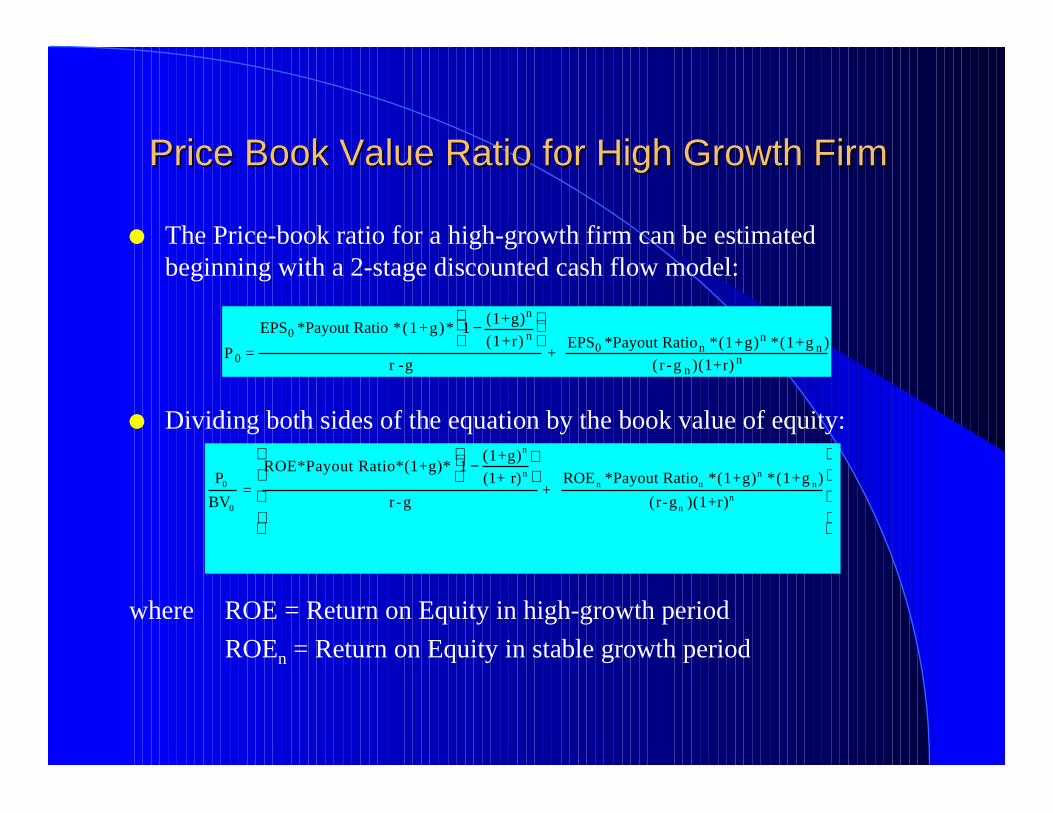
Price Book Value Ratio for High Growth FirmPrice Book Value Ratio for High Growth Firm
l The Price-book ratio for a high-growth firm can be estimated beginning with a 2-stage discounted cash flow model:
l Dividing both sides of the equation by the book value of equity:
where ROE = Return on Equity in high-growth period
ROEn = Return on Equity in stable growth period
P 0 =
EPS0 *Payout Ratio *(1+g)* 1 − (1+g)n
(1+r) n
r -g+
EPS0 *Payout Ration *(1+g)n *(1+g n )
( r -g n )(1+r) n
P0
BV0
=
ROE*Payout Ratio*(1+g)* 1 −(1+g)n
(1+ r)n
r -g
+ ROEn *Payout Ration *(1+g)n *(1+g n)
(r-gn )(1+r)n
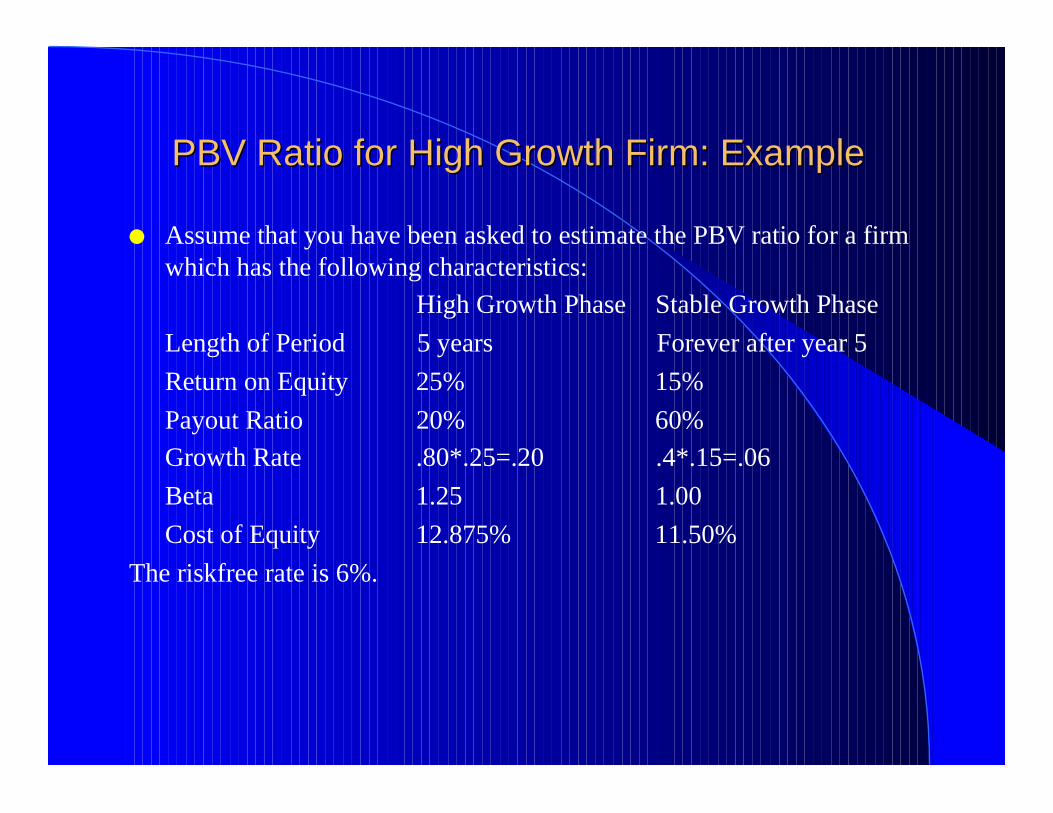
PBV Ratio for High Growth Firm: ExamplePBV Ratio for High Growth Firm: Example
l Assume that you have been asked to estimate the PBV ratio for a firm which has the following characteristics:
High Growth Phase Stable Growth Phase
Length of Period 5 years Forever after year 5
Return on Equity 25% 15%
Payout Ratio 20% 60%
Growth Rate .80*.25=.20 .4*.15=.06
Beta 1.25 1.00
Cost of Equity 12.875% 11.50%
The riskfree rate is 6%.
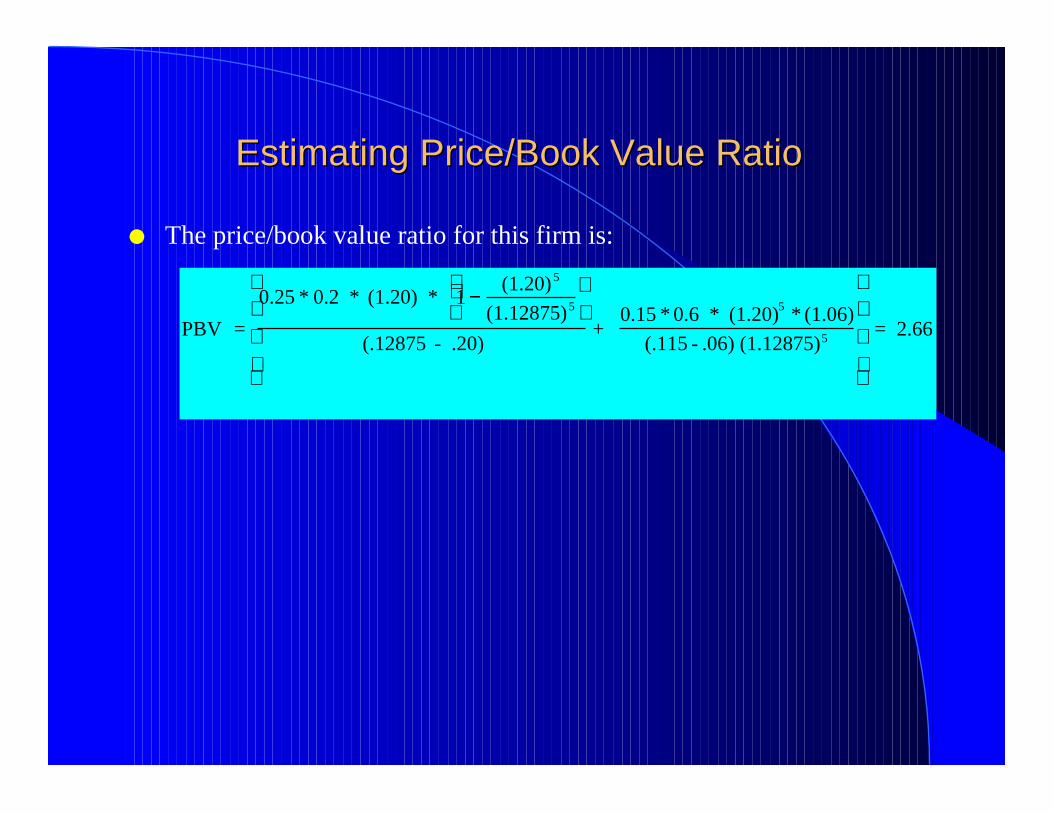
Estimating Price/Book Value RatioEstimating Price/Book Value Ratio
l The price/book value ratio for this firm is:
PBV =
0.25 * 0.2 * (1.20) * 1 − (1.20) 5
(1.12875)5
(.12875 - .20)
+ 0.15 * 0.6 * (1.20)5 * (1.06)
(.115 - .06) (1.12875)5
= 2.66

PBV and ROE: The KeyPBV and ROE: The Key
PBV and ROE: Risk Scenarios
0
0.5
1
1.5
2
2.5
3
3.5
4
10% 15% 20% 25% 30%
ROE
Pric
e/Boo
k V
alue
Rat
ios
Beta=0.5Beta=1Beta=1.5
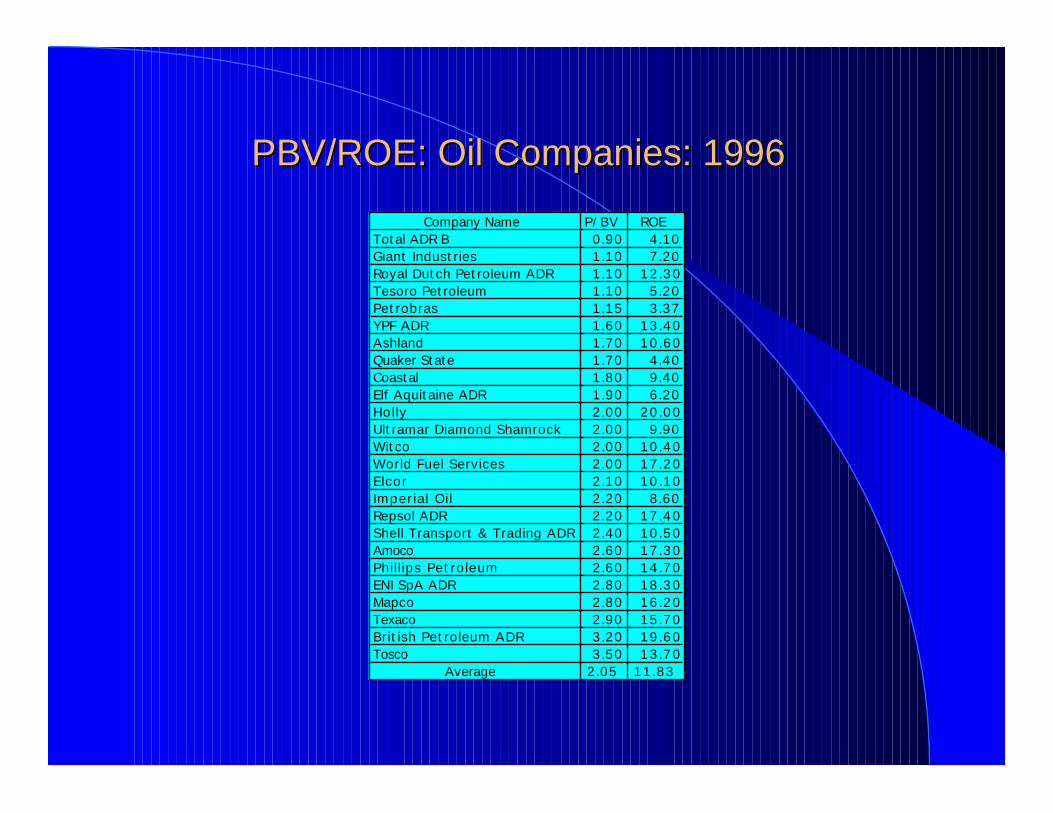
PBV/ROE: Oil Companies: 1996PBV/ROE: Oil Companies: 1996
Company Name P/BV ROETotal ADR B 0.90 4.10Giant Industries 1.10 7.20Royal Dutch Petroleum ADR 1.10 12.30Tesoro Petroleum 1.10 5.20Petrobras 1.15 3.37YPF ADR 1.60 13.40Ashland 1.70 10.60Quaker State 1.70 4.40Coastal 1.80 9.40Elf Aquitaine ADR 1.90 6.20Holly 2.00 20.00Ultramar Diamond Shamrock 2.00 9.90Witco 2.00 10.40World Fuel Services 2.00 17.20Elcor 2.10 10.10Imperial Oil 2.20 8.60Repsol ADR 2.20 17.40Shell Transport & Trading ADR 2.40 10.50Amoco 2.60 17.30Phillips Petroleum 2.60 14.70ENI SpA ADR 2.80 18.30Mapco 2.80 16.20Texaco 2.90 15.70British Petroleum ADR 3.20 19.60Tosco 3.50 13.70
Average 2.05 11.83

PBV versus ROE regressionPBV versus ROE regression
l Regressing PBV ratios against ROE for oil companies yields the following regression:
PBV = 0.96 + 9.28 (ROE) R2 = 46.67%
l For every 1% increase in ROE, the PBV ratio should increase by 0.0928.

Valuing PemexValuing Pemex
l Assume that you have been asked to value a PEMEX for the Mexican Government; All you know is that it has earned a return on equity of 14% last year. The appropriate P/BV ratio can be estimated in one of two ways –– Beta based upon international oil companies = 0.70
– Cost of Equity = 7.50% + 0.70 (5.50%) = 11.35%
l P/BV Ratio (based upon regression) = 0.96 + 9.28 * 0.14 = 2.26

Looking for undervalued securities - PBV Looking for undervalued securities - PBV Ratios and ROERatios and ROE
l Given the relationship between price-book value ratios and returns on equity, it is not surprising to see firms which have high returns on equity selling for well above book value and firms which have low returns on equity selling at or below book value.
l The firms which should draw attention from investors are those which provide mismatches of price-book value ratios and returns on equity - low P/BV ratios and high ROE or high P/BV ratios and low ROE.
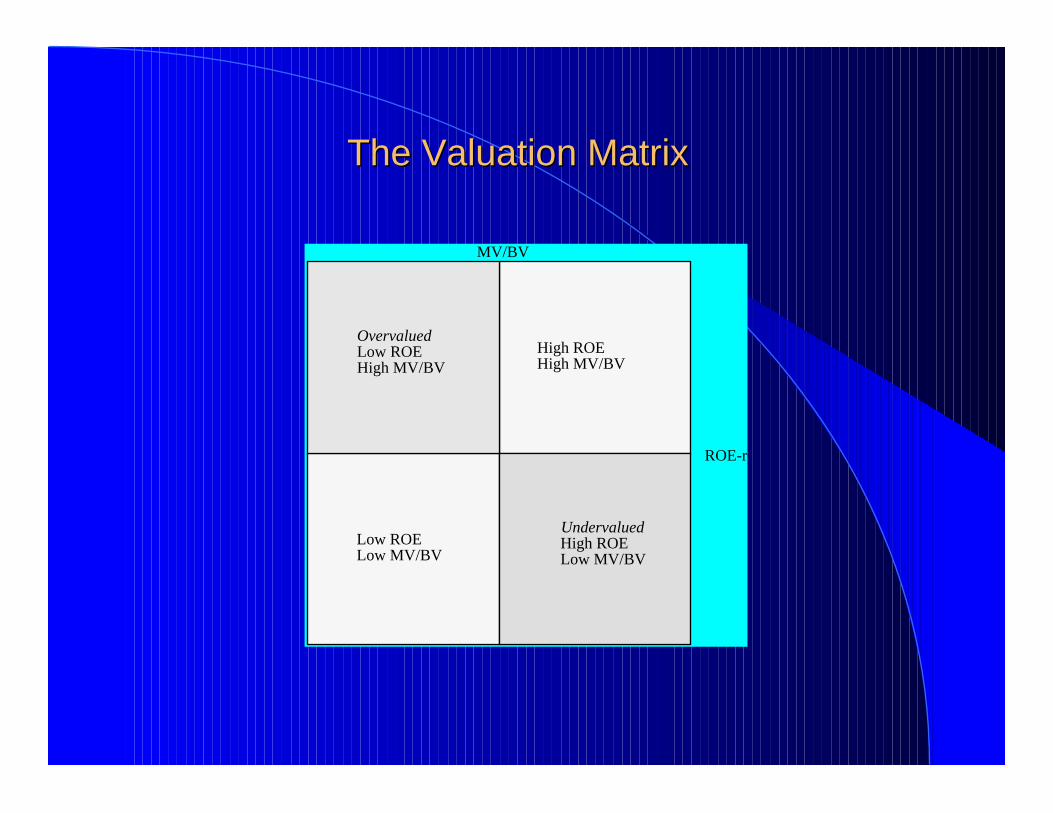
The Valuation MatrixThe Valuation Matrix
MV/BV
ROE-r
High ROEHigh MV/BV
Low ROELow MV/BV
OvervaluedLow ROEHigh MV/BV
UndervaluedHigh ROELow MV/BV
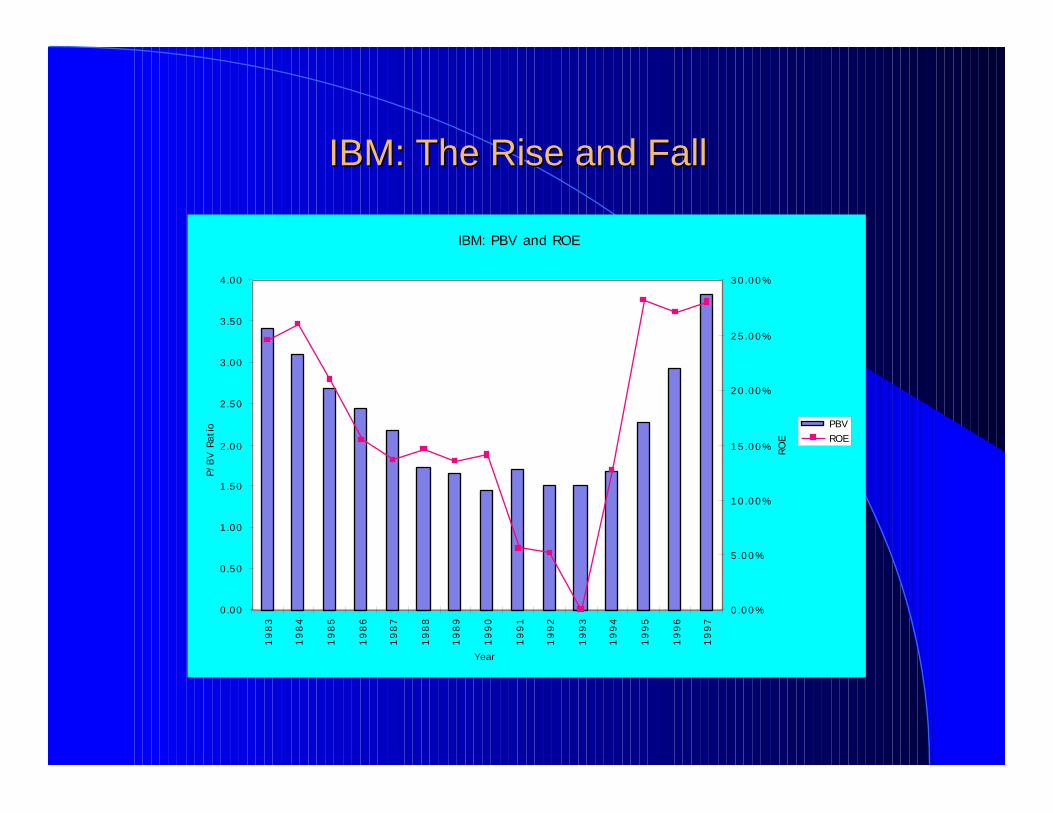
IBM: The Rise and FallIBM: The Rise and Fall
IBM: PBV and ROE
0.00
0.50
1.00
1.50
2.00
2.50
3.00
3.50
4.001
98
3
19
84
19
85
19
86
19
87
19
88
19
89
19
90
19
91
19
92
19
93
19
94
19
95
19
96
19
97
Year
P/BV
Rat
io
0.00%
5.00%
10.00%
15.00%
20.00%
25.00%
30.00%
ROE
PBVROE
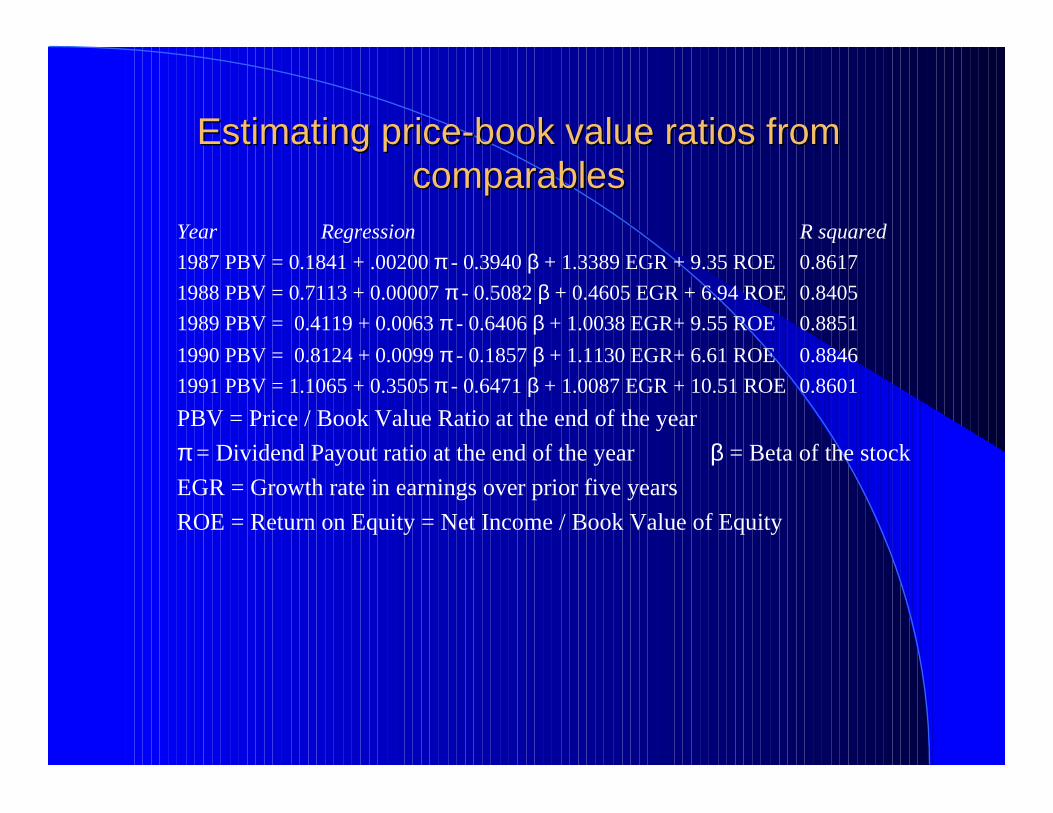
Estimating price-book value ratios from Estimating price-book value ratios from comparablescomparables
Year Regression R squared
1987 PBV = 0.1841 + .00200 π - 0.3940 β + 1.3389 EGR + 9.35 ROE 0.8617
1988 PBV = 0.7113 + 0.00007 π - 0.5082 β + 0.4605 EGR + 6.94 ROE 0.8405
1989 PBV = 0.4119 + 0.0063 π - 0.6406 β + 1.0038 EGR+ 9.55 ROE 0.8851
1990 PBV = 0.8124 + 0.0099 π - 0.1857 β + 1.1130 EGR+ 6.61 ROE 0.8846
1991 PBV = 1.1065 + 0.3505 π - 0.6471 β + 1.0087 EGR + 10.51 ROE 0.8601
PBV = Price / Book Value Ratio at the end of the year
π = Dividend Payout ratio at the end of the year β = Beta of the stock
EGR = Growth rate in earnings over prior five years
ROE = Return on Equity = Net Income / Book Value of Equity
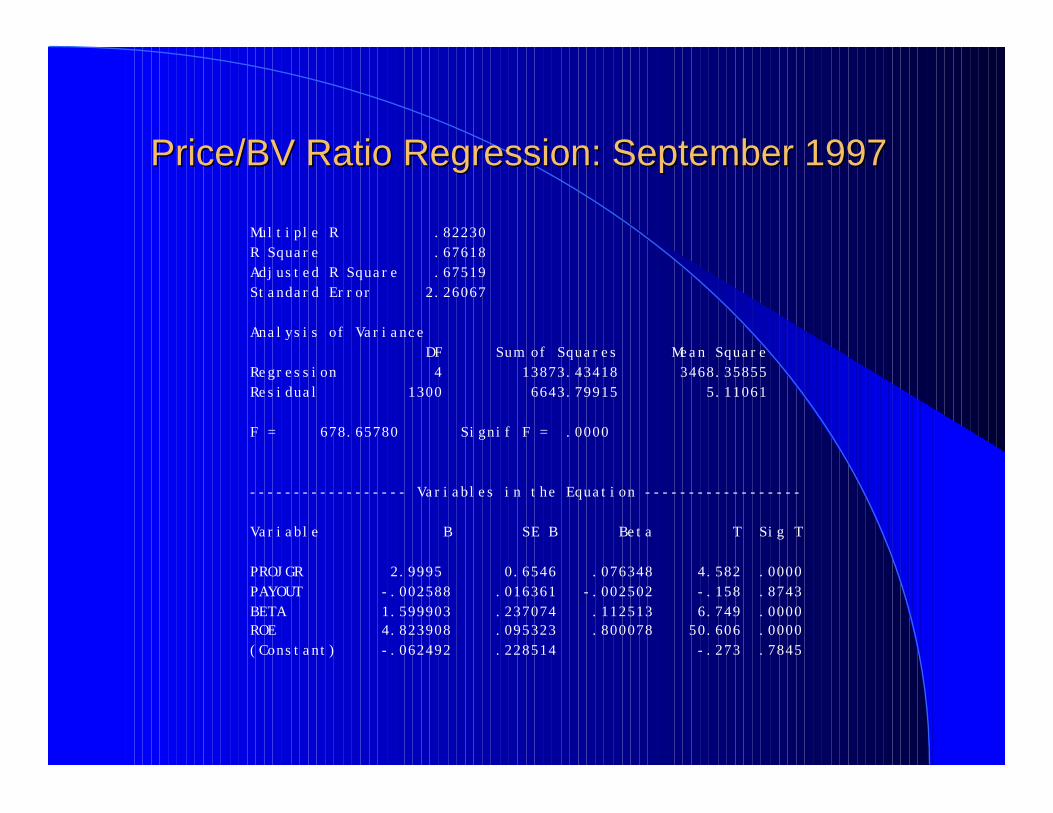
Price/BV Ratio Regression: September 1997Price/BV Ratio Regression: September 1997
Multiple R .82230R Square .67618Adjusted R Square .67519Standard Error 2.26067
Analysis of Variance DF Sum of Squares Mean SquareRegression 4 13873.43418 3468.35855Residual 1300 6643.79915 5.11061
F = 678.65780 Signif F = .0000
------------------ Variables in the Equation ------------------
Variable B SE B Beta T Sig T
PROJGR 2.9995 0.6546 .076348 4.582 .0000PAYOUT -.002588 .016361 -.002502 -.158 .8743BETA 1.599903 .237074 .112513 6.749 .0000ROE 4.823908 .095323 .800078 50.606 .0000(Constant) -.062492 .228514 -.273 .7845
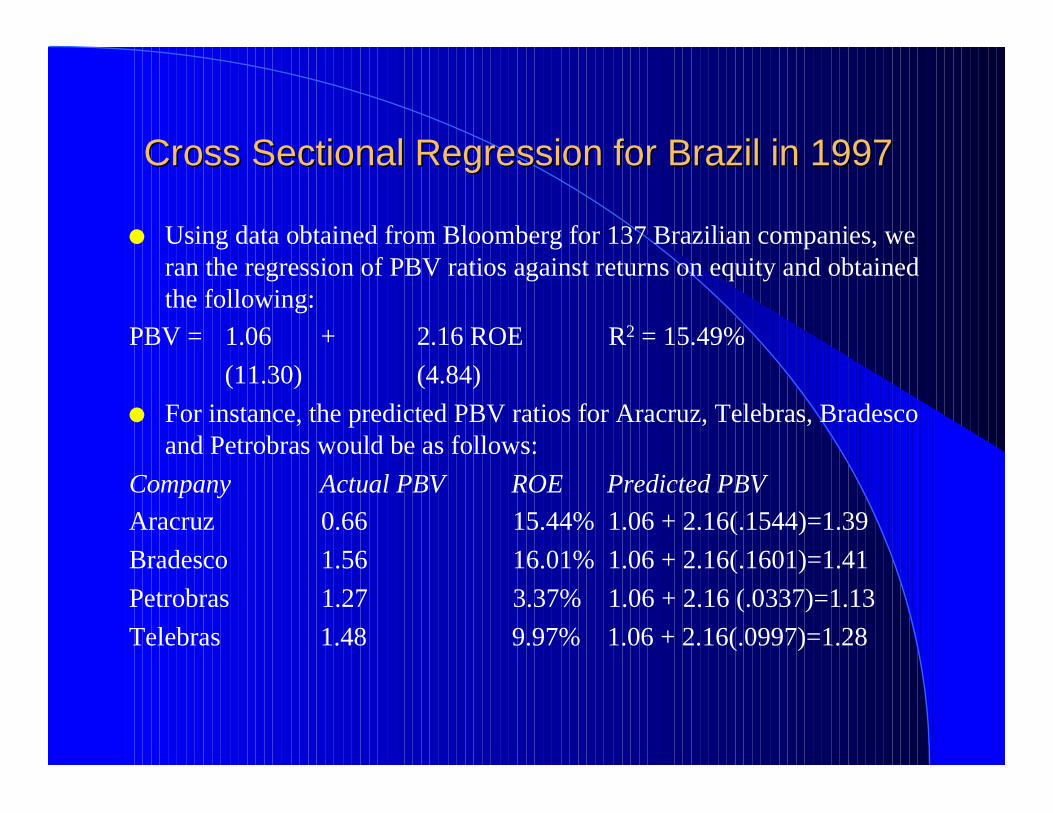
Cross Sectional Regression for Brazil in 1997Cross Sectional Regression for Brazil in 1997
l Using data obtained from Bloomberg for 137 Brazilian companies, we ran the regression of PBV ratios against returns on equity and obtained the following:
PBV = 1.06 + 2.16 ROE R2 = 15.49%
(11.30) (4.84)
l For instance, the predicted PBV ratios for Aracruz, Telebras, Bradesco and Petrobras would be as follows:
Company Actual PBV ROE Predicted PBV
Aracruz 0.66 15.44% 1.06 + 2.16(.1544)=1.39
Bradesco 1.56 16.01% 1.06 + 2.16(.1601)=1.41
Petrobras 1.27 3.37% 1.06 + 2.16 (.0337)=1.13
Telebras 1.48 9.97% 1.06 + 2.16(.0997)=1.28
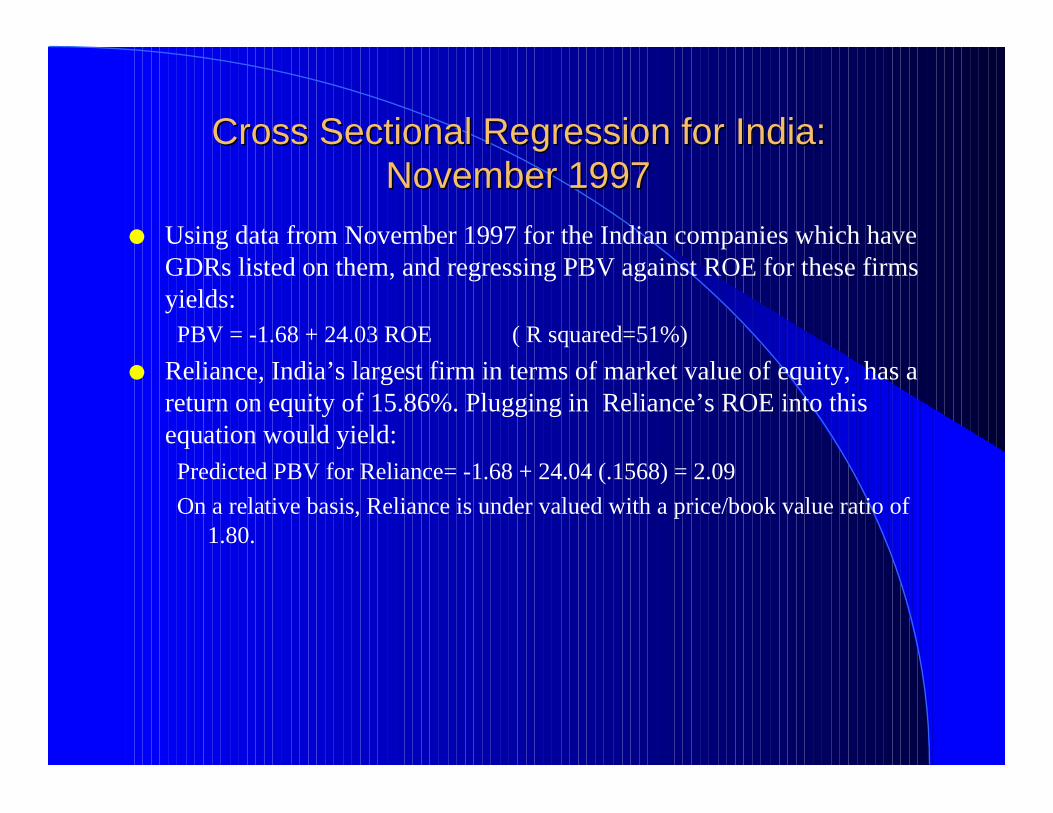
Cross Sectional Regression for India: Cross Sectional Regression for India: November 1997November 1997
l Using data from November 1997 for the Indian companies which have GDRs listed on them, and regressing PBV against ROE for these firms yields:PBV = -1.68 + 24.03 ROE ( R squared=51%)
l Reliance, India’s largest firm in terms of market value of equity, has a return on equity of 15.86%. Plugging in Reliance’s ROE into this equation would yield:Predicted PBV for Reliance= -1.68 + 24.04 (.1568) = 2.09
On a relative basis, Reliance is under valued with a price/book value ratio of 1.80.
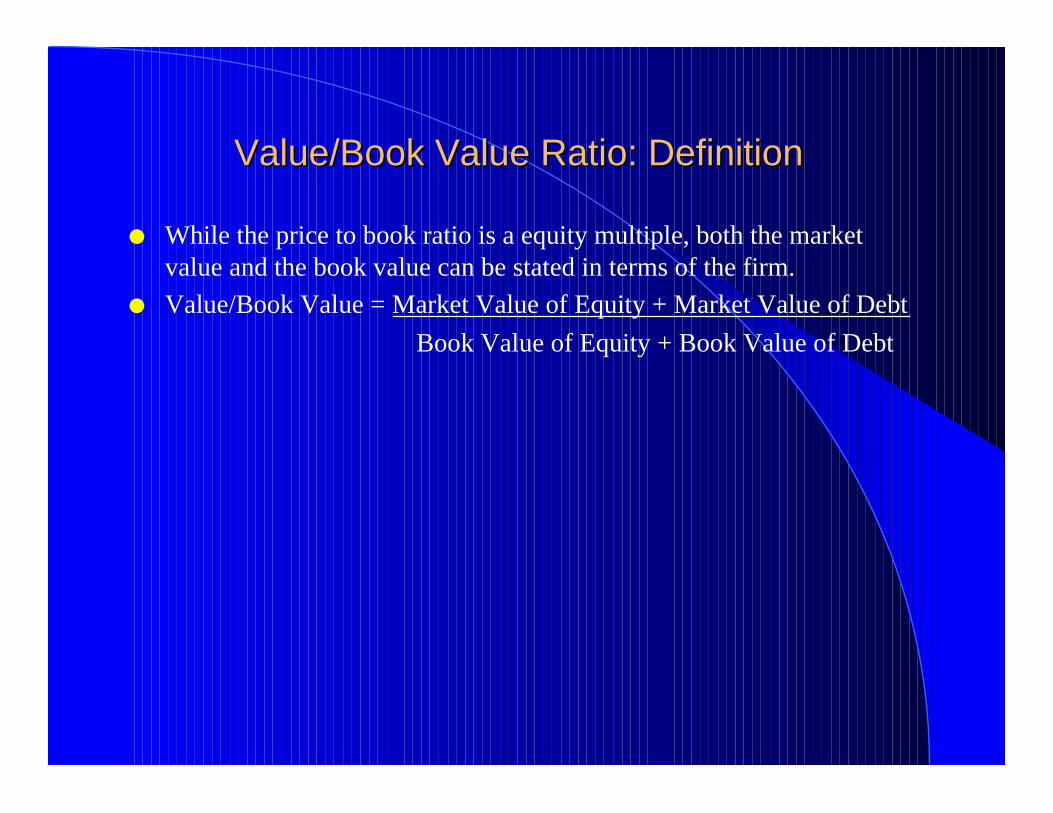
Value/Book Value Ratio: DefinitionValue/Book Value Ratio: Definition
l While the price to book ratio is a equity multiple, both the market value and the book value can be stated in terms of the firm.
l Value/Book Value = Market Value of Equity + Market Value of Debt
Book Value of Equity + Book Value of Debt
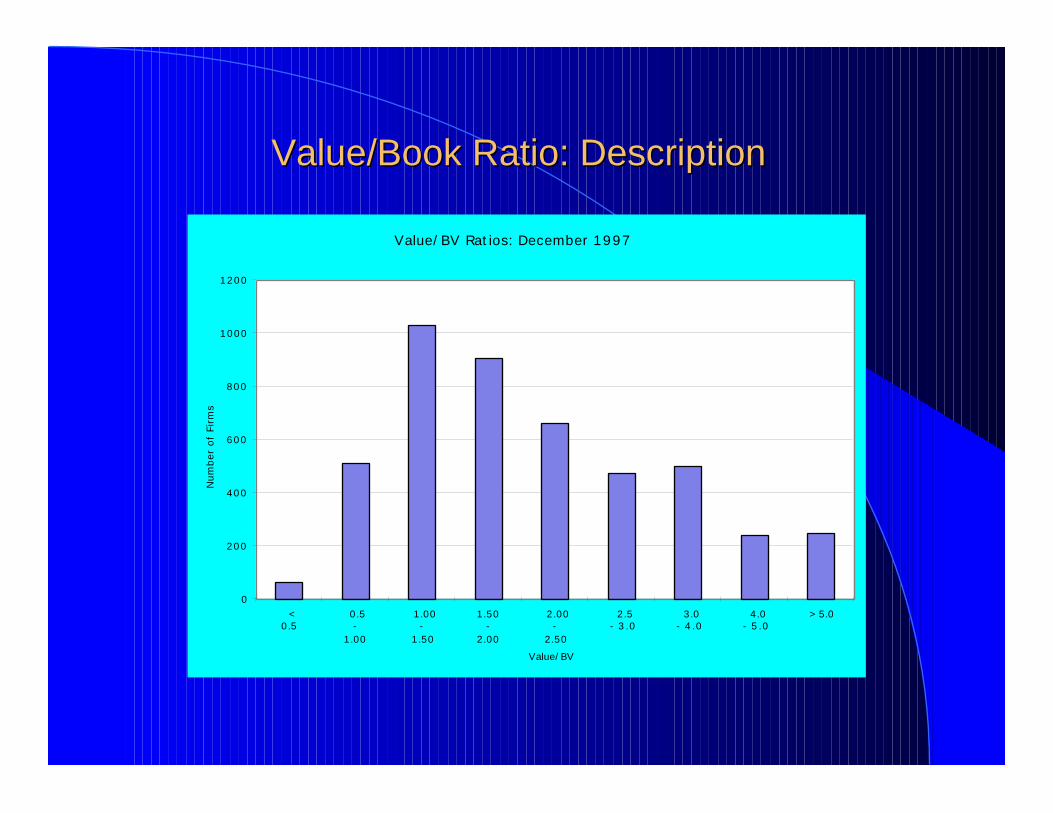
Value/Book Ratio: DescriptionValue/Book Ratio: Description
Value/BV Ratios: December 1997
0
200
400
600
800
1000
1200
<0.5
0.5-
1.00
1.00-
1.50
1.50-
2.00
2.00-
2.50
2.5- 3.0
3.0- 4.0
4.0- 5.0
> 5.0
Value/BV
Num
ber
of F
irm
s
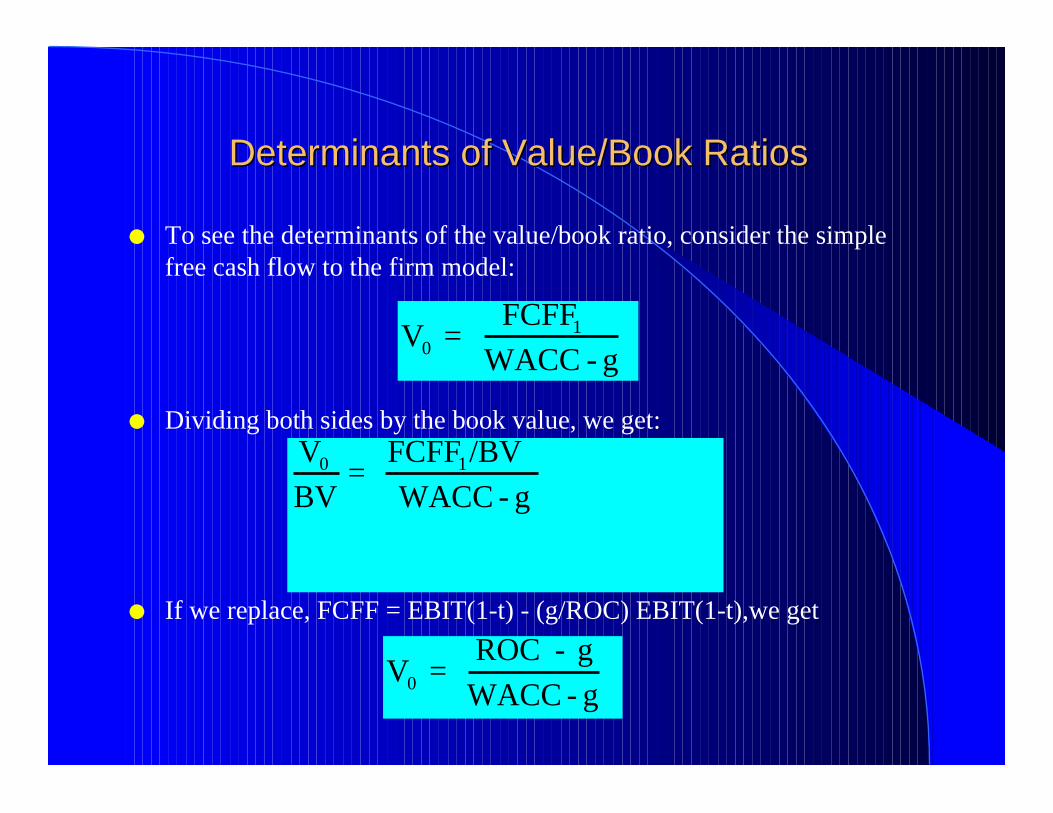
Determinants of Value/Book RatiosDeterminants of Value/Book Ratios
l To see the determinants of the value/book ratio, consider the simple free cash flow to the firm model:
l Dividing both sides by the book value, we get:
l If we replace, FCFF = EBIT(1-t) - (g/ROC) EBIT(1-t),we get
V0 = FCFF1
WACC - g
V0
BV=
FCFF1/BV
WACC - g
V0 = ROC - g
WACC - g
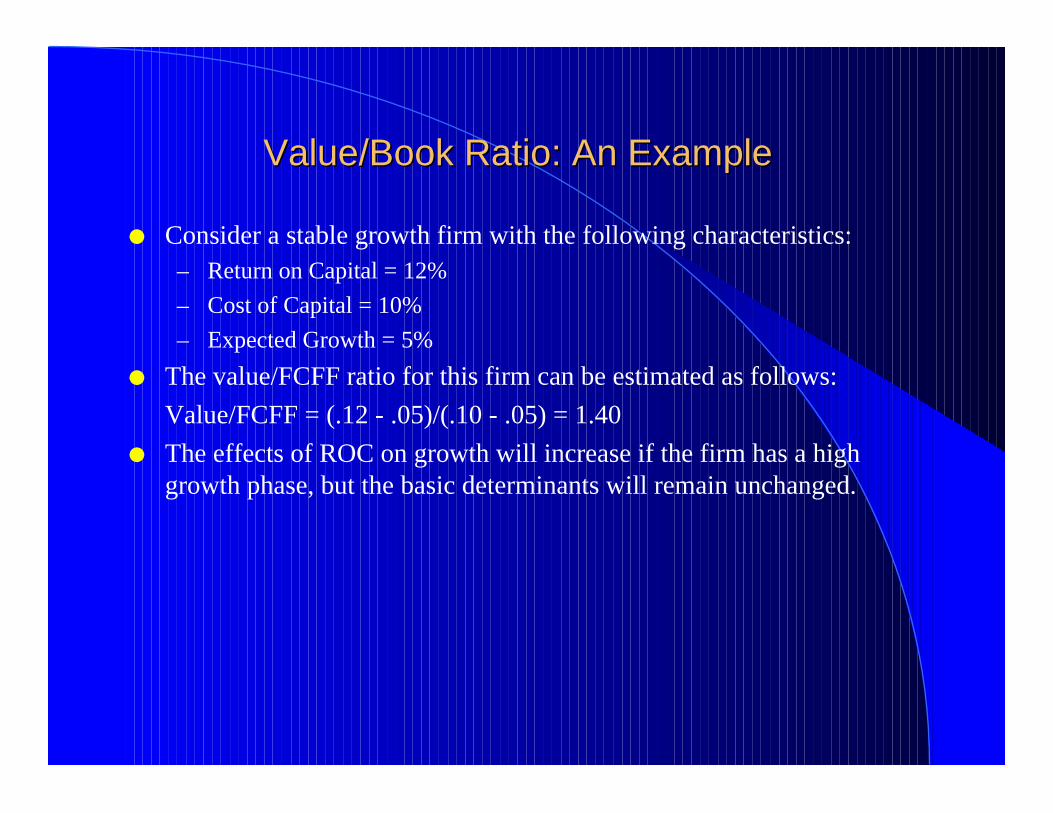
Value/Book Ratio: An ExampleValue/Book Ratio: An Example
l Consider a stable growth firm with the following characteristics:– Return on Capital = 12%
– Cost of Capital = 10%
– Expected Growth = 5%
l The value/FCFF ratio for this firm can be estimated as follows:
Value/FCFF = (.12 - .05)/(.10 - .05) = 1.40
l The effects of ROC on growth will increase if the firm has a high growth phase, but the basic determinants will remain unchanged.
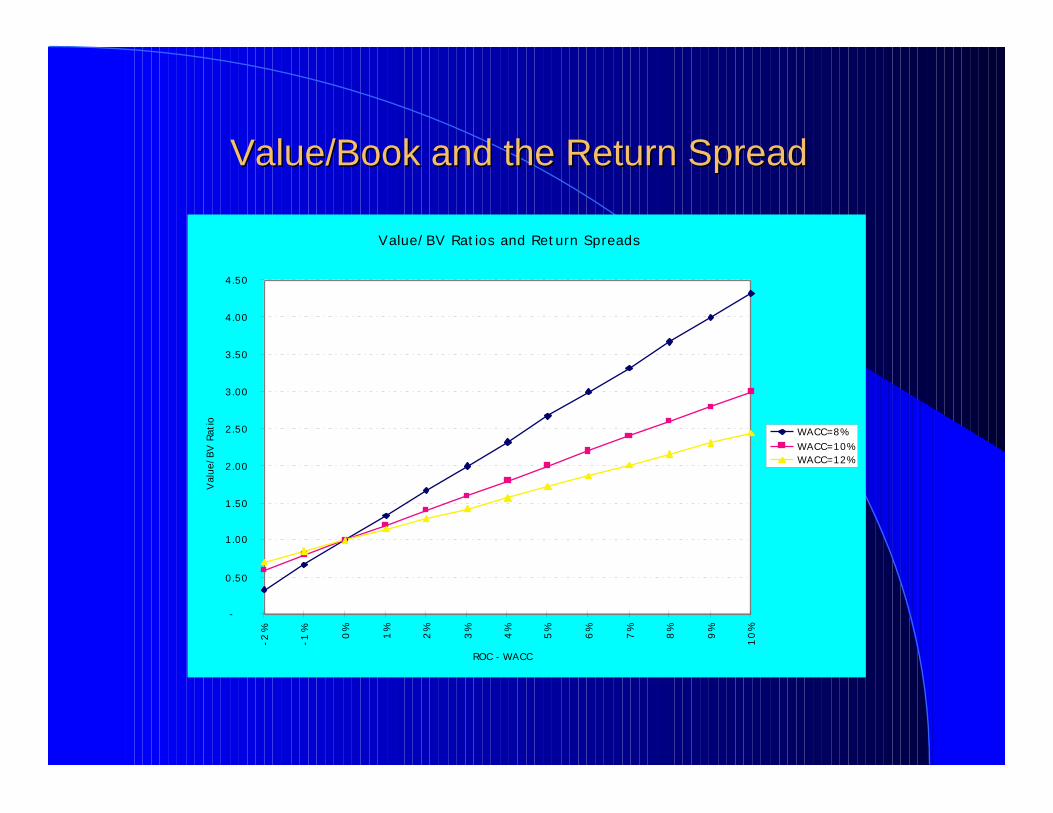
Value/Book and the Return SpreadValue/Book and the Return Spread
Value/BV Ratios and Return Spreads
-
0.50
1.00
1.50
2.00
2.50
3.00
3.50
4.00
4.50
-2%
-1%
0%
1%
2%
3%
4%
5%
6%
7%
8%
9%
10
%
ROC - WACC
Val
ue/B
V R
atio
WACC=8%WACC=10%WACC=12%