accounting conservatism and the limits to earnings management · accounting conservatism and the...
TRANSCRIPT
Accounting conservatism and the limits to earnings management
Juan Manuel García Lara
Universidad Carlos III de Madrid
Beatriz García Osma
Universidad Autónoma de Madrid
Fernando Penalva†
IESE Business School, University of Navarra
This draft: April, 2012
† Corresponding author. IESE Business School, University of Navarra, Av. Pearson, 21, 08034 Barcelona, Spain. E-mail: [email protected]. Tel. (+34) 93 253 4200, Fax. (+34) 93 253 4343.
We thank Bill Rees, Fengyun Wu, and seminar participants at the 2010 European Accounting Association annual congress, the 2010 American Accounting Association annual meeting, and the 2011 Workshop on Empirical Research in Financial Accounting for their comments and suggestions. We acknowledge financial assistance from the Spanish Ministry of Innovation and Science (ECO2010-19314) and the European Commission INTACCT Research Training Network (MRTN-CT-2006-035850).

Accounting conservatism and the limits to earnings management
Abstract
We study the association between conservatism and both accrual and real earnings management.
Conservatism facilitates the monitoring of managerial accounting choices, potentially limiting
the opportunities for accruals-based earnings management. To the extent that managers face
constraints to manipulate accruals, we expect that they may shift to potentially more costly real
earnings management practices, which they may, in fact, prefer (Graham, Harvey and Rajgopal
2005). Using a large US sample for the period 1991-2010 we find a negative association between
conservatism and measures of accruals manipulation, and a positive association between
conservatism and real earnings management. We also find that more conservative firms have less
probabilities of being suspect of having engaged in earnings management (of any type) to
achieve earnings benchmarks.
Keywords: Conservatism, earnings asymmetric timeliness, earnings management,
manipulation of real operating activities
Data Availability: Data is available from the sources identified in the paper.
JEL Classification: G10, G31, M41.

1
1. Introduction
Managers take accounting and real decisions with the intent to mislead firm stakeholders about
the underlying economic performance of the firm. This earnings management reduces the
precision of the earnings signal, increasing outsiders’ uncertainty (Rajgopal and Venkatachalam
2011), as well as potentially leading to information asymmetries among firm insiders and to
decreases in investment efficiency. Earnings management not only conceals the company actual
performance, but it also masks underlying trends in revenue and earnings growth, which help to
build expectations of future growth and product demand (McNichols and Stubben 2008).
It is thus not surprising that the different parties to the firm perceive earnings
management as undesirable and attempt to reduce discretion by tightening managerial
monitoring. However, tighter monitoring may lead to a substitution effect, in that, keeping
managerial incentives constant, reducing accounting accruals manipulation may increase real
earnings management (Demski 2004, Ewert and Wagenhofer 2005). Real earnings management
implies that managers deviate from their optimal plans of action to affect earnings, by timing or
structuring real transactions, and thus, imposing real costs to the firm.
In this paper, we study the association between conservatism in accounting and both
types of earnings management. Conservatism is the consequence of the asymmetric verifiability
requirements for the recognition of economic gains and losses in firm financial statements, which
result in accounting information that reflects economic losses in a timelier manner than gains
(Basu 1997). Recent literature predicts that conservatism imposes limits to earnings management
practices. Guay and Verrecchia (2006) argue that conditional conservatism, by imposing timely
recognition of losses and delaying the recognition of economic gains, reduces the opportunities
for successful earnings management. This is consistent with the broader view of conservatism in

2
Watts (2003a), who makes the argument that an important role of conservatism is to constrain
management’s opportunistic financial reporting behavior and to offset biases introduced in
financial reports by self-interested parties. The analytical work of Chen, Hemmer and Zhang
(2007) confirms this viewpoint. They show that conservatism can reduce opportunistic biases in
accounting by dampening firm insiders’ incentives to manage earnings.
However, critical voices claim that more stringent monitoring leads to inefficiencies in
corporate governance. Hermalin and Weisbach (2012, p. 196) argue that “increased monitoring
can give management incentives to engage in value-reducing activities intended to make them
appear more able.” Consistent with this broader view of the consequences of increased
monitoring, Demski (2004) and Ewert and Wagenhofer (2005) analytically demonstrate that
tighter accounting standards have the side-effect of increasing real earnings management, while
Cohen, Dey and Lys (2008) provide empirical evidence that the passage of the Sarbanes-Oxley
Act (SOX) was followed by a decrease in accrual-based earnings management but also, by an
increase in real earnings manipulation. The evidence in Cohen et al. (2008) indicates that firms
switched instruments, but continued manipulating earnings after SOX. This is in line with the
arguments in Ettredge, Scholz, Smith and Sun (2008), who make the case that management uses
up all the leeway within generally accepted accounting principles (GAAP) and cross the
boundary into other forms of manipulation when within-GAAP manipulation is exhausted.
Following this latter line of research, we investigate the aggregate consequences of
conservatism on both types of earnings management. To the extent that greater accounting
conservatism limits the opportunities for successful accrual-based manipulation, we expect to
observe a negative association between conservatism and accrual-based earnings management.
Conversely, if this disciplining role of conservatism increases the benefits of manipulating

3
transactions, we should observe that greater conservatism can lead to increases in real earnings
management.
Using a large sample of US firms for the period 1991-2010 we test these predictions on
the association between accounting conservatism and both types of earnings management. To do
so, we first construct and validate a firm-specific measure of conditional conservatism (CO)
based on the conservatism proxies developed by Givoly and Hayn (2000), Kahn and Watts
(2009) and Callen, Segal and Hope (2010). Second, we create measures of accruals-based
earnings management based on Jones (1991)-type accruals models, and of real earnings
management based on the work of Roychowdhury (2006). Using these proxies, we study the
association between prior accounting conservatism and current earnings management. Our tests
yield the following key findings. We show that accounting conservatism is associated with
decreased accrual earnings management, in line with the arguments in Watts (2003a), Guay and
Verrecchia (2006) and LaFond and Watts (2008). To the best of our knowledge, there is no prior
empirical evidence on this association. However, we also find that increased accounting
conservatism is associated with greater real earnings management, potentially indicating that
tighter monitoring may lead managers to switch amongst the different types of earnings
management, leading to increases in potentially more costly real earnings management.
This trade-off between accruals and real earnings management raises the issue of what is
the net effect of conservatism and whether its benefits (lower accrual-based earnings
management) may not be outweighed by its costs (greater real earnings management). To gauge
this net effect, we analyse whether conservatism decreases the overall probability that a firm
manipulates its financial statements (by using either method). In our empirical analysis, we
provide evidence that more conservative firms have less probabilities of being suspect of having

4
engaged in earnings management (of any type) to achieve earnings benchmarks, indicating that
in terms of the aggregate level of earnings management, the displacement from one type of
manipulation to another is moderate and overall, conservatism serves to constrain earnings
manipulation. Thus, we contribute to the literature on the consequences of more stringent
monitoring and the literature on the trade-offs between accrual-based and real earnings
management. We also provide new evidence on the consequences of conservatism in accounting.
The remainder of the paper is structured as follows. Section 2 contains the discussion on
the expected relation between conservatism and earnings management. Section 3 describes the
research methods, and the empirical measures of conservatism and earnings management that we
use in our tests. Section 4 presents the data and the empirical results. In Section 5 we carry out an
assessment of the construct validity of the conservatism measure used in the main tests. Finally,
Section 6 summarizes the findings and concludes.
2. Conservatism and the limits to accrual and real earnings management
2.1. Real versus accrual-based earnings management
Accrual accounting is at the core of the financial reporting system and it involves a myriad of
managerial estimations. Extant research in accounting shows that managers can use the
discretion inherent to accrual calculation and introduce biases in accounting numbers both for
opportunistic and informative purposes. Earnings management occurs when managers use this
flexibility with the intent to mislead firm stakeholders about the underlying economic

5
performance of the firm.1 Aside from this accrual- (purely accounting-) based type of
manipulation, earnings can also be managed by strategically timing and structuring transactions.
This alternative form of earnings management is denoted real earnings management, as it
involves real operating, investment or financing decisions (Schipper 1989). For example,
management may opportunistically increase earnings (making use of private information) by
reducing advertising expenses in any given month, restructuring the form of payment of a
transaction, choosing a specific firm provider, temporarily increasing sales discounts, or
strategically timing the sale of some assets.
Given that accruals-based earnings management is less costly for the firm than real
earnings management (Bhojraj, Hribar, Picconi and McInnis, 2009), it is generally assumed that
managers prefer to manipulate accruals rather than transactions, and that real earnings
management is a residual form of manipulation. This assumption, while plausible, fails to take
into consideration corporate governance dynamics, the prevalence of time-invariant earnings
management incentives, or the consequences of litigation risk. Managers have to answer for
earnings that fail to accurately reflect true economic performance before auditors, corporate
boards, audit committees, shareholders, and even courts. It is however less likely that they have
to respond for difficult to monitor operating, investment or financing decisions that fully fall
within their responsibilities and for which outsiders find it nearly impossible to estimate
deviations from optimal behavior. Accounting estimates may be undone and numbers
recalculated under differing assumptions, methods or procedures. This is hardly the case with
real firm operations. As argued in Garcia Osma (2008) it is unclear whether corporate
1 See Healy and Wahlen (1999) and Dechow and Skinner (2000) for reviews of the extant earnings management literature.

6
governance monitoring extends to questioning managers on certain transactions, particularly in
terms of reducing discretionary expenses, such as R&D or advertising outlays.
The survey study conducted by Graham et al. (2005) indicates that managers may in fact
prefer real earnings management to accrual-based earnings management. Their survey was
conducted in a period of increased accounting scrutiny, right after the spate of accounting
scandals that led to the demise of Arthur Andersen and the passage of SOX. Hence, at the time of
conducting the survey, managers were likely immersed in the switch from accrual-based to real
earnings management documented in Cohen et al. (2008). In fact, Cohen et al. argue that their
results are consistent with the evidence in Graham et al. (2005), and suggest that firms switched
to managing earnings through altering operational activities, possibly because these alterations to
operational activities, although more costly for the firm, are less costly for managers, as they
may be harder to detect, or at least, to question.
2.2. Conditional conservatism and earnings management
Recent literature argues that conditional conservatism, by imposing timely recognition of losses
and delaying the recognition of economic gains, reduces the opportunities for successful accrual-
based earnings management (Watts 2003a, Guay and Verrecchia 2006, LaFond and Watts, 2008).
This is so as, given that conservatism defers the recognition of gains and constrains the
overstatement of earnings and assets, under conservative accounting managers will find it more
difficult to opportunistically increase earnings to avoid breaking debt covenants, avoid missing
earnings targets or increase their compensation. The evidence linking conservatism to easier
access to debt financing (Göx and Wagenhofer, 2009; García Lara, García Osma and Penalva,
2012) and improved credit terms (Zhang, 2008) is also consistent with the view that more

7
conservative borrowers are less likely to expropriate debt-holders through accrual-based earnings
management. Also, LaFond and Watts (2008) argue that managers have incentives to overstate
earnings during their tenure to increase share price and, thus, their compensation. They argue that
conservatism reduces management’s ability to increase their wealth at the expense of
shareholders, especially in firms with large information asymmetries between managers and
investors. The evidence by Garcia Lara, Garcia Osma and Penalva (2011) that more conservative
firms are rewarded with a lower cost of capital is consistent with the view that shareholders
interpret conservatism as a governance tool that constrains accrual-based earnings management.
Consistent with this disciplining view of conservatism, recent research provides evidence of a
positive association between the strength of corporate governance and conditional conservatism
(Beekes, Pope and Young 2004, Ahmed and Duellman 2007, García Lara, García Osma and
Penalva 2009).
Although there is plenty of indirect evidence linking conservatism to reduced accrual-
based earnings management, there is virtually no prior research directly addressing the issue.
Only the analytical work of Chen et al. (2007) directly studies the disciplining role of
conservatism over managerial incentives for accrual-based earnings management. Chen et al.
(2007) demonstrate that not only does conservatism offset opportunistic biases by imposing
explicit constraints and reducing opportunities to introduce biases, but it also dampens firm
insiders’ incentives to manage earnings.
While the relation between conservatism and accrual-based earnings management has
been widely discussed in prior literature, the links between conservatism and real earnings
management have not attracted similar attention, and prior research has just focused on the more
general topic of the links between monitoring and real earnings management. In particular,

8
Demski (2004) and Ewert and Wagenhofer (2005) demonstrate that, in the presence of strong
monitoring (for example, tighter accounting standards), there is a substitution effect between
accrual-based and real earnings management. These authors show that tighter accounting
standards reduce accrual-based earnings management, but also increase real earnings
management. The explanation for this substitution is that tighter monitoring increases the
marginal benefits of real earnings management (Ewert and Wagenhofer 2005), or alternatively
stated, it lowers the disutility associated with engaging in real earnings management (Demski
2004). In line with these arguments, Ettredge et al. (2008) make the case that managers use up all
the leeway within generally accepted accounting principles and cross the boundary into other
forms of manipulation when within-GAAP management is no longer possible. The empirical
evidence in Cohen et al. (2008) is consistent with this view, and indicates that following the
passage of SOX, accrual-based earnings management declined significantly while real earnings
management increased significantly.
In this paper, we test how conditional conservatism impacts the two types of earnings
management. We expect to observe two interlinked effects of accounting conservatism. To the
extent that greater conservatism disciplines managerial inclination for accrual-based
manipulation, we expect that greater conservatism is associated to (i) lower accrual-based
earnings management, but also, to (ii) greater real earnings management. This predicted trade-off
between accruals- and real-earnings management could be interpreted as a costly consequence of
conservatism in accounting, raising the issue of what is the net impact of conservatism on the
aggregate level of earnings management.
Given that there is evidence that firms with more stringent monitoring over the financial
reporting system (with more independent directors, as in Garcia Lara et al., 2009, or with higher

9
ownership by institutions, as in Ramalingegowda and Yu, 2012) present more conservative
accounting numbers, it could be argued that conservatism contributes to reduce the trade-off
between accrual-based and real earnings management, as independent directors and institutional
investors are expected to monitor not only the financial reporting system, but also real
operational decisions that affect long term firm value. This argument is consistent with the
results in Roychowdhury (2006) and Zang (2012) that firms with institutional investors engage
less in real earnings management. However, we cannot discard the opposite explanation that
independent directors that are better suited for monitoring might be less able to understand the
long-term effects of operational decisions, opening the door for real earnings management. The
results in Faleye, Hoitash and Hoitash (2011) that increased board monitoring reduces accrual-
based earnings management but also innovation are consistent with this view.
3. Research design
We study whether conditional conservatism is differently associated to accrual-based versus real
earnings management. We first present the models used to test the association between
conservatism and earnings management and discuss the choice of control variables. Then, we
describe the proxies for earnings management, and the proxy used to measure conservatism at
the firm-year level. Finally, we describe the sample used to test our predictions and validate our
conservatism proxy. To assess the relationship between conservatism and earnings management,
we use the following two equations:
RMt = α + β1 COt + δ ∑ InnateDet_COt + γ ∑ Incentives_EMt + εt (1.a)
AMt = α + β1 COt + δ ∑ InnateDet_COt + γ ∑ Incentives_EMt + εt (1.b)

10
where RM and AM are our real and accrual-based earnings management proxies, CO is the
accounting conservatism proxy, and t is the time-period indicator. InnateDet_CO is a vector of
control variables that capture the innate determinants of conservatism and Incentives_EM is a
vector of control variables that measure the costs of and incentives for engaging in earnings
management. If conditional conservatism exhausts managerial opportunities for successful
accrual-based earnings management, we should observe that greater levels of conservatism are
associated to lower accrual-based earnings management, and thus, we expect that β1 in model
(1.b) will be negative and significant. Conversely, if tighter accounting-based monitoring leads
to increases in non-GAAP manipulation, we expect to see a positive association between our
measure of real earnings management and CO (β1 > 0) in model (1.a). Following Petersen
(2009), we estimate this regression in a pooled fashion and report t-statistics based on standard
errors that are robust to heteroskedasticity, serial and cross-sectional correlation with a two
dimensional cluster at the firm- and year-level. All regressions include fiscal-year indicator
variables.
To study the net effect of conservatism over the aggregate level of earnings management,
we focus on a well-established output of manipulation: the probability that a firm beats,
marginally, earnings benchmarks. Prior research indicates the existence of significant market
rewards associated with meeting or beating earnings targets (Skinner and Sloan 2002, Bartov,
Givoly and Hayn 2002). And thus, perhaps unsurprisingly, the extant evidence reports clear
discontinuities in the earnings distribution around the benchmark points, suggesting that
managers avoid reporting losses, earnings decreases and disappointing financial analysts
(Burgstahler and Dichev 1997, Degeorge, Patel and Zeckhauser 1999). Following this line of
research we study the probability that a firm meets or beats marginally one of these benchmarks,
11
conditional on its level of conservatism. We use the following model:
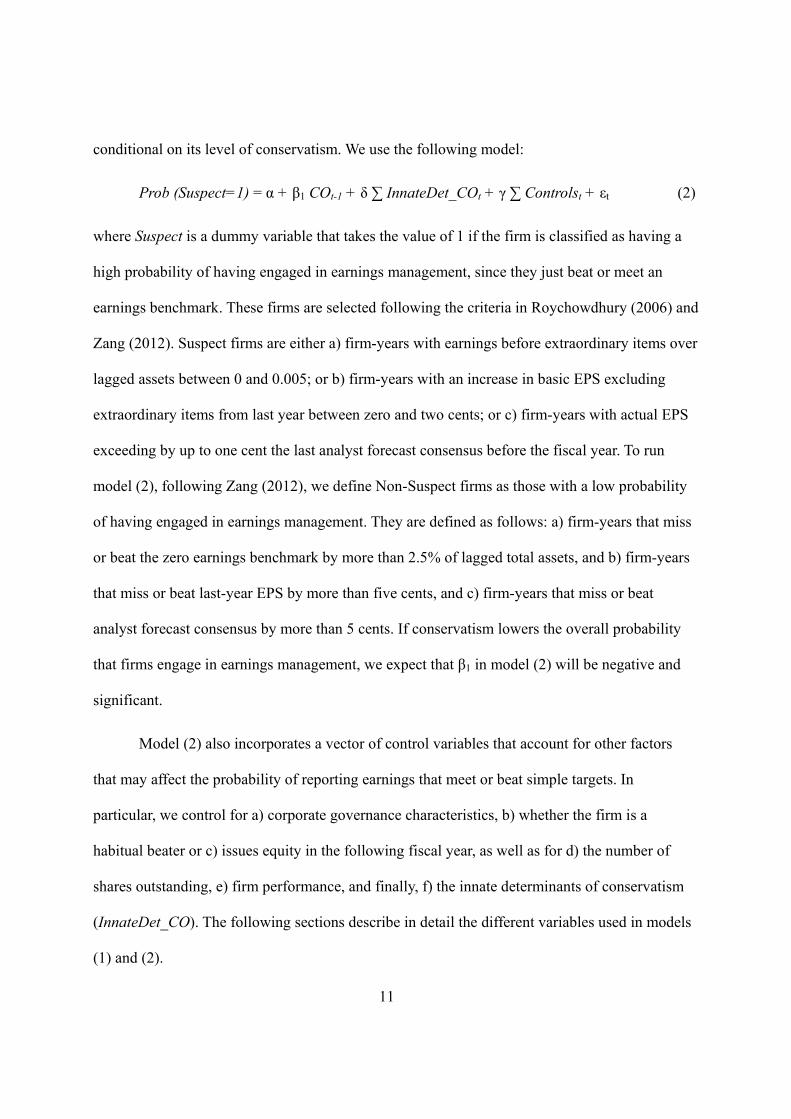
Prob (Suspect=1) = α + β1 COt-1 + δ ∑ InnateDet_COt + γ ∑ Controlst + εt (2)
where Suspect is a dummy variable that takes the value of 1 if the firm is classified as having a
high probability of having engaged in earnings management, since they just beat or meet an
earnings benchmark. These firms are selected following the criteria in Roychowdhury (2006) and
Zang (2012). Suspect firms are either a) firm-years with earnings before extraordinary items over
lagged assets between 0 and 0.005; or b) firm-years with an increase in basic EPS excluding
extraordinary items from last year between zero and two cents; or c) firm-years with actual EPS
exceeding by up to one cent the last analyst forecast consensus before the fiscal year. To run
model (2), following Zang (2012), we define Non-Suspect firms as those with a low probability
of having engaged in earnings management. They are defined as follows: a) firm-years that miss
or beat the zero earnings benchmark by more than 2.5% of lagged total assets, and b) firm-years
that miss or beat last-year EPS by more than five cents, and c) firm-years that miss or beat
analyst forecast consensus by more than 5 cents. If conservatism lowers the overall probability
that firms engage in earnings management, we expect that β1 in model (2) will be negative and
significant.
Model (2) also incorporates a vector of control variables that account for other factors
that may affect the probability of reporting earnings that meet or beat simple targets. In
particular, we control for a) corporate governance characteristics, b) whether the firm is a
habitual beater or c) issues equity in the following fiscal year, as well as for d) the number of
shares outstanding, e) firm performance, and finally, f) the innate determinants of conservatism
(InnateDet_CO). The following sections describe in detail the different variables used in models
(1) and (2).

12
3.1. Earnings management measures
We use three measures of accruals earnings management (AM): (i) discretionary accruals from
the modified Jones (1991) model, as proposed by Dechow et al. (1995) (DA_Modified Jones),
(ii) discretionary accruals from the lagged model (DA_Lagged Model) discussed in Dechow et
al. (2003), and (iii) discretionary accruals from the adapted model (DA_Adapted Model) also in
Dechow et al. To measure real earnings management, we use the proxies in Roychowdhury
(2006) of abnormal production costs and abnormal discretionary expenses, and combine them
into a single measure (RM). In the next subsections, we explain the calculation of each of these
proxies.
3.1.1. Accrual-based earnings management proxies
The modified Jones model (Dechow et al., 1995) is based on the residuals of the following
regression:
TAccrt /Assetst-1 = α + β0 1/Assetst-1 + β1 (ΔSalest – ΔRECit) /Assetst-1
+ β2 PPEt/Assetst-1 + β3 ROAt-1 + β4 SGt + εt (3)
we measure total accruals (TAccr) as the difference between earnings before extraordinary items
and cash flows from operations reported in the statement of cash flows, ΔSales is change in sales,
ΔREC is the change in accounts receivable and PPE is gross property, plant and equipment. All
the variables, including the intercept are scaled by total assets at the end of year t-1. We also
include an unscaled intercept in all our regressions. To control for the influence of firm
performance and growth on the level of total accruals, we follow the recommendations of
Kothari, Leone and Wasley (2005) and of Collins, Pungaliya and Vijh (2012) and also include as
additional regressors lagged ROA (defined as net income scaled by total assets) and current
13
growth in sales (SG). This control for performance and growth will be included in the estimation
of all our proxies of earnings management, both accrual-based and real management. In the
robustness tests section we discuss the results when we employ an alternative approach to control
for performance and growth in which we match treatment firms with firms of a control sample
on ROA and SG. Model (2) is estimated for each 2 digit SIC-fiscal year grouping imposing a
minimum of 15 observations per regression. The residuals of this model are our first proxy of
discretionary accruals, which we denote as DA_Modified Jones.
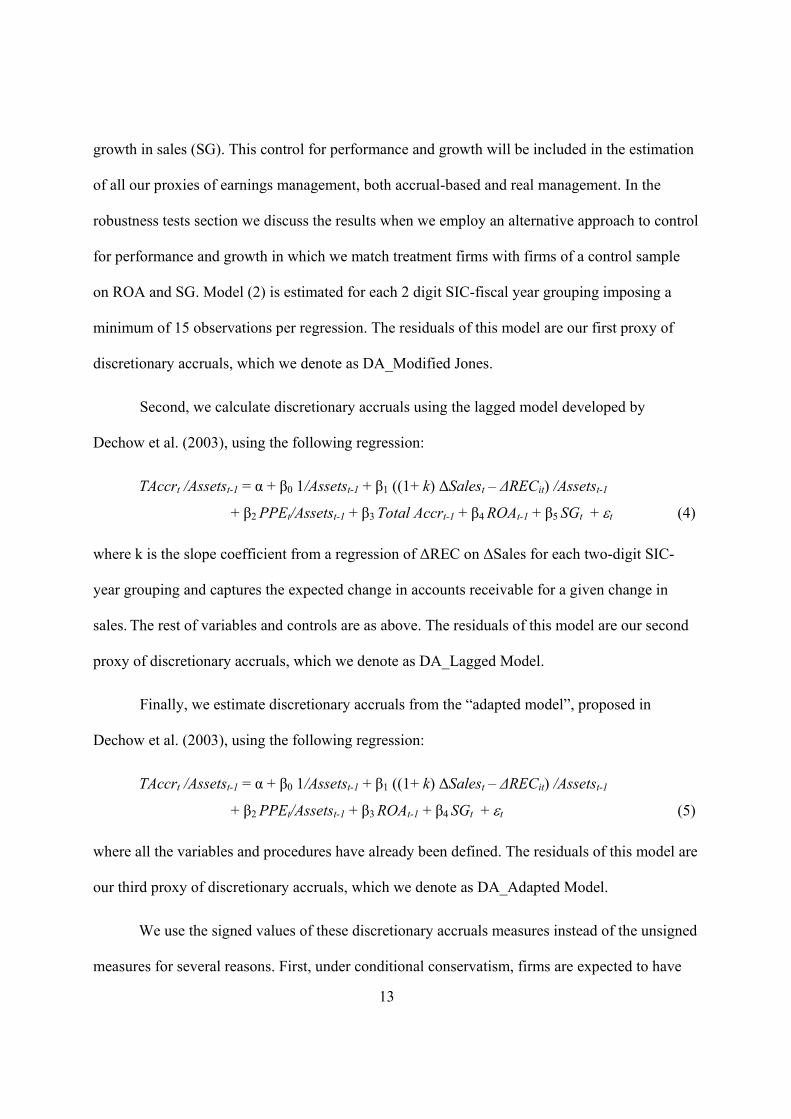
Second, we calculate discretionary accruals using the lagged model developed by
Dechow et al. (2003), using the following regression:
TAccrt /Assetst-1 = α + β0 1/Assetst-1 + β1 ((1+ k) ΔSalest – ΔRECit) /Assetst-1
+ β2 PPEt/Assetst-1 + β3 Total Accrt-1 + β4 ROAt-1 + β5 SGt + εt (4)
where k is the slope coefficient from a regression of ΔREC on ΔSales for each two-digit SIC-
year grouping and captures the expected change in accounts receivable for a given change in
sales. The rest of variables and controls are as above. The residuals of this model are our second
proxy of discretionary accruals, which we denote as DA_Lagged Model.
Finally, we estimate discretionary accruals from the “adapted model”, proposed in
Dechow et al. (2003), using the following regression:
TAccrt /Assetst-1 = α + β0 1/Assetst-1 + β1 ((1+ k) ΔSalest – ΔRECit) /Assetst-1
+ β2 PPEt/Assetst-1 + β3 ROAt-1 + β4 SGt + εt (5)
where all the variables and procedures have already been defined. The residuals of this model are
our third proxy of discretionary accruals, which we denote as DA_Adapted Model.
We use the signed values of these discretionary accruals measures instead of the unsigned
measures for several reasons. First, under conditional conservatism, firms are expected to have
14
large negative accruals (Givoly and Hayn 2000). These large negative accruals are associated to
timely recognition of economic losses, and not to opportunistic biases. Second, as argued in
Chen et al. (2007), generally, when there is uncertainty about the future payoff of the firm, there
is an incentive to manage the accounting earnings upward to induce more favourable (potential)
investors’ beliefs about the firm’s prospects. Thus, we are particularly interested in studying the
links between conservatism and income-increasing behaviour.
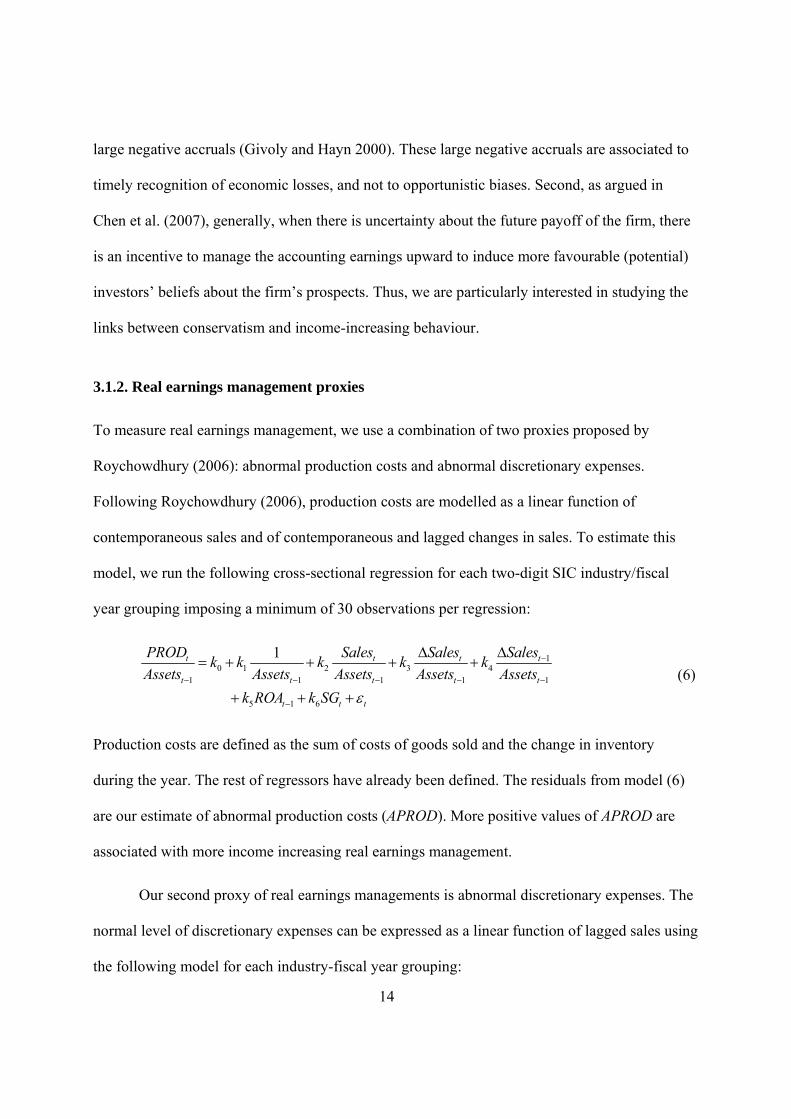
3.1.2. Real earnings management proxies
To measure real earnings management, we use a combination of two proxies proposed by
Roychowdhury (2006): abnormal production costs and abnormal discretionary expenses.
Following Roychowdhury (2006), production costs are modelled as a linear function of
contemporaneous sales and of contemporaneous and lagged changes in sales. To estimate this
model, we run the following cross-sectional regression for each two-digit SIC industry/fiscal
year grouping imposing a minimum of 30 observations per regression:
10 1 2 3 4
1 1 1 1 1
5 1 6
1
t t t t
t t t t t
t t t
PROD Sales Sales Salesk k k k kAssets Assets Assets Assets Assets
k ROA k SG ε
−
− − − − −
−
Δ Δ= + + + +
+ + + (6)
Production costs are defined as the sum of costs of goods sold and the change in inventory
during the year. The rest of regressors have already been defined. The residuals from model (6)
are our estimate of abnormal production costs (APROD). More positive values of APROD are
associated with more income increasing real earnings management.
Our second proxy of real earnings managements is abnormal discretionary expenses. The
normal level of discretionary expenses can be expressed as a linear function of lagged sales using
the following model for each industry-fiscal year grouping:
15
10 1 2 3 1 4
1 1 1
1t tt t t
t t t
DEXP Sales ROA SGAssets Assets Assets
γ γ γ γ γ ε−−
− − −
= + + + + + (7)
Discretionary expenses (DEXP) are defined as the sum of SG&A, R&D and advertising
expenses. The residuals of this model are our estimate of abnormal discretionary expenses
(AEXP). More negative values of AEXP are associated with more income increasing real
earnings management.
Finally, we follow Cohen and Zarowin (2010) and aggregate the two real activities
manipulation measures into one proxy (RM), by adding APROD and -1*AEXP. Higher values of
RM are interpreted as evidence of more income-increasing real earnings management.2
3.2. Measurement of conditional conservatism
We employ a summary measure of conditional conservatism constructed with three firm-year
proxies of conservatism. Our first measure is based on the conservatism scores developed by
Khan and Watts (2009). Drawing from the Basu (1997) model, they estimate the timeliness of
earnings to good news (G_Score) and the incremental timeliness of earnings to bad news
(C_Score). By adding both, we obtain the total timeliness of bad news recognition.3 We define
our first conservatism proxy as the annual decile ranks of the three-year average of the total
timeliness of loss recognition (G_Score + C_Score), and denote this measure as CO_TLR. We
take the three-year average to capture firms’ commitment to conservative reporting choices.
2 We do not examine abnormal cash flows from operations because real activities manipulation impacts this variable in different directions and the net effect is ambiguous, as discussed by Roychowdhury (2006). 3 Taking Basu (1997) model (Earn = β0 + β1 Neg + β2 Ret + β3 Ret*Neg + ε) as a reference, G_Score is a firm-year estimation of the β2 coefficient (the timeliness to good news) and C_Score is the estimation of the β3 coefficient (the incremental timeliness to bad news). Therefore, G_Score + C_Score is the total timeliness to bad news.

16
Following Khan and Watts, to estimate this measure we delete firm-years with price per share
less than $1, with negative total assets or book value of equity, and firms in the top and bottom
1% of earnings, returns, size, market-to-book ratio, leverage and depreciation each year.4
The second conservatism measure is based on the work of Givoly and Hayn (2000). It is
the negative of the ratio of the skewness of net income to the skewness of cash flow from
operations, as in Zhang (2008). To obtain the skewness we use rolling windows of five years
ending at the current year. We denote this measure as CO_SKW.
Our third measure is the conservatism ratio (CO_CR) developed by Callen et al. (2010),
which is based on the Vuolteenaho (2002) return decomposition model. The conservatism ratio is
a measure of conditional conservatism that shows the proportion of the total shock to current and
expected future earnings recognized in current year earnings. As with the previous measure, we
define CO_CR as the three-year average of CO_CR. To compute CO_CR, we follow the
estimation details described in Callen et al. (2010). These authors estimate a pooled regression
per industry across time using all sample years available (up to 2007 in our sample). This can
cause a look-ahead bias in the estimates of CO_CR because the conservatism measure for, say,
1995 uses future information from 1996-2007. To avoid the potential negative effects of the
look-ahead bias, we use a 25-year rolling window approach ending in the current year of each
CO_CR measure. That is, to estimate CR for, say, 1995, our pooled regressions across time only
4 A growing number of published papers claim that the Basu (1997) asymmetric timeliness coefficient is not a valid measure of conditional conservatism (e.g., Dietrich et al., 2007; Givoly et al., 2007; and Patatoukas and Thomas, 2011). However, recent working papers by Ball, Kothari, and Nikolaev (2010, 2011) provide a number of counter-arguments.

17
include years 1971-1995, and we take the estimates of CO_CR for the last year. Finally, like
Callen et al., we drop observations with negative CO_CR as its interpretation is ambiguous.5
Finally, we combine our three proxies into a summary measure of conditional
conservatism. To do so, we take the average of the three standardized conservatism proxies.6 To
mitigate measurement error in the summary measure and to reduce concerns about possible non-
linearities, we take annual deciles and denote this summary measure as CO.
3.3. Control variables for the innate determinants of conditional conservatism and incentives
for earnings management
Conservatism is jointly determined by innate firm characteristics and by managerial
discretionary choices. Therefore, in models (1) and (2) we control for the innate determinants of
conservatism (InnateDet_CO). Controlling for these determinants, we interpret the coefficient
estimates on CO as capturing the effect of the discretionary component of conservatism. This
approach follows the method in Francis et al. (2005). The selection of innate determinants of
conservatism is based on previous literature (e.g., Watts, 2003; LaFond and Watts, 2008; Qiang,
2007) that identifies contracting, litigation, taxation, political costs and information asymmetry
as the main drivers of conservatism in accounting. We include Leverage to capture debt
contracting motivations, defined as short-term plus long-term debt scaled by market value of
equity. The year indicator variables included in the regression control for periods of high auditor
5 There is a fourth conservatism proxy: the accumulation of non-operating accruals (Givoly and Hayn, 2000). We do not use this proxy because our dependent variables are discretionary accruals which are mechanically associated with non-operating accruals. 6 We use unit weights to construct CO following the recommendations of Grice and Harris (1998), who find that unit-weighted composites exhibit better psychometric properties than alternative weighting schemes. We obtain similar results if we use factor analysis.

18
litigation (Basu, 1997; Holthausen and Watts, 2001) and the passage of Sarbanes-Oxley Act.
Taxation incentives for conservatism are captured by a dummy variable (Low MTR) that takes
the value of one if the firm has a low marginal tax rate, and zero otherwise. A low marginal tax
rate is assumed if the firm’s marginal tax rate is below the statutory tax rate. To measure the
marginal tax rate we employ the proxy developed by Blouin et al. (2010). Size is used to capture
political pressures and it is measured as the natural log of market value of equity. Information
asymmetry demand for conservatism is captured by the Bid/Ask spread. Finally, we also include
the market-to-book ratio (MTB) because firms with high MTB ratio have more growth options
relative to assets in place; growth options are associated with agency costs and conservatism is
an efficient governance response to these agency costs (Khan and Watts, 2009).
We also control for the relative costs of engaging in earnings management
(Incentives_EM). To do so, we follow the approach in Zang (2012). Similar to Cohen et al.
(2008) and Cohen and Zarowin (2010), she formally models the trade-offs faced by firms when
selecting the type of earnings management (real or accrual based), but also, she proposes that
there is a certain sequence when choosing between both types of manipulations. Zang (2012)
proposes two key ideas when considering the trade-offs between accruals and real- earnings
management. First, engaging in earnings management is costly for firms and they must trade-off
between manipulating real activities or accruals. The decision is based on their relative costliness
and firms’ ability to do one type or the other. Second, the decision to engage in real earnings
management is taken early in the year and the effects are realized during the year. At the end of
the year, managers still can further adjust earnings by doing accruals earnings management. For
this reason, it is important to consider the timing of both activities when designing the tests.

19
Zang (2012) shows that the level of each earnings management activity decreases with its
own costs and increases with the costs of the other. She demonstrates that firms prefer different
earnings management strategies in a predictable manner, depending on their operational and
accounting environment. Following Zang, we introduce in Equations (1a) and (1b) the following
determinants of the decision to engage in either accrual-based or real earnings management: a)
corporate governance (institutional investors, analysts following and the anti-takeover index of
Cremers and Nair, 2005), b) market share (% of firm sales over total sales in the industry), c)
firm financial condition (Altman, 1968 Z-Score), d) taxation (the marginal tax rate), e) auditing
(indicator variable for big-8 auditor), f) past earnings management (the bloated balance sheet
measure in Barton and Simko, 2002), g) length of the operating cycle (in days), h) pre-managed
earnings (earnings before extraordinary items minus discretionary accruals), i) effect of real
earnings management on accruals management (the fitted and the residuals of the real earnings
management equation), and j) firm performance (ROA and sales growth). We explain the
rationale for including each of these variables and how they are constructed in Appendix A.
4. Sample and results
We use COMPUSTAT to extract accounting data and CRSP to extract stock market data. Analyst
data come from IBES, ownership data from Thomson Financial, and governance data from Risk
Metrics. Our final sample contains 38,968 firm-year observations and spans 20 years, t = 1991 to
2010. The sample period begins in 1991 because it is the first year in which some of the
governance variables are available. We eliminate financial firms (SIC 6000–6999) and winsorize
all continuous variables at the top and bottom percentiles to avoid the effect of outliers. Table 1
reports descriptive evidence of the data used to run the main regression tests. Panel A shows

20
summary statistics of the main variables of interest and Panel B shows the correlation matrix.
The descriptive evidence presented in Table 1 is generally consistent with prior evidence. The
discretionary accruals proxies (DA_Modified, DA_Lagged and DA_Adapted) are on average
close to zero, as expected, and are negatively associated with prior earnings management as
measured by balance sheet bloat (NOA), indicating that the balance sheet acts as a constraint for
further accruals-manipulation, consistent with the arguments in Barton and Simko (2002). In
contrast, NOA is positively correlated with RM, consistent with the existence of a certain level of
displacement from one type of earnings management to the other. It is interesting to note
however that the accrual-based and real earnings management proxies are positively correlated,
indicating that, on aggregate, firms tend to combine both types of manipulation, rather than
substitute one for another.
4.1. Discussion of main results
Table 2 presents the results from running models (1a) and (1b). Following Petersen (2009), we
estimate this regression in a pooled fashion and report p-values based on standard errors that are
robust to heteroskedasticity, serial and cross-sectional correlation with a two dimensional cluster
at the firm- and year-level. The evidence reported in Table 2 supports our predictions:
conservatism is associated to lower accrual-based earnings management. Specifically, we find
that conservatism is related to lower discretionary accruals, as measured by our DA_Modified
(CO = -0.468, p-val < 0.01), DA_Lagged (CO = -0.260, p-val < 0.01), and DA_Adapted (CO = -
0.467, p-val < 0.01) earnings management proxies. Overall, this evidence is consistent with the
arguments in Watts (2003a) and Guay and Verrecchia (2006) that conservatism in accounting
reduces the opportunities for successful accrual-based earnings management.

21
Regarding the association between conservatism and real earnings management, we find
evidence consistent with the existence of potential preferences and trade-offs in choosing
earnings management instruments. When we use our proxy of real earnings management as the
dependent variable in model (1), the coefficient on CO becomes significantly positive (CO =
0.762, p-val < 0.01), indicating that the disciplining role of conservatism likely exhausts the
opportunities for successful accrual (purely accounting) manipulation, leading managers to resort
to real actions. This positive association between accounting conservatism and real earnings
management is consistent with the arguments in Ewert and Wagenhofer (2005), Faleye, Hoitash
and Hoitash (2011) or Hermalin and Weisbach (2012) that more stringent monitoring over the
financial reporting system may lead to unintended economic consequences, and with the results
in Cohen et al. (2008), who show that increases in monitoring (such as those required by SOX)
can result in greater real earnings management.
In line with the existence of patterns in the data that suggest that there is a certain
substitution between the two types of manipulation, we find that NOA (our proxy for past
accumulated accruals-manipulation) is negatively related with accruals-based earnings
management across all models, while it is positively associated with real earnings management
(model 1, NOA (t-1) = 6.426, p-val < 0.01). This is consistent with firms switching from
accruals- to real earnings management when they exhaust the possibilities for further accruals-
based earnings management. Also consistent with the idea that there are links between the two
types of manipulation, we find that our proxies for expected and unexpected real earnings
management (Pred_RM and Unexp_RM) are positively related with the accruals-based proxies.
This suggests that, consistent with the arguments in Zang (2012), managers plan beforehand the
level of necessary real earnings management, taking actions during the year, and then, after the

22
fiscal year end, they make accounting choices that put the final touches in their plans to meet or
beat their earnings objectives.
In terms of economic significance, a five-decile change in CO (i.e., moving from the first
to the third quartile) results in a reduction in discretionary accruals (as per the modified Jones
model) of -2.34% and in an increase in RM of 3.81%.
Overall, the evidence suggests that CO reduces accrual-based earnings management and
this creates a substitution effect that forces firms to do more real earnings management. However
governance provisions in place also appear to partly control for this last effect. Our results show
that governance provisions effectively reduce real earnings management. In addition, one of the
governance provisions, namely conservatism, is also put in place because it is one that optimally
curtails accrual-based earnings management.
In our second set of analyses, we study the net effect of conservatism on earnings
management. To do so, we focus on firms that are classified as either being Suspect or Non-
Suspect of earnings management. Suspect firms are firms with a high probability of having
engaged in earnings management because they just beat or meet important earnings benchmarks.
A total of 6,193 firm-year observations are classified as Suspect firms. Non-suspect firms are
those firms with low probability of having engaged in earnings management of any type
(accruals-based or real). There are 9,229 non-suspect firm-year observations. Using this sample
of 15,422 firm-year observations, we run model (2) to assess the probability that firms are
classified as Suspect, conditional of their level of conservatism. Table 3 reports results from
running this test. The evidence indicates that overall, conservatism reduces the likelihood of
being a suspect firm (CO = -0.019, p-val = 0.01). This suggests that even if a certain level of
substitution between accruals-based and real earnings management appears to take place,

23
conservatism is an efficient corporate governance mechanism, that overall, leads to a reduction in
the probability that a firm reports manipulated financial statements (using either method.) In
terms of economic significance, a five-decile change in CO (i.e., moving from the first to the
third quartile) results in a reduction in the probability of being a suspect of -9.06% [= exp(-
0.019*5)-1)*100].
4.2. Robustness checks
To check the robustness of our findings, we carry a number of sensitivity analyses. First of all,
we repeat our main analysis (models 1a and 1b) restricting the test to those firms that are
classified as either being Suspect or Non-Suspect firms. These tests should provide a starker
contrast of our hypothesis. Table 4 provides the results for this analysis. All results are consistent
with the previously reported evidence. We find that conservatism is negatively associated with
accruals-based earnings management (DA_Modified, CO = -0.467, p-val <0.01; DA_Lagged, CO
= -0.274, p-val <0.01; DA_Adapted, CO = -0.466, p-val <0.01), but also, we provide evidence of
a certain substitution effect between the two types of manipulation, as we find a positive relation
between conservatism and real earnings management (CO = 0.805, p-val <0.01).
We repeat the analysis of Table 4 focusing only on suspect firms. Because we focus on a
very specific subset of firms, we could be incurring in a selection bias. To address this issue, we
employ a two-stage Heckman procedure. In the first stage, we run a probit model with all
available firms with enough data that predicts the likelihood of being suspect. The explanatory
variables are taken from Cohen and Zarowin (2010) and Zang (2012) and include controls for
whether a firm is a Habitual beater, measured as the number of times the firm beats/meets
analysts’ forecast consensus in the past four quarters. Firms for which there are no data to

24
compute Habitual beaters are assigned a value of zero. This could introduce errors because some
of these firms could be habitual beaters but we failed to identify them correctly. To control for
this possibility, we create an indicator variable (Habitual beater dummy) that equals one if
Habitual beater was missing, and zero otherwise. In addition, we also control for a) Stock issue
(t+1): an indicator variable that equals one if the firm issues equity in the next fiscal year, and
zero otherwise, b) Analyts: the number of analysts following the firm, c) MTB: is the market to
book ratio, d) Size: the log of the market value of equity, e) Leverage: defined as short-term plus
long-term debt scaled by market value of equity, f) Shares: the log number of shares outstanding,
and g) ROA3: return on assets computed using net income for the rolling four quarters ending
with the third quarter of year t.
Table 5 Panel A provides summary stats of the above variables, and Table 5 Panel B
reports the results of the first-stage Heckman procedure. The main results are presented in Table
5 Panel C, which provides evidence of the second-stage Heckman regression. These regressions
include the inverse mills ratio (IMR) estimated with data from the first-stage regression to
control for a possible selection bias. The results confirm all the previous findings. We report
evidence consistent with conservatism reducing accruals-based earnings management, but also,
potentially increasing real earnings management.
As a further robustness test, we control for the effects of performance and growth in
accruals using the performance matching technique advocated by Roychowdhury (2006) and
Collins et al. (2012). In the performance matching technique the residuals from all our earnings
management models are adjusted for like residuals from firms matched on ROA and sales
growth (SG). To do so, we first split the sample into two subsamples: the treatment sample that
contains the suspects firms and a control subsample that consists of non-suspect firms. Next, we

25
arrange all same-industry treatment firms each fiscal year into five ROAt-1 quintiles and choose
the matching control firm that has the closest SG in the relevant quintile, year, and industry. We
apply this procedure to all the proxies of earnings management analyzed in the paper. Table 6
presents the results using performance-matched earnings management proxies. The results are
identical but the sample size is fairly small because it is difficult to always find a matching firm.
As a final robustness test, we run all the previously reported tests using our three
conservatism proxies separately. This procedure generates identical inferences.
5. Assessment of the construct validity of the conservatism proxy (CO)
Given the controversy over the use of firm-year specific conservatism measures, we carry out a
series of tests to assess the construct validity of CO as a measure of conservatism. Similar to
Khan and Watts (2009), we examine whether the empirical properties of CO are consistent with
predictions of conservatism and with associations documented in the prior literature using other
conservatism measures. We begin by placing firms into CO deciles each year. Then, we compute
the mean of the different properties associated with conservatism for each decile, and verify
whether the mean values vary monotonically as we move along the CO deciles. If this is the case
for most of the properties examined, we can conclude that CO is associated with the underlying
unobserved level of conditional conservatism. Examining the properties of CO deciles allows
non-parametric tests of unconditional (univariate) predictions, and avoids issues of potential non-
linearities in the relations examined.
We first examine the level of the three conservatism proxies used to construct CO. Table
7 columns 1 through 3 provide evidence consistent with firms being correctly classified by the
CO aggregate measure. For all three conservatism proxies (CO_TLR, CO_SKW and CO_CR), the

26
rank correlation between CO decile and the conservatism deciles is 1.00. Then, we examine a
number of variables that are expected to be associated with conservatism. In particular, we look
at the association between conservatism and a) ROA, b) MTB, c) Size, d) Leverage, e) Length of
the operating cycle, f) Information asymmetry, g) Volatility and h) Age.
Holding everything else constant, the additional write-downs and write-offs taken by
conservative firms are expected to reduce profitability. As a result, previous work (Basu, 1997;
Givoly and Hayn, 2000; Watts, 2003b) has documented a negative association between
conservatism and ROA. Table 7 confirms this negative association between conservatism and
ROA, with a rank correlation between CO and ROA deciles of -0.92.
The market-to-book ratio has a direct association with conservatism because it captures
the effect of both conditional and unconditional conservatism. Both types of conservatism result
in lower net asset values. However, unconditional conservatism pre-empts conditional
conservatism: under unconditional conservatism, certain investments (i.e., R&D) are not
capitalized but expensed immediately. If an R&D project fails, there is no need to recognize a
write off because there is no R&D asset on the balance sheet. Had the R&D investment been
capitalized, the failure would have been recognized immediately under conditional conservatism.
For this reason, both types of conservatism are negatively associated. In practice, it seems that
the effect of unconditional conservatism prevails and produces a negative association between
MTB and conditional conservatism, as documented by empirical evidence. In addition, there is
the “buffer problem” described by Roychowdhury and Watts (2007) which also causes this
negative association. The evidence reported in Table 7 confirms this negative association.
Regarding Size, larger firms have richer information environments (i.e., more analysts
following) which reduce information asymmetries and overall uncertainty about the results of

27
current projects. This causes a lower contractual demand for conservatism that has been
confirmed by previous research (LaFond and Watts, 2008, among others). Therefore, we expect
to find a negative association between CO and size, which is confirmed by the negative rank
correlation of -0.99 reported in Table 7. Consistent with prior work on the determinants of
conservatism (e.g., Watts 2003a), we also find that conservatism is increasing with Leverage
(rank correlation=0.99) in agreement with the extant prior evidence that demonstrates that
conservatism is demanded and rewarded by debt-holders.
Conservatism is expected to increase with firm specific uncertainty and length of the
operating cycle (Cycle), since agency costs increase with these variables (Khan and Watts 2009).
Consistent with this prediction, we find a positive correlation between conservatism and both
Cycle (rank correlation=0.96) and Volatility (rank correlation=0.99). This last variable, Volatility,
measured as standard deviation of one year of daily stock returns, also captures litigation risk,
which is also predicted to be positively correlated with conservatism.
Evidence in LaFond and Watts (2008) and Khan and Watts (2009) is consistent with
conservatism appearing as a reaction to the existence of information asymmetries, leading to an
expected positive association between conservatism and information asymmetry. In line with this
expectation, we find a positive rank correlation between the CO deciles and both of our
information asymmetry proxies: the Bid/Ask spread (rank correlation = 0.99) and PIN (rank
correlation = 0.99). Finally, conservatism is expected to decrease with firm age, because younger
firms tend to have more growth opportunities relative to assets-in-place, and information
asymmetry increases with growth options (Khan and Watts 2009). Accordingly, we expect a
negative correlation with firm age. The evidence in Table 7 confirms this prediction.

28
Overall, the results in Table 7 are consistent with CO being a robust firm-year measure of
conservatism.
6. Summary and conclusions
Conservatism facilitates the monitoring of financial reporting choices, potentially limiting
managerial opportunities for within-GAAP accounting manipulation. Watts (2003a) and Guay
and Verrecchia (2006) argue that this monitoring role of conservatism leads to lower earnings
management. To the extent that managers face constraints to manage accruals, we expect that
they may shift to potentially more costly real earnings management practices, which they may, in
fact, prefer (Graham et al. 2005). Our results are consistent with conservatism creating this trade-
off between accrual-based and real earnings management: we find a negative association
between conservatism and measures of accruals-based earnings management, and a positive
association between conservatism and real earnings management.
This trade-off between accruals and real earnings management raises the issue of what is
the net effect of conservatism and whether its benefits (lower accrual-based earnings
management) may not be outweighed by its costs (greater real earnings management). To gauge
this net effect, we analyse whether conservatism decreases the overall probability that a firm
manipulates its financial statements (by using either method). We provide evidence that more
conservative firms have less probabilities of being suspect of having engaged in earnings
management (of any type) to achieve earnings benchmarks, indicating that in terms of the
aggregate level of earnings management, the displacement from one type of manipulation to
another is moderate and overall, conservatism serves to constrain earnings manipulation.

29
We contribute to the literature on the unintended consequences of a financial reporting
systems that permits more stringent monitoring over management’s financial reporting decisions
(Ewert and Wagenhofer, 2005; Hermalin and Weisbach, 2012) and to the literature on the trade-
offs between accounting and real earnings management (Cohen et al., 2008; Cohen and Zarowin,
2010; Zang, 2012). While the trade-offs between the two types of earnings management have
been documented in prior research in different settings, and improved monitoring mechanisms
have been shown to trigger a substitution effects, there is no prior empirical evidence showing
which of the two effects dominates (the decrease in accrual-based earnings management or the
increase in real activities manipulation). Focusing on conservatism as a mechanism that permits
better monitoring, we show that although conservatism triggers the documented trade-off
between the two types of earnings management, the overall effect of conservatism is beneficial
as it reduces the overall likelihood on engaging in any type of earnings management to meet or
beat earnings benchmarks.

30
Appendix A
Determinants of the decision to choose accrual-based vs real earnings management
(a) Corporate Governance: Firms that are closely monitored may find it more costly to
manipulate real activities as these manipulations have real costs for investors. On the
other hand, accruals manipulations might be seen as a benign form of achieving earnings
targets that do not affect the underlying economics of the firm and can even be used to
convey information to the market about future profitability (Healy and Wahlen, 1999).
For instance, institutional investors, being more sophisticated and better informed are
likely to exert a higher effort in monitoring operational decisions that can have long-term
economic implications (Bushee, 1998; Roychowdhury, 2006), and they are less likely to
pay excessive attention to accruals manipulations, particularly if they are within
reasonable boundaries. We use three proxies of governance, all measured at the
beginning of the fiscal year: the proportion of institutional investors (Institutions), the
number of analysts following (Analysts), and the alternative takeover vulnerability index
(ATI) developed by Cremers and Nair (2005). This index is based on the one developed
by Gompers et al. (2003). It focuses on only three key antitakeover provisions shown to
be critical to takeovers.7 These three provisions are the existence of classified boards, of
blank check preferred stock (“poison pill”), and of restrictions on shareholders on calling
special meetings or acting through written consent. We assign the index and initial value
of 4 and remove a point for the existence of each of these three provisions to create a
value between 1 and 4, where a higher value again implies less protection against
7 We do not use the Gompers et al. (2003) index because a few data items necessary to construct it are not available since 2007. We appreciate the assistance of Martijn Cremers in the construction of ATI.

31
takeovers and hence higher quality of external governance. Because the data to construct
the index is only available for 40 percent of observations, following Biddle et al. (2009),
we set observations with missing ATI to zero. We then include an indicator variable
(ATI_dummy) that takes the value of one if the data is missing and zero otherwise. In
summary, we expect that the three governance proxies will have a negative association
with real earnings management and a positive association with accruals earnings
management.
(b) Market Share: Firms that are leaders in their own industries and exert certain dominance
in the markets they operate in have more room to deviate from optimal operational
policies than firms that operate in competitive industries. For this reason we expect to
observe that firms with a high market share are more likely to engage in real earnings
management than firms that are followers. To capture this effect, we define Market share
as the percentage of the company’s sales to total sales of its 3-digit SIC industry,
measured at the beginning of the year.
(c) Financial condition: Firms in poor financial condition, especially those approaching
bankruptcy, are expected to do everything possible to improve their situation and restore
financial health. This is likely to imply the adoption of radical operating decisions to
reduce losses and improve future prospects. Nini, Smith and Roberts (2012) show that
firms that violate debt covenants, a clear sign of financial distress, immediately
experience sharp declines in acquisitions and capital expenditures. In these situations, the
use of accruals management is not the appropriate strategy because it is not going to alter
the underlying economics of the firm. To control for the firm’s financial condition, we
use Altman’s (1968) bankruptcy Z-Score measured at the beginning of the year. Because

32
higher values of Z-Score indicate better financial health, we expect to observe a negative
(positive) association between real (accrual) earnings management and Z-Score.
(d) Taxation: Real manipulations are likely to have a direct impact in the firm’s taxable
income because they tend to have real cash flow implications whereas accrual
manipulations usually do not affect taxable income, For example, reducing R&D
expenditures increases taxable income, whereas increasing bad debt expense does not.
We measure tax incentives for earnings management with an indicator variable (Low
MTR) that takes the value of one if the firm has a low marginal tax rate. Firms with low
marginal tax rates are expected to engage in more real earnings management and less
accruals earnings management. Taxation was already included in the model as it is also a
driver of conservatism (Watts, 2003a).
(e) Auditing: We expect that high quality auditors are more likely to detect and disallow
aggressive accrual-based earnings management activities. On the other hand, auditors are
not expected to curtail real operating decisions because is not part of their
responsibilities. To measure the quality of the firm’s auditor, we employ an indicator
variable (Auditing) that equals one if the firm has a Big-8 auditor and the auditor tenure is
above the sample mean, and zero otherwise.8 We expect to observe a negative (positive)
association between accruals (real) earnings management and Auditing.
(f) Past accruals-based earnings management: Past accruals-based earning management is
likely to have an influence in current and future accruals management because of the
8 Prior research has documented that top auditors are successful in constraining accruals earnings management (DeFond and Jiambalvo, 1993; Francis, Maydew, and Sparks, 1999) and that auditing quality increases with auditor tenure (Stice, 1991). We do not use a dummy variable indicating whether the firm has a Big-8 auditor because most of the firms in our sample fall in this group and this results in very little cross-sectional variation in the variable.

33
articulation between the income statement and the balance sheet, and because of the
limitations imposed by GAAP. Therefore, if a firm has been aggressive in managing
accruals in the past, in the future it will have little or no room for additional accruals
management. To capture this effect we use the measure of balance sheet bloat developed
by Barton and Simko (2002). NOA is an indicator variable that equals one if the net
operating assets (i.e., shareholders’ equity less cash and marketable securities and plus
total debt) at the beginning of the year divided by lagged sales is above the median of the
corresponding two-digit SIC industry-year, and zero otherwise. To the extent that
managers exhaust the possibility of managing accruals, they are expected to resort to
manage real activities. We expect to observe a negative (positive) association between
accruals (real) earnings management and NOA.
(g) Length of the operating cycle: The longer the cycle, the greater the possibilities to
manage accruals and the lesser the need to resort to managing real activities. To capture
this effect, we use the length of the operating cycle (Cycle) computed as the days
receivable plus the days inventory less the days payable, all at the beginning of the year.
We predict a positive (negative) association between accruals (real) earnings
management and Cycle.
(h) Pre-managed earnings: As argued in Zang (2012), managers must make the decision to
engage in real earning management early in the year because these activities take time to
deliver the expected results. When making the decision they observe the result of similar
activities in the previous year before including the effect of accruals management, which
is decided at year closing. To capture this effect, we define pre-managed earnings (Earn)
as earnings before extraordinary items minus discretionary accruals from the modified

34
Jones model, both measured at t-1, and include Earn in the equation in which real
earnings management is the dependent variable (model 1.a).
(i) Effect of real earnings management on accruals-based earnings management: Because of
the sequential nature of the decisions to engage in earnings management (the decision to
manipulate real activities must be taken early in the year), in the equations where the
dependent variable is discretionary accruals (model 1.b), we include as explanatory
variables the fitted values and the residuals of the real earnings management equation.
We denote these variables as Predicted RM and Unexpected RM, respectively.
(j) Firm Performance: Finally, we also include two controls for firm performance. Return on
assets (ROA3), computed using net income for the rolling four quarters ending with the
third quarter of year t, and sales growth (SG), which equals the change in annual sales
scaled by previous year’s sales.

35
Appendix B
Variables description
RM Real earnings management proxy computed as the addition of APROD and -1*AEXP, which are Roychowdhury’s (2006) abnormal production costs and abnormal discretionary expenses, respectively.
DA_Modified Jones Discretionary accruals obtained with the modified Jones model.
DA_Lagged Model Discretionary accruals obtained with the lagged model in Dechow et al (2003).
DA_Adapted Model Discretionary accruals obtained with the adapted model in Dechow et al (2003).
CO Summary measure of conditional conservatism obtained as the average of the following three standardized proxies of conservatism: CO_TLR which is the three-year average of timeliness loss recognition (G_Score + C_Score). G_Score is the timeliness of earnings to good news and C_Score is the incremental timeliness of earnings to bad news as developed by Khan and Watts (2009). CO_SKW is the negative of the ratio of the skewness of net income to the skewness of cash flow from operations. To obtain the skewness, we use rolling windows of five years ending at the current year. CO_CR is the three-year average of the conservatism ratio as developed by Callen et al. (2010).
Institutions (t-1) is the percentage of firm shares held by institutional investors, at the stat of the year.
Analysts (t-1) is the number of analysts following the firm, at the stat of the year.
ATI (t-1) is the alternative takeover vulnerability index developed by Cremers and Nair (2005). It ranges from 1 to 4. If ATI is missing, we assign it a value of zero. It is measured at the stat of the year.
ATI_dummy is an indicator variable that equals one if ATI is not available and zero otherwise.
Maket share (t-1) is the percentage of the company’s sales to total sales of its 3-digit SIC industry, measured at the beginning of the year.
Z-Score (t-1) is Altman’s (1968) bankruptcy score measure at the beginning of the year. It equals 3.3*Net income + Sales + 1.4*Retained earnings + 1.2*Working capital + 0.6*Market value of equity, with all variables scaled by total assets except Market value of equity which is scaled by total liabilities.
Low_MTR is an indicator variable that takes the value of one if the firm has a low marginal tax rate, and zero otherwise. A low marginal tax rate is assumed if the firm’s marginal tax rate is below the statutory tax rate. To measure the marginal tax rate we employ the proxy developed by Blouin et al. (2010).

36
Auditing is an indicator variable that equals one if the firm has a Top-8 auditor and the auditor tenure is above the sample mean, and zero otherwise.
NOA (t-1) is an indicator variable that equals one if the net operating assets (i.e., shareholders’ equity less cash and marketable securities and plus total debt) at the beginning of the year divided by lagged sales is above the median of the corresponding two-digit SIC industry-year, and zero otherwise.
Cycle (t-1) as the days receivable plus the days inventory less the days payable, all at the beginning of the year.
ROA3 is return on assets computed using net income for the rolling four quarters ending with the third quarter of year t.
SG equals the change in annual sales scaled by previous year’s sales.
MTB is the market-to-book value of equity ratio.
Size is the log of market value of equity.
Leverage equals short-term plus long-term debt scaled by market value of equity.
Bid/Ask spread is the bid-ask-spread defined as the annual average of daily spread scaled by the midpoint between bid and ask.
Earn (t-1) is earnings before extraordinary items minus discretionary accruals from the modified Jones model, both measured at t-1.
Suspect is an indicator variable that equals one if the firm is suspect of engaging in earnings management, and zero otherwise. Suspect firms are either a) firm-years with earnings before extraordinary items over lagged assets between 0 and 0.005; or b) firm-years with change in basic EPS excluding extraordinary items from last year between zero and two cents; or c) firm-years with actual EPS exceeding by up to one cent the last analyst forecast consensus before the fiscal year end.
Pred_RM is the fitted values of the estimation of model (1.a).
Unexp_RM is the residual values of the estimation of model (1.a).
Habitual beater is the number of times the firm beats/meets analysts’ forecast consensus in the past four quarters. Firms for which there are no data to compute Habitual beaters are assigned a value of zero.
Habitual beater_dum is an indicator variable that equals one if Habitual beater was missing, and zero otherwise.
Stock issue (t+1) is an indicator variable that equals one if the firm issues equity in the next fiscal year, and zero otherwise.
Shares is the log number of shares outstanding.

37
References
Ahmed, A.S. and S. Duellman. 2007. Evidence on the role of accounting conservatism in corporate governance. Journal of Accounting and Economics, 43:411-437.
Altman, E. 1968. Discriminant analysis and the prediction of corporate bankruptcy. The Journal of Finance, 23(4): 589-609.
Ball, R., S.P. Kothari and V.A. Nikolaev. 2011. On estimating conditional conservatism. Working paper, University of Chicago.
Ball, R., S.P. Kothari and V.A. Nikolaev. 2010. Econometrics of the Basu asymmetric timeliness coefficient and accounting conservatism. Working paper, University of Chicago.
Barton, J. and P. Simko. 2002. The Balance sheet as an earnings management constraint, The Accounting Review, 77 (Supplement): 1-27.
Bartov, E., D. Givoly and C. Hayn. 2002. The rewards to meeting or beating earnings expectations. Journal of Accounting and Economics, 33(2): 173-204.
Basu, S. 1997. The conservatism principle and the asymmetric timeliness of earnings. Journal of Accounting and Economics, 24: 3-37.
Beekes, W., P.F. Pope and S. Young. 2004. The link between earnings timeliness, earnings conservatism and board composition: evidence from the UK. Corporate Governance, 12(1): 47-51.
Bhojraj, S., P. Hribar, M. Picconi and J. McInnis. 2009. Making Sense of Cents: An Examination of Firms That Marginally Miss or Beat Analyst Forecasts. The Journal of Finance, 64(5): 2361-2388.
Biddle, G.C, G. Hilary and R.S. Verdi. 2009. How does financial reporting quality improve investment efficiency? Journal of Accounting and Economics, 48: 112-131.
Blouin, J., J. Core and W. Guay. 2010. Have the tax benefits of debt been overestimated? Journal of Financial Economics, 98: 195-213.
Burgstahler, D., and I. Dichev. 1997. Earnings management to avoid earnings decreases and losses. Journal of Accounting and Economics, 24: 99-126.
Bushee, B. 1998. The influence of institutional investors on myopic R&D investment behavior. The Accounting Review, 73(3): 305–333.
Callen, J.L., D. Segal, and O-K. Hope. 2010. The pricing of conservative accounting and the measurement of conservatism at the firm-year level. Review of Accounting Studies, 15: 145–178.
Chen, Q., T. Hemmer and Y. Zhang. 2007. On the relation between conservatism in accounting standards and incentives for earnings management. Journal of Accounting Research, 45(3): 541-565.
Cohen, D.A., A. Dey and T.Z. Lys. 2008. Real and accrual-based earnings management in the pre- and post-Sarbanes-Oxley periods. The Accounting Review, 83(3): 757-787.
Cohen, D.A. and P. Zarowin. 2010. Accrual-based and real earnings management activities

38
around seasoned equity offerings. Journal of Accounting and Economics, 50(1): 2 - 19.
Collins, D.W., R.S. Pungaliya, and A.M. Vijh. 2012. The effects of firm growth and model specification choices on tests of earnings management. Available at SSRN: http://ssrn.com/abstract=1823835 or http://dx.doi.org/10.2139/ssrn.1823835.
Cremers, K. J. M., and V.B. Nair. 2005. Governance mechanisms and equity prices. The Journal of Finance, 60: 2859–2894.
Dechow, P.M. and D.J. Skinner. 2000. Earnings management: Reconciling the views of accounting academics, practitioners, and regulators. Accounting Horizons, 14(2): 235-250.
Dechow, P. M., R.G. Sloan and A.P. Sweeney. 1995. Detecting earnings management. The Accounting Review, 70(2): 193-225.
Dechow, P. M., S.A. Richardson and I. Tuna. 2003. Why are earnings kinky? An examination of the earnings management explanation. Review of Accounting Studies, 8(2-3): 355-384.
DeFond, M., and J. Jiambalvo. 1993. Factors related to auditor-client disagreements over income-increasing accounting methods. Contemporary Accounting Research, 9(2): 415–431.
Degeorge, F., J. Patel and R. Zeckhauser. 1999. Earnings management to exceed thresholds. Journal of Business, 72(1): 1-33.
Demski, J.S. 2004. Endogenous expectations. The Accounting Review, 79: 229-245.
Dietrich, J.R., K.A. Muller and E.J. Riedl. 2007. Asymmetric timeliness tests of accounting conservatism. Review of Accounting Studies, 12: 95-124.
Ettredge, M., S. Scholz, K.R. Smith and L. Sun. 2008. The association between misstatements and bloated balance sheets. Working paper, Rutgers University.
Ewert, R. and A. Wagenhofer. 2005. Economic effects of tightening accounting standards to restrict earnings management. The Accounting Review, 80(4): 1101-1124.
Faleye, O., R. Hoitash and U. Hoitash. 2011. The costs of intense board monitoring. Journal of Financial Economics, 101: 160-181.
Francis, J., R. LaFond, P. Olsson and K. Schipper. 2005. The market pricing of earnings quality. Journal of Accounting and Economics, 39, 295–327.
Francis, J., E. Maydew, and H. Sparks. 1999. The role of Big Six auditors in the credible reporting of accruals. Auditing: A Journal of Practice and Theory, 18(2): 17–35.
Garcia Lara, J., B. Garcia Osma and F. Penalva. 2009. Accounting conservatism and corporate governance. Review of Accounting Studies, 14(1): 161-201.
Garcia Lara, J., B. Garcia Osma and F. Penalva. 2011. Conditional conservatism and cost of capital. Review of Accounting Studies, 16: 247-271.
Garcia Lara, J., B. Garcia Osma and F. Penalva. 2012. Accounting conservatism and firm investment efficiency. Working paper. IESE Business School.
Garcia Osma, B. 2008. Board independence and real earnings management: The case of R&D expenditure. Corporate Governance, 16: 116-131.
Givoly, D. and C. Hayn. 2000. The changing time-series properties of earnings, cash flows and

39
accruals: Has financial reporting become more conservative? Journal of Accounting and Economics, 29: 287-320.
Givoly, D., C. Hayn and A. Natarajan. 2007. Measuring reporting conservatism. The Accounting Review, 82(1): 65-106.
Gompers, P., J. Ishii and A. Metrick. 2003. Corporate governance and equity prices. The Quarterly Journal of Economics, 118 (1): 107-155.
Göx, R. and A. Wagenhofer. 2009. Optimal impairment rules. Journal of Accounting and Economics, 48: 2-16.
Graham, J.R., C.R. Harvey and S. Rajgopal. 2005. The economic implications of corporate financial reporting. Journal of Accounting and Economics, 40: 3-73.
Grice, J. W. and Harris, R. J. 1998. A comparison of regression and loading weights for the computation of factor scores. Multivariate Behavioral Research, 33: 221-248.
Guay, W. and R. Verrecchia. 2006. Discussion of an economic framework for conservative accounting and Bushman and Piotroski (2006). Journal of Accounting and Economics, 42: 149-165.
Healy, P.M. and J.M. Wahlen. 1999. A review of the earnings management literature and its implications for standard setting. Accounting Horizons, 13(4): 365-383.
Hermalin, B.E. and M.S. Weisbach. 2012. Information disclosure and corporate governance. Journal of Finance, 67(1): 195-233.
Holthausen, R. and R. L. Watts, 2001. The relevance of the value-relevance literature for financial accounting standard setting. Journal of Accounting and Economics, 31:3-75.
Jones, J. J. 1991. Earnings management during import relief investigations. Journal of Accounting Research, 29(2): 193-228.
Khan, M., and R.L.Watts. 2009. Estimation and empirical properties of a firm-year measure of accounting conservatism. Journal of Accounting and Economics,48: 132-150.
Kothari, S.P., A.J. Leone, and C.E. Wasley. 2005. Performance matched discretionary accruals measures. Journal of Accounting and Economics, 39: 163-197.
LaFond, R. and R. L. Watts. 2008. The information role of conservatism. The Accounting Review, 83: 443-478.
McNichols, M.F. and S. R. Stubben. 2008. Does earnings management affect firms’ investment decisions? The Accounting Review 83(6): 1571-1603.
Nini, G., D.C. Smith, and A. Sufi. 2012. Creditor control rights, corporate governance, and firm value. Review of Financial Studies, forthcoming.
Patatoukas, P.N. and J. K. Thomas. 2011. More evidence of bias in differential timeliness estimates of conditional conservatism. The Accounting Review 86(5): 1765-1794.
Petersen, M.A. 2009. Estimating standard errors in finance panel data sets: Comparing approaches. Review of Financial Studies, 22: 435-480.

40
Qiang, X. 2007. The effects of contracting, litigation, regulation, and tax costs on conditional and unconditional conservatism: cross-sectional evidence at the firm level. The Accounting Review, 82: 759-797.
Rajgopal, S. and M. Venkatachalam. 2011. Financial reporting quality and idiosyncratic return volatility. Journal of Accounting and Economics, 51: 1-20.
Ramalingegowda, S. and Y. Yu. 2012. Institutional ownership and conservatism, Journal of Accounting and Economics, 53: 98-114.
Roychowdhury, S. 2006. Management of earnings through the manipulation of real activities that affect cash flow from operations. Journal of Accounting and Economics, 42(3): 335-370.
Roychowdhury, S. and R. L. Watts. 2007. Asymmetric timeliness of earnings, market-to-book and conservatism in financial reporting. Journal of Accounting and Economics, 44: 2-31.
Schipper, K. 1989. Commentary on earnings management. Accounting Horizons, 3: 91-102.
Skinner, D.J., and R.G. Sloan. 2002. Earnings surprises, growth expectations and stock returns or don’t let an earnings torpedo sink your portfolio. Review of Accounting Studies, 7: 289-312.
Stice, J. 1991. Using financial and market information to identify pre-engagement factors associated with lawsuits against auditors. The Accounting Review, 66(3): 516–533.
Vuolteenaho, T. 2002. What drives firm-level stock returns. The Journal of Finance, 57: 233-264.
Watts, R. L. 2003a. Conservatism in accounting Part I: Explanations and implications. Accounting Horizons, 17 (3): 207-221.
Watts, R. L. 2003b. Conservatism in accounting Part II: Evidence and research opportunities. Accounting Horizons, 17 (4): 287–301.
Zang, A. Y. 2012. Evidence on the trade-off between real activities manipulation and accrual-based earnings. The Accounting Review, 87(2): 675-704.
Zhang, J. 2008. The contracting benefits of accounting conservatism to lenders and borrowers. Journal of Accounting and Economics, 45: 27-54.

41
TABLE 1
Panel A: Summary statistics
variable mean sd p25 p50 p75 N RM (%) -2.81 36.63 -20.39 0.40 18.23 38,968 DA_Modified Jones (%) 0.06 8.44 -3.70 0.41 4.30 38,700 DA_Lagged Model (%) 0.09 8.10 -3.55 0.42 4.19 38,611 DA_Adapted Model (%) 0.05 8.44 -3.71 0.41 4.30 38,700 CO (unranked) -0.01 0.68 -0.33 -0.04 0.27 38,968 Institutions (t-1) 0.49 0.28 0.25 0.48 0.72 38,968 Analysts (t-1) 6.78 7.43 1 4 10 38,968 ATI (t-1) 0.79 1.12 0 0 2 38,968 ATI_dummy 0.60 0.49 0 1 1 38,968 Market share (t-1) 0.05 0.10 0.00 0.01 0.04 38,968 Z-Score (t-1) 4.99 5.66 2.29 3.50 5.58 38,968 Low MTR 0.91 0.28 1 1 1 38,968 Auditing 0.43 0.49 0 0 1 38,968 NOA (t-1) 0.53 0.50 0 1 1 38,968 Cycle (t-1) 80.12 92.48 37.32 74.39 121.28 38,968 ROA3 3.01 12.31 -0.09 4.48 8.94 38,968 SG 0.12 0.27 -0.01 0.08 0.20 38,968 MTB 2.94 4.00 1.22 1.97 3.25 38,968Size 5.78 1.95 4.34 5.71 7.09 38,968 Leverage 0.46 1.20 0.01 0.16 0.46 38,968 Bid/Ask spread 4.32 2.25 2.70 3.87 5.47 38,968 Earn (t-1) 3.77 13.26 -2.03 4.06 10.29 38,968
The sample comprises 38,968 firm-year observations for the period 1991-2010 RM is real earnings management computed as the addition of APROD and -1*AEXP, which are Roychowdhury’s (2006) abnormal production costs and abnormal discretionary expenses, respectively. DA_Modified Jones (DA_Lagged, DA_Adapted) Jones Model are discretionary accruals obtained with the modified Jones (original Dechow et al 2003, adapted Dechow et al 2003) model. CO is a summary measure of conditional conservatism obtained as the average of the following three standardized proxies of conservatism: CO_TLR which is the three-year average of timeliness loss recognition (G_Score + C_Score). G_Score is the timeliness of earnings to good news and C_Score is the incremental timeliness of earnings to bad news as developed by Khan and Watts (2009). CO_SKW is the negative of the ratio of the skewness of net income to the skewness of cash flow from operations. To obtain the skewness, we use rolling windows of five years ending at the current year. CO_CR is the three-year average of the conservatism ratio as developed by Callen et al. (2010). Institutions (t-1) is the percentage of firm shares held by institutional investors, at the stat of the year. Analysts (t-1) is the number of analysts following the firm, at the stat of the year. ATI (t-1) is the alternative takeover vulnerability index developed by Cremers and Nair (2005). It ranges from 1 to 4. If ATI is missing, we assign it a value of zero. It is measured at the stat of the year. ATI_dummy is an indicator variable that equals one if ATI is not available and zero otherwise. Maket share (t-1) is the percentage of the company’s sales to total sales of its 3-digit SIC industry, measured at the beginning of the year. Z-Score (t-1) is Altman’s (1961) bankruptcy score measure at the beginning of the year. It equals 3.3*Net income + Sales + 1.4*Retained earnings + 1.2*Working capital + 0.6*Market value of equity, with all variables scaled by total assets except Market value of equity which is scaled by total liabilities. Low_MTR is an indicator variable that takes the value of one if the firm has a low marginal tax rate, and zero otherwise. A low marginal tax rate is assumed if the firm’s marginal tax rate is below the statutory tax rate. To measure the marginal tax rate we employ the proxy developed by Blouin et al.

42
(2010). Auditing is an indicator variable that equals one if the firm has a Top-8 auditor and the auditor tenure is above the sample mean, and zero otherwise. NOA (t-1) is an indicator variable that equals one if the net operating assets (i.e., shareholders’ equity less cash and marketable securities and plus total debt) at the beginning of the year divided by lagged sales is above the median of the corresponding two-digit SIC industry-year, and zero otherwise. Cycle (t-1) as the days receivable plus the days inventory less the days payable, all at the beginning of the year. ROA3 is return on assets computed using net income for the rolling four quarters ending with the third quarter of year t. SG equals the change in annual sales scaled by previous year’s sales. MTB is the market-to-book value of equity ratio. Size is the log of market value of equity. Leverage equals short-term plus long-term debt scaled by market value of equity. Bid/Ask spread is the bid-ask-spread defined as the annual average of daily spread scaled by the midpoint between bid and ask. Earn (t-1) is earnings before extraordinary items minus discretionary accruals from the modified Jones model, both measured at t-1.

43
TABLE 1 (continued)
Panel B: Pearson correlation matrix
RM
DA
_Mod
ified
Jone
s
DA
_Lag
ged
Mod
el
DA
_Ada
pted
Mod
el
CO
Inst
itutio
ns ( t
-1)
Ana
lyst
s (t-1
)
ATI
( t-1
)
ATI
_dum
my
Mar
ket s
hare
(t-1
)
Z-Sc
ore
(t-1)
Low
MTR
Aud
iting
NO
A (t
-1)
Cyc
le (t
-1)
RO
A3
SG
MTB
Size
Leve
rage
Bid
/Ask
spre
ad
DA_Modified Jones 0.12 1.00
DA_Lagged Model 0.10 0.96 1.00
DA_Adapted Model 0.12 1.00 0.96 1.00
CO 0.13 0.03 0.02 0.03 1.00
Institutions (t-1) -0.05 -0.03 -0.03 -0.03 -0.29 1.00
Analysts (t-1) -0.10 -0.05 -0.05 -0.05 -0.41 0.44 1.00
ATI (t-1) -0.04 0.00 0.00 0.00 -0.27 0.40 0.43 1.00
ATI_dummy 0.03 0.00 0.00 0.00 0.32 -0.50 -0.52 -0.87 1.00
Market share (t-1) 0.02 0.01 0.01 0.01 -0.16 0.19 0.26 0.25 -0.30 1.00
Z-Score (t-1) -0.14 -0.06 -0.04 -0.06 -0.20 0.03 0.07 -0.03 0.06 -0.09 1.00
Low MTR 0.02 -0.01 -0.02 -0.01 0.11 -0.08 -0.16 -0.11 0.12 -0.11 -0.03 1.00
Auditing 0.00 0.02 0.02 0.02 -0.11 0.18 0.19 0.27 -0.30 0.15 -0.06 -0.06 1.00
NOA (t-1) 0.11 -0.04 -0.05 -0.04 -0.01 0.09 0.07 0.04 -0.05 -0.02 -0.04 0.01 0.00 1.00
Cycle (t-1) 0.03 0.04 0.03 0.04 0.05 -0.07 -0.13 -0.01 0.03 -0.02 0.04 0.00 0.04 0.20 1.00
ROA3 -0.06 0.17 0.18 0.17 -0.15 0.10 0.12 0.12 -0.13 0.09 0.24 -0.12 0.08 -0.07 0.00 1.00
SG -0.01 0.02 0.01 0.01 -0.09 -0.03 0.02 -0.07 0.09 -0.07 0.16 -0.02 -0.08 0.07 -0.08 0.18 1.00
MTB -0.18 -0.05 -0.04 -0.05 -0.20 0.05 0.17 0.07 -0.08 0.03 0.14 -0.04 0.00 -0.09 -0.09 0.03 0.15 1.00
Size -0.10 0.01 0.01 0.01 -0.54 0.56 0.73 0.52 -0.62 0.35 0.11 -0.18 0.24 0.08 -0.15 0.26 0.13 0.28 1.00
Leverage 0.09 -0.01 -0.01 0.00 0.16 -0.06 -0.09 -0.04 0.04 0.04 -0.19 0.03 -0.02 0.08 -0.03 -0.12 -0.06 -0.09 -0.19 1.00
Bid/Ask spread -0.04 -0.07 -0.07 -0.07 0.17 -0.27 -0.22 -0.28 0.33 -0.22 0.06 0.12 -0.19 -0.04 0.01 -0.35 -0.01 -0.01 -0.41 0.12 1.00
Earn (t-1) -0.11 -0.06 0.00 -0.06 -0.16 0.12 0.15 0.11 -0.11 0.07 0.28 -0.11 0.05 -0.10 -0.05 0.60 0.02 0.03 0.21 -0.10 -0.25
Bold figures indicate statistical significance at the 0.01 level (two-tailed). All the variables are described in the Appendix and in Table 1.A.

44
TABLE 2 Regressions using all available observations
(1) (2) (3) (4) RM DA_Modified Jones DA_Lagged Model DA_Adapted Model CO 0.762*** -0.468*** -0.260*** -0.467***
[0.000] [0.000] [0.000] [0.000] Institutions (t-1) -5.032*** 2.512*** 1.090*** 2.491***
[0.000] [0.000] [0.000] [0.000] Analysts (t-1) -0.237*** 0.081*** 0.013 0.081***
[0.000] [0.000] [0.225] [0.000] ATI (t-1) -1.379*** 1.073*** 0.689*** 1.067***
[0.000] [0.000] [0.000] [0.000] ATI_dummy -3.549*** 3.019*** 2.000*** 2.997***
[0.000] [0.000] [0.000] [0.000] Market share (t-1) 13.656*** -10.645*** -6.932*** -10.616***
[0.000] [0.000] [0.000] [0.000] Z-Score (t-1) -0.438*** 0.205*** 0.085*** 0.206***
[0.000] [0.000] [0.000] [0.000] Low MTR 0.283 -0.364*** -0.280** -0.355***
[0.654] [0.005] [0.027] [0.007] Auditing 0.594 -0.390*** -0.229*** -0.387***
[0.118] [0.000] [0.007] [0.000] NOA (t-1) 6.426*** -5.389*** -3.579*** -5.326***
[0.000] [0.000] [0.000] [0.000] Cycle (t-1) -0.004* 0.006*** 0.005*** 0.006***
[0.083] [0.000] [0.000] [0.000] ROA3 0.032 0.203*** 0.171*** 0.202***
[0.181] [0.000] [0.000] [0.000] SG 3.158*** -2.906*** -2.001*** -3.002***
[0.000] [0.000] [0.000] [0.000] MTB -1.258*** 0.755*** 0.430*** 0.752***
[0.000] [0.000] [0.000] [0.000] Size -0.317 0.645*** 0.528*** 0.637***
[0.114] [0.000] [0.000] [0.000] Leverage 1.292*** -0.865*** -0.534*** -0.862***
[0.000] [0.000] [0.000] [0.000] Bid/Ask spread -1.429*** 0.888*** 0.504*** 0.882***
[0.000] [0.000] [0.000] [0.000] Earn (t-1) -0.231***
[0.000] Pred_RM 0.688*** 0.407*** 0.685***
[0.000] [0.000] [0.000]

45
Unexp_RM 0.022*** 0.020*** 0.022*** [0.000] [0.000] [0.000]
Constant 12.462*** -5.912*** -5.090*** -5.866*** [0.000] [0.000] [0.000] [0.000]
N 38,968 38,700 38,611 38,700 adj. R-sq 0.076 0.099 0.073 0.097
The sample contains up to 38,968 firm-year observations for the period 1991-2010. All continuous variables are winsorized at the 1 and 99 percentiles to avoid the effect of influential observations. The regressions include year fixed effects. The p-values are based on robust standard errors clustered at the firm and year level. p-values in brackets. * p<0.10, ** p<0.05, *** p<0.01. Appendix B contains all variable definitions.
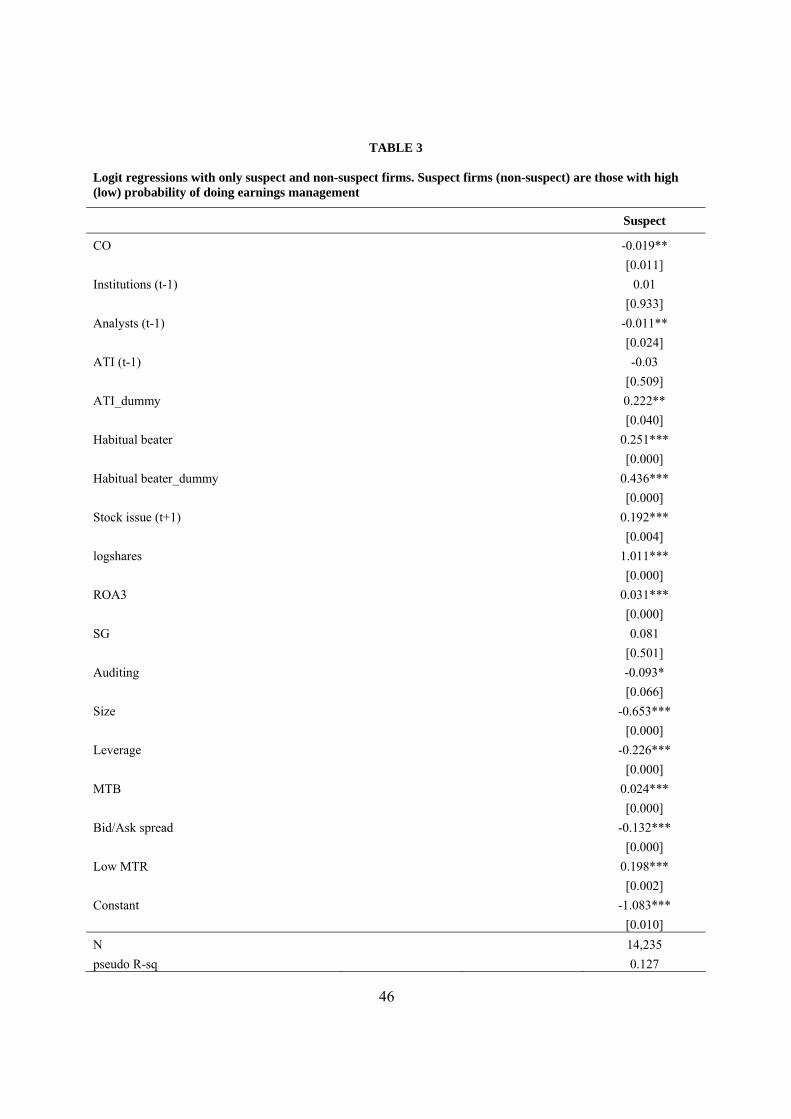
46
TABLE 3
Logit regressions with only suspect and non-suspect firms. Suspect firms (non-suspect) are those with high (low) probability of doing earnings management
Suspect
CO -0.019** [0.011]
Institutions (t-1) 0.01 [0.933]
Analysts (t-1) -0.011** [0.024]
ATI (t-1) -0.03 [0.509]
ATI_dummy 0.222** [0.040]
Habitual beater 0.251*** [0.000]
Habitual beater_dummy 0.436*** [0.000]
Stock issue (t+1) 0.192*** [0.004]
logshares 1.011*** [0.000]
ROA3 0.031*** [0.000]
SG 0.081 [0.501]
Auditing -0.093* [0.066]
Size -0.653*** [0.000]
Leverage -0.226*** [0.000]
MTB 0.024*** [0.000]
Bid/Ask spread -0.132*** [0.000]
Low MTR 0.198*** [0.002]
Constant -1.083*** [0.010]
N 14,235 pseudo R-sq 0.127

47
The dependent variable equals one if the firm is suspect of engaging in earnings management, and zero otherwise. The sample contains only suspect and non-suspect firms of engaging in earnings management. Suspect firms are either a) firm-years with earnings before extraordinary items over lagged assets between 0 and 0.005; or b) firm-years with change in basic EPS excluding extraordinary items from last year between zero and two cents; or c) firm-years with actual EPS less the last analyst forecast consensus before the fiscal year end between zero and one cent. Non-suspect firms are a) firm-years that miss or beat the zero earnings benchmark by more than 2.5% of lagged total assets, and b) firm-years that miss or beat analyst forecast consensus, and c) firm-years that miss or beat last-year EPS by more than five cents. All continuous variables are winsorized at the 1 and 99 percentiles to avoid the effect of influential observations. The regressions include year fixed effects. The p-values are based on robust standard errors clustered at the firm and year level. p-values in brackets. * p<0.10, ** p<0.05, *** p<0.01. Appendix B contains all variable definitions.

48
TABLE 4
Regressions with only suspect and non-suspect firms. Suspect firms (non-suspect) are those with high (low) probability of engaging in earnings management
(1) (2) (3) (4) RM DA_Modified Jones DA_Lagged Model DA_Adapted Model CO 0.805*** -0.467*** -0.274*** -0.466***
[0.000] [0.000] [0.000] [0.000] Institutions (t-1) -3.791*** 1.346*** 0.494 1.349***
[0.006] [0.001] [0.188] [0.001] Analysts (t-1) -0.411*** 0.162*** 0.059** 0.162***
[0.000] [0.000] [0.010] [0.000] ATI (t-1) -1.730*** 1.123*** 0.715*** 1.118***
[0.000] [0.000] [0.000] [0.000] ATI_dummy -2.342* 1.830*** 1.306*** 1.815***
[0.062] [0.000] [0.000] [0.000] Market share (t-1) 13.222*** -10.633*** -7.532*** -10.651***
[0.000] [0.000] [0.000] [0.000] Z-Score (t-1) -0.443*** 0.174*** 0.070** 0.175***
[0.000] [0.000] [0.018] [0.000] Low MTR 0.389 -0.411* -0.272 -0.403*
[0.695] [0.054] [0.190] [0.059] Auditing 1.474** -1.101*** -0.728*** -1.093***
[0.015] [0.000] [0.000] [0.000] NOA (t-1) 7.439*** -6.081*** -4.249*** -6.020***
[0.000] [0.000] [0.000] [0.000] Cycle (t-1) -0.001 0.006*** 0.004*** 0.006***
[0.756] [0.000] [0.000] [0.000] ROA3 0.032 0.222*** 0.190*** 0.221***
[0.372] [0.000] [0.000] [0.000] SG 3.868*** -3.653*** -2.724*** -3.738***
[0.003] [0.000] [0.000] [0.000] MTB -1.179*** 0.678*** 0.414*** 0.677***
[0.000] [0.000] [0.000] [0.000] Size 1.153*** -0.191* 0.073 -0.195*
[0.001] [0.068] [0.452] [0.062] Leverage 2.489*** -1.713*** -1.147*** -1.713***
[0.000] [0.000] [0.000] [0.000] Bid/Ask spread -1.722*** 1.005*** 0.583*** 1.003***
[0.000] [0.000] [0.000] [0.000] Earn (t-1) -0.246***
[0.000] Pred_RM 0.662*** 0.413*** 0.661***

49
[0.000] [0.000] [0.000] Unexp_RM 0.022*** 0.020*** 0.022***
[0.000] [0.000] [0.000] Constant 1.278 -0.997 -0.029 -0.993
[0.716] [0.255] [0.968] [0.257]
N 15,422 15,296 15,266 15,296 adj. R-sq 0.084 0.118 0.093 0.117
The sample contains only suspect and non-suspect firms of engaging in earnings management. Suspect firms are either a) firm-years with earnings before extraordinary items over lagged assets between 0 and 0.005; or b) firm-years with change in basic EPS excluding extraordinary items from last year between zero and two cents; or c) firm-years with actual EPS less the last analyst forecast consensus before the fiscal year end between zero and one cent. These criteria produce a sample of 6,193 firm-year observations. Non-suspect firms are a) firm-years that miss or beat the zero earnings benchmark by more than 2.5% of lagged total assets, and b) firm-years that miss or beat analyst forecast consensus, and c) firm-years that miss or beat last-year EPS by more than five cents. There are 9,229 non-suspect firm-years. All continuous variables are winsorized at the 1 and 99 percentiles to avoid the effect of influential observations. The regressions include year fixed effects. The p-values are based on robust standard errors clustered at the firm and year level. p-values in brackets. * p<0.10, ** p<0.05, *** p<0.01. Appendix B contains all variable definitions.
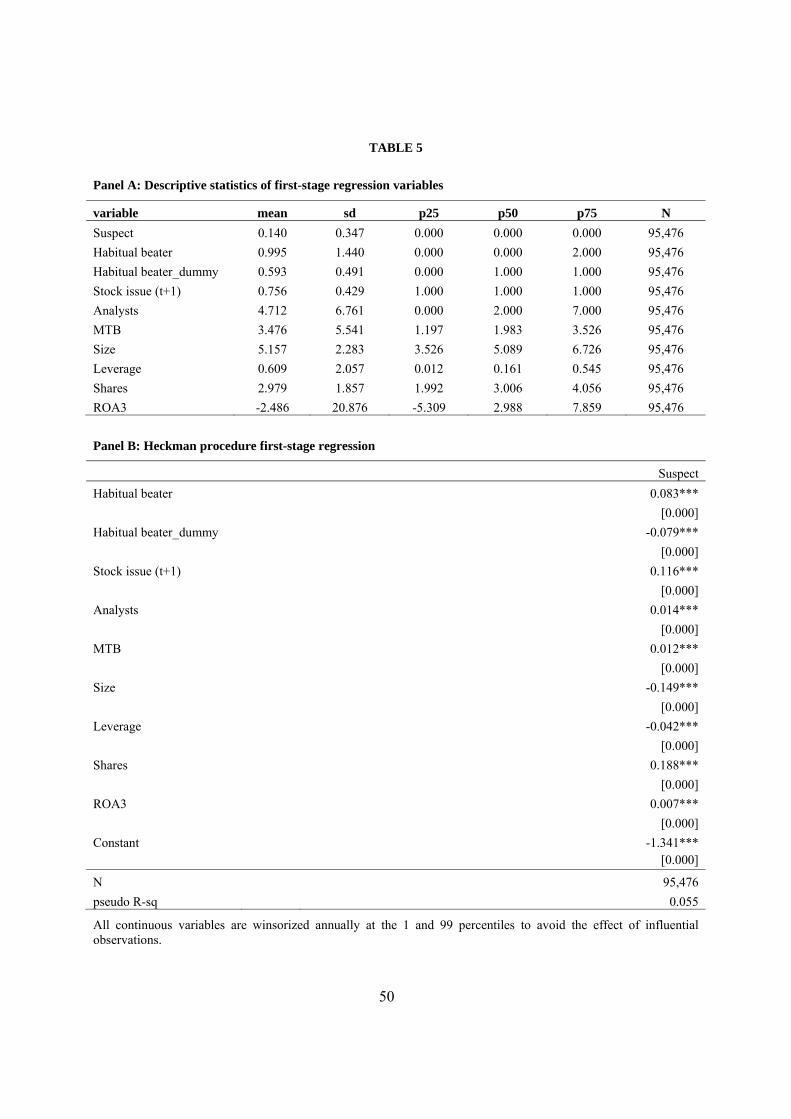
50
TABLE 5
Panel A: Descriptive statistics of first-stage regression variables
variable mean sd p25 p50 p75 N Suspect 0.140 0.347 0.000 0.000 0.000 95,476 Habitual beater 0.995 1.440 0.000 0.000 2.000 95,476 Habitual beater_dummy 0.593 0.491 0.000 1.000 1.000 95,476 Stock issue (t+1) 0.756 0.429 1.000 1.000 1.000 95,476 Analysts 4.712 6.761 0.000 2.000 7.000 95,476 MTB 3.476 5.541 1.197 1.983 3.526 95,476 Size 5.157 2.283 3.526 5.089 6.726 95,476 Leverage 0.609 2.057 0.012 0.161 0.545 95,476 Shares 2.979 1.857 1.992 3.006 4.056 95,476 ROA3 -2.486 20.876 -5.309 2.988 7.859 95,476
Panel B: Heckman procedure first-stage regression
Suspect Habitual beater 0.083***
[0.000] Habitual beater_dummy -0.079***
[0.000] Stock issue (t+1) 0.116***
[0.000] Analysts 0.014***
[0.000] MTB 0.012***
[0.000] Size -0.149***
[0.000] Leverage -0.042***
[0.000] Shares 0.188***
[0.000] ROA3 0.007***
[0.000] Constant -1.341***
[0.000]
N 95,476 pseudo R-sq 0.055
All continuous variables are winsorized annually at the 1 and 99 percentiles to avoid the effect of influential observations.

51
TABLE 5 (continued)
Panel C: Heckman procedure second-stage regression
(1) (2) (3) (4) RM DA_Modified Jones DA_Lagged Model DA_Adapted ModelCO 0.834*** -0.486*** -0.239*** -0.481***
[0.000] [0.000] [0.000] [0.000] Institutions (t-1) -3.850* 2.075*** 0.877* 2.055***
[0.084] [0.000] [0.077] [0.000] Analysts (t-1) -0.023 -0.042** -0.048** -0.041*
[0.817] [0.043] [0.017] [0.051] ATI (t-1) -1.553** 1.058*** 0.550*** 1.049***
[0.036] [0.000] [0.000] [0.000] ATI_dummy -2.513 1.886*** 1.064*** 1.839***
[0.206] [0.000] [0.007] [0.000] Market share (t-1) 15.014*** -10.803*** -5.873*** -10.752***
[0.001] [0.000] [0.000] [0.000] Z-Score (t-1) -0.377*** 0.213*** 0.095*** 0.212***
[0.000] [0.000] [0.004] [0.000] Low MTR 2.067 -1.128*** -0.541* -1.122***
[0.206] [0.000] [0.075] [0.000] Auditing 2.594*** -1.816*** -1.025*** -1.804***
[0.010] [0.000] [0.000] [0.000] NOA (t-1) 10.127*** -7.659*** -4.477*** -7.546***
[0.000] [0.000] [0.000] [0.000] Cycle (t-1) -0.008 0.008*** 0.005*** 0.008***
[0.202] [0.000] [0.000] [0.000] ROA3 0.071 0.124*** 0.101*** 0.122***
[0.329] [0.000] [0.000] [0.000] SG 7.925*** -7.379*** -4.841*** -7.357***
[0.001] [0.000] [0.000] [0.000] MTB -1.292*** 0.778*** 0.400*** 0.773***
[0.000] [0.000] [0.000] [0.000] Size -0.081 0.340*** 0.264** 0.328***
[0.886] [0.004] [0.023] [0.006] Leverage 2.109*** -1.292*** -0.697*** -1.281***
[0.000] [0.000] [0.000] [0.000] Bid/Ask spread -1.606*** 1.080*** 0.613*** 1.068***
[0.000] [0.000] [0.000] [0.000] Earn (t-1) -0.238***
[0.000] IMR 12.664*** -7.421*** -3.462*** -7.359***
[0.000] [0.000] [0.000] [0.000]

52
Pred_RM 0.678*** 0.363*** 0.673*** [0.000] [0.000] [0.000]
Unexp_RM 0.027*** 0.024*** 0.027*** [0.000] [0.000] [0.000]
Constant -22.188*** 10.979*** 4.841** 10.927*** [0.010] [0.000] [0.017] [0.000]
N 6,193 6,135 6,125 6,135 adj. R-sq 0.108 0.091 0.052 0.09
The sample only contains firms that are suspect of engaging in earnings management. Suspect firms are either a) firm-years with earnings before extraordinary items over lagged assets between 0 and 0.005; or b) firm-years with change in basic EPS excluding extraordinary items from last year between zero and two cents; or c) firm-years with actual EPS less the last analyst forecast consensus before the fiscal year end between zero and one cent. All continuous variables are winsorized at the 1 and 99 percentiles to avoid the effect of influential observations. The regressions include year fixed effects. The p-values are based on robust standard errors clustered at the firm and year level. p-values in brackets. * p<0.10, ** p<0.05, *** p<0.01. Appendix B contains all variable definitions.
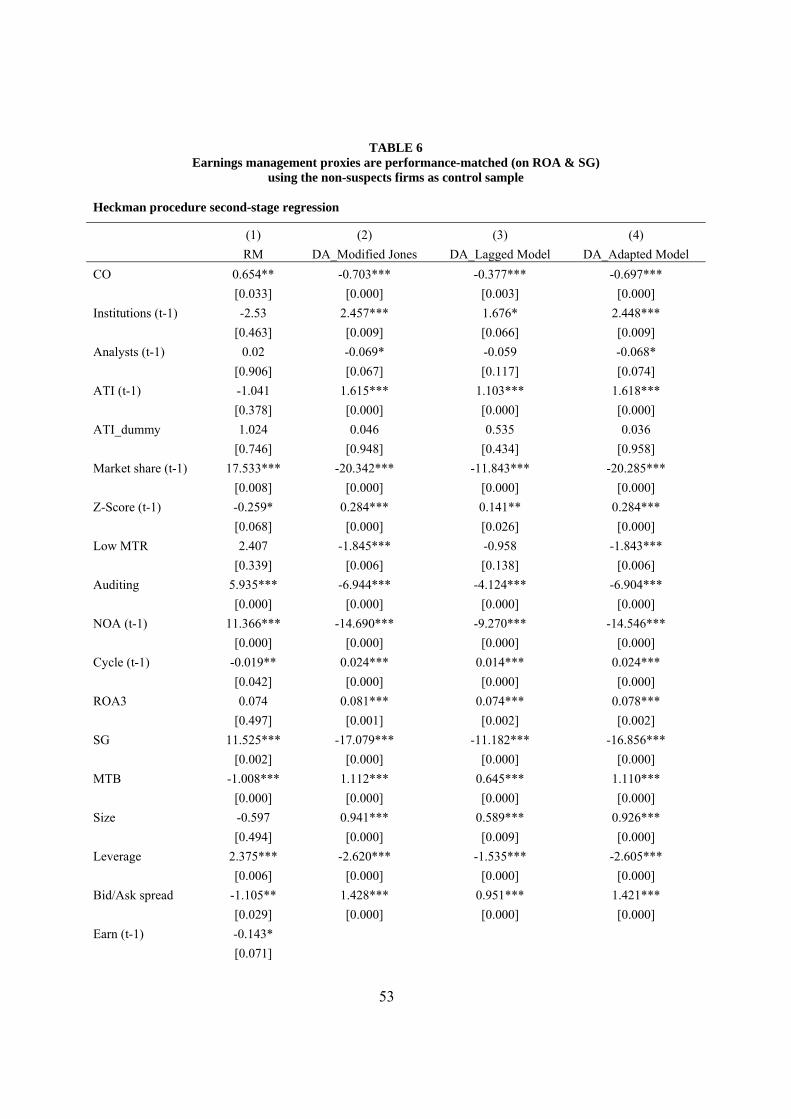
53
TABLE 6 Earnings management proxies are performance-matched (on ROA & SG)
using the non-suspects firms as control sample Heckman procedure second-stage regression
(1) (2) (3) (4) RM DA_Modified Jones DA_Lagged Model DA_Adapted Model CO 0.654** -0.703*** -0.377*** -0.697***
[0.033] [0.000] [0.003] [0.000] Institutions (t-1) -2.53 2.457*** 1.676* 2.448***
[0.463] [0.009] [0.066] [0.009] Analysts (t-1) 0.02 -0.069* -0.059 -0.068*
[0.906] [0.067] [0.117] [0.074] ATI (t-1) -1.041 1.615*** 1.103*** 1.618***
[0.378] [0.000] [0.000] [0.000] ATI_dummy 1.024 0.046 0.535 0.036
[0.746] [0.948] [0.434] [0.958] Market share (t-1) 17.533*** -20.342*** -11.843*** -20.285***
[0.008] [0.000] [0.000] [0.000] Z-Score (t-1) -0.259* 0.284*** 0.141** 0.284***
[0.068] [0.000] [0.026] [0.000] Low MTR 2.407 -1.845*** -0.958 -1.843***
[0.339] [0.006] [0.138] [0.006] Auditing 5.935*** -6.944*** -4.124*** -6.904***
[0.000] [0.000] [0.000] [0.000] NOA (t-1) 11.366*** -14.690*** -9.270*** -14.546***
[0.000] [0.000] [0.000] [0.000] Cycle (t-1) -0.019** 0.024*** 0.014*** 0.024***
[0.042] [0.000] [0.000] [0.000] ROA3 0.074 0.081*** 0.074*** 0.078***
[0.497] [0.001] [0.002] [0.002] SG 11.525*** -17.079*** -11.182*** -16.856***
[0.002] [0.000] [0.000] [0.000] MTB -1.008*** 1.112*** 0.645*** 1.110***
[0.000] [0.000] [0.000] [0.000] Size -0.597 0.941*** 0.589*** 0.926***
[0.494] [0.000] [0.009] [0.000] Leverage 2.375*** -2.620*** -1.535*** -2.605***
[0.006] [0.000] [0.000] [0.000] Bid/Ask spread -1.105** 1.428*** 0.951*** 1.421***
[0.029] [0.000] [0.000] [0.000] Earn (t-1) -0.143*
[0.071]
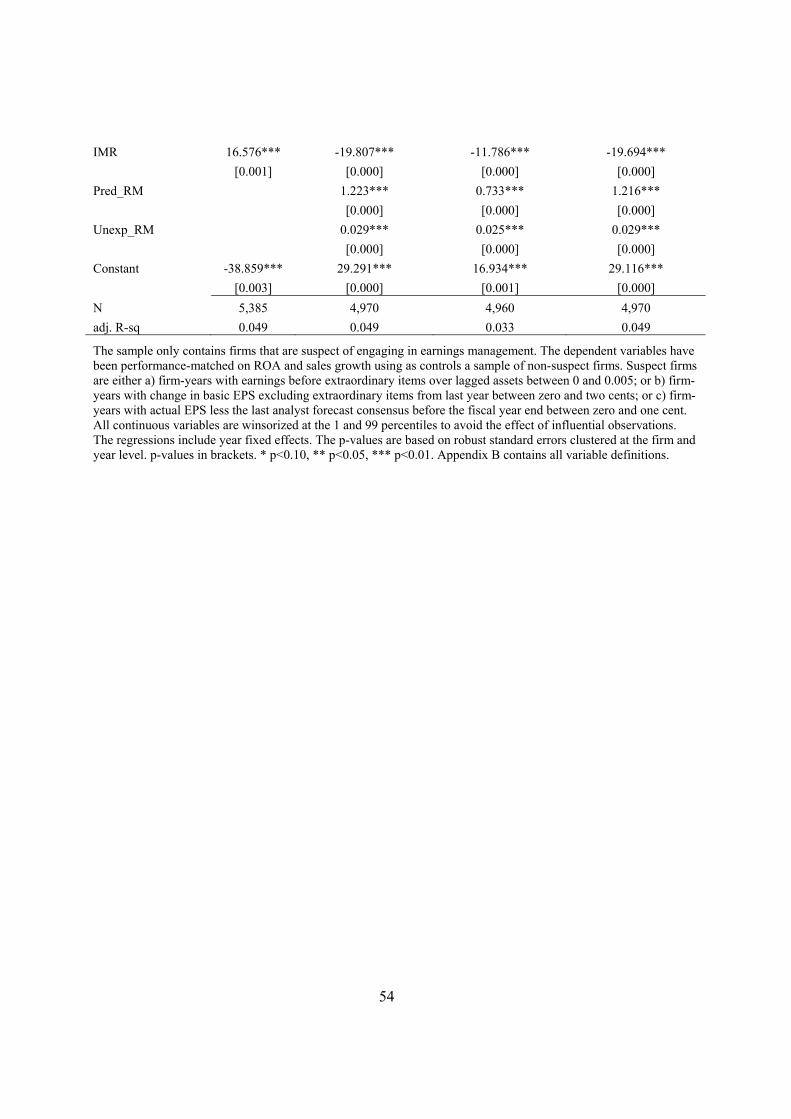
54
IMR 16.576*** -19.807*** -11.786*** -19.694*** [0.001] [0.000] [0.000] [0.000]
Pred_RM 1.223*** 0.733*** 1.216*** [0.000] [0.000] [0.000]
Unexp_RM 0.029*** 0.025*** 0.029*** [0.000] [0.000] [0.000]
Constant -38.859*** 29.291*** 16.934*** 29.116*** [0.003] [0.000] [0.001] [0.000]
N 5,385 4,970 4,960 4,970 adj. R-sq 0.049 0.049 0.033 0.049
The sample only contains firms that are suspect of engaging in earnings management. The dependent variables have been performance-matched on ROA and sales growth using as controls a sample of non-suspect firms. Suspect firms are either a) firm-years with earnings before extraordinary items over lagged assets between 0 and 0.005; or b) firm-years with change in basic EPS excluding extraordinary items from last year between zero and two cents; or c) firm-years with actual EPS less the last analyst forecast consensus before the fiscal year end between zero and one cent. All continuous variables are winsorized at the 1 and 99 percentiles to avoid the effect of influential observations. The regressions include year fixed effects. The p-values are based on robust standard errors clustered at the firm and year level. p-values in brackets. * p<0.10, ** p<0.05, *** p<0.01. Appendix B contains all variable definitions.

55
TABLE 7
Means of selected characteristics of CO deciles
CO decile CO_TLR CO_SKW CO_CR ROA MTB Size Leverage Cycle Bid/Ask PIN Volatility Age
1 0.04 -8.24 0.32 0.06 4.92 7.70 0.26 74.00 3.76 0.15 0.03 22.97 2 0.07 -1.56 0.33 0.05 3.69 7.24 0.26 73.48 3.72 0.16 0.03 20.04 3 0.09 -0.87 0.35 0.04 3.21 6.61 0.29 77.44 3.98 0.18 0.03 17.96 4 0.11 -0.48 0.37 0.02 3.15 6.13 0.34 79.95 4.17 0.19 0.03 17.19 5 0.13 -0.22 0.42 0.02 2.96 5.79 0.38 80.50 4.31 0.20 0.03 16.47 6 0.14 0.08 0.45 0.01 2.72 5.46 0.42 80.50 4.48 0.22 0.04 16.50 7 0.16 0.46 0.50 0.01 2.57 5.14 0.46 82.82 4.56 0.23 0.04 17.02 8 0.17 0.80 0.59 0.01 2.30 4.81 0.52 83.26 4.58 0.26 0.04 16.689 0.19 1.54 0.76 0.00 1.99 4.45 0.68 86.72 4.73 0.28 0.04 16.73
10 0.21 8.30 1.40 0.01 1.94 4.54 1.02 85.72 4.89 0.27 0.04 16.77
Rank correlation 1.00 1.00 1.00 -0.92 -1.00 -0.99 0.99 0.96 0.99 0.99 0.99 -0.65 Predicted sign + + + – – – + + + + + –
Rank correlation is the rank correlation between the CO decile and the column ranking, and is a measure of the monotonicity of the ranking in the table.
CO_TLR is the three-year average of timeliness loss recognition (G_Score + C_Score). G_Score is the timeliness of earnings to good news and C_Score is the incremental timeliness of earnings to bad news as developed by Khan and Watts (2009). CO_SKW is the negative of the ratio of the skewness of net income to the skewness of cash flow from operations. To obtain the skewness, we use rolling windows of five years ending at the current year. CO_CR is the three-year average of the conservatism ratio as developed by Callen et al. (2010). ROA. MTB is the market-to-book value of equity ratio. Size is the log of market value of equity. Leverage equals short-term plus long-term debt scaled by market value of equity. Cycle is the days of receivables plus the days of inventory less the days of payables, all at the beginning of the year. Bid/Ask spread is the bid-ask-spread defined as the annual average of daily spread scaled by the midpoint between bid and ask. Volatility is the standard deviation of one year of daily stock returns.