accounting methodology statement 2017/18
TRANSCRIPT
Accounting Methodology Statement 2017/18

1
Table of contents
Table of contents 1
Figures & Tables 2
1 Introduction 3
1.1 Purpose 3
1.2 Scope 3
1.3 Governance 3
2 Operating Systems, Structure and Outsourced Contracts 5
2.1 Operating Systems 5
2.2 Operating Structure 5
2.3 Cost categories 6
2.4 Expense line items 6
2.5 Outsourced contracts 7
3 Guidance 7
3.1 Regulatory Accounting Guidelines (RAGs) 7
4 Changes to methodology from 2016/17 8
5 Operating expenses - allocation assumptions 9
5.1 Wholesale 9
5.2 Retail 14
5.3 Billing and collection 17
6 Group Services expenditure 18
7 Capex 21
7.1 Allocation to Price Control and segment 21
7.2 Allocation to Upstream Service (US) level 23
7.3 Allocation of shared use assets 23
7.4 Data adjustments 23
7.5 Historic assets allocation: 24
7.6 Allocation to infrastructure network reinforcement 24
7.7 Population of tables 4D and 4E 24
7.8 Reconciliation 24
8 Year on year comparison of operating expenditure 25
8.1 Wholesale water 25
8.2 Wholesale wastewater 27
8.3 Retail - Household 29
8.4 Retail – Non-Household 29
9 Glossary of Terms 29
2
Figures & Tables
Figure 1 Governance Process 4
Figure 2 Operating Companies 5
Table 1 Price Control unit and Upstream Service levels 6
Table 2 Outsourced Contracts 7
Table 3 Changes to Methodology from 2016/17 9
Table 4 Water service allocation basis 10
Table 5 Wastewater service allocation basis 11
Table 6 Derivation of quantities used to calculate unit cost information for operating expenses in
table 4D 12
Table 7 Derivation of quantities used to calculate unit cost information for operating expenses in
table 4E 13
Table 8 Derivation of quantities used to calculate population unit cost information for operating expenses in table 4D and 4E 13
Table 9 The impact of the revised methodology on 17/18 LAHA and WOC Commission 14
Table 10 The impact of the revised methodology on 17/18 Doubtful Debt costs 14
Table 11 Retail activities by expense 15
Table 12 Retail opex allocation bases 16
Table 13 Household/Non-household allocation 16
Table 14 Group Services 18
Table 15 SAP Accounting Separation Key Mapping Table 21
Table 16 2D Categories 22
Table 17 Wholesale Water Opex and Units 25
Table 18 Wholesale Water Opex year on year movements in operating expenses by Upstream
Service level 26
Table 19 Wholesale Wastewater Opex and Units 27
Table 20 Wholesale Wastewater year on year movements in operating expenses by Upstream
Service level 28
Table 21 Retail Opex - Household ....................................................................................................... 29
3
1 Introduction
1.1 Purpose The purpose of this methodology statement (“the ‘Statement”) is to explain the systems, processes and allocation methods used to report costs in the following tables in the Annual Performance Report (“APR”) for the year ended 31 March 2018: Section 2: Price review and other segmental reporting:
• 2A – Segmental income statement
• 2B – Totex analysis – wholesale water and wastewater;
• 2C – Operating cost analysis - Retail; and
• 2D – Historic cost analysis of tangible fixed assets – wholesale and retail Section 4: Additional regulatory reporting:
• 4D – Totex analysis – wholesale water;
• 4E – Totex analysis – wholesale wastewater; and
• 4F – Operating cost analysis – Retail Household; These are referred to as the ‘Section 2 tables’ and ‘Section 4 tables’ throughout this document and are prepared in accordance with Regulatory Accounting Guidelines (“RAGs”). This methodology statement should be read in conjunction with the APR for the year ended 31 March 2018. This methodology explains the Wholesale upstream services and Price control methodology approach as stated on RAG 3.10 and therefore does not cover the approach used for the more detailed splits in the cost assessment tables.
1.2 Scope This document relates to Thames Water Utilities Limited appointed business only and focuses only on costs relating to that business. This statement should be read in conjunction with the following guidance:
• IN18/07 ‘Expectations for monopoly company annual performance reporting 2017-18’
• RAG 2.07 ‘Guideline for the classification of costs across the price controls’;
• RAG 3.10 ‘Guideline for the format and disclosures for the annual performance report;
• RAG 4.07 ‘Guideline for the table definitions for the annual performance report’; and
• RAG 5.07 ‘Guideline for transfer pricing in the water and sewerage sectors’
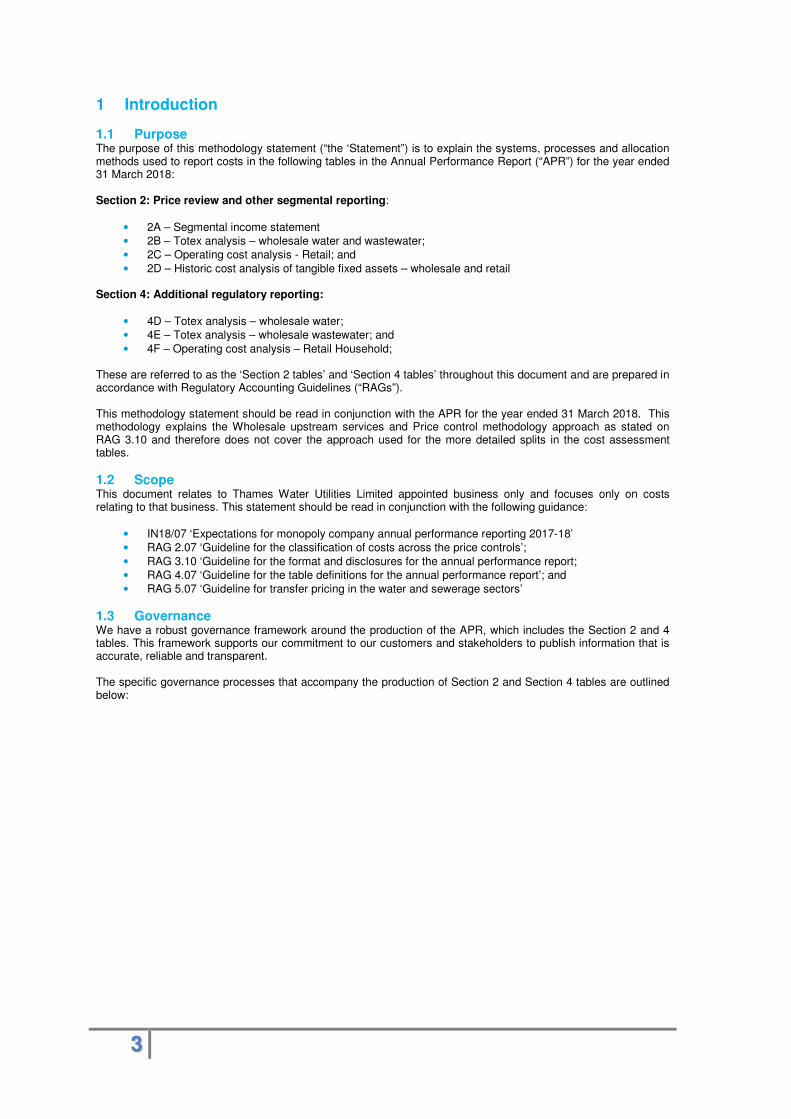
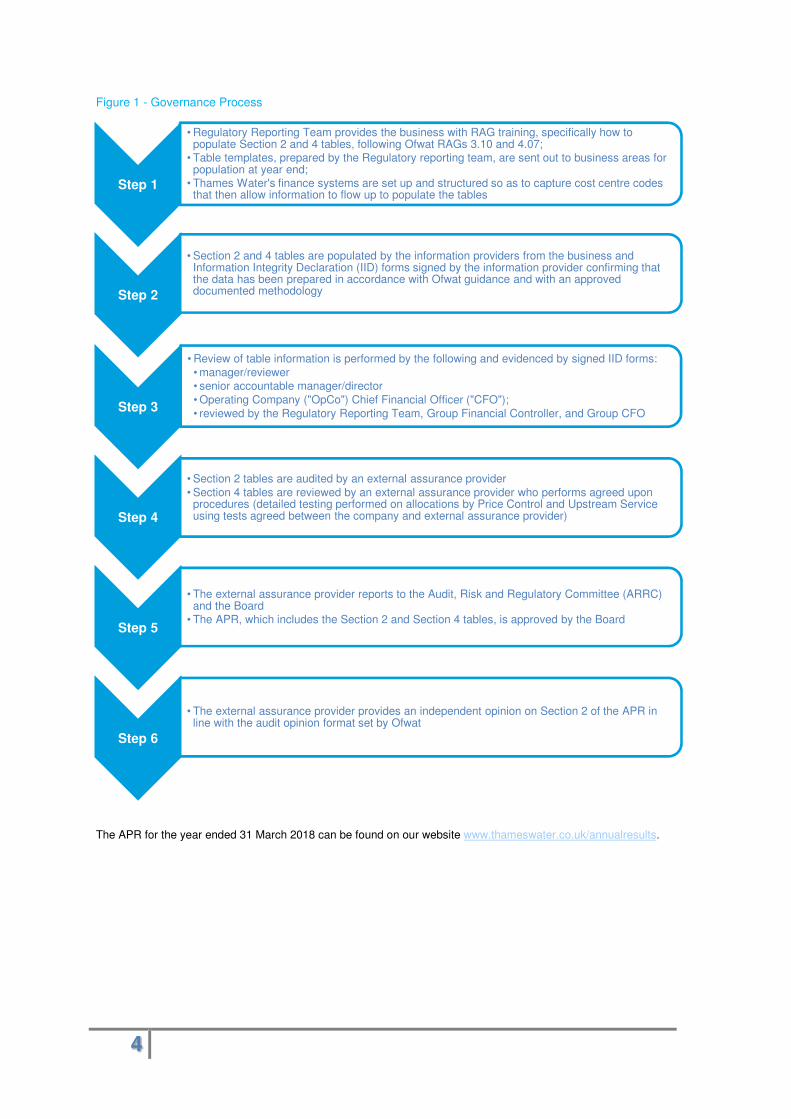
1.3 Governance We have a robust governance framework around the production of the APR, which includes the Section 2 and 4 tables. This framework supports our commitment to our customers and stakeholders to publish information that is accurate, reliable and transparent. The specific governance processes that accompany the production of Section 2 and Section 4 tables are outlined below:
4
Figure 1 - Governance Process
The APR for the year ended 31 March 2018 can be found on our website www.thameswater.co.uk/annualresults.
Step 1
• Regulatory Reporting Team provides the business with RAG training, specifically how to populate Section 2 and 4 tables, following Ofwat RAGs 3.10 and 4.07;
• Table templates, prepared by the Regulatory reporting team, are sent out to business areas for population at year end;
• Thames Water's finance systems are set up and structured so as to capture cost centre codes that then allow information to flow up to populate the tables
Step 2
• Section 2 and 4 tables are populated by the information providers from the business and Information Integrity Declaration (IID) forms signed by the information provider confirming that the data has been prepared in accordance with Ofwat guidance and with an approved documented methodology
Step 3
• Review of table information is performed by the following and evidenced by signed IID forms:
• manager/reviewer• senior accountable manager/director
• Operating Company ("OpCo") Chief Financial Officer ("CFO");
• reviewed by the Regulatory Reporting Team, Group Financial Controller, and Group CFO
Step 4
• Section 2 tables are audited by an external assurance provider
• Section 4 tables are reviewed by an external assurance provider who performs agreed upon procedures (detailed testing performed on allocations by Price Control and Upstream Service using tests agreed between the company and external assurance provider)
Step 5
• The external assurance provider reports to the Audit, Risk and Regulatory Committee (ARRC) and the Board
• The APR, which includes the Section 2 and Section 4 tables, is approved by the Board
Step 6
• The external assurance provider provides an independent opinion on Section 2 of the APR in line with the audit opinion format set by Ofwat
5
2 Operating Systems, Structure and Outsourced Contracts
2.1 Operating Systems There are two key systems used for the population of Section 2 and Section 4 tables:
• SAP; the primary financial accounting and management tool used by the business and the source of the data used in Anaplan
• Anaplan; (implemented in 2015) is the system used for allocating operating expenditure (“opex”) to upstream service (“US”) levels1
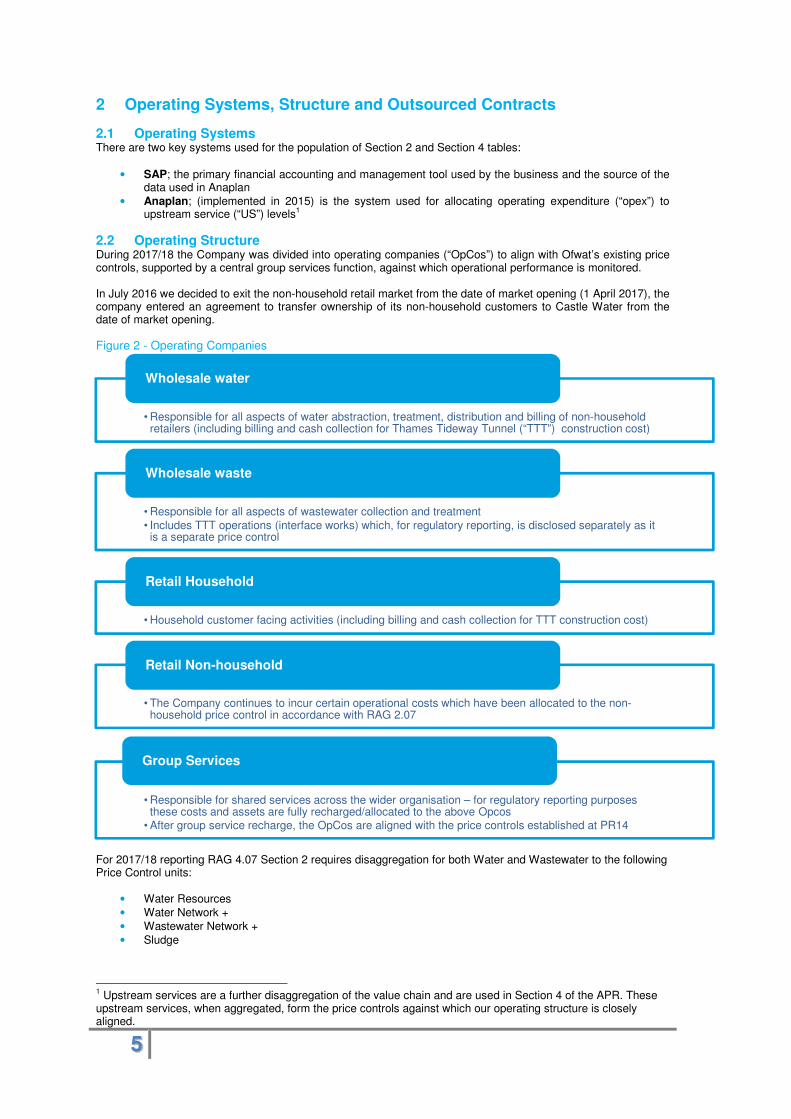
2.2 Operating Structure During 2017/18 the Company was divided into operating companies (“OpCos”) to align with Ofwat’s existing price controls, supported by a central group services function, against which operational performance is monitored. In July 2016 we decided to exit the non-household retail market from the date of market opening (1 April 2017), the company entered an agreement to transfer ownership of its non-household customers to Castle Water from the date of market opening.
Figure 2 - Operating Companies
For 2017/18 reporting RAG 4.07 Section 2 requires disaggregation for both Water and Wastewater to the following Price Control units:
• Water Resources
• Water Network +
• Wastewater Network +
• Sludge
1 Upstream services are a further disaggregation of the value chain and are used in Section 4 of the APR. These upstream services, when aggregated, form the price controls against which our operating structure is closely aligned.
• Responsible for all aspects of water abstraction, treatment, distribution and billing of non-household retailers (including billing and cash collection for Thames Tideway Tunnel (“TTT”) construction cost)
Wholesale water
• Responsible for all aspects of wastewater collection and treatment
• Includes TTT operations (interface works) which, for regulatory reporting, is disclosed separately as it is a separate price control
Wholesale waste
• Household customer facing activities (including billing and cash collection for TTT construction cost)
Retail Household
• The Company continues to incur certain operational costs which have been allocated to the non-household price control in accordance with RAG 2.07
Retail Non-household
• Responsible for shared services across the wider organisation – for regulatory reporting purposes these costs and assets are fully recharged/allocated to the above Opcos
• After group service recharge, the OpCos are aligned with the price controls established at PR14
Group Services
6
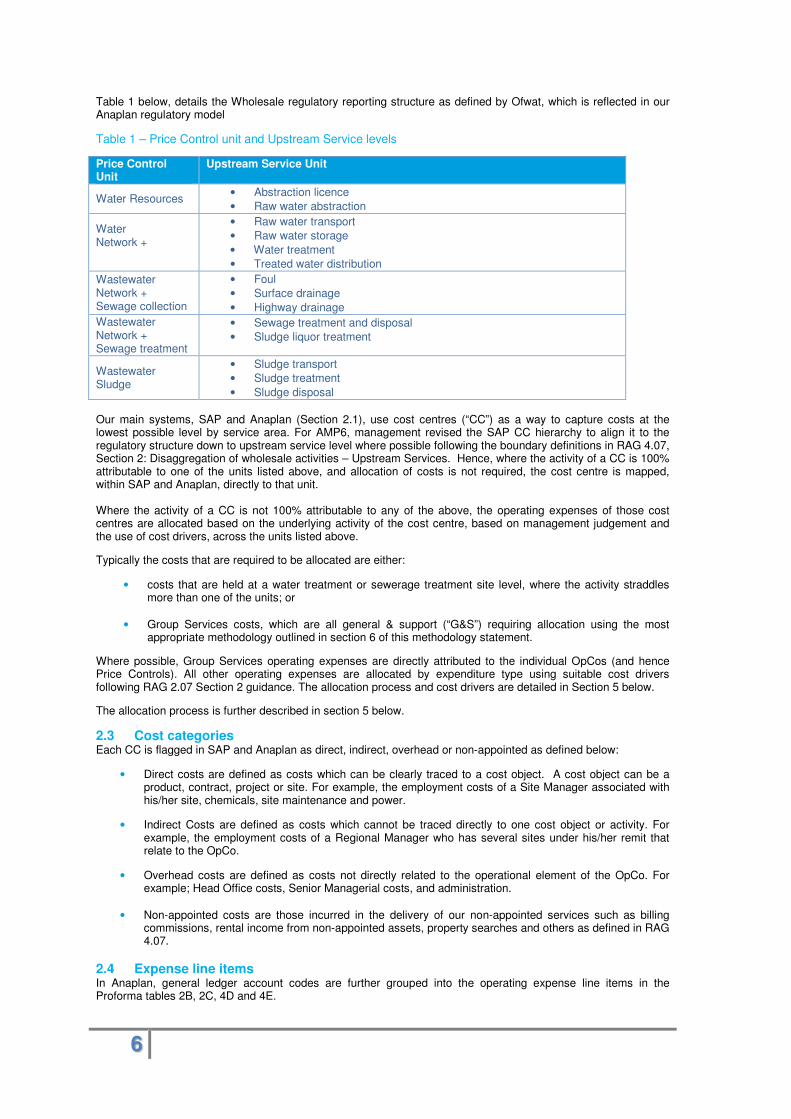
Table 1 below, details the Wholesale regulatory reporting structure as defined by Ofwat, which is reflected in our Anaplan regulatory model
Table 1 – Price Control unit and Upstream Service levels
Price Control Unit
Upstream Service Unit
Water Resources • Abstraction licence
• Raw water abstraction
Water Network +
• Raw water transport
• Raw water storage
• Water treatment
• Treated water distribution
Wastewater Network + Sewage collection
• Foul
• Surface drainage
• Highway drainage
Wastewater Network + Sewage treatment
• Sewage treatment and disposal
• Sludge liquor treatment
Wastewater Sludge
• Sludge transport
• Sludge treatment
• Sludge disposal
Our main systems, SAP and Anaplan (Section 2.1), use cost centres (“CC”) as a way to capture costs at the lowest possible level by service area. For AMP6, management revised the SAP CC hierarchy to align it to the regulatory structure down to upstream service level where possible following the boundary definitions in RAG 4.07, Section 2: Disaggregation of wholesale activities – Upstream Services. Hence, where the activity of a CC is 100% attributable to one of the units listed above, and allocation of costs is not required, the cost centre is mapped, within SAP and Anaplan, directly to that unit. Where the activity of a CC is not 100% attributable to any of the above, the operating expenses of those cost centres are allocated based on the underlying activity of the cost centre, based on management judgement and the use of cost drivers, across the units listed above.
Typically the costs that are required to be allocated are either:
• costs that are held at a water treatment or sewerage treatment site level, where the activity straddles more than one of the units; or
• Group Services costs, which are all general & support (“G&S”) requiring allocation using the most appropriate methodology outlined in section 6 of this methodology statement.
Where possible, Group Services operating expenses are directly attributed to the individual OpCos (and hence Price Controls). All other operating expenses are allocated by expenditure type using suitable cost drivers following RAG 2.07 Section 2 guidance. The allocation process and cost drivers are detailed in Section 5 below.
The allocation process is further described in section 5 below.
2.3 Cost categories Each CC is flagged in SAP and Anaplan as direct, indirect, overhead or non-appointed as defined below:
• Direct costs are defined as costs which can be clearly traced to a cost object. A cost object can be a product, contract, project or site. For example, the employment costs of a Site Manager associated with his/her site, chemicals, site maintenance and power.
• Indirect Costs are defined as costs which cannot be traced directly to one cost object or activity. For example, the employment costs of a Regional Manager who has several sites under his/her remit that relate to the OpCo.
• Overhead costs are defined as costs not directly related to the operational element of the OpCo. For example; Head Office costs, Senior Managerial costs, and administration.
• Non-appointed costs are those incurred in the delivery of our non-appointed services such as billing commissions, rental income from non-appointed assets, property searches and others as defined in RAG 4.07.
2.4 Expense line items In Anaplan, general ledger account codes are further grouped into the operating expense line items in the Proforma tables 2B, 2C, 4D and 4E.
7
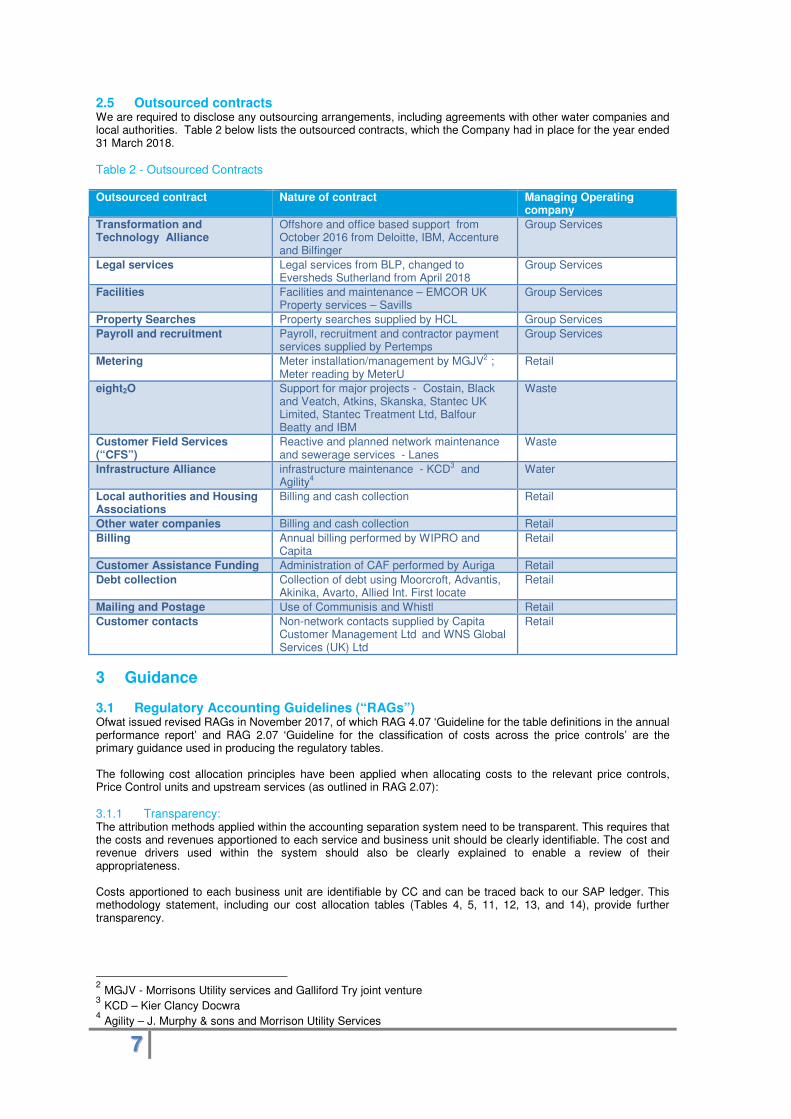
2.5 Outsourced contracts We are required to disclose any outsourcing arrangements, including agreements with other water companies and local authorities. Table 2 below lists the outsourced contracts, which the Company had in place for the year ended 31 March 2018.
Table 2 - Outsourced Contracts
Outsourced contract Nature of contract Managing Operating company
Transformation and Technology Alliance
Offshore and office based support from October 2016 from Deloitte, IBM, Accenture and Bilfinger
Group Services
Legal services Legal services from BLP, changed to Eversheds Sutherland from April 2018
Group Services
Facilities Facilities and maintenance – EMCOR UK Property services – Savills
Group Services
Property Searches Property searches supplied by HCL Group Services
Payroll and recruitment Payroll, recruitment and contractor payment services supplied by Pertemps
Group Services
Metering Meter installation/management by MGJV2 ; Meter reading by MeterU
Retail
eight2O Support for major projects - Costain, Black and Veatch, Atkins, Skanska, Stantec UK Limited, Stantec Treatment Ltd, Balfour Beatty and IBM
Waste
Customer Field Services (“CFS”)
Reactive and planned network maintenance and sewerage services - Lanes
Waste
Infrastructure Alliance infrastructure maintenance - KCD3 and Agility4
Water
Local authorities and Housing Associations
Billing and cash collection Retail
Other water companies Billing and cash collection Retail
Billing Annual billing performed by WIPRO and Capita
Retail
Customer Assistance Funding Administration of CAF performed by Auriga Retail
Debt collection Collection of debt using Moorcroft, Advantis, Akinika, Avarto, Allied Int. First locate
Retail
Mailing and Postage Use of Communisis and Whistl Retail
Customer contacts Non-network contacts supplied by Capita Customer Management Ltd and WNS Global Services (UK) Ltd
Retail
3 Guidance
3.1 Regulatory Accounting Guidelines (“RAGs”) Ofwat issued revised RAGs in November 2017, of which RAG 4.07 ‘Guideline for the table definitions in the annual performance report’ and RAG 2.07 ‘Guideline for the classification of costs across the price controls’ are the primary guidance used in producing the regulatory tables. The following cost allocation principles have been applied when allocating costs to the relevant price controls, Price Control units and upstream services (as outlined in RAG 2.07):
Transparency: 3.1.1The attribution methods applied within the accounting separation system need to be transparent. This requires that the costs and revenues apportioned to each service and business unit should be clearly identifiable. The cost and revenue drivers used within the system should also be clearly explained to enable a review of their appropriateness. Costs apportioned to each business unit are identifiable by CC and can be traced back to our SAP ledger. This methodology statement, including our cost allocation tables (Tables 4, 5, 11, 12, 13, and 14), provide further transparency.
2 MGJV - Morrisons Utility services and Galliford Try joint venture
3 KCD – Kier Clancy Docwra
4 Agility – J. Murphy & sons and Morrison Utility Services
8
Causality: 3.1.2Cost causality requires that costs (and revenues) are allocated to those activities and services that cause the cost (or revenue) to be incurred. This requires that the attribution of costs and revenues to activities and services should be performed at as granular a level as possible
Wherever possible, costs are directly attributed to a price control. Some costs are less easily attributed (for example the costs of regulation). Where possible we have taken an activity based costing approach. The method applied to allocating indirect costs is described in this methodology statement, Section 6.
Non-discrimination: 3.1.3The attribution of costs and revenues should not favour any business unit within the regulated company and it should be possible to demonstrate that internal transfer charges are consistent with the prices charged to external third parties.
Costs allocated are objective and do not favour any OpCo, business unit or service within the regulated company and are undertaken at an arm’s length.
No cross subsidy between price controls: 3.1.4Following the introduction of separate binding price controls at the 2014 price review, companies cannot transfer costs between the price control units in setting prices and preparing regulatory accounting statements. In accordance with RAG 5, transfer prices for transactions between price control units should be based on market price unless no market exists, in which case transfer prices should be based on cost.
In line with the separate binding price controls introduced from April 2015, costs are not transferred between price control units and are compliant with RAG 5.07 ‘Guideline for transfer pricing in the water and sewerage sectors’.
Objectivity: 3.1.5The cost and revenue attribution criteria need to be objective and should not intend to benefit any business unit or service
Costs are allocated objectively and do not favour any OpCo, business unit or service within the regulated company.
Consistency: 3.1.6The cost and revenue attribution criteria should be consistent from year to year to enable meaningful comparison of information over time. Changes to the attribution methodology from year to year should be clearly justified and documented.
Cost allocation methods are kept as consistent as possible. Where changes are required, these are documented in Section 4.
Principal use: 3.1.7
Capital expenditures and depreciation should be directly attributed to one of the five5 services for which price limits have been set for 2015-20. Where this is not possible as the asset is used by more than one service, it should be reported in the service of principal use with recharges made to the others services that use the asset reflecting the proportion of the asset used by the other services.
Where possible we have directly attributed capital expenditure and the corresponding depreciation to the price control units and applied the principle use guidance for shared assets, section 7. Section 7 below details the allocation assumptions outlining how the above principles have been applied.
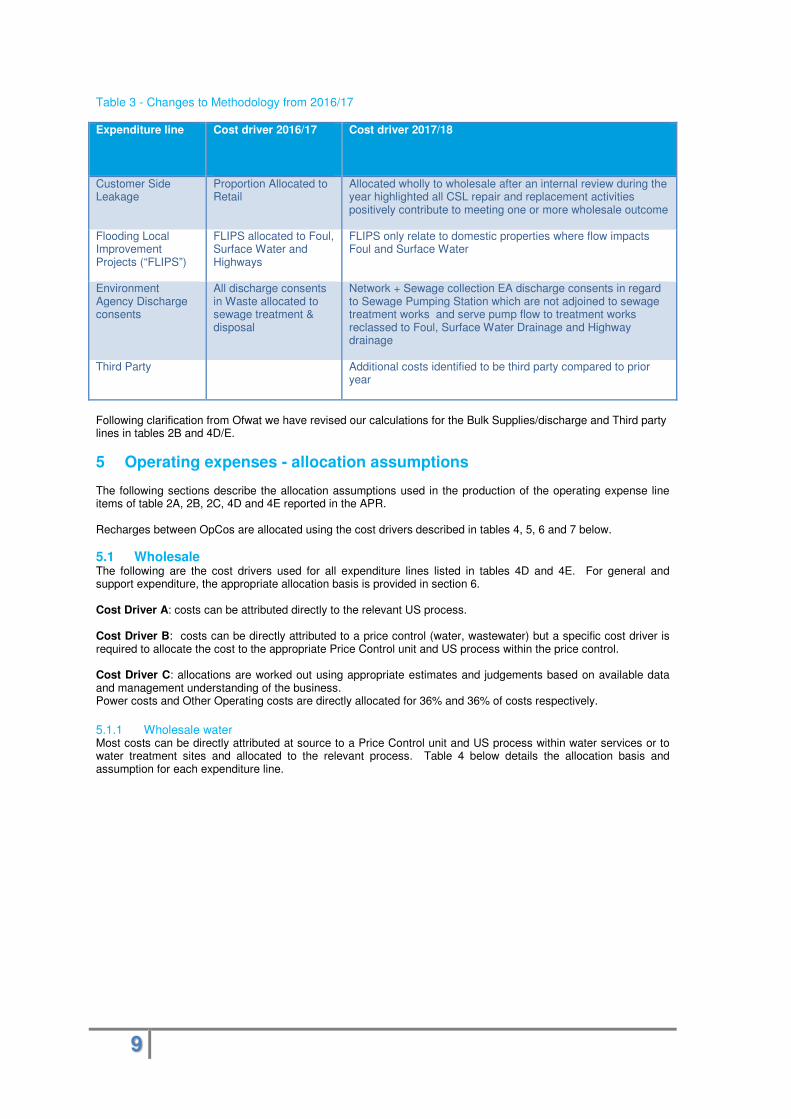
4 Changes to methodology from 2016/17 As a result of management review and to align more closely with RAG 2.07, the cost drivers for the following costs have changed from prior year:
5 There are five binding price controls for AMP6 being Wholesale Water, Wholesale Waste, Retail Household, Retail Non-household and Thames Tideway Tunnel.
9
Table 3 - Changes to Methodology from 2016/17
Expenditure line Cost driver 2016/17
Cost driver 2017/18
Customer Side Leakage
Proportion Allocated to Retail
Allocated wholly to wholesale after an internal review during the year highlighted all CSL repair and replacement activities positively contribute to meeting one or more wholesale outcome
Flooding Local Improvement Projects (“FLIPS”)
FLIPS allocated to Foul, Surface Water and Highways
FLIPS only relate to domestic properties where flow impacts Foul and Surface Water
Environment Agency Discharge consents
All discharge consents in Waste allocated to sewage treatment & disposal
Network + Sewage collection EA discharge consents in regard to Sewage Pumping Station which are not adjoined to sewage treatment works and serve pump flow to treatment works reclassed to Foul, Surface Water Drainage and Highway drainage
Third Party Additional costs identified to be third party compared to prior year
Following clarification from Ofwat we have revised our calculations for the Bulk Supplies/discharge and Third party lines in tables 2B and 4D/E.
5 Operating expenses - allocation assumptions The following sections describe the allocation assumptions used in the production of the operating expense line items of table 2A, 2B, 2C, 4D and 4E reported in the APR. Recharges between OpCos are allocated using the cost drivers described in tables 4, 5, 6 and 7 below.
5.1 Wholesale The following are the cost drivers used for all expenditure lines listed in tables 4D and 4E. For general and support expenditure, the appropriate allocation basis is provided in section 6. Cost Driver A: costs can be attributed directly to the relevant US process.
Cost Driver B: costs can be directly attributed to a price control (water, wastewater) but a specific cost driver is required to allocate the cost to the appropriate Price Control unit and US process within the price control.
Cost Driver C: allocations are worked out using appropriate estimates and judgements based on available data and management understanding of the business. Power costs and Other Operating costs are directly allocated for 36% and 36% of costs respectively.
Wholesale water 5.1.1
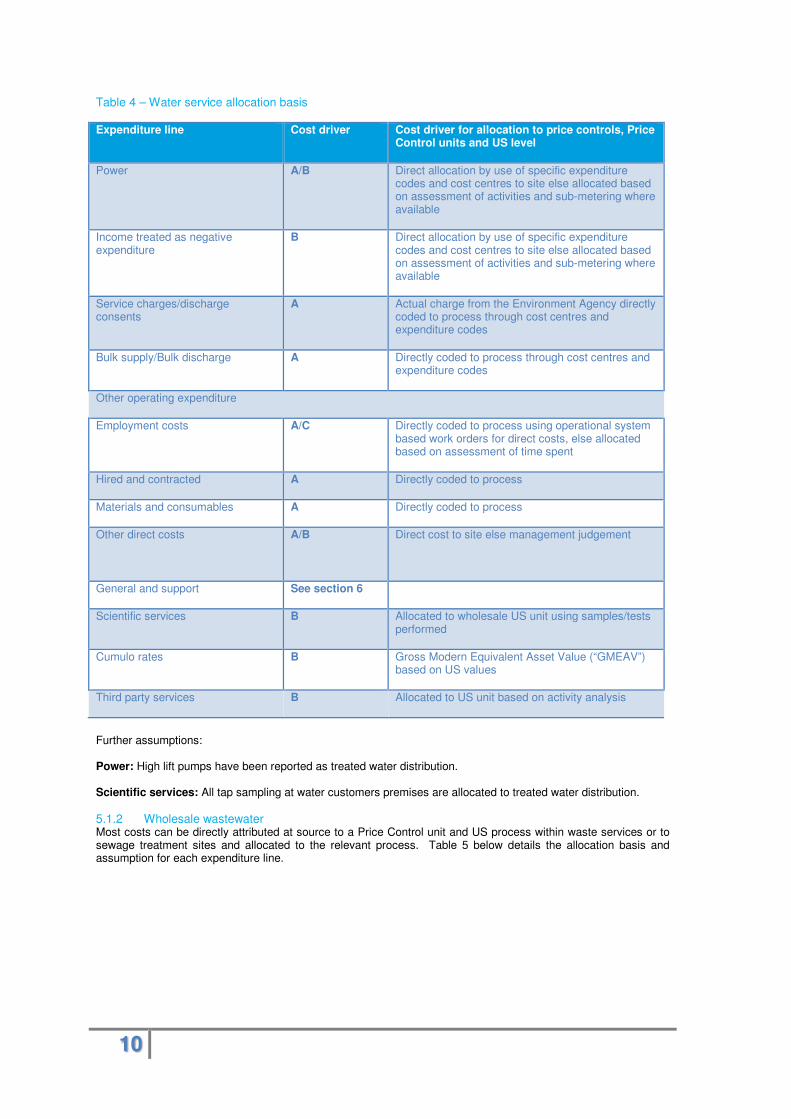
Most costs can be directly attributed at source to a Price Control unit and US process within water services or to water treatment sites and allocated to the relevant process. Table 4 below details the allocation basis and assumption for each expenditure line.
10
Table 4 – Water service allocation basis
Expenditure line Cost driver Cost driver for allocation to price controls, Price Control units and US level
Power A/B Direct allocation by use of specific expenditure codes and cost centres to site else allocated based on assessment of activities and sub-metering where available
Income treated as negative expenditure
B Direct allocation by use of specific expenditure codes and cost centres to site else allocated based on assessment of activities and sub-metering where available
Service charges/discharge consents
A Actual charge from the Environment Agency directly coded to process through cost centres and expenditure codes
Bulk supply/Bulk discharge A Directly coded to process through cost centres and expenditure codes
Other operating expenditure
Employment costs A/C Directly coded to process using operational system based work orders for direct costs, else allocated based on assessment of time spent
Hired and contracted A Directly coded to process
Materials and consumables A Directly coded to process
Other direct costs A/B Direct cost to site else management judgement
General and support See section 6
Scientific services B Allocated to wholesale US unit using samples/tests performed
Cumulo rates B Gross Modern Equivalent Asset Value (“GMEAV”) based on US values
Third party services B Allocated to US unit based on activity analysis
Further assumptions: Power: High lift pumps have been reported as treated water distribution. Scientific services: All tap sampling at water customers premises are allocated to treated water distribution.
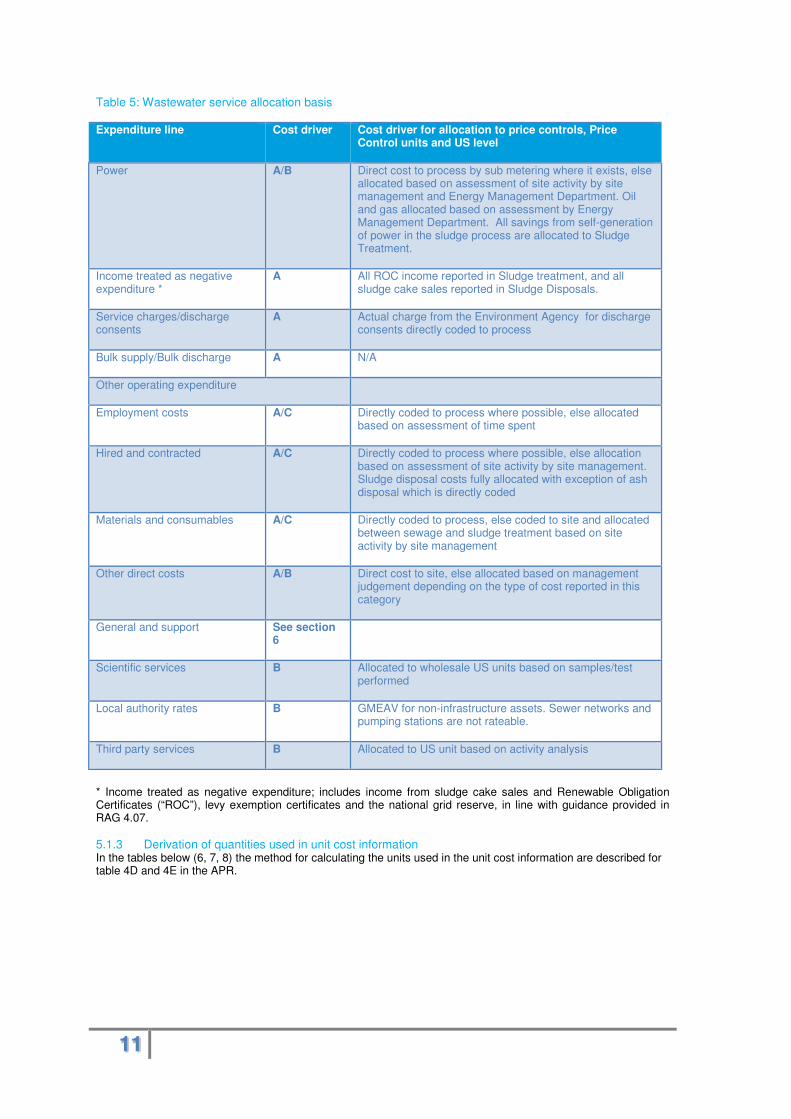
Wholesale wastewater 5.1.2Most costs can be directly attributed at source to a Price Control unit and US process within waste services or to sewage treatment sites and allocated to the relevant process. Table 5 below details the allocation basis and assumption for each expenditure line.
11
Table 5: Wastewater service allocation basis
Expenditure line Cost driver Cost driver for allocation to price controls, Price Control units and US level
Power A/B Direct cost to process by sub metering where it exists, else allocated based on assessment of site activity by site management and Energy Management Department. Oil and gas allocated based on assessment by Energy Management Department. All savings from self-generation of power in the sludge process are allocated to Sludge Treatment.
Income treated as negative expenditure *
A All ROC income reported in Sludge treatment, and all sludge cake sales reported in Sludge Disposals.
Service charges/discharge consents
A Actual charge from the Environment Agency for discharge consents directly coded to process
Bulk supply/Bulk discharge A N/A
Other operating expenditure
Employment costs A/C Directly coded to process where possible, else allocated based on assessment of time spent
Hired and contracted A/C Directly coded to process where possible, else allocation based on assessment of site activity by site management. Sludge disposal costs fully allocated with exception of ash disposal which is directly coded
Materials and consumables A/C Directly coded to process, else coded to site and allocated between sewage and sludge treatment based on site activity by site management
Other direct costs A/B Direct cost to site, else allocated based on management judgement depending on the type of cost reported in this category
General and support See section 6
Scientific services B Allocated to wholesale US units based on samples/test performed
Local authority rates B GMEAV for non-infrastructure assets. Sewer networks and pumping stations are not rateable.
Third party services B Allocated to US unit based on activity analysis
* Income treated as negative expenditure; includes income from sludge cake sales and Renewable Obligation Certificates (“ROC”), levy exemption certificates and the national grid reserve, in line with guidance provided in RAG 4.07.
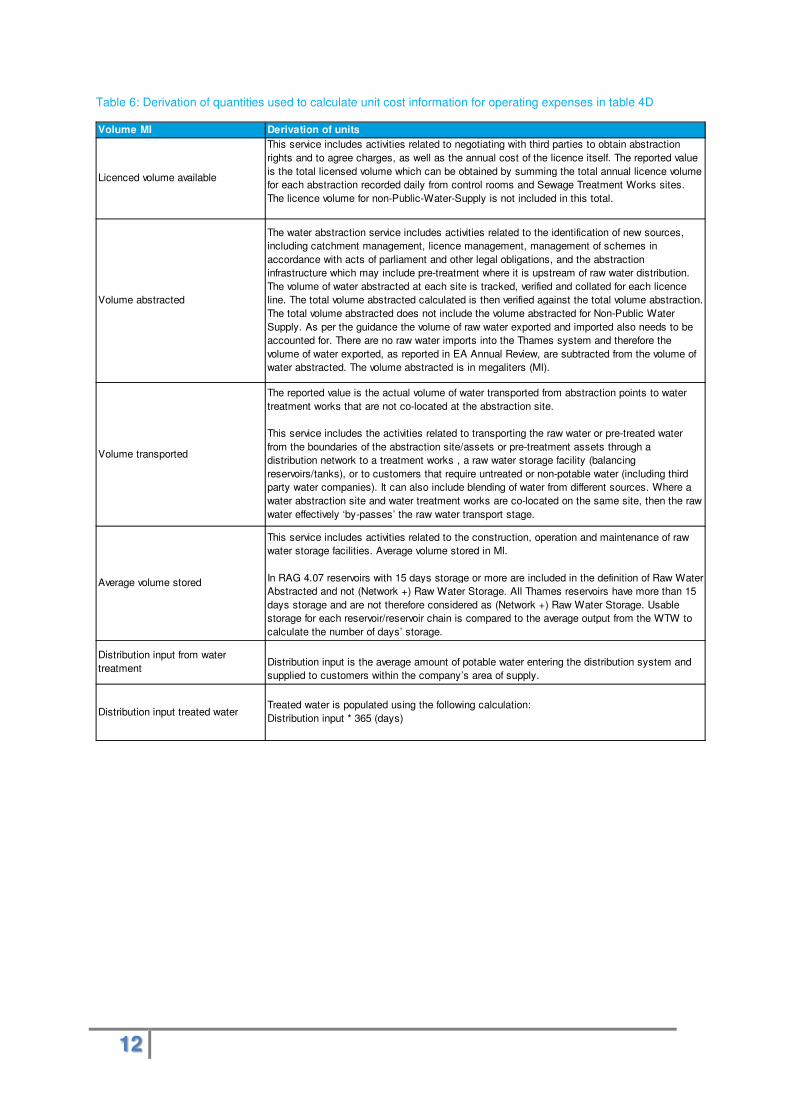
Derivation of quantities used in unit cost information 5.1.3In the tables below (6, 7, 8) the method for calculating the units used in the unit cost information are described for table 4D and 4E in the APR.
12
Table 6: Derivation of quantities used to calculate unit cost information for operating expenses in table 4D
Volume MI Derivation of units
Licenced volume available
This service includes activities related to negotiating with third parties to obtain abstraction
rights and to agree charges, as well as the annual cost of the licence itself. The reported value
is the total licensed volume which can be obtained by summing the total annual licence volume
for each abstraction recorded daily from control rooms and Sewage Treatment Works sites.
The licence volume for non-Public-Water-Supply is not included in this total.
Volume abstracted
The water abstraction service includes activities related to the identification of new sources,
including catchment management, licence management, management of schemes in
accordance with acts of parliament and other legal obligations, and the abstraction
infrastructure which may include pre-treatment where it is upstream of raw water distribution.
The volume of water abstracted at each site is tracked, verified and collated for each licence
line. The total volume abstracted calculated is then verified against the total volume abstraction.
The total volume abstracted does not include the volume abstracted for Non-Public Water
Supply. As per the guidance the volume of raw water exported and imported also needs to be
accounted for. There are no raw water imports into the Thames system and therefore the
volume of water exported, as reported in EA Annual Review, are subtracted from the volume of
water abstracted. The volume abstracted is in megaliters (Ml).
Volume transported
The reported value is the actual volume of water transported from abstraction points to water
treatment works that are not co-located at the abstraction site.
This service includes the activities related to transporting the raw water or pre-treated water
from the boundaries of the abstraction site/assets or pre-treatment assets through a
distribution network to a treatment works , a raw water storage facility (balancing
reservoirs/tanks), or to customers that require untreated or non-potable water (including third
party water companies). It can also include blending of water from different sources. Where a
water abstraction site and water treatment works are co-located on the same site, then the raw
water effectively ‘by-passes’ the raw water transport stage.
Average volume stored
This service includes activities related to the construction, operation and maintenance of raw
water storage facilities. Average volume stored in Ml.
In RAG 4.07 reservoirs with 15 days storage or more are included in the definition of Raw Water
Abstracted and not (Network +) Raw Water Storage. All Thames reservoirs have more than 15
days storage and are not therefore considered as (Network +) Raw Water Storage. Usable
storage for each reservoir/reservoir chain is compared to the average output from the WTW to
calculate the number of days’ storage.
Distribution input from water
treatmentDistribution input is the average amount of potable water entering the distribution system and
supplied to customers within the company’s area of supply.
Distribution input treated waterTreated water is populated using the following calculation:
Distribution input * 365 (days)
13
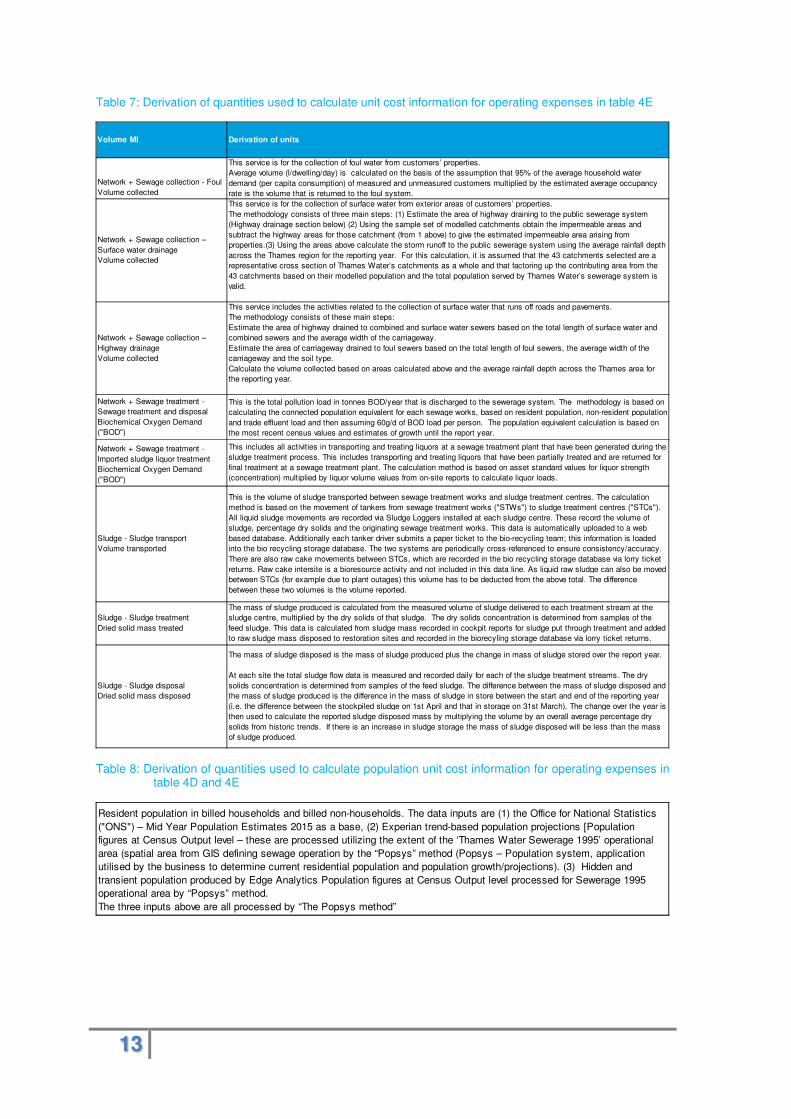
Table 7: Derivation of quantities used to calculate unit cost information for operating expenses in table 4E
Table 8: Derivation of quantities used to calculate population unit cost information for operating expenses in table 4D and 4E
Volume MI Derivation of units
Network + Sewage collection - Foul
Volume collected
This service is for the collection of foul water from customers’ properties.
Average volume (l/dwelling/day) is calculated on the basis of the assumption that 95% of the average household water
demand (per capita consumption) of measured and unmeasured customers multiplied by the estimated average occupancy
rate is the volume that is returned to the foul system.
Network + Sewage collection –
Surface water drainage
Volume collected
This service is for the collection of surface water from exterior areas of customers’ properties.
The methodology consists of three main steps: (1) Estimate the area of highway draining to the public sewerage system
(Highway drainage section below) (2) Using the sample set of modelled catchments obtain the impermeable areas and
subtract the highway areas for those catchment (from 1 above) to give the estimated impermeable area arising from
properties.(3) Using the areas above calculate the storm runoff to the public sewerage system using the average rainfall depth
across the Thames region for the reporting year. For this calculation, it is assumed that the 43 catchments selected are a
representative cross section of Thames Water’s catchments as a whole and that factoring up the contributing area from the
43 catchments based on their modelled population and the total population served by Thames Water’s sewerage system is
valid.
Network + Sewage collection –
Highway drainage
Volume collected
This service includes the activities related to the collection of surface water that runs off roads and pavements.
The methodology consists of these main steps:
Estimate the area of highway drained to combined and surface water sewers based on the total length of surface water and
combined sewers and the average width of the carriageway.
Estimate the area of carriageway drained to foul sewers based on the total length of foul sewers, the average width of the
carriageway and the soil type.
Calculate the volume collected based on areas calculated above and the average rainfall depth across the Thames area for
the reporting year.
Network + Sewage treatment -
Sewage treatment and disposal
Biochemical Oxygen Demand
("BOD")
This is the total pollution load in tonnes BOD/year that is discharged to the sewerage system. The methodology is based on
calculating the connected population equivalent for each sewage works, based on resident population, non-resident population
and trade effluent load and then assuming 60g/d of BOD load per person. The population equivalent calculation is based on
the most recent census values and estimates of growth until the report year.
Network + Sewage treatment -
Imported sludge liquor treatment
Biochemical Oxygen Demand
("BOD")
This includes all activities in transporting and treating liquors at a sewage treatment plant that have been generated during the
sludge treatment process. This includes transporting and treating liquors that have been partially treated and are returned for
final treatment at a sewage treatment plant. The calculation method is based on asset standard values for liquor strength
(concentration) multiplied by liquor volume values from on-site reports to calculate liquor loads.
Sludge - Sludge transport
Volume transported
This is the volume of sludge transported between sewage treatment works and sludge treatment centres. The calculation
method is based on the movement of tankers from sewage treatment works ("STWs") to sludge treatment centres ("STCs").
All liquid sludge movements are recorded via Sludge Loggers installed at each sludge centre. These record the volume of
sludge, percentage dry solids and the originating sewage treatment works. This data is automatically uploaded to a web
based database. Additionally each tanker driver submits a paper ticket to the bio-recycling team; this information is loaded
into the bio recycling storage database. The two systems are periodically cross-referenced to ensure consistency/accuracy.
There are also raw cake movements between STCs, which are recorded in the bio recycling storage database via lorry ticket
returns. Raw cake intersite is a bioresource activity and not included in this data line. As liquid raw sludge can also be moved
between STCs (for example due to plant outages) this volume has to be deducted from the above total. The difference
between these two volumes is the volume reported.
Sludge - Sludge treatment
Dried solid mass treated
The mass of sludge produced is calculated from the measured volume of sludge delivered to each treatment stream at the
sludge centre, multiplied by the dry solids of that sludge. The dry solids concentration is determined from samples of the
feed sludge. This data is calculated from sludge mass recorded in cockpit reports for sludge put through treatment and added
to raw sludge mass disposed to restoration sites and recorded in the biorecyling storage database via lorry ticket returns.
Sludge - Sludge disposal
Dried solid mass disposed
The mass of sludge disposed is the mass of sludge produced plus the change in mass of sludge stored over the report year.
At each site the total sludge flow data is measured and recorded daily for each of the sludge treatment streams. The dry
solids concentration is determined from samples of the feed sludge. The difference between the mass of sludge disposed and
the mass of sludge produced is the difference in the mass of sludge in store between the start and end of the reporting year
(i.e. the difference between the stockpiled sludge on 1st April and that in storage on 31st March). The change over the year is
then used to calculate the reported sludge disposed mass by multiplying the volume by an overall average percentage dry
solids from historic trends. If there is an increase in sludge storage the mass of sludge disposed will be less than the mass
of sludge produced.
Resident population in billed households and billed non-households. The data inputs are (1) the Office for National Statistics
("ONS") – Mid Year Population Estimates 2015 as a base, (2) Experian trend-based population projections [Population
figures at Census Output level – these are processed utilizing the extent of the ‘Thames Water Sewerage 1995’ operational
area (spatial area from GIS defining sewage operation by the “Popsys” method (Popsys – Population system, application
utilised by the business to determine current residential population and population growth/projections). (3) Hidden and
transient population produced by Edge Analytics Population figures at Census Output level processed for Sewerage 1995
operational area by “Popsys” method.
The three inputs above are all processed by “The Popsys method”
14
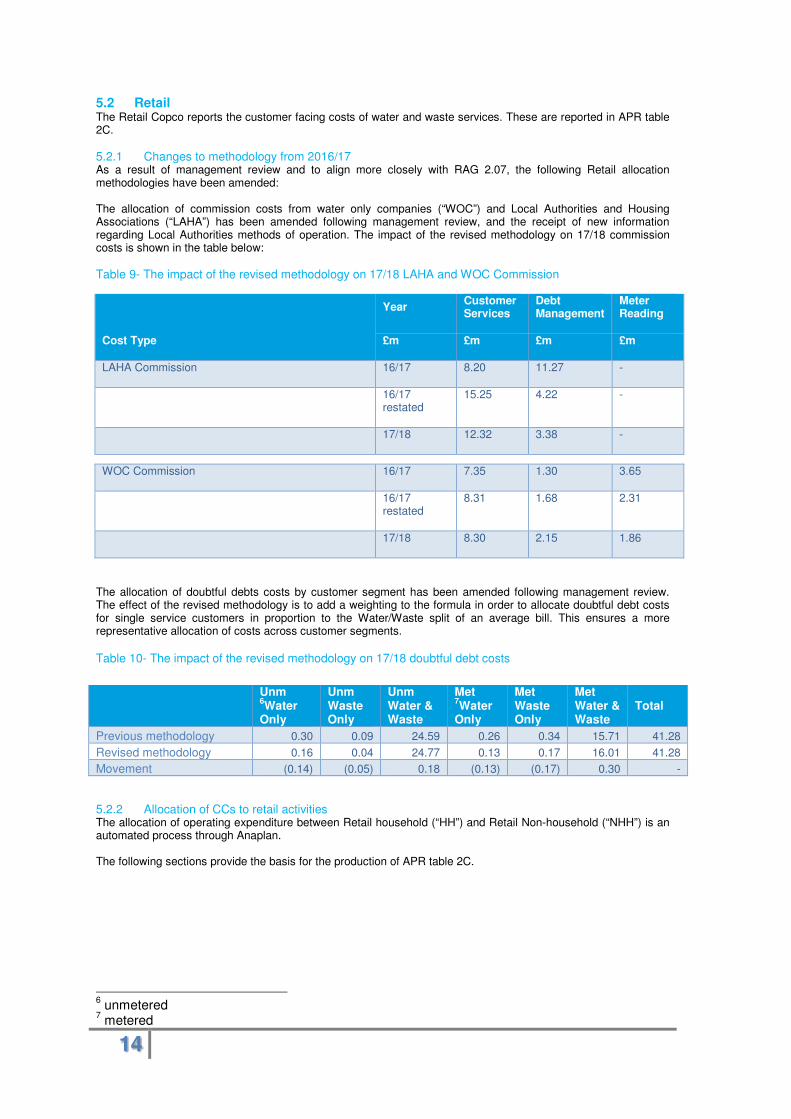
5.2 Retail The Retail Copco reports the customer facing costs of water and waste services. These are reported in APR table 2C.
Changes to methodology from 2016/17 5.2.1As a result of management review and to align more closely with RAG 2.07, the following Retail allocation methodologies have been amended:
The allocation of commission costs from water only companies (“WOC”) and Local Authorities and Housing Associations (“LAHA”) has been amended following management review, and the receipt of new information regarding Local Authorities methods of operation. The impact of the revised methodology on 17/18 commission costs is shown in the table below:
Table 9- The impact of the revised methodology on 17/18 LAHA and WOC Commission
Cost Type
Year Customer Services
Debt Management
Meter Reading
£m £m £m £m
LAHA Commission 16/17 8.20 11.27 -
16/17 restated
15.25 4.22 -
17/18 12.32 3.38 -
WOC Commission 16/17 7.35 1.30 3.65
16/17 restated
8.31 1.68 2.31
17/18 8.30 2.15 1.86
The allocation of doubtful debts costs by customer segment has been amended following management review. The effect of the revised methodology is to add a weighting to the formula in order to allocate doubtful debt costs for single service customers in proportion to the Water/Waste split of an average bill. This ensures a more representative allocation of costs across customer segments.
Table 10- The impact of the revised methodology on 17/18 doubtful debt costs
Allocation of CCs to retail activities 5.2.2The allocation of operating expenditure between Retail household (“HH”) and Retail Non-household (“NHH”) is an automated process through Anaplan. The following sections provide the basis for the production of APR table 2C.
6 unmetered
7 metered
Unm 6Water
Only
Unm Waste Only
Unm Water & Waste
Met 7Water
Only
Met Waste Only
Met Water & Waste
Total
Previous methodology 0.30 0.09 24.59 0.26 0.34 15.71 41.28
Revised methodology 0.16 0.04 24.77 0.13 0.17 16.01 41.28
Movement (0.14) (0.05) 0.18 (0.13) (0.17) 0.30 -

15
Table 11 - Retail activities by expense
The majority of costs reported within table 2C are directly attributable and reported within the Retail OpCo.
The ‘Recharged from Wholesale’ line in table 6 above shows those direct costs which are not managed by the Retail OpCo and are recharged from Wholesale OpCos following classification guidance in RAG 2.07
Billin
g
Paym
en
t, r
em
itta
nce a
nd
cash
han
dlin
g
Ch
ari
tab
le T
rust
do
nati
on
s
Vu
lnera
ble
cu
sto
mer
sch
em
es
No
n-n
etw
ork
cu
sto
mer
en
qu
irie
s &
co
mp
lain
ts
Netw
ork
cu
sto
mer
en
qu
irie
s
an
d c
om
pla
ints
Investi
gato
ry/f
irst
tim
e v
isit
s
to c
usto
mers
Oth
er
cu
sto
mer
serv
ices
Other (HR/Central
charges/Facilities)
General & Support - Specific to other
direct costs �
Meter reading Specific to meter reading �
WOC Bad Debt Specific to Doubtful Debts �
WOC Commissions
Allocation across activities covered by
WOCs pro-rata to their Retail Costs
submissions� � � � �
Bad Debt Provision & Excess
CreditsSpecific to Doubtful Debts �
RSC Continuous ImprovementAllocated using the same basis as RSC
staff cost centre � �
Customer Resolution - RSCAlloction based on volumes by type of
enquiries handled by each team � � � � �
Customer Insight
Specific to other direct costs (service
improvement, intelligence, monitoring,
marketing)�
Customer experience and
engagement
Specific to other direct costs (service
improvement, intelligence, monitoring,
marketing)�
Customer Journeys
Specific to other direct costs (service
improvement, intelligence, monitoring,
marketing)�
Brand TeamSpecific to other direct costs (monitoring,
marketing)�
Customer Marketing and
communications
Specific to other direct costs (monitoring,
marketing) �
Digital Communications Based on Managers assessment of FTE's � � � � �
Affordability Specific to Vulnerable Grps �
RegulationSpecific to other direct costs (General and
support cost)�
IT & Change -Transformation Specific to other direct costs (General and
support cost)�
Customer propositions Based on Managers assessment of FTE's �
Commercial
Weighted average based on cost centre
allocations the managers in this cost
centre are responsible for� � � � � � �
LAHA Transition Based on Managers assessment of FTE's � � �
Backlog and BPO process Based on Managers assessment of FTE's � �
On-Boarding Based on Managers assessment of FTE's � � �
Senior Management TeamBased on overall % allocation of all
activites in Retail� � � � � � � � � �
CFO contingency
Prior year bonus overaccrual reallocated to
cost centres they relate to and assigned
to activites in line with those cost centres.
Remaining value allocated to Other direct
costs
� � � � � � � � �
Weather related event General Ledger account driven � � �
Water Efficiency (Retail) Specific to Water Efficiency �
Developer Services Specific to Developer services �
Recharged from Wholesale Services To Developers �
Recharged from Wholesale Calls found not to be a network issue �
Recharged from Wholesale Disconnections & Reconnections �
Retail
activities by cost centreBasis of allocation
Deb
t m
an
ag
em
en
t
Do
ub
tfu
l d
eb
ts
Mete
r re
ad
ing
Dis
co
nn
ecti
on
s a
nd
reco
nn
ecti
on
s
Dem
an
d-s
ide w
ate
r eff
icie
ncy
init
iati
ves
Cu
sto
mer
sid
e leaks
Oth
er
dir
ect
co
sts
Customer services
Serv
ices t
o d
evelo
pers
16
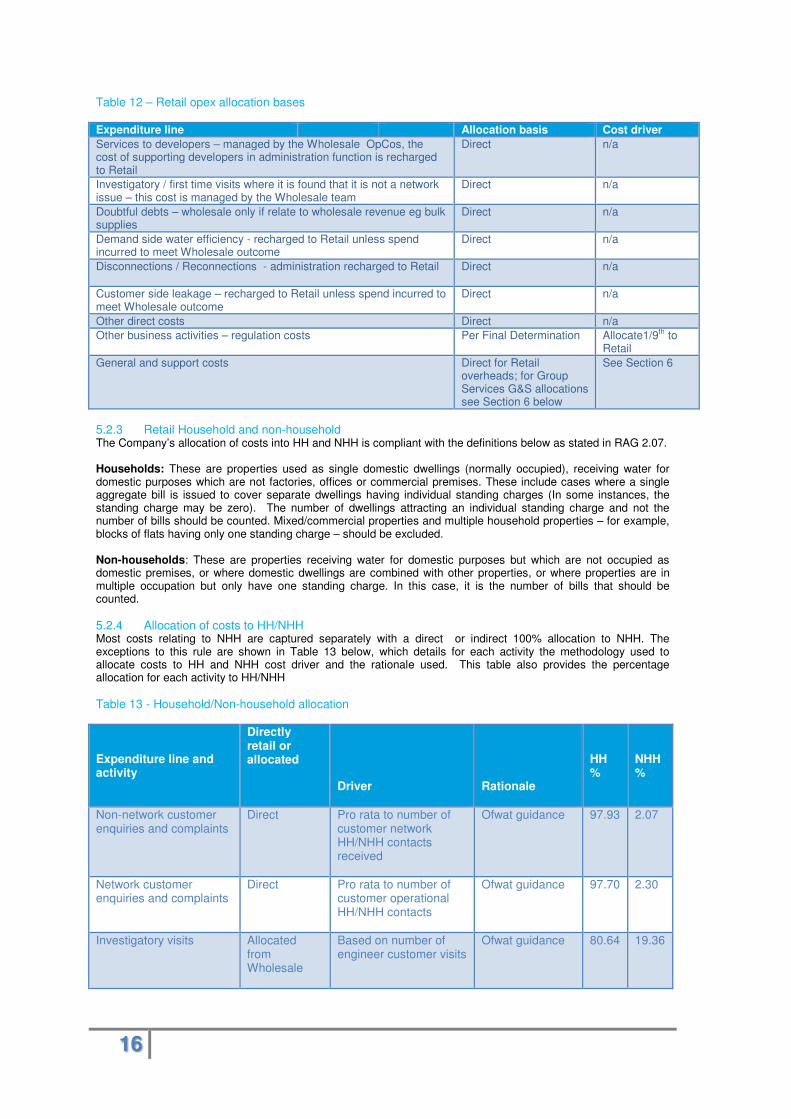
Table 12 – Retail opex allocation bases
Expenditure line Allocation basis Cost driver
Services to developers – managed by the Wholesale OpCos, the cost of supporting developers in administration function is recharged to Retail
Direct
n/a
Investigatory / first time visits where it is found that it is not a network issue – this cost is managed by the Wholesale team
Direct
n/a
Doubtful debts – wholesale only if relate to wholesale revenue eg bulk supplies
Direct
n/a
Demand side water efficiency - recharged to Retail unless spend incurred to meet Wholesale outcome
Direct
n/a
Disconnections / Reconnections - administration recharged to Retail Direct
n/a
Customer side leakage – recharged to Retail unless spend incurred to meet Wholesale outcome
Direct
n/a
Other direct costs Direct n/a
Other business activities – regulation costs Per Final Determination Allocate1/9th to Retail
General and support costs Direct for Retail overheads; for Group Services G&S allocations see Section 6 below
See Section 6
Retail Household and non-household 5.2.3The Company’s allocation of costs into HH and NHH is compliant with the definitions below as stated in RAG 2.07. Households: These are properties used as single domestic dwellings (normally occupied), receiving water for domestic purposes which are not factories, offices or commercial premises. These include cases where a single aggregate bill is issued to cover separate dwellings having individual standing charges (In some instances, the standing charge may be zero). The number of dwellings attracting an individual standing charge and not the number of bills should be counted. Mixed/commercial properties and multiple household properties – for example, blocks of flats having only one standing charge – should be excluded. Non-households: These are properties receiving water for domestic purposes but which are not occupied as domestic premises, or where domestic dwellings are combined with other properties, or where properties are in multiple occupation but only have one standing charge. In this case, it is the number of bills that should be counted.
Allocation of costs to HH/NHH 5.2.4Most costs relating to NHH are captured separately with a direct or indirect 100% allocation to NHH. The exceptions to this rule are shown in Table 13 below, which details for each activity the methodology used to allocate costs to HH and NHH cost driver and the rationale used. This table also provides the percentage allocation for each activity to HH/NHH
Table 13 - Household/Non-household allocation
Expenditure line and activity
Directly retail or allocated
Driver
Rationale
HH %
NHH %
Non-network customer enquiries and complaints
Direct Pro rata to number of customer network HH/NHH contacts received
Ofwat guidance 97.93 2.07
Network customer enquiries and complaints
Direct Pro rata to number of customer operational HH/NHH contacts
Ofwat guidance 97.70 2.30
Investigatory visits Allocated from Wholesale
Based on number of engineer customer visits
Ofwat guidance 80.64 19.36

17
Allocation of Household costs by customer type 5.2.5Following the production of APR table 2C, the Household costs are further manually allocated by customer type (APR table 4F) in proportion to average property numbers, which are reported in APR table 2F. An adjustment is made to exclude any costs that are specifically related to Water only Companies, when calculating the cost of water only customers. Similarly, an adjustment is made to exclude any costs that specifically do not relate to WOCs, when calculating the cost of waste only customers.
5.3 Billing and collection
Percentage of income 5.3.1The percentage of income that the Company outsourced for billing and collection is based on the revenue billed on behalf of the company by LAHA, who bear the risk of any non-collection of any outstanding debt. The billed value is taken from year-end LAHA Commissions Report. During the year ended 31 March 2018, LAHA billing percentage of turnover billed was 5.9%.
Bills to occupier policy 5.3.2The Company only raises bills in the name of the "occupier" when it has evidence that the property is occupied but cannot confirm the name of the occupier. When the occupant is identified the bill is cancelled and rebilled in the customer’s name. If the Company has not identified an occupant within 6 months the bill is cancelled and the property is classified as empty. The value of bills issued in the name of the occupier included in turnover is obtained from the ‘Occupier Billing report’ run by our Billing Analysts. No specific doubtful debt provision is made for bills issued in the name of the occupier at the year-end. A bad debt provision is applied to all outstanding debt, at the year-end a provision of 14.9% is applied to all debt less than one year old, which would include any debt in the name of the occupier.
Doubtful debt policy where the customer has vacated a property 5.3.3Where a customer has vacated a property leaving unpaid debt, this is handled within our debt management process, credit notes are not issued to cancel any such uncollectable debt, when uncollected it is written-off as bad debt.
Bad debt provision policy 5.3.4The bad debt provision is charged to operating costs to reflect the company’s assessment of the risk of non-recoverability of debtors. It is calculated by applying expected erosion rates to debts outstanding at the end of the accounting period. These collection rates take into account the age of the debt and type of debt. Higher provisioning percentages are applied to older categories of debt. Bad debt provisioning rates are updated annually to reflect the latest collection performance data from the company’s billing system. All debt greater than four years old is fully provided for. The bad debt provision also takes into account the recoverability of debts which will ultimately be cancelled and may or may not be rebilled, and of debts which have not yet been billed, but are part of the metered sales accrual. Future expected performance (taking into account historic trends) is also used to validate our bad debt provisions to ensure that use of historic performance will not result in a material misstatement. We also provide for debts from Water Only Companies, who bill for our sewage service on our behalf. Since detailed information about the debt is unavailable to us, we provide for the debt based on the historical write-offs.
Contact centre and outsourced costs 5.3.5Contact centre agents’ costs and outsourced costs are allocated to activities on the basis of the FTE requirement planning and the work packs and work streams issued to outsource partners. WOC commissions are allocated across activities in accordance with the previous year’s Retail submission. LAHA commissions are allocated across the activities they undertake, i.e. billing, payment handling, debt management and customer (non-network) queries based on the relevant weighting of those activities within the Retail operating expenses, factored for the relative costs for the LA/HAs based on management analysis and judgement.
Further assumptions 5.3.6The following assumptions have been applied consistently with the prior period. Demand side water efficiency initiatives within Retail refer to the Base Line Programme (“BSWE”) costs identified. Local authority rates are allocated to Retail based on office occupancy of the Retail OpCo for Walnut Court in Swindon, and Kemble Court in Reading where the Operations contact centre is based. These costs are shown within the Local authority rates caption in APR table 2C. Third party costs – there are no costs incurred within Retail that are classed as third party costs, therefore no costs have been reported within this line.
18
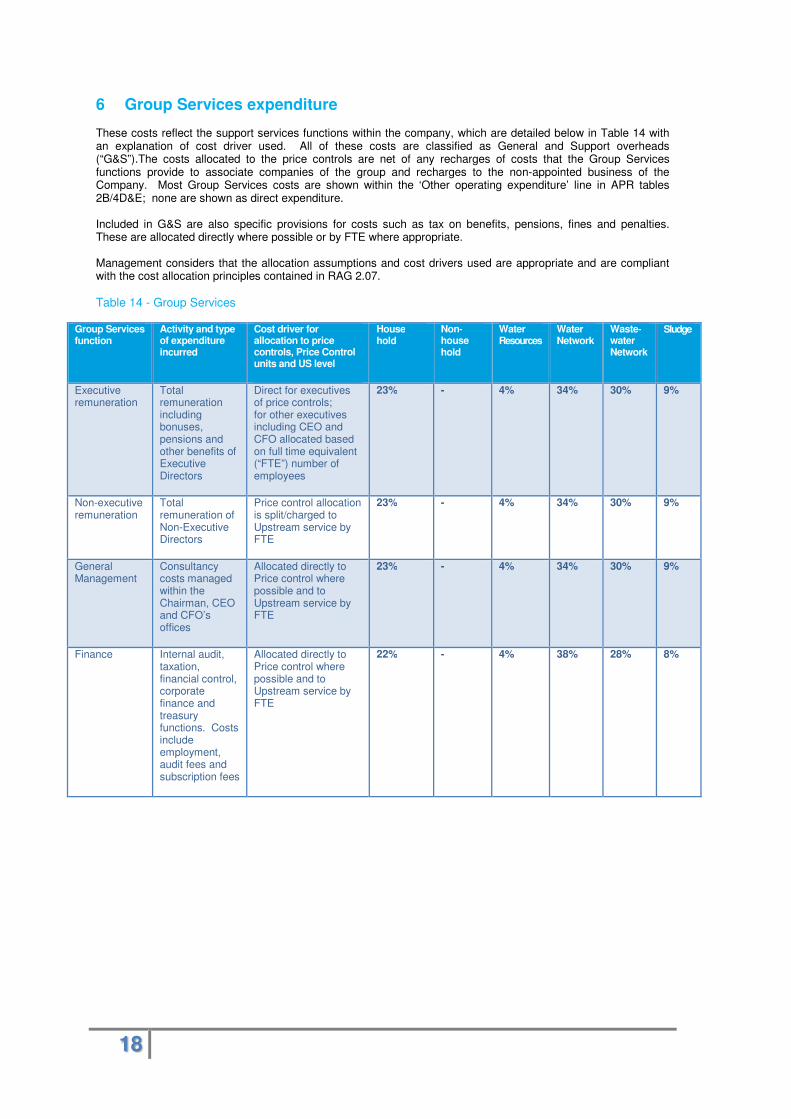
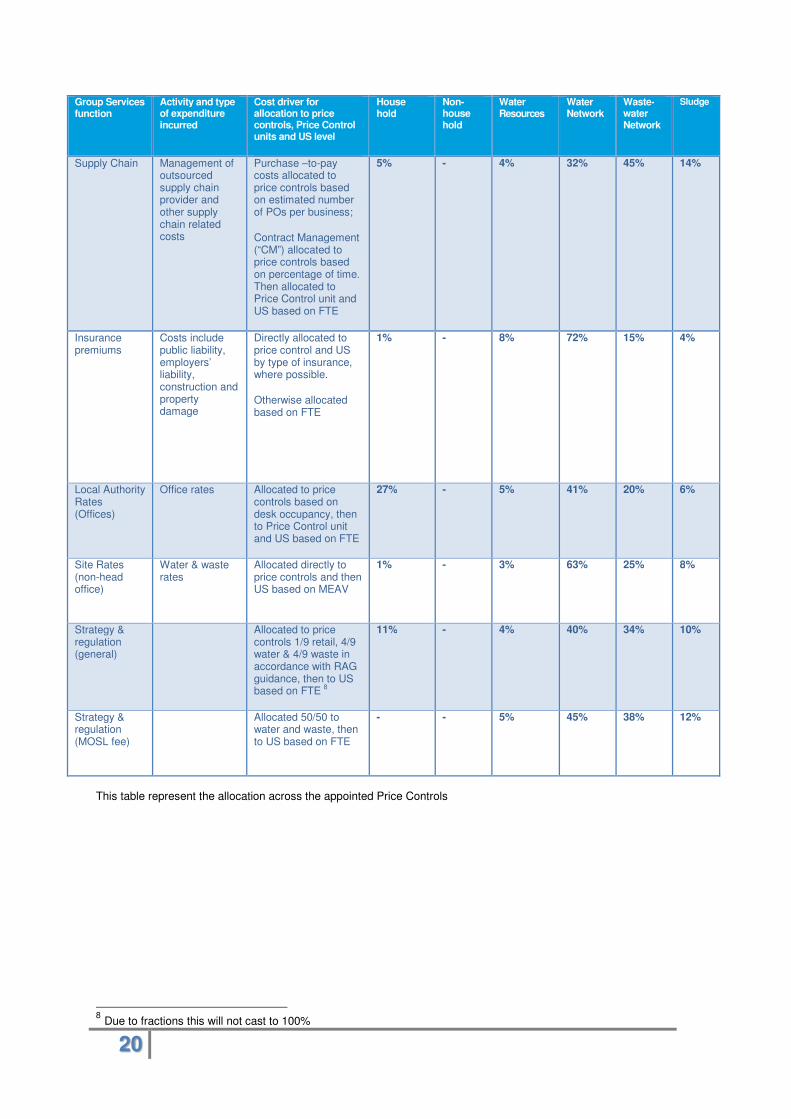
6 Group Services expenditure These costs reflect the support services functions within the company, which are detailed below in Table 14 with an explanation of cost driver used. All of these costs are classified as General and Support overheads (“G&S”).The costs allocated to the price controls are net of any recharges of costs that the Group Services functions provide to associate companies of the group and recharges to the non-appointed business of the Company. Most Group Services costs are shown within the ‘Other operating expenditure’ line in APR tables 2B/4D&E; none are shown as direct expenditure. Included in G&S are also specific provisions for costs such as tax on benefits, pensions, fines and penalties. These are allocated directly where possible or by FTE where appropriate. Management considers that the allocation assumptions and cost drivers used are appropriate and are compliant with the cost allocation principles contained in RAG 2.07.
Table 14 - Group Services
Group Services function
Activity and type of expenditure incurred
Cost driver for allocation to price controls, Price Control units and US level
House hold
Non-house hold
Water Resources
Water Network
Waste-water Network
Sludge
Executive remuneration
Total remuneration including bonuses, pensions and other benefits of Executive Directors
Direct for executives of price controls; for other executives including CEO and CFO allocated based on full time equivalent (“FTE”) number of employees
23% - 4% 34% 30% 9%
Non-executive remuneration
Total remuneration of Non-Executive Directors
Price control allocation is split/charged to Upstream service by FTE
23% - 4% 34% 30% 9%
General Management
Consultancy costs managed within the Chairman, CEO and CFO’s offices
Allocated directly to Price control where possible and to Upstream service by FTE
23% - 4% 34% 30% 9%
Finance Internal audit, taxation, financial control, corporate finance and treasury functions. Costs include employment, audit fees and subscription fees
Allocated directly to Price control where possible and to Upstream service by FTE
22% - 4% 38% 28% 8%

19
Group Services function
Activity and type of expenditure incurred
Cost driver for allocation to price controls, Price Control units and US level
House hold
Non-house hold
Water Resources
Water Network
Waste-water Network
Sludge
Legal & secretariat
Management of outsourced legal service provider, management of board and related committees
Directly allocated to price control, Price Control unit and US by case, where possible.
Otherwise allocated based on FTE
23% 1% 4% 33% 30% 9%
Human Resources
Employment costs, training costs and other HR business support costs
Allocated directly to Price control where possible and to Upstream service by FTE
23% - 4% 34% 30% 9%
IS Employment and telephony costs
All other costs including management of outsourced IT support costs
Allocated directly to Price control where possible and to Upstream service by FTE
20% - 4% 36% 30% 10%
External Affairs (excluding Customer Assistant Fund)
This activity includes corporate communications and corporate and social responsibility.
Allocated directly to Price control where possible and to Upstream service by FTE
23% - 4% 34% 30% 9%
Facilities and Maintenance
This function includes office supplies, security, facilities and building maintenance costs.
Allocated to price control based on building and desk usage then allocated to Price Control unit and US based on FTE
3% - 3% 28% 51% 15%
Health and safety
Cost of the advisors providing support to Company employees and contractors
Allocated directly to Price control where possible and to Upstream service by FTE
18% - 4% 34% 34% 10%
Fleet
Fleet management costs and fuel costs
Allocated to price control and cost centre in which the vehicle is used. Further allocated to Price Control unit and US based on % split of direct costs for those cost centres.
- - 5% 44% 37% 14%
20
Group Services function
Activity and type of expenditure incurred
Cost driver for allocation to price controls, Price Control units and US level
House hold
Non-house hold
Water Resources
Water Network
Waste-water Network
Sludge
Supply Chain Management of outsourced supply chain provider and other supply chain related costs
Purchase –to-pay costs allocated to price controls based on estimated number of POs per business;
Contract Management (“CM”) allocated to price controls based on percentage of time. Then allocated to Price Control unit and US based on FTE
5% - 4% 32% 45% 14%
Insurance premiums
Costs include public liability, employers’ liability, construction and property damage
Directly allocated to price control and US by type of insurance, where possible.
Otherwise allocated based on FTE
1% - 8% 72% 15% 4%
Local Authority Rates (Offices)
Office rates Allocated to price controls based on desk occupancy, then to Price Control unit and US based on FTE
27% - 5% 41% 20% 6%
Site Rates (non-head office)
Water & waste rates
Allocated directly to price controls and then US based on MEAV
1% - 3% 63% 25% 8%
Strategy & regulation (general)
Allocated to price controls 1/9 retail, 4/9 water & 4/9 waste in accordance with RAG guidance, then to US based on FTE
8
11% - 4% 40% 34% 10%
Strategy & regulation (MOSL fee)
Allocated 50/50 to water and waste, then to US based on FTE
- - 5% 45% 38% 12%
This table represent the allocation across the appointed Price Controls
8 Due to fractions this will not cast to 100%
21
7 Capex
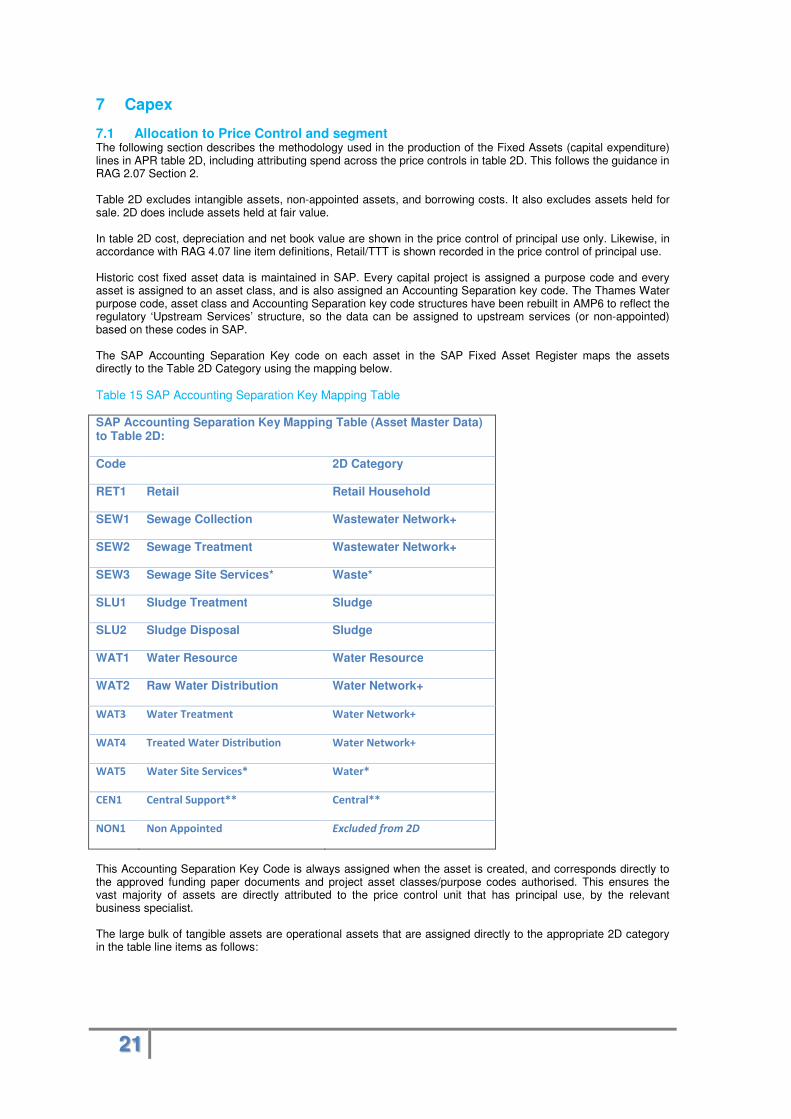
7.1 Allocation to Price Control and segment The following section describes the methodology used in the production of the Fixed Assets (capital expenditure) lines in APR table 2D, including attributing spend across the price controls in table 2D. This follows the guidance in RAG 2.07 Section 2. Table 2D excludes intangible assets, non-appointed assets, and borrowing costs. It also excludes assets held for sale. 2D does include assets held at fair value. In table 2D cost, depreciation and net book value are shown in the price control of principal use only. Likewise, in accordance with RAG 4.07 line item definitions, Retail/TTT is shown recorded in the price control of principal use. Historic cost fixed asset data is maintained in SAP. Every capital project is assigned a purpose code and every asset is assigned to an asset class, and is also assigned an Accounting Separation key code. The Thames Water purpose code, asset class and Accounting Separation key code structures have been rebuilt in AMP6 to reflect the regulatory ‘Upstream Services’ structure, so the data can be assigned to upstream services (or non-appointed) based on these codes in SAP. The SAP Accounting Separation Key code on each asset in the SAP Fixed Asset Register maps the assets directly to the Table 2D Category using the mapping below.
Table 15 SAP Accounting Separation Key Mapping Table
SAP Accounting Separation Key Mapping Table (Asset Master Data) to Table 2D:
Code 2D Category
RET1 Retail Retail Household
SEW1 Sewage Collection Wastewater Network+
SEW2 Sewage Treatment Wastewater Network+
SEW3 Sewage Site Services* Waste*
SLU1 Sludge Treatment Sludge
SLU2 Sludge Disposal Sludge
WAT1 Water Resource Water Resource
WAT2 Raw Water Distribution Water Network+
WAT3 Water Treatment Water Network+
WAT4 Treated Water Distribution Water Network+
WAT5 Water Site Services* Water*
CEN1 Central Support** Central**
NON1 Non Appointed Excluded from 2D
This Accounting Separation Key Code is always assigned when the asset is created, and corresponds directly to the approved funding paper documents and project asset classes/purpose codes authorised. This ensures the vast majority of assets are directly attributed to the price control unit that has principal use, by the relevant business specialist. The large bulk of tangible assets are operational assets that are assigned directly to the appropriate 2D category in the table line items as follows:

22
Table 16 2D Categories
*As shown in the earlier mapping table (coded “SEW3” and “WAT5”), there are a small minority of assets which are Water or Waste site assets (for example vehicles or generators, or site admin buildings) which are specific to the Waste or Water price control but are then allocated further between the 2D Categories proportionally. **Also shown in the mapping table, there are a remaining number of mainly “Management & General” assets which are coded as “CEN1” Central Support (e.g. computer hardware or fleet vehicles). Where the principal user still cannot be ascertained, and in the absence of further information, these are assigned to either the wholesale waste or wholesale water base in proportion to the asset base. Assets commissioned each year are reviewed individually to provide assurance that the appropriate Accounting Separation Code has been assigned to the asset. The review is carried out by the relevant price control asset specialists (for example Sludge assets are reviewed by the Bio-Resources Ops Asset Manager). Central assets are reviewed by the Capital and Investment team in order to assign them where possible to the most appropriate price control on a principal user basis. The whole asset base Accounting Separation data will be reviewed at key points in time, for example where there is a change in methodology, or where a change in table category definitions/ requirements occurs. This ensures the appropriate mapping is maintained. Table 2D balances also include the uplift in fair value as a result of adopting IFRS Accounting Standards in April 2015. These are split across the wholesale business (mainly Water Network+ assets) according to the specific instruction at that time.
Table 2D Line items: Table 2D Categories:
Wholesale Retail
AMP6 Price Controls
(price limits have been set for 2015-20)
Wholesale Water Wholesale Waste TTT Retail Household
Retail Non-Household
Table 2D Categories: Water Resource
Water Network+
Wastewater Network+
Sludge TTT Retail Household
Retail Non-Household
Year-end Closing Balances (Gross Cost & Accumulated. Depreciation)
Mapped asset by asset from the SAP Fixed Asset Register using Accounting Separation Key codes.
Mapped asset by asset from the SAP Fixed Asset Register using Accounting Separation Key codes.
Mapped asset by asset from the SAP Fixed Asset Register using Accounting Separation Key codes.
Mapped asset by asset from the SAP Fixed Asset Register using Accounting Separation Key codes.
Small volume of assets specifically identified by Project code and cost centres, separated out from other Waste assets.
Mapped asset by asset from the SAP Fixed Asset Register using Accounting Separation Key codes.
n/a
Additions, Disposals and Adoptions at Nil Cost (Fair Value)
As per Tables 4D & 4E methodology
(Asset Class & Purpose Code basis)
As per Tables 4D & 4E methodology
(Asset Class & Purpose Code basis)
As per Tables 4D & 4E methodology
(Asset Class & Purpose Code basis)
As per Tables 4D & 4E methodology
(Asset Class & Purpose Code basis)
As per Tables 4D & 4E methodology
(although TTT not included in 4D/4E)
As per Tables 4D & 4E methodology
(although Retail not included in 4D/4E)
n/a
Depreciation Charge in the Year
Mapped asset by asset from the SAP Fixed Asset Register using Accounting Separation Key codes.
Mapped asset by asset from the SAP Fixed Asset Register using Accounting Separation Key codes.
Mapped asset by asset from the SAP Fixed Asset Register using Accounting Separation Key codes.
Mapped asset by asset from the SAP Fixed Asset Register using Accounting Separation Key codes.
Small volume of assets specifically identified by Project code and cost centres, separated out from other Waste assets.
Mapped asset by asset from the SAP Fixed Asset Register using Accounting Separation Key codes.
n/a

23
A handful of assets included in the table have been acquired at nil cost. This includes assets adopted, (for example Self-Lay Sewers typically installed by property developers, or Private Sewer Pumping Stations which we are now responsible for). These are directly attributed to the relevant price controls. The Adjustments line shows the movements in the opening/closing balances not driven by standard additions, disposals, adoptions or depreciation activities. This would include any asset reclasses, revaluations, or accounting (e.g. IFRS) adjustments. Where assets are used by more than one price control, a recharge is made from the principal user to the other price controls to reflect the usage of the asset. The recharge is calculated as an allocation of the depreciation charge since this represents the charge for using the underlying assets. The cost driver and basis for the allocations follow the same basis as operating expenses allocations per Table 14 above. These recharges are reported in APR table 2A.
7.2 Allocation to Upstream Service (US) level The following documents the process adopted by the Company to comply with Ofwat’s guidance for allocation of capital expenditure across US units. The methodology detailed in this section covers the assumptions, adjustments and method of analysis applied to populate the capital expenditure sections of tables 4D and 4E. As the relevant sections of these two tables require the allocation of capital expenditure to US units, the primary driver for allocation is the asset class in use on the capital project. Our asset class structure has been rebuilt for AMP6 to reflect the US structure so the data can be assigned to US immediately from the Asset Class entered into SAP. The asset class also identifies whether the asset is infrastructure or non-infrastructure and is used to split the capex line items in tables 4D/4E. Assets are classed as “Base” or “Enhancement” in SAP. Base capex is reported in the “Maintaining the long term capability of assets” lines and enhancement capex is reported in the “Other capital expenditure” lines. A number of asset classes however do not map directly to the US units. An example of such an asset class would be ‘Treatment works plant & machinery – 20 year life’. Depending on the specific asset in question, this could sit within any one of the following US units: Water Treatment, Sewage Treatment & Disposal or Sludge Treatment. In these cases we assign an US unit based on the purpose code(s) allocated to the project. Our purpose codes for AMP6 have similarly been rebuilt to reflect the US structure, so the vast majority of the data left unallocated from the asset class review can be assigned through the purpose codes recorded on the capital projects. The data that then remains unallocated comprises largely management & general (“M&G”) assets. Examples include Fleet and IT assets as well as office buildings on non-operational sites. Assets produced from these projects are reviewed manually in order to assign them to the most appropriate US unit. In some cases such assets are used by multiple US units and so are deemed ‘shared use assets’.
7.3 Allocation of shared use assets As mentioned above, a number of these M&G assets are used by more than one US unit and indeed in a number of cases are used for the activities of more than one price control unit. In accordance with RAG 4.07, such assets have been wholly allocated in tables 4D and 4E to the price control of primary use, which in almost all cases for the Company is the wholesale wastewater price control (based on the total cost incurred by the OpCo). Once allocated to the price control unit of primary use, these assets are allocated across the US units according to a suitable driver. In most cases the driver used is headcount of the directly attributable employees within each of the US units, as the M&G activities are supporting the rest of the business as carried out by the staff within each operational business unit. In some cases a more bespoke allocation is possible, e.g. our main laboratory building is primarily carrying out sample testing of effluent from the sewage treatment process, and hence asset expenditure is allocated wholly to the ‘Sewage Treatment & Disposal’ US.
7.4 Data adjustments A number of adjustments are made to the raw data as extracted from the SAP system to ensure correct allocations are made to the US units as well as to the categories of infrastructure and non-infrastructure assets and between capital maintenance and enhancement expenditure. These adjustments were made to comply with Ofwat’s guidance on allocation. The key adjustments are explained below:
• Sludge centres adjustment: a manual review of all capital expenditure allocated to sludge-related US units is undertaken to ensure that only assets at our dedicated sludge centres (or assets involved in transporting sludge to our dedicated sludge centres) are allocated to these categories. Similarly, a review of allocations within the sludge-related US units is carried out to ensure correct assignment, for example, between sludge treatment and sludge disposal.
• Sludge transport and disposal: the sludge transport and sludge disposal US units have a very small list of assets that should be allocated to them so this adjustment is moving Capex to sludge treatment where spend has been miscoded to disposal or transport

24
• Infrastructure at treatment works sites: a manual review is undertaken to ensure no infrastructure assets are coded to the Water Treatment or Sewage Treatment & Disposal US units as any underground pipework within treatment work sites should be classed as a civil structure.
• Shared use assets: an adjustment is made I line with method discussed in section 7.1 above. Following completion of the manual data checks, a bulk adjustment is made to include unallocated capital overheads (“OHAP”) that cannot be allocated through the steps mentioned above. As in previous years this is allocated proportionately across the relevant US.
7.5 Historic assets allocation: In light of Ofwat’s introduction of new competitive markets for water resources and bioresources in AMP7, new requirements were introduced in 2016/17 to split the water and waste price controls in Table 2D (historical cost analysis of tangible fixed assets) between water resources and water network+, and sludge and waste network+, respectively. In the first reporting of this in 2016/17 with the requirement to analyse data in a different way, it was necessary for this allocation to be carried out using a manual process based on the then available level of data granularity. During the course of this year, we have improved our system capabilities and this has allowed us to undertake a more detailed analysis of the data. This exercise identified the need to restate the opening netbook value positions for the new price controls.
7.6 Allocation to infrastructure network reinforcement For water projects infrastructure network reinforcement spend can be identified from the purpose codes in the SAP BI data. For waste, growth and developer related projects have been manually assessed to estimate the percentage of spend on network reinforcement.
7.7 Population of tables 4D and 4E Now that the data set has been fully allocated to US units it can be mapped into the capital expenditure sections of tables 4D and 4E by way of specific data columns. These data columns distinguish between the following criteria in order to populate tables 4D and 4E:
• infrastructure and non-infrastructure;
• capital maintenance and enhancement expenditure;
• Infrastructure network reinforcement; and
• US units. The additional lines for third party services relates to capital expenditure that enable the fulfilment of bulk supplies and other services to other monopoly suppliers and inset appointees. The infrastructure network reinforcement relates to capital expenditure for the provision of new infrastructure network assets or enhanced capacity in existing infrastructure network assets (such as water mains, tanks, service reservoirs, sewers and pumping stations), in consequence of new connections and/or new developments.
7.8 Reconciliation Once all of the data has been reviewed and the necessary adjustments made, a final reconciliation is carried out to ensure no capital expenditure has been omitted or included when it should not have been. Tables 4D and 4E are reconciled to management accounts (HFM) and to statutory financial statements (i.e. PP&E note). There are a number of capital expenditure categories that are removed during the allocation process that form reconciling items between our initial data set from SAP and tables 4D and 4E. These are listed below:
• Thames Tideway Tunnel capital expenditure – this is excluded from table 4E as it is included as a separate column of data in table 2B;
• Non-regulatory capital expenditure;
• Retail capital expenditure; and
• Developer Services fair value adjustments on grossed-up schemes - These assets are being built by the Developers which Thames will adopt at nil cost upon completion. Under IFRS, we need to value these assets in our Balance Sheet although no real spend to Thames. This requires an adjustment to recognise the assets in our Balance Sheet at fair value and the related income. However, the fair value is posted to the projects/SAP as normal ‘Value of Work Done’ (“VoWD”) journal rather than a manual GL journal. Hence, this is being removed from the Gross capex

25
8 Year on year comparison of operating expenditure
8.1 Wholesale water
Table 17- Wholesale Water Opex and Units
Key: lower year on year costs are shown as negative values. Commentary Water Treatment, Treated Water Distribution and Raw water transport 1The increase in the unit cost for Treated Water distribution, Water treatment and Raw water transport is driven by the increase in year on year spend of £64.1m, £10.4m and £1.2m respectively as explained in table 18 below. Table 18 below explains year on year movements in operating expenses by Upstream Service level:
Abstraction
Licence
Raw water
abstraction
Raw
water
transport
Raw water
storage
Water
treatment
Treated Water
Distribution
Total Operating Expenses 2017/18 £m 470.6 14.0 48.2 8.3 - 77.6 322.5
Total Operating Expenses 2016/17 £m 392.9 13.8 46.4 7.1 - 67.2 258.4
Variance £m 77.7 0.2 1.8 1.2 - 10.4 64.1
Variance % 17% 2% 4% 15% - 10% 20%
Unit
Licenced
volume available
Volume
abstracted
Volume
transported
Average
volume
stored
Distribution
input volume
Distribution
input volume
17/18 Volume (MI) 1,546,857.1 1,066,331.0 88,575.7 - 988,299.2 978,520.5
17/18 Unit Cost (£/MI) 9.0 45.2 93.7 - 78.6 329.5
16/17 Volume (MI) 1,553,664.0 1,038,999.8 85,348.6 - 977,125.4 964,093.4
16/17 Unit Cost (£/MI) 8.9 44.7 83.2 - 68.8 268.0
VarianceVolume (MI) (6,806.9) 27,331.2 3,227.1 - 11,173.8 14,427.1
Variance Unit Cost (£/MI) 1 0.1 0.5 10.5 - 9.8 61.5
Water Resources Network PlusWater
Service
Total

26
Table 18- Wholesale Water Opex year on year movements in operating expenses by Upstream Service level
Abstraction
Licence
£m
Raw water
abstraction
£m
Raw water
transport
£m
Raw water
storage
£m
Water treatment
£m
Treated Water
Distribution
£m
Total Operating Expenses 2016/17 392.9 13.8 46.4 7.1 - 67.2 258.4
Increase in PR19 costs 2.0 0.2 0.2 - - 0.1 1.5
Higher consultancy spend due to Trunk mains Strategic Review 1.9 - - - - - 1.9
Leakage delivery - volume/mix related increases: Leak Detection,
Do-job, Customer Side Leakage, Streetw orks, Planning &
Scheduling 4.5 - - - - - 4.5
Increased Headcount in Netw ork Infrastructure & Leakage Team
additional costs for DMAE, Seepage, JD7 camera 2.7 - - - - - 2.7
Reclass (section 4): Change in methodology to reclass CSL to
operations 3.8 - - - - - 3.8
Higher spend on mains cut outs, replacement of boundary boxes
and replacement of outside stop valves 4.5 - - - - - 4.5
Reclass (section 4) to Third Party due to incorrectly categorised in
prior year: cost recovery, f ire brigade, building w ater, modelling
from developers due to consultancy 3.3 - 0.2 - - - 3.1
Higher Pow er costs driven by increased prices (£2.9m); Higher
production volumes (£0.6m); Dry w eather event impacting
efficiency of production through running of more expensive sites
(£1.2m) 4.9 - 1.4 - - 1.6 1.9
Higher Employee costs driven by increased headcount/pay rise;
Defined pension cost contribution increase (£0.4m) 5.5 - 0.9 - - 1.9 2.7
Higher bottled w ater & tankering alternative w ater event spend
driven by volume of large events w ithin year (Freeze/Thaw ,
Summer Supply/Demand events) 1.3 - - - - - 1.3
Increased Production maintenance and site materials spend 0.9 - 0.2 - - 0.5 0.2
Increased volume associated w ith Essex & Suffolk bulk supply
import trade 0.4 - 0.4 - - - -
Increase in Capital Maintenance and Pipe Bridge Inspect & Repairs 2.1 (0.3) 0.5 (0.2) - 0.3 1.8
Reduction in CRC emissions due to grid import electricity being
generated via greater renew able resources than previous year (1.1) - (0.3) - - (0.2) (0.6)
Higher Spend to support the leakage recovery programme, largely
spent on District Meter Area Reduction (DMAR) loggers and
leakage recovery programme management costs. 2.8 - - - - - 2.8
During 2017/18 there w as a revaluation by the Valuation Office
resulting in a c.£20m increase in the rateable value for w ater
properties. 21.2 - 0.7 2.3 - (2.9) 21.1
Increased consultancy costs in the year at a group level. 5.2 0.2 0.6 0.1 - 0.8 3.5
Increase in pension cost due to increase in the cost of the def ined
benefit pension scheme. 0.6 - - (0.2) - 0.7 0.1
Write off of fair value adjustment to f ixed assets made in the
current year. 6.3 - 0.2 0.1 - 1.4 4.6
Digital/Marketing (£0.2m), Customer immersion (£0.9m), Water
efficiency (£0.8m), Weather event (£0.2m), incident management
(£0.9m) and on boarding (£0.3m) 3.5 - - - - 0.6 2.9
Other (<10%, hence not material) 1.4 0.1 (3.2) (0.9) - 5.6 (0.2)
Total Operating Expenses 2017/18 470.6 14.0 48.2 8.3 - 77.6 322.5
Water
Service
Total
£m
Water Resources Network Plus

27
8.2 Wholesale wastewater
Table 19- Wholesale Wastewater Opex and Units
Key: lower year on year costs are shown as negative values. Commentary Sludge Transport Volume transported in the sludge transport upstream service has increased from the previous year by 448,384 m2
as we have closed a number of lime treatment plants during the period and this has now been intersited to digestion treatment sites; in addition we have hauled a larger volume of sludge between sites rather than sending to restoration. The increase in volume transported with a small decrease in cost of £2.1m has caused the unit cost to decrease (£5.0) as a result. Sludge Disposal The decrease in the unit cost for Sludge disposal is driven by the decrease in year on year spend of £5.8m as explained in table 20 below. Foul, Surface water drainage and Highway drainage The increase in unit cost for Foul, Surface water drainage and Sewage treatment & disposal is driven by the increase in year on year spend of £7.6m, £3m and £3.8m respectively as explained in table 20 below. Table 20 below explains year on year movements in operating expenses by Upstream Service level:
Foul
Surface
water
drainage
Highway
drainage
Sewage
treatment &
disposal
Liquor
treatment
Sludge
transport
Sludge
treatment
Sludge
disposal
Total Operating Expenses 2017/18 £m 430.2 113.7 33.2 17.3 199.0 0.8 11.1 35.8 19.3
Total Operating Expenses 2016/17 £m 423.9 106.1 30.1 16.6 195.4 0.7 12.1 38.1 24.8
Variance £m 6.3 7.6 3.1 0.7 3.6 0.1 (1.0) (2.3) (5.5)
Variance % 1.5% 6.7% 9.2% 4.0% 1.9% 4.8% (9.9%) (6.0%) (29.1%)
Unit Description
Volume
collected
Volume
collected
Volume
collected
Biochemical
Oxygen
Demand
(BOD)
Biochemical
Oxygen Demand
(BOD)
Volume
transported
Dried solid
mass
treated
Dried solid
mass
disposed
Unit measure MI MI MI Tonnes Tonnes m³ ttds ttds
17/18 Volume (MI) 702,657.7 325,096.8 179,347.8 354,102.6 8,391.8 1,384,487.2 366.2 365.2
17/18 Unit Cost (£/MI) 161.8 102.1 96.5 562.4 91.3 8.0 97,853.8 52,715.1
16/17 Volume (MI) 736,961.6 309,888.0 170,958.0 350,608.6 8,384.7 936,103.3 382.6 387.7
16/17 Unit Cost (£/MI) 143.9 97.3 97.2 557.2 86.9 13.0 99,256.6 64,120.4
VarianceVolume (MI) (34,304.0) 15,208.8 8,389.8 3,493.9 7.1 448,384.0 (16.3) (22.5)
Variance Unit Cost (£/MI) 17.9 4.8 (0.7) 5.2 4.4 (5.0) (1,402.8) (11,405.3)
SludgeNetwork + Sewage
TreatmentNetwork + Sewage collection
Waste
Service
Total
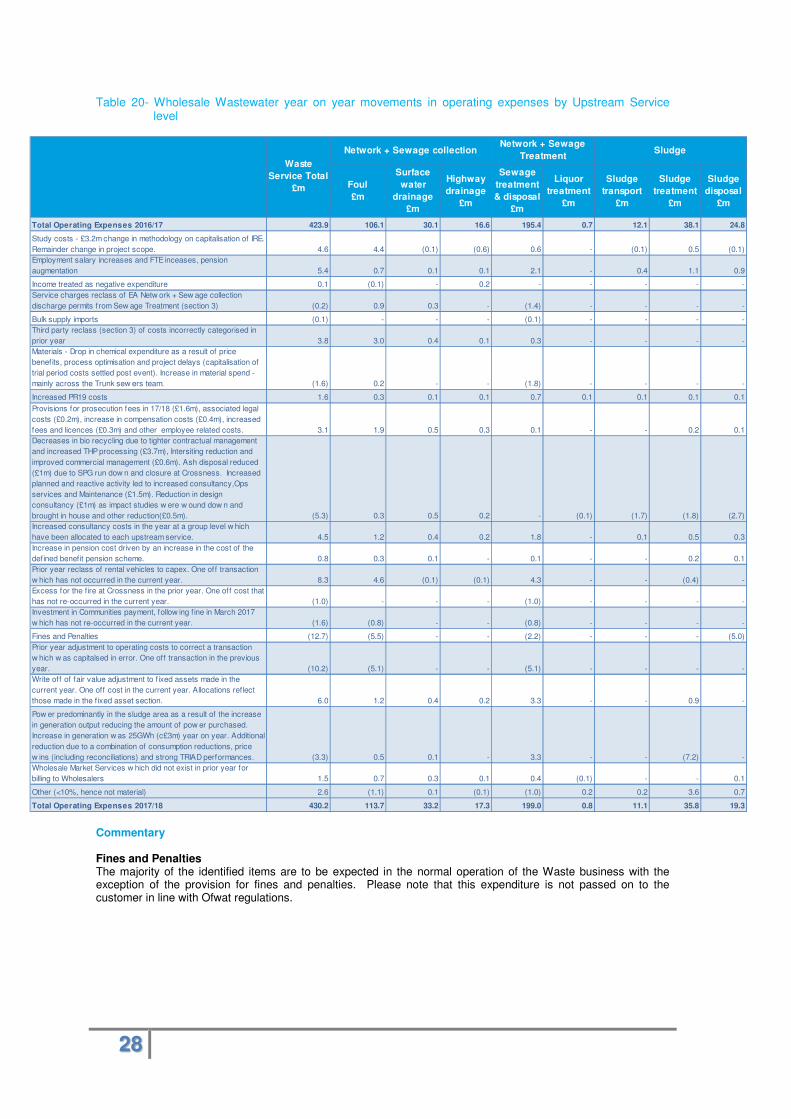
28
Table 20- Wholesale Wastewater year on year movements in operating expenses by Upstream Service level
Commentary Fines and Penalties The majority of the identified items are to be expected in the normal operation of the Waste business with the exception of the provision for fines and penalties. Please note that this expenditure is not passed on to the customer in line with Ofwat regulations.
Foul
£m
Surface
water
drainage
£m
Highway
drainage
£m
Sewage
treatment
& disposal
£m
Liquor
treatment
£m
Sludge
transport
£m
Sludge
treatment
£m
Sludge
disposal
£m
Total Operating Expenses 2016/17 423.9 106.1 30.1 16.6 195.4 0.7 12.1 38.1 24.8
Study costs - £3.2m change in methodology on capitalisation of IRE.
Remainder change in project scope. 4.6 4.4 (0.1) (0.6) 0.6 - (0.1) 0.5 (0.1)
Employment salary increases and FTE inceases, pension
augmentation 5.4 0.7 0.1 0.1 2.1 - 0.4 1.1 0.9
Income treated as negative expenditure 0.1 (0.1) - 0.2 - - - - -
Service charges reclass of EA Netw ork + Sew age collection
discharge permits from Sew age Treatment (section 3) (0.2) 0.9 0.3 - (1.4) - - - -
Bulk supply imports (0.1) - - - (0.1) - - - -
Third party reclass (section 3) of costs incorrectly categorised in
prior year 3.8 3.0 0.4 0.1 0.3 - - - -
Materials - Drop in chemical expenditure as a result of price
benefits, process optimisation and project delays (capitalisation of
trial period costs settled post event). Increase in material spend -
mainly across the Trunk sew ers team. (1.6) 0.2 - - (1.8) - - - -
Increased PR19 costs 1.6 0.3 0.1 0.1 0.7 0.1 0.1 0.1 0.1
Provisions for prosecution fees in 17/18 (£1.6m), associated legal
costs (£0.2m), increase in compensation costs (£0.4m), increased
fees and licences (£0.3m) and other employee related costs. 3.1 1.9 0.5 0.3 0.1 - - 0.2 0.1
Decreases in bio recycling due to tighter contractual management
and increased THP processing (£3.7m), Intersiting reduction and
improved commercial management (£0.6m). Ash disposal reduced
(£1m) due to SPG run dow n and closure at Crossness. Increased
planned and reactive activity led to increased consultancy,Ops
services and Maintenance (£1.5m). Reduction in design
consultancy (£1m) as impact studies w ere w ound dow n and
brought in house and other reduction(£0.5m). (5.3) 0.3 0.5 0.2 - (0.1) (1.7) (1.8) (2.7)
Increased consultancy costs in the year at a group level w hich
have been allocated to each upstream service. 4.5 1.2 0.4 0.2 1.8 - 0.1 0.5 0.3
Increase in pension cost driven by an increase in the cost of the
defined benefit pension scheme. 0.8 0.3 0.1 - 0.1 - - 0.2 0.1
Prior year reclass of rental vehicles to capex. One off transaction
w hich has not occurred in the current year. 8.3 4.6 (0.1) (0.1) 4.3 - - (0.4) -
Excess for the f ire at Crossness in the prior year. One off cost that
has not re-occurred in the current year. (1.0) - - - (1.0) - - - -
Investment in Communities payment, follow ing f ine in March 2017
w hich has not re-occurred in the current year. (1.6) (0.8) - - (0.8) - - - -
Fines and Penalties (12.7) (5.5) - - (2.2) - - - (5.0)
Prior year adjustment to operating costs to correct a transaction
w hich w as capitalsed in error. One off transaction in the previous
year. (10.2) (5.1) - - (5.1) - - - -
Write off of fair value adjustment to f ixed assets made in the
current year. One off cost in the current year. Allocations reflect
those made in the f ixed asset section. 6.0 1.2 0.4 0.2 3.3 - - 0.9 -
Pow er predominantly in the sludge area as a result of the increase
in generation output reducing the amount of pow er purchased.
Increase in generation w as 25GWh (c£3m) year on year. Additional
reduction due to a combination of consumption reductions, price
w ins (including reconciliations) and strong TRIAD performances. (3.3) 0.5 0.1 - 3.3 - - (7.2) -
Wholesale Market Services w hich did not exist in prior year for
billing to Wholesalers 1.5 0.7 0.3 0.1 0.4 (0.1) - - 0.1
Other (<10%, hence not material) 2.6 (1.1) 0.1 (0.1) (1.0) 0.2 0.2 3.6 0.7
Total Operating Expenses 2017/18 430.2 113.7 33.2 17.3 199.0 0.8 11.1 35.8 19.3
Waste
Service Total
£m
Network + Sewage collectionNetwork + Sewage
TreatmentSludge
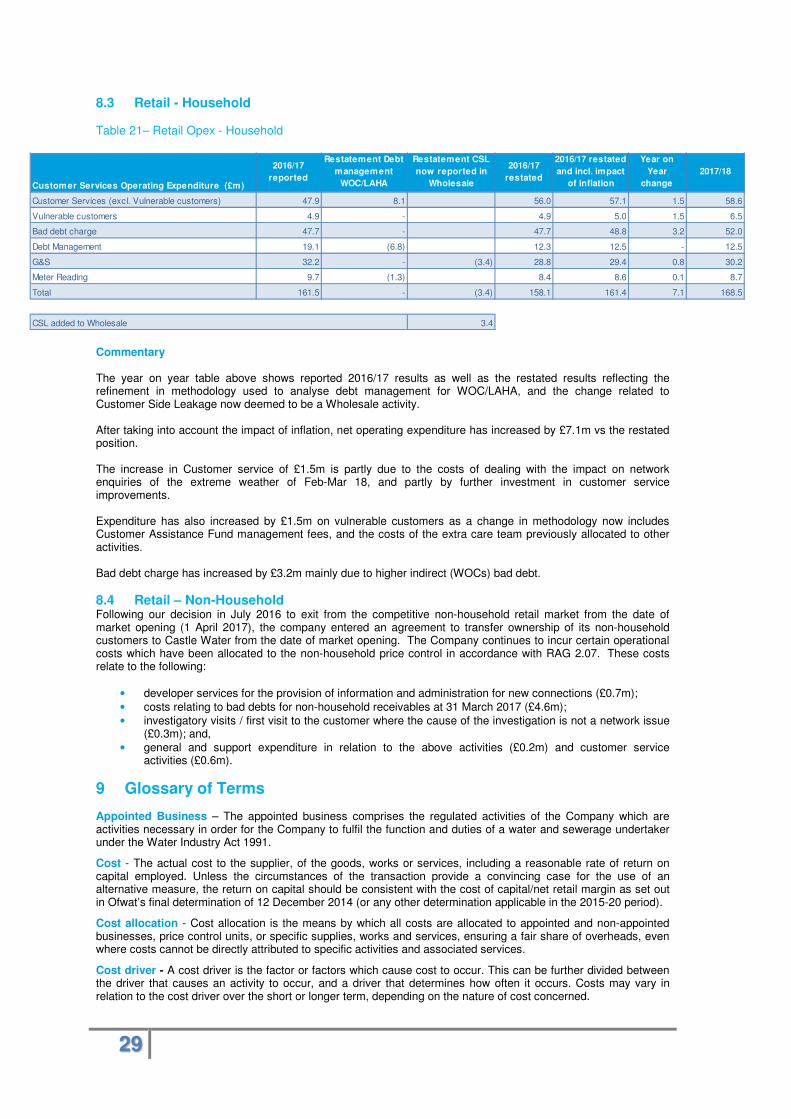
29
8.3 Retail - Household
Table 21– Retail Opex - Household
Commentary The year on year table above shows reported 2016/17 results as well as the restated results reflecting the refinement in methodology used to analyse debt management for WOC/LAHA, and the change related to Customer Side Leakage now deemed to be a Wholesale activity. After taking into account the impact of inflation, net operating expenditure has increased by £7.1m vs the restated position. The increase in Customer service of £1.5m is partly due to the costs of dealing with the impact on network enquiries of the extreme weather of Feb-Mar 18, and partly by further investment in customer service improvements. Expenditure has also increased by £1.5m on vulnerable customers as a change in methodology now includes Customer Assistance Fund management fees, and the costs of the extra care team previously allocated to other activities. Bad debt charge has increased by £3.2m mainly due to higher indirect (WOCs) bad debt.
8.4 Retail – Non-Household Following our decision in July 2016 to exit from the competitive non-household retail market from the date of market opening (1 April 2017), the company entered an agreement to transfer ownership of its non-household customers to Castle Water from the date of market opening. The Company continues to incur certain operational costs which have been allocated to the non-household price control in accordance with RAG 2.07. These costs relate to the following:
• developer services for the provision of information and administration for new connections (£0.7m);
• costs relating to bad debts for non-household receivables at 31 March 2017 (£4.6m);
• investigatory visits / first visit to the customer where the cause of the investigation is not a network issue (£0.3m); and,
• general and support expenditure in relation to the above activities (£0.2m) and customer service activities (£0.6m).
9 Glossary of Terms
Appointed Business – The appointed business comprises the regulated activities of the Company which are activities necessary in order for the Company to fulfil the function and duties of a water and sewerage undertaker under the Water Industry Act 1991.
Cost - The actual cost to the supplier, of the goods, works or services, including a reasonable rate of return on capital employed. Unless the circumstances of the transaction provide a convincing case for the use of an alternative measure, the return on capital should be consistent with the cost of capital/net retail margin as set out in Ofwat’s final determination of 12 December 2014 (or any other determination applicable in the 2015-20 period).
Cost allocation - Cost allocation is the means by which all costs are allocated to appointed and non-appointed businesses, price control units, or specific supplies, works and services, ensuring a fair share of overheads, even where costs cannot be directly attributed to specific activities and associated services.
Cost driver - A cost driver is the factor or factors which cause cost to occur. This can be further divided between the driver that causes an activity to occur, and a driver that determines how often it occurs. Costs may vary in relation to the cost driver over the short or longer term, depending on the nature of cost concerned.
Customer Services (excl. Vulnerable customers) 47.9 8.1 56.0 57.1 1.5 58.6
Vulnerable customers 4.9 - 4.9 5.0 1.5 6.5
Bad debt charge 47.7 - 47.7 48.8 3.2 52.0
Debt Management 19.1 (6.8) 12.3 12.5 - 12.5
G&S 32.2 - (3.4) 28.8 29.4 0.8 30.2
Meter Reading 9.7 (1.3) 8.4 8.6 0.1 8.7
Total 161.5 - (3.4) 158.1 161.4 7.1 168.5
CSL added to Wholesale 3.4
Customer Services Operating Expenditure (£m)
2016/17
reported
Restatement Debt
management
WOC/LAHA
Restatement CSL
now reported in
Wholesale
2016/17
restated
2016/17 restated
and incl. impact
of inflation
Year on
Year
change
2017/18
30
Customer side leakage (“CSL”) – leakage from customer side pipes.
FTEs - For the purposes of cost allocation, FTEs (or “full-time equivalents”) should include all full-time staff, and contractors/temporary staff directly employed. Where there is an existing contractual arrangement in place with an associate or third party for example a third party billing arrangement, FTEs will include all full-time staff, and contractors/temporary staff directly employed by the associate or third party involved in providing that service to the appointee.
Household - These are properties used as single domestic dwellings (normally occupied), receiving water for domestic purposes which are not factories, offices or commercial premises. These include cases where a single aggregate bill is issued to cover separate dwellings having individual standing charges. (In some instances, the standing charge may be zero.) The number of dwellings attracting an individual standing charge and not the number of bills should be counted. Mixed/commercial properties and multiple household properties – for example, blocks of flats having only one standing charge – should be excluded.
Non-appointed business – The non-appointed business activities of the Company are activities for which the Company as a water and sewerage undertaker is not a monopoly supplier (for example, the sale of laboratory services to an external organisation) or involves the optional use of an asset owned by the Company (for example, the use of underground assets for cable television).
Non-household – The company has exited the Non-household market, transferring ownership of its customers to Castle Water from the date of the market opening (1 April 2017). These are properties receiving water for domestic purposes but which are not occupied as domestic premises, or where domestic dwellings are combined with other properties, or where properties are in multiple occupation but only have one standing charge. In this case, it is the number of bills that should be counted. The Company continues to incur certain operational costs which have been allocated to the non-household price control in accordance with RAG 2.07.
Ofwat – The name used to refer to the Water Services Regulation Authority (“WSRA”). The WSRA acts as the economic regulator of the water industry.
Operating Expenditure (Opex) - Payments for the day-to-day operations of our business, such as operating and maintaining our network and treatment works, paying our staff and our energy bills. This is known as operational expenditure or OPEX.
Price control units - At the 2014 price review Ofwat introduced separate binding price controls. These include wholesale water, wholesale wastewater, retail household and retail non household.
Regulatory Accounting Guidelines (“RAG”) – The accounting guidelines for regulatory accounts issued, and amended from time to time, by Ofwat.
Retail - This term refers to any water company activities that take place once water has passed to the customer’s side of a property boundary. These include billing, payment handling, debt management, meter reading and handling billing related calls .The Company continues to perform these services for Household customers only as Non-household customers have been transferred to Castle Water from the market opening.
Third-party contributions– Grants and third-party contributions received in respect of infrastructure assets and any deferred income relating to grants and third-party contributions for non-infrastructure assets.
Water Resources Management Plan (“WRMP”) – A plan that sets out how water companies aim to meet predicted demand for water over the next 25 years, ensuring enough water is available to meet customers' needs. This is published every five years.
Wholesale - This term covers all water company activities that take place before water passes the customer’s property boundary – resources management, abstraction, treatment, distribution (water and sewer networks), sewage collection, transportation, sewage treatment, sludge disposal and energy from waste.