accounting separation methodology statement 2014 … · methodology statement accounting separation...
TRANSCRIPT

Thames Water Utilities 2014 Methodology Statement AS tables
Methodology Statement
Accounting Separation tables For the year ended 31 March 2014
June 2014

Thames Water Utilities 2014 Methodology Statement AS tables
Contents
Section Page 1. Introduction
1.1 Purpose 1 1.2 Scope 1 1.3 Governance 1
2. Systems and structures
2.1 Systems 2 2.2 Structures 2
3. Guidance 3.1 Regulatory Accounting Guidelines 4 3.2 Information Notice 5 3.3 Changes to methodology 5
4. Process 4.1 SAP allocation process 7 4.2 Completion of tables 8
5. Allocation assumptions – operating costs 5.1 Wholesale tables 10 5.2 Retail 13 5.3 General and support expenditure 20
6. Allocation assumptions – fixed assets 6.1 General assumptions 22 6.2 Calculation of current cost depreciation 23 6.3 Analysis of current cost fixed asset additions 23 6.4 Business objects analysis 23
7. Capitalisation policy 7.1 General principles 25 7.2 General overheads 25 7.3 Employee overheads 25 7.4 Internal verification 26 7.5 Process and procedures 26
8. Year on year comparison of operating expenditure 8.1 Wholesale water 27 8.2 Wholesale sewerage 28 8.3 Retail 29
9. Comparison of actual operating expenditure with final determination 30
10. Further improvements 31

Thames Water Utilities 2014 Methodology Statement AS tables
1
1. Introduction The Accounting Separation (“AS”) tables included in the Company’s Regulatory accounts have been prepared in accordance with this methodology statement.
1.1 Purpose The purpose of this methodology statement is to enable Ofwat and other stakeholders to understand the systems, processes and allocation assumptions used in the preparation of the AS tables reported within the Company’s regulatory accounts. The following sections will also provide the scope and governance processes that the Company adopted in preparing these tables. This methodology statement should be read in conjunction with the Regulatory accounts as reported within the Company’s Annual report and financial statements. This methodology statement forms part of our internal governance process and forms part of our control and reporting structure as shown in the table 1 below. Table 1
External guidance Internal processes Outputs
Regulatory Accounting Guidelines (“RAG”)
AS methodology statement Regulatory accounts
Information Notices Upstream services methodology statement
Internal verification pack
Process and procedures Compliance document
1.2 Scope This document relates to Thames Water Utilities Limited appointed business only, and should be read in conjunction with the following guidance:
• RAG 4.04 ‘Guideline for the definitions for the regulatory accounts tables’; and
• Information notice (“IN”) 14/05 issued 7 February 2014 documents: o ‘Disclosure requirements for companies AS and upstream services data methodology
statements 2013-14’; and o ‘AS guidance clarifications’.
Please refer to the guidance section, section 3 below for more information.
1.3 Governance The Company follows a rigorous compliance regime in respect of the production of the AS tables. Each table produced will follow the process whereby an Integrity Data Declaration form is required to be signed off by the following:
• Information provider
• Table lead
• Data owner
• Director The tables and methodology statement are externally reviewed and audited by KPMG as part of their audit of the Company’s Annual report and financial statements including the regulatory accounts. The final outputs of the AS tables are included in the Regulatory accounts of the Company’s Annual report and financial statements (“AR&A”). Please refer to note 3 for operating costs on pages 178 to 180 and the current cost analysis of fixed asset tables on pages 181 to 183 of the Company’s AR&A, which can be found on our website www.thameswater.co.uk/results.
Thames Water Utilities 2014 Methodology Statement AS tables
2
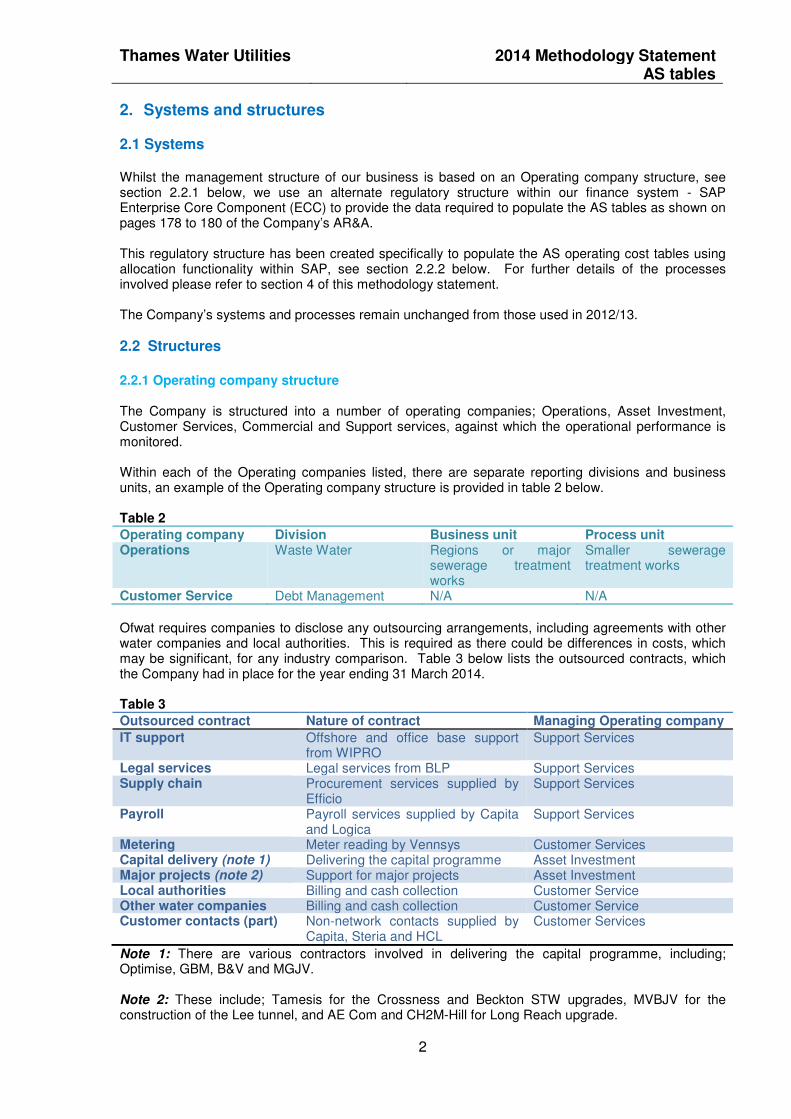
2. Systems and structures 2.1 Systems Whilst the management structure of our business is based on an Operating company structure, see section 2.2.1 below, we use an alternate regulatory structure within our finance system - SAP Enterprise Core Component (ECC) to provide the data required to populate the AS tables as shown on pages 178 to 180 of the Company’s AR&A. This regulatory structure has been created specifically to populate the AS operating cost tables using allocation functionality within SAP, see section 2.2.2 below. For further details of the processes involved please refer to section 4 of this methodology statement. The Company’s systems and processes remain unchanged from those used in 2012/13.
2.2 Structures
2.2.1 Operating company structure The Company is structured into a number of operating companies; Operations, Asset Investment, Customer Services, Commercial and Support services, against which the operational performance is monitored. Within each of the Operating companies listed, there are separate reporting divisions and business units, an example of the Operating company structure is provided in table 2 below. Table 2
Operating company Division Business unit Process unit Operations Waste Water Regions or major
sewerage treatment works
Smaller sewerage treatment works
Customer Service Debt Management N/A N/A
Ofwat requires companies to disclose any outsourcing arrangements, including agreements with other water companies and local authorities. This is required as there could be differences in costs, which may be significant, for any industry comparison. Table 3 below lists the outsourced contracts, which the Company had in place for the year ending 31 March 2014. Table 3
Outsourced contract Nature of contract Managing Operating company
IT support Offshore and office base support from WIPRO
Support Services
Legal services Legal services from BLP Support Services Supply chain Procurement services supplied by
Efficio Support Services
Payroll Payroll services supplied by Capita and Logica
Support Services
Metering Meter reading by Vennsys Customer Services Capital delivery (note 1) Delivering the capital programme Asset Investment Major projects (note 2) Support for major projects Asset Investment Local authorities Billing and cash collection Customer Service Other water companies Billing and cash collection Customer Service Customer contacts (part) Non-network contacts supplied by
Capita, Steria and HCL Customer Services
Note 1: There are various contractors involved in delivering the capital programme, including; Optimise, GBM, B&V and MGJV. Note 2: These include; Tamesis for the Crossness and Beckton STW upgrades, MVBJV for the construction of the Lee tunnel, and AE Com and CH2M-Hill for Long Reach upgrade.

Thames Water Utilities 2014 Methodology Statement AS tables
3
For each type of cost, each operating company categorises its cost between direct, indirect and overheads:
• Direct costs are defined as costs which can be clearly traced to a cost object. A cost object can be a product, contract, project or site. For example, the employment costs of a Site Manager associated with his/her site, chemicals, site maintenance and power.
• Indirect Costs are defined as costs which cannot be traced directly to one cost object or activity. For example, the employment costs of a Regional Manager who has several sites under his/her remit that relate to the Business Unit.
• Overhead costs are defined as costs not directly related to the operational element of the Operating company. For example Head Office costs, Senior Managerial costs, and administration. A WTW (Water treatment works)/STW (Sewage treatment works) may have zero overheads for these purposes.
2.2.2 Regulatory structure The regulatory structure in SAP reflects the AS units, defined by Ofwat are as listed below: Wholesale – Water services
• Water resources
• Raw water distribution
• Water treatment
• Treated water distribution Wholesale – Sewerage services
• Sewage collection
• Sewage treatment
• Sludge treatment
• Sludge disposal Retail
• Household
• Non-household Where the activity of a cost centre within the management structure is 100% attributable to one of the AS units listed above, and allocation of costs is not required, the cost centre is mapped, within SAP, into its AS unit. Where the activity of a cost centre within the management structure is not 100% attributable to any of the above, these cost centres are held within a further cost centre group. These costs are then allocated based on key drivers and rules defined to enable these costs to be allocated to the 10 AS units listed above. These costs are either:
• costs that are held at a water treatment or sewerage treatment site level, where the activity straddles more than one of the wholesale AS units; or
• the cost is a support service cost and is therefore allocated based on the activity of the support service function using the most appropriate methodology outlined in section 5.3 of this methodology statement.
The allocation process is further described in section 4 below.

Thames Water Utilities 2014 Methodology Statement AS tables
4
3. Guidance
3.1 Regulatory Accounting Guidelines (“RAG”) Ofwat issued revised RAG in February 2013, which RAG 4.04 ‘Guideline for the definitions for the regulatory accounts tables’ is the primarily guidance used in producing the AS tables. The following principles outlined in RAG 4.04 have been applied when allocation costs to the relevant AS unit.
• Transparency: the attribution methods applied within the AS system need to be transparent. This requires that the costs and revenues apportioned to each service and business unit should be clearly identifiable. The cost and revenue drivers used within the system should also be clearly explained to enable a review of their appropriateness. Management considers that the Company’s financial system and allocation methodology outlined in section 5 provide transparency as required by this principle.
• Causality: cost causality requires that costs (and revenues) are allocated to those activities and services that cause the cost (or revenue) to be incurred. This requires that the attribution of costs and revenues to activities and services should be performed at as granular level as possible. Wherever possible, costs are attributed to the process that causes the cost to be incurred. Where costs cannot be directly attributed, the costs are allocated as detailed in section 5 of this methodology statement. Management considers that it is compliant with this principle.
• Non-discrimination: the attribution of costs and revenues should not favour any business unit within the regulated company and it should be possible to demonstrate that internal transfer charges are consistent with the prices charged to external third parties. Management consider that the cost allocation methodology detailed in section 5 are Non-discriminatory and do not favour any one business unit to the detriment of others.
• Objectivity: the cost and revenue attribution criteria need to be objective and should not intend to benefit any business unit or service. Management considers that the cost allocation bases described in section 5 are objective and do not favour any one business unit to the detriment of others.
• Consistency: the cost and revenue attribution criteria should be consistent from year to year to enable meaningful comparison of information over time. Changes to the attribution methodology from year to year should be clearly justified and documented.
Management consider that the methodology is consistent with the prior year. Where changes to the allocation methods are required, these are documented in this methodology statement, see section 3.3.
Section 4 below details the process and section 5 the allocation assumptions outlining how the above principles have been applied.

Thames Water Utilities 2014 Methodology Statement AS tables
5
3.2 Information Notice (“IN”) In February 2014, Ofwat issued IN 14/05, clarifying the requirements that companies should follow in preparing the 2014 AS tables. Table 4 below lists the clarification outlined in IN 14/05 ‘AS guidance clarifications’. Table 4 Activity Guidance
Customer Services – network calls The cost of network enquiries includes the costs of; scheduling jobs where triggered by a customer call, visiting the customer to investigate the problem where it is found that it is not a network issue and internally generated calls to the retail cost centre to enable the customer call to be resolved -.see section 5.2.6 below
Other operating expenditure Clarification of activities to be included in this line – see table 6, page 8 Scientific services All costs to be allocated to the wholesale AS units – see 3.3.1 below Regulation costs To be split equally across all nine AS units – see 3.3.1 below Definition of household and non-household properties
See section 5.2.5 for definitions and table 12 for details of allocation methodology and assumptions used
IN 14/05 also provided companies with those disclosure requirements that companies are expected to include in their methodology statements. All these disclosure requirements have been incorporated throughout this methodology statement. There has been no other guidance issued up to June 2014 changing RAG requirements.
3.3 Changes to methodology 3.3.1 Changes to methodology as a result of latest Ofwat guidance The clarification regarding the reporting of scientific services and regulation costs is a change from the methodology used in the Company’s 2012/13 AS tables as detailed below:
• Scientific services: sampling of drinking water at customers’ taps is now treated as a wholesale activity, in 2012/13 these costs were allocated to retail.
• Regulation costs: costs are now split equally across all nine AS units; in 2012/13 costs were allocated pro-rata to the direct costs incurred by each of the nine AS units.
3.3.2 Changes to methodology as a result of management review In addition to the two changes noted above resulting from IN 14/05, the Company has also changed its methodology in the allocation of general and support costs within the Retail table. Previously these costs were allocated between household (“HH”) and non-household (“NHH”) pro-rata to the level of direct costs reported within these two services. In 2013/14, the Company has allocated general and support costs pro-rata to the number of customer accounts within HH and NHH. Management consider that this change in methodology is appropriate and more closely aligns with the way the resources are consumed and is also in line with the approach taken for PR14. The basis of allocation of general and support costs between wholesale and retail AS units remain unchanged from the prior year. Table 5 below details the impact on operating expenditure of the changes to methodology outlined above, if these were applied to the 2012/13 AS tables. The prior year tables are not required to be disclosed in the regulatory accounts, therefore there is no requirement to restate these tables. The below information is provided to show the impact of the changes in methodology and to aid the year on year comparison tables provided in section 8 of this methodology statement.

Thames Water Utilities 2014 Methodology Statement AS tables
6
Table 5
Activity
Wholesale
£m
Retail household
£m
Retail non-household
£m
Scientific services – Treated water distribution 1.1 (1.0) (0.1)
Regulation costs – all units 0.1 (0.1) -
General and support - 1.0 (1.0)
Total 1.2 (0.1) (1.1)
The allocation of Retail assets between HH and NHH has also been reviewed by management to take into account the transfer of meter assets from Retail to Treated water distribution in the year ended 31 March 2013. In the prior period, Retail assets were allocated to HH and NHH using analysis of metered customers as the appropriate cost driver on the premise that the depreciation associated with domestic meters was main constituent of Retail’s depreciation charge. With the transfer of meters from Retail to Treated water distribution during the prior period, using metered customers as the cost driver is no longer considered to be appropriate. Management now consider the most appropriate allocation of Retail assets should be based on the number of customer accounts. 3.3.3 Changes to methodology as a result of change to the application of the capitalisation policy 3.3.3.1 Customer side leakage (“CSL”) The Company has changed its application of the capitalisation policy in respect of CSL replacement and relining of customer side pipes. Prior to 2013/14, all costs associated with CSL were charged to operating costs. In this regulatory period, the Company in providing a free service to customers for any customer side leakage repairs, costs associated with the replacement and relining of customer side pipes have been capitalised as Infrastructure Renewals Expenditure (“IRE”), as management considers that such expenditure meets the criteria of IRE as defined in RAG 1.01. In the period the amount capitalised as IRE was £3.3m. In accordance with the guidance in RAG 1.01 in respect of the accounting for IRE, the Company has charged £2.2m of the above IRE as an Infrastructure Renewals Charge (“IRC”) in the year as depreciation within the statutory accounts. However, to comply with the guidance provided in RAG 4.04 and IN 14/05, the Company has reclassified the IRC as operating cost within the historical and current cost regulatory accounts. This treatment has been discussed with Ofwat, who have agreed with the differing approaches within the statutory accounts and regulatory accounts. 3.3.3.2 Enabling costs Following a review of the areas of operational activity that act as enabling costs to capital expenditure, the Company has identified two areas that should be treated as enabling costs and therefore are now being capitalised. Leak detection: the Company carries out a programme of leak detection and where it is found that a repair is required and is to be capitalised, the cost of detection of the leak, is also capitalised as part of the repair. The amount capitalised in the year was £6.4m, of which £4.1m relate to prior periods. Traffic management: the Company incurs the cost of the initial street works permit and does not pass this on to the contractor. This cost of the permit is retrospectively allocated to the ensuing capital project. The amount capitalised in the year was £7.0m, of which £3.9m relate to prior periods There are no other changes to the methodology or to management judgements that the Company has used in the 2013/14 AS tables within the regulatory accounts other than those noted above. The Company’s internal compliance document has been updated to reflect the above changes in methodology.

Thames Water Utilities 2014 Methodology Statement AS tables
7
4. Process
4.1 SAP allocation process Finance data within SAP is recorded by expenditure type within a cost centre. Cost centres are grouped in a hierarchy appropriate to the relevant business stream or area. The cost centres represent an area of management either at a process level within a functional area e.g. Sludge Disposal – Bicester Sewerage Treatment Works or at a support level e.g. Finance. Where possible, costs are recorded at the lowest level within the regulatory cost centre hierarchy i.e. the relevant process level appropriate to the type of cost and AS unit. However, certain costs are recorded at a higher level in the cost centre hierarchy where they do not specifically relate to a process or if the cost is a support related cost. These costs are allocated to the AS unit by using pre-determined rules defined by management; these rules are recoded within SAP. These rules are created to ensure compliance with latest Ofwat guidance; and the principles outlined in RAG 4.04 are complied with. The costs to be allocated are regularly assessed by management (see explanation below diagram), with regards to the nature and type of cost and an appropriate rule is created. The rule allocates costs from a sender cost centre to a receiver cost centre. These allocation rules are referred to as assessment cycles within SAP. The sender cost centres can be an operational or support services cost centre within the management cost centre structure that cannot be directly attributed to an AS unit. Receiving cost centres are those cost centres specifically defined in SAP as AS cost centres. The following diagram outlines the assessment cycle process for a sender cost centre to a receiving cost centre:
Sending cost centre Receiving cost centres
Assessment cycle TW03B1_22 allocation of 100% of costs to receiving cost centres based on fixed percentages
The assessment cycles are reviewed by management at least annually to ensure that they remain appropriate and valid, taking into account any business unit reorganisation, any operational process changes and latest Ofwat guidance. As part of the Company’s budgetary planning cycle, the allocation percentages for all cost centres were reviewed and SAP was updated to reflect any changes to the assessment cycles accordingly. This review is undertaken by finance managers with operational management for each cost centre within the regulatory hierarchy. Any changes to assessment cycles within SAP, following the review, are undertaken by the Regulatory Finance Reporting Manager. A cost centre control file is maintained, which details all relevant cost centres regulatory information, including assessment cycles. The assessment cycles are run at least twice a year in order that management can review AS tables for the six month period to 30 September and for the full twelve month period to 31 March.
Sending Cost centre
3452 – Technical
scheduling
Water treatment
Treated water distribution
Sewerage collection
Thames Water Utilities 2014 Methodology Statement AS tables
8
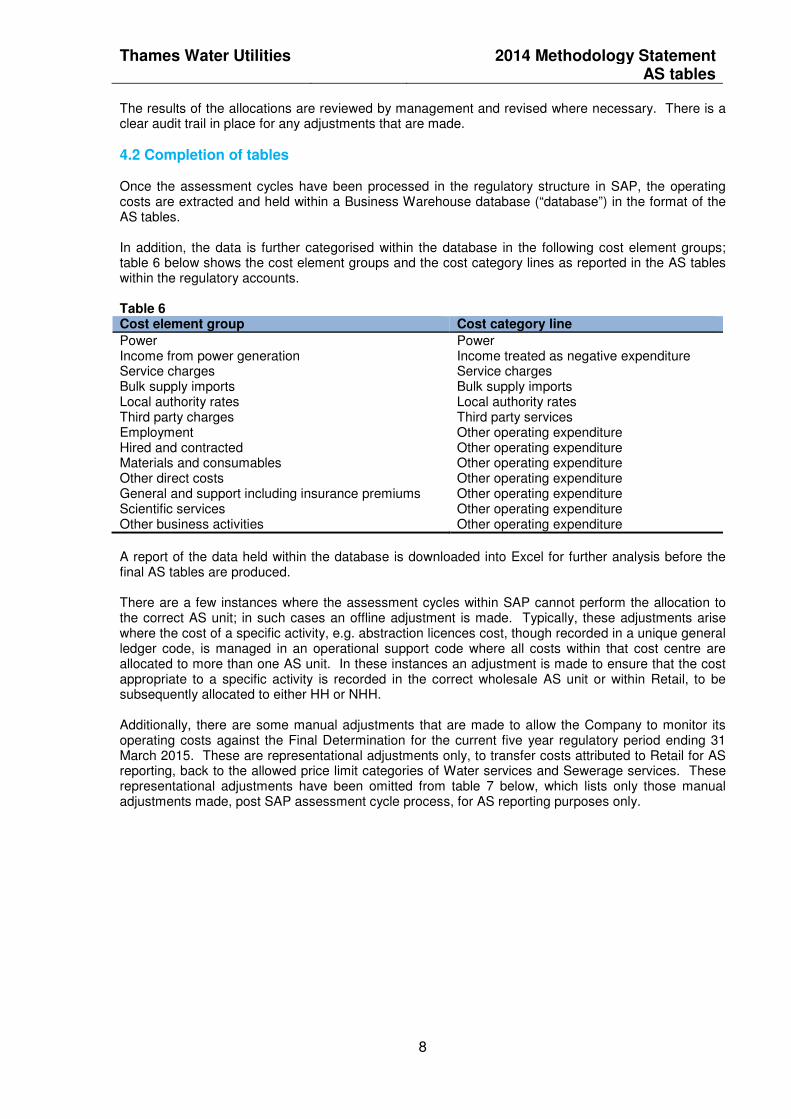
The results of the allocations are reviewed by management and revised where necessary. There is a clear audit trail in place for any adjustments that are made.
4.2 Completion of tables Once the assessment cycles have been processed in the regulatory structure in SAP, the operating costs are extracted and held within a Business Warehouse database (“database”) in the format of the AS tables. In addition, the data is further categorised within the database in the following cost element groups; table 6 below shows the cost element groups and the cost category lines as reported in the AS tables within the regulatory accounts. Table 6 Cost element group Cost category line
Power Power Income from power generation Income treated as negative expenditure Service charges Service charges Bulk supply imports Bulk supply imports Local authority rates Local authority rates Third party charges Third party services Employment Other operating expenditure Hired and contracted Other operating expenditure Materials and consumables Other operating expenditure Other direct costs Other operating expenditure General and support including insurance premiums Other operating expenditure Scientific services Other operating expenditure Other business activities Other operating expenditure
A report of the data held within the database is downloaded into Excel for further analysis before the final AS tables are produced. There are a few instances where the assessment cycles within SAP cannot perform the allocation to the correct AS unit; in such cases an offline adjustment is made. Typically, these adjustments arise where the cost of a specific activity, e.g. abstraction licences cost, though recorded in a unique general ledger code, is managed in an operational support code where all costs within that cost centre are allocated to more than one AS unit. In these instances an adjustment is made to ensure that the cost appropriate to a specific activity is recorded in the correct wholesale AS unit or within Retail, to be subsequently allocated to either HH or NHH. Additionally, there are some manual adjustments that are made to allow the Company to monitor its operating costs against the Final Determination for the current five year regulatory period ending 31 March 2015. These are representational adjustments only, to transfer costs attributed to Retail for AS reporting, back to the allowed price limit categories of Water services and Sewerage services. These representational adjustments have been omitted from table 7 below, which lists only those manual adjustments made, post SAP assessment cycle process, for AS reporting purposes only.
Thames Water Utilities 2014 Methodology Statement AS tables
9
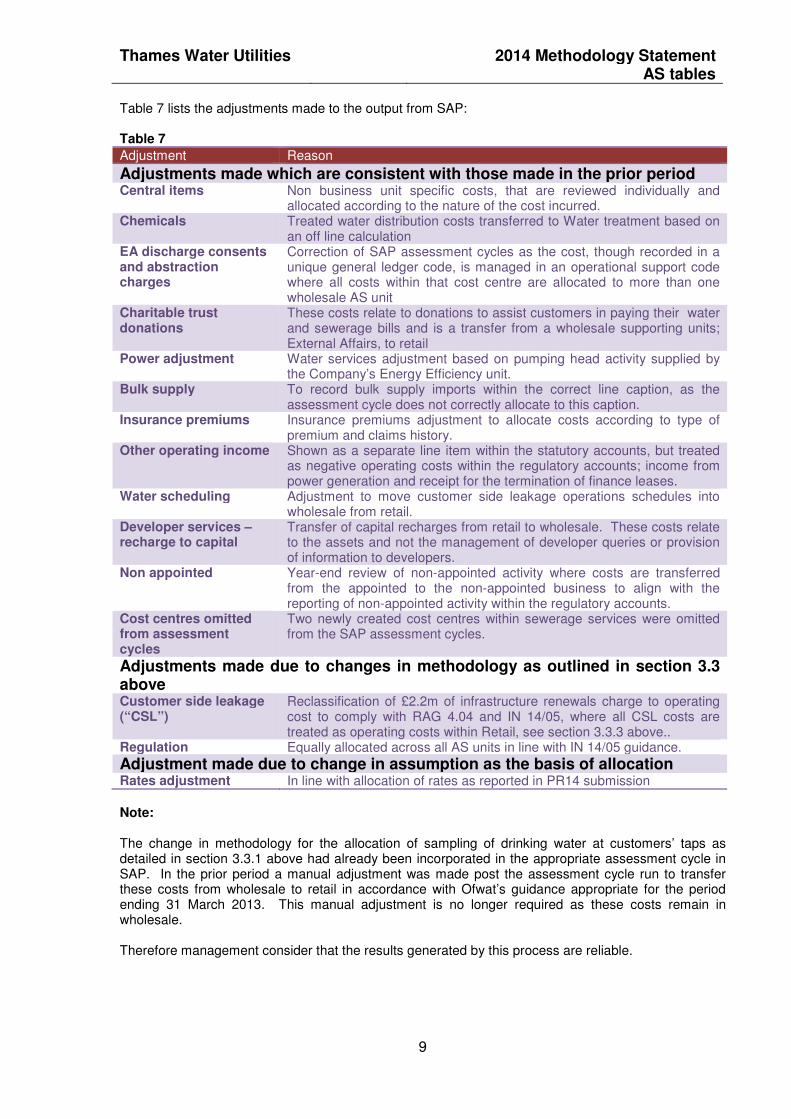
Table 7 lists the adjustments made to the output from SAP: Table 7
Adjustment Reason
Adjustments made which are consistent with those made in the prior period Central items Non business unit specific costs, that are reviewed individually and
allocated according to the nature of the cost incurred. Chemicals Treated water distribution costs transferred to Water treatment based on
an off line calculation EA discharge consents and abstraction charges
Correction of SAP assessment cycles as the cost, though recorded in a unique general ledger code, is managed in an operational support code where all costs within that cost centre are allocated to more than one wholesale AS unit
Charitable trust donations
These costs relate to donations to assist customers in paying their water and sewerage bills and is a transfer from a wholesale supporting units; External Affairs, to retail
Power adjustment Water services adjustment based on pumping head activity supplied by the Company’s Energy Efficiency unit.
Bulk supply To record bulk supply imports within the correct line caption, as the assessment cycle does not correctly allocate to this caption.
Insurance premiums Insurance premiums adjustment to allocate costs according to type of premium and claims history.
Other operating income Shown as a separate line item within the statutory accounts, but treated as negative operating costs within the regulatory accounts; income from power generation and receipt for the termination of finance leases.
Water scheduling Adjustment to move customer side leakage operations schedules into wholesale from retail.
Developer services – recharge to capital
Transfer of capital recharges from retail to wholesale. These costs relate to the assets and not the management of developer queries or provision of information to developers.
Non appointed Year-end review of non-appointed activity where costs are transferred from the appointed to the non-appointed business to align with the reporting of non-appointed activity within the regulatory accounts.
Cost centres omitted from assessment cycles
Two newly created cost centres within sewerage services were omitted from the SAP assessment cycles.
Adjustments made due to changes in methodology as outlined in section 3.3 above Customer side leakage (“CSL”)
Reclassification of £2.2m of infrastructure renewals charge to operating cost to comply with RAG 4.04 and IN 14/05, where all CSL costs are treated as operating costs within Retail, see section 3.3.3 above..
Regulation Equally allocated across all AS units in line with IN 14/05 guidance.
Adjustment made due to change in assumption as the basis of allocation Rates adjustment In line with allocation of rates as reported in PR14 submission
Note: The change in methodology for the allocation of sampling of drinking water at customers’ taps as detailed in section 3.3.1 above had already been incorporated in the appropriate assessment cycle in SAP. In the prior period a manual adjustment was made post the assessment cycle run to transfer these costs from wholesale to retail in accordance with Ofwat’s guidance appropriate for the period ending 31 March 2013. This manual adjustment is no longer required as these costs remain in wholesale. Therefore management consider that the results generated by this process are reliable.

Thames Water Utilities 2014 Methodology Statement AS tables
10
5. Allocation assumptions – operating costs 5.1 Wholesale tables
5.1.1 General assumption The following sections describe the allocation assumptions used in the production of the wholesale AS tables reported in the regulatory accounts. Cost drivers are assigned to each type of cost incurred and these are shown below: The following are the cost driver’s used for all expenditure lines listed in section’s 5.1.2 (Water services), and 5.1.3 (Sewerage services). For general and support expenditure, the appropriate allocation basis is provided in section 5.3. Cost Driver - A This is where direct costs can be attributed directly to the relevant AS process.
Cost Driver – B In cases where the cost can be directly attributed to a service area (water, sewerage or retail) but a specific cost driver is then used to allocate the cost to the appropriate AS business unit within the service area.
Cost Driver – C In cases where the mapping is not direct, allocations are worked out using appropriate estimates and judgements based on available data and an understanding of the business.
The following tables set out by line item the basis of allocations used to populate the tables. The basis of allocation, with the exception of the changes in methodology outlined in section 3.3 above, remain consistent with the prior period. 5.1.2 Water services Most costs can be directly attributed at source to an AS process within water services or to water treatment sites and allocated to the relevant process. Table 8 below details the allocation basis and assumption for each expenditure line. Table 8
Expenditure line Cost driver
Allocation basis Allocation assumption
Power B Direct cost to site Allocated based on assessment by site management using pumping head data and power of equipment.
Service charges A Actual charge from the Environment Agency directly coded to process
N/A
Bulk supply imports A Directly coded to process N/A Other operating expenditure - Employment costs A/C Directly coded to process where possible, else
allocated based on assessment of time spent Based on split of maintenance activity
- Hired and contracted A Directly coded to process N/A - Materials and
consumables A Directly coded to process N/A
- Other direct costs B Direct cost to site Management judgement - General and support See section 5.3 - Scientific services B Allocated to wholesale AS unit Based on samples - Other business
activities A Regulatory costs Equally allocated across all units
Local authority rates B/C Floor space Business unit FTE’s of floor space occupied
Cumulo rates C Gross Modern Equivalent Asset Value Based on AS values Third party services B Allocated to AS unit Based on activity analysis

Thames Water Utilities 2014 Methodology Statement AS tables
11
Further assumptions Power: High lift pumps at the end of the treatment process (on site) have been reported as water treatment, with an allocation to treated water distribution for dual pumping. Scientific services: All tap sampling water customers premises are allocated to treated water distribution.
Thames Water Utilities 2014 Methodology Statement AS tables
12
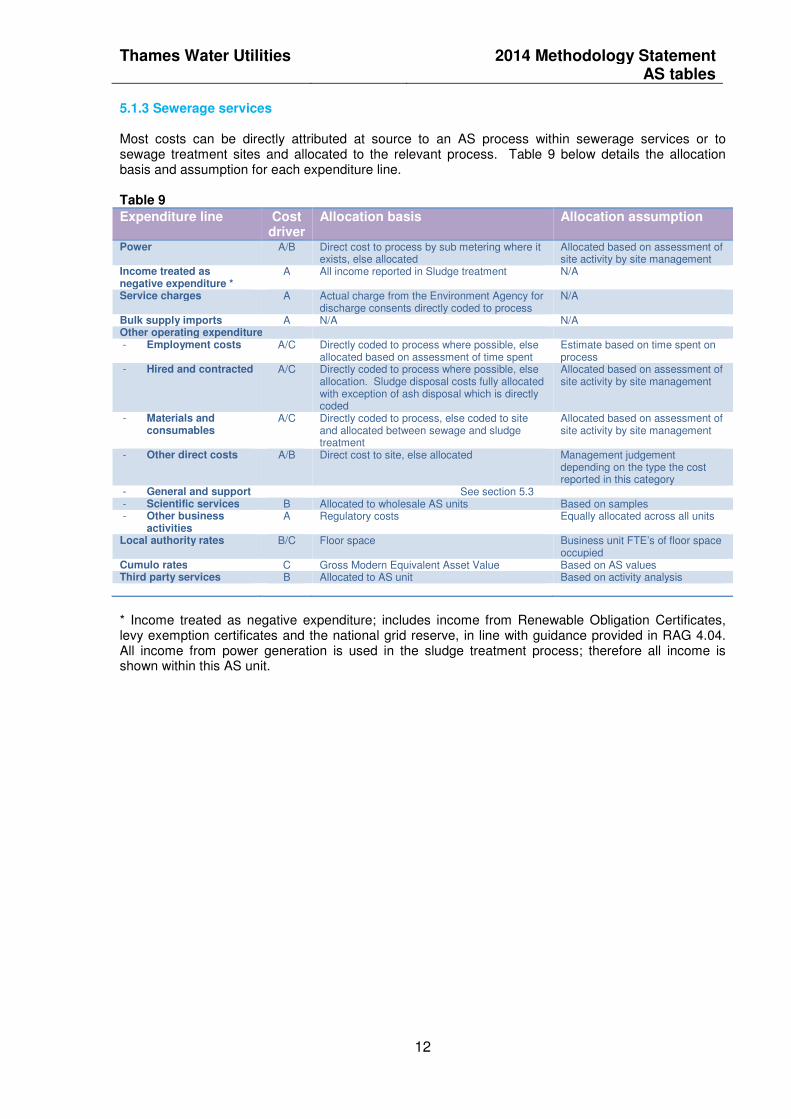
5.1.3 Sewerage services Most costs can be directly attributed at source to an AS process within sewerage services or to sewage treatment sites and allocated to the relevant process. Table 9 below details the allocation basis and assumption for each expenditure line. Table 9
Expenditure line Cost driver
Allocation basis Allocation assumption
Power A/B Direct cost to process by sub metering where it exists, else allocated
Allocated based on assessment of site activity by site management
Income treated as negative expenditure *
A All income reported in Sludge treatment N/A
Service charges A Actual charge from the Environment Agency for discharge consents directly coded to process
N/A
Bulk supply imports A N/A N/A Other operating expenditure - Employment costs A/C Directly coded to process where possible, else
allocated based on assessment of time spent Estimate based on time spent on process
- Hired and contracted A/C Directly coded to process where possible, else allocation. Sludge disposal costs fully allocated with exception of ash disposal which is directly coded
Allocated based on assessment of site activity by site management
- Materials and consumables
A/C Directly coded to process, else coded to site and allocated between sewage and sludge treatment
Allocated based on assessment of site activity by site management
- Other direct costs A/B Direct cost to site, else allocated Management judgement depending on the type the cost reported in this category
- General and support See section 5.3 - Scientific services B Allocated to wholesale AS units Based on samples - Other business
activities A Regulatory costs Equally allocated across all units
Local authority rates B/C Floor space Business unit FTE’s of floor space occupied
Cumulo rates C Gross Modern Equivalent Asset Value Based on AS values Third party services B Allocated to AS unit Based on activity analysis
* Income treated as negative expenditure; includes income from Renewable Obligation Certificates, levy exemption certificates and the national grid reserve, in line with guidance provided in RAG 4.04. All income from power generation is used in the sludge treatment process; therefore all income is shown within this AS unit.

Thames Water Utilities 2014 Methodology Statement AS tables
13
5.2 Retail 5.2.1 General assumption The assumptions, allocations and management judgements used for the collection, allocation and apportionment of the Retail cost data are reviewed at least yearly, to ensure that the methodology is still appropriate in the allocation of costs to the various Retail activities in accordance with Ofwat guidance. The following sections provide further guidance in support of the Company’s Retail cost table within the regulatory accounts. The Retail business unit reports the customer facing costs of water and sewerage services. 5.2.2 Customer services The majority of costs reported within the Retail table are directly attributable and reported within the Customer services function of the Company. Direct costs which are not included within the current Customer service function are allocated from Wholesale and are reported within Retail costs. Table 10 below shows the activities and costs that are not reported within the Customer service function but are allocated from Wholesale or from Central costs to be reported within Retail costs: Table 10
Cost Type Allocated Cost £m Charitable trust donations – Central funding is provided for the Customer Assistance Fund designed to assist vulnerable customers
1.7
Meter reading – in the current year costs have been managed by the Asset Investment team 8.1 Services to developers – managed by the Wholesale team, the cost of supporting Developers in administration function is allocated to Retail
0.7
Network customer enquiries and complaints where it is found that it is not a network issue – this cost is managed by the Wholesale team
2.5
Disconnections 0.1 Demand side water efficiency – measures to improve efficiency of water use, managed by Wholesale and support costs allocated to Retail
0.7
Customer side leaks 4.8 Other business activities 0.7 General and support costs including rates and regulation costs 16.5
5.2.3 Retail cost allocation process The assessment cycles in SAP form the basis of allocation into the retail table, however, in order to reflect these costs in line with the activities shown in table 12 below, a number of manual adjustments are made. This process ensures that the Customer service activities shown in table 11 and the transfers shown in table 10 above are accurately reflected in the Retail table, split between HH and NHH accordingly.

Thames Water Utilities 2014 Methodology Statement AS tables
14
Table 11 below details the Customer Services activities by cost centre and the cost allocation basis, used for each activity listed: Table 11 Customer Services activities by cost centre
Basis of allocation 1 2 3 4 5 6 7 8 9 10
Revenue Contact Centre Agents Based on average Full Time Equivalent (“FTE”) requirements for Work Baskets/Work streams as per Agents Workload Planning (Long Term Plan)
� � � � �
Operational Contact Centre Agents Specific to Network /Operational Enquiries & Complaints � Operational contact centre Specific to Network /Operational Enquiries & Complaints � Office agents Pro-rata to FTE split between Revenue and Operational Contact Centre � � � � � Outsourced Office Agents Based on Analysis of Calls Taken, and Work streams / Workbaskets for
Outsource providers. � � � �
Mail house Based on volumes of type of bills/mail � � � Key Accounts (all NHH) Based on Managers Activity Summary for key accounts agents � � � � � Head of Revenue * Based on FTE allocation relating to Manager's roles/duties � � � Billing & Sales Specific to Billing � Revenue Agents (debt recovery) Specific to Debt Management � Cash & Debt Staff & Other Operating costs
Specific to Payment Handling & Debt Management, allocation based on managers FTE assessment.
� �
Cash & Debt - Payment Commissions Specific to Payment Handling � Cash & Debt - DCA commissions Specific to Debt Management � LA/HA Commissions (all HH) Management judgement based on TW relative costs for the activities covered,
and historical discussions with LA/HA's. � � � �
WOC Commissions Allocation across activities covered by WOCs pro-rata to their Retail Costs submissions
� � � � �
WOC Bad Debt Specific to Doubtful Debts � Bad Debt Provision & Excess Credits Specific to Doubtful Debts
�
Customer Insight & Resolution - RCC Specific to Non-Network Customer Enquiries & Complaints � Customer Insight & Resolution Ops Specific to Network Customer Enquiries & Complaints, including GSS payments
allocated to other operating expenditure � �
Customer experience and engagement - Staff costs
Based on Managers assessment of FTE's supporting customer non-network and network activities
� �
Customer experience and engagement - Non-Staff costs
Specific costs relating to customer non-network, network activities and billing with some costs shared across these activities (based on managers assessment)
� � � �
IT & Change -Transformation Pro-rata to Contact Centre Agents � � � � � � Senior Management Team Pro-rata to CS activities � � � � � � � � Developer Services Specific to Developer services �
* The methodology used for allocating costs within this cost centre has changed in the current year due to a restructuring of the team such that in this year Customer enquiries were no longer being handled. The team continued to handle Billing, Payment handling and Debt recovery activities.

Thames Water Utilities 2014 Methodology Statement AS tables
15
Key to retail table captions: Customer services caption 1 Billing 2 Payment handling, remittance and cash handling 3 Vulnerable customer schemes 4 Non-network customer enquiries and complaints 5 Network customer enquiries and complaints
Other Retail caption 6 Debt management 7 Doubtful debts 8 Meter reading 9 Services to developers 10 Other operating expenditure

Thames Water Utilities 2014 Methodology Statement AS tables
16
5.2.4 General and support cost assumptions The General and support allocation is addressed in section 5.3 below for all AS units. General and support costs represent overheads that are allocated to Wholesale and Retail AS units. The allocation of General and support costs between HH and NHH is allocated based on the number of customer accounts, which is in accordance with the guidance received for PR14. This is a change in the methodology used in the prior year where General and support costs were allocated pro-rata to the level of direct costs incurred. Management considers that allocation pro-rata to the number of customer accounts, in line with PR14 guidance, is a more appropriate way of allocating these types of costs, as these costs cannot be directly attributed to either HH or NHH. This change in methodology does not impact prior year AS tables, as this change is effective from the current financial year ending 31 Match 2014. 5.2.5 Definition of household and non-household properties used in this methodology statement The Companies allocation of costs into HH and NHH is compliant with the definitions below as clarified by Ofwat in IN 14/05. Households: These are properties used as single domestic dwellings (normally occupied), receiving water for domestic purposes which are not factories, offices or commercial premises. These include cases where a single aggregate bill is issued to cover separate dwellings having individual standing charges. (In some instances the standing charge may be zero). The number of dwellings attracting an individual standing charge and not the number of bills should be counted. Exclude mixed/commercial properties and multiple HH properties, e.g. blocks of flats having only one standing charge. Examples of households: • typical family dwelling, i.e. terraced, semi-detached, detached house or flat having individual standing charges; or • Local authority family dwellings which each have individual standing charges but may be included in an aggregate water bill. Non-households: These are properties receiving water for domestic purposes but which are not occupied as domestic premises, or where domestic dwellings are combined with other properties, or where properties are in multiple occupations but only have one standing charge. The number of bills should be counted in this case. Examples of non-households: • industrial/commercial properties (e.g. institutions, farms, public houses, offices); • combined premises with a single standing charge, such as a flat above a shop; or • block of flats, or caravan site (consisting of multiple dwellings) but only having one standing charge. These must be counted as one NHH property.” Table 12 below details for each activity the methodology used to allocate costs to HH and NHH cost driver and the rationale used. Where a cost has been allocated from the wholesale business, information supporting the allocation method used is also provided in the table or within section 5.2.8 below.

Thames Water Utilities 2014 Methodology Statement AS tables
17
Table 12
Expenditure line and activity Directly retail or allocated
Driver Rationale
Customer services - Billing Direct Number of bills issued
to HH/NHH customers Ofwat guidance
- Payment handling, remittance and cash handling
Direct Level of payment transaction processed and commissions paid by HH/NHH customer
Transaction analysis
- Charitable trust donations Allocated from External Affairs
Costs separately identified and allocated 100% to HH
All HH
- Vulnerable customer schemes Direct All HH All HH - Non-network customer enquiries and
complaints Direct Pro rata to number of
customer network HH/NHH contacts received
Ofwat guidance
- Network customer enquiries and complaints Direct Pro rata to number of customer operational HH/NHH contacts
Ofwat guidance
- Network customer enquiries and complaints where it is found that it is not a network issue *
Allocated from Wholesale
Based on number of engineer customer visits at a fixed call out rate
Ofwat guidance
Debt management Direct Pro-rata to HH/NHH Outstanding Debt with DCA commissions specific to HH/NHH.
Ofwat guidance
Doubtful debts Direct Pro-rata to average HH/NHH % for cost of 5 years debt write-offs.
Based on actual history of debt write-offs by HH/NHH
Meter reading Direct Allocation to HH/NHH based on time taken for Meter Reads.
Ofwat guidance
Services to developers Allocated from Wholesale
Customer facing enquiries allocated 100% to NHH
Costs identified within a wholesale cost centre used wholly in this activity
Other operating expenditure - Disconnections Allocated from
Wholesale No of disconnections managed - all NHH
Ofwat guidance
- Demand side water efficiency Allocated from Wholesale
HH/NHH Activity cost analysis.
Ofwat guidance
- Customer side leaks Allocated from Wholesale
Analysis of number of jobs split HH/NHH
Ofwat guidance
- Other direct costs Direct Pro rata to billing Small value costs - General and support See section 5.3 - Other business activities Allocated from
Regulation Costs allocated equally across 9 AS units
Pro rata to number of customers billed into HH/NHH
Local authority rates Direct Floor space occupied Staff based at Walnut Court and Kemble Court
Third party services N/A N/A N/A
* Management has considered the methodology of allocating network customer enquiries and complaints between HH and NHH. We have changed our methodology to use the number of contacts generating from the Company’s Work Asset Management Information system (“WAMI”). This system logs all customer contacts. Analysis for 6 months of calls has been used to generate the HH/NHH split. Management believe this is a more accurate basis of allocation. In the prior year these costs were allocated based upon volumes generated from the CIS (“Customer information system”) system which may create multiple contacts depending on the number of issues raised by the customer”.

Thames Water Utilities 2014 Methodology Statement AS tables
18
IN 14/05 document ‘Disclosure requirements for companies AS and upstream services data methodology statements 2013-14’ issued by Ofwat on 7 February 2014, require the following information to be disclosed within companies’ methodology statements. 5.2.6 Billing and collection 5.2.6.1 Percentage of income The percentage of income that the Company outsourced for billing and collection is based on the revenue billed on behalf of the company by Local Authorities/ Housing Associations (LA/HA), who bear the risk of any non-collection of any outstanding debt. Billed value taken from year-end LA/HA Commissions Report. During the year ended 31 March 2014, LA/HA billing percentage of turnover billed was 6.9%. 5.2.6.2 Bills to occupier policy The Company only raises bills in the name of the "occupier" when it has evidence that the property is occupied but cannot confirm the name of the occupier. When the occupant is identified the bill is cancelled and rebilled in the customer’s name. If the Company has not identified an occupant within 6 months the bill is cancelled and the property is classified as empty. The value of bills issued in the name of the occupier included in turnover is obtained from the ‘Occupier Billing report’ run by our Billing Analysts. No specific doubtful debt provision is provided for bills issued in the name of the occupier at the year-end. A bad debt provision is applied to all outstanding debt, at the year-end a provision of 13.7% is applied to all debt less than one year old, which would include any debt in the name of the occupier. 5.2.6.3 Doubtful debt policy where the customer has vacated a property Where a customer has vacated a property leaving unpaid debt, this is handled within our debt management process, credit notes are not issued to cancel any such uncollectable debt, it is written-off as bad debt. 5.2.6.4 Bad debt provision policy The bad debt provision is charged to operating costs to reflect the company’s assessment of the risk of non-recoverability of debtors. It is calculated by applying expected erosion rates to debts outstanding at the end of the accounting period. These collection rates take into account the age of the debt and type of debt. Higher provisioning percentages are applied to older categories of debt. Bad debt provisioning rates are updated annually to reflect the latest collection performance data from the company’s billing system. All debt greater than 4 years old are fully provided for. The bad debt provision also takes into account the recoverability of debts which will ultimately be cancelled and may or may not be rebilled, and of debts which have not yet been billed, but are part of the metered sales accrual. Future expected performance (taking into account historic trends) is also used to validate our provisions to ensure that use of historic performance will not result in a material misstatement. We also provide for debts from Water Only Companies (WOCs) who bill for our sewage service on our behalf. Since detailed information about the debt is unavailable to us, we provide for the debt based on the historical write-offs. 5.2.7 Contact centre and outsourced costs Contact Centre Agents costs and Outsource costs are allocated to activities on the basis of the FTE requirement planning and the work packs and work streams issued to outsource partners. WOC commissions are allocated across activities in accordance with the previous year’s Retail submission. LA/HA commissions are allocated across the activities they undertake, i.e. billing, payment handling, debt management and customer (non-network) queries based on the relevant weighting of those activities within the Customer Service Operating costs, factored for the relative costs for the LA/HA’s based on management discussions.

Thames Water Utilities 2014 Methodology Statement AS tables
19
5.2.8 Further assumptions The following assumptions have been applied consistently with the prior period. Customer services expenditure in the retail table includes payment handling, remittance and cash received from developers. Network customer enquiries and complaints include costs:
• associated with the scheduling of jobs where they are triggered by a customer call,
• visiting the customer to investigate the problem where it is found that it is not a network issue, and
• Internally generated calls to enable the customer call to be resolved. These costs are reported in the Operations contact centre, a separately identified cost centre within the Customer service operating company. Doubtful debts split into HH/NHH are based on 5 year history of the debt write-offs. Ofwat’s latest PR14 guidance proposes that companies should directly attribute costs on a customer specific basis. Our systems do not currently enable us to report on this basis. We are, therefore seeking clarification with Ofwat on the suitability of our current basis of allocation and whether our current methodology is acceptable. Demand side water efficiency initiatives within Retail refer to the Base Line Programme (“BSWE”) costs identified and allocated to retail. Sampling of drinking water at customer’s taps is now treated as a Wholesale activity, for 2012/13 these costs were reported within Retail. Customer side leakage costs are reported within a separately identified cost centre in the Operations operating company, the costs being transferred to retail for AS reporting. Operating costs include £2.2m of IRC to comply with RAG 4.04 and IN 14/05. Meter Reading costs are reported within a separately identified cost centre in the Asset Investment function, the costs are directly attributed to retail within the SAP assessment cycle process for AS reporting. Local authority rates are allocated to Retail based on office occupancy of the Customer Services operating company; Walnut Court in Swindon, and Kemble Court in Reading where the Operations contact centre is based. These costs are shown within the Local authority rates caption in the Retail table within the Regulatory accounts. Key accounts retail team costs are allocated to retail from the Commercial business unit within Wholesale. This represents the cost of managing key commercial NHH accounts. Third party costs – there are no costs incurred within Retail that are classed as third party costs, therefore no costs have been reported within this line.

Thames Water Utilities 2014 Methodology Statement AS tables
20
5.3 General and support expenditure These costs reflect the support services functions within the Company, which are detailed below in table 13 with an explanation of the appropriate allocation method used. The costs allocated to the AS units are net of any recharges of costs that the support services functions provide to associate companies of the group and recharges to the non-appointed business of the Company. All General and support costs are shown within the ‘Other operating expenditure’ line category of the AS tables; none are shown as direct expenditure. The allocation methodology remains unchanged from those used in the 2012/13 AS tables. Table 13
Support Service function
Activity and type of expenditure incurred
Allocation Basis Used
Chairman and Chief Executive Officer’s costs
Employment costs and consultancy costs
After recharging a proportion of costs to other associated companies of the Kemble Group, remaining costs are allocated based on the level of total direct costs incurred by each of the nine AS units.
Finance Internal audit, taxation, financial control and treasury functions. Costs include employment , audit fees and subscription fees
Costs are allocated pro rata to direct costs incurred.
Supply Chain Management of outsourced supply chain provider
Management and third party contractor costs are allocated pro-rata to the level of bought in services of each AS unit.
Vehicles and Plant
Fleet management costs and fuel costs
Management of the Company’s vehicles are allocated based on the relevant AS unit in which the vehicle is used.
Legal & secretariat
Management of outsourced legal service provider, management of board and related committees
Allocation applied to all legal requests in the managed legal service database based on work undertaken. All other costs pro-rata to direct costs.
Human Resources costs
Employment costs, training costs and other HR business support costs
These costs are allocated pro rata to direct employment costs incurred.
IT Employment and telephony costs All other costs including management of outsourced IT support costs
These costs are allocated pro-rata to direct employment costs incurred. These costs are allocated pro-rata to direct hired and contracted costs incurred.
External Affairs (excluding Customer Assistant Fund)
This activity includes corporate communications, shareholder engagement and corporate responsibility.
Due to the nature of the costs incurred it is considered appropriate to allocate these costs pro rata to direct costs incurred.
Customer Assistant fund
Payments made to help customers in paying their water and sewerage bills.
All costs relating to the Company’s Customer Assistant fund are directly charged to Retail.
Estates and Facilities
This function includes office supplies, security, facilities and building maintenance costs.
Costs allocated pro rata to total direct cost incurred.
Thames Water Utilities 2014 Methodology Statement AS tables
21
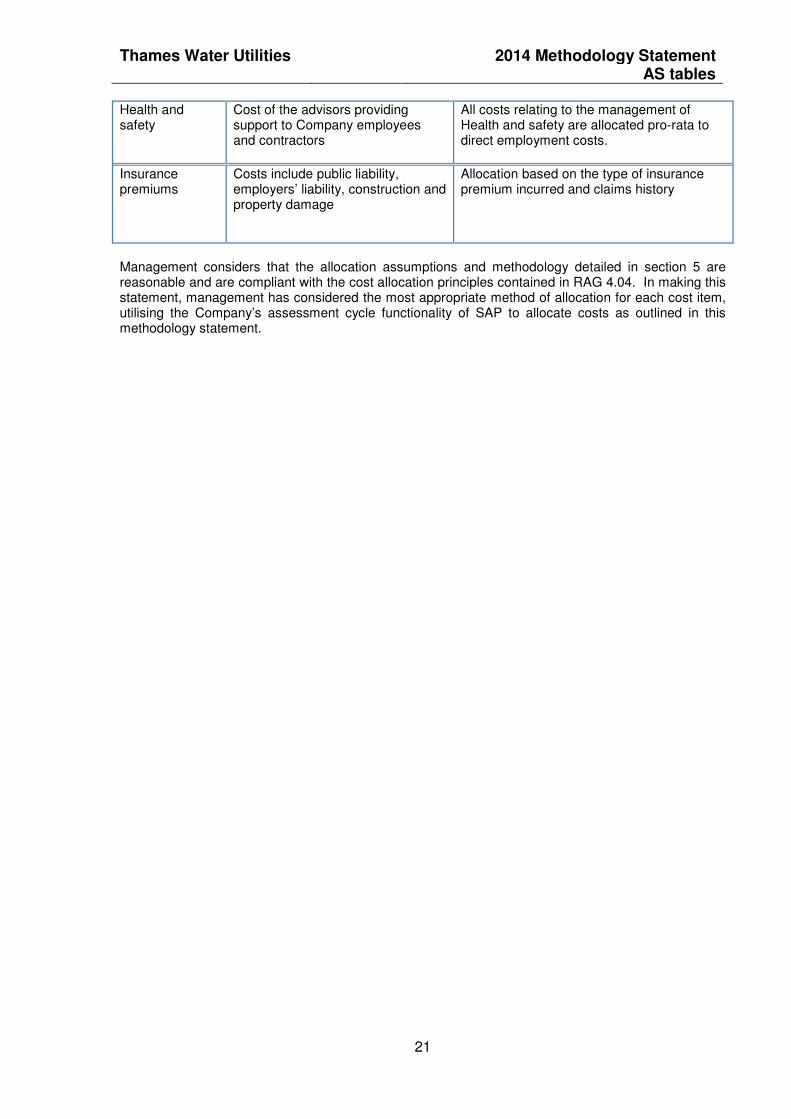
Health and safety
Cost of the advisors providing support to Company employees and contractors
All costs relating to the management of Health and safety are allocated pro-rata to direct employment costs.
Insurance premiums
Costs include public liability, employers’ liability, construction and property damage
Allocation based on the type of insurance premium incurred and claims history
Management considers that the allocation assumptions and methodology detailed in section 5 are reasonable and are compliant with the cost allocation principles contained in RAG 4.04. In making this statement, management has considered the most appropriate method of allocation for each cost item, utilising the Company’s assessment cycle functionality of SAP to allocate costs as outlined in this methodology statement.

Thames Water Utilities 2014 Methodology Statement AS tables
22
6 Allocation assumptions - fixed assets
6.1 General assumptions The following documents the process adopted by the Company to comply with Ofwat’s guidance for the AS fixed asset tables. The methodology detailed in this section covers the assumptions, adjustments and method of analysis applied to populate the fixed asset tables. The Company maintains a current cost asset register that is based on the 2008 modern equivalent asset value (MEAV) revaluation adjusted to include fixed assets commissioned from 2009 to date. Assets are commissioned to sites and are at present exclusively utilised by the service carried out at that facility. Consequentially, at present, there are no recharges between business units relating to asset use. Asset data is mapped to AS categories using a combination of asset class, purpose code and location code. Any assets that do not fall into the Ofwat categories are consolidated into service specific overheads (water or sewerage). This approach enables the majority of asset data to be analysed to match the Ofwat AS categories. The water and sewerage overhead depreciation charges are then absorbed into the appropriate Ofwat categories on a percentage uplift basis. The Company’s AS fixed asset tables methodology remains unchanged compared to the prior year. The Company has changed its application of the capitalisation policy in respect of CSL replacement and relining of customer side pipes, see section 3.3.3 above. The following section tabulates the allocation assumptions used in the production of the AS tables reported in the regulatory accounts. Cost drivers are assigned to each asset classification and these are shown below: The following are the cost driver’s used for populating the asset related expenditure and depreciation lines. Cost Driver - A Is where direct costs can be attributed directly to the relevant AS business units.
Cost Driver – B In cases where the cost can be directly attributed to a service area (water, sewerage or retail) but a specific cost driver is then used to allocate the cost to the appropriate AS business unit within the service area.
Cost Driver – C In cases where the mapping is not direct, allocations are worked out using appropriate estimates and judgements based on available data and an understanding of the business.

Thames Water Utilities 2014 Methodology Statement AS tables
23
Table 14 below set out by line item the basis of allocations used to populate the tables. Table 14
Cost Driver
Allocation Basis Used
Water and Sewerage Service assets
A Direct using project purpose code and asset class/category.
Land A Direct using project purpose code and asset class/category.
Buildings and offices
A Direct using project purpose code and asset class/category.
Plant A Direct using project purpose code and asset class/category.
Fixtures and fittings
A Direct using project purpose code and asset class/category.
Retail IT systems A Direct using project purpose code and asset class/category.
Meters A Direct using project purpose code and asset class/category.
General and support
C Indirect as an uplift applied separately to water and sewerage.
6.2 Calculation of Current Cost Depreciation (“CCD”). The CCD is based on Modern Equivalent Asset (“MEA”) commissioned asset data. Current year commissioning data is based on asset records downloaded from SAP ECC Asset Management and General Ledger into Microsoft Excel. This data is consolidated with project level detail from SAP Project Systems to create an enhanced data set. The MEA commissioning data set includes commission date; gross book value; annual depreciation charge, asset class and AS analysis which is not available in Asset Management. This current year data is then incorporated with the prior year’s MEA commissioned data. This final data set is uploaded into Business Objects and analysed as detailed below, see ‘section 6.4’.
6.3 Analysis of Current Cost Fixed Asset Additions The current year fixed asset additions data is based on SAP Project Systems data downloaded into Microsoft Excel. This is then reconciled to SAP ECC to ensure the fixed asset spend for the year is accurate. This final data set is uploaded into Business Objects and analysed as detailed below, see ‘section 6.3’.
6.4 Business Objects Analysis The two data sets are analysed independently within Business Objects to enable the allocations to the AS units on the following basis: Wholesale The data is analysed in table 15 below: Table 15
Classification Asset field used Source
Water or Sewerage Purpose code SAP PS Infrastructure or Non-Infrastructure Asset class SAP Asset Module Base or Enhancement Asset category SAP PS
A second tier allocation to exact AS business unit is then performed based on Purpose Code (SAP PS).

Thames Water Utilities 2014 Methodology Statement AS tables
24
Retail The Location Code field is used to extract data relating to Customer Services which is then allocated to Retail. The additions and depreciation figures for Retail are derived from the sum of all assets with a “location code” e.g., for Walnut Court i.e. “WALNO1ZZ” plus a proportional allocation of the overhead. The allocation of retail assets between HH and NHH has also been reviewed by management to take into account the transfer of meter assets from retail to treated water distribution in the year ended 31 March 2013. In the prior period, Retail assets were allocated to HH and NHH using analysis of metered customers as the appropriate cost driver on the premise that the depreciation associated with domestic meters was main constituent of Retail’s depreciation charge. With the transfer of meters from Retail to treated water distribution during the prior period, using metered customers as the cost driver is no longer considered to be appropriate. Management now consider the most appropriate allocation of Retail assets should be based on the number of customer accounts. Table 16 below provides details of the assets reported within retail showing the closing net book value and current cost depreciation charged in the year. Table 16
Asset
Net book value
£m
Depreciation charged in the year
£m
Billing system 12.3 6.1 Land and buildings, fixtures and fittings, plant and machinery and other assets
42.3
3.0
Total 54.6 9.1
Retail assets do not have any amortisation of deferred credits arising from third party contributions on any of the assets reported in the above table. Additionally, Retail does not have any intangible assets and therefore there is no amortisation reported within retail. Overheads Assets that do not fall into the AS business units are consolidated into service specific overheads. The overhead data is then allocated across the AS business units on a percentage uplift basis. Non-Infra Base Additions As Non-Infrastructure Base expenditure is reported against “Additions” under “Gross replacement cost” for the year, their value is replicated in the disposals line on the assumption that they represent “like for like” replacements of existing non infrastructure assets. These costs do not represent an enhancement to the asset base so a corresponding and off-setting disposal is deemed to exist, i.e. this spend represents a “like for like” replacement of existing assets.

Thames Water Utilities 2014 Methodology Statement AS tables
25
7. Capitalisation Policy
7.1 General principles The Company’s Capitalisation Policy details the framework, principles and specific treatment for all capital expenditure within the Company.
This policy contains specific guidance on a number of areas. Where there is no guidance on a particular type of expenditure, the principles contained within the policy are to be used when ascertaining the appropriate accounting treatment. There has been no change in the policy in the reporting period. There has been a change in the application of the capitalisation policy, which is in respect of capitalising of CSL replacement and relining of customer side pipes as IRE, see section 3.3.3, page 6 for a full explanation. In addition, a number of local policies exist, which are consistent with the overall policy and provide further guidance to the business. The company adopts the following principles in relation to its capitalisation policy:
• Adherence to Accounting Standards, particularly FRS 15 ‘Tangible Fixed Assets’;
• Adherence to Regulatory Standards, particularly RAG 2 04 ‘Guideline for classification of Expenditure’,
• Where practicable, capital costs are directly attributed to projects;
• Where capital costs cannot be directly attributed to projects, these need to be allocated via a capital overhead mechanism;
• All capital expenditure is formally approved by an appropriate level of management as defined in the Company’s Schedule of Delegated Authorities policy.
7.2 General overheads
The Company recognises that elements of its Support services costs, whilst not directly attributable to individual projects, are actually incurred to sustain capital delivery. These costs can be characterised as expenditure that would have been avoided if the capital programme did not exist. Such costs are known internally as Design and Procurement General (D&PG). These costs are absorbed as a percentage of total capital cost. Exclusions are identified for those support costs where it is clear that the expenditure is of a specific nature that does not qualify for capitalisation, i.e. operational costs which are excluded from the D&PG percentage as detailed in the policy document.
7.3 Employee overheads Certain salary related costs attributable to the delivery of the capital programme are charged directly to capital projects through a time sheeting process. Such costs are primarily employee costs and associated indirect costs that arise as a result of having an engineering resource pool. The timesheet activity rates are reviewed annually.

Thames Water Utilities 2014 Methodology Statement AS tables
26
7.4 Internal verification The existence and completeness of capital expenditure is verified through robust reviews on a project basis at the Company’s Investment Committee. Investment papers are checked by the Capital Investment Team prior to their submission. The level of capital expenditure by business unit is reviewed at a monthly meeting chaired by the Asset Investment Director. There is regular monitoring of overheads recharged to capital and monthly reviews of capital spend. Specific Internal Audit reviews are performed as agreed with the Audit Committee to supplement the capital controls.
7.5 Processes and procedures in place to assess the continued appropriateness of the accounting policies. The capitalisation policy is reviewed on an annual basis. A refresh of the percentage of capitalisation of overheads by department has been performed in the current year.

Thames Water Utilities 2014 Methodology Statement AS tables
27
8 Year on year comparison of operating expenditure 8.1 Wholesale water Table 17
£m
2012/13 reported values 549.3 Impact of change in methodology of scientific services and regulation costs 1.1 Impact of inflation 15.9
2012/13 inflated to 2013/14 prices 566.3 Year on year movements: Lower hired and contractor costs within treated water distribution (14.6) Lower Environmental Authority abstraction charges (4.2) Increase power costs both volume and price 4.1 Lower general and support costs (2.6) Increased rates 16.7 Increase in IRC 34.1 Increase in current cost depreciation 9.1 Other operating cost movements (1.9)
2013/14 reported values 607.0
Commentary The lower hired and contractor costs of £14.6m is due to drought costs (£6.4m) incurred in the prior period, lower water production costs; the prior period included a one-off desalination write off (£2.1m) and lower water network costs (£6.1m). The increase in rates is principally within treated water distribution and reflects an increase in the allocation of cumulo rates to the water network. The increase in IRC is within treated water distribution (£23.0m) and within raw water distribution (£14.7m), reflecting the increase in IRE incurred in the maintenance and improvement of the Company’s water distribution network. These increases were partly offset by reduced IRC within water resources (£3.6m). Current cost depreciation in the year has increased by £9.1m reflecting the increased capital spend, particularly within treated water distribution (£7.3m)

Thames Water Utilities 2014 Methodology Statement AS tables
28
8.2 Wholesale sewerage Table 18
£m
2012/13 reported values 589.4 Impact of change in methodology of regulation costs 0.1 Impact of inflation 17.0
2012/13 inflated to 2013/14 prices 606.5 Year on year movements: Increased waste network costs largely due to wet weather event costs 12.1 Increase power costs both volume and price 5.9 Lower general and support costs (5.9) Lower rates (6.2) Reduction in IRC (10.2) Increase in current cost depreciation 20.9 Other operating cost movements (0.7)
2013/14 reported values 622.4
Commentary The increased waste network costs is principally due to wet weather event costs of £21.0m reflecting the exceptional level of rainfall earlier in the year and the additional tankering costs required to pump water from the sewer network. These costs are partly offset by increased network contractor costs of £7.6m incurred in the prior period. The reduction in IRC of £10.2m reflects the lower level of IRE within the sewerage network compared to the prior period. The increase in current cost depreciation of £20.9m is principally within sewage treatment (£12.0m) and sludge treatment (£6.7m) as the Company continually improves its treatment works.

Thames Water Utilities 2014 Methodology Statement AS tables
29
8.3 Retail Table 19
£m
2012/13 reported values 196.0 Impact of change in methodology of scientific services and regulation costs (1.2) Impact of inflation 5.2
2012/13 inflated to 2013/14 prices 200.0 Year on year movements: Lower bad debt charge (33.6) Increased Customer Services costs 7.8 Increased meter reading costs 2.5 Increase in local authority rates 0.6 Lower current cost depreciation (1.7) Other operating cost movements (0.1)
2013/14 reported values 175.5
Commentary The lower bad debt charge of £33.6m principally reflects the additional catch ups incurred in the prior period, to bring the bad debt provision in line with the level of cash collection. The increase in Customer Services costs of £7.8m include an increase in the number of customer network enquiries and complaints (£2.2m), where an engineer has visited to investigate the problem, but where it is found that it is not a network issue. This increase was primarily due to the exceptional level of rainfall earlier in the year and the consequential increase in the number of calls in respect of sewer flooding and blockages. Where subsequent visits by engineers have identified that the blockage has cleared, these costs have been recharged to Retail in accordance with Ofwat’s guidance. The remaining increase is due to higher staff costs, higher local authority and housing association costs, outsourcing and increased hired and contractor costs (£5.6m)
The increase in meter reading costs reflects the increase in the number of metered customers compared to the prior period.
The increase in local authority rates principally reflects a review of retail staff occupancy at Kemble Court, dealing with network customer enquiries and complaints.
The reduction in current cost depreciation reflects an increase in assets that are yet to be depreciated.
The following table details those cost included within the other operating expenditure caption within the Retail table shown on page 180 of the AR&A. Table 20
£m
Disconnections 0.1 Demand side water efficiency costs 0.7 Customer side leakage costs 4.8 General and support costs 16.5 Regulation costs 0.4 Other direct costs - Key account management support costs 0.4
2013/14 reported values 22.9

Thames Water Utilities 2014 Methodology Statement AS tables
30
Demand side water efficiency costs of £0.7m reflect the baseline expenditure transferred to retail from wholesale as outlined in table 11 above. In addition, a further £0.7m of enhanced expenditure was incurred, and in accordance with Ofwat’s PR14 guidance, this cost has been reported within treated water distribution within wholesale. It should be noted that total water efficiency costs were £2.1m, as detailed in the table 21 below: Table 21
£m
Baseline water efficiency costs reported in retail 0.7 Enhanced water efficiency costs reported in wholesale 0.7 General and support costs, including external affairs communication costs 0.1 Notional stock issue costs 0.6
2013/14 reported values 2.1
The notional stock issue costs of £0.6m reflect the value of water efficiency aids provided to customers free of charge during the year. The cost of the stock was written off in the period that the stock was purchased. This is in line with UKGAAP treatment, where the value of the stock was considered to be at zero value, as the stock was to be provided free of charge to customers, and therefore should not be held as stock within the balance sheet. The notional value of the stock provided to customers has been included in the above table for completeness.
9 Comparison of actual operating expenditure with Final Determination Water
£m Sewerage
£m Total
£m
Final determination allowance * 396.4 375.6 772.0 Less deficit repair payment included in above (10.5) (10.1) (20.6)
Final determination excluding deficit repair payment
385.9
365.5
751.4
Actual expenditure 387.8 394.9 782.7
Variance (1.9) (29.4) (31.3)
Analysis of variance Bad debt above the amount in the Final Determination
(15.0)
(4.2)
(19.2)
Traffic Management Act 4.8 0.8 5.6 Lower accrued pension costs 2.6 1.3 3.9 Rates 0.8 2.6 3.4 Wet weather event - (20.0) (20.0) Private sewers - (5.6) (5.6) S203 fine - (6.2) (6.2) Other 4.9 1.9 6.8
(1.9) (29.4) (31.3)
*Final determination includes cash pension costs, whereas the AS tables within the regulatory accounts include accrued pension costs in accordance with FRS 17.

Thames Water Utilities 2014 Methodology Statement AS tables
31
10 Further improvements The Company is continuing to develop a software solution that will enable costs to be split into both the AS and upstream services units, to be in place for reporting of regulatory financial information for the year ended 31 March 2015. This approach that the Company is undertaking is to ensure that we are able to meet the reporting requirements expected for reporting against Price Review (“PR14”) final determination. Whilst Ofwat have not outlined their Regulatory accounts reporting requirements for PR14, the Company, in using this software solution will be best placed to meet the challenges expected as we move into the next 5 year Asset Management period (“AMP6”) from 1 April 2015. As the reporting of upstream services also evolves, we need to ensure that we have the systems in place to provide accurate cost data and granularity including the appropriate cost driver information to enable meaningful comparison across the industry. The Company will continually review its methodology and assumptions used in producing both the AS and upstream services financial statements to ensure that they comply with Ofwat guidance, but also to provide meaningful management data to better inform the industry as the market is open to competition.