accurate qpcr measurements in biomedicine - … · qs with and without reverse transcription d c...
TRANSCRIPT

Accurate qPCR measurements in biomedicine
Jo Vandesompele professor, Ghent University co-founder and CEO, Biogazelle Institute for Research in Biomedicine, Barcelona November 23, 2012

Biogazelle is a qPCR/dPCR analysis & services company
Do you sometimes feel frustrated with scientific literature?
n important information is missing n primer sequences n DNAse treament n RNA quality control n experiment design and run layout n …
n lack of best practice n only 1 (non-validated) reference
gene n no assay validation (specificity,
efficiency) n statistics on linear data instead of
logarithmic transformed data n …
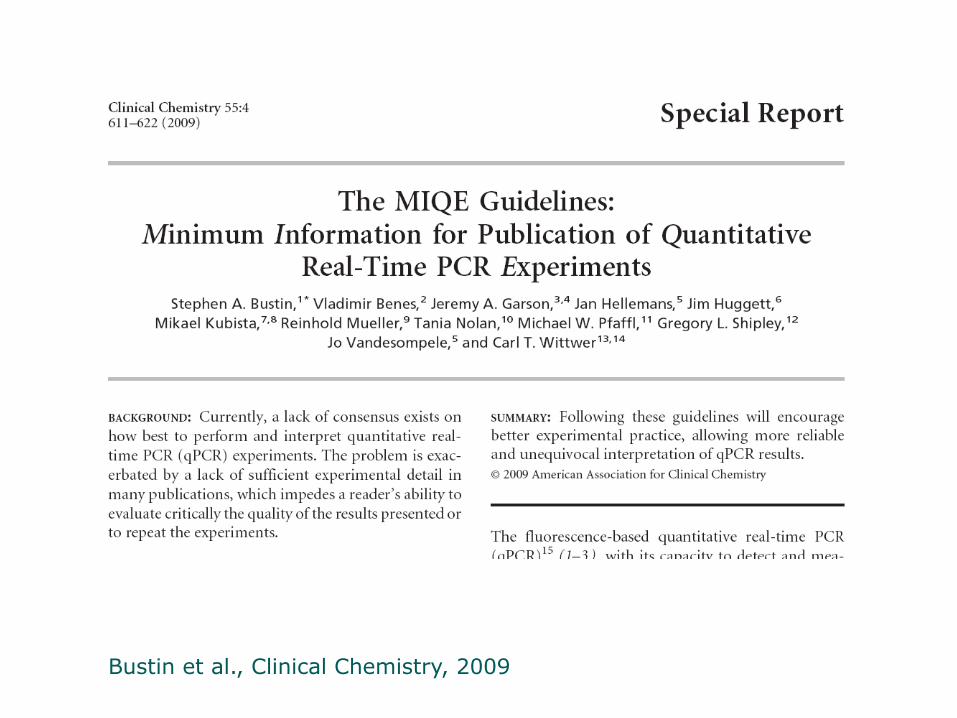
Bustin et al., Clinical Chemistry, 2009

The MIQE guidelines are summarized in a checklist
n qPCR community driven guidelines for essential and desired information in literature
n experimental design n sample n nucleic acid extraction n reverse transcription n target information n oligonucleotides n qPCR protocol n qPCR validation n data analysis
Table 1. MIQE checklist for authors, reviewers, and editors.a
Item to check Importance Item to check Importance
Experimental design qPCR oligonucleotides
Definition of experimental and control groups E Primer sequences E
Number within each group E RTPrimerDB identification number D
Assay carried out by the core or investigator’s laboratory? D Probe sequences Dd
Acknowledgment of authors’ contributions D Location and identity of any modifications E
Sample Manufacturer of oligonucleotides D
Description E Purification method D
Volume/mass of sample processed D qPCR protocol
Microdissection or macrodissection E Complete reaction conditions E
Processing procedure E Reaction volume and amount of cDNA/DNA E
If frozen, how and how quickly? E Primer, (probe), Mg2!, and dNTP concentrations E
If fixed, with what and how quickly? E Polymerase identity and concentration E
Sample storage conditions and duration (especially for FFPEb samples) E Buffer/kit identity and manufacturer E
Nucleic acid extraction Exact chemical composition of the buffer D
Procedure and/or instrumentation E Additives (SYBR Green I, DMSO, and so forth) E
Name of kit and details of any modifications E Manufacturer of plates/tubes and catalog number D
Source of additional reagents used D Complete thermocycling parameters E
Details of DNase or RNase treatment E Reaction setup (manual/robotic) D
Contamination assessment (DNA or RNA) E Manufacturer of qPCR instrument E
Nucleic acid quantification E qPCR validation
Instrument and method E Evidence of optimization (from gradients) D
Purity (A260/A280) D Specificity (gel, sequence, melt, or digest) E
Yield D For SYBR Green I, Cq of the NTC E
RNA integrity: method/instrument E Calibration curves with slope and y intercept E
RIN/RQI or Cq of 3" and 5" transcripts E PCR efficiency calculated from slope E
Electrophoresis traces D CIs for PCR efficiency or SE D
Inhibition testing (Cq dilutions, spike, or other) E r2 of calibration curve E
Reverse transcription Linear dynamic range E
Complete reaction conditions E Cq variation at LOD E
Amount of RNA and reaction volume E CIs throughout range D
Priming oligonucleotide (if using GSP) and concentration E Evidence for LOD E
Reverse transcriptase and concentration E If multiplex, efficiency and LOD of each assay E
Temperature and time E Data analysis
Manufacturer of reagents and catalogue numbers D qPCR analysis program (source, version) E
Cqs with and without reverse transcription Dc Method of Cq determination E
Storage conditions of cDNA D Outlier identification and disposition E
qPCR target information Results for NTCs E
Gene symbol E Justification of number and choice of reference genes E
Sequence accession number E Description of normalization method E
Location of amplicon D Number and concordance of biological replicates D
Amplicon length E Number and stage (reverse transcription or qPCR) of technical replicates E
In silico specificity screen (BLAST, and so on) E Repeatability (intraassay variation) E
Pseudogenes, retropseudogenes, or other homologs? D Reproducibility (interassay variation, CV) D
Sequence alignment D Power analysis D
Secondary structure analysis of amplicon D Statistical methods for results significance E
Location of each primer by exon or intron (if applicable) E Software (source, version) E
What splice variants are targeted? E Cq or raw data submission with RDML D
a All essential information (E) must be submitted with the manuscript. Desirable information (D) should be submitted if available. If primers are from RTPrimerDB,information on qPCR target, oligonucleotides, protocols, and validation is available from that source.
b FFPE, formalin-fixed, paraffin-embedded; RIN, RNA integrity number; RQI, RNA quality indicator; GSP, gene-specific priming; dNTP, deoxynucleoside triphosphate.c Assessing the absence of DNA with a no–reverse transcription assay is essential when first extracting RNA. Once the sample has been validated as DNA free,
inclusion of a no–reverse transcription control is desirable but no longer essential.d Disclosure of the probe sequence is highly desirable and strongly encouraged; however, because not all vendors of commercial predesigned assays provide this
information, it cannot be an essential requirement. Use of such assays is discouraged.
MIQE Guidelines for qPCR Special Report
Clinical Chemistry 55:4 (2009) 613

Critical factors contributing to accurate RT-qPCR results
Derveaux et al., Methods, 2010

Full text papers available on Biogazelle website
http://www.biogazelle.com

Weekly qPCR tips and tricks via Twitter
https://twitter.com/Biogazelle @Biogazelle

RNA sample quality is determined by its integrity & purity
n purity n SPUD assay n UV-VIS spectrophotometer (260:280 > insensitive + stable pH!)
n integrity n microfluidic electrophoresis n 5’-3’ mRNA ratio assay
n part of the MIQE checklist
n conflicting conclusions in the literature n RNA degradation can be rescued by normalization n RNA integrity has substantial impact on results
n aims of this study n evaluate existing and new RNA QC parameters n develop framework for
o assessing the impact of RNA quality on RT-qPCR results o evaluating the relative performance of RNA QC parameters

RNA purity assessment using the SPUD assay
n spiking of synthetic sequence lacking homology with any known human sequence into RNA
SPUD +
H2O
SPUD +
heparin
SPUD +
RNA1
SPUD +
RNA2
SPUD +
RNA3
Cq 22 Cq 27 Cq 22 Cq 25 Cq 22
ΔCq > 1: presence of inhibitors
------------RT-qPCR-----------
Nolan et al., Anal Biochem, 2006

RNA integrity assessment using 5’-3’ mRNA assay
n universally expressed low abundant reference (HPRT1) n anchored oligo(dT) reverse transcription (iScript select)
AAAAAA 5’ 3’
Cq 5’ Cq 3’
increasing delta-Cq values upon artificial RNA degradation

RNA integrity assessment using 5’-3’ mRNA assay
n universally expressed low abundant reference (HPRT1) n anchored oligo(dT) reverse transcription (iScript select)
AAAAAA 5’ 3’
Cq 5’ Cq 3’
decreasing RQI values upon artificial RNA degradation
RQI 10.0 RQI 10.0 RQI 9.0 RQI 6.8

impact of RNA quality on results
most stable
least stable
low low high high quality
RNA quality has impact on reference gene stability ranking
Perez-Novo et al., Biotechniques, 2005

sample group size
refe
renc
e ge
ne v
aria
tion
low quality
high quality
50
Degraded RNA is characterized by more expression noise
Vermeulen et al., Nucleic Acids Research, 2011

sample group size
refe
renc
e ge
ne v
aria
tion
low quality
high quality
Vermeulen et al., Nucleic Acids Research, 2011
Degraded RNA is characterized by more expression noise
50

impact of RNA quality on results
sample group size
sign
ifica
ne (
-10l
og p
-val
ue)
low quality
high quality
50
p=0.05
Intact RNA delivers more significant results
Vermeulen et al., Nucleic Acids Research, 2011

Impact of RNA quality on multigene classification of cancer patients
impact on risk classification performance
clear difference in sensitivity/specificity
PPV/NPV accuracy
multi < single gene level
59 < 6 genes
correlation < PAM analysis
multivariate logistic regression analysis
HPRT1 5’-3’ dCq OR 4.65 (95% CI:
1.19-18.18) normalisation factor
OR 17.86 (95%CI: 4.17-76.92)
predict cancer patient survival
prognostic classifier

Impact of RNA quality on multigene classification of cancer patients
impact on risk classification performance
clear difference in sensitivity/specificity
PPV/NPV accuracy
multi < single gene level
59 < 6 genes
correlation < PAM analysis
multivariate logistic regression analysis
HPRT1 5’-3’ dCq OR 4.65 (95% CI:
1.19-18.18) normalisation factor
OR 17.86 (95%CI: 4.17-76.92)
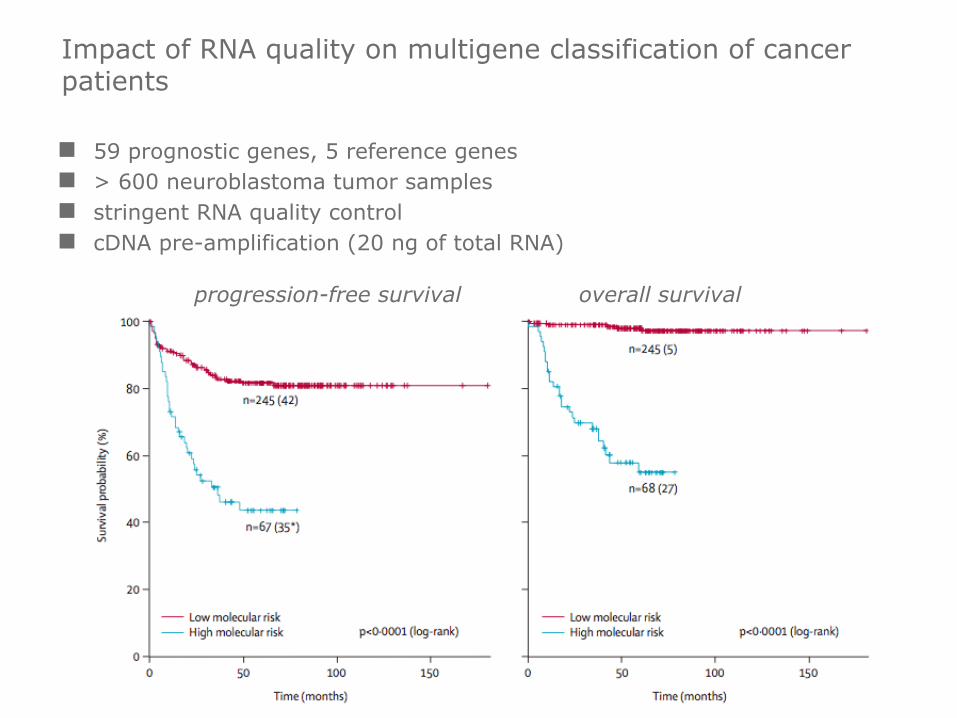
Impact of RNA quality on multigene classification of cancer patients
n 59 prognostic genes, 5 reference genes n > 600 neuroblastoma tumor samples n stringent RNA quality control n cDNA pre-amplification (20 ng of total RNA)
progression-free survival overall survival

Impact of RNA quality on multigene classification of cancer patients
n 59 prognostic genes, 5 reference genes n > 600 neuroblastoma tumor samples n stringent RNA quality control n cDNA pre-amplification (20 ng of total RNA)

Determination of RNA quality control cutoff requires work
n depends on various factors n method (RT-qPCR, microarray, RNA-sequencing) n expression difference of the target(s) n abundance of the target(s) n stability of the target(s) n size of the amplicon n sample material (fresh frozen vs. FFPE) n application: single gene study vs. multi-gene classification signature
n pilot experiment is needed with positive and negative controls to establish minimal acceptable RNA quality

Conclusions
n measurable impact of RNA quality n on variation of reference genes n on significance of differential expression of biomarker genes n on risk classification performance using a multigene signature
n the HPRT1 5’-3’ delta-Cq quality parameter and normalization factor appear to have the largest influence on the qPCR expression results
n measuring RNA quality is of critical importance to obtain accurate gene expression data
n pilot studies to establish a quality cut-off are needed

Further reading
n Vermeulen et al., Nucleic Acids Research, 2011

Good experiment design is key
n very important to achieve biologically meaningful and statistically significant results
n often underestimated or neglected part of the workflow
n power analysis define number and type of replicates (technical vs. biological), control and reference samples, and genes
n choose run layout n sample maximization n gene maximization n perform inter-run calibration if needed
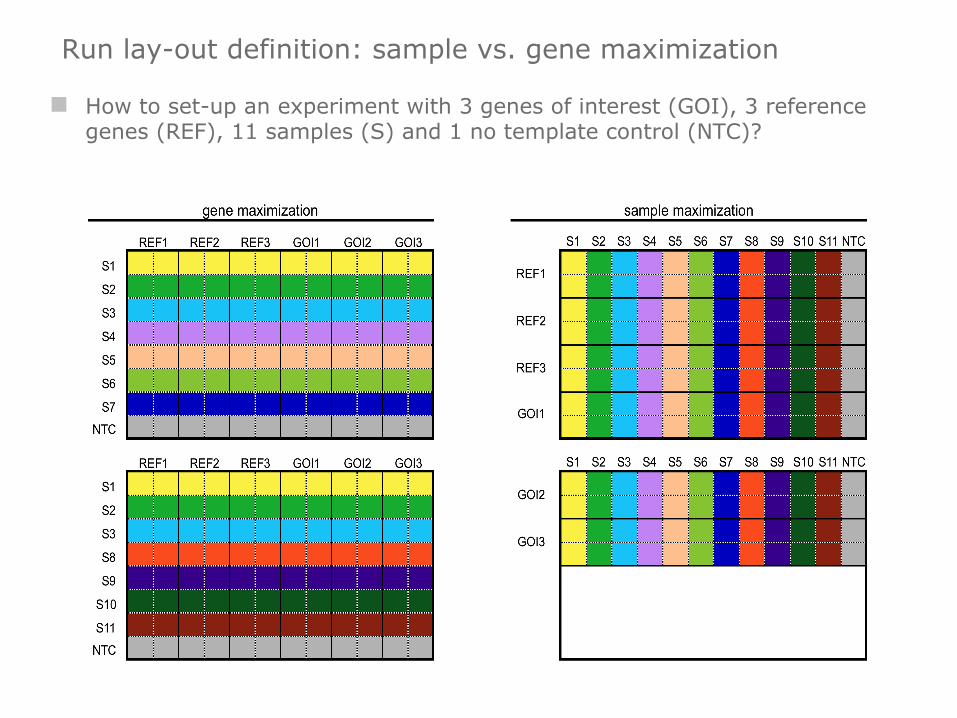
Run lay-out definition: sample vs. gene maximization
n How to set-up an experiment with 3 genes of interest (GOI), 3 reference genes (REF), 11 samples (S) and 1 no template control (NTC)?

Run lay-out definition: sample vs. gene maximization
n sample maximization is to be preferred n no increase in variation due to absence of inter-run variation n more cost-effective (fewer reactions) n easier to set-up (make master mix only once) n suitable for retrospective studies and controlled experiments
n gene maximization n introduces (under-estimated) inter-run variation n applicable for prospective studies or large studies in which the number
of samples do not fit on the plate anymore n inter-run variation can be measured and corrected for using inter-run
calibrators (IRC)

Inter-run calibration corrects inter-run differences
n possible on two levels n Cq values n normalized relative quantities
o greater flexibility o fewer calculations
n rules for inter-run calibration
n the more inter-run calibrators, the better n use the same set of inter-run calibrators in all runs n measure all genes in the inter-run calibrators
n specialised software is needed (e.g. qbasePLUS)


Why do we need normalization?
n 2 sources of variation in gene expression results n biological variation (true fold changes) n experimentally induced variation (noise and bias)
n purpose of normalization is removal or reduction of the experimental variation n input quantity: RNA quantity, cDNA synthesis efficiency, … n (input quality: RNA integrity, RNA purity, …)

Various normalisation strategies have been proposed
Huggett et al., Genes and Immunity, 2005
The use of reference genes (housekeeping genes) is the most universal and most appropriate method for normalization.

Candidate reference gene expression levels fluctuate
n RT-qPCR analysis of 5 reference genes (belonging to different functional and abundance classes) on 7 normal human blood samples
0
1
2
3
4
ACTB HMBS HPRT1 TBP UBC
A B C D E F G
15 fold difference between A and B if normalized by a single non-validated reference gene (ACTB or HMBS)

the geNorm solution to the normalisation problem
n framework for qPCR gene expression normalisation using the reference gene concept n quantified errors related to the use of a single reference gene
(> 3 fold in 25% of the cases; > 6 fold in 10% of the cases) n developed a robust algorithm for assessment of expression stability of
candidate reference genes n proposed the geometric mean of multiple reference genes for accurate
and reliable normalisation
n Vandesompele et al., Genome Biology, 2002

geNorm M value is an expression stability parameter
n pairwise variation V (between any 2 candidate reference genes) n gene stability measure M
average pairwise variation V of a given reference gene with all other candidate reference genes
n iterative procedure of removing the worst reference gene followed by
recalculation of M-values
gene A gene B
sample 1 a1 b1 log2(a1/b1) sample 2 a2 b2 log2(a2/b2) sample 3 a3 b3 log2(a3/b3) … … … … sample n an bn log2(an/bn)
standard deviation = V

n ranking of candidate reference genes according to their stability n determination of how many genes are required for reliable normalization
geNorm analysis is straightforward and helps you on 2 levels
http://www.genorm.info

Calculation of a sample specific normalization factor as the geometric mean of the reference genes
n controls for outliers n compensates for differences in expression level between the
reference genes
geometric mean = (a x b x c) 1/3
arithmetic mean = a + b + c
3

NF
ACTB HMBS HPRT1 TBP UBC
Geometric averaging is robust (insensitive to outliers)

Hoebeeck et al., Int J Cancer, 2006
The use of multiple reference genes for normalization gives statistically more significant results
Kaplan-Meier cancer patient survival curve
log rank statistics
0.003
NF4
0.006 0.021 0.023 0.056
NF1

Hellemans et al., Nature Genetics, 2004
n patient / control n 3 independent experiments n 95% confidence intervals
The use of multiple reference genes for normalization enables accurate measurement of small expression differences
LEMD3 levels drop to 50% in patient with NMD

geNorm is the de facto standard for reference gene validation and normalization
n > 5 200 citations of the geNorm technology n > 15 000 geNorm software downloads in 100 countries

Large and active geNorm discussion community
> 1000 members, almost 2000 posts
http://tech.groups.yahoo.com/group/genorm/

genormPLUS is a much improved version built into qbasePLUS
classic geNorm
improved geNorm
platform Excel Windows
qbasePLUS Win, Mac, Linux
speed 1x 20x
expert interpretation + report - +
ranking best 2 genes - +
handling missing data - +
raw data (Cq) as input - +

genormPLUS result interpretation is easy
n expert report without need to understand formulas n time saver n higher confidence in the results

Tips and tricks
n expression levels of reference gene and gene of interest do not need to be similar
n no need to measure reference genes in the same run (plate) as genes of interest
n geNorm pilot experiment can fit in a single 96-well plates n 10 representative samples x 8 candidate reference genes (no replicates, no controls, no standard curve) n results that can be used in the future if experimental conditions do not
change n at least 2 reference genes are needed
n quality control of the expression stability and normalization factor n more accurate results
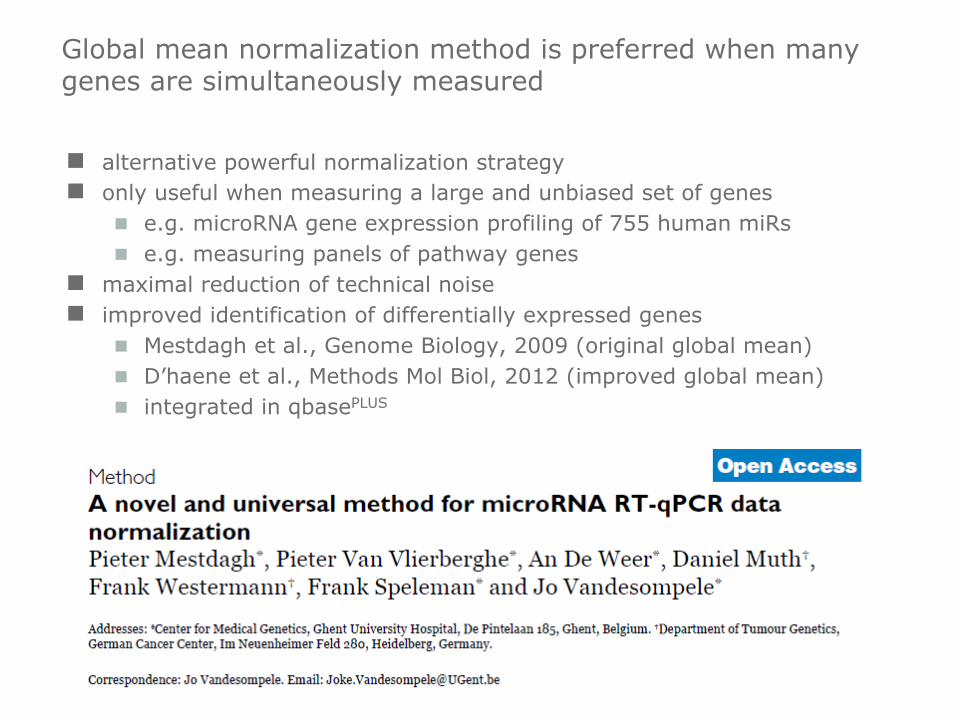
Global mean normalization method is preferred when many genes are simultaneously measured
n alternative powerful normalization strategy n only useful when measuring a large and unbiased set of genes
n e.g. microRNA gene expression profiling of 755 human miRs n e.g. measuring panels of pathway genes
n maximal reduction of technical noise n improved identification of differentially expressed genes
n Mestdagh et al., Genome Biology, 2009 (original global mean) n D’haene et al., Methods Mol Biol, 2012 (improved global mean) n integrated in qbasePLUS
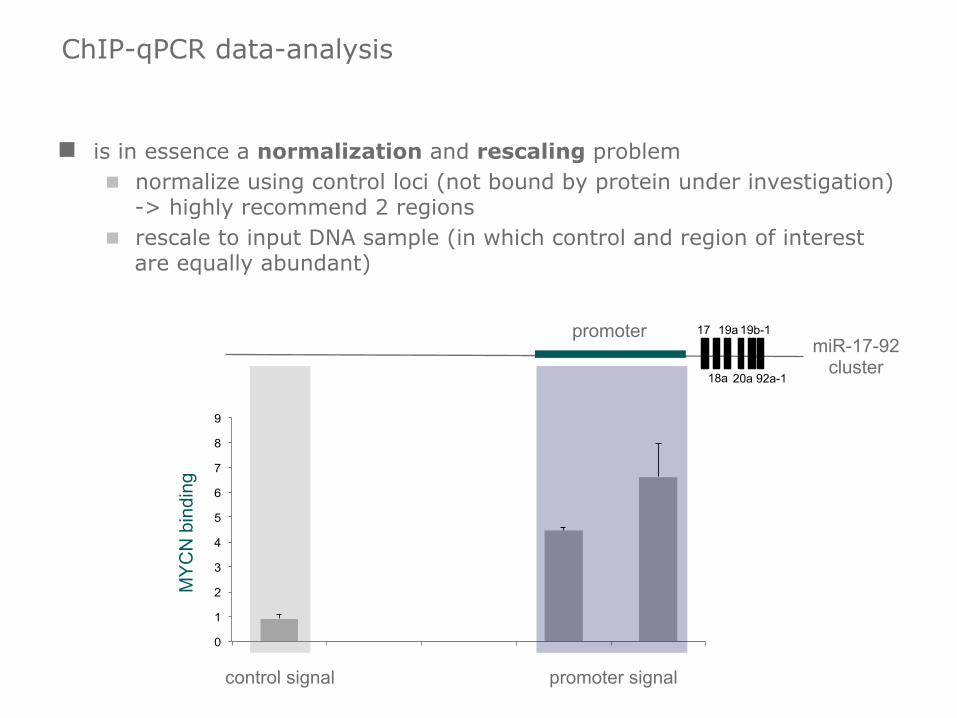
ChIP-qPCR data-analysis
n is in essence a normalization and rescaling problem n normalize using control loci (not bound by protein under investigation)
-> highly recommend 2 regions n rescale to input DNA sample (in which control and region of interest
are equally abundant)
0
1
2
3
4
5
6
7
8
9
���������������%#$�"
������
��
���
���
���
����
�������� '
� �#�"&�$� �
!���#����#
�����
�������
�������
�������
�� �
miR-17-92 cluster
promoter
MY
CN
bin
ding
promoter signal control signal

ChIP-qPCR data-analysis
n is in essence a normalization and rescaling problem n normalize using control loci (not bound by protein under investigation)
-> highly recommend 2 regions n rescale to input DNA sample
n Biogazelle > resources > presentations > 2011 n http://www.biogazelle.com/posters/20110328_ChIP_qPCR.pdf
n Mestdagh et al., Genome Biology, 2009


How can I extract meaningful biological information from qPCR data?

How can I extract meaningful biological information from qPCR data?
n error bars that make sense and provide confidence in the results
n differences that are meaningful and explain the phenotype or mechanism under investigation

qPCR data-analysis witnessed 3 generations of quantification models
NRQ = 2ΔΔCq
NRQ =Egoi
ΔCq,goi
ErefΔCq,ref
NRQ =Egoi
ΔCq,goi
∏i
nErefi
ΔCq,refin
n Livak and Schmittgen (2001) n 100% PCR efficiency n 1 reference gene
n Pfaffl (2001)
n adjusted PCR efficiency n 1 reference gene
n Hellemans et al. (2007) - qbasePLUS n adjusted PCR efficiency n multiple reference genes n error propagation rules

qBase is a state-of-the-art quantification model with error propagation

The qBase paper is cited more than 600 times
Hellemans et al., Genome Biology, 2007

n based on Ghent University’s geNorm and qBase technology n from single 96-well up to hundreds of 384-well plates n multiple reference genes for accurate normalization n detection and correction of inter-run variation n error propagation (confidence in your results) n biostatistics wizard
qbasePLUS is most powerful, flexible and user-friendly real-time PCR data-analysis software
http://www.qbaseplus.com

qbasePLUS is the only 3rd party qPCR data-analysis software that is MIQE and RDML compliant
n RDML universal file format compatible n peer-reviewed data-analysis algorithms
n multiple reference gene normalization n global mean normalization n inter-run calibration n error propagation
n assay information n data quality control
n reference gene stability analysis n NTC analysis n PCR efficiency calculation n replicate variability assessment

How to get qbasePLUS?
n basic license n no high-throughput features n no biostatistics n expires after 1 year
n premium license n powerful high-throughput features n copy number variant analysis n biostatistics n everlasting license
n promotion until the end of year n premium license at 45% discount
http://t.co/eA2OGKgn
Summary
n take home message: Accurate qPCR analysis relies on validation at each step of the workflow
n critical MIQE factors contributing to accurate qPCR results
n RNA quality n reference gene normalization n experiment design n data-analysis n standardized reporting (MIQE & RDML)
n Derveaux et al., Methods, 2010
How to do successful gene expression analysis using real-time PCR

Acknowledgments
n UGent n Joëlle Vermeulen n Stefaan Derveaux n Pieter Mestdagh n Filip Pattyn n Steve Lefever n Katleen De Preter n Frank Speleman
n Biogazelle n Barbara D’haene n Jan Hellemans n Gaëlle Van Severen
n RDML consortium n MIQE consortium