achieve data profile: pennsylvania april 2006. 2 american diploma project network the big picture n...
TRANSCRIPT

Achieve Data Profile:Pennsylvania
April 2006

2AMERICAN DIPLOMA PROJECT NETWORK
The Big Picture
To be successful in today’s economy, all students will need education and training that go beyond the high school diploma.
How successful is your state in moving students successfully through the education pipeline?
NOTE: All figures in this presentation are rounded to the nearest percent. Rounding errors may occur when figures are compared. Also please note that all bar graphs that are empty or labeled #N/A are not available due to non-participation or small sample size.
3AMERICAN DIPLOMA PROJECT NETWORK
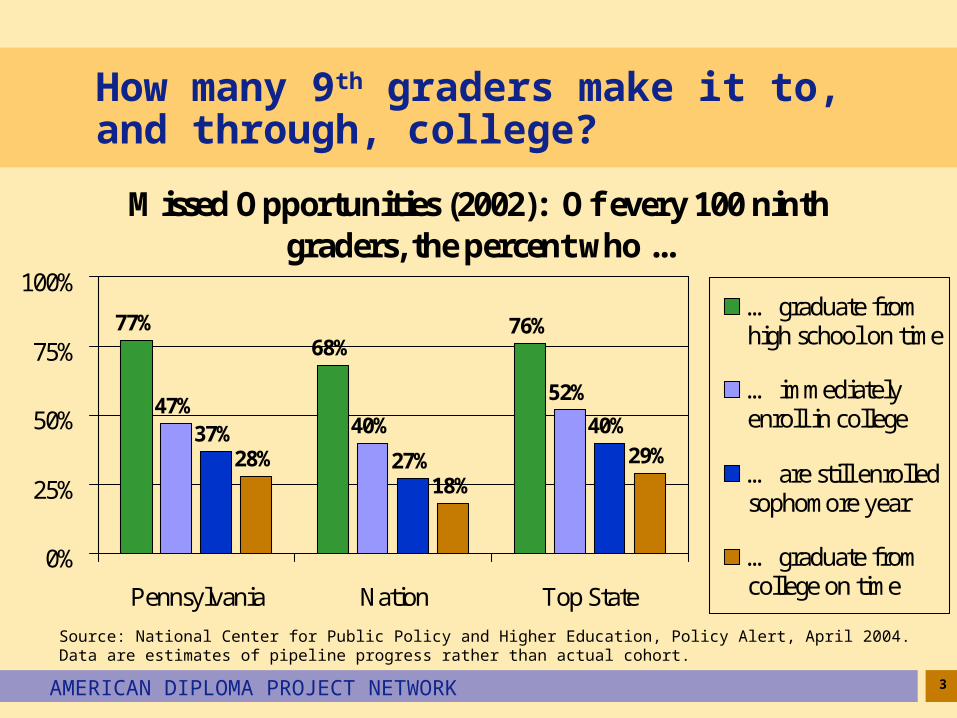
How many 9th graders make it to, and through, college?
Missed Opportunities (2002): Of every 100 ninth graders, the percent who ...
77%68%
76%
40%
52%
27%
40%
18%29%
47%37%
28%
0%
25%
50%
75%
100%
Pennsylvania Nation Top State
… graduate fromhigh school on time
… immediatelyenroll in college
… are still enrolledsophomore year
… graduate fromcollege on time
Source: National Center for Public Policy and Higher Education, Policy Alert, April 2004. Data are estimates of pipeline progress rather than actual cohort.
4AMERICAN DIPLOMA PROJECT NETWORK
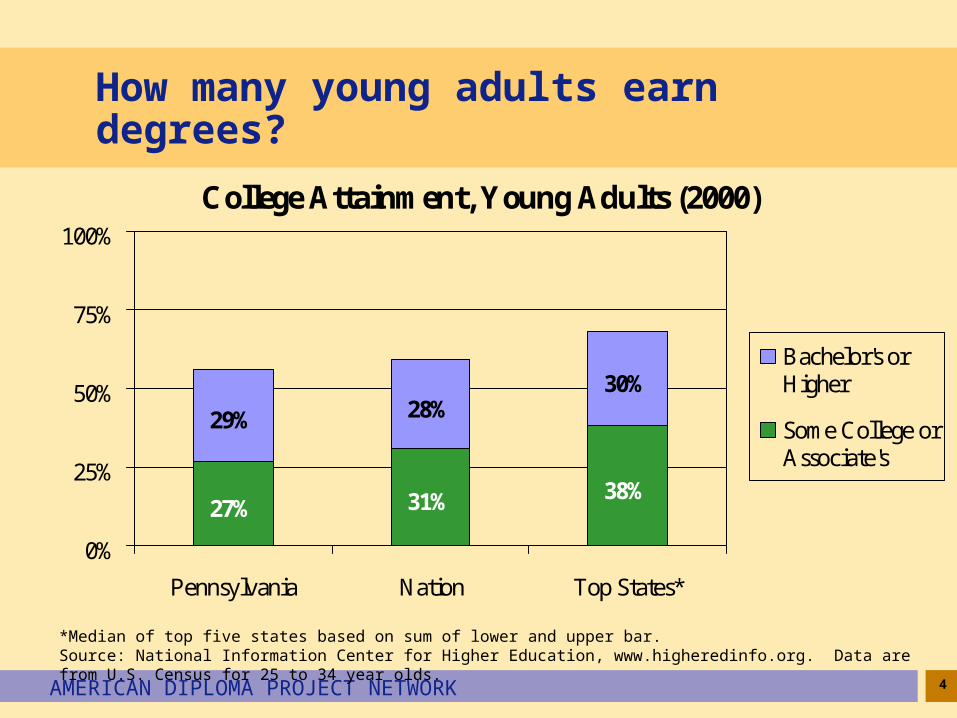
How many young adults earn degrees?
College Attainment, Young Adults (2000)
27% 31% 38%
29% 28%30%
0%
25%
50%
75%
100%
Pennsylvania Nation Top States*
Bachelor's orHigher
Some College orAssociate's
*Median of top five states based on sum of lower and upper bar.Source: National Information Center for Higher Education, www.higheredinfo.org. Data are from U.S. Census for 25 to 34 year olds.
5AMERICAN DIPLOMA PROJECT NETWORK
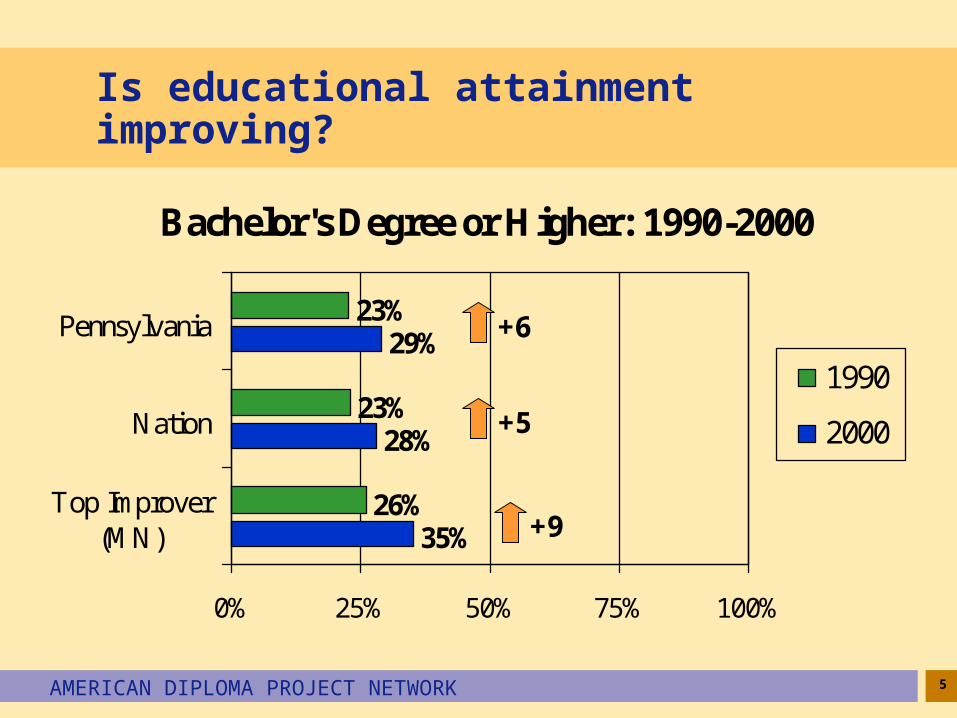
Is educational attainment improving?
Bachelor's Degree or Higher: 1990-2000
35%
28%
29%
26%
23%
23%
0% 25% 50% 75% 100%
Top Improver(MN)
Nation
Pennsylvania
1990
2000
+9
+5
+6
6AMERICAN DIPLOMA PROJECT NETWORK
Elementary School - Assessments
The National Assessment of Educational Progress (NAEP) is a common test taken by a sample of students in every state, making it a reliable yardstick for comparing achievement through elementary school.
Comparing the percentage of 4th graders scoring at or above Proficient on NAEP with those deemed proficient on state tests reveals a much lower proficiency standard on most state tests.
7AMERICAN DIPLOMA PROJECT NETWORK
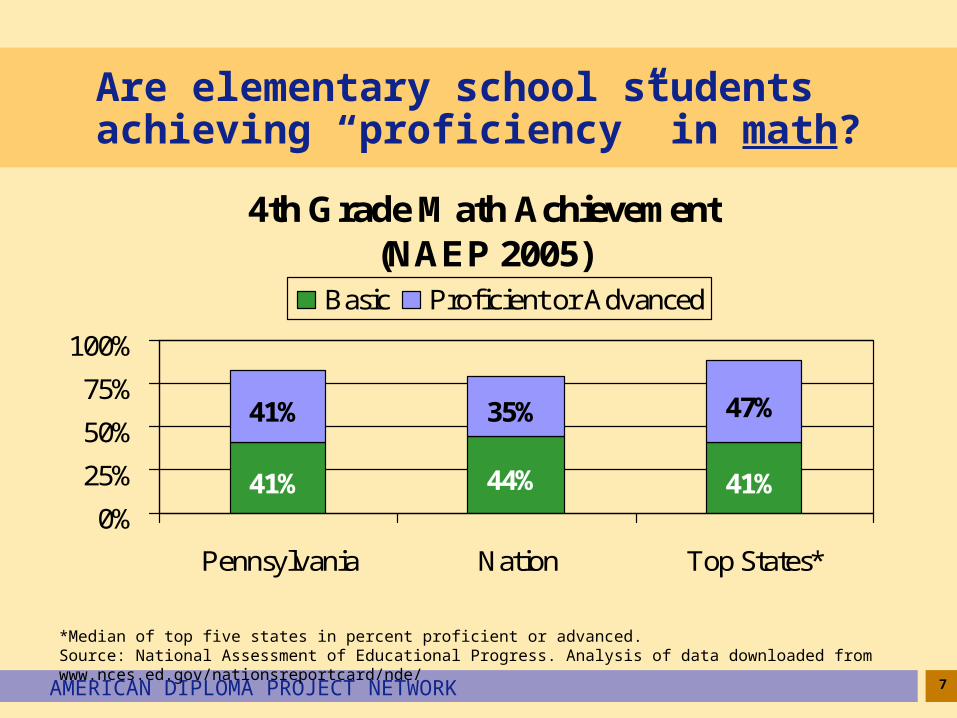
Are elementary school students achieving “proficiency” in math?
4th Grade Math Achievement(NAEP 2005)
41% 44% 41%
41% 35% 47%
0%
25%
50%
75%
100%
Pennsylvania Nation Top States*
Basic Proficient or Advanced
*Median of top five states in percent proficient or advanced. Source: National Assessment of Educational Progress. Analysis of data downloaded from www.nces.ed.gov/nationsreportcard/nde/
8AMERICAN DIPLOMA PROJECT NETWORK
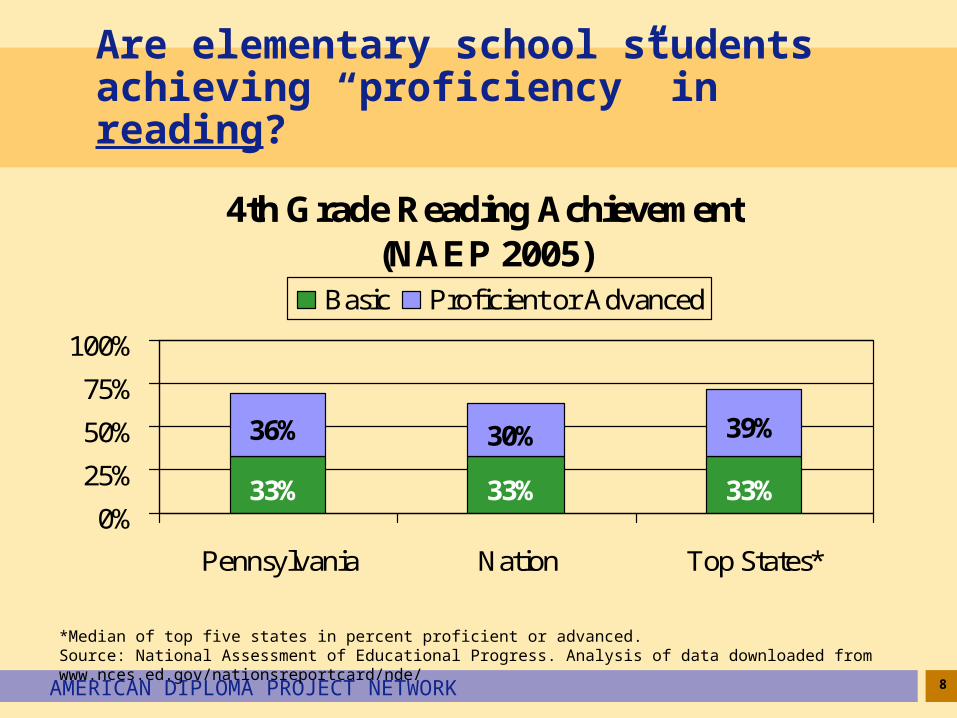
Are elementary school students achieving “proficiency” in reading?
4th Grade Reading Achievement(NAEP 2005)
33% 33% 33%
36% 30% 39%
0%
25%
50%
75%
100%
Pennsylvania Nation Top States*
Basic Proficient or Advanced
*Median of top five states in percent proficient or advanced. Source: National Assessment of Educational Progress. Analysis of data downloaded from www.nces.ed.gov/nationsreportcard/nde/
9AMERICAN DIPLOMA PROJECT NETWORK
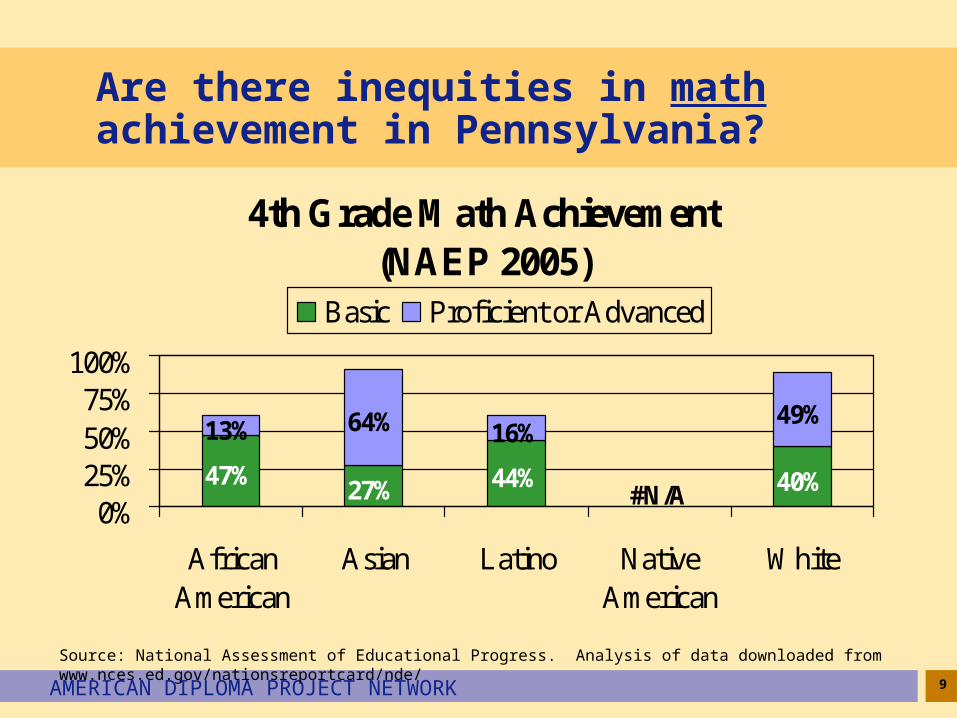
Are there inequities in math achievement in Pennsylvania?
4th Grade Math Achievement(NAEP 2005)
47%27% 44% 40%
13% 64% 16%49%
#N/A0%
25%50%75%
100%
AfricanAmerican
Asian Latino NativeAmerican
White
Basic Proficient or Advanced
Source: National Assessment of Educational Progress. Analysis of data downloaded from www.nces.ed.gov/nationsreportcard/nde/
10AMERICAN DIPLOMA PROJECT NETWORK
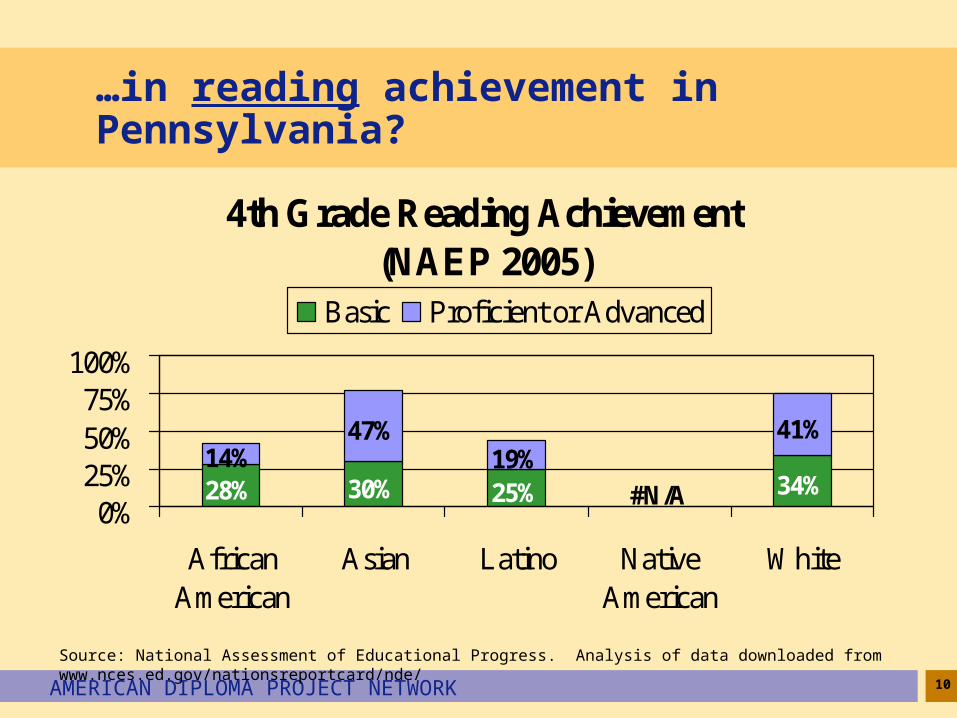
…in reading achievement in Pennsylvania?
4th Grade Reading Achievement(NAEP 2005)
28% 30% 25% 34%14%
47%19%
41%
#N/A0%
25%50%75%
100%
AfricanAmerican
Asian Latino NativeAmerican
White
Basic Proficient or Advanced
Source: National Assessment of Educational Progress. Analysis of data downloaded from www.nces.ed.gov/nationsreportcard/nde/

11AMERICAN DIPLOMA PROJECT NETWORK
Is there a gap between achievement on state assessments and NAEP?
4th Grade Achievement on State Assessment v. NAEP (2005)
#N/A#N/A41%36%
0%
25%
50%
75%
100%
Reading Proficient Math Proficient
Pennsylvania NAEP
Source: National Assessment of Educational Progress. Analysis of data downloaded from www.nces.ed.gov/nationsreportcard/nde/ and 2005 Pennsylvania System of School Assessment (PSSA) results at www.pde.state.pa.us/a_and_t/cwp/view.asp?A=3&Q=115510. No 4th grade test in 2005.
12AMERICAN DIPLOMA PROJECT NETWORK
Middle School
Students who take challenging courses and meet high standards in middle school are much more likely to enter high school ready to succeed.
Algebra is widely recognized as a “gateway” course—students who take it by the end of 8th grade are much more likely to take rigorous courses in high school that lead to a college degree.
13AMERICAN DIPLOMA PROJECT NETWORK
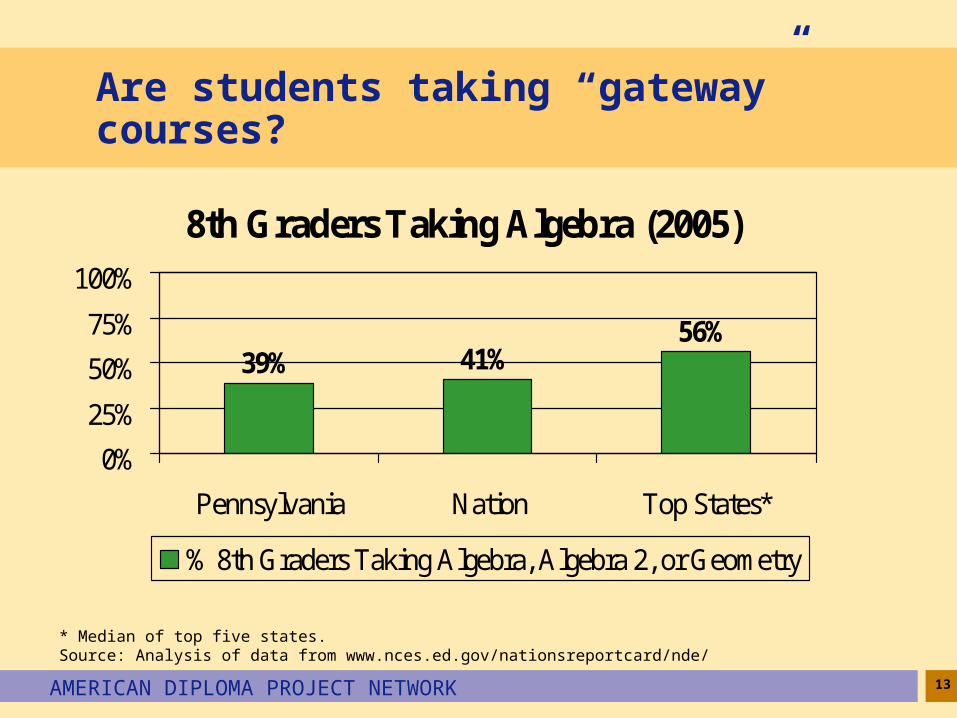
Are students taking “gateway” courses?
8th Graders Taking Algebra (2005)
56%41%39%
0%
25%
50%
75%
100%
Pennsylvania Nation Top States*
% 8th Graders Taking Algebra, Algebra 2, or Geometry
* Median of top five states.Source: Analysis of data from www.nces.ed.gov/nationsreportcard/nde/
14AMERICAN DIPLOMA PROJECT NETWORK
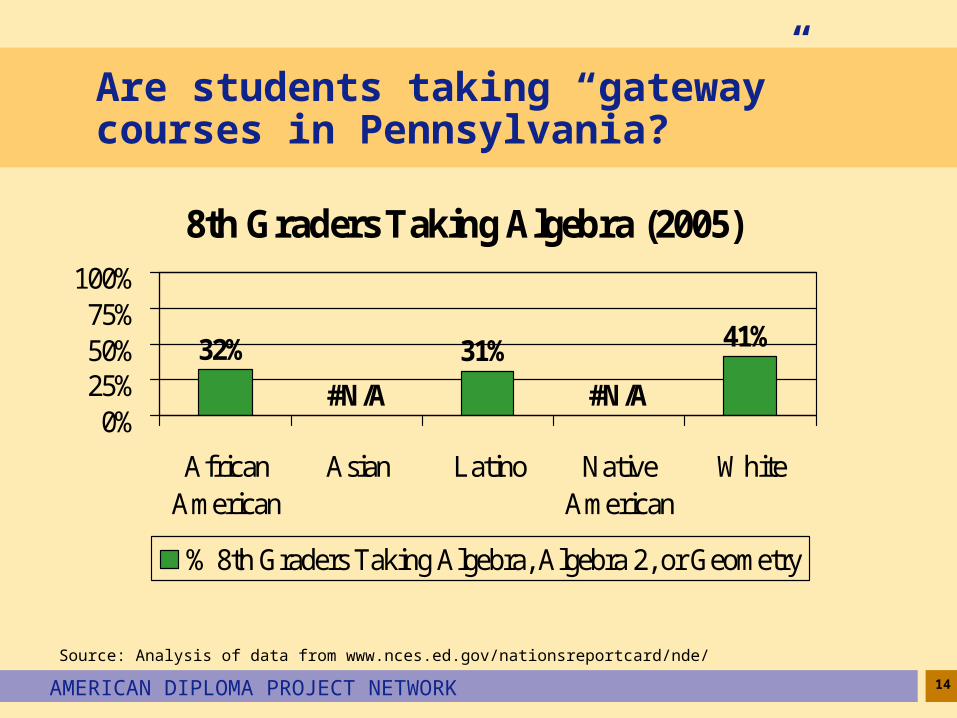
Are students taking “gateway” courses in Pennsylvania?
8th Graders Taking Algebra (2005)
41%
#N/A
31%
#N/A
32%
0%25%50%75%
100%
AfricanAmerican
Asian Latino NativeAmerican
White
% 8th Graders Taking Algebra, Algebra 2, or Geometry
Source: Analysis of data from www.nces.ed.gov/nationsreportcard/nde/
15AMERICAN DIPLOMA PROJECT NETWORK
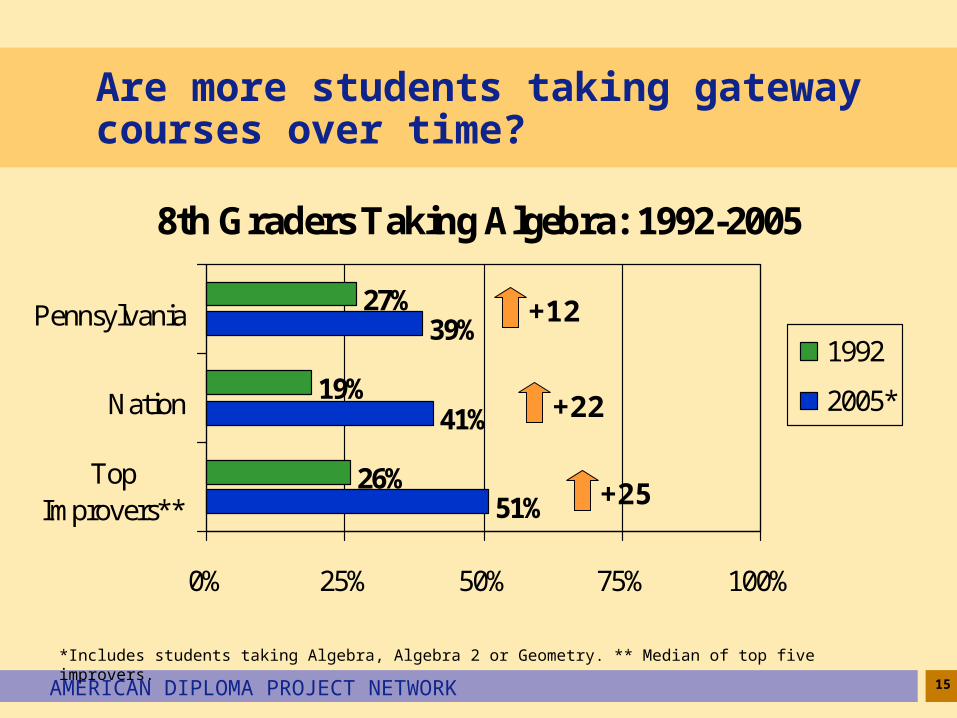
Are more students taking gateway courses over time?
8th Graders Taking Algebra: 1992-2005
51%
41%
39%
26%
19%
27%
0% 25% 50% 75% 100%
TopImprovers**
Nation
Pennsylvania
1992
2005*
+25
+22
+12
*Includes students taking Algebra, Algebra 2 or Geometry. ** Median of top five improvers.
16AMERICAN DIPLOMA PROJECT NETWORK
Middle School – Assessments
The National Assessment of Educational Progress (NAEP) is a common test taken by a sample of students in every state, making it a reliable yardstick for comparing achievement through middle school.
Comparing the percentage of 8th graders scoring at or above Proficient on NAEP with those deemed proficient on state tests reveals a much lower proficiency standard on most state tests.
17AMERICAN DIPLOMA PROJECT NETWORK
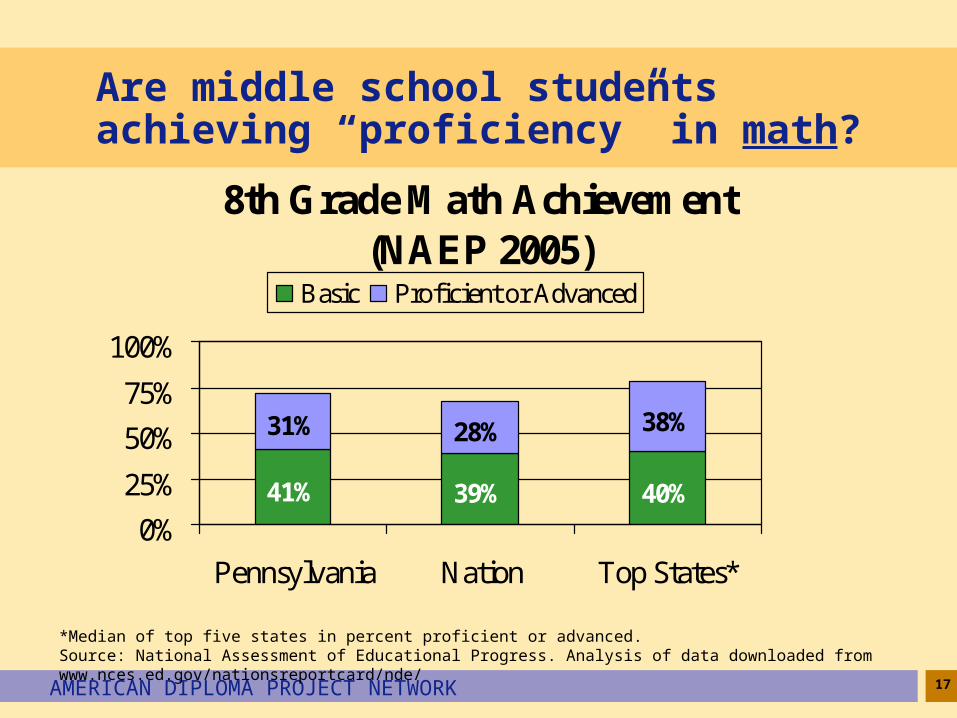
Are middle school students achieving “proficiency” in math?
8th Grade Math Achievement (NAEP 2005)
40%
31% 28% 38%
39%41%
0%
25%
50%
75%
100%
Pennsylvania Nation Top States*
Basic Proficient or Advanced
*Median of top five states in percent proficient or advanced. Source: National Assessment of Educational Progress. Analysis of data downloaded from www.nces.ed.gov/nationsreportcard/nde/
18AMERICAN DIPLOMA PROJECT NETWORK
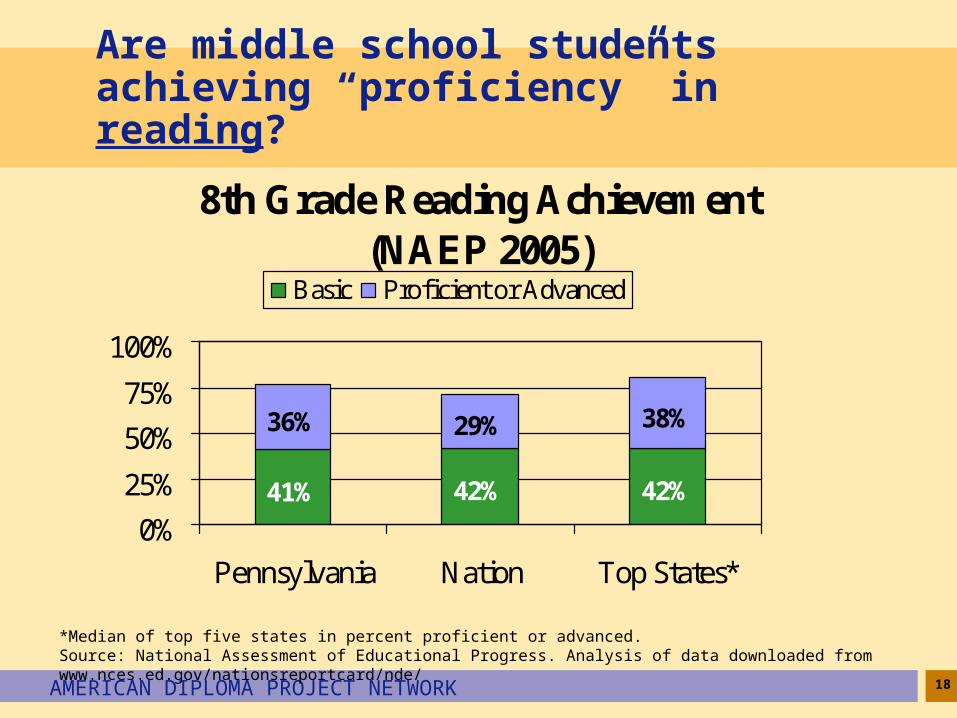
Are middle school students achieving “proficiency” in reading?
8th Grade Reading Achievement (NAEP 2005)
42%
36% 29% 38%
42%41%
0%
25%
50%
75%
100%
Pennsylvania Nation Top States*
Basic Proficient or Advanced
*Median of top five states in percent proficient or advanced. Source: National Assessment of Educational Progress. Analysis of data downloaded from www.nces.ed.gov/nationsreportcard/nde/

19AMERICAN DIPLOMA PROJECT NETWORK
Is math achievement improving?
8th Graders Scoring At or Above Proficient in NAEP Math: 1992-2005
43%
28%
31%21%
23%
20%
0% 25% 50% 75% 100%
Top Improver(MA)
Nation
Pennsylvania
1992
2005+8
+20
+10

20AMERICAN DIPLOMA PROJECT NETWORK
Is reading achievement improving?
8th Graders Scoring At or Above Proficient in NAEP Reading: 1998-2005
30%
29%
36%#N/A
23%
30%
0% 25% 50% 75% 100%
Top Improver(DE)
Nation
Pennsylvania
1998
2005-1
+7

21AMERICAN DIPLOMA PROJECT NETWORK
Is there a gap between achievement on state assessments and NAEP?
8th Grade Achievement on State Assessment v. NAEP (2005)
63%64%
36% 31%
0%
25%
50%
75%
100%
Reading Proficient Math Proficient
Pennsylvania
NAEP
Source: National Assessment of Educational Progress. Analysis of data downloaded from www.nces.ed.gov/nationsreportcard/nde/ and 2005 Pennsylvania System of School Assessment (PSSA) results at www.pde.state.pa.us/a_and_t/cwp/view.asp?A=3&Q=115510.

22AMERICAN DIPLOMA PROJECT NETWORK
Middle School – Achievement Gap
In most states, there is an achievement gap that separates African American, Latino and Native American students from White and Asian students.
How large is that gap in your state?
How successful has your state been in closing it over time?
23AMERICAN DIPLOMA PROJECT NETWORK
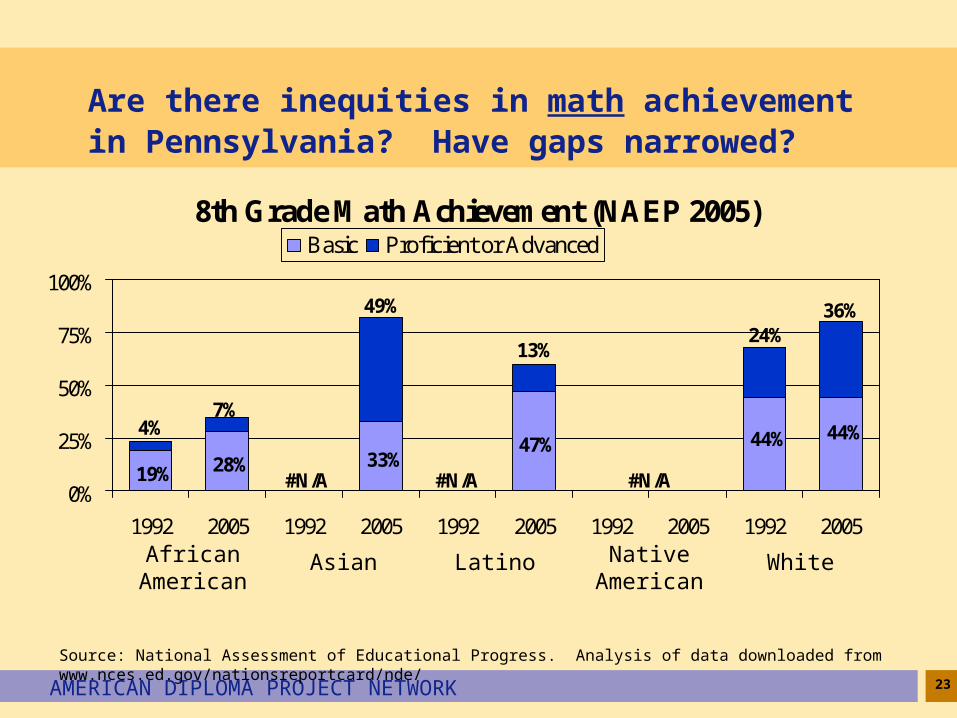
Are there inequities in math achievement in Pennsylvania? Have gaps narrowed?
8th Grade Math Achievement (NAEP 2005)
19% 28%#N/A
33%#N/A
47%
#N/A
44% 44%
36%24%
13%
49%
7%4%
0%
25%
50%
75%
100%
1992 2005 1992 2005 1992 2005 1992 2005 1992 2005
Basic Proficient or Advanced
African American
Asian Latino Native American
White
Source: National Assessment of Educational Progress. Analysis of data downloaded from www.nces.ed.gov/nationsreportcard/nde/
24AMERICAN DIPLOMA PROJECT NETWORK
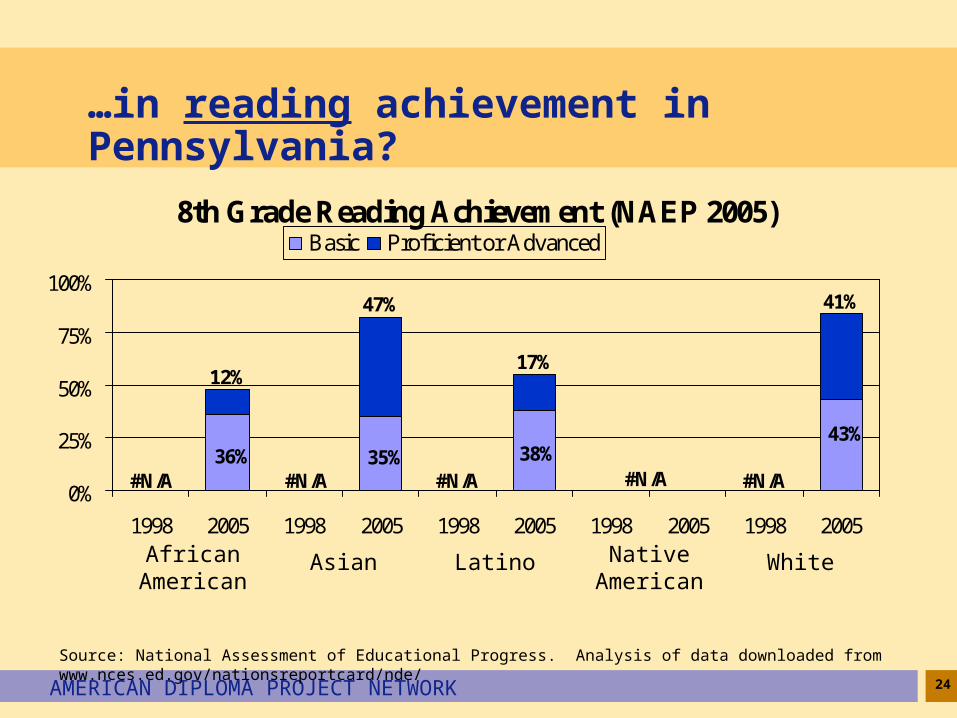
…in reading achievement in Pennsylvania?
8th Grade Reading Achievement (NAEP 2005)
36%#N/A
35%#N/A
38%#N/A #N/A
43%
41%
17%
47%
12%
#N/A0%
25%
50%
75%
100%
1998 2005 1998 2005 1998 2005 1998 2005 1998 2005
Basic Proficient or Advanced
African American
Asian Latino Native American
White
Source: National Assessment of Educational Progress. Analysis of data downloaded from www.nces.ed.gov/nationsreportcard/nde/

25AMERICAN DIPLOMA PROJECT NETWORK
High School
Research has shown that a powerful predictor of whether high school students will graduate and earn a college degree is the rigor of the high school curriculum they complete.
Advanced Placement (AP) exams show how many students are taking challenging courses and attempting to earn college credit while still in high school.
26AMERICAN DIPLOMA PROJECT NETWORK
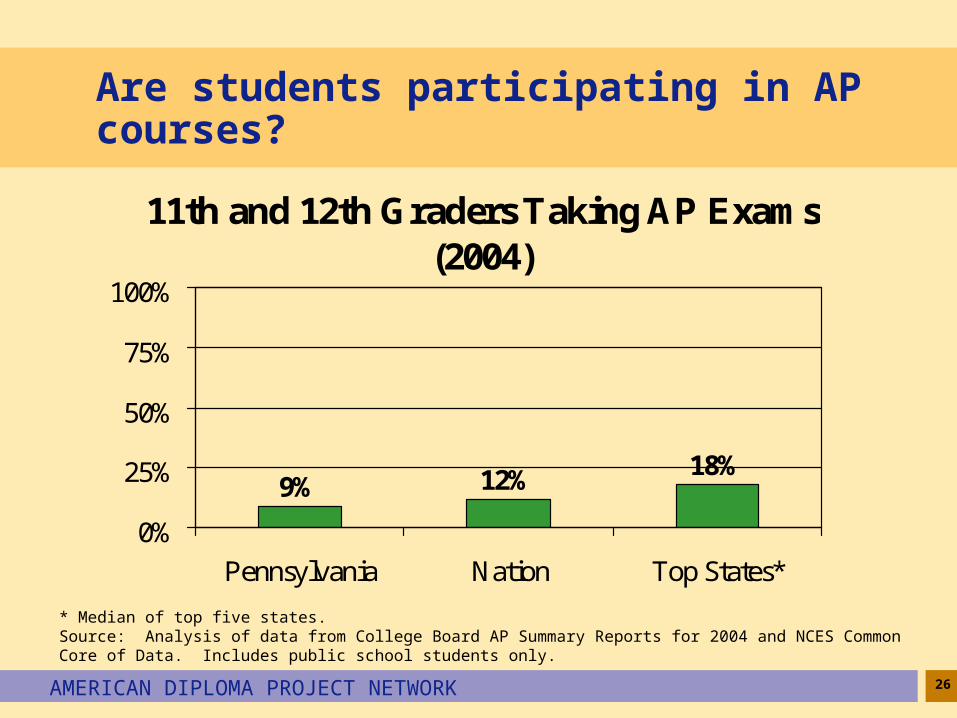
Are students participating in AP courses?
11th and 12th Graders Taking AP Exams (2004)
18%12%9%
0%
25%
50%
75%
100%
Pennsylvania Nation Top States*
* Median of top five states.Source: Analysis of data from College Board AP Summary Reports for 2004 and NCES Common Core of Data. Includes public school students only.
27AMERICAN DIPLOMA PROJECT NETWORK
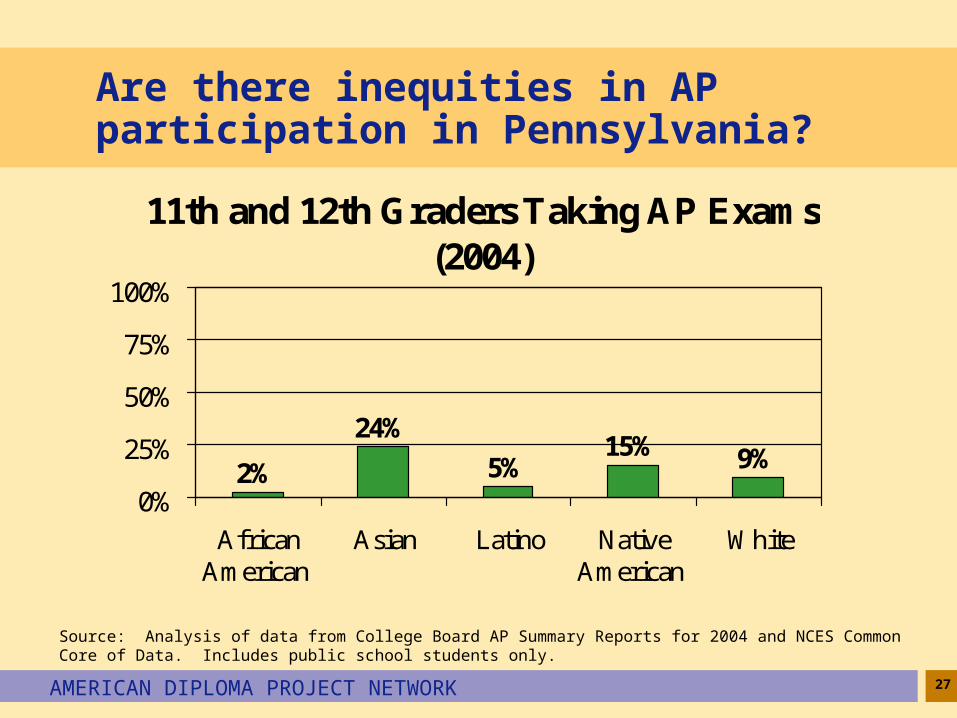
Are there inequities in AP participation in Pennsylvania?
11th and 12th Graders Taking AP Exams (2004)
9%15%5%
24%
2%0%
25%
50%
75%
100%
AfricanAmerican
Asian Latino NativeAmerican
White
Source: Analysis of data from College Board AP Summary Reports for 2004 and NCES Common Core of Data. Includes public school students only.
28AMERICAN DIPLOMA PROJECT NETWORK
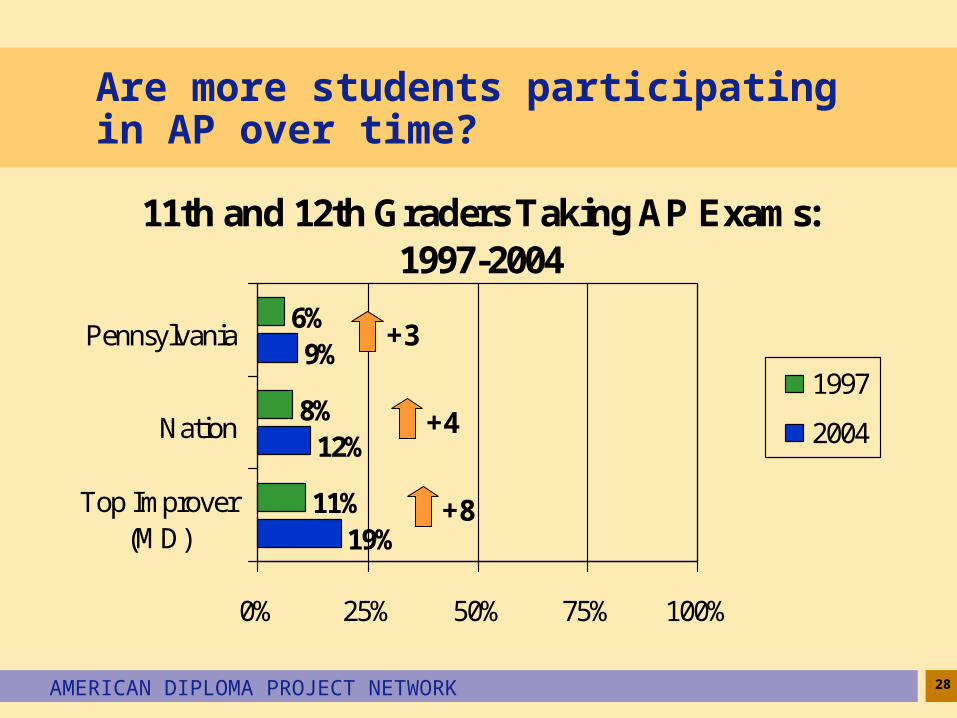
Are more students participating in AP over time?
11th and 12th Graders Taking AP Exams: 1997-2004
19%
12%
9%
11%
8%
6%
0% 25% 50% 75% 100%
Top Improver(MD)
Nation
Pennsylvania
1997
2004
+8
+4
+3
29AMERICAN DIPLOMA PROJECT NETWORK
High School – State Assessments
All states have high school assessments that students take by the 10th or 11th grade. In almost half of the states, students must pass these tests in order to graduate.
Are students who pass the high school tests truly prepared for success in college or work?
Few states have designed their high school assessments to answer whether passing students are prepared for success in college and work.

30AMERICAN DIPLOMA PROJECT NETWORK
How do students perform on state math tests?
11th Graders Scoring Proficient or Above on the Pennsylvania System of School Assessment, 2005
51%
?0%
25%
50%
75%
100%
Math Scoring College ReadySource: 2005 Pennsylvania System of School Assessment (PSSA) results at www.pde.state.pa.us/a_and_t/cwp/view.asp?A=3&Q=115510.

31AMERICAN DIPLOMA PROJECT NETWORK
How do students perform on state English tests?
11th Graders Scoring Proficient or Above on the Pennsylvania System of School Assessment, 2005
65% 69%
?0%
25%
50%
75%
100%
Reading Writing Scoring College ReadySource: 2005 Pennsylvania System of School Assessment (PSSA) results at www.pde.state.pa.us/a_and_t/cwp/view.asp?A=3&Q=115510.

32AMERICAN DIPLOMA PROJECT NETWORK
High School – Graduating on Time
Nationwide, nearly 30% of high school students don’t graduate on time, and the figures are much lower for disadvantaged minority students than for White and Asian students.
Without a high school diploma, students’ chances for success in college or the workplace are severely restricted.
33AMERICAN DIPLOMA PROJECT NETWORK
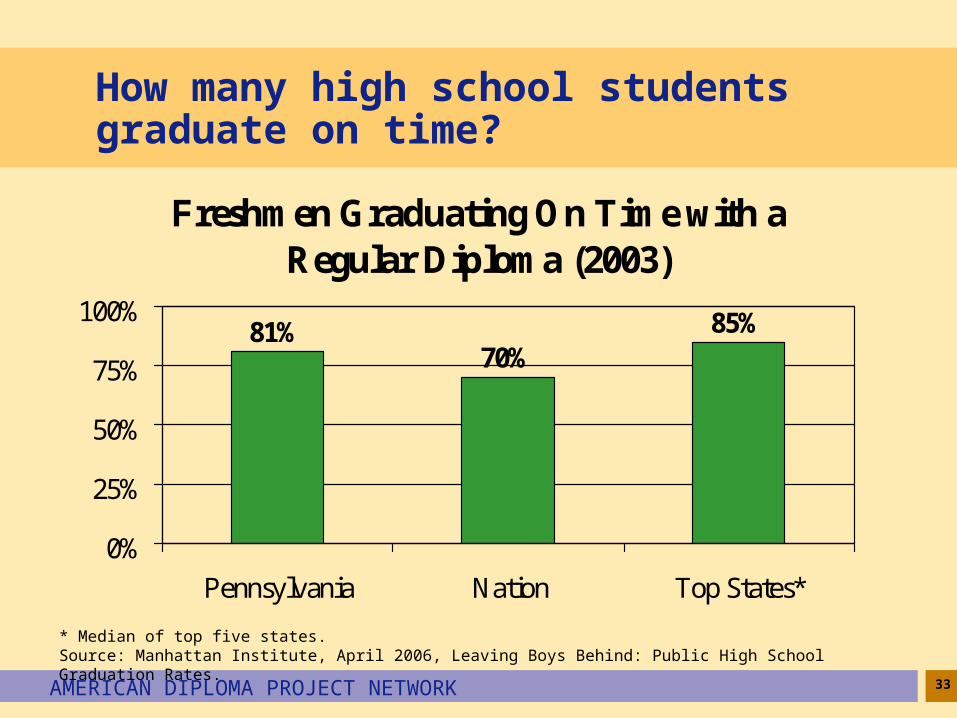
How many high school students graduate on time?
Freshmen Graduating On Time with a Regular Diploma (2003)
85%70%
81%
0%
25%
50%
75%
100%
Pennsylvania Nation Top States*
* Median of top five states.Source: Manhattan Institute, April 2006, Leaving Boys Behind: Public High School Graduation Rates.

34AMERICAN DIPLOMA PROJECT NETWORK
Are graduation rates equitable in Pennsylvania?
Freshmen Graduating On Time with a Regular Diploma (2003)
87%
50%
79%61%
0%
25%
50%
75%
100%
AfricanAmerican
Asian Latino White
Source: Manhattan Institute, April 2006, Leaving Boys Behind: Public High School Graduation Rates.
35AMERICAN DIPLOMA PROJECT NETWORK
Postsecondary Attainment
Earning a postsecondary credential has become increasingly important in today’s economy, and some states have made significant gains in college going rates.
College admission is only the first step. A quarter of college freshmen will not return for their sophomore year.
Only slightly more than half of students in 4-year colleges earn a degree within six years.
36AMERICAN DIPLOMA PROJECT NETWORK
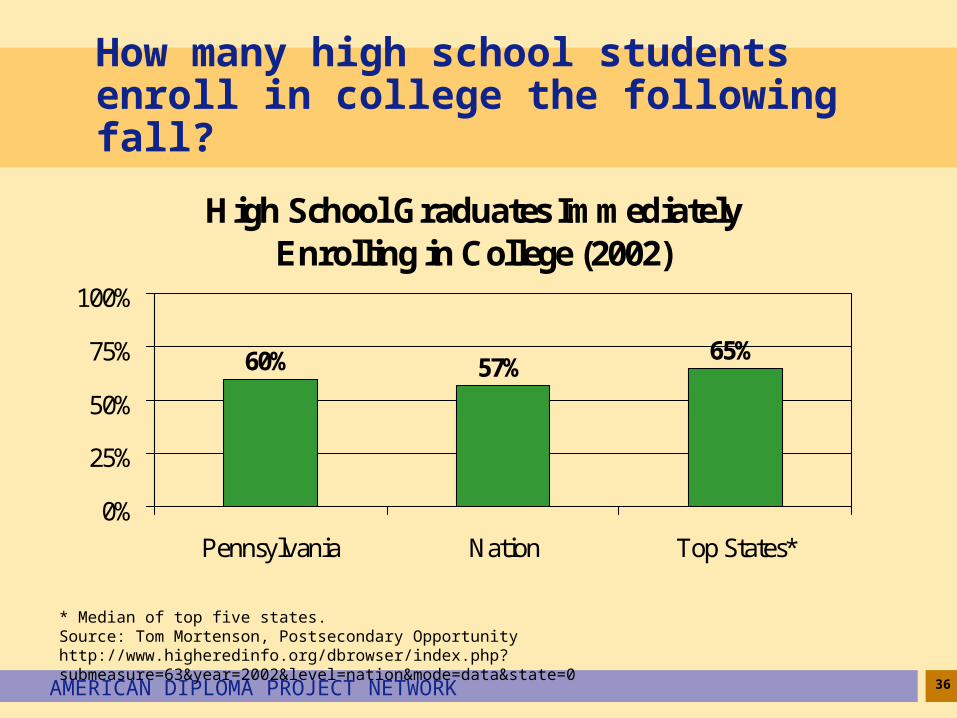
How many high school students enroll in college the following fall?
High School Graduates Immediately Enrolling in College (2002)
65%57%60%
0%
25%
50%
75%
100%
Pennsylvania Nation Top States*
* Median of top five states.Source: Tom Mortenson, Postsecondary Opportunityhttp://www.higheredinfo.org/dbrowser/index.php?submeasure=63&year=2002&level=nation&mode=data&state=0
37AMERICAN DIPLOMA PROJECT NETWORK
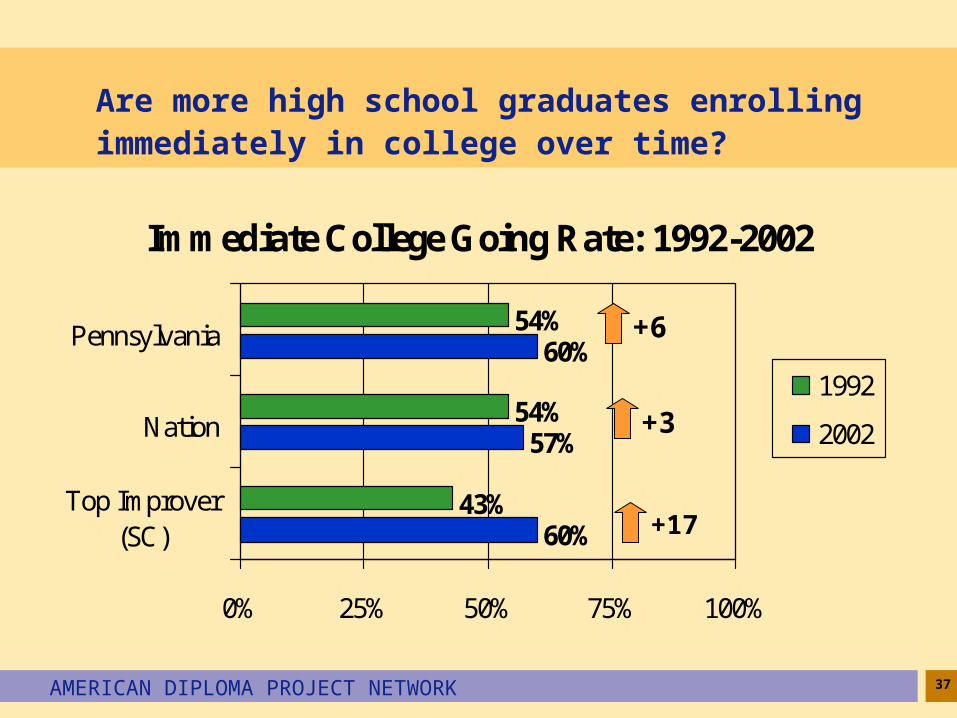
Are more high school graduates enrolling immediately in college over time?
Immediate College Going Rate: 1992-2002
60%
57%
60%
43%
54%
54%
0% 25% 50% 75% 100%
Top Improver(SC)
Nation
Pennsylvania
1992
2002
+17
+3
+6
38AMERICAN DIPLOMA PROJECT NETWORK
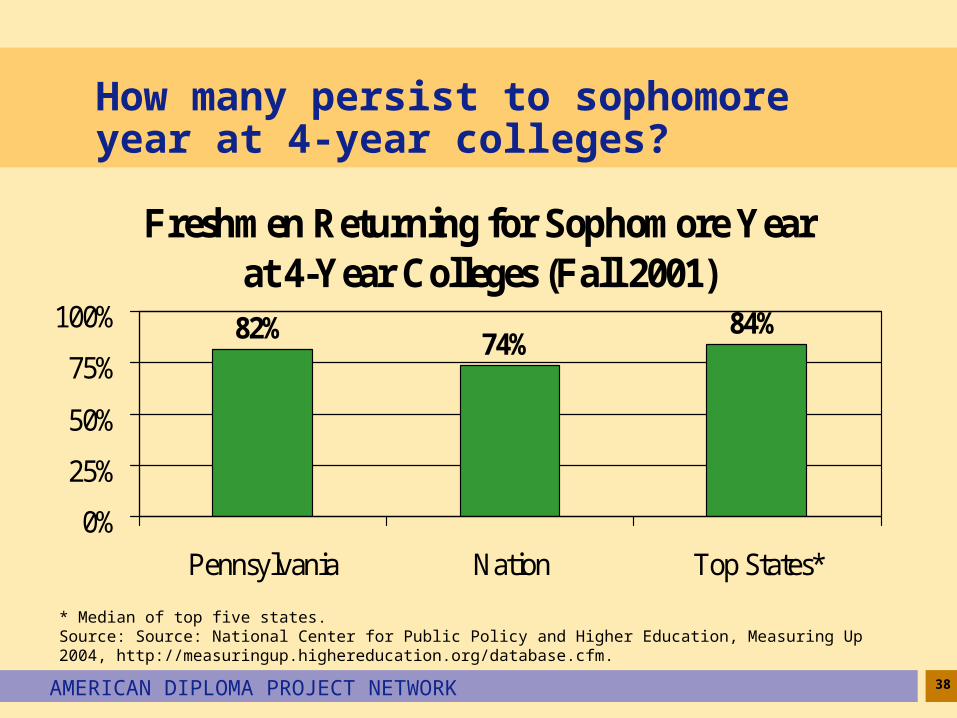
How many persist to sophomore year at 4-year colleges?
Freshmen Returning for Sophomore Year at 4-Year Colleges (Fall 2001)
74%82% 84%
0%
25%
50%
75%
100%
Pennsylvania Nation Top States*
* Median of top five states.Source: Source: National Center for Public Policy and Higher Education, Measuring Up 2004, http://measuringup.highereducation.org/database.cfm.
39AMERICAN DIPLOMA PROJECT NETWORK
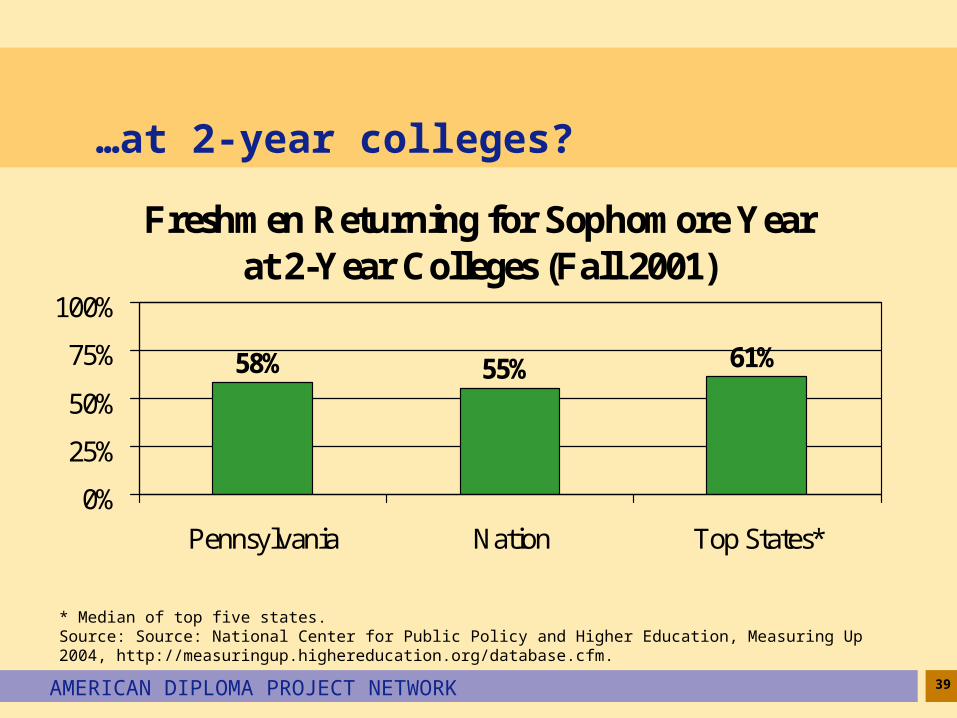
…at 2-year colleges?
Freshmen Returning for Sophomore Year at 2-Year Colleges (Fall 2001)
55%58% 61%
0%
25%
50%
75%
100%
Pennsylvania Nation Top States*
* Median of top five states.Source: Source: National Center for Public Policy and Higher Education, Measuring Up 2004, http://measuringup.highereducation.org/database.cfm.
40AMERICAN DIPLOMA PROJECT NETWORK
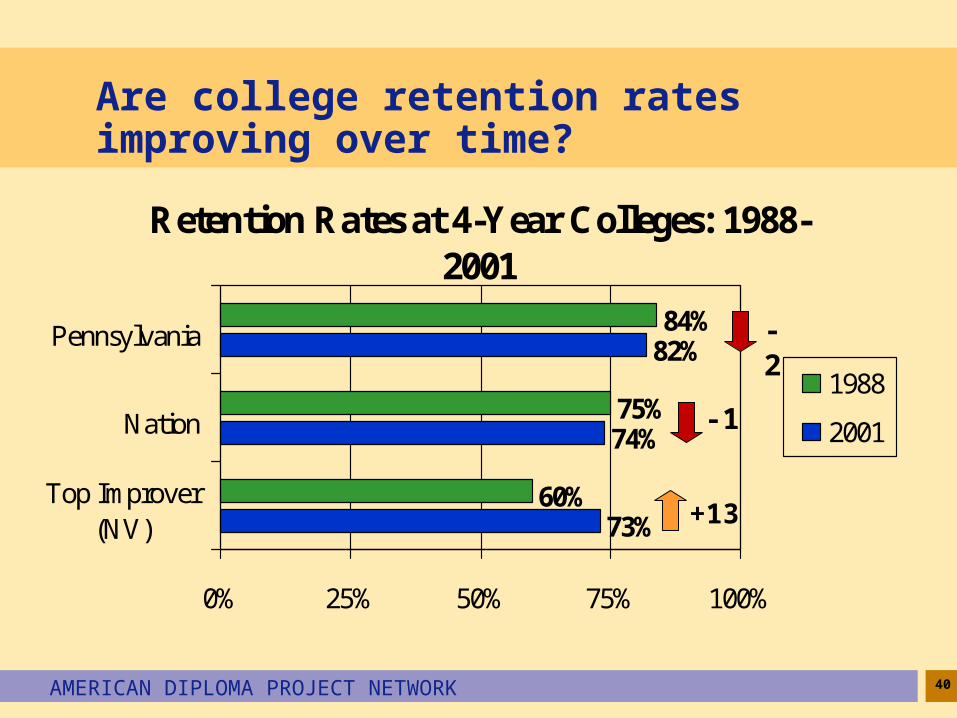
Are college retention rates improving over time?
Retention Rates at 4-Year Colleges: 1988-2001
73%
74%
82%
60%
75%
84%
0% 25% 50% 75% 100%
Top Improver(NV)
Nation
Pennsylvania
1988
2001
+13
-1
-2
41AMERICAN DIPLOMA PROJECT NETWORK
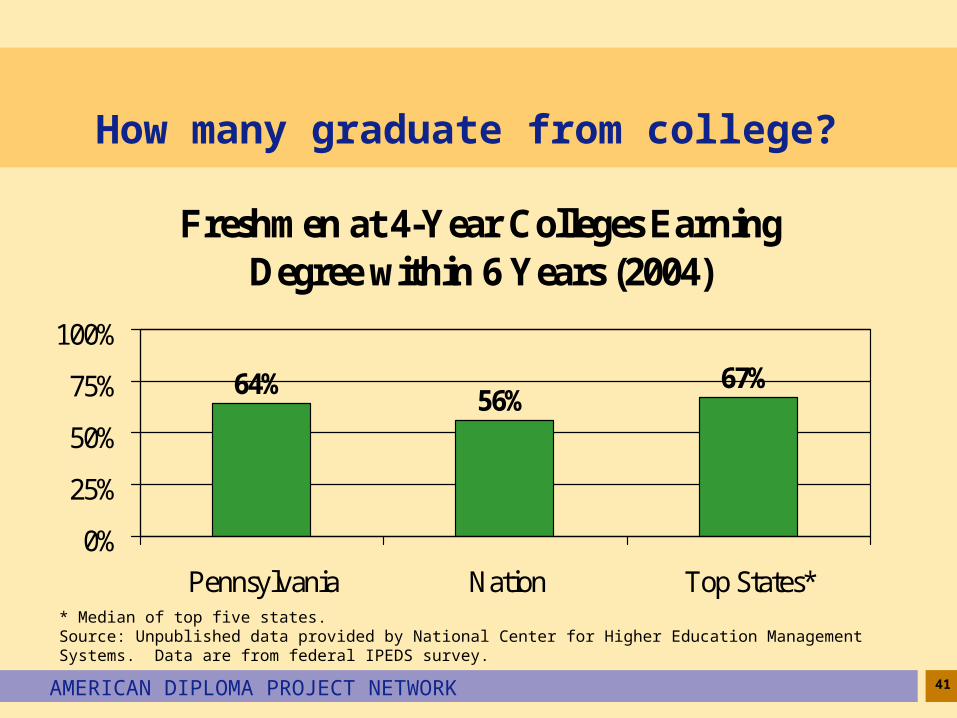
How many graduate from college?
Freshmen at 4-Year Colleges Earning Degree within 6 Years (2004)
67%56%
64%
0%
25%
50%
75%
100%
Pennsylvania Nation Top States** Median of top five states.Source: Unpublished data provided by National Center for Higher Education Management Systems. Data are from federal IPEDS survey.

42AMERICAN DIPLOMA PROJECT NETWORK
Are college graduation rates equitable in Pennsylvania?
Freshmen at 4-Year Colleges Earning Degree within 6 Years (2004)
65%51%57%
70%47%
0%
25%
50%
75%
100%
AfricanAmerican
Asian Latino NativeAmerican
White
Source: Unpublished data provided by National Center for Higher Education Management Systems. Data are from federal IPEDS survey.

Achieve Data Profile:Pennsylvania
April 2006