achieving a balanced organizational structure in professional services firms: some lessons from a...
TRANSCRIPT

M. Kunc: Managing a Balanced Professional Services Firm 119
Published online in Wiley InterScience(www.interscience.wiley.com) DOI: 10.1002/sdr
Abstract
While many factors affect the organizational shape that managers in professional services firms
should achieve, one has the greatest importance: the ratio of junior, mid-level, and senior staff,
usually referred to as a firm’s leverage. The tensions between short-term (market demand and firmprofitability—a static equilibrium issue) and long-term issues (organizational structure and pro-
fessional development—a dynamic equilibrium issue) were analyzed in a modeling for learning
project. Managing a professional service firm implies important trade-offs between satisfying staffdevelopment and financial performance. A hiring and promotion proactive policy aimed at satis-
fying professional staff development leads to an expensive organizational structure without any
certainty for future growth perspectives. However, a reactive hiring policy is not better since itburns out mid-level staff due to delays in training and hiring, which increase staff departures.
Therefore, a widely applied “up-or-out promotion system” seems to be the right policy for managing
professional services firms. Copyright © 2008 John Wiley & Sons, Ltd.
Syst. Dyn. Rev. 24, 119–143, (2008)
Introduction
While many factors affect the organizational shape that managers in profes-sional services firms (PSFs) should achieve, one has the greatest importance:the ratio of junior, mid-level, and senior staff, usually referred to as a firm’sleverage (Maister, 1993; Kor and Leblebici, 2005). In PSFs, professionals de-velop their expert knowledge after many years of experience. Their expertisebuilds on recurrent transactions with clients and formal training, as well asinformal training by senior professionals. In PSFs, senior staff are in charge ofcomplex projects supported by junior professionals who perform simpler tasksand learn from the work of senior staff. This process, known as leveragingexpert human resources (Kor and Leblebici, 2005), has important implicationson the creation of value and the performance of PSFs (Hitt et al., 2001).
While the desired relative mix of juniors, middle-level, and senior staff(optimal organizational pyramid) is primarily determined by skill require-ments based on the complexity of the work (Maister, 1993), the shape of theorganization in equilibrium depends on the rate at which people progress fromone stage in their career to the next. Therefore the shape of the organizationwill almost certainly deviate from the optimal pyramid over time, so managersmust determine policies to reshape their organizations or manage organizations
Achieving a balanced organizational structurein professional services firms: some lessonsfrom a modeling project
Martin Kunc*
System Dynamics Review Vol. 24, No. 2, (Summer 2008): 119–143Published online in Wiley InterScience(www.interscience.wiley.com) DOI: 10.1002/sdr.394Copyright © 2008 John Wiley & Sons, Ltd.
119
* Correspondence to: Martin Kunc, School of Business, Universidad Adolfo Ibanez, Avenida Diagonal LasTorres 2640, Penalolen, Santiago 7941169, Chile. E-mail: [email protected]
Received April 2007; Accepted January 2008
Martin Kunc is
assistant professor ofStrategic Management
and Business
Dynamics at theSchool of Business,
Universidad Adolfo
Ibañez. He holds aPhD in Decision
Science from London
Business School,where his research
involved managerial
decision making undera resource-based
perspective.
He has performeddiverse consulting
projects in human
resources planning,strategic marketing
and supply chainusing System
Dynamics. He is
co-founder of theSystem Dynamics
Latin American
Chapter. His actualresearch is focused
on the dynamics of
clusters and regionalinnovation systems
from a managerial
perspective.

120 System Dynamics Review Volume 24 Number 2 Summer 2008
Published online in Wiley InterScience(www.interscience.wiley.com) DOI: 10.1002/sdr
Fig. 1. Organizational structures of imbalanced firms (adapted from Maister, 1993)
below their potential performance because they are not aligned with the de-mands arising from the market. Figure 1 summarizes these ideas.
The tensions between short-term (market demand and firm profitability—astatic equilibrium issue) and long-term issues (organizational structure andprofessional development—a dynamic equilibrium issue) can be analyzed andoptimized using simulation. Sterman (2000, Ch. 12) presents a stock and flownetwork that is at the core of this issue: a promotion chain. Sterman describesthe problem of a typical American university and suggests that it is verydifficult to find equilibrium in this type of organizational structure because ofa number of factors such as growth rate and promotion policies. This paperpresents an application of this network that has been expanded with the effectsof adjustment processes between workload and staff effort between tasks.Some studies in system dynamics have also explored the issues facing PSFs.For example, Bayer and Gann (2006) observed through their model the inter-actions between project portfolio and business-level processes and theirinfluence on workload fluctuations. Warren (1998, 2002, pp. 43–46, 150–155)centered his analysis on the dynamics of human resource management and thebroader implications on quality and firm reputation. This paper contributes tothis rich set of system dynamics work in the area of professional services firmsby analyzing the problems existing in the management of the organizationalshape of PSFs to balance short-term (market and organizational demands) andlong-term issues (professional development). In other words, the model can bepositioned as a combination between Bayer and Gann’s model focused onprojects and business-level processes and Warren’s model focused on thedynamics of human resource management.
The modeling project was developed for the management team of a profes-sional services firm in the financial industry to help them understand thedynamics of balancing organizational structure and demands from the market,

M. Kunc: Managing a Balanced Professional Services Firm 121
Published online in Wiley InterScience(www.interscience.wiley.com) DOI: 10.1002/sdr
and apply it during the budgeting process. The issue faced by the firm can berelated to the process of human resource planning (Fisher et al., 1999). Essen-tially, the process of human resource planning consists of matching the needsfor labor driven by organizational strategies and market demand, and thesupply of labor determined by the actual and future mix of employees andskills (Schrager and Delaney, 1985). Human resource planning methods can bedivided into two categories: judgmental and mathematical (Fisher et al., 1999),but in practice most organizations use some combination of the two methods(Ward, 1996). On the one hand, judgmental methods make use of knowledge-able people to forecast the future, an example of this type of method being theDelphi method. On the other hand, mathematical methods use quantitativeinformation to determine the number of people required for the future, forexample multiple regressions based on several factors that correlate with labordemand to forecast future demand of personnel (Meehan and Ahmed, 1990).The model presented in this paper contributes not only to the set of complexmathematical models used to forecast human resources based in the estimateddemand of labor from expected levels of activity (projects) and the flow ofpeople and skills through the firm, but also to improving judgmental methods,as system dynamics can also be employed in modeling for learning projects(Morecroft and Sterman, 1994).
The paper is organized as follows. First, I present a description of the firmand the issues faced by the management team. Then, I describe the modeldeveloped and some scenarios used to help managers understand the issues inhuman resource planning in their specific context. Finally, I put forwardimplications and contributions to human resource planning, professionalservices firm literature and systems dynamics.
The case study
The professional services firm
A modeling for learning project (Morecroft and Sterman, 1994) has been heldwith a PSF, which evaluates and rates corporate bonds, in the financial indus-try. The company has been in the market for many years and has a strongreputation for quality. The firm participates in four different types of marketsegments and it is the leader in all of them. Given the high level of specializa-tion and differences in types of customers between the services, each of thefour practices has their own staff and they are independent of each other. Table 1presents the most important characteristics of each service. We can observefrom Table 1 some differences between each service in terms of task complex-ity and its effects on project completion time.
The four services existing in the firm had followed diverse growth paths inrecent years (see Figure 2). Service B had followed an almost exponential

122 System Dynamics Review Volume 24 Number 2 Summer 2008
Published online in Wiley InterScience(www.interscience.wiley.com) DOI: 10.1002/sdr
Services
A B C D
Percentage of simple projects 80% 80% 20% 50%
Percentage of complex projects 20% 20% 80% 50%Staff days for finishing one simple project 2 4 20 7
Staff days for finishing one complex project 7 10 30 14
Total number of projects in 2004 20 690 30 140
Table 1.
Characteristics of the
four services providedby the firm
growth. Service D reached a plateau after a period of growth. Services A and Chave almost stagnated compared with services B and D. The management teambelieved that the growth path of each service was determined mostly by marketconditions rather than the effect of imbalances in the organizational structureof each service. The scenarios presented during the modeling project helpedthe management team to realize that some of their beliefs were erroneous.
Fig. 2. 2001–2004 growth rate in the four services provided by the firm
M. Kunc: Managing a Balanced Professional Services Firm 123
Published online in Wiley InterScience(www.interscience.wiley.com) DOI: 10.1002/sdr
Services
A B C D
Average period of time acquiring skills in each category (months)
Senior staff 18 18 18 21Advanced staff 18 12 18 21
Intermediate staff 12 7 12 15
Novice staff (training time) 6 3 12 5
Staff in each categoryManagers 1 2 2 2
Senior staff 0 3 2 0
Advanced staff 1 2 2 2Intermediate staff 1 7 1 9
Novice staff 2 7 5 2
Total 5 21 12 15
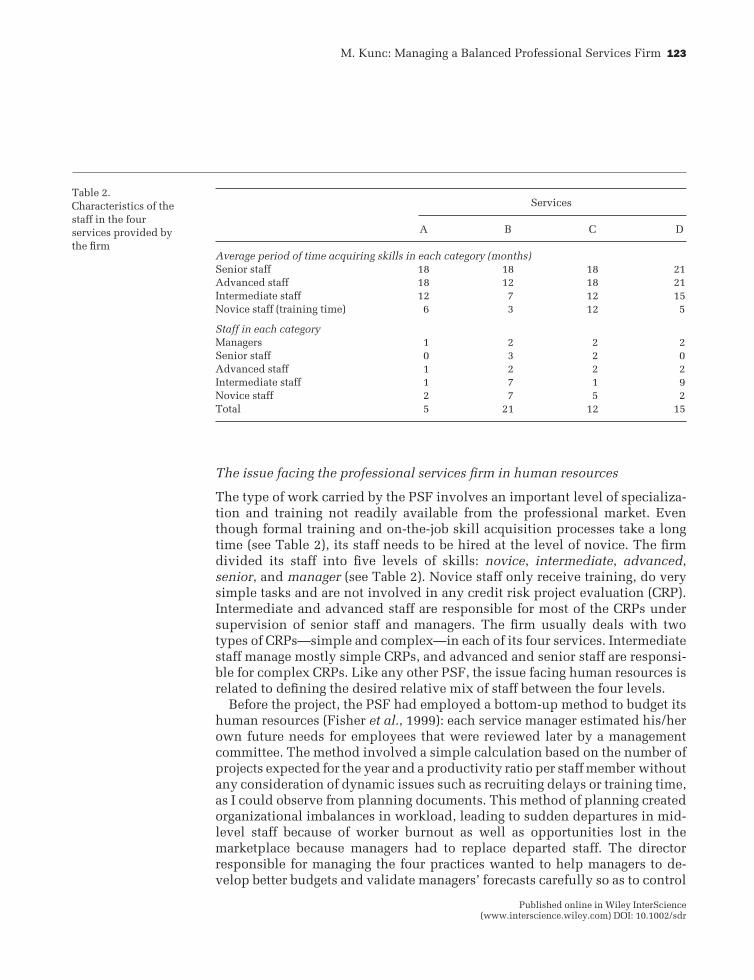
Table 2.
Characteristics of the
staff in the fourservices provided by
the firm
The issue facing the professional services firm in human resources
The type of work carried by the PSF involves an important level of specializa-tion and training not readily available from the professional market. Eventhough formal training and on-the-job skill acquisition processes take a longtime (see Table 2), its staff needs to be hired at the level of novice. The firmdivided its staff into five levels of skills: novice, intermediate, advanced,senior, and manager (see Table 2). Novice staff only receive training, do verysimple tasks and are not involved in any credit risk project evaluation (CRP).Intermediate and advanced staff are responsible for most of the CRPs undersupervision of senior staff and managers. The firm usually deals with twotypes of CRPs—simple and complex—in each of its four services. Intermediatestaff manage mostly simple CRPs, and advanced and senior staff are responsi-ble for complex CRPs. Like any other PSF, the issue facing human resources isrelated to defining the desired relative mix of staff between the four levels.
Before the project, the PSF had employed a bottom-up method to budget itshuman resources (Fisher et al., 1999): each service manager estimated his/herown future needs for employees that were reviewed later by a managementcommittee. The method involved a simple calculation based on the number ofprojects expected for the year and a productivity ratio per staff member withoutany consideration of dynamic issues such as recruiting delays or training time,as I could observe from planning documents. This method of planning createdorganizational imbalances in workload, leading to sudden departures in mid-level staff because of worker burnout as well as opportunities lost in themarketplace because managers had to replace departed staff. The directorresponsible for managing the four practices wanted to help managers to de-velop better budgets and validate managers’ forecasts carefully so as to control

124 System Dynamics Review Volume 24 Number 2 Summer 2008
Published online in Wiley InterScience(www.interscience.wiley.com) DOI: 10.1002/sdr
managers’ budgets for over- and understaffing requests. The director also wantedmanagers to consider not only the desired relative mix of staff based on workrequirements but also how long it would take for the organization to reach itsdesired relative mix given initial staff levels, departure, recruiting, and train-ing rates.
The modeling project
The modeling project had been developed in three stages. First, the modelerwith the management team found the desired balance in the PSF using a staticapproach. In this stage, the management team defined the shape of the organ-ization (in terms of staff) considering the best use of the time from each staffcategory—the static equilibrium between task demands and organizationalstructure. This stage helped them to identify gaps between the actual organiza-tional structure and an optimal organizational structure. In the second stage,the modeler with the management team developed a system dynamics modelto determine managerial policies aimed at achieving a dynamic balance be-tween organizational structure and task demands. The third stage consisted ofscenarios, initially conceptual, to describe the organizational balance/imbal-ance existing in each of the services offered by the firm and the reasons fortheir dynamic performance. These scenarios were discussed with the manag-ers of each service to extract lessons before generating policies to correct theactual situation in the following staff budgeting process. Thus, the modelingproject was not aimed at replicating what had occurred in the firm but to“facilitate a group of managers to make up their own minds” (de Geus, 1992)with respect to planning their human resource needs considering the inherentdynamic complexity existing in flows of people and skills over time.
Stage one: the simple task of achieving static equilibrium
The number of staff that optimize the leverage of the firm is a good startingpoint to observe the shape of the organization that the management team wantsto have. There are two main components in a static balance: the allocation oftasks among staff categories and the demands from the market.
Table 3 offers the information to calculate the time available for a certaintask from a staff category. These percentages, which represent the expectednormal allocation of time by each staff category, multiplied by the number ofpeople in a category and the time available per month for each member of staff,provides the total amount of time available to deal with the market demandsand organizational processes.
As an example, Table 4 summarizes the number of projects that service Dcan deal given its actual level of staff and the time required to finish each typeof project (see Table 1). Table 4 considers the distribution of the time in each

M. Kunc: Managing a Balanced Professional Services Firm 125
Published online in Wiley InterScience(www.interscience.wiley.com) DOI: 10.1002/sdr
Proportion of time allocated to:
Project completion Project acquisition Supervising Hiring Training
Manager 0% 50% 25% 10% 15%
Senior staff 25% 25% 25% 10% 15%Advanced staff 80% 0% 0% 10% 10%
Intermediate staff 100% 0% 0% 0% 0%
Table 3. Percentage of
time allocated to each
task according to staffcategories
category according to Table 3, a fixed number of days available per month(second column from the left in Table 4), and the number of staff/days to finisha project (seven staff/days for simple projects and 14 staff/days for complexprojects according to Table 1). Table 4 shows that service D handled very well140 deals during 2004. However, future growth perspectives for service D (30percent per year) and long delays in hiring, training, and on-the-job learningmake it difficult to estimate the number of staff needed to be hired and pro-moted in the next two years to achieve the forecast growth in market demand.
This exercise illustrates the issues faced at the beginning of the project.When the organization had observed very diverse growth paths for each of itsservices, ascertaining equilibrium on human resources leverage over timecould become very complex to manage intuitively. In this situation, a dynamicsimulation can be very useful for understanding what managers did in the pastand why, as well as how many staff would be required in the future and whena balance could be achieved.
Table 4. Number of projects feasible to be handled at the end of 2004 and projections for 2005 and 2006 for service D
Time available per task (in staff days)
Number Days available Project Simple Complexof staff per month Training Hiring acquisition Supervising projects projects Total
Managers 2 37.00 6 4 19 9 — — 37.00Senior staff 0 — — — — — — —
Advanced Staff 2 35.00 4 4 — — 28 35.00Intermediate Staff 9 157.50 — — — — 63 95 157.50
Novice analysts 2 — — — — — — —
Total 15 230 9 7 19 9 63 123 230
Time in analyst/days per project 7 14Number of projects feasible per month 9.0 8.8
Number of projects feasible per year (based on 10 months) 90 88
Total number of projects in 2004 70 70Total number of expected projects in 2005 91 91
Total number of expected projects in 2006 118 118

126 System Dynamics Review Volume 24 Number 2 Summer 2008
Published online in Wiley InterScience(www.interscience.wiley.com) DOI: 10.1002/sdr
Promoting
Staff
Departing
Time
Supply
Time
Demand
Time
Allocation
function
Organization
Performance
Medium Term
Resource
Accumulation:
Staff
Hiring
• Number of Simple
and Complex
Projects
Exogenous
Variables
Departure
rates
Market
Demands
Org.
Demands
Normal
Time
Fraction
Managerial
intervention through
staff budgeting
Promotion
rates
Organizational Processes:
• Project Acquisition
• Project Completion
• Supervising
• Hiring
• Training
Short Term
Adjustment
of Time
Allocation
Fig. 3. Overview of dynamics at the organizational level captured in the model
Stage two: the complex task of achieving a dynamic equilibrium
OVERVIEW OF THE MODEL A system dynamics model was developed to under-stand the dynamic equilibrium in the firm and help the management team ofthe firm to budget their staff requirements considering the dynamic implica-tions of their decisions. The model has three main sectors: staff, time supplyand time demand (see Figure 3 for an overview). Starting from a promotionchain with five categories—novice, intermediate, advanced, senior, and man-agers—I added two processes: one process controls the allocation of timeamong different tasks by each staff category (sector “time allocation function”in Figure 3) considering a normal allocation of time (sector “normal timefraction” in Figure 3), which is based on the data presented in Table 3, and theeffect of time demands from diverse tasks (sector “short-term adjustment oftime allocation” in Figure 3). Another process calculates the demand of timefrom different processes performed by the organization and the market (sector“time demand” and sectors “organizational demands” and “market demands”

M. Kunc: Managing a Balanced Professional Services Firm 127
Published online in Wiley InterScience(www.interscience.wiley.com) DOI: 10.1002/sdr
in Figure 3). Essentially, the model replicated a short-term balancing feedbackprocess between supply and demand of time performed behaviorally by PSFstaff. By using the model, the management team should learn how to managethe medium-term balancing feedback process between market demands andhuman resource needs. Once the management team learned how to balancemarket demands and staff requirements, each manager would be able to forecasthis/her staff requirements more precisely in terms of quantities and timing.
There were a number of exogenous variables that could be modeledendogenously because they could be affected by imbalances between timesupply and demand, for example departure rates. However, the objective of theproject was to achieve a balanced organizational structure without incurringovertime, which is a well-researched cause to departure rates (Homer, 1985).In the model, imbalances in the organization could be observed using keyperformance indicators like project completion capacity utilized or achieve-ment of hiring targets. Table 5 describes the groups of variables presented inFigure 3 and their categorization as endogenous or exogenous in the model, aswell as a brief explanation of the reasons for their inclusion in or exclusionfrom feedback processes.
STAFF SECTOR Staff are represented using a promotion chain (Sterman, 2000)based on levels of skills. The formulation used for developing the promotionchain is based in a first-order formulation assuming perfect mixing for theflows between categories (Sterman, 2000) since there is no fast track in the firmfor any new analyst. The number of staff in each category, except novices,depends on average residence times (see Table 2) and departure rates, since thefirm cannot hire experienced staff owing to the specificity of the job. Staff in thenovice category represent new hires under training, which can only be promotedinto the intermediate category after a training period. The normal trainingperiod for novice staff can be longer if senior staff and managers do not spendthe necessary time training them. Thus, the promotion chain has only one hiringflow, which occurs at the novice staff level, and multiple departing flows.
TIME SUPPLY The model considers a number of tasks performed by each staffcategory—hiring, training, supervising, project acquisition, and project com-pletion—as important in satisfying the requirements from the market and theorganization. I agreed with the management team a normal, or ideal, timefraction for each combination of staff category and type of task (see Table 3). Ithen assumed a similar productivity for all staff in a certain category (if a staffcategory is not prepared for the task, the category does not have any timeallocated to the task). Thus, the time available for a task—time supply—isdefined by the number of staff existing in a category multiplied by the propor-tion of time allocated to this task and a fixed total working time available permonth (in staff/days). For example, Table 4 shows the distribution of time perstaff category for service D as well as total time available per task.

128 System Dynamics Review Volume 24 Number 2 Summer 2008
Published online in Wiley InterScience(www.interscience.wiley.com) DOI: 10.1002/sdr
Table 5. Model
boundary: exogenous
and endogenousvariables
Variable
Market demands:complex and
simple projects
Normal time fraction
Time allocationfunction
Departure rates
Promotion rates
Organizationalprocesses time
Exogenous/Endogenous
Exogenous
Exogenous
Endogenous
Exogenous
Exogenous
Exogenous
Reason
Customers are usually banks that look for themost recognized credit rating firm and they
are not particularly influenced directly by
sales activities
The management team defined for each staff
category a normal allocation of time among
different tasks. This ideal distribution basedon staff experience and skills should not be
affected by short-term imbalances
The model adjusts the normal fraction oftime allocation according to the number
of projects accumulated in a backlog, which
is a key factor determining the organizationalperformance in the market
Managers believed that departure rates were
determined by better opportunities existingin the job market and not by high workloads.
The model does not use overtime, e.g. staff
only work 8 hours daily during 18 days permonth, to balance supply and demand.
When there are imbalances, the model showsthat some tasks cannot be performed because
of lack of enough time
Managers defined a normal promotion ratefor each category based on an expected time
to obtain enough experience, which should
not change in the short term except after adepth review. Only at the level of novice
staff does training affect the promotion rate
Organizational process time corresponds totime required to perform a task. This time can
only be modified if there are initiatives to
redesign the processes (but this is beyond themodel boundary). Otherwise, its value remains
fixed in the time horizon of the model
The model then calculates the dynamic adjustment of time supply. Theadjustment of time allocated to a task is defined by two variables. One variablecaptures the normal percentage of time allocated to a certain task, which isbased on the values existing in Table 3, and a second variable adjusts thispercentage of time according to the demands generated from a projected backlog.A backlog is generated when the time necessary to complete and supervise thenumber of projects existing in the pipeline is higher than the total time availablefor finishing and supervising projects. This formulation aims to capture thebehavioral adjustment that staff perform in the allocation of their time when

M. Kunc: Managing a Balanced Professional Services Firm 129
Published online in Wiley InterScience(www.interscience.wiley.com) DOI: 10.1002/sdr
Fig. 4. Adjustment function to the normal time allocated to a task based on projected backlog
there are more projects than they can handle considering a normal allocationof time between different tasks. A generic equation for this process is:
Time allocated to task i by staff category j (t) = Normal time allocated to task iby staff category j (t) × Effect of project backlog to task i (t)
The adjustment function, Effect of project backlog to task i, is shown inFigure 4. The slope of the function captures the level of prioritization that staffassign to each task; for example, analysts reduce more rapidly the percentageof time allocated to project acquisition or training than supervising when theprojected backlog is increasing. The shape of this figure was obtained frommeetings with the management team using expert knowledge elicitation tech-niques (Ford and Sterman, 1998).
TIME DEMANDS The level of demands from the market (number of expectedprojects) and the organization (organizational process such as training) drivesthe demand of time that staff should satisfy. The demands in analyst-days forcompleting a project can be observed in Table 1. The demands in analyst-daysfor each organizational process, the driver of each organizational process’s
130 System Dynamics Review Volume 24 Number 2 Summer 2008
Published online in Wiley InterScience(www.interscience.wiley.com) DOI: 10.1002/sdr
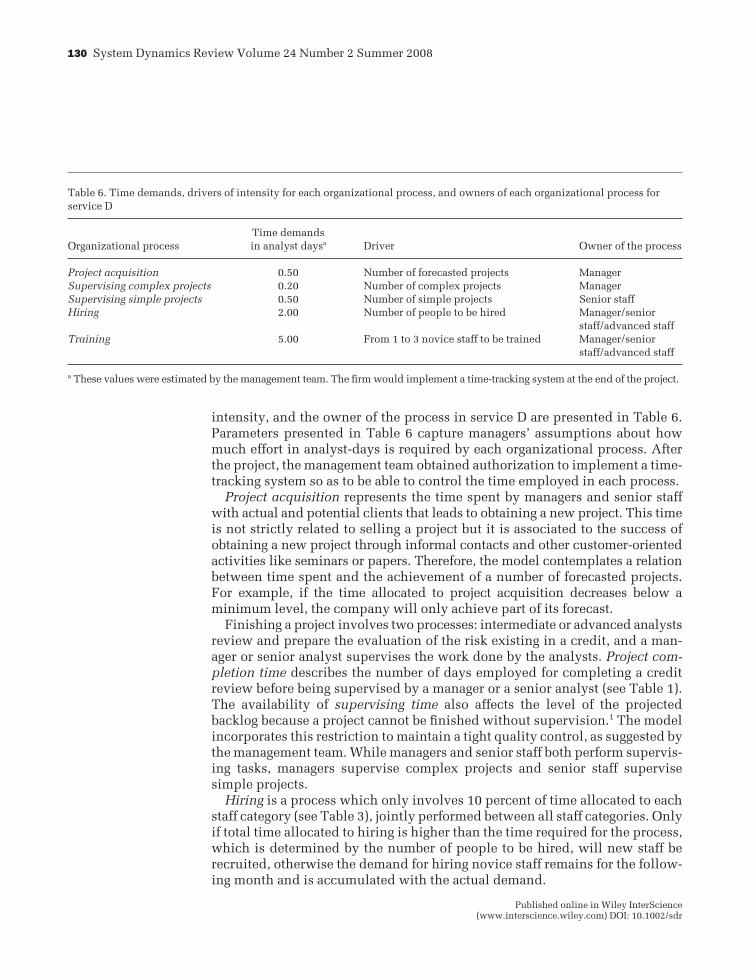
Table 6. Time demands, drivers of intensity for each organizational process, and owners of each organizational process for
service D
Organizational process
Project acquisition
Supervising complex projects
Supervising simple projectsHiring
Training
a These values were estimated by the management team. The firm would implement a time-tracking system at the end of the project.
Owner of the process
Manager
Manager
Senior staffManager/senior
staff/advanced staff
Manager/seniorstaff/advanced staff
Driver
Number of forecasted projects
Number of complex projects
Number of simple projectsNumber of people to be hired
From 1 to 3 novice staff to be trained
Time demands
in analyst daysa
0.50
0.20
0.502.00
5.00
intensity, and the owner of the process in service D are presented in Table 6.Parameters presented in Table 6 capture managers’ assumptions about howmuch effort in analyst-days is required by each organizational process. Afterthe project, the management team obtained authorization to implement a time-tracking system so as to be able to control the time employed in each process.
Project acquisition represents the time spent by managers and senior staffwith actual and potential clients that leads to obtaining a new project. This timeis not strictly related to selling a project but it is associated to the success ofobtaining a new project through informal contacts and other customer-orientedactivities like seminars or papers. Therefore, the model contemplates a relationbetween time spent and the achievement of a number of forecasted projects.For example, if the time allocated to project acquisition decreases below aminimum level, the company will only achieve part of its forecast.
Finishing a project involves two processes: intermediate or advanced analystsreview and prepare the evaluation of the risk existing in a credit, and a man-ager or senior analyst supervises the work done by the analysts. Project com-pletion time describes the number of days employed for completing a creditreview before being supervised by a manager or a senior analyst (see Table 1).The availability of supervising time also affects the level of the projectedbacklog because a project cannot be finished without supervision.1 The modelincorporates this restriction to maintain a tight quality control, as suggested bythe management team. While managers and senior staff both perform supervis-ing tasks, managers supervise complex projects and senior staff supervisesimple projects.
Hiring is a process which only involves 10 percent of time allocated to eachstaff category (see Table 3), jointly performed between all staff categories. Onlyif total time allocated to hiring is higher than the time required for the process,which is determined by the number of people to be hired, will new staff berecruited, otherwise the demand for hiring novice staff remains for the follow-ing month and is accumulated with the actual demand.

M. Kunc: Managing a Balanced Professional Services Firm 131
Published online in Wiley InterScience(www.interscience.wiley.com) DOI: 10.1002/sdr
Training is also a process jointly performed between all staff categoriesinvolving on average 15 percent of their time (see Table 3). Only if total timeallocated to training is higher than time required for the process, which isdetermined by the number of staff in the novice category, will novice staff betrained and promoted to the intermediate category within the period of timeindicated for the category (see Table 2). Otherwise novice staff will stay longerthan the normal time to be trained, as indicated in Table 2.
Stage three: learning the dynamic complexity of human resource planningusing scenarios
After finishing the model, the management team was able to play differentscenarios using a microworld (see Figure 5 for the initial screen). The initial screentried to convey the idea to the management team that they need to balance timesupply, which resulted from the number of staff and the allocation of theirtime among diverse tasks, and time demand determined exogenously by theexpected number of projects and organizational processes. Managers could seea set of traffic lights indicating the actual performance of the organization (topleft side of the screen) and their performance over time (clicking each buttonnext to the traffic lights they could navigate to time charts). Managers couldalso enter forecasts for the number of projects and their complexity for the nexttwo years (table functions at the bottom left of the screen) or change theprocessing time for the different organizational processes (button at the bottomright of the screen, as shown in Figure 5) if they want to know where to focustheir energies on redesigning processes.
The rest of the paper presents a number of conceptual scenarios using themodel to understand the dynamic performance of the diverse services in thisfirm. I chose to present conceptual scenarios (based in a hypothetical firm havingonly one person in each staff category, as can be seen in Table 7) rather than theresults from each specific service, for two reasons. First, I wanted to draw
Table 7. A hypothetical non-pyramidal organizational structure
Time available per task
Days available Project Simple ComplexNumber per analyst Training Hiring acquisition Supervising projects projects Total
Manager 1 18.5 2.8 1.9 9.3 4.6 0.0 0.0 18.5Senior staff 1 18.5 2.8 1.9 4.6 4.6 4.6 18.5
Advanced staff 1 17.5 1.8 1.8 0.0 0.0 14.0 17.5
Intermediate staff 1 17.5 0.0 0.0 0.0 0.0 10.5 7.0 17.5Total analyst days 4 72.0 7.3 5.5 13.9 9.3 10.5 25.6 72.0
Time in analyst/days per project 4 10
Number of projects feasible 2.6 2.6

132 System Dynamics Review Volume 24 Number 2 Summer 2008
Published online in Wiley InterScience(www.interscience.wiley.com) DOI: 10.1002/sdr
Fig. 5. Initial screen of the microworld
generic lessons for human resource planning and professional services firmmanagement because the objective of the project was to learn how to manage thedynamic complexity in the human resource planning process. Second, man-agers could observe using a non-pyramidal structure which staff category grew ordiminished over time depending on their human resource planning policies.
SCENARIO 1: NO REPLACEMENTS AND THE REASONS FOR UNDERPERFORMANCE OF SERVICES AAND C How will the static balanced organization represented in Table 7 look ifthere are no replacements for departures? Figure 6 presents a graph over timeof the simulated distribution of staff among categories. The number of peoplewith managerial skills grew over time as the process of skills acquisition“depleted” lower staff categories.

M. Kunc: Managing a Balanced Professional Services Firm 133
Published online in Wiley InterScience(www.interscience.wiley.com) DOI: 10.1002/sdr
Fig. 6. Number of staff in each category over a period of 24 months without hiring replacements
If the demands of the market remained stable (same number of simple andcomplex projects), the proportion of the total time employed in project com-pletion (line 1 in Figure 7) and the simulated time employed by senior staff onthe completion of simple projects (line 3 in Figure 7) would grow in order tosatisfy the requirements of the market. Other activities like project acquisitiondecreased (line 2 in Figure 7). As there would not be time allocated to projectacquisition, it would be very difficult to maintain a similar level of projectsobtained over time, which was one of the management assumptions concern-ing market demand.
After running this scenario, the management team recognized that this situationhad been occurring in services A and C since 2001 (see Figure 2). Managers inthese practices had not been able to hire and train junior staff because they hadbeen extremely busy satisfying short-term market demands. These serviceshad insufficient mid-level staff to allow their managers to perform long-termactivities, such as project acquisition, training or hiring, which might haveexpanded the size of these practices. Since the management team saw thatthese services were not growing, no additional human resources were com-mitted to expand these practices; and without additional resources thesepractices did not grow. Erroneous beliefs gave rise to incorrect managerialpolicies that caused both services to become stagnant.

134 System Dynamics Review Volume 24 Number 2 Summer 2008
Published online in Wiley InterScience(www.interscience.wiley.com) DOI: 10.1002/sdr
Fig. 7. Behavior of the proportion of time spent between project completion and project acquisition, as well as the proportionof senior staff’s time dedicated to simple projects
Scenario 2: hiring after departures and the performance of service D
One approach to solving the problem presented in the previous scenario is tohire novice staff in order to keep the number of staff in each category stable, butthe question is: “When should we hire?” In this scenario, managers hire peopleonly when there are departures. However, new staff cannot work immediatelybecause of delays in hiring and training. Figure 8 shows the delays in bringingnew staff in and the number of people remaining in each category. Delays inhiring and training hinder the possibility of a quick reaction to sudden depar-tures in senior staff categories and leave the organization with lower levels ofstaff than required to keep the organization properly balanced.
While delays affected the number of people in each category, the distribution oftime in senior categories improved with respect to the first simulation, as Figure 9shows. The effect of maintaining a stable number of people in mid-level categoriesallowed senior staff to do other tasks rather than only completing projects. However,a reactive response to departures, as shown in this example, implied that theorganization went through “firefighting” periods, indicated by the oscillationbetween the proportions of time spent in project completion and project acqui-sition, as shown in Figure 9. Senior staff needed to switch between projectcompletion and project acquisition because there were insufficient mid-level staff.

M. Kunc: Managing a Balanced Professional Services Firm 135
Published online in Wiley InterScience(www.interscience.wiley.com) DOI: 10.1002/sdr
Fig. 8. Number of staff in each category after hiring to replace departures considering a delay of three months in hiring and
three months in training
Fig. 9. Proportion of time employed in project completion, acquisition and senior staff preparing simple projects after hiring to
replace departures with a delay of three months in hiring and three months in training
136 System Dynamics Review Volume 24 Number 2 Summer 2008
Published online in Wiley InterScience(www.interscience.wiley.com) DOI: 10.1002/sdr
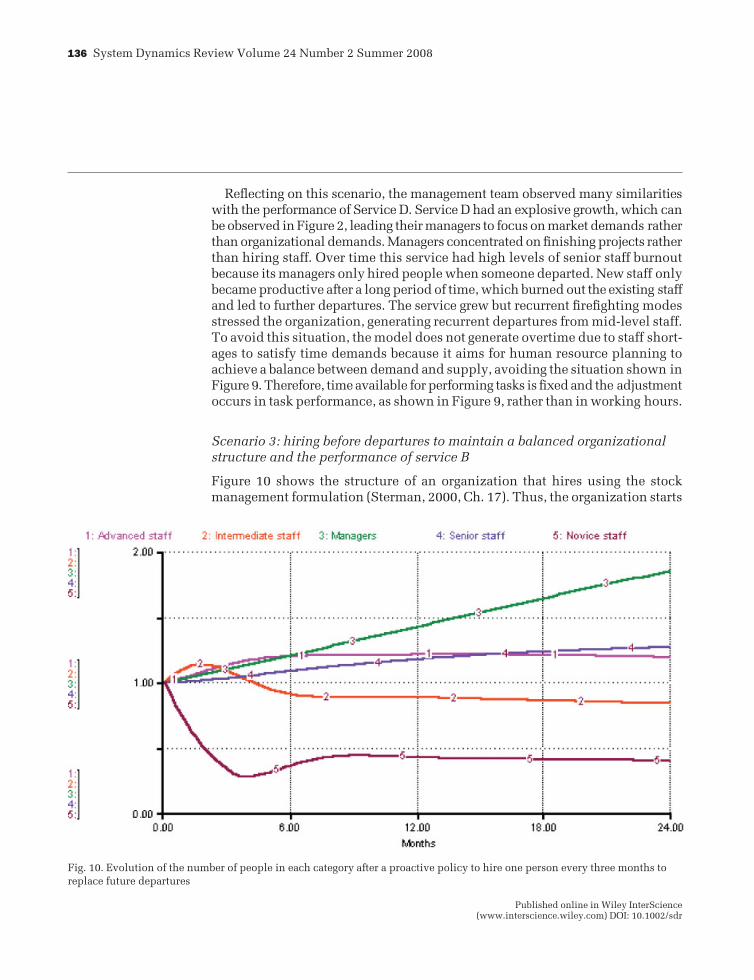
Fig. 10. Evolution of the number of people in each category after a proactive policy to hire one person every three months to
replace future departures
Reflecting on this scenario, the management team observed many similaritieswith the performance of Service D. Service D had an explosive growth, which canbe observed in Figure 2, leading their managers to focus on market demands ratherthan organizational demands. Managers concentrated on finishing projects ratherthan hiring staff. Over time this service had high levels of senior staff burnoutbecause its managers only hired people when someone departed. New staff onlybecame productive after a long period of time, which burned out the existing staffand led to further departures. The service grew but recurrent firefighting modesstressed the organization, generating recurrent departures from mid-level staff.To avoid this situation, the model does not generate overtime due to staff short-ages to satisfy time demands because it aims for human resource planning toachieve a balance between demand and supply, avoiding the situation shown inFigure 9. Therefore, time available for performing tasks is fixed and the adjustmentoccurs in task performance, as shown in Figure 9, rather than in working hours.
Scenario 3: hiring before departures to maintain a balanced organizationalstructure and the performance of service B
Figure 10 shows the structure of an organization that hires using the stockmanagement formulation (Sterman, 2000, Ch. 17). Thus, the organization starts

M. Kunc: Managing a Balanced Professional Services Firm 137
Published online in Wiley InterScience(www.interscience.wiley.com) DOI: 10.1002/sdr
Fig. 11. Distribution of time of the whole organization with at least one person—novice staff—in training and hiring before a
departure occurs
with one novice analyst. The stock management function suggests hiringapproximately 0.15 novice analysts per month or one person every six monthsto replace mid-level staff that are sufficiently skilled to move into highercategories, rather than hiring new staff only when it is necessary. In this case,the firm is proactively maintaining a pool of novice staff in training beforedepartures occur.
The organization achieves a dynamic balance in their leverage levels, as we canobserve in Figure 11, because senior staff in this organization are employingenough time in value-added tasks, such as project acquisition, and not usingsenior staff to finish projects, including simple projects (line 3 in Figure 11).
Figure 12 shows the distribution of time with a 25 percent increase in marketdemand with respect to the previous simulation. The initial number of projectsof 5.2 was augmented to 6.5 from month 3. The results show that a balancedorganization is capable of absorbing a rate of growth equal to 25 percentwithout major problems in the distribution of time among the different tasks.The model generated some adjustments to the allocation of time to support thegrowth in the demand, as shown in Figure 12, without major adjustments inthe short term. However, the organization must increase its number of staff inthe medium term to sustain its balance before major adjustments can occur.

138 System Dynamics Review Volume 24 Number 2 Summer 2008
Published online in Wiley InterScience(www.interscience.wiley.com) DOI: 10.1002/sdr
Fig. 12. Distribution of time with one person in the novice staff category and a rate of growth of 25 percent from month 3
This situation had been experienced by service B according to the manage-ment team. Interestingly, service B hiring policy was not supported by a stockmanagement formulation process but by the archetype “Success to the Suc-cessful” (Senge, 1999). Since this service had been growing, its managerscould obtain more resources to hire people in each budgeting process. Theywere able to hire people even before departures occurred because their successin the market supported their human resources requests to the top manage-ment team. Inadvertently, managers in service B were able to maintain a poolof replacements ready available for the mid-level staff.
Lessons from the modeling project for the managementof professional services firms, human resource planning,and system dynamics
Organizational structure and management of professional services firms
PSFs’ managers are facing a very difficult task in satisfying short- and long-term requirements simultaneously (Maister, 1993). The scenarios run con-firmed this idea, as Table 8 displays the results of each organizational structure

M. Kunc: Managing a Balanced Professional Services Firm 139
Published online in Wiley InterScience(www.interscience.wiley.com) DOI: 10.1002/sdr
Organizational structure at the end of month 24
Senior Advanced Intermediate Novice TotalScenario Manager staff staff staff staff staff
Static analysis 1.00 1.00 1.00 1.00 0.00 4.00No replacements 1.58 0.64 0.23 0.02 0.00 2.47
Hiring after departures 1.65 0.88 0.68 0.46 0.22 3.89
Hiring before departures 1.87 1.30 1.26 0.92 0.45 5.80
Table 8.
Organizational
structure resultingfrom the scenarios
Table 9. Distribution of time of the highest skilled professionals based on the scenarios
Proportion of staff time allocated to (at the end of month 24 in the simulations)
Project Simple project Project
completion completiona acquisition Supervising Hiring Training
Manager
Static analysis 0% 0% 50% 25% 10% 15%
No replacements 67% 50% 3% 13% 10% 7%Hiring after departures 64% 24% 5% 13% 10% 8%
Hiring before departures 12% 0.5% 50% 13% 10% 15%
Senior staff
Static analysis 25% 0% 25% 25% 10% 15%No replacements 34% 50% 1% 48% 10% 7%
Hiring after departures 60% 24% 3% 19% 10% 8%
Hiring before departures 36% 0.5% 25% 14% 10% 15%
a This percentage is a proportion of the time under “Project completion”. It does not add to the other variables.
at the end of each scenario. While the optimal static scenario starts and finisheswith four staff, the optimal dynamic scenario hiring before departures finisheswith 5.80 staff, 45 percent higher than the static scenario. In a scenario withouthiring the organization falls to only 2.47 staff due to normal departures, but ina reactive scenario, where the organization hires staff after departures, totalstaff number only 3.89.
On the one hand, the scenario hiring before departures is the optimalscenario that satisfies the long-term requirements of the professional servicesfirm. However, the resulting organization shows that satisfying professionalstaff through promotion policies that reflect the level of skills acquired andhiring policies aimed at maintaining a correct balance between skills andworkload may imply lower financial performance because the firm will havemore senior than junior staff for the same number of projects. On the otherhand, the scenario hiring after departures, which optimizes short-term re-quirements, implies that managers and senior staff perform tasks unrelated totheir skills (more than 60 percent of their time is employed completing projects),as shown in Table 9.

140 System Dynamics Review Volume 24 Number 2 Summer 2008
Published online in Wiley InterScience(www.interscience.wiley.com) DOI: 10.1002/sdr
Therefore, how could managers in a PSF manage this dilemma? On the onehand, the simulation shows that an organization without mid-level staff ishighly inefficient because highly skilled professionals, such as managers andseniors, are performing simple tasks. On the other hand, hiring to sustain astable pool of mid-level staff increases the number of highly skilled profes-sionals without any certainty that they will be efficient in bringing new pro-jects and generating more revenue to support a more expensive structure.
Managers in PSFs balance workload and skills using the “up-or-out” policy(Sterman, 2000, p. 485). In this policy, managers allow mid-level staff to departif managers are unable to promote them to senior level because there are noopportunities to grow in the market. The PSF literature also suggests thathiring novice staff represents an investment in a portfolio of options to acquirethe future value of human capital after it has developed over time (Malos andCampion, 1995). Development over the apprenticeship period and perceivedstrategic opportunities will determine whether the firm exercises its option onparticular staff by promoting them to a higher salary level or will let them go(Malos and Campion, 1995).
PSFs seem to be the only firms that need to control their growth rate using astrange policy: losing the highly productive mid-level staff. While the shape oforganizations may be similar to a pyramid, the results of this project suggestthat the organizational shape of PSFs can be closer to a diamond, where mid-level staff are abundant and both ends of the organizational structure (novice andmanagers) have fewer people than mid-level categories. This structure is alreadyestablished in service B, the most successful service in the firm of the case study.This observation clearly departs from traditional perspectives in the area of organ-izational structures but it needs further empirical tests to sustain its validity.
Human resource planning
Koch and McGrath (1996) suggest that human resource planning when imple-mented properly generates a lead time, necessary to avoid potential problemsthat may affect the performance of the organization. Human resource planningshould look not only at the balance between demand and labor supply but alsothe evaluation of policies and programs that can be beneficial to the perform-ance of the organization (Koch and McGrath, 1996). Planning a balanced firmin terms of human resources is a very challenging task for any manager becauseof a variety of factors that affects its performance. Human resource managersare increasingly employing decision tools for this task (Ward, 1996). However,there are no tools or methods aimed at understanding and managing thedynamic complexity existing between changes in the mix of the employeepopulation with organizational levels of activity (Meehan and Ahmed, 1990).This paper contributes to the literature by offering a model that balancesemployee population characterized by their skills and organizational levels ofactivity determined by key processes.
M. Kunc: Managing a Balanced Professional Services Firm 141
Published online in Wiley InterScience(www.interscience.wiley.com) DOI: 10.1002/sdr
While defining an optimal structure from a static point of view does notseem to represent a major problem in human resource planning, defining anoptimal dynamic configuration that sustains the performance of the organiza-tion in the long term is more difficult because:
• The process of skill acquisition affects the optimal structure determinedfrom a static point of view, especially the amount of time available forcertain tasks oriented towards the long-term performance of the firm.
• If people do not have enough time because there are fewer staff than re-quired, they will abandon tasks relevant for the long-term health of theorganization for short-term oriented tasks.
• Hiring policies that react to present imbalances in the organization will notimmediately improve the performance of the firm since there are delays innew staff becoming fully productive.
• Hiring staff in advance is an important step in starting to grow given thedelays in formal and on-the-job training.
• Actual growth rates are important in defining the rate of promotion but “up-or-out” policies are more important in balancing the organizational struc-ture and managing the future growth rate.
The present model can be used to address all these issues during the process ofhuman resource planning.
Actually human resource planning is not circumscribed to the area ofhuman resources but line managers are also involved in the process (Fisheret al., 1999). The use of microworlds, like the one developed in this projectand presented in the paper, in addressing the issue of promotion chains com-bined with levels of activity can be very useful in improving decentralizedprocesses of human resource planning, as occurred during this modeling forlearning project. Moreover, simulation models can easily play different timehorizons, allowing the planning process to focus on several time horizons:short term—just one year in advance; intermediate term—two to three years; orlong term—more than three years.
Implications for system dynamics literature
While many organizations react to increasing backlogs with heroic efforts thatburn out their staff (Homer, 1985), in the model total time available from staffis fixed so imbalances between demand and supply can unfold and managerscan be aware of them. In other words, the model aims to avoid the appearanceof systemic archetypes like “Shifting the Burden” (Senge, 1999) in managers’behavior. Unless the management team hires more people, explicitly recog-nizes overtime by changing the amount of working time available per person,or changes the time demands for a certain task, the backlog accumulates andother tasks are not performed until the backlog disappears. These restrictions

142 System Dynamics Review Volume 24 Number 2 Summer 2008
Published online in Wiley InterScience(www.interscience.wiley.com) DOI: 10.1002/sdr
in the model show the effect of not having enough staff to perform all tasks in abalanced manner and consequently not achieving an optimal leverage thatrespects staff skills and working hours. This restriction is very useful since it isvery tempting to keep growing without adding staff. Organizations usuallyreact only when burnt-out staff leave the firm, which is the behavior that themodeling project wants to eliminate.
In this sense, the model purposefully avoids adjusting imbalances throughovertime, which is an important factor determining staff departures and should bemodeled endogenously. Sterman (2000, p. 490) suggests that important insightscan be obtained from promotion chain models with exogenous hiring, promotion,and departure parameters, but more insights can be obtained when these structuresare embedded in a full model of the organization. For example, the promotionfraction can be modeled endogenously as depending on the balance of seniorto junior personnel or the growth trend in projects obtained. A full model of theorganization may show that the loss of talent can feed back to worsen performancein the marketplace, further eroding growth in a vicious cycle (Sterman, 2000,p. 490; Warren, 2002). However, the scope of the model did not include thefinancial or market performance of the organization because the managementteam and I believed that a balanced organization would avoid these issues.
Oliva and Sterman (2001) found that temporary imbalances between servicecapacity and demand generate erosion of the service standards, affecting thelong-term performance of the firm. The model has staff working time andorganizational processes time fixed without any feedback process affectingthem endogenously. This restriction in the model aims to avoid repeating inthe organization Oliva and Sterman’s findings that even under stable demandemployees absorb small variations in workload, increasing working hours orreducing time spent in processes, which gradually erodes service standards. Inthe model, the lack of sufficient time implies that a service cannot be per-formed. In other words, it is important that people learn not to experienceprocesses aimed at shifting the burden.
The model can be expanded to explore Hafeez and Abdelmeguid’s (2003)suggestions that in some situations management may decide to meet some staffshortages by moving towards a multi-skill policy and offering training toexisting employees. Here system dynamics simulations can help to providetraining and learning time estimates to implement such radical change, asHafeez and Abdelmeguid suggested.
Note
1. This restriction is implemented in the model using a MIN function betweenthe percentage of projects that can be completed by intermediate and advancedstaff and the percentage of projects that can be supervised by managers andsenior staff.
M. Kunc: Managing a Balanced Professional Services Firm 143
Published online in Wiley InterScience(www.interscience.wiley.com) DOI: 10.1002/sdr
References
Bayer S, Gann, D. 2006. Balancing work: bidding strategies and workload dynamics in aproject-based professional service organization. System Dynamics Review 22: 185–211.
de Geus AP. 1992 Modelling to predict or to learn? European Journal of OperationalResearch, Special Issue: Modelling for Learning 59: 1–5.
Fisher CD, Schoenfeldt LF, Shaw JB. 1999. Human Resource Management FourthEdition. Houghton Mifflin Co: Boston.
Ford, DN, Sterman, JD. 1998 Expert knowledge elicitation to improve formal andmental models. System Dynamics Review 14: 309–340.
Hafeez K, Abdelmeguid H. 2003 Dynamics of human resource and knowledge manage-ment. Journal of the Operational Research Society 54: 153–164.
Hitt MA, Bierman L, Shimizu K, Kochhar R. 2001. Direct and moderating effects ofhuman capital on strategy and performance in professional service firms: a resource-based perspective. Academy of Management Journal 44: 13–28.
Homer JB. 1985. Worker burnout: a dynamic model with implications for preventionand control. System Dynamics Review 1: 42–62.
Koch MJ, McGrath RG. 1996. Improving labor productivity: human resource manage-ment policies do matter. Strategic Management Journal 17: 335–354.
Kor Y, Leblebici H. 2005. How do interdependencies among human-capital deploy-ment, development, and diversification strategies affect firms’ financial performance?Strategic Management Journal 26: 967–985.
Maister DH. 1993. Managing the Professional Service Firm. Free Press: New York.Malos SB, Campion MA. 1995. An option based model of career mobility in profes-
sional service firms. Academy of Management Review 20: 611–644.Meehan RH, Basheer Ahemed, S. 1990. Forecasting human resources requirements: a
demand model. Human Resource Planning 13: 297–308.Morecroft JD, Sterman JD (eds). 1994. Modeling for Learning Organizations. Productivity
Press: Portland, OR. (Now available from Pegasus Communications, Waltham, MA.)Oliva R, Sterman JD. 2001. Cutting corners and working overtime: quality erosion in the
service industry. Management Science 47: 894–915.Schrager S, Delaney C. 1985 Human resource planning: a business necessity. Journal of
Information Systems Management 2: 51–54.Senge PM. 1999. The Fifth Discipline: The Art and Practice of the Learning Organization.
Random House: London.Sterman JD. 2000. Business Dynamics: Systems Thinking and Modeling for a Complex
World. Irvine–McGraw-Hill: New York.Ward D. 1996. Workforce demand forecasting techniques. Human Resource Planning
19: 54–55.Warren K. 1998. The Professional Services Microworld. Global Strategy Dynamics:
Princes Risborough, UK.——. 2002. Competitive Strategy Dynamics. Wiley: Chichester.