achieving staff stability: using data driven decisions to ... · better jobs better care achieving...
TRANSCRIPT

Case Study, Analytic Tool, and Practice Guide
A Product of Better Jobs Better Care
Achieving Staff Stability: Using Data Driven Decisions to Re-Examine Industry Norms
“The first step is that you have to be big enough to say what you’re doing isn’t working. Then you can
fix it, do it better, and move forward.” - Scott West, Administrator
- Birchwood Terrace Healthcare∗
By Cathie Brady and Barbara Frank∗ B & F Consulting, Inc.
In a Unique Collaboration with: Better Jobs Better Care – VT∗
COVE: Community of Vermont Elders Birchwood Terrace Healthcare
Quality Partners of Rhode Island
March 2007 ∗ Birchwood Terrace Healthcare, in Burlington, Vermont, is owned by Kindred Nursing Centers East, LLC, a subsidiary of Kindred Healthcare Inc. ∗ The authors are indebted to David Farrell, MSW, NHA, who designed the analytic tools used at Birchwood and in the QIO pilot and contributed valuable knowledge, skills, and understanding. ∗ Vermont's Better Jobs Better Care Program (BJBC-VT), sponsored by the Community of Vermont Elders, was funded by the Robert Wood Johnson Foundation and the Atlantic Philanthropies.

Case Study, Analytic Tool, and Practice Guide
A Product of Better Jobs Better Care
Achieving Staff Stability: Using Data Driven Decisions to Re-Examine Industry Norms
Table of Contents
Introduction ……………………………………………………………………………………………. 1 Stabilizing Staffing: The Problem …………………………………………………… 3 The Birchwood Story: In the Beginning …………………………….. 3 The QIO Workforce Retention Pilot ……………………………………. 6 Stabilizing Staffing: The Intervention …………………………………………… 9 Data Collection Tools: The “Drilldown” ……………………………….. 9 Data Analysis ……………………………………………………………………………… 11 A New Approach ………………………………………………………………………… 15 Leadership Development: Building Skills and Systems …… 19 Results …………………………………………………………………………………………… 21 Conclusion: A Lesson Learned …………………………………………………………… 24 A cautionary note …………………………………………………………………………24 Appendix A – Do Your Management Practices Support Stability or Instability? …………………………………………………… 25 Appendix B – Drilldown: The Tool and Instructions ………………… 37 Appendix C – Blank Drilldown in Excel* ………………………………………… 51 * An electronic version of the excel tools is available at: www.riqualitypartners.org and www.bjbc.org.
1
Achieving Staff Stability Using Data Driven Decisions to Re-Examine Industry Norms
A Unique Collaboration of Better Jobs, Better Care – Vermont and Birchwood Terrace Healthcare
with B & F Consulting, Inc. and Quality Partners of Rhode Island
By Cathie Brady and Barbara Frank∗ March 2007
“The first step is that you have to be big enough to say what you’re doing isn’t working.
Then you can fix it, do it better, and move forward.” - Scott West, Administrator, Birchwood Terrace Healthcare∗
Introduction: Nursing homes across the country struggle with high turnover and absenteeism at all levels of their organization, and often consider this staff instability to be a given in the field. The reasons for people cycling in and out of jobs in this field vary, but research suggests that there are two interrelated forces at work:
• fiscal issues (i.e. wages, benefits, financial incentives, and staffing decisions); and • management practices that shape the way people work together.
Unwittingly, many fiscal and management practices frequently used to deal with chronic staffing instability actually contribute to and accelerate the instability. Yet these practices are such common responses to instability that they have gone unquestioned and been assumed to be working. These industry norms bear closer scrutiny. A fundamental rethinking of these norms, through careful analysis and rigorous process improvement efforts, has led homes to spend smarter for better results. This is the story of how one nursing home, Birchwood Terrace Healthcare, broke with convention, re-examined industry-wide norms, and changed its fiscal and managerial practices. It is also the story of an analytic process which guided Birchwood’s examination and led it to institute new approaches that led to positive results. The home used classic process improvement to make data driven decisions. Using a tool available at www.bjbc.org and www.riqualitypartners.org, Birchwood saw how its fiscal incentives were creating instability. By refocusing its resources, Birchwood broke its vicious cycle of turnover and stress, and achieved workplace stability and harmony. This story is important because it is not just one nursing home’s story. The problems Birchwood faced, and the fiscal and managerial practices that had been its norm, are common across the country. What is uncommon is that Scott West, the administrator, ∗ The authors are indebted to David Farrell, MSW, NHA, who designed the analytic tools used at Birchwood and in the QIO pilot and contributed valuable knowledge, skills, and understanding. ∗ Birchwood Terrace Healthcare is owned by Kindred Nursing Centers East, LLC, a subsidiary of Kindred Healthcare Inc.

2
and Sue Fortin, the director of nursing, were willing to acknowledge that what they were doing wasn’t working, and that they had to do something different. These exemplary leaders guided their home to new norms. They were aided by technical assistance from B & F Consulting, Inc. provided through Better Jobs, Better Care – Vermont. When Birchwood began its participation in Better Jobs Better Care – Vermont, its presenting problem was a high rate of turnover. Through a 6 month intervention process it made substantial progress toward stability. The heart of the intervention was the collection of data to determine the impact of resource decisions. Leadership analyzed the data and put new fiscal practices in place that had an immediate impact in stabilizing staffing. Birchwood’s managers concurrently focused on strengthening supervisory and management practices and putting systems in place to solidify relationships among staff. A year later, the progress has been sustained.
Workers that left between 2/15/04 - 2/15/05 2/15/06-2/15/07 LNAs 92 30 RNs 18 3
LPNs 10 6
The intervention at Birchwood provides a valuable and replicable example of an analytic process that workplace leaders can use to identify and address underlying causes of staff instability. While Birchwood’s situation has its own unique characteristics and the tools were customized to Birchwood, the lessons and methods have universal applicability. Birchwood’s change process coincided with a CMS funded pilot, “Improving the Nursing Home Culture,” staffed by Quality Partners of Rhode Island and B & F Consulting. The pilot focused, in part, on workforce retention. Among the 254 homes in the pilot, many had turnover problems similar to Birchwood’s, and had been using similar approaches in response. The BJBC and CMS projects drew from each other. Birchwood and the CMS pilot homes were able to shatter the norms of high turnover using new practices that rewarded retention and achieved stability. Collectively the pilot homes achieved significant improvements in staff retention and in clinical quality measures including restraints, pain, pressure ulcers, and activities of daily living. This best practice case study describes the methodology behind the workforce intervention, how the tools were used, and the results. The paper highlights fiscal and management practices prevalent today in the nursing home field that actually contribute to instability and contrasting practices that support stability, cohesion, and teamwork. The take-home lesson of this case study is that our systems create our outcomes. What we do gets us what we get. To get something different, we have to do something different. To do differently, we need to see with new eyes what we’ve taken as givens. At Birchwood, and in the QIO pilot, when systematic analysis provided new eyes, nursing homes were able to change their systems and generate new and better outcomes for staff and residents. As they grew in their understanding of what could be done, they replaced systems that contributed to instability with systems that helped them stabilize their staff. Theirs is a story of change that transforms our field.

3
Stabilizing Staffing: The Problem 1. The Birchwood Story … in the beginning For decades, the long-term care field has taken high turnover as a given. Research suggests two main causes for a vicious cycle of turnover, absenteeism, and stress.
• The first cause is fiscal -- wages and benefits. Direct care workers typically receive wages and benefits that are insufficient for them to make ends meet. Many lower wage staff face daily economically-related struggles that inevitably affect their work. Nursing homes often feel helpless to address this economic reality because wage and benefit levels are affected significantly by public reimbursement rates. Yet, each nursing home’s systems for bonuses, incentives, and differentials as well as policies related to attendance, schedules, assignments and employee assistance, all have an impact on retention outcomes.
• The second cause is management practices.∗ In homes with high turnover,
many staff experience lack of respect. Despite management efforts to the provide positive appreciation, staff often do not feel valued within their workplace. They see little positive feedback for their contribution, they don’t feel listened to or included in decision-making, and they work with staffing ratios that make a hard job even harder. In these settings, the work culture can feel harsh and punitive, with little room for the caring heart that brought people to this work. Here again, management systems – for orientation and welcome; problem-solving and conflict resolution; and teamwork, collaboration and participatory decision-making – all shape retention outcomes.
When Birchwood became involved in Better Jobs Better Care- VT, it sought assistance with turnover. Birchwood Terrace Healthcare, in Burlington, VT, is a Medicare and Medicaid certified nursing facility owned by Kindred Nursing Centers East, LLC, a subsidiary of Kindred Healthcare, Inc. Birchwood has a capacity for 160 residents and has 186 employees. It has a sub-acute unit, a dementia unit, and a regular long-term unit. Scott West, the administrator, and Sue Fortin, the Director of Nursing, are recognized leaders in their field. Early in the process with BJBC-VT, contractors B & F Consulting gathered information from staff about the nature of the turnover. B & F then developed an intervention process that included:
• Collection and analysis of data to determine the nature and extent of the turnover and absenteeism
• Development and implementation of a three-pronged plan to stabilize staffing by increasing the percentage of full-time and part-time staff, improving attendance, and retaining a greater percentage of new employees
• Leadership training for managers and supervisors
∗ What a difference management makes! by Susan C. Eaton, 2002, documents five key management practices that make the difference between high and low turnover in nursing homes in the same labor market.
4
Information Gathering (Qualitative):
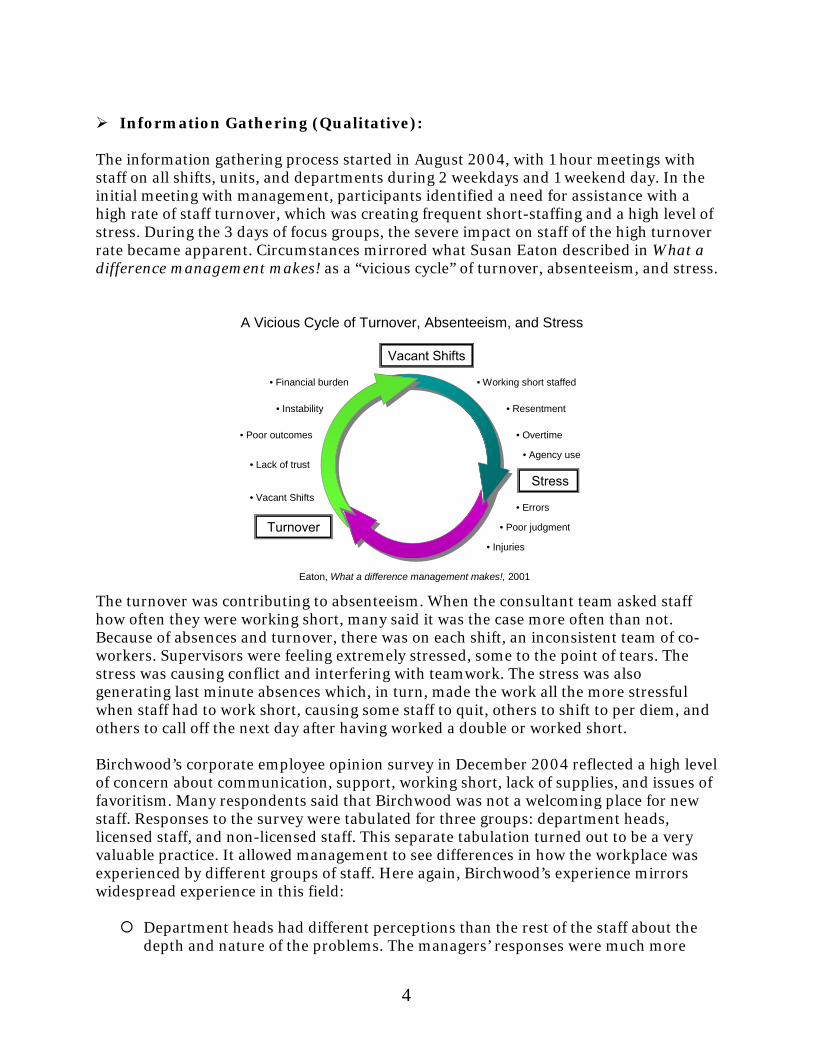
The information gathering process started in August 2004, with 1 hour meetings with staff on all shifts, units, and departments during 2 weekdays and 1 weekend day. In the initial meeting with management, participants identified a need for assistance with a high rate of staff turnover, which was creating frequent short-staffing and a high level of stress. During the 3 days of focus groups, the severe impact on staff of the high turnover rate became apparent. Circumstances mirrored what Susan Eaton described in What a difference management makes! as a “vicious cycle” of turnover, absenteeism, and stress.
A Vicious Cycle of Turnover, Absenteeism, and Stress
Turnover
Vacant Shifts
Stress
• Working short staffed
• Resentment
• Agency use
• Errors
• Poor judgment
• Injuries
• Vacant Shifts
• Lack of trust
• Instability
• Poor outcomes
• Financial burden
• Overtime
Eaton, What a difference management makes!, 2001
The turnover was contributing to absenteeism. When the consultant team asked staff how often they were working short, many said it was the case more often than not. Because of absences and turnover, there was on each shift, an inconsistent team of co-workers. Supervisors were feeling extremely stressed, some to the point of tears. The stress was causing conflict and interfering with teamwork. The stress was also generating last minute absences which, in turn, made the work all the more stressful when staff had to work short, causing some staff to quit, others to shift to per diem, and others to call off the next day after having worked a double or worked short. Birchwood’s corporate employee opinion survey in December 2004 reflected a high level of concern about communication, support, working short, lack of supplies, and issues of favoritism. Many respondents said that Birchwood was not a welcoming place for new staff. Responses to the survey were tabulated for three groups: department heads, licensed staff, and non-licensed staff. This separate tabulation turned out to be a very valuable practice. It allowed management to see differences in how the workplace was experienced by different groups of staff. Here again, Birchwood’s experience mirrors widespread experience in this field:
Department heads had different perceptions than the rest of the staff about the depth and nature of the problems. The managers’ responses were much more

5
favorable than the rest of the staff in areas related to communication, teamwork, support when working short, and other morale-related areas.
Nurses’ responses indicated their morale was the lowest in the building.
There were sometimes wide swings, with a significant number of staff responding
positively, and a significant number responding negatively, indicating unevenness in the work experience in the building.
When employees are absent, there is a strong effort to get replacements
Strongly Agree
Agree Neither agree nor disagree
Disagree Strongly Disagree
Department heads 29% 57% 14% 0% 0% Licensed Nurses 14% 36% 14% 29% 7% Hourly Staff 17% 17% 17% 17% 33% Teamwork in my department is good
Strongly Agree
Agree Neither agree nor disagree
Disagree Strongly Disagree
Department heads 57% 43% 0% 0% 0% Licensed Nurses 13% 13% 27% 20% 27% Hourly Staff 33% 33% 0% 0% 33% Management cares about me as a person
Strongly Agree
Agree Neither agree nor disagree
Disagree Strongly Disagree
Department heads 43% 57% 0% 0% 0% Licensed Nurses 7% 13% 27% 13% 40% Hourly Staff 17% 50% 0% 0% 33% I would recommend this to a friend as a good place to work
Strongly Agree
Agree Neither agree nor disagree
Disagree Strongly Disagree
Department heads 43% 43% 14% 0% 0% Licensed Nurses 20% 13% 20% 27% 20% Hourly Staff 33% 17% 0% 17% 33% Department heads were very aware that there were serious problems and were working diligently to address them. But, as is often the case, management was unaware of just how depleted and demoralized their staff, and especially their nurses, were. Management was trying to provide support, promote morale, and plug the holes, in ways that are common to many nursing homes in similar situations. To provide support, West, as administrator, was involved in a hands-on way in helping with the work – washing windows, passing trays, making beds, transporting residents. While staff appreciated his active support, they still felt overwhelmed. Attempts to improve employee morale, such as pizza parties, were unsuccessful at alleviating the stress staff they were experiencing.

6
Meanwhile, the practices it was employing to plug the holes were keeping the holes open. For example, in its urgency to fill vacancies, Birchwood used:
“You’ll work? We’ll take you”: Feeling the urgency to hire, they brought on new people they might not have hired had they felt they could wait.
Inconsistent assignments: New hires were often given different assignments
each day, to plug that day’s hole, without having the opportunity to get to know their co-workers, their residents, or their supervisors. Many new staff left immediately, so the home had to start a new hiring process.
Piecemeal hiring: They tried to fill holes on certain days and shifts, and
accepted new hires only willing to work certain days and shifts. Their schedule was a daily jigsaw puzzle, filling holes and fitting people in as they could.
Sign-on bonuses: Birchwood offered sign-on bonuses to their new nursing
hires. This was hard for current staff who felt undervalued by comparison.
Baylors: To allow full-time staff to have more weekends off, Birchwood used a Baylor program – staff who worked two 12 hour shifts got paid for 30 hours. Eventually, the program took on a life of its own, expanding to weekday use.
Last minute assignment Bonus: Another common practice also used at
Birchwood was a bonus of $5.00 per hour for CNAs and $10.00 per hour for licensed nurses to cover for staff who called in absences at the last minute. Still it faced daily instability, with absences, turnover, and stress at all time highs.
Its actions, meant to stem the tide of instability, were unwittingly accelerating the instability, and generating hard feelings among their core of reliable staff. Birchwood’s efforts were standard in the field, yet they were making matters worse. 2. The QIO Workforce Retention Pilot… in the beginning In August, 2004, the Centers for Medicare and Medicaid Services (CMS) funded Quality Partners of Rhode Island (QPRI) to conduct a one-year pilot with two prongs: Person-centered care and Workforce retention. On the Workforce Retention side of the pilot, five major national nursing home corporations and two state triads (consisting of the for-profit and not-for-profit associations and the QIO) participated in four learning sessions conducted by QPRI. They in turn led 10 – 12 nursing homes each through a year long intervention meant to reduce their turnover. On the Person-centered care side of the pilot, twenty-one state QIOs also attended four training sessions conducted by QPRI and in turn led 5 – 10 nursing homes in their state through an effort to shift from institutional to individualized resident care. QPRI contracted with B & F Consulting to work with their core staff of Marguerite McLaughlin and David Farrell in designing the pilot, conducting the training, and assisting the corporations and the QIOs in their

7
implementation of the change process. Eaton’s What a difference management makes! was used as a core text for workforce retention. The work and findings at Birchwood became a living laboratory for the workforce retention efforts under this pilot. From the onset it was evident that the experience at Birchwood was a common one. Homes participating with their corporations in the workforce retention pilot were experiencing similar problems and relying on similar practices to deal with them. On the person-centered care side of the pilot, homes focused first on individualizing care. However by the fourth learning session, they were ready to focus on workforce retention. The experiences at Birchwood, and by then, with the homes in the workforce retention side of the pilot, rang true for them as well.
Information Gathering: Pilot participants wanted guidance on how to improve retention. We gave them a way to understand the nature, extent, and causes of their turnover similar to the way focus groups at Birchwood had provided valuable information about the causes and effects of turnover. We designed a package of homework assignments which we gave participants in the workforce retention pilot at their first learning session, in October 2004. The homework was a way for management to begin the information gathering process. The homework focused on ways of beginning to get a better picture of the current conditions and to provide the management with an awareness of their staff’s experiences. It involved staff interviews and data collection covering the same areas that had surfaced in the Birchwood focus groups. The homework assignments that included:
What is your cycle of turnover? Interview staff who have left over the last three months to find out why they left and what their experience of working for you was. Compile results.
What is your cycle of understaffing? Collect information over three months on the number of shifts where scheduled staff do not work and so overtime or pool is used, or the shift works short. Ask a staff person from every shift, unit and department how often they feel understaffed and what the work feels like when that’s the case. Ask what it feels like when they have enough staff. How often is that the case? Ask them what teamwork is like and what happens related to teamwork when they are understaffed. Ask what happens that leads people to be a last minute absence.
Where is your money going?
Compare all spending related to recruitment and to retention in the last year.
What are your financial incentives? Compile information on incentives and determine how frequently they are given. Examples: a bonus for working a last minute assignment, shift differentials, having people work two 12 hour shifts and be paid for 36 hours, extra per hour take-home pay for working per diem, bonuses for good attendance, working a

8
holiday, hiring bonus, referral bonus, longevity, completing a class, mentoring a new co-worker, etc. What do you offer new hires to start and how does that compare with what longer term employees are paid?
High-Turnover/Low-Turnover Self-Assessment Using Eaton to Look
At Your Facility’s Landscape This self-assessment tool is based on Eaton’s What a difference management makes! with scoring in the five areas of management practice Eaton had found to make a difference in retention. These five areas are: high quality leadership throughout the organization, valuing staff in word and deed, human resource practices that support staff stability, organization of work to build on employees’ intrinsic motivation, and enough staff and resources to do the job well.
What Do Employees Want in Their Job? Ask five staff people what brought them into caregiving, what keeps them there, what their frustrations are, and what they most want in the job.
Managing for Retention • Chart longevity in your workplace – how many staff have been there by
number of years of service. Chart turnover of staff by longevity. • Ask three staff who have been there less than a year what it was like to come
in new and what they think would be helpful to do to welcome in new staff. What would have helped them?
• Sit in the employee break room. Make a list of what you see that’s comfortable
and inviting, what you see that isn’t, and what you could see that could be done to make it better. What would you like to eat in here? Is this a comfortable place to relax and replenish? Ask at least three staff who come in these same questions.
• Review in-service training and opportunities for on-the-job classes. For
classes given in the last year, what was the content and what teaching mode was used (video, lecture, tape, discussion, role-play, case study, etc.)? Ask at least one staff person from each shift about in-service and opportunities for on-the-job classes. Were there any in the last year that they liked? What suggestions do they would have for areas they’d like to have a class on? What suggestions do they have for scheduling of classes? What could make classes better? Share and discuss findings with team.
Build on Intrinsic Motivation
The intrinsic motivation for nursing home staff is the ability to care for others. Observe a morning’s routine in your nursing home, from 5 – 8 a.m. Observe a lunch and a dinner. Observe the pace for staff and residents, their interactions, and the affect these routines have on them. Does the system you have in place allow for the caring that motivates your staff to work in long-term care?

9
When the corporate staff returned for their second learning session in January 2005, they shared what they had learned from the homework. It mirrored the experience at Birchwood. The corporate staff were able to see through the eyes of their staff. They learned why their staff do the work they do – out of a calling to care for others. They learned why people have last minute absences – because they are burnt out. They learned what it’s like to work short – one staff person said, “it’s hell;” and what it’s like to work with enough staff – one staff person said, “you have time to be human.” One corporation, after its management team sat in their employee break rooms and saw how dreary they were, immediately initiated remodeling at the break rooms in all its homes. Pilot participants learned that they were not adequately supporting new hires and by drilling down to chart longevity in relation to turnover, some of the corporations learned that most of their turnover was occurring in the first week after hire. Corporate staff had not realized how impossibly rushed the morning routine is, how much their in-services were boring videos, or how prevalent the experience of disrespect was among their non-supervisory staff. Overall, participants understand that they had been woefully unaware of the depth of despair among their employees. They had also been unaware that their own fiscal and management practices were generating their own vicious cycle of turnover. They began to match their systems with their outcomes and to re-examine traditional practices, such as staffing to census, bonuses for last minute assignments, and sign-on bonuses. The information collected from the staff interviews and the data drill down gave them a powerful analysis of what was causing their turnover and what steps they needed to take to remedy it. Stabilizing Staffing -- The Intervention 1. Data Collection Tools∗ – The “Drill-down” Through the workforce retention pilot, we had created rudimentary tools for data collection based on Birchwood’s experience. The pilot participants had found the data collection tools to be a powerful source of information about what was happening in their workplaces. Working with David Farrell, we formalized these tools so that we could systemically collect information at Birchwood. We designed a data collection tool to capture a snapshot of the current picture of the staff and the financial incentives currently in place. Our goal was to “drill down” and learn more about any possible causal links between Birchwood’s financial incentives and its staff instability. The tool asked for the following information broken down for RNs, LPNs, CNAs, and for staff from non-nursing departments.
• The Snapshot of the Current Situation
Composition of Staff for RNs, LPNs, and CNAs by full-time, part-time, per diem and Baylor. This collects concrete information on the number and
∗ A blank of this Drill-down tool, with instructions on its use, is in Appendix B. For an excel copy, go to www.riqualitypartners.org or www.bjbc.org.

10
percentage of licensed and non-licensed staff who are regular full-time employees and those who were piecemeal employees.
Current Staff by Length of Service, including categories for less than 6
months, 6 months to 1 year, 1 to 2 years, more than 2 years, more than 5 years, and more than 10 years. This looks at what percentage of the current staff has what longevity.
Terminations by Length of Service, including categories for 1 day to 1
month, 1 to 3 months, 3 to 6 months, 6 months to one year, 1 – 2 years, and 2 or more years. It separates terminations by employee choice and employer choice. This provides information on how quickly staff leave after hire.
Turnover Replacement Costs, including costs for recruiting and hiring,
staffing the vacancy, training and orientation. This allows homes to calculate individual and annual costs for turnover.
• Financial Incentives
Bonus for accepting last minute assignment captures the amount of the bonus, how much was paid out in the last quarter, and what the annual pay-out is.
Differentials details amounts paid for working hard to fill shift and
weekends. It calculates the cost per position, per quarter, and annually.
Baylor calculates the actual hourly wage rate for RNs, LPNs, and CNAs who are paid for hours they do not work. It compares this with the hourly wage for non-Baylors.
Per Diem Status calculates the quarterly and annual pay-out for the extra
per hour take home pay in lieu of benefits.
Perfect Attendance Bonus captures the amount of the bonus and the quarterly and annual pay-out for those who have worked all the shifts for which they are scheduled in a month or a quarter.
Holiday Bonus computes the quarterly and annual cost for extra pay, above
the standard “time and a half,” for working a holiday.
Bonuses Related to Recruitment calculates quarterly and annual pay-outs for new employee sign-on bonuses and employee referral bonuses.
Annual Average Wage Increase computes the annual estimated expense
for the wage increase for the licensed and non-licensed nursing staff.

11
Longevity Bonus details the amount paid to current employees who attain certain levels of years of service and delineates the annual estimated cost for pay-outs per position.
Preceptor Bonus captures the amount paid to an individual who helps a
new hire and the amount paid out by the facility annually for this program. The final sheet of the financial incentives tool computes the total annual estimate cost of all bonuses, incentives and differentials and contrasts it with the annual wage increase expense for RNs, LPNs, and CNAs. Combined with the annual cost of turnover, Birchwood had a comprehensive breakdown of financial data. 2. Data Analysis The data was compiled in June 2005. The next step in the process was to analyze the data to see if there were any links. Indeed there were. The data explained significant problems that had surfaced in the focus groups and the employee survey. The data also suggested a link between the staff instability and the financial incentives. First, we looked at the Composition of Current Staff, as of June 2005. By looking at the numbers we were able to see immediately that full time status employees made up the lowest percentage of their staff, particularly in supervisory and management positions. Of 57 licensed staff, only 23 were full-time.
Composition of Current Staff (June 2005)
Position FT PT Per diem Baylor
RN Total - 30
8 27%
4 13%
14 47%
4 13%
LPN Total – 27
15 55.5%
0 0%
5 18.5%
7 26%
CNA Total – 77
37 48%
8 10%
7 9%
25 32%
Seeing that fewer than half the supervisory staff were working full-time provided an immediate understanding about significant problems in leadership, morale and communication. Nurses were putting in their hours and leaving. The piecemeal staffing meant that they weren’t available to follow-up on resident or staff issues, or on facility initiatives. CNAs had different supervisors each day, each with their own way of doing things, their own expectations of the staff, and in many cases, limits on the degree to which they engaged with the teamwork and communication issues on the floor. The other number that jumped out in looking at the composition of the staff was that one third of the CNAs and one fourth of the LPNs were Baylors. Working two twelve hour shifts left many people worn out. Working with people during their second twelve hour shift was often a very trying experience.

12
Clearly there was a link between the composition of the staff and the instability Birchwood was experiencing. Was there any link between the composition of the staff and the financial incentives? The best deal in the house was to work as a Baylor. In fact, Baylor nurses made more per hour than the Director of Nursing, with far less responsibility. Birchwood, like many other homes, was paying its staff for hours they didn’t work. The next best deal in the house was to work per diem and take a last minute assignment. There was no financial benefit to working full-time and committing to a schedule that the facility could count on. And there was no bonus for having perfect attendance.
Financial Incentives – Bonuses (June 2005)
Bonus Extra Per Hr. Annual
Baylor work two 12’s, paid for 30 hours
$268,944
Per diem
$ 1 add on to regular hourly wage
$51,012
Last minute assignment
RN, LPN --$10 CNA -- $5
$360,000
Perfect attendance $0 $0
Birchwood was rewarding the behavior it was trying to stop and not rewarding the behavior it sought to encourage. This was a radical realization. Why should we reward people for doing what they are supposed to do – coming to work? That’s a natural question to ask, until we look at the data and realize the current system rewards people for not coming to work, or for coming to work only on their own terms rather than when they are scheduled and can be counted on to show up. Birchwood had no control of its schedule because staff had converted from full-time to per diem and Baylor and were picking up last minute assignments when it fit into their individual schedule to work. West and Fortin conducted an analysis in which they sat down and looked at everyone’s rate of pay. For the Baylor and per diem they factored their incentive pay into their hourly rate. What they saw “blew our minds!” It was at that point that is was very clear to them that they needed to make a change. The Baylor program and the bonus for last minute assignments are classic interventions in the nursing home field to address short-staffing and absenteeism. However, the programs actually contribute to absenteeism and create instability. Dependable staff who commit to a schedule and keep to it don’t know from one day to the next who their co-workers or supervisors will be. This creates stress, and contributes to their own last minute absences. It is hard, too, to work along side others who are being paid $5 or $10 more an hour to come in at the last minute, or who are on their 20th hour as a Baylor and about to be paid for 6 hours of not working.
13
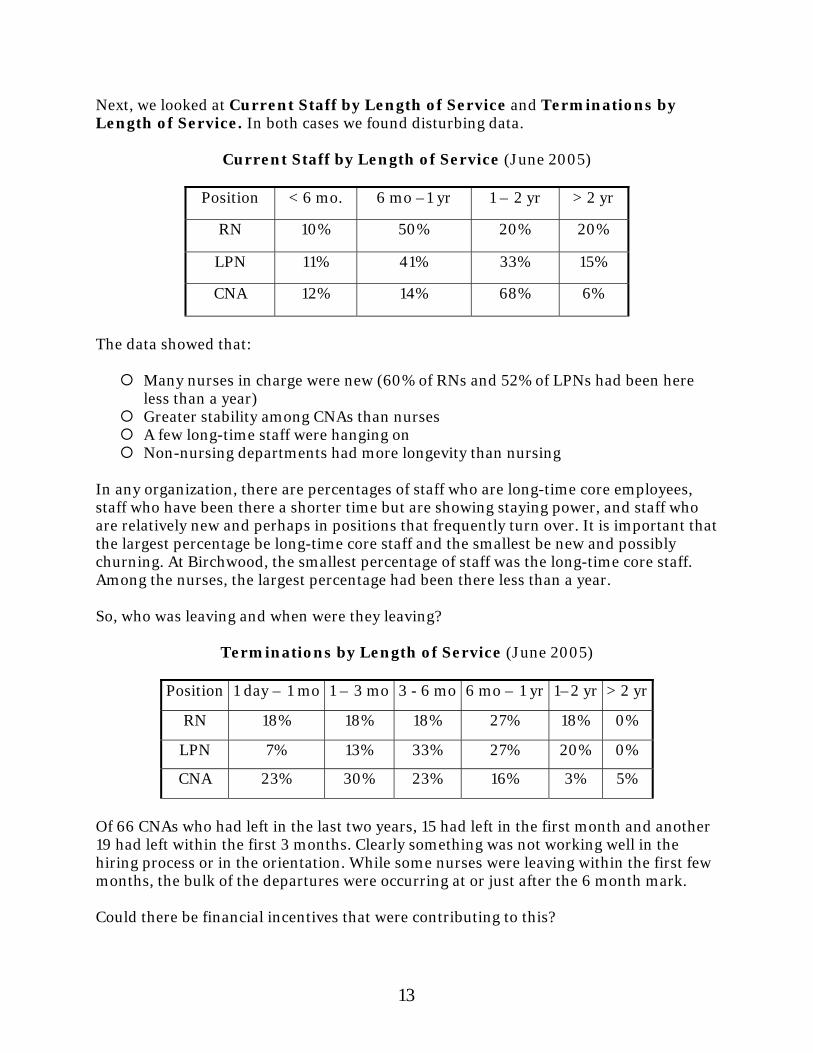
Next, we looked at Current Staff by Length of Service and Terminations by Length of Service. In both cases we found disturbing data.
Current Staff by Length of Service (June 2005)
Position < 6 mo. 6 mo –1 yr 1 – 2 yr > 2 yr
RN 10% 50% 20% 20%
LPN 11% 41% 33% 15%
CNA 12% 14% 68% 6%
The data showed that:
Many nurses in charge were new (60% of RNs and 52% of LPNs had been here less than a year)
Greater stability among CNAs than nurses A few long-time staff were hanging on Non-nursing departments had more longevity than nursing
In any organization, there are percentages of staff who are long-time core employees, staff who have been there a shorter time but are showing staying power, and staff who are relatively new and perhaps in positions that frequently turn over. It is important that the largest percentage be long-time core staff and the smallest be new and possibly churning. At Birchwood, the smallest percentage of staff was the long-time core staff. Among the nurses, the largest percentage had been there less than a year. So, who was leaving and when were they leaving?
Terminations by Length of Service (June 2005)
Position 1 day – 1 mo 1 – 3 mo 3 - 6 mo 6 mo – 1 yr 1–2 yr > 2 yr
RN 18% 18% 18% 27% 18% 0%
LPN 7% 13% 33% 27% 20% 0%
CNA 23% 30% 23% 16% 3% 5%
Of 66 CNAs who had left in the last two years, 15 had left in the first month and another 19 had left within the first 3 months. Clearly something was not working well in the hiring process or in the orientation. While some nurses were leaving within the first few months, the bulk of the departures were occurring at or just after the 6 month mark. Could there be financial incentives that were contributing to this?

14
Financial Incentives – Bonuses (June 2005)
Bonus Amount Offered Quarter Pd - Annual Est.
Sign-on bonus Paid after 6 months
RN -- $2000 LPN -- $500 CNA -- $250
$12,500 - $50,000
Referral bonus Paid after 6 months
RN, LPN --$1000 CNA -- $500
$1,500 - $6,000
Longevity $0 $0
Raises Average 2% $90,710
Birchwood’s sign-on bonus kicked in at the 6 month mark. So did its turnover of licensed nurses. Its data showed it was putting more emphasis on recruitment and hiring than on retention. While it had paid out $50,000 for sign-on bonuses, it had no longevity bonus in place, and it was paying an annual raise averaging 2%. Here again, Birchwood was rewarding behaviors that were hurting its stability and not rewarding behaviors it sought to encourage. What was all this turnover costing? In 2004, it cost $3,207 for each CNA who left and over $4000 for each nurse who left. Its total cost for turnover in 2004, for all positions, was $453,940.
Turnover Costs (calculated in June 2005)
Position Per Person Annual Cost
RN $4,899 $53,889
LPN $4,193 $62,895
CNA $3,207 $205,248
Other $2,692 $131,908
Total 2004 $453,940
How did that measure up with what it was spending on retention? What if these funds could be reinvested in retention efforts? Putting all the incentives together, Birchwood was able to look at what its instability was costing it compared to what it was spending to increase its stability. It turned out that it was spending over a million dollars per year on turnover and practices that accelerated the turnover. By contrast, it was spending one tenth that amount on investments in stability. No wonder it was getting the results it was getting.

15
Instability vs. Stability (June 2005)
Costs of Instability Investments in Stability
Last minute bonus $360,000
Perfect attendance $ 0
Baylors $268,994
Raises @ 2% $90,710
Sign-on bonuses $50,000
Referral bonuses $6,000
Turnover costs $453,940
Longevity bonus $0
Total: $1,132,934
Total: $96,710
The good news was that there were resources available that could be redirected to serve its organizational goals. The data provided the information necessary to take the next steps – develop a plan of action. 3. A New Approach Once West and Fortin looked at the data, they saw that what they were doing wasn’t working. They needed a new approach. They focused on three goals for a six month (from July 1 – December 31, 2005) effort to stabilize staffing:
• Increase the percentage of full-time staff • Increase the percentage of new hires who stay
• Improve attendance; decrease the number of shifts with last-minute absences
Increase the percentage of full-time staff:
To increase the percentage of full-time staff, West worked with his district office on a wage package that made working full-time the best deal in the house. By eliminating the last-minute assignment bonus and phasing out the Baylor program, West was able to free up considerable resources. He redirected those resources to a wage increase that only full-time staff and part-time staff in the nursing department were eligible to receive. Staff who work 24 hours per week are eligible for benefits, so with the wage package, it was a good deal for staff to switch from per diem to become a regular part of the staffing team.

16
Raises for Full-time Nursing Department Staff (August 2005)
Position Old Wage Range New Wage Range Raise Amount CNA $9.25 to $10.50 $11.50 to 12.75 + $2.25 LPN $15.00 to $16.70 $18.00 to $20.50 + $3.00 to $3.80 RN $18.00 to $20.50 $23.50 to $26.00 + $5.50
West and Fortin began an aggressive internal marketing campaign. They sat down one-on-one with each part-time, per diem, and Baylor staff person to talk about what the raise, plus benefits would mean for them. By December 2005, they had gone from 60 full-time employees in the nursing department to 80. Some staff converted from per diem to full or part time. Some former employees returned. As Birchwood brought on new staff, it almost exclusively hired for full-time positions. A year later, in December 2006, they had 96 full-time employees in nursing, an increase of over 50%. The shift has been cost neutral; dollars that were going to Baylors for hours they didn’t work are now going to full-time employees for hours worked. They hadn’t anticipated the increased cost for benefits to the increased number of full-time employees, and yet the investment in their staff is still a better deal than what they were spending before. Not only does Birchwood tell applicants it is looking only for people who can work full-time, but also it is receiving inquiries from nurses and CNAs who want to work full-time. This too is a shift from the perception in the field that many nurses especially are looking for part-time work. When the work is stressful, it is natural to try to minimize time at work. Now that people are able to take care of each other, people want to come to work. For the first time in her five years as Director of Nursing, Fortin has applications in her desk drawer of nurses who want to work full-time for her and are waiting for openings. There were two dynamics to the wage bump that West and Fortin had to deal with. One they anticipated – that the advantage of the wage increase would be short-lived, that their competitors in the area would quickly move to match their wages. The other, they hadn’t been prepared for. While they had the advantage in the labor market, they suddenly had a large pool of applicants, not all of whom were well suited for work at Birchwood, many of whom were attracted primarily to the wage rate. After a few false starts with new hires led to some quick terminations, they revamped their screening and hiring process. This was an area they were concentrating on anyway as their second goal, to increase the percentage of new hires who stay.
Increase the percentage of new hires who stay Increasing retention of new hires involved both a better hiring process and a better welcome process. B & F Consulting, with David Farrell, facilitated a couple of training sessions with the department heads to talk about screening and interviews. Farrell drew on his work on the Pillars of Retention to provide concrete proven strategies that Birchwood could immediately put into practice. West changed his screening and hiring system to involve his managers, and worked with them to develop their skills.

17
o Hiring Skills: To develop their skills, the managers did mock interviews with
people posing as applicants. Those posing as applicants played out particular scenarios or personalities so that the managers had practice managing difficult situations – a shy person, one with latent anger, someone not quite straightforward enough. Together they looked through applications of new hires that had not worked out and discussed red flags to beware of. For example, an applicant whose previous work history involved a lot of sitting might not work out in a job on her feet all day.
o Hiring System: West and Fortin decided to focus their hiring efforts on new
entries to the field rather than on people who had worked at other facilities in the area and perhaps not performed satisfactorily. So they hired through their own training class.
Their goal is to get the right people into the class. They set up a three part process, each requiring attendance and timeliness, a first screen. First is an open house which includes an information session and a tour of the building. Each manager takes two or three applicants on the tour, invites their questions and encourages them to interact with residents. Applicants are told this is their chance to convince the manager to have them back for an interview. While applicants are getting to see the building, managers get to see the applicants’ abilities to relate to residents.
After the tours, the managers meet together and decide which applicants to interview. They make three piles – yes, no, and maybe. They look over the applications, looking for red flags. They identify areas to be probed in the interviews or reference check. Applicants have two more appointments to keep – the interview and a pre-employment physical. If they make it to the class, Birchwood now finds they’ll make it through the class and onto the floor.
o Welcoming System: Birchwood has worked equally hard to revamp its welcome
so that new employees settle in well. On the evening shift, the entire staff takes responsibility for helping new co-workers succeed. The experienced staff work one-on-one with the new staff, and take their new staff with them on breaks and to meals. Sometimes the staff have pizza together to welcome their new workmates.
New staff have a two day orientation. On day two, the nurse in charge of the mentor program sets up each new employee’s schedule, teaches them how to read their schedule, connects them with their mentor and follows-up throughout the first few weeks. Managers and supervisors now have it as a priority to check in how new staff are doing, the first day and onward. They discuss new staff at morning stand-up.
These efforts were successful in increasing the percentage of new hires that stayed. In June 2005, 34 of the 66 CNAs who had left in the previous 12 months had left within their first 3 months of employment. By Dec. 2005, they were still losing new employees because they were attracting a lot more applicants because of their higher wages and improved reputation as a workplace, and they had not yet instituted the careful screening process. They put the screening process in place in 2006. As of Dec. 2006,

18
their long time staff were staying so that a third of their staff had been there more than 2 years, and their new hires were staying through the first six months, and beyond.
Staff by Length of Service (2004 compared with 2006) Reflecting back on the change in practice, Fortin remembers their desperation to plug a hole in the schedule, even when it meant hiring someone who’d been “no-call, no show” at another facility. “We’d hire them and hope they’d work out,” she said. Now, they have high standards in their hiring. They don’t hire people they have doubts about. They hold each other to the high standard. It’s caught them by surprise how much the staff have supported them in this – reliable staff want management to hire reliable staff. As they’ve held to the high standard and hired people they have confidence in, they’re no longer facing desperate moments when they have to plug a hole. The old practice, so common in the field, perpetuated the instability. High standards, careful hiring, and a good welcome, build and maintain stability.
Improve attendance; decrease the number of shifts with last-minute absences
Birchwood began to embrace high standards for attendance. The first step was to track attendance, by individual and by department. West, being a firm believer in process improvement, told his managers, “What you collect is what’s important to you. When we focus on something, we make it work.” So they started monitoring employee attendance. Employees received their monthly attendance record with their paychecks. Managers analyzed the absences for patterns and met one-on-one with each individual with significant absences to communicate their concern. Rather than a strictly punitive approach, managers worked with employees with a lot of absences to reduce their hours to a more manageable schedule, or made other adjustments in their assignment to help them succeed. They also took action when it became apparent staff couldn’t be depended on. And they rewarded those with good attendance. They came to realize that when they were dealing with 3-4 call-offs every day in June 2005, they were constantly focused on that day’s staffing. Managers, the scheduler, supervisors were playing a daily game of “let’s make a deal” to do anything they could to get staff to come in or to stay over. They were plugging holes everywhere and never looked up to get control of the schedule. Their quick fix approach was so short-sighted that they didn’t see they were never going to get their heads above water.
Length of Service 2004 May 2006 Dec 2006 < 6 months 12.00% 23.00% 31.51% 6 months to 1 year 14.00% 5.19% 15.07% 1 to 2 years 68.00% 35.00% 20.55% > 2 years 6.00% 36.36% 32.88%

19
Birchwood’s management took control of the schedule, and they now hold each other to their commitment to expect and reward attendance, and to not tolerate excessive absences. In a meeting to reflect on what a difference a year makes, they couldn’t remember the last time there had been a “no call-no show” except for a new staff person who had misread her schedule. “You’re never going to get to perfection,” Fortin said. “There’ll always be staffing issues. But now things are steady enough that when something comes up we can deal with it.” They have many days now with no last minute absences. They’ve changed their bonuses to be able to reward attendance and staying power. If an employee works all her scheduled hours in a given month, she gets a $25 bonus credit for that month. At the end of the year, all the bonus credits are paid out. The maximum payment is $25 for each month of perfect attendance, or $300 for the year. In December 2006, Birchwood paid out $13,000 in attendance bonuses. By contrast, in their June 2005 data, they had paid out $360,000 in bonuses in the previous year for people to pick-up last minute assignments to cover for others who were absent. By the fall of 2005, Birchwood was already feeling the positive affects of its stabilization efforts. As it slowed its vicious cycle of turnover and absenteeism, West and Fortin asked their managers and supervisors to take up their leadership roles with more confidence. Now that staff could be counted on each day, supervisors needed skills in how to work with staff to bring out the best in them. 4. Leadership Development – Building Skills and Systems Birchwood participated in a three part Leadership Development training program offered by BJBC-VT and taught by B & F Consulting. In addition, B & F provided on-site assistance with teamwork and problem-solving for Birchwood’s nursing management and supervisors. The leadership development efforts focused in two areas: building skills and building systems. In both areas the core concept is relationship-based leadership. The challenge is to build both skills and systems that support relationships. The training drew from two texts: What a difference management makes! by Susan Eaton and The Leadership Challenge by Kouzes and Posner. Each of these texts identifies five key practices for effective leadership. The essence of their messages was to approach the practice of leadership by bringing out the best in others. Eaton had studied nursing homes with high turnover and homes with low turnover drawing from the same labor pool and had determined that five key management practices explained the difference in turnover at these homes:
• High quality leadership at all levels of the organization: Top leaders need to cultivate leadership among mid-level supervisors and non-supervisory staff. This includes building skills and creating systems for self-direction and shared decision-making. An example is start-of-shift meetings in which all staff share in thinking about what is needed for the day to go well.

20
• Valuing staff in policy and practice, word and deed: Valuing staff needs
to be real and pervasive. Staff want genuine appreciation for a job well done, and understanding for the challenges they face in their personal lives. The daily interactions in the workplace set the tone for appreciation and valuing.
• High performance, high investment human resource policies and
practices: Commitment is a two-way street. Organizations that show respect and loyalty gain respect and loyalty. Policies that send staff home if the census undermine the compact between employer and employee about the work schedule. Wages, benefits, orientation, training, scheduling all have an impact on retention. High investments in staff bring staff investment in the organization.
• Work design that supports staff’s intrinsic motivation: Staff work in this
field because they have a calling to care for others. Work patterns that build on this motivation support retention. For example, consistent assignments foster relationships and teamwork while constant rotation of assignments disrupts those relationships.
• Sufficient staff and resources to do the job humanely: Staff don’t want to
work short. They want to have enough time with each resident to care humanely. Eaton’s work which focused specifically on nursing home management practices, reinforced lessons from The Leadership Challenge, in which Kouzes and Posner identified five practices of exemplary leaders:
• Model the Way: Effective leaders walk the talk and lead by their example and their actions.
• Inspire a Shared Vision: Effective leaders bring everyone together for a
common purpose.
• Challenge the Process: Effective leaders are able to look at a current practice and see that it isn’t working and are willing to try new ways of doing things even if they go against the way it’s always been.
• Enable Others to Act: Effective leaders give staff the knowledge, skills, and
tools they need to act and then step back and make room for them to do so.
• Encourage the Heart: Effective leaders focus on encouragement and support, bringing out the best in those around them.
The training programs included experiential learning opportunities to explore these concepts and homework assignments that guided participants to apply these concepts in their workplaces in between sessions. In concurrent on-site work, B & F Consulting met with Birchwood’s nursing leadership in facilitated problem-solving meetings focused on

21
workforce and workflow. Now that staff was stabilizing, supervisors were struggling with how to guide staff to work better together. Supervisors voiced concern that they were either too lenient or too harsh. Talking it through together, nurses explored ways of being neither lenient nor harsh, but instead holding their staff to high expectations and helping them meet these expectations. They also brainstormed ways of resolving problems each was facing. In their collaborative problem-solving on workforce issues, one nurse discussed a new hire on the short-term rehab unit who wasn’t keeping up. Another nurse volunteered to have the new hire switched to the slower pace of her unit. In problem-solving on workflow issues, a nurse said that she cried when she saw the breakfast cart come because she wasn’t ready to pass out the trays. Another nurse offered to have the cart come to her floor first and then Fortin said she would talk with the Food Service Director about holding the trays for that unit until they were ready to receive it. The nurses began to problem-solve together and become a support group to each other, with Fortin playing a key role in facilitating the process. After one such meeting, in which staff had been particularly creative in brainstorming solutions, West wrote a congratulatory note to all who had participated, saying,
“We had a great meeting with the people from Better Jobs Better Care Grant. Everyone brought insight and the reality of what we do. Honest discussion is what will move us forward and improves our system of delivering care for our patients and staff…. I am impressed and thankful that we recognize that sometimes our systems are set up because ‘it is just the way that we have always done it.’ Let’s break the mold, think outside the box, and make it happen!”
Birchwood was experiencing a new energy. Staff were able to shine. They were working better together in thinking things through and finding new ways forward. 5. Results By the following May (2006), Birchwood had created a new norm -- daily stability. It had broken the vicious cycle. It had seen a 33% increase in percent of full-time staff. With high retention and attendance, it was more fully staffed each day, so care became manageable and the environment more positive and supportive environment. West had begun working with department heads to grow their leadership skills. He said, “I expect more from them and I’m working with them to meet my expectations.” Fortin said that she had learned that “leadership is all about relationships. Anyone can be a leader. You have to understand your impact and bring out the best in the staff.” Her staff was stable enough that she could invest in helping them to develop and she was supporting a number of her nurses in pursuing further education. As West and Fortin reflected on what was different a year after the drilldown, they noted:
• Now that we have more staff, people aren’t as stressed. They are more able to help each other out. We don’t hear “not my hall”

22
• Nurse managers “model teamwork instead of conflict” • We have trust among the team; we can say “time-out, let’s look at this” • Now they are hiring for full-time positions and they take their time now to hire
right • The schedule runs smoothly now; no favoritism and now we have consistent
attendance • Consistent attendance is allowing us to move to block assignments • There is better team problem-solving on the units • Now we can take on individualized care
The concurrent efforts at fiscal and management practices paid off. Birchwood broke its vicious cycle of turnover, vacancies and stress. It reduced its overall turnover, as well as its turnover of new hires. In 2004, its turnover rate was 61.5% and by 2006, its turnover had had a relative decline of 16%, to 50.53%. It increased its number of full-time staff from an average of 105 in 2004 to 123 in 2006.
Full Time Employee 2004 2005 2006 Jan 104 105 121 Feb 105 109 119 Mar 106 104 120 April 101 109 128 May 107 112 128 June 101 108 128 July 101 106 128
Aug 108
119 126
Sept 99 125
125 Oct 112 128 115 Nov 109 127 118 Dec 108 122 122 Average 105.08 114.50 123.17
Birchwood’s staff composition has steadily shifted to full-time, long-term employees:
Turnover 2004 2005 2006 RN 62.6 54.2 50.7
LPN 37.5 30.4 19.5 LNA 84.4 95.8 81.4
Average 61.5 60.13 50.53
New wage package Switched to laundry and housekeeping contract

23
RN LPN LNA Employment Status 2005 May 2006
Dec. 2006 2005
May 2006
Dec. 2006 2005
May 2006
Dec. 2006
Full Time 27.00% 56.00% 70.83% 55.50% 67.88% 84.38% 48.00% 65.75% 82.61% Part Time 13.00% 18.75% 16.67% 0.00% 7.14% 3.13% 10.00% 13.70% 2.90% Per Diem 47.00% 18.75% 8.33% 18.50% 7.14% 3.13% 9.00% 5.48% 4.35% Baylor 13.00% 6.25% 4.17% 26.00% 17.86% 9.44% 32.00% 15.07% 10.14%
Length of Service 2004 May 2006 Dec. 2006 2004
May 2006
Dec. 2006 2004
May 2006
Dec. 2006
< 6 months 10.00% 6.25% 22.73% 11.00% 16.67% 24.24% 12.00% 23.00% 31.51% 6 months to 1year 50.00% 0.00% 4.55% 41.00% 0.00% 18.18% 14.00% 5.19% 15.07% 1 to 2 years 20.00% 18.75% 18.18% 33.00% 16.67% 12.12% 68.00% 35.00% 20.55% > 2 years 20.00% 75.00% 68.18% 15.00% 66.60% 45.45% 6.00% 36.36% 32.88%
In 2005, its licensed nursing staff was predominantly per diem and Baylor who had been there less than a year. Eighteen months later, its licensed nursing staff is predominantly full-time, and staying for the long term. Birchwood is now a place people want to work. Their experience debunks the myth that nurses really prefer part-time work. Once it’s a good place to work, nurses are eager for full-time positions. Birchwood’s most recent numbers reflect that their positive results have been sustained.
2/15/05 2/15/07 Open LNA positions 14 2
Open staff nursing positions 6 0 Full time LNA 31 51
Full time nurses 18 31 Per diem employees 22 6
These results are not just because of the changes in financial incentives but also because of the changes in management practices. The stability brought by the fiscal practices allowed the management to put in place key practices to promote and support that stability. For example, once experienced staff shifted back to full-time and reduced their absences, they stabilized. Once they stabilized, they had a manageable workload because they were fully-staffed on most shifts. Once they had a manageable workload, they were able to provide a better welcome to new hires. Each practice reinforced the others and they built on each other. The end result was a better environment for everyone. In January 2007, the brag board was full with thank you’s from staff to each other for how they’d all pitched in to help through the holidays – “You guys are awesome;” “thanks for the great and positive attitudes;” “thanks a million for the team you are creating;” “thanks to all who pitched in;” “you rock the house.” People covered for each other so that they could each have time to celebrate the holidays and still maintain good staffing. In day-to-day exchanges around the building, staff voluntarily help each other. A beautiful hand-painted sign in the lobby said, “Live well, love much, laugh often.” Indeed, Sue Fortin said,

24
“It’s so much fun coming to work. We laugh here all the time.”
West notes that now “our goal is not to lose focus of where we were and how we got where we are. I had a team meeting yesterday to focus on some key areas as a management team. One area is to continue to improve retention. I have a great nurse that is going to run this committee. No one wants to go back to where we were - great motivation.” Conclusion: A Lesson Learned When asked to share lessons from his experience, West wrote:
The other really important message from our work with you is to remember to take the time to sit and reflect on the positives. I remember when you were coming up to talk about "our story." I thought "what story?" But by taking the time and talking about the changes we were able to see we were moving in the right direction. I feel that is a very important message. While we try to be proactive often we are reacting to something during the day and that tends to be the focus.
Long-term care work is so demanding and fast-paced that there is often little time for reflection. Yet when we stop and look at what we are doing, or what we have accomplished, we come to see it for what it is. When it’s not working, the reflection gives us a chance to change it. When our changes have brought positive results, the reflection let’s us take stock of what we have accomplished so that we have it, and don’t lose it. Thus, we end on a cautionary note: David Farrell, a prime architect of the drilldown, often notes that “nursing homes are fragile eco-systems.” As remarkable as the achievements at Birchwood are, they can easily be undone. Typically, success lulls people into thinking that the problems are forever gone. However, eternal vigilance is the price of stability. As soon as a provider starts to cut corners again, say, to lower the amount of the bonus for perfect attendance, any short-term savings from such a measure will likely start to cost, before too long, in slippage. With a 10:1 ratio of investment in instability to investment in stability, any cut in stability will cost tenfold. Our field cannot afford a return to the industry norm of penny-wise and pound foolish.

25
Appendix A Do Your Management Practices Support Stability or Instability?
“They are staying with nursing, just away from the stress of the nursing home. When I conducted a learning circle with the …coalition, a very astute person identified a reason for CNA turnover this way: ‘Who wants to clock in to stress?’ Says it all.”
– note from a QIO nursing home specialist Do your management practices support stability or instability? Do they contribute to staff morale or to staff stress? These questions are essential in examining your management practices and determining the best direction to take. One of the myths in long term care is that the reason instability is endemic in our field has to do with the nature of the workforce. However, recent research has confirmed that stress and instability in the workplace have a greater impact on turnover than economic and social factors. Workplace practices are the main drivers of turnover. In CMS funded research in 2002, Susan Eaton studied homes in the same neighborhood, drawing from the same labor market, with far different results in terms of stability. When she compared the practices in the high turnover and low turnover homes, she found 5 distinct management practices in place in the low turnover homes. In What a difference management makes! she describes these five practices as:
1. High quality leadership throughout the organization 2. Organizational practices that value staff 3. Human Resource policies and practices that invest in and support staff 4. Organization and design of work to reinforce the intrinsic motivation of staff to
care for residents 5. Sufficient staffing and resources to provide humane care
These practices reinforce organizational goals of stability by how leaders work with staff, how policies and practices support and value staff, and how the very structure of work allows the flow of daily work to support good care and a good work atmosphere. By contrast, Eaton found in her study that homes with high turnover engaged in very different practices, practices that are unfortunately prevalent in the field. It is the practices themselves that create the instability in the workplace. The instability becomes a vicious cycle of vacancies, absences, stress, and turnover. Many of these management practices reflect a “conventional wisdom” that has turned out to be not so wise after all. Because these practices are widespread throughout the country, they are seen by nursing home management as the “right” way to do things. But although they are practiced widely, they are not good management practices. To the contrary, they actual contribute to and increase the high turnover that in our field. Most of this conventional wisdom needs to be reversed. Many of the prevalent practices provide perceived short-term gains at the expense of long-term stability. In fact, even in the short-term, they undermine stability. They bear revisiting.

26
These conventional wisdoms were revisited both in the BJBC-VT demonstration project presented in this paper and in a year long pilot, Improving the Nursing Home Culture, funded by CMS and coordinated by Quality Partners of Rhode Island. Both the BJBC-VT demonstration project and the CMS pilot drew on the practices identified by Susan Eaton. In the BJBC-VT demonstration project, one home, struggling with high turnover, replaced many of the management practices it was using that were in line with the norms of the field with new management practices that are in line with the research about best practices. At the same time, from 2004 – 2005, two hundred fifty-four nursing homes from 22 states participated in the CMS pilot, also replacing traditional management practices with new ones based on the work of Eaton. The two initiatives informed each other and in the end, their results were parallel in proving the wisdom of the new practices. The case study presented here captures the staggering and sustained improvements achieved by the Vermont home. In similar fashion, in aggregate, the 254 pilot homes showed remarkable improvement. They not only improved their staff retention, they also improved their clinical outcomes. Stable staffing allowed the homes to provide better care. This appendix identifies practices to support staff stability found by Eaton, the INHC pilot, and this case study. It contrasts prevalent practices in the field that actually promote instability with preferred practices that promote stability. It addresses practices in several areas and concludes with a few essential management practices that support workplace stability. The practices reviewed are in three areas:
1. Hiring 2. Attendance, Scheduling and Assignments 3. Management relations with staff
1. Hiring
Prevalent Practices that Undermine Stability
Preferred Practices that Support Stability
Sign-on Bonuses Refer a Friend Bonuses
Encouraging Benefit Give-up through Pay in Lieu of Benefits
Encouraging Benefits and Making them Affordable
Ceilings on Raises for long-time employees
Longevity Bonuses
Plug-in-the-hole Hiring Hiring Full-time Employees Any warm body Hiring High standards in hiring; taking time
to hire right Lack of adequate orientation; Rotating new hires so they have experience on every unit
Thorough orientation to residents, co-workers, and the organization; Creating a stable environment to help new hires acclimate and settle in

27
Sign-on bonuses vs. Refer a Friend Bonuses It is quite common to see advertisements in the Sunday papers for nursing home staff that boast of large sign-on bonuses. Because so many homes offer them, other homes feel compelled to do so to compete for staff. Homes that offer sign-on bonus should closely monitor how long staff stays. They may find to their dismay that there is a significant bubble of high turnover at the date of the bonus payout. Sign-on bonuses as the operative motivation for someone joining the staff demonstrates a commitment to the cash bonus rather than to the home or to the residents. Additionally, it sends a bad message to full time regular committed staff. First, it makes it hard for those who are committed to residents and to their co-workers to hold onto this value when they see others come and go for the bonus. They talk about how bad it feels to be the one who has been holding things together with no extra compensation only to find that a new employee has a better financial deal than they do. A better use of bonuses is to give them to employees that refer a friend who then comes to work and stays a length of time. While sign-on bonuses are a recruitment strategy, refer a friend bonuses are both a recruitment and a retention strategy. Word of mouth is the best way to advertise. Having your reliable staff refer people they think will work well strengthens your workplace. A refer-a-friend bonus is a way of saying that you know that your good workers probably have friends who are good workers. A 2002 Gallup poll found that workers tend to stay in jobs where they have friends. Friendship at work is a key ingredient in retention. The financially rewarding bonus then is in the hands of your good worker. This is a win-win solution.
Encouraging Benefit Give-up vs. Encouraging Benefit Take-up Many homes offer an employment option whereby staff receive higher pay in lieu of benefits, including paid time off and especially an opt out of costly health insurance. While this may be a good arrangement in limited situations where this is a second job or an employee has other options for health insurance, it has serious ramifications that should not be overlooked. When low wage workers are offered a higher wage in lieu of healthcare insurance, many workers gamble and take the higher wages because they are struggling to make ends meet. Offering this kind of option to workers puts them in a position to have to choose between their health and perhaps their rent, groceries or utilities. However, it then leaves staff in a very vulnerable position when they have medical needs. Direct care work is hard. Many staff routinely work hurt because their injuries have occurred from years of lifting and bending and are therefore not covered by workers’ comp. Staff are exposed to illnesses at work, and often have chronic conditions that require medications and treatment. Allowing employees to opt out of benefits began as a way to allow for staff whose spouse provided benefits to opt out of the costly benefits. It was seen as a way to contain the high cost of medical insurance. It worked well for employees who received insurance
28
from a spouse. This seemingly innocuous practice has taken a dark turn. In some homes there is an encouragement to opt out of benefits even for those who do not have other coverage. When employees are put into this forced choice between slightly higher wages or health care, and when their wages are not adequate to meet their needs they are in a no-win situation. They often choose the slightly higher wage, gambling on their good health. A better way is to be sure to offer an adequate affordable health benefit to all employees. While the rising cost of health insurance makes that seem like a difficult option, an analysis of the costs of absences and turnover related to workplace injuries and illnesses, might demonstrate that offering insurance is cost effective. Whether or not it immediately pays for itself, it is a management practice that puts staff’s well-being first. After all, you want healthy employees. Additionally it is a good practice to offer low cost in-house health promotion to our staff such as flu shots, vitamins, healthy meals and healthy vending machine options, regular physicals, and health promotion opportunities such as smoke cessations programs and weight loss clinics. When we take good care of staff, they are better able to take good care of residents.
Ceiling on wages vs. Rewarding Longevity
Many nursing homes have a ceiling on wages. In an effort to keep wages affordable and to maintain an upward limit on pay per position many homes put a cap on the uppermost end. At a certain point then, your most reliable, long-term staff stop receiving raises. This can prevent their wages from keeping up with inflation. It can put your senior staff in a position where they see new hires being brought in at a rate close to theirs, negating their years of experience and loyalty. While the cap saves on some costs it may incur others. If the staff with the most longevity do not feel that they are adequately compensated they may in discouragement leave. While the home may save money filling their position at a lower starting wage rate, the home loses the institutional memory and consistency of care that staff with longevity bring. New hires can easily turn over again so a once stable position becomes an unstable one. Turnover costs, on average, $2,500 - $3,500 per CNA turnover. Applying those funds to retaining your long-time staff through longevity bonuses is a much better use of limited resources. To promote longevity, staff should be supported with regular raises where years of service bring financial recognition. In addition to raises, longevity bonuses are a way to show long time staff that they are valued. This is a shift in how resources are used—from costs associated with turnover to costs associated with longevity and retention. Plug-in-the-hole hiring of part time staff vs. Hiring Full-Time Staff
Often a home will look to part time staffing as a solution to problem vacancies. Many nursing homes have a mosaic of part time staff, especially among their licensed nurses. This is done in the mistaken belief that nurses only want to work part-time, and that it saves money to hire part time and per diem workers who do not need high cost benefits.

29
Having a lot of part time staff has a definite down side to it. In some cases homes have had to turn down potential full time employees because they no longer have full time work available—only holes in the schedule to be filled by part timers. A not so apparent down side is staff commitment. When a home has a lot of part time staff, they have staff that does not have the same kind of commitment and follow through as full time staff. Someone who only works two days a week is not likely to be able to come to committee meetings, or be involved in any changes you want to make. Because they are there so infrequently they may not notice the small changes in residents that are the early signs of deterioration that need to be tended to. It creates a hardship on front line staff that look to these positions for leadership. Front line staff in these situations talk about how hard it is to work for so many different supervisors with so many different expectations. It is a conventional wisdom in the field that many nurses only want to work part-time. However, as organizations stabilize, reduce stress, value staff, and thereby become good places to work, they become places that staff would like to work full-time. Birchwood Terrace now has a waiting list of nurses looking for full-time work with them. Hiring full-time staff reinforces stability. Having stability attracts full-time staff.
Any warm body hiring vs. taking time to hire right When faced with an immediate need to fill vacancies, it may be tempting to put aside our hesitation about a potential new hire and “just give it a try.” Even though staff are tired and voicing a need for help when there are vacancies, they really want you to hire reliable dependable co-workers. When new hires are not reliable and dependable, current staff end up working even harder and with resentment. Your staff will tell you that anybody is not better than nobody, to take your time to hire right. Hiring people who don’t meet your standards will likely result in a termination in short order. And you will be in the same situation again, with a vacancy, needing to hire. When you take time to hire right you’re more likely to hire someone who will stay. A good hire who stays and does a good job provides a boost to everyone.
Inadequate Orientation and Rotating Assignments vs. Thorough Orientation and Consistent Assignments
When homes are “working short,” they quite often forgo solidly orienting a new staff member. For example, the new person is put on one wing one day because there is an acute need there, and then the next day is put on a different wing. While this may appear to relieve the shortage for the day, the reality is that it leaves the new person floundering without a way of getting to know the residents s/he is caring for or getting to know co-workers. When new staff don’t know anyone and feel no connection, the difficulties of starting a new job can become overwhelming. It’s not unusual to see a new hire just leave during the break. A better way is to allow the new worker the time for a solid orientation on the unit or neighborhood where s/he will be working. This grounding in knowing both the residents and the new co-workers will make the first few weeks much easier. This time

30
of orientation provides another good opportunity for a bonus – to give a financial reward to the unit that keeps a new staff member on their shift for more than six months. This fosters team work and a communal way of ensuring that new staff members are supported in their transition. 2. Attendance, Scheduling and Assignments
Prevalent Practices that Undermine Stability
Preferred Practices that Support Stability
Staffing to Census Maintaining Steady Daily Staffing Through the Ups and Downs of Census
Baylor Program, working doubles, double doubles, two 12’s
Reasonable Work Hours and Solid Connections to the Rest of the Staff
Bonuses for Taking Last Minute Assignments
Rewarding and Supporting Good Attendance
Rotating Assignments Consistent Assignments Punitive and Inflexible Attendance Policies
Constructive and Flexible Attendance Policies
Staffing to Census vs. Maintaining Steady Daily Staffing Through the Ups
and Downs of Census Many homes reduce their staff on days when their census is low. They feel that they cannot justify having staff on payroll on a day that there are fewer than usual residents. This often occurs when residents are in the hospital or during winter months when many short term sub acute units have beds that are unoccupied. So when the census is low, staff are sent home. For workers who are barely making it on the low wages paid in this field, losing a day of pay is a hardship that they cannot bear. They count on their wages to make ends meet, and do not have other ways to make up the short fall. If we want loyalty from our staff and their commitment, then we must make a commitment in return. We must be able to guarantee hours for our staff. The money saved by sending staff home can cost in turnover when staff leave for another job where they can count on their hours. Another factor that contributes to turnover is the relentless stress of this very hard job. Maintaining steady staffing during the ups and downs of census, allows staff to have days with less stress. Staff will appreciate those times for the way that they can better tune into the care needs of their residents. Steady staffing provides stable employment that staff can count on and some days that are not as hard as other days. Baylor Program Working Too Many Hours Straight vs. Reasonable Work
Hours and Solid Connections to the Rest of the Staff Many homes fill their week-end or night shifts with an offer of employment that pays the worker to work long hours and be paid for more hours than they work. Baylors may work for two twelve hour shifts and get paid for three shifts, or they may work two 16

31
hour shifts and be paid for 40 hours. There are shifts that can be difficult to fill and this has been a way that many homes have filled these slots. However, the down side to this practice is tremendous. When there is a week end Baylor program, it tends to create a separation between the weekday and the week end staff. The week end staff have little interaction with week day staff and so are not tied into the initiatives that the home undertakes. Because they are working so many extra hours in a row, they are often are tired and overworked. This makes them more vulnerable to errors and injuries as judgment is impaired. Other staff may experience greater stress working with a Baylor who may be more short tempered and, in essence, hard to work with. A better way is to eliminate Baylors or to reduce the number of hours they work in a row. One alternative Baylor arrangement is to have the shift be four eight hour days on Friday, Saturday, Sunday and Monday and pay for 40 hours. This provides continuity and a tie in with regular week day staff and manageable work hours for employees.
Higher Wages for Last Minute Assignment vs. Rewarding and
Supporting Good Attendance In order to fill last minute vacancies some homes offer a significant hourly bonus for taking a shift at the last minute. This is a short term solution that creates incentives for instability and contributes to the erosion of full time, dependable staffing. Staff who reliably come to work receive less pay than those who come in at the last minute. It is a better financial deal to take the last minute assignment than to be on the schedule. Those on the schedule never know who they’ll be working with or whether they’ll be working short. The stress and the financial inequity can cause full-time staff to opt, over time, to become part time or per diem and then wait for the last minute call. A better way is to reward full time work with regular wage increases and perfect attendance bonuses. Team rewards to units that go long periods without working short a shift can help everyone pull together, especially when staff are allowed to make changes in their own schedule with co-workers if something does come up at the last minute.
Rotating staff vs. Consistent Assignments Rotating staff assignments is a common practice in long term care. Rotation of staff is thought to be beneficial for a variety of reasons. One of the most common reasons is the desire to have all staff know all residents so that every CNA can care for any resident. Then when there are call-outs, staff can be pulled from anywhere to cover where staff is short. The notion of rotating staff assignments discounts the importance of building relationships, caring about the people we care for, and accountability to those we care for and work with. Homes that have consistent assignments for their staff find that residents have more of a sense of well being, that staff feel more connected to the residents that they care for, that call outs are less frequent, and that turnover is reduced. Additionally the quality of
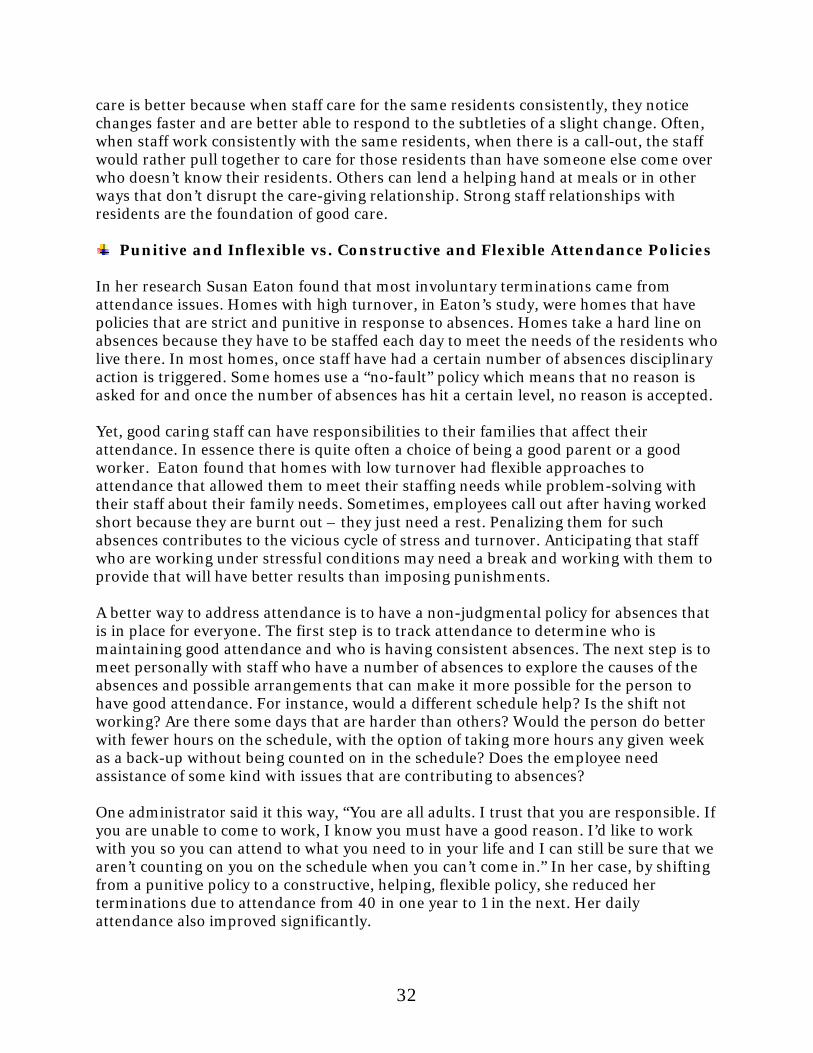
32
care is better because when staff care for the same residents consistently, they notice changes faster and are better able to respond to the subtleties of a slight change. Often, when staff work consistently with the same residents, when there is a call-out, the staff would rather pull together to care for those residents than have someone else come over who doesn’t know their residents. Others can lend a helping hand at meals or in other ways that don’t disrupt the care-giving relationship. Strong staff relationships with residents are the foundation of good care.
Punitive and Inflexible vs. Constructive and Flexible Attendance Policies In her research Susan Eaton found that most involuntary terminations came from attendance issues. Homes with high turnover, in Eaton’s study, were homes that have policies that are strict and punitive in response to absences. Homes take a hard line on absences because they have to be staffed each day to meet the needs of the residents who live there. In most homes, once staff have had a certain number of absences disciplinary action is triggered. Some homes use a “no-fault” policy which means that no reason is asked for and once the number of absences has hit a certain level, no reason is accepted. Yet, good caring staff can have responsibilities to their families that affect their attendance. In essence there is quite often a choice of being a good parent or a good worker. Eaton found that homes with low turnover had flexible approaches to attendance that allowed them to meet their staffing needs while problem-solving with their staff about their family needs. Sometimes, employees call out after having worked short because they are burnt out – they just need a rest. Penalizing them for such absences contributes to the vicious cycle of stress and turnover. Anticipating that staff who are working under stressful conditions may need a break and working with them to provide that will have better results than imposing punishments. A better way to address attendance is to have a non-judgmental policy for absences that is in place for everyone. The first step is to track attendance to determine who is maintaining good attendance and who is having consistent absences. The next step is to meet personally with staff who have a number of absences to explore the causes of the absences and possible arrangements that can make it more possible for the person to have good attendance. For instance, would a different schedule help? Is the shift not working? Are there some days that are harder than others? Would the person do better with fewer hours on the schedule, with the option of taking more hours any given week as a back-up without being counted on in the schedule? Does the employee need assistance of some kind with issues that are contributing to absences? One administrator said it this way, “You are all adults. I trust that you are responsible. If you are unable to come to work, I know you must have a good reason. I’d like to work with you so you can attend to what you need to in your life and I can still be sure that we aren’t counting on you on the schedule when you can’t come in.” In her case, by shifting from a punitive policy to a constructive, helping, flexible policy, she reduced her terminations due to attendance from 40 in one year to 1 in the next. Her daily attendance also improved significantly.

33
3. Management Relations with Staff
Prevalent Practices that Undermine Stability
Preferred Practices that Support Stability
Leave your problems at the door Sympathetic understanding of personal problems
Poor communication; lack of investment in time for communication
Building in systems and skills for communication
Theory X management that focuses on control and punishment
Theory Y management that focuses on support and encouragement
We have a policy and procedure for everything
Independent Judgment and Decision-making
Leave your problems at the door vs. Sympathetic understanding of
personal problems Studies consistently show that workers want to be valued, want to be treated with respect, and want a sympathetic understanding of personal problems. Yet in the field of long term care the prevalent attitude is to “leave your problems at the door.” This attitude assumes that by not allowing for problems to be given any recognition, the employee can put them aside while at work. One astute administrator recently said “we’re dealing with their problems, because they’re dealing with their problems. It’s just a question of whether we deal with them up front and honestly or we force staff underground with what they are dealing with. When we force their issues underground, we wind up dealing with the problems in other ways, when they can’t come to work, or are carrying their worries without any help or recognition from us as their employer. That’s when we can lose a good worker who’s having a bad time of it.” Normal everyday problems of getting through life are compounded in this field because of the difficulties that are associated with low wages. Even staff who are working two jobs are likely struggling to make ends meet, without much cushion to handle any problems related to illness, child care, transportation, or even basic shelter. There is no getting around it—these problems will be dealt with one way or another. Homes that allow for and assist employees with their problems end up with employees who are better able to get to work, and who develop a deep commitment and loyalty to their employer. Often simply being able to take a moment to say what is happening allows the employee to get into work mode. There are situations where the employer can be of assistance. Or the workplace can be the place of stability and safety for workers who may be dealing with uncertainty and hardness in other aspects of their life.
“Many who work in long-term care have hard lives. I want this job to be a place of stability for them. I hope it can anchor life for them.”
Connie McDonald, Administrative Director MaineGeneral Rehabilitation and Nursing Care,
Augusta, ME

34
– Poor communication vs. Building in Systems for Communication
Many homes have trouble in keeping the information flow open and fluid. When staffing is tight, holding meetings to share information is often thought to be a luxury that can no longer be afforded. Then the practices that allowed for good sharing stop. Staff meetings are postponed or cancelled. If the situation gets worse there may be a fear that any opportunity to talk things through will turn into a gripe session instead of a productive meeting. So the staff meeting where issues can be talked through gets indefinitely put off. But open communication is even more necessary when there times are tough and staffing is tight. Issues of how to work together to get everything done are important to talk through. Bringing everyone together helps everyone through the tough times. It let’s staff know what efforts are underway and it gives management valuable information from staff about where the trouble-spots are that need to be kept in mind. Bringing people together is important both on an organizational level and at the unit level. Doing so is important not only in tough times, but also as part of ensuring everyday that people have the information they need, when they need it. Not having information about individual residents, about new admissions, or about other matters relevant to care, actually takes more staff time. It is time consuming to care for people when you do not have accurate up-to-date information. Some systems of supporting good communication that do not take a lot of time but give people needed information include:
quick change of shift meetings with outgoing and incoming staff start of shift stand-up meetings so everyone can be on the same page together
about their responsibilities for the day mid shift huddles that allow for a staff refocus on what is needed on their shift end of shift check in on how the day went and what issues or developments
everyone needs to be aware of meetings of the nursing staff that look not only at clinical issues related to
residents, but that also look at human resource issues such as how new employees are doing or how to help out on a unit that is working short
Lack of communication and lack of systems for communication add to staff stress. Stress contributes to call-outs and to turnover. Systems that support regular communication provide the structure for teamwork and contribute to stability – both in the day-to-day and in the overall work environment.
Theory X vs. Theory Y approach to management. “Theory X- Theory Y” is a management theory that matches management practices to underlying beliefs about what motivates people. It proposes a continuum. On one end is Theory X. At this end is the belief that people are intrinsically unmotivated and will do whatever they can to avoid responsibilities. In response, management practices need to be punitive, harsh and directive. At the other end is Theory Y which holds the belief that
35
people are responsible, conscientious, mature and motivated. In response, management practices need to bring out the best in the staff by supporting, including, and trusting employees. The field of long-term care is made up of employees who come to this work as a calling. Yet the field historically has had a top down, directive, punitive approach to management in general. A national nursing home leader likened the nursing home management approach to leadership approach found in the military. This Theory X approach to management that is so prevalent in long-term care has a counter-productive effect on staff, even people who are responsible, conscientious, mature and motivated. By contrast, the Theory Y approach unleashes employees’ creativity and commitment and generates high performance. Unfortunately, many homes have people in management positions who have not had any training in supervision. Most nurses in supervisory positions have worked their way up by being good nurses. But being a good nurse is very different that being a good supervisor. Without training, supervisors and managers are left to figure out for themselves how to handle the daily challenges on the job. Because the norm in long-term care is more harsh and punitive, people coming into supervisory positions often see that as the standard they need to follow. These factors have led to a harsh way of managing that does not bring out the best in staff. The punitive, command and control approach to supervision has actually led to people leaving this field. A better approach is a positive chain of command in which everyone is actively involved in supporting everyone else. Good supervision is about getting good results, not primarily by disciplinary action or by being soft, but more by setting high standards and helping to support people in reaching those high standards. It is really about seeing potential in someone and then helping them to develop that potential. It involves understanding what motivates people and drawing on their “intrinsic motivation.” When workers talk about what brings them into this field they talk about a calling to work where they help others. In interviews with workers who have left employment, again and again the response is that they leave because they felt disrespected and unseen. An organizational culture that supports nurses as they support their frontline staff gets better results. We have a policy and procedure for everything vs. Independent
Judgment and Decision-making Today’s nursing homes are highly routinized with little room for individuality on the part of either the resident or the worker. Intense regulatory pressure and a highly litigious environment have led many nursing homes to try to have answers for everything. Because the policies attempt to answer every possible situation that might arise, this approach discourages staff from using critical thinking for anything. The issue is further compounded because many of the practices that have become embedded in policies have been a blanket approach that is designed to protect the

36
organization. They are not necessarily the best approach for each individual resident. Staff are often put in the position of enforcing practices that they know aren’t working, with little avenue for raising the concern, let alone, resolving it. As homes begin to re-examine long-standing procedures and practices, they need to have staff fully engaged in the process. They need staff’s questions, their concerns and their ability to help think through new and better approaches to care. They need staff to use critical thinking and to use their expertise when changes are considered.
4. A Few Essential Management Practices that Support Staff Stability:
Managing by walking around Good managers are in touch with those they manage. Managing by walking around is a regular daily walk through to be available and in touch with staff, to see what people need to do their jobs, how new employees are faring, and where the trouble-spots are that need attention and assistance. It is not micro- managing, checking up on people, or walking around to see what is being done wrong. It is a way of supporting people.
Group rewards vs. individual rewards While individual rewards are important, group rewards provide an extra benefit. They recognize good efforts while helping teamwork and cohesiveness to flourish.
Recognition and appreciation only works when relationships are good When people are not getting along well with each other, they are not likely to enjoy a pizza party, employee recognition event, or other signs of appreciation. Their concerns about the difficulties of their working situation will overshadow their ability to receive the appreciations being offered. However, when people are working well together every day and feeling good about their jobs, the appreciations are real celebrations. For appreciation to be truly felt it must come as a genuine gesture of thankfulness. It will fall short if it is perfunctory and not heartfelt. Genuine appreciation comes when we have taken to time to establish relationships with those who work with us.
Mentoring and developing managers and supervisors Good managers develop others. They have high expectations and help others to take on challenges and grow into them. As part of an overall strategy, assess your managers and supervisors individually and figure out how to help them be their best.
Expect people to perform at their best and help them get there Having high expectations is the key. It is in human nature to want to excel. By having high expectations we are tapping into a basic human desire for mastery. Then, help people meet those expectations by nurturing and developing them.
Meetings to focus on workforce and workflow, not just on care If we take care of our staff, they will take care of residents. In nursing homes the general focus has been on care. To get good care, we need to have an equal focus on how staff are doing and where the trouble-spots are in daily operations. Our world is not just a place where our residents get the care; it is also a work place. When we care for staff, they stay. When we have a stable staff, we give better care.
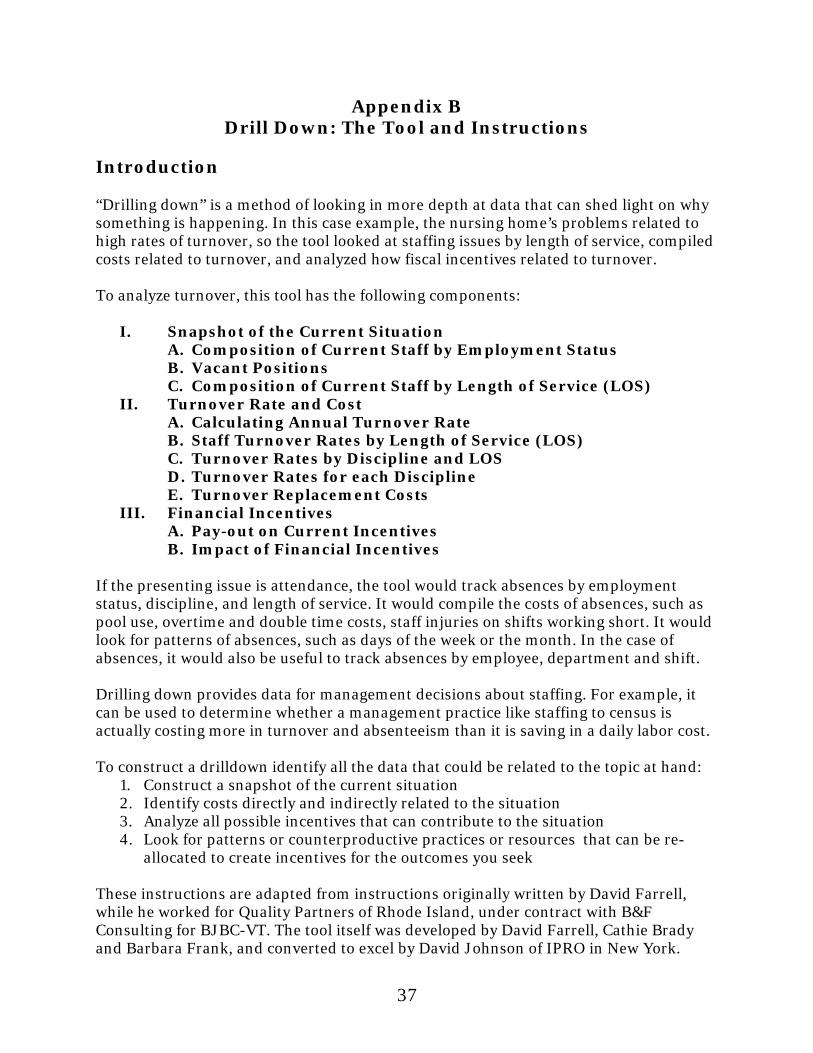
37
Appendix B Drill Down: The Tool and Instructions
Introduction “Drilling down” is a method of looking in more depth at data that can shed light on why something is happening. In this case example, the nursing home’s problems related to high rates of turnover, so the tool looked at staffing issues by length of service, compiled costs related to turnover, and analyzed how fiscal incentives related to turnover. To analyze turnover, this tool has the following components:
I. Snapshot of the Current Situation A. Composition of Current Staff by Employment Status B. Vacant Positions C. Composition of Current Staff by Length of Service (LOS)
II. Turnover Rate and Cost A. Calculating Annual Turnover Rate B. Staff Turnover Rates by Length of Service (LOS) C. Turnover Rates by Discipline and LOS D. Turnover Rates for each Discipline E. Turnover Replacement Costs
III. Financial Incentives A. Pay-out on Current Incentives B. Impact of Financial Incentives
If the presenting issue is attendance, the tool would track absences by employment status, discipline, and length of service. It would compile the costs of absences, such as pool use, overtime and double time costs, staff injuries on shifts working short. It would look for patterns of absences, such as days of the week or the month. In the case of absences, it would also be useful to track absences by employee, department and shift. Drilling down provides data for management decisions about staffing. For example, it can be used to determine whether a management practice like staffing to census is actually costing more in turnover and absenteeism than it is saving in a daily labor cost. To construct a drilldown identify all the data that could be related to the topic at hand:
1. Construct a snapshot of the current situation 2. Identify costs directly and indirectly related to the situation 3. Analyze all possible incentives that can contribute to the situation 4. Look for patterns or counterproductive practices or resources that can be re-
allocated to create incentives for the outcomes you seek These instructions are adapted from instructions originally written by David Farrell, while he worked for Quality Partners of Rhode Island, under contract with B&F Consulting for BJBC-VT. The tool itself was developed by David Farrell, Cathie Brady and Barbara Frank, and converted to excel by David Johnson of IPRO in New York.

38
I. Snapshot of the Current Situation A. Composition of Current Staff by Employment Status: Examine a recent payroll report to determine the number and percentage of your staff by their full-time/part-time status Total number of staff working in the nursing department: 134 RN total: 30 FT 8 Part-
time: 4 Per
Diem: 14 Baylor: 4
Percentage 26.67% 13.33% 46.67% 13.33% LPN total: 27 FT 15 Part-
time: 0 Per
Diem: 5 Baylor: 7
Percentage 55.56% 0.00% 18.52% 25.93% CNA total: 77 FT 37 Part-
time: 8 Per
Diem: 7 Baylor: 25
Percentage 48.05% 10.39% 9.09% 32.47% Calculate the percentage of licensed nurses and CNAs who are FT, PT, Per Diem, and Baylor. Consider the impact of your staff composition. Look at the percentage of FT licensed staff in relation to continuity, consistency, supervision, teamwork, and organizational commitment. How many people do you have working as Baylors. What impact do their long hours have on their ability to function and to work well together? Total number FT PT Per Diem Baylor Licensed Nurses
57 23 40%
4 7%
19 33%
11 19.6%
CNAs 77 37 48%
8 10.4%
7 9%
25 32.5%
Take a look at this data:
Fewer than half the staff, and only 40% of the licensed nurses, work full-time. This affects continuity of care, teamwork, follow-through on issues, and the ability to notice changes in residents’ condition.
A third of the CNAs and 20% of the licensed nurses work as Baylors, working two 12 hour shifts in a row. This constitutes a lot of people who may be very tired by the end of their shifts. Their tiredness can affect their morale, teamwork, concentration, safety, and error rate.
A third of the nurses are per diem, an employment status with far less accountability, continuity, and affiliation with the organization.

39
B. Vacant Positions: Determine the current number of vacant, full-time positions (FTEs). Look at department staffing budgets compared to the current staff composition. Add part-time open positions together to create vacant FTE’s. For example, here there are 77 CNAs working but there are not 77 FTEs. There are 37 FT, 8 PT equaling 6 FT, and 25 Baylor (working two 12’s and getting paid for 30 as FT) equaling 25 FT, for a total of 68 FTEs. Total vacant FTEs in nursing dept: 13 Dietary department total: 0 Housekeeping department total: .5 Laundry department total: 0 Department Heads total: 0 Other: 1 Total vacant full-time positions: 14.5 Nursing Department Vacancy Rate: Calculation: Total number of vacant FTEs divided by total number of budgeted FTEs. Example: 7 vacant CNA FTEs
68 budgeted CNA FTEs = .103 x 100 = 10.3% CNA vacancy rate RN vacancy rate: 3 vacant RN FTEs
15 budgeted RN FTEs = 20%
LPN vacancy rate: 3 vacant LPN FTEs 22 budgeted LPN FTEs =
13.6%
CNA vacancy rate: 7 vacant CNA FTEs 68 budgeted CNA FTEs =
10.3%
Vacancy rate in the nursing department:
13 vacant nursing dept FTEs 105 budgeted nursing dept FTEs
12.4%
C. Composition of Current Staff by Length of Service (LOS): Calculate the number of staff in all non-nursing positions. Add this to the calculations, above, of the number of nursing department employees: Nursing department total: 134 Dietary department total: 17 Housekeeping department total: 11 Laundry department total: 5 Department Heads total: 8 Other: 11 Total number of employees: 186
RN total: 3 LPN total: 3 CNA total: 7

40
By looking at each employee’s date of hire, document total number of staff by longevity: Total # of staff employed
6 mos. or less
6 mos. to 1 yr.
1 yr. to 2 yrs.
2 yrs or more
5 yrs or more
10 yrs or more
Total
RN 3 15 6 4 2 0 30 LPN 3 11 9 3 1 0 27 CNA 9 11 52 3 2 0 77 Nursing Total 15 37 67 10 5 0 134 Other Total 8 14 18 9 1 2 52 Totals 23 51 85 19 6 2 186 Next, calculate the percentage of employees who have been at the facility by length of service in order to gain an understanding of staff longevity. Calculation: Divide the total number of staff for each of the categories above by the total number of staff employed today. Example: 23 staff employed six months or less
186 total number of staff = .124 x 100 = 12.4% of the staff has been employed six months
To calculate LOS percentages by department and discipline, use the total number of staff in each department and the total number of staff by discipline as the denominator. Example: 11 CNA’s have been employed 6 months to one year
77 total CNA’s = .143 x 100 =14.3% of the CNA’s have been employed 6 months to one year
% of staff employed
6 mos. or less
6 mos. to 1 yr.
1 yr. to 2 yrs.
2 yrs or more
5 yrs or more
10 yrs or more
RN 10% 50% 20% 13.33% 6.67% 0% LPN 11.11% 40.74% 33.33% 11.11% 3.70% 0% CNA 11.69% 14.29% 67.53% 3.90% 2.60% 0% Nursing Total 11.19% 27.61% 50% 7.46% 3.73% 0% Other total 15.38% 26.92% 34.62% 17.31% 1.92% 3.85% Totals 12.37% 27.42% 45.7% 10.22% 3.23% 1.08%
Take a look at the longevity on staff: Only 10% of staff have been here for 2 years or more -- a sign of instability. 50% of RNs and 40% of LPNs are employed 6 mos. and1 year. The sign-on
bonus pays out at 6 months.
RN: 30 LPN: 27 CNA: 77
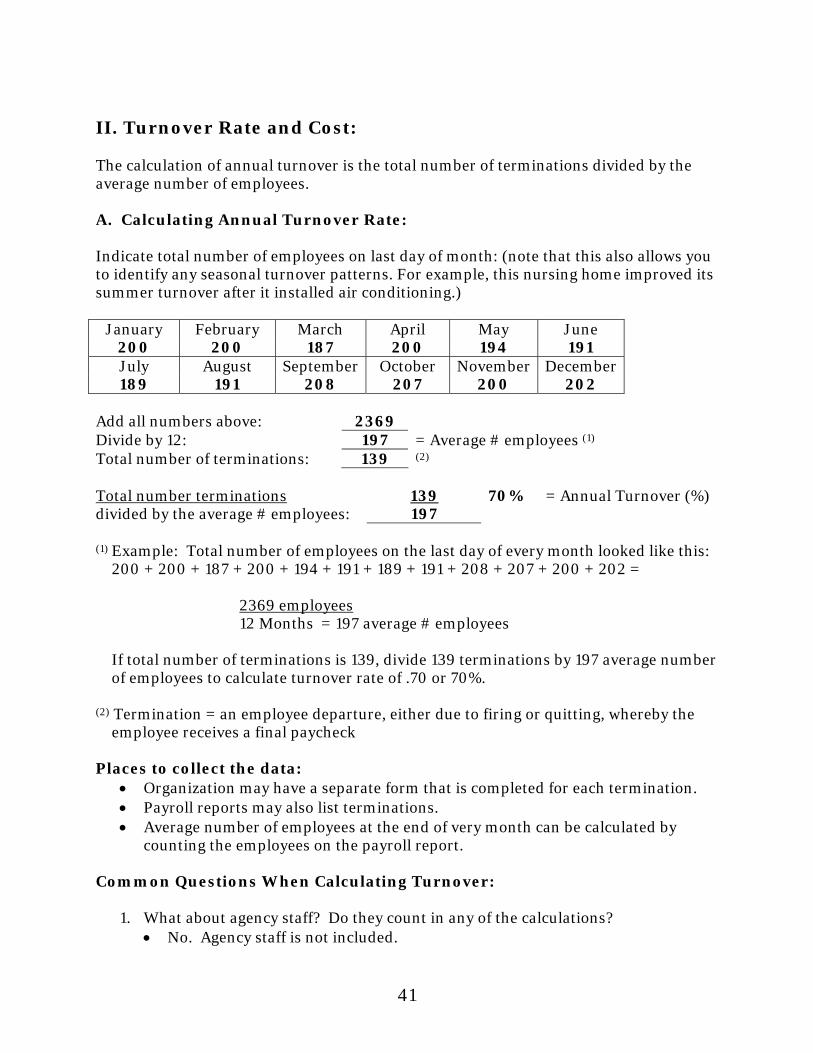
41
II. Turnover Rate and Cost: The calculation of annual turnover is the total number of terminations divided by the average number of employees. A. Calculating Annual Turnover Rate: Indicate total number of employees on last day of month: (note that this also allows you to identify any seasonal turnover patterns. For example, this nursing home improved its summer turnover after it installed air conditioning.)
January February March April May June 200 200 187 200 194 191 July August September October November December 189 191 208 207 200 202
Add all numbers above: 2369 Divide by 12: 197 = Average # employees (1) Total number of terminations: 139 (2) Total number terminations divided by the average # employees:
139 197
70% = Annual Turnover (%)
(1) Example: Total number of employees on the last day of every month looked like this:
200 + 200 + 187 + 200 + 194 + 191 + 189 + 191 + 208 + 207 + 200 + 202 =
2369 employees 12 Months = 197 average # employees
If total number of terminations is 139, divide 139 terminations by 197 average number of employees to calculate turnover rate of .70 or 70%.
(2) Termination = an employee departure, either due to firing or quitting, whereby the
employee receives a final paycheck Places to collect the data:
• Organization may have a separate form that is completed for each termination. • Payroll reports may also list terminations. • Average number of employees at the end of very month can be calculated by
counting the employees on the payroll report. Common Questions When Calculating Turnover:
1. What about agency staff? Do they count in any of the calculations? • No. Agency staff is not included.

42
2. Why does a part-time or per diem employee termination count equally as a full-
time employee termination? • The calculation is a measurement of all turnover, regardless of their
employment status.
3. What about an employee who changes his/her job title and stays in the organization? Does that count as a termination? • No. Do not count this individual as a termination.
4. What if an employee works at two facilities owned by the same corporation and
leaves one of the facilities but stays at the other? • The employee would be coded as a termination by the facility from which he
or she departed.
5. What if an employee cuts his/her hours from full-time to per diem? Does that count as a termination? • No. They are still employed by the facility.
6. What about an employee who goes on unpaid leave or who is still employed but
did not work any hours in the month or pay period? • Employee is still employed and continues to be included in the denominator.
7. What if an employee leaves (termination) and then is re-hired 3 weeks later?
• Employee counts as a termination if the calculation is done prior to re-hire.
8. If a home has 130 budgeted positions but only 125 of the positions are filled, is the average number of employees 125 or 130? • The average number of employees is 125.
B. Staff Turnover Rates by Length of Service (LOS): Who triggered the termination? Group the terminations over the last twelve months by who triggered the termination. Analyze each termination to determine the number and percentage of terminations due to employee choice and due to employer choice. Total number of terminations: 139 # % Total number of terminations due to employee choice: 77 55% Total number of terminations due to employer choice: 62 45% Calculation of percentage: divide each number above by the total number of terminations.

43
Determine LOS for each individual who left over the last 12 months. Total number of nursing department terminations: 90 Terminations of nursing department staff employed by number and percentage: Termination within: Employee
Choice # Employee Choice %
Employer Choice #
Employer Choice %
One day to one month: 8 8.89% 10 11.11% One month to three months: 13 14.44% 10 11.11% Three months to six months: 14 15.56% 8 8.89% Six months to one year: 10 11.11% 7 7.78% One year to two years: 4 4.44% 3 3.33% Two years or more: 3 3.33% 0 0.00% Totals 52 57.78% 38 42.22%
Seeing how soon after hire people left can identify possible areas to focus on, such as: • High numbers of departures in the first month might indicate a need for better
orientation or better hiring practices. • Significant departures as sign-on bonuses are paid out raises questions about the
possible negative consequences of this incentive program. • Data from Current Staff by Length of Service indicates 15 nursing staff have been
employed 2 years or more. Losing 3 (20%), by their choice, is a serious concern. • Having a significant number of involuntary terminations in the first 3 months
may be an indication of a poor hiring decision. Total terminations (employer and employee choice) of nursing department staff by number and percentage: Length of Service # % One day to one month: 18 20% One month to three months: 23 25.5% Three months to six months: 22 24.4% Six months to one year: 17 18.9% One year to two years: 7 7.77% Two years or more: 3 3.33% Total 90 100% Calculation for percentages: Divide each of the totals in the LOS categories above by the total number of terminations. Example: 18 terminations LOS one day to one month
90 total termination = .2 x 100
= 20% of the terminations were staff employed less than one month.

44
C. Turnover Rates by Discipline and LOS: This section combines the previous information to provide data on the number and percentage of staff, by discipline, who are leaving, by their length of service. Total number of RN terminations: 11 Number and percent of RN terminations (by employee and employer choice) by LOS: Length of Service Employee
Choice # Employee Choice %
Employer Choice #
Employer Choice %
Total #
Total %
1 day to 1 month: 1 9.09% 1 9.09% 2 18.2% 1 mo. to 3 mos.: 0 0.00% 2 18.18% 2 18.2% 3 mos. to 6 mos: 0 0.00% 2 18.18% 2 18.2% 6 mos. to 1 year: 3 27.27% 0 0.00% 3 27.2% 1 year to 2 years: 1 9.09% 1 9.09% 2 18.2% 2 years or more: 0 0.00% 0 0.00% 0 0% Total 5 45.45% 6 54.55% 11 100% Calculation of percentages: Divide each of the totals in the LOS categories above by the total number of terminations. Do this for employee choice, employer choice, and total terminations. Example: 2 terminations RN LOS one day to one month
11 total RN terminations = .182 x 100 = 18.2%
= 18.2% of the RN terminations were RNs employed less than one month. The same formula can be used for LPNs and CNAs. Total number of LPN terminations: 15 Number and percent of LPN terminations (by employee and employer choice) by LOS: Length of Service
Employee Choice #
Employee Choice %
Employer Choice #
Employer Choice %
Total #
Total %
1 day to 1 mo: 1 6.67% 0 0.00% 1 6.7% 1 mo. to 3 mos: 1 6.67% 1 6.67% 2 13.3% 3 mos. - 6 mos: 3 20.00% 2 13.13% 5 33.3% 6 mos. to 1 yr: 4 26.67% 0 0.00% 4 26.7% 1 year to 2 years: 3 20.00% 0 0.00% 3 18.2% 2 years or more: 0 0.00% 0 0.00% 0 0.00% Total 12 80.00% 3 20.00% 15 100%

45
Total number of CNA terminations: 64 Number and percent of CNA terminations (by employee and employer choice) by LOS: Length of Service
Employee Choice #
Employee Choice %
Employer Choice #
Employer Choice %
Total #
Total %
1 day to 1 month: 6 9.38% 9 14.06% 15 23.4% 1 mo. to 3 mos.: 12 18.75% 7 10.94% 19 29.7% 3 mos. to 6 mos: 11 17.19% 4 6.25% 15 23.4% 6 mos. to 1 yr: 3 4.69% 7 10.94% 10 15.6% 1 year to 2 years: 0 0.00% 2 3.13% 2 3.1% 2 years or more: 3 4.69% 0 0.00% 3 4.7% Total 35 54.69% 29 45.31% 64 100% D. Turnover Rates for each Discipline: Calculation: Total number of terminations by discipline (RN, LPN, CNA) divided by the average number staff within each discipline. Example: 64 CNA terminations 77 avg. number of CNAs = .831 X 100 = 83.1% CNA turnover rate Discipline CNA RN LPN Terminations: 64 11 15 Average number of staff: 77 30 27 Turnover rate: 83% 36.7% 55.6% E. Turnover Replacement Costs: Example: CNA replacement costs. Use same methodology for RNs and LPNs. 1. Replacement Data
New Hire hourly rate: $9.50 *Advertising Cost: $750.00 (Cost of ad in newspaper for 3 days including
Sunday) *Cost to interview and screen applicants:
$40.00 (Interviewer’s hourly rate multiplied by the time taken for the interview.)
*Cost to call and check references:
$40.00 (Hourly rate of person checking references multiplied by the time taken to check
references.)
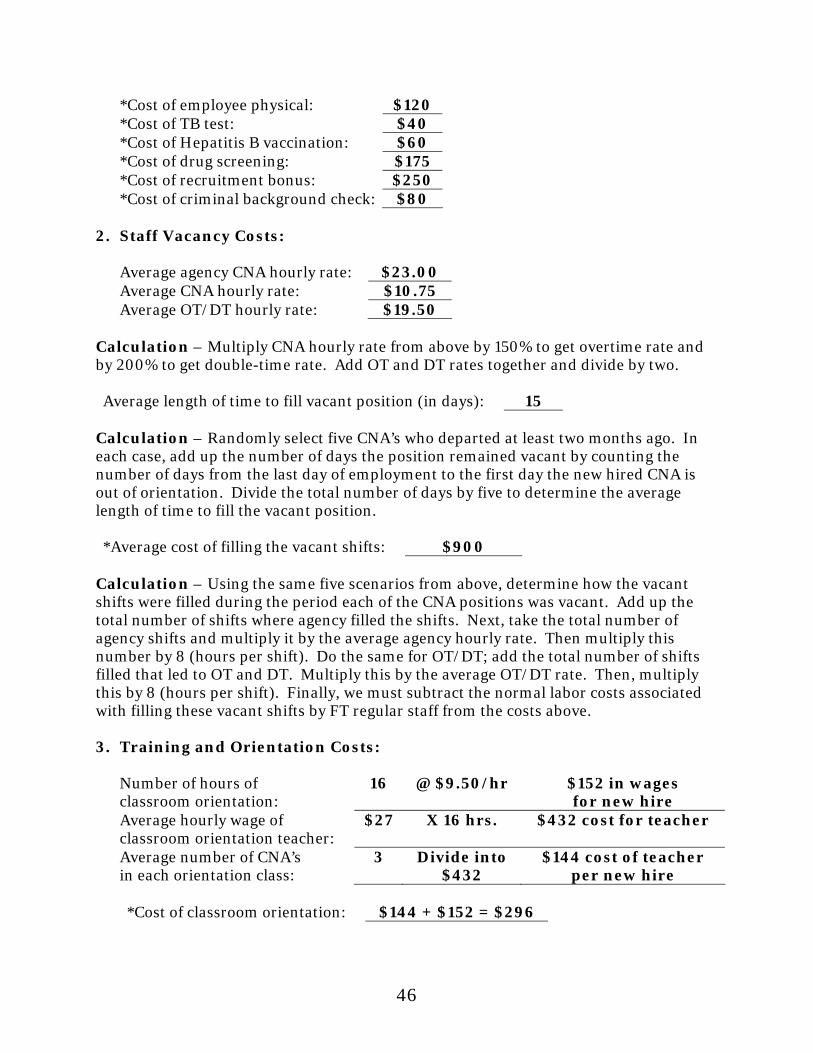
46
*Cost of employee physical: $120 *Cost of TB test: $40 *Cost of Hepatitis B vaccination: $60 *Cost of drug screening: $175 *Cost of recruitment bonus: $250 *Cost of criminal background check: $80
2. Staff Vacancy Costs:
Average agency CNA hourly rate: $23.00 Average CNA hourly rate: $10.75 Average OT/DT hourly rate: $19.50
Calculation – Multiply CNA hourly rate from above by 150% to get overtime rate and by 200% to get double-time rate. Add OT and DT rates together and divide by two.
Average length of time to fill vacant position (in days): 15
Calculation – Randomly select five CNA’s who departed at least two months ago. In each case, add up the number of days the position remained vacant by counting the number of days from the last day of employment to the first day the new hired CNA is out of orientation. Divide the total number of days by five to determine the average length of time to fill the vacant position.
*Average cost of filling the vacant shifts: $900
Calculation – Using the same five scenarios from above, determine how the vacant shifts were filled during the period each of the CNA positions was vacant. Add up the total number of shifts where agency filled the shifts. Next, take the total number of agency shifts and multiply it by the average agency hourly rate. Then multiply this number by 8 (hours per shift). Do the same for OT/DT; add the total number of shifts filled that led to OT and DT. Multiply this by the average OT/DT rate. Then, multiply this by 8 (hours per shift). Finally, we must subtract the normal labor costs associated with filling these vacant shifts by FT regular staff from the costs above.
3. Training and Orientation Costs:
Number of hours of classroom orientation:
16 @ $9.50/hr $152 in wages for new hire
Average hourly wage of classroom orientation teacher:
$27 X 16 hrs. $432 cost for teacher
Average number of CNA’s in each orientation class:
3 Divide into $432
$144 cost of teacher per new hire
*Cost of classroom orientation: $144 + $152 = $296

47
Calculation – Add these two for total cost of classroom orientation per new hire: • Average hourly wage of teacher multiplied by the total number of classroom
orientation hours, divided by the average number of CNA’s in each orientation class. • Number of hours in classroom multiplied by hourly wage of new employee.
Average number of hours spent in on-the-job orientation: 48 Hourly wage of new hire $9.50 *Cost of on-the-job orientation: $456
Calculation – Average wage of new hire multiplied by the average number of hours spent on on-the-job orientation. Total Replacement and Turnover Costs: Add up all calculations with an * to get the total direct costs to replace one CNA. *Advertising Cost: $750.00 + *Cost to interview and screen applicants: $40.00 + *Cost to call and check references: $40.00 + *Cost of employee physical: $120.00 + *Cost of TB test: $40.00 + *Cost of Hepatitis B vaccination: $60.00 + *Cost of drug screening: $175.00 + *Cost of recruitment bonus: $250.00 + *Cost of criminal background check: $80.00 + *Average cost of filling the vacant shifts: $900.00 + *Cost of classroom orientation: $296.00 + *Cost of on-the-job orientation: $456.00 = Total direct costs to replace one CNA: $3,207.00 Determine how many CNA’s terminations there were last year. Multiply this number by the dollar figure above to determine your annual cost of turnover. Example: 64 CNA terminations X $3,207 = $205,248 annual CNA turnover costs Total annual CNA turnover costs: $205,248 Use the same methodology to determine RN and LPN turnover costs.
Position Direct Costs for 1 turnover
# of turnovers
Total Annual Cost
RN: $4,899 11 $53,899 LPN: $4,193 15 $62,895 CNA: $3,207 64 $205,248 Other staff: $2,692 49 $131,908 Total 139 $453,940

48
III. What are your financial incentives? A. Pay-out on Current Incentives. Compile data on types of incentives available to staff and determine how frequently they are given and how much is distributed to the staff in the last quarter. Use the last quarter to estimate the annual expenditure. Examples of frequently used financial incentives: 1. Bonus for accepting a last minute assignment: $10 per hour for RNs and LPNs $5 per hour for CNAs
How much was spent last quarter: $90,000 Estimate of annual expenditure $360,000 2. Shift differentials: CNA AM: $0.00 PM: $2.00 NOC: $2.50 RN / LPN AM: $0.00 PM: $3.00 NOC: $4.00 3. Offering individuals who work two 12-hour shifts and are paid for 30 - 36 hours worked (Baylor): Works 2, 12-hour shifts and gets paid for 36 hours. 4. Extra per hour take-home pay for Per Diem status:
RN: $1.00 LPN: $1.00 CNA: $1.00 5. Perfect attendance bonuses (No call-outs for a month, quarter, year): None How much was spent last quarter: $0.00 Estimate of annual expenditure $0.00 6. Holiday bonuses (Extra pay for working a holiday above the standard time and a half.): None

49
7. Bonus related to recruitment: a. New employee sign-on bonuses:
RN: $2,000 LPN: $500 CNA: $250
How much was spent last quarter: $12,500 Estimate of annual expenditure $50,000 b. Employee referral bonuses:
RN: $1,000 LPN: $1,000 CNA: $500
How much was spent last quarter: $1,500 Estimate of annual expenditure $6,000 8. Annual average wage increase: RN: 2% LPN: 2% CNA: 2%
9. Longevity bonuses (Bonuses paid to staff that attain certain levels of years of service.): None How much was spent last quarter: $0.00 10. List all other financial incentives and their dollar amounts: Preceptor bonus – CNA $300 plus $0.50 per hour
Add up all of the bonuses estimated to have been paid out last year: Bonus for accepting a last minute assignment $360,000 New employee sign-on bonuses $ 50,000 Employee referral bonuses $ 6,000 Total estimated bonus pay-out $416,000
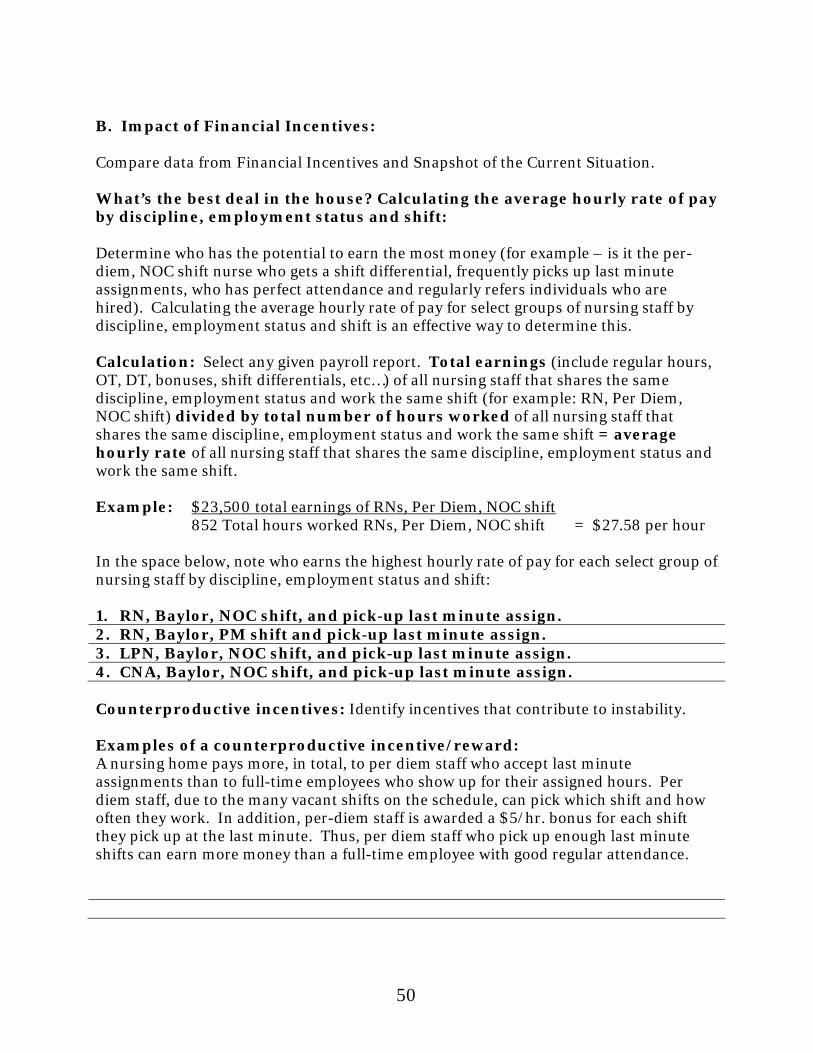
50
B. Impact of Financial Incentives: Compare data from Financial Incentives and Snapshot of the Current Situation. What’s the best deal in the house? Calculating the average hourly rate of pay by discipline, employment status and shift: Determine who has the potential to earn the most money (for example – is it the per-diem, NOC shift nurse who gets a shift differential, frequently picks up last minute assignments, who has perfect attendance and regularly refers individuals who are hired). Calculating the average hourly rate of pay for select groups of nursing staff by discipline, employment status and shift is an effective way to determine this. Calculation: Select any given payroll report. Total earnings (include regular hours, OT, DT, bonuses, shift differentials, etc…) of all nursing staff that shares the same discipline, employment status and work the same shift (for example: RN, Per Diem, NOC shift) divided by total number of hours worked of all nursing staff that shares the same discipline, employment status and work the same shift = average hourly rate of all nursing staff that shares the same discipline, employment status and work the same shift. Example: $23,500 total earnings of RNs, Per Diem, NOC shift 852 Total hours worked RNs, Per Diem, NOC shift = $27.58 per hour In the space below, note who earns the highest hourly rate of pay for each select group of nursing staff by discipline, employment status and shift: 1. RN, Baylor, NOC shift, and pick-up last minute assign. 2. RN, Baylor, PM shift and pick-up last minute assign. 3. LPN, Baylor, NOC shift, and pick-up last minute assign. 4. CNA, Baylor, NOC shift, and pick-up last minute assign. Counterproductive incentives: Identify incentives that contribute to instability. Examples of a counterproductive incentive/reward: A nursing home pays more, in total, to per diem staff who accept last minute assignments than to full-time employees who show up for their assigned hours. Per diem staff, due to the many vacant shifts on the schedule, can pick which shift and how often they work. In addition, per-diem staff is awarded a $5/hr. bonus for each shift they pick up at the last minute. Thus, per diem staff who pick up enough last minute shifts can earn more money than a full-time employee with good regular attendance.