acid gas cleaning using amine solvents: validation with...
TRANSCRIPT

Acid Gas Cleaning using Amine Solvents: Validation with Experimental and Plant DataJennifer Dyment, Product Marketing, Aspen Technology, Inc. Suphat Watanasiri, Senior Director R&D, Aspen Technology, Inc.
WHITE PAPER

2 Acid Gas Cleaning using Amine Solvents: Validation with Experimental and Plant Data ©2015 Aspen Technology Inc. 11-7678-1215
IntroductionAcid gas removal is an important process in various branches of the hydrocarbon processing industry, primarily in natural gas processing and refining. Acid gas removal is also an essential part of other processes, such as coal gasification where carbon dioxide, hydrogen sulfide, carbonyl sulfides, mercaptans, and other contaminants need to be removed.
Acid gas is defined as gas containing significant amounts of contaminants, such as hydrogen sulfide (H
2S), carbon dioxide (CO
2), and other acidic gases. Sour gas is gas contaminated with H
2S. This
term comes from the rotten smell due to sulfur content (1). Thus, “gas sweetening” refers to H2S
removal, because it improves the odor of the gas being processed, while “acid gas removal” refers to the removal of both CO
2 and H
2S.
Acid gases need to be removed in order to comply with sales gas quality regulations. These regulations are in place to minimize environmental impact and ensure gas transport pipeline integrity, avoiding undesired occurrences, such as corrosion caused by H
2S and CO
2 in the presence
of water. Acid gases also need to be removed due to the toxicity of compounds, such as H2S, and the
lack of the heating value of CO2. Typically, “pipeline quality” or sales gas is required to be sweetened
to contain concentrations of H2S that’s no more than 4 parts per million (ppm), and a heating value
of no less than 920 to 1150 Btu/SCF, depending on the final consumer requirements (2).
There are numerous processes developed for acid gas removal, and they typically fall into one of the five categories: chemical solvents (amines), physical solvents, adsorption, membranes, and cryogenic fractionation (3, 4).
When gas processors turn to absorption processes for acid gas removal, several factors affect their decision in choosing whether to use a chemical or physical absorption process from an economic standpoint. They take into account the required solvent circulation rate that affects capital and operating costs by strongly influencing equipment size and energy requirements for solvent regeneration (4). In this paper, we will describe acid gas cleaning via absorption processes with emphasis on the use of chemical solvents.
Acid Gas Cleaning — Brief Process Overview A typical flow diagram of a gas treating unit is shown in Figure 1. The acid gas is sent to a separator to remove any entrained liquid or sand and then fed to the bottom of the absorber column. The absorber can be a tray or packed tower, although packing is usually preferred due to high capacity and better options for materials of construction.
The feed gas then flows upward, counter-current to the lean amines or physical solvent solution which is introduced in one or more stages around the top of the absorber. The cleaned gas exits the top of the column. The solvent with the absorbed acid gas, called rich amines (or solvent), is sent to a flash drum and a second “Stripper” column, to be regenerated by means of heating in the case of the chemical solvent. Physical solvent regeneration is completed by reducing the pressure in a couple of stages, unless deep cleaning of H
2S or CO
2 is required, in which case, a stripper column will be
used. As shown in Figure 1, there are many unit operations involved in this process, and operating the gas cleaning unit optimally will require control and sound engineering judgment. Process simulation is a critical tool, not only to optimize the acid gas cleaning unit alone, but for the entire gas treating facility.

3 Acid Gas Cleaning using Amine Solvents: Validation with Experimental and Plant Data ©2015 Aspen Technology Inc. 11-7678-1215
Figure 1: Typical acid gas treating unit: Absorber cleans gas, Regenerator (Stripper) reclaims solvent
Chemical SolventsChemical solvents, or aqueous solutions of alkanolamines, such as diethanolamine (DEA), monoethanolamine (MEA), methyldiethanolamine (MDEA), etc., are most commonly used to remove hydrogen sulfide (H
2S) and carbon dioxide (CO
2). Since heat is required for regeneration, the
higher operating costs need to be accounted for in the selection process. Since physical solvents, such as DEPG, preferentially absorb the contaminants through physical means, pressure reduction can regenerate the solvent thus minimizing operating costs. Engineers must determine which solvent has the needed selective affinity to the contaminants when choosing what solvent to use for acid gas cleaning.
Typically, chemical solvents are most suitable at lower pressures, and physical solvents are favored for higher acid gas partial pressures, as shown in Figure 2. Figure 2 describes the acid gas loading as a function of acid gas partial pressure. The red line shows that at lower partial pressures of acid gas, chemical solvents are very effective in cleaning the gas, up to a point where the capacity is plateaued. For physical solvents, shown by the blue line, the relationship is linear and is more effective at higher partial pressures. Figure 3 shows lower energy per mol of CO
2 absorption by
DEPG when compared with MDEA, indicating that energy optimization is critical for management of operating costs in chemical solvent-based processes.
Chemical solvents are typically favored in natural gas processing when high recovery of heavy hydrocarbons is desired, since physical solvents have a higher co-absorption of hydrocarbons (3).

4 Acid Gas Cleaning using Amine Solvents: Validation with Experimental and Plant Data ©2015 Aspen Technology Inc. 11-7678-1215
Modeling Chemical & Physical Solvents in Aspen HYSYS®
Acid Gas Cleaning is an integral functionality of Aspen HYSYS version 8.3 and higher. The “Acid Gas” property package in Aspen HYSYS provides the thermodynamics based on the Electrolyte NRTL model (12) with all the necessary aqueous-phase equilibrium and kinetics reactions required for rigorous calculations of the process. In Aspen HYSYS V8.6, the Acid Gas Cleaning functionality has been enhanced with a new property package, “Acid Gas - Physical Solvents”, based on the Perturbed Chain Statistical Association Fluid Theory (PC-SAFT) Equation Of State, which allows users to model Dimethyl Ether of Polyethylene Glycol (DEPG), a constituent of a commercially available solvent called Selexol®*.
The technology for modeling the chemical and physical solvent interaction with acid gases can be separated into two aspects—the thermodynamic package and the simulation engine.
The thermodynamic package technology for chemical solvent modeling is based on the Electrolyte Non-Random Two- Liquid (Electrolyte NRTL) model for electrolyte thermodynamics and Peng-Robinson Equation of State for vapor phase properties. Regression has been performed with available VLE and heat of absorption data for many amine solvents, including all major amine solvents used in the industry, such as: MDEA, MEA, DEA, PZ, PZ+MDEA, DGA, DIPA, Sulfolane-DIPA, Sulfolane-MDEA, and TEA (see Appendix I for abbreviations decoded).
There are two main approaches to modeling columns in process simulation software: rate-based and equilibrium-stage. Rate-based models utilize heat and mass-transfer correlations based on transfer properties and tray/packing geometry, assuming that separation is caused by mass transfer between the contacting phases (6). This makes them more accurate over a wider range of operating conditions, as the equilibrium-stage models require empirical adjustments for accurate simulation.
Rate-based technology is the most reliable way to model columns with reaction and to design columns without having information about tray efficiencies or HETP (height equivalent to a theoretical plate) for packed columns. Implementing rate-based modeling allows users to simulate actual column performance more closely, enabling them to make more accurate predictions over a wider range of operating conditions with less fitting of data. This is particularly useful for absorption
Figure 2: Comparison of effectiveness of physical vs. chemical solvent
Figure 3: Relative magnitude of heat of absorption of physical vs. chemical solvent
*Selexol is a registered trademark of Allied Chemical Corporation. All other trademarks cited here are the property of their respective owners.

5 Acid Gas Cleaning using Amine Solvents: Validation with Experimental and Plant Data ©2015 Aspen Technology Inc. 11-7678-1215
and acid gas cleaning processes, where component efficiencies vary widely. Rate-based modeling allows users to extrapolate outside current operating ranges with more confidence, which is advantageous when limited data is available. This in turn allows users to produce tighter designs with confidence, leading to designs that are optimized for energy consumption, and capital and operating costs.
Two models are available for the simulation of the absorber and regenerator units—Efficiency and Advanced. Both are based on AspenTech’s proprietary Rate-Based technology. The Advanced model uses the Maxwell-Stefan theory (8) to rigorously calculate the heat and mass-transfer rates without assuming thermal or chemical equilibrium between the vapor and liquid for each stage. The Efficiency model uses a conventional equilibrium-stage model to solve the column, but the non-equilibrium behavior inherent in acid gas systems is modeled by calculating a Rate-Based efficiency for CO
2 and H
2S at each stage. The efficiencies are computed using the same underlying correlations
for mass transfer and interfacial area used by the Efficiency model.
The results from the Efficiency and Advanced models are comparable for most systems, but the Efficiency solves much faster due to its simplicity. The Advanced model is recommended when contaminants other than H
2S and CO
2 are present in the feed gas.
Physical solvent modeling in Aspen HYSYS employs the PC-SAFT equation of state, which follows the recommendations of the Final Report for Consortium of Complex Fluids (9). The focus of this work is on amine solvents. A separate white paper on validation of a DEPG treatment model is
published separately and can be accessed here.
In addition to the superior rate-based modeling technology, Aspen HYSYS offers many other useful features when modeling acid gas cleaning.
Amine solvents contain impurities, such as heat stable salts, which cannot be removed in the regenerator due to their “heat stable” nature. When in trace amounts, they can aid in decreasing the energy required to break the bond between the amine and the acid gas in the regenerator, which significantly lowers the reboiler duty and the associated operating expenses. Yet, if present in larger quantities, these salts can bind with the amine and hinder the absorption of the acid gases in the absorber, substantially lowering the performance of the system. To support operational integrity of the acid gas cleaning part of the process, it is important to understand the effect of the heat stable salts present in the system on absorption and regeneration, so that they can be removed via reclaimers or distillation columns for the amine (6) when necessary.
Aspen HYSYS can model the following heat stable salt ions: OH-, Cl-, HCOO-, CH3COO-, SO
4(2-),
S2O
3(2-), SCN-, Na+, and H+. When CO
2, H
2O, H
2S, and at least one of the supported amines are
in the component list, there is an option to add heat stable salts to the list using the Add/Remove Heat Stable Salts button on the Component List form (6). With a known amount of heat stable salts present, engineers can use a simulator to determine whether they will hinder the performance of the absorber or regenerator units.
Phosphoric Acid (H3PO
4) is commonly used as a stripping promoter in gas treating processes. Small
quantities of phosphoric acid in the amine stream speed up the stripping of acid gasses from the amine stream going through the regenerator, leading to reduced reboiler duty and consequently reduced operating expenses. Starting from V8.6, Aspen HYSYS has an option to model phosphoric acid as a heat stable salt (6).

6 Acid Gas Cleaning using Amine Solvents: Validation with Experimental and Plant Data ©2015 Aspen Technology Inc. 11-7678-1215
Ammonia (NH3) contamination (<1000ppm) of acid gas is typical in refining, especially from upstream hydrotreaters and hydrocrackers. The presence of ammonia leads to operational problems, such as equipment fouling or reduced efficiency in downstream processes. Thus, it is important to be able to model the behavior of ammonia in the system. Aspen HYSYS supports the modeling of ammonia present in small quantities in the feed gas starting from V8.6 (6).
Makeup streams are used in simulation to account for the loss of amines and water in the absorber and regenerator outlets, and anywhere else in the system. The Makeup unit operation, shown in Figure 4, is utilized to easily and accurately account for the makeup streams, and to avoid common convergence issues when the user sets it up manually. The Makeup unit operation has a spreadsheet built into it, which automatically calculates the necessary makeup flow rate, so that users only need to attach and specify the inlet and outlet amine streams to the Makeup block (6).
Figure 4: Makeup block in Aspen HYSYS
There is a plethora of additional resources to aid in utilizing the Acid Gas Cleaning functionality. Several examples of modeling amines are distributed with Aspen HYSYS. Additional information on the subject can be accessed using the “Search” functionality within Aspen HYSYS, where you can view webinars, Computer-Based Training, Jump Start Guides, and more.
Users have the option to auto-convert existing COMThermo - DBR Amines or the Amine Pkg property packages to implement the superior technology of Acid Gas Cleaning in Aspen HYSYS. More information about the conversion process is available in our Aspen HYSYS Online Documentation (6).
7 Acid Gas Cleaning using Amine Solvents: Validation with Experimental and Plant Data ©2015 Aspen Technology Inc. 11-7678-1215
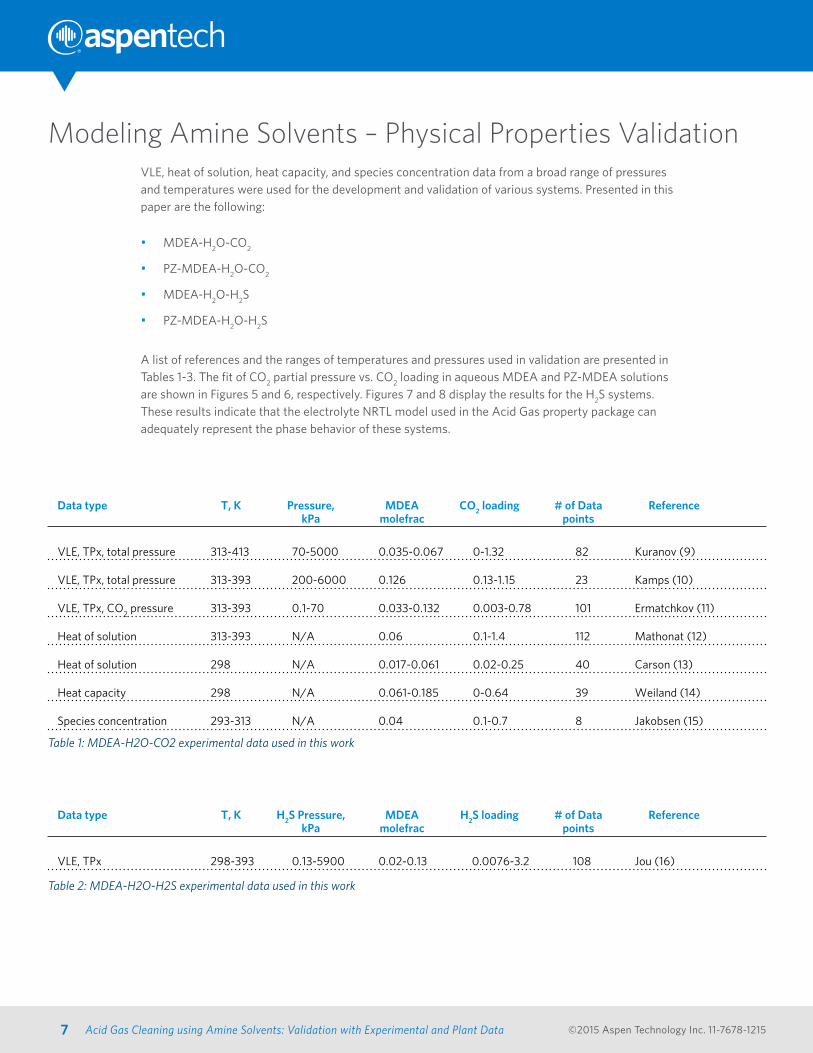
Modeling Amine Solvents – Physical Properties ValidationVLE, heat of solution, heat capacity, and species concentration data from a broad range of pressures and temperatures were used for the development and validation of various systems. Presented in this paper are the following:
• MDEA-H2O-CO
2
• PZ-MDEA-H2O-CO
2
• MDEA-H2O-H
2S
• PZ-MDEA-H2O-H
2S
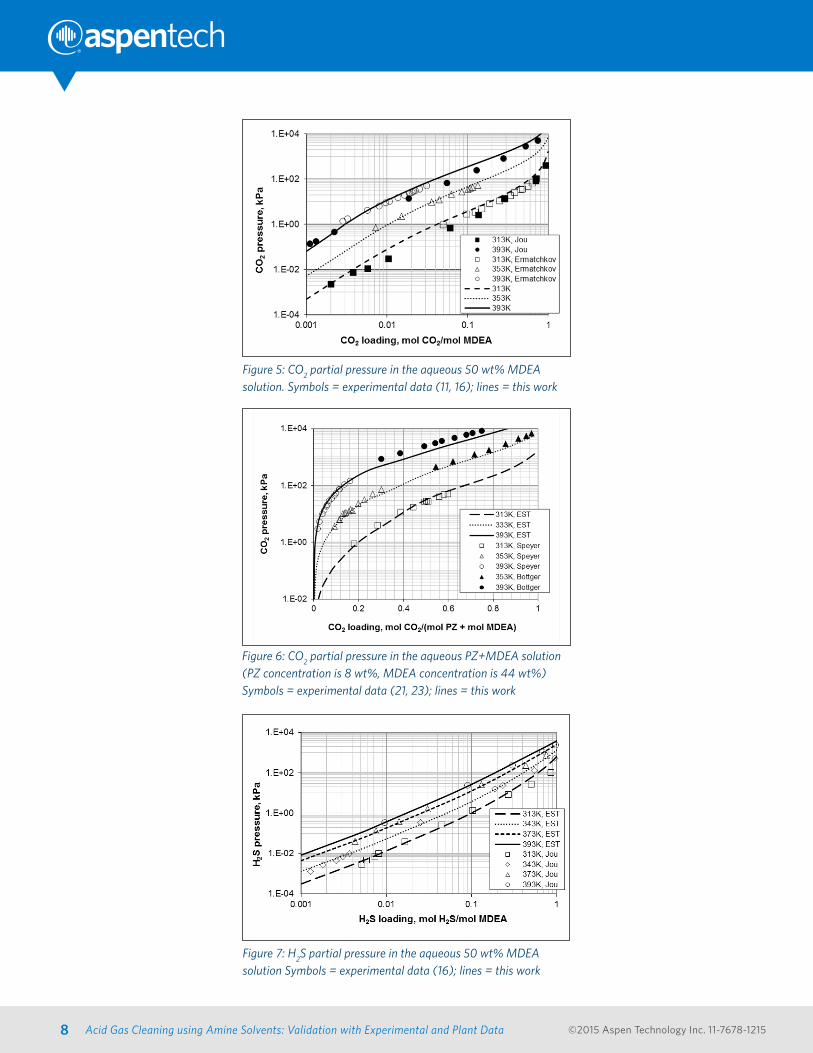
A list of references and the ranges of temperatures and pressures used in validation are presented in Tables 1-3. The fit of CO
2 partial pressure vs. CO
2 loading in aqueous MDEA and PZ-MDEA solutions
are shown in Figures 5 and 6, respectively. Figures 7 and 8 display the results for the H2S systems.
These results indicate that the electrolyte NRTL model used in the Acid Gas property package can adequately represent the phase behavior of these systems.
Data type T, K Pressure, MDEA CO2 loading # of Data Reference kPa molefrac points
VLE, TPx, total pressure 313-413 70-5000 0.035-0.067 0-1.32 82 Kuranov (9)
VLE, TPx, total pressure 313-393 200-6000 0.126 0.13-1.15 23 Kamps (10)
VLE, TPx, CO2 pressure 313-393 0.1-70 0.033-0.132 0.003-0.78 101 Ermatchkov (11)
Heat of solution 313-393 N/A 0.06 0.1-1.4 112 Mathonat (12)
Heat of solution 298 N/A 0.017-0.061 0.02-0.25 40 Carson (13)
Heat capacity 298 N/A 0.061-0.185 0-0.64 39 Weiland (14)
Species concentration 293-313 N/A 0.04 0.1-0.7 8 Jakobsen (15)
Table 1: MDEA-H2O-CO2 experimental data used in this work
Data type T, K H2S Pressure, MDEA H2S loading # of Data Reference kPa molefrac points
VLE, TPx 298-393 0.13-5900 0.02-0.13 0.0076-3.2 108 Jou (16)
Table 2: MDEA-H2O-H2S experimental data used in this work
8 Acid Gas Cleaning using Amine Solvents: Validation with Experimental and Plant Data ©2015 Aspen Technology Inc. 11-7678-1215
Figure 5: CO2 partial pressure in the aqueous 50 wt% MDEA
solution. Symbols = experimental data (11, 16); lines = this work
Figure 6: CO2 partial pressure in the aqueous PZ+MDEA solution
(PZ concentration is 8 wt%, MDEA concentration is 44 wt%) Symbols = experimental data (21, 23); lines = this work
Figure 7: H2S partial pressure in the aqueous 50 wt% MDEA
solution Symbols = experimental data (16); lines = this work

9 Acid Gas Cleaning using Amine Solvents: Validation with Experimental and Plant Data ©2015 Aspen Technology Inc. 11-7678-1215
Data type T, K Pressure, MDEA, PZ, wt% CO2 # of Data Reference kPa wt% loading points
VLE, TPx, CO2 pressure 323-363 16-754 14-35 1.2-8.4 0.15-0.98 80 Liu (17)
VLE, TPx, CO2 pressure 313-343 0.03-7.5 31 3.4 0.006-0.29 13 Bishnoi (18)
VLE, TPx, CO2 pressure 354 180-6400 17 12 0.18-0.57 10 Kamps (19)
VLE, TPx, CO2 pressure 313-343 28-3938 18-26 2.2-8.6 0.23-1.36 103 Jenab (20)
VLE, TPx, CO2 pressure 313-393 218-11880 18-44 8.4-12 0.30-1.96 74 Bottger (21)
VLE, TPx, CO2 pressure 298-323 0.25-110 5-31 3.4-11 0.042-0.98 84 Derks (22)
VLE, TPx, CO2 pressure 313-393 0.1-147 18-47 4-18 0.017-0.83 151 Speyer (23)
VLE, TPx, CO2 pressure 313-373 0.2-27 29-41 8.6-21 0.033-0.56 26 Chen (24)
VLE, TPx, CO2 pressure 373-433 78-2477 35-45 9.3-25 0.14-0.42 33 Xu (25)
Table 3: PZ-MDEA-H2O-CO
2 experimental data used in this work
Figure 8: VLE of PZ-MDEA-H2O-H2S at 353 K (PZ concentration is 12 wt%, MDEA concentration is 17 wt%) Symbols = experimental data (26); lines = this work

10 Acid Gas Cleaning using Amine Solvents: Validation with Experimental and Plant Data ©2015 Aspen Technology Inc. 11-7678-1215
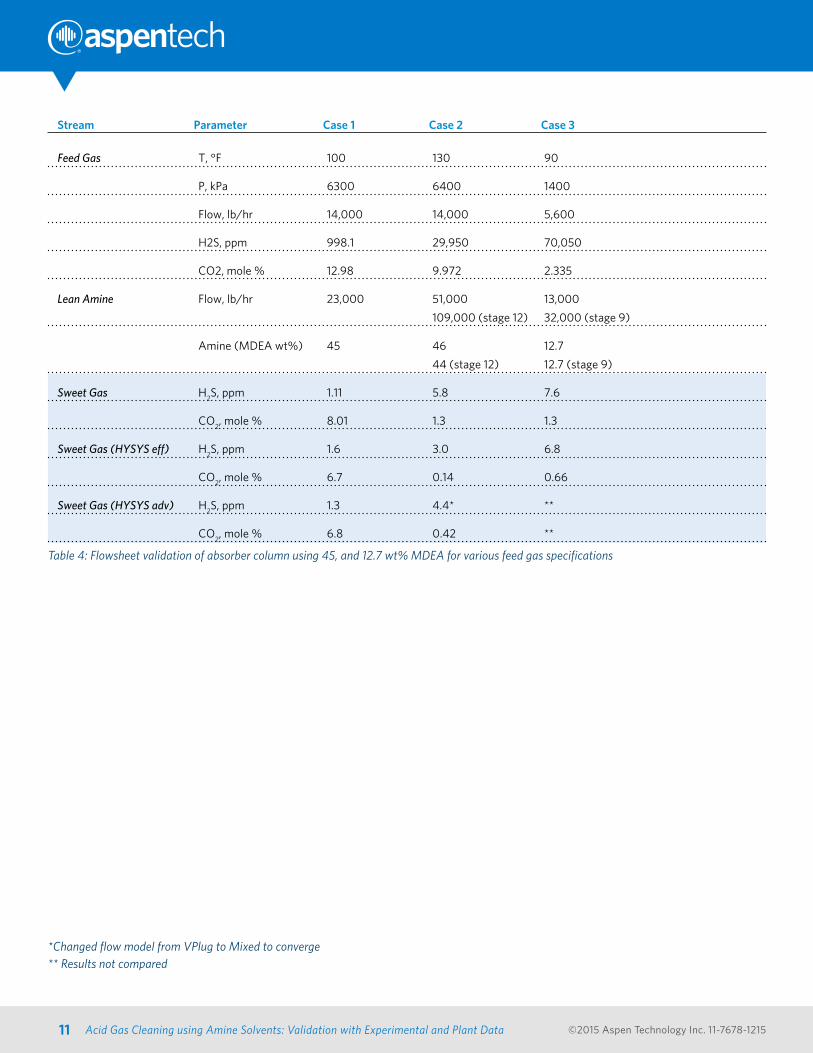
Amine Solvents – Flowsheet ValidationIn addition to validating the thermodynamic model with physical properties data, the simulation model has also been validated against plant data provided by AspenTech’s customers. A flowsheet model of the acid gas cleaning process was developed in Aspen HYSYS, employing both Efficiency and Advanced models for the absorber column as shown in Figure 9.
Figure 9: Specifications for the flowsheet validation of acid gas cleaning process using MDEA (Case 1)
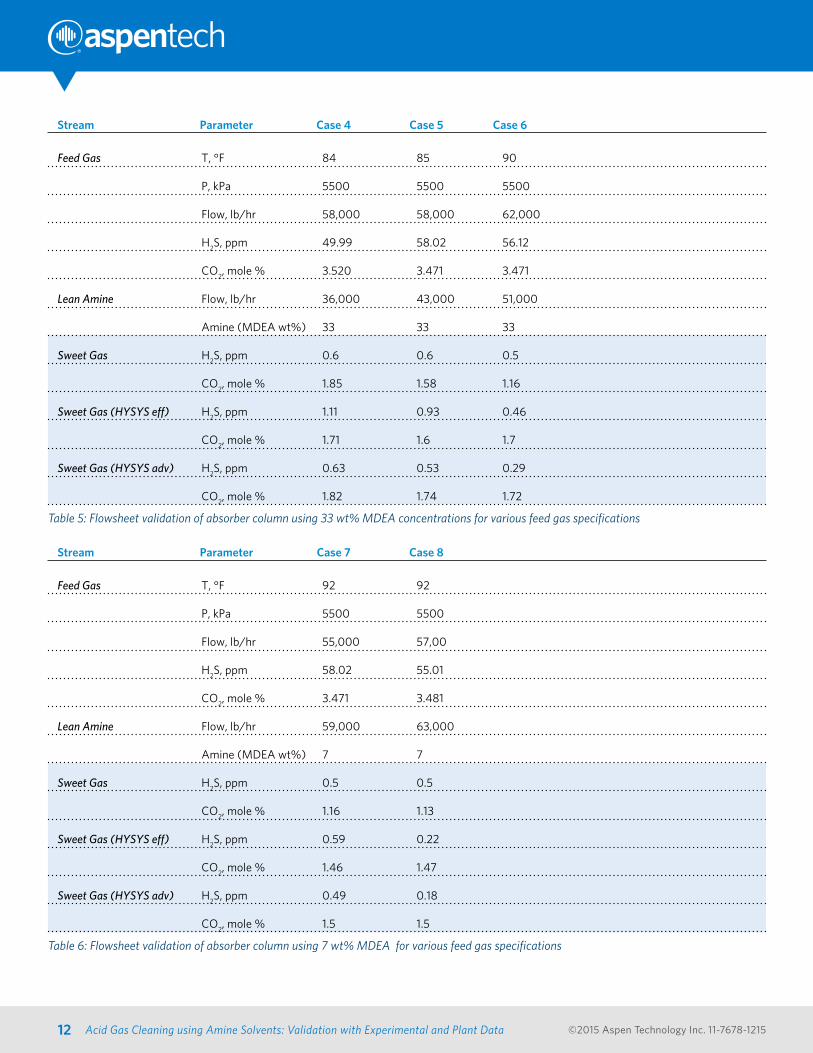
Plant data for various concentrations of MDEA solvent used to scrub different feed gas compositions was compared to simulation. A total of 8 cases were studied, and the results are displayed in Tables 4-6. Both the Efficiency and the Advanced Aspen HYSYS models were used. In Case 2, the lean amine was fed into the absorber column at stage 1 and stage 12, with a flow rate at stage 12 almost double of that at stage 1. In Case 3, the lean amine was fed at stages 1 and 9, with stage 9 flow rate of almost two and a half times higher than the stage 1 flow rate. In all cases, the Efficiency model yields mainly overall conservative results, and the Advanced model provides more accurate results. However, in this case, the results are similar for the Advanced and Efficiency model, which illustrates the fact that the Efficiency model is sufficient for H
2S and CO
2 removal applications mentioned
earlier. This is unique to AspenTech’s proprietary Acid Gas Cleaning modeling technology, which allows users of all levels to achieve reliable results.
11 Acid Gas Cleaning using Amine Solvents: Validation with Experimental and Plant Data ©2015 Aspen Technology Inc. 11-7678-1215
Stream Parameter Case 1 Case 2 Case 3
Feed Gas T, °F 100 130 90
P, kPa 6300 6400 1400
Flow, lb/hr 14,000 14,000 5,600
H2S, ppm 998.1 29,950 70,050
CO2, mole % 12.98 9.972 2.335
Lean Amine Flow, lb/hr 23,000 51,000 13,000
109,000 (stage 12) 32,000 (stage 9)
Amine (MDEA wt%) 45 46 12.7
44 (stage 12) 12.7 (stage 9)
Sweet Gas H2S, ppm 1.11 5.8 7.6
CO2, mole % 8.01 1.3 1.3
Sweet Gas (HYSYS eff) H2S, ppm 1.6 3.0 6.8
CO2, mole % 6.7 0.14 0.66
Sweet Gas (HYSYS adv) H2S, ppm 1.3 4.4* **
CO2, mole % 6.8 0.42 **
Table 4: Flowsheet validation of absorber column using 45, and 12.7 wt% MDEA for various feed gas specifications
*Changed flow model from VPlug to Mixed to converge ** Results not compared
12 Acid Gas Cleaning using Amine Solvents: Validation with Experimental and Plant Data ©2015 Aspen Technology Inc. 11-7678-1215
Stream Parameter Case 4 Case 5 Case 6
Feed Gas T, °F 84 85 90
P, kPa 5500 5500 5500
Flow, lb/hr 58,000 58,000 62,000
H2S, ppm 49.99 58.02 56.12
CO2, mole % 3.520 3.471 3.471
Lean Amine Flow, lb/hr 36,000 43,000 51,000
Amine (MDEA wt%) 33 33 33
Sweet Gas H2S, ppm 0.6 0.6 0.5
CO2, mole % 1.85 1.58 1.16
Sweet Gas (HYSYS eff) H2S, ppm 1.11 0.93 0.46
CO2, mole % 1.71 1.6 1.7
Sweet Gas (HYSYS adv) H2S, ppm 0.63 0.53 0.29
CO2, mole % 1.82 1.74 1.72
Table 5: Flowsheet validation of absorber column using 33 wt% MDEA concentrations for various feed gas specifications
Stream Parameter Case 7 Case 8
Feed Gas T, °F 92 92
P, kPa 5500 5500
Flow, lb/hr 55,000 57,00
H2S, ppm 58.02 55.01
CO2, mole % 3.471 3.481
Lean Amine Flow, lb/hr 59,000 63,000
Amine (MDEA wt%) 7 7
Sweet Gas H2S, ppm 0.5 0.5
CO2, mole % 1.16 1.13
Sweet Gas (HYSYS eff) H2S, ppm 0.59 0.22
CO2, mole % 1.46 1.47
Sweet Gas (HYSYS adv) H2S, ppm 0.49 0.18
CO2, mole % 1.5 1.5
Table 6: Flowsheet validation of absorber column using 7 wt% MDEA for various feed gas specifications

13 Acid Gas Cleaning using Amine Solvents: Validation with Experimental and Plant Data ©2015 Aspen Technology Inc. 11-7678-1215
ConclusionThe Acid Gas Cleaning feature in Aspen HYSYS is based on the Electrolyte NRTL thermodynamic model and the rate-based simulation technology for distillation columns. These technologies are well-proven and have been successfully used by a large number of AspenTech’s customers over many years; primarily in Aspen Plus®. The thermodynamic package and the simulation model in Aspen HYSYS were tested against the experimental and plant data. The results show a good match at a wide range of operating conditions.
If you are interested in validating models with your plant data, you should contact Jennifer Dyment at [email protected].
References 1. NaturalGas.org Website page. Processing Natural Gas. Accessed: 8/7/2014
2. Foss, Michelle Michot, and C. E. E. Head. “Interstate Natural Gas--Quality Specifications &
Interchangeability.” Center for Energy Economics, Bureau of Economic Geology, University of
Texas at Austin (2004).
3. Althuluth, M., Peters, C. J., Berrouk, A. S., Kroon, M. C., Separation Selectivity of Various Gases
in the Ionic Liquid 1-Ethyl-3 -Methylimidazolium Tris(pentafluoroethyl)Trifluorophosphate, 2013
AIChE Annual Meeting, November 2013
4. Kidnay, Arthur J., and William R. Parrish. Fundamentals of natural gas processing. Vol. 200. CRC
Press, 2006.
5. Zhang Y, Que H, Chen C C. Thermodynamic modeling for CO2 absorption in aqueous MEA
solution with electrolyte NRTL model. Fluid Phase Equilibria, 2011; 311:68-76
6. Aspen Technology Inc. Aspen HYSYS online documentation, 2014.
7. Taylor, R., R. Krishna, and H. Kooijman, “Real-World Modeling of Distillation,” Chem. Eng. Prog.,
July 2003, 28-39.
8. M. Kleiner, F. Tumakaka, G. Sadowski, A. Dominik, S. Jain, A. Bymaster, W. G. Chapman,
“Thermodynamic Modeling of Complex Fluids Using PC-SAFT,” Final Report for Consortium of
Complex Fluids, Universitat Dortmund and Rice University, 2006.
9. Kuranov, G.; Rumpf, B.; Smirnova, N. A.; Maurer, G. Solubility of Single Gases Carbon Dioxide and
Hydrogen Sulfide in Aqueous Solutions of N-Methyldiethanolamine in the Temperature Range
313-413 K at Pressures up to 5 MPa. Ind. Eng. Chem. Res. 1996, 35, 1959–1966.
10. Kamps,A´. P.-S.; Balaban, A.; Jo¨decke, M.; Kuranov, G.; Smirnova, N. A.; Maurer, G.
Solubility of Single Gases Carbon Dioxide and Hydrogen Sulfide in Aqueous Solutions of
N-Methyldiethanolamine at Temperatures from 313 to 393 K and Pressures up to 7.6 MPa: New
Experimental Data and Model Extension. Ind. Eng. Chem. Res. 2001, 40, 696–706.
11. Ermatchkov, V.; Kamps,A´ . P.-S.; Maurer, G. Solubility of Carbon Dioxide in Aqueous Solutions of
N-Methyldiethanolamine in the Low Gas Loading Region. Ind. Eng. Chem. Res. 2006, 45, 6081–
6091.

14 Acid Gas Cleaning using Amine Solvents: Validation with Experimental and Plant Data ©2015 Aspen Technology Inc. 11-7678-1215
12. Mathonat, C. Calorimetrie de me´lange, a ecoulement, a temperatures et pressions elevees.
Application a l’etude de l’elimination du dioxide de carbone a l’aide de solutions aqueuses
d’alcanolamines, Universite Blaise Pascal, Paris, 1995, p 265.
13. Carson, J. K.; Marsh, K. N.; Mather, A. E. Enthalpy of Solution of Carbon Dioxide in (Water
+ Monoethanolamine, or Diethanolamine, or N-Methyldiethanolamine) and (Water +
Monoethanolamine + N-Methyldiethanolamine) at T ) 298.15 K. J. Chem. Thermodyn. 2000, 32,
1285–1296.
14. Weiland, R. H.; Dingman, J. C.; Cronin, D. B. Heat capacity of Aqueous Monoethanolamine,
Diethanolamine,
N-Methyldiethanolamine, and N-Methyldiethanolamine-Based Blends with Carbon Dioxide. J.
Chem. Eng. Data 1997, 42, 1004–1006.
15. Jakobsen, J. P.; Krane, J.; Svendsen, H. F. Liquid-Phase Composition Determination in CO2-H
2O-
Alkanolamine Systems: An NMR Study.Ind. Eng. Chem. Res. 2005, 44, 9894–9903.
16. Jou, F. Y.; Mather, A. E.; Otto, F. D. Solubility of H2S and CO
2 in Aqueous Methyldiethanolamine
Solutions. Ind. Eng. Chem. Process Des. Dev. 1982, 21, 539–544.
17. Liu, H. –B.; Zhang, C. –F.; Xu, G.–W. A Study on Equilibrium Solubility for Carbon Dioxide in
Methyldiethanolamine-Piperazine-Water Solution, Ind. Eng. Chem. Res. 1999, 36, 4032-4036
18. Bishnoi, S. and Rochelle, G. T. Thermodynamics of Piperazine/Methyldiethanolamine/Water/
Carbon Dioxide, Ind. Eng. Chem. Res., 2002, 41, 604-612
19. Kamps,A´. P.-S.; Xia, J.; Maurer, G. Solubility of CO2 in (H2O+Piperazine) and in
(H2O+MDEA+Piperazine). AIChE Journal, 2003, 49, 2662-2670
20. Jenab, M. H.; Abdi, M. A.; Najibi, S. H.; Vahidi, M.; Matin, N. S. Solubility of Carbon Dioxide in
Aqueous Mixtures of N-Methyldiethanolamine+Piperazine+Sulfolane. J. Chem. Eng. Data. 2005,
50, 583-586
21. Bottger, A.; Ermatchkov, V.; Maurer, G. Solubility of Carbon Dioxide in Aqueous Solutions of
N-Methyldiethanolamine and Piperazine in the High Gas Loading Region, J. Chem. Eng. Data,
2009, 54, 1905-1909
22. Derks, P. W. J.; Hogendoorn, J. A.; Versteeg, G. F. Experimental and Theoretical Study of the
Solubility of Carbon Dioxide in Aqueous Blends of Piperazine and N-methyldiethanolamine. J.
Chem. Thermodynamics.2010, 42, 151-163
23. Speyer, D.; Maurer, G. “Solubility of Hydrogen Sulfide in Aqueous Solutions of Piperazine in the
Low Gas-Loading Region”, J. Chem. Eng. Data, 2011, 56, 763-767
24. Chen, X. “Carbon Dioxide Thermodynamics, Kinetics, and Mass Transfer in Aqueous Piperazine
Derivatives and other Amines”, Ph. D. Dissertation, the University of Texas at Austin, 2011
25. Xu, Q. “Thermodynamics of CO2 Loaded Aqueous Amines”, Ph. D. Dissertation, the University of
Texas at Austin, 2011
26. Xia, J.; Kamps, A. P. –S.; Maurer, G. Solubility of H2S in (H
2O + Piperazine) and in (H
2O + MDEA +
Piperazine). Fluid Phase Equilibria, 2003, 207, 23-34.
Note: Irina Rumyantseva, a former product marketing manager at AspenTech, co-authored this paper.

15 Acid Gas Cleaning using Amine Solvents: Validation with Experimental and Plant Data ©2015 Aspen Technology Inc. 11-7678-1215
Appendix IAbbreviations
MDEA Methylenedioxyethylamphetamine
MEA Monoethanolamine
DEA Diethanolamine
PZ Piperazine
DGA Aminoethoxyethanol (Diglycolamine)
DIPA Diisopropanolamine
TEA Triethanolamine

AspenTech is a leading supplier of software that optimizes process manufacturing—for energy, chemicals, engineering and construction, and other industries that manufacture and produce products from a chemical process. With integrated aspenONE® solutions, process manufacturers can implement best practices for optimizing their engineering, manufacturing, and supply chain operations. As a result, AspenTech customers are better able to increase capacity, improve margins, reduce costs, and become more energy efficient. To see how the world’s leading process manufacturers rely on AspenTech to achieve their operational excellence goals, visit www.aspentech.com.
Worldwide HeadquartersAspen Technology, Inc. 20 Crosby Drive | Bedford, MA 01730 | United States phone: +1-781-221-6400 | fax: +1-781-221-6410 | [email protected]
Regional HeadquartersHouston, TX | United States phone: +1-281-584-1000
São Paulo | Brazil phone: +55-11-3443-6261
Reading | United Kingdom phone: +44-(0)-1189-226400
Singapore | Republic of Singapore phone: +65-6395-3900
Manama | Bahrain phone: +973-13606-400
For a complete list of offices, please visit www.aspentech.com/locations
16 Acid Gas Cleaning using Amine Solvents: Validation with Experimental and Plant Data ©2015 Aspen Technology Inc. 11-7678-1215