‘cool’ load balancing for high performance computing data...
TRANSCRIPT

1
‘Cool’ Load Balancing for High PerformanceComputing Data Centers
Osman Sarood, Phil Miller, Ehsan Totoni, and Laxmikant V. Kale, Fellow, IEEE
Abstract—As we move to exascale machines, both peak power demand and total energy consumption have become prominentchallenges. A significant portion of that power and energy consumption is devoted to cooling, which we strive to minimize in thiswork. We propose a scheme based on a combination of limiting processor temperatures using Dynamic Voltage and FrequencyScaling (DVFS) and frequency-aware load balancing that reduces cooling energy consumption and prevents hot spot formation.Our approach is particularly designed for parallel applications, which are typically tightly coupled, and tries to minimize the timingpenalty associated with temperature control. This paper describes results from experiments using five different CHARM++ andMPI applications with a range of power and utilization profiles. They were run on a 32-node (128-core) cluster with a dedicatedair conditioning unit. The scheme is assessed based on three metrics: the ability to control processors’ temperature and henceavoid hot spots, minimization of timing penalty, and cooling energy savings. Our results show cooling energy savings of up to63%, with a timing penalty of only 2–23%.
Index Terms—Green IT, Temperature aware, Load balancing, Cooling energy, DVFS
F
1 INTRODUCTION
ENERGY consumption has emerged as a significantissue in modern high-performance computing
systems. Some of the largest supercomputers drawmore than 10 megawatts, leading to millions of dollarsper year in energy bills. What is perhaps less wellknown is the fact that 40% to 50% of the energy con-sumed by a data center is spent in cooling [1], [2], [3],to keep the computer room running at a lower tem-perature. How can we reduce this cooling energy?
Increasing the thermostat setting on the computerroom air-conditioner (CRAC) will reduce the coolingpower. But this will increase the ambient tempera-ture in the computer room. The reason the ambienttemperature is kept cool is to keep processor coresfrom overheating. If they run at a high temperaturefor a long time, the processor cores may be damaged.Additionally, cores consume more energy per unit ofwork when run at higher temperatures [4]. Further,due to variations in the air flow in the computer room,some chips may not be cooled as effectively as therest. Semiconductor process variation will also likelycontribute to variability in heating, especially in futureprocessor chips. So, to handle such ‘hot spots’, theambient air temperature is kept at a low temperatureto ensure that no individual chip overheats.
Modern microprocessors contain on-chip tempera-ture sensors which can be accessed by software withminimal overhead. Further, they also provide meansto change the frequency and voltage at which the chipruns, known as dynamic voltage and frequency scaling, orDVFS. Running processor cores at a lower frequency
The authors are members of the Parallel Programming Laboratory in theDepartment of Computer Science at the University of Illinois at Urbana-Champaign, Urbana, IL, 61801. For contact information and software, seehttp://charm.cs.illinois.edu/
(and correspondingly lower voltage) reduces the ther-mal energy they dissipate, leading to a cool-down.
This suggests a method for keeping processors coolwhile increasing the CRAC set-point (i.e. the thermo-stat setting). A component of the application softwarecan periodically check the temperature of the chip.When it exceeds a pre-set threshold, the software canreduce the frequency and voltage of that particularchip. If the temperature is lower than a threshold, thesoftware can correspondingly increase the frequency.
This technique will ensure that no processors over-heat. However, in HPC computations, and specificallyin tightly-coupled science and engineering simula-tions, this creates a new problem. Generally, compu-tations on one processor are dependent on the dataproduced by the other processors. As a result, if oneprocessor slows down to half its original speed, theentire computation can slow substantially, in spite ofthe fact that the remaining processors are running atfull speed. Thus, such an approach will reduce thecooling power, but increase the execution time of theapplication. Running the cooling system for a longertime can also increase the cooling energy.
We aim to reduce cooling power without substan-tially increasing execution time, and thus reduce cool-ing energy. We first describe the temperature sensorand frequency control mechanisms, and quantify theirimpact on execution time mentioned above (§ 3).Our solution leverages the adaptive runtime systemunderlying the Charm++ parallel programming sys-tem (§ 4). In order to minimize total system energyconsumption, we study an approach of limiting CPUtemperatures via DVFS and mitigating the resultanttiming penalties with a load balancing strategy that isconscious of these effects (§ 5). We show the impact of

2
this combined technique on application performance(§ 7) and total energy consumption (§ 8).
This paper is a substantially revised version ofa conference paper presented at Supercomputing2011 [5]. The new material includes performance dataon MPI benchmarks, in contrast to just the Charm++applications presented previously, refinements of theearlier techniques, performance data on the newSandy Bridge processor, including power sensors notavailable on the older hardware in our cluster, andsubstantially expanded experimental data.
2 RELATED WORKCooling energy optimization and hot spot avoidancehave been addressed extensively in the literature ofnon-HPC data centers [6], [7], [8], [9], which showsthe importance of the topic. As an example, job place-ment and server shut down have shown savings of upto 33% in cooling costs [6]. Many of these techniquesrely on placing jobs that are expected to generate moreheat in the cooler areas of the data center. This doesnot apply to HPC applications because different nodesare running parts of the same application with similarpower consumption. As an example, Rajan et al [10]use system throttling for temperature-aware schedul-ing in the context of operating systems. Given theirassumptions, they show that keeping temperatureconstant is beneficial with their theoretical models.However, their assumption of non-migratability oftasks is not true in HPC applications, especially withan adaptive runtime system. Le et al. [11] constraincore temperatures by turning the machines on and offand consequently reduce total energy consumption by18%. However, most of these techniques, can not beapplied to HPC applications as they are not practicalfor tightly-coupled applications.
Minimizing energy consumption has also been animportant topic for HPC researchers. However, mostof the work has focused on machine energy consump-tion rather than cooling energy. Freeh et al. [12] showmachine energy savings of up to 15% by exploitingthe communication slack present in the computationalgraph of a parallel application. Lim et al [13] demon-strate a median energy savings of 15% by dynamicallyadjusting the CPU frequency/voltage pair during thecommunication phases in MPI applications. Springeret al. [14] generate a frequency schedule for a DVFS-enabled cluster that runs the target application. Thisschedule tries to minimize the execution time whilestaying within the power constraints. The major dif-ference of our approach to the ones mentioned isthat our DVFS decisions are based on saving coolingenergy consumption by constraining core tempera-tures. The total energy consumption savings that wereport represent both machine and cooling energyconsumption.
Huang and Feng describe a kernel-level DVFS gov-ernor that tries to determine the power-optimal fre-
quency for the expected workload over a short timeinterval that reduces machine energy consumptionupto 11% [15]. Hanson et al. [16] devise a runtimesystem named PET for performance, power, energyand thermal management. They consider a more gen-eral case of multiple and dynamic constraints. How-ever, they just consider a serial setting without thedifficulties of parallel machines and HPC applications.Extending our approach for constraints other thantemperature is an interesting future work.
Banerjee et al. [17] try to improve the cooling cost inHPC data centers by an intelligent job placement al-gorithm yielding up to 15% energy savings. However,they do not consider the temperature variations insidea job, so there is no control over the applications.Thus, their approach can be less effective for datacenters with a few large-scale jobs rather than manysmall jobs. They also depend on job pre-runs to getinformation about the jobs. In addition, their resultsare based on simulations and not experiments on areal testbed. Tang et al. [18] reduce 30% of coolingenergy consumption by scheduling tasks in a datacenter. However, large-scale parallel jobs’ considera-tions is an issue there too.
Merkel et al. [19] discuss the scheduling of tasksin a multiprocessor to avoid hot cores. However, theydo not deal with complications of parallel applicationsand large-scale data centers. Freeh et al. [20] exploitthe varying sensitivity of different phases in the appli-cation to core frequency in order to reduce machineenergy consumption for load balanced applications.This work is similar to ours, as it deals with loadbalanced applications. They reduce machine energyconsumption by a maximum of 16%. However, ourwork is different as we achieve much higher savingsin total energy consumption primarily by reducingcooling energy consumption.
3 LIMITING TEMPERATURESThe design of a machine room or data center must en-sure that all equipment stays within its safe operatingtemperature range while keeping costs down. Com-modity servers and switches draw cold air from theirenvironment, pass it over processor heatsinks andother hot components, and then expel it at a highertemperature. To satisfy these systems’ specificationsand keep them operating reliably, cooling systems inthe data center must supply a high enough volumeof sufficiently cold air to every piece of equipment.
Traditional data center designs treated the air inthe machine room as a single mass, to be kept atan acceptable aggregate temperature. If the air en-tering some device was too hot, it meant that theCRAC’s thermostat should be adjusted to a lowerset-point. That adjustment would cause the CRAC torun more frequently or intensely, increasing its energyconsumption. More modern designs, such as alter-nating hot/cold aisles [1] or in-aisle coolers, provide

3
Fig. 1. Average core temperatures and maximumdifference of any core from the average for Wave2D
greater separation between cold and hot air flows andmore localized cooling, easing appropriate supply tocomputing equipment and increasing efficiency.
However, even with this tighter air management,variations in air flow, system design, manufacturingand assembly, and workload may still leave some de-vices significantly hotter than others. To illustrate thissensitivity, we run an intensive parallel application ona cluster with a dedicated CRAC unit whose set-pointwe can manipulate. Details of this setup are describedin Section 6. Figure 1 shows two runs of the applica-tion with different CRAC set-point temperatures. Foreach run, we plot both the average core temperatureacross the entire cluster, and the maximum deviationof any core from that average.
Unsurprisingly, observed core temperatures corre-late with the temperature of the air provided to coolthem. With a set-point increase of 2.3◦ C, the averagetemperature across the system increases by 6◦ C. Morenoteworthy is that this small shift creates a substantialhot spot, that worsens progressively over the courseof the run. At the higher 25.6◦ C set-point, the tem-perature difference from the average to the maximumrises from 9◦ C to 20◦ C. In normal operations, thiswould be an unacceptable result, and the CRAC set-point must be kept low enough to avoid it.
An alternative approach, based on DVFS, showspromise in addressing the issue of overcooling andhot spots. DVFS is already widely used in laptops,desktops, and servers in non-HPC data centers as ameans to limit CPU power consumption. Howeverapplying DVFS naıvely to HPC workloads entails anunacceptable performance degradation. Many HPCapplications are tightly-coupled, such that one or afew slow cores would effectively slow down an entirejob. This timing penalty implies decreased throughputand increased time-to-solution.
To demonstrate the impact of DVFS, we repeat theearlier experiment with a temperature constraint. Wefix a threshold temperature of 44◦ C that we wishto keep all CPUs below. We sample temperaturesperiodically, and when a CPU’s average temperatureis over this threshold, its frequency is lowered by
0
100
200
300
400
500
NoLB 14.4 17.8 21.1 24.4 0
200
400
600
800
1000
1200
1400
Tim
e (
sec)
Energ
y (
KJ)
CRAC Set Point (C)
TimeMachine EnergyCooling Energy
Fig. 2. Execution time and energy consumption forWave2D running at different CRAC set-points usingDVFS
one step i.e. increase P-state by a level. If it is morethan a degree below the threshold, its frequency isincreased by one step i.e. decrease P-state by a level.We repeat this experiment over a range of CRACsettings, and compute their performance in time andenergy consumption relative to a run with all coresworking at their maximum frequency and the CRACset to 12.2◦ C. As shown in Figure 2, DVFS alone inthis setting hurts performance and provides minimalsavings in total energy consumption. Most of thesavings from cooling energy consumption are offsetby an increase in machine energy consumption. Nev-ertheless, our results in Figure 3 (described in detailin Section 7) show that DVFS effectively limits bothoverall temperatures and hot spots.
More radical liquid-cooling designs mitigate someof the hot spot concerns, but they are not a panacea.Equipment must be specifically designed to be liquid-cooled, and data centers must be built or retrofit tosupply the coolant throughout the machine room. Thepresent lack of commodity liquid-cooled systems anddata centers means that techniques to address thechallenges of air-cooled computers will continue tobe relevant for the foreseeable future. Moreover, ourtechniques for limiting core temperatures can actuallyreduce the overall thermal load of an HPC system,leading to energy savings even for installations usingliquid cooling.
4 CHARM++ AND LOAD BALANCING
CHARM++ is a general-purpose C++-based parallelprogramming system designed for productive HPCprogramming [21]. It is supported by an adaptiveruntime system that automates resource management.It relies on techniques such as processor virtualizationand over-decomposition (having more work unitsthan the number of cores) to improve performancevia adaptive overlap of computation and communi-cation and data-driven execution. This means thatthe developer does not need to program in terms

4
of the physical cores, but instead divides the workinto pieces with a suitable grain size to let the systemmanage them easily.
A key feature of CHARM++ is that the units ofwork decomposition are migratable objects. The adap-tive runtime system can assign these objects to anyprocessor and move them around during program ex-ecution, for purposes including load balancing, com-munication optimization, and fault tolerance. To en-able effective load balancing, it tracks statistics of eachobject’s execution, including its computation time andcommunication volume [22].
The runtime system provides a variety of plug-inload balancing strategies that can account for differentapplication characteristics. Through a simple API,these strategies take the execution statistics from theruntime and generate a set of migration instructions,describing which objects to move between which pro-cessors. Application developers and users can providetheir own strategy implementations as desired. Loadbalancing strategies can be chosen at compilation orrun-time. The majority of these strategies are basedon the heuristic ‘principle of persistence’, which statesthat each object’s computation and communicationloads tend to persist over time. The principle ofpersistence holds for a large class of iterative HPCapplications. In this study, we have developed a newload balancing strategy that accounts for the per-formance effects of DVFS-induced heterogeneity. Thenew strategy is described in detail in Section 5.
At small scales, the cost of the entire load balancingprocess, from instrumentation through migration, isgenerally a small portion of the total execution time,and less than the improvement it provides. Where thisis not immediately the case, a strategy must be chosenor adapted to match the application’s needs [23]. Ourapproach can be easily adapted to available hierarchi-cal schemes, which have been shown to scale to thelargest machines available [24]. By limiting the costof decision-making and scope of migration, we expectthese schemes to offer similar energy benefits.
4.1 AMPIThe Message Passing Interface (MPI) is a standard-ized communication library for distributed-memoryparallel programming. MPI has become the dominantparadigm for large-scale parallel computing. Thus,techniques for addressing the energy consumptionof large parallel systems must be applicable to MPIapplications.
CHARM++ provides an implementation of MPIknown as Adaptive MPI (AMPI). AMPI makes thefeatures of the CHARM++ runtime system availableto MPI programs. Common MPI implementationsimplement each unit of parallel execution, or rank, as aseparate process. Pure MPI applications run one rankper CPU core, while others use fewer ranks and gainadditional shared-memory parallelism via threading.
In contrast, AMPI encourages running applicationswith several ranks per core. AMPI implements theseranks as light-weight user-level threads, many ofwhich can run in each process. The runtime schedulesthese threads non-preemptively, and switches themwhen they make blocking communication calls. In-ternally, these threads are implemented as migratableobjects, enabling the same benefits for MPI programsas for native CHARM++. In particular, AMPI allowsus to apply the CHARM++ load balancing strategieswithout intrusive modifications to application logic.
5 TEMPERATURE-AWARE LOAD BALANC-ING APPROACH
In this section, we introduce a novel approach thatreduces energy consumption of the system with min-imal timing penalty. It is based on limiting core tem-peratures using DVFS and task migration. Becauseour scheme is tightly coupled to task migration, wechose CHARM++ and AMPI as our parallel program-ming frameworks as they allow easy task (object) mi-gration with low overhead. All the implementationsand experiments were done using CHARM++ andAMPI. However, our techniques can be applied to anyparallel programming system that provides efficienttask migration.
The steps of our temperature-control scheme canbe summarized as applying the following processperiodically:
1) Check the temperatures of all cores2) Apply DVFS to cores that are hotter or colder
than desired3) Address the load imbalance caused by DVFS
using our load balancer, TempLDB:a) Normalize task and core load statistics to
reflect old and new frequenciesb) Identify overloaded or underloaded coresc) Move work from overloaded cores to un-
derloaded coresThe remainder of this section describes this process indetail.
Our temperature control scheme is periodically trig-gered after equally spaced intervals in time, referredto as steps. Other DVFS schemes [15] try to reactdirectly to the demands of the application workload,and thus must sample conditions and make adjust-ments at intervals on the order of milliseconds. Incontrast, our strategy only needs to react to muchslower shifts in chip temperature, which occur overintervals of seconds. At present, DVFS is triggered aspart of the runtime’s load balancing infrastructure ata user-specified period.
Our control strategy for DVFS is to let the coreswork at their maximum frequency as long as theirtemperature is below a threshold parameter. If a core’stemperature crosses above the threshold, it is con-trolled by decreasing the voltage and frequency using

5
TABLE 1Description for variables used in Algorithm 1
Variable Description
n number of tasks in applicationp number of coresTmax maximum temperature allowedk current load balancing stepCi set of cores on same chip as core itaskT imeki execution time of task i during
step k (in ms)coreT imeki time spent by core i executing tasks
during step kfki frequency of core i during step k (in Hz)
mki core number assigned to task i
during step k{task, core}T ickski num. of clock ticks taken by ith task/core
during step ktki average temperature of chip i at start of
step k (in ◦C)overHeap heap of overloaded coresunderSet set of underloaded cores
DVFS. When the voltage and frequency are reduced,power consumption will drop and hence the core’stemperature will fall. Our earlier approach [5] raisedthe voltage and frequency as soon as temperaturesfell below the threshold, causing frequent changes andrequiring effort to load balance in every interval. Toreduce overhead, our strategy now waits until a chip’stemperature is a few degrees below the thresholdbefore increasing its frequency.
The hardware in today’s cluster computers does notallow reducing the frequency of each core individu-ally and so we must apply DVFS to the whole chip.This raises the question: what heuristic should weuse to trigger DVFS and modulate frequency? In ourearlier work [4], we conducted DVFS when any of thecores on a chip were considered too hot. However, ourmore recent results [5] show that basing the decisionon average temperature of the cores in a chip resultsin better temperature control.
Another important decision is how much a chip’sfrequency should be reduced (respectively, raised)when it gets too hot (is safe to warm up). Presenthardware only offers discrete frequency and voltagelevels built into the hardware, the ‘P-states’. Usingthis hardware, we observed that reducing the chip’sfrequency by one level at a time is a reasonableheuristic because it effectively constrains the coretemperatures in the desired range (Figure 3). Lines 1–6of Algorithm 1 apply DVFS as we have just described.The description of the variables and functions used inthe algorithm is given in Table 1.
When DVFS adjusts frequencies differently acrossthe cores in a cluster, the workloads on those coreschange relative to one another. Because this potentialfor load imbalance occurs all at once, at an easilyidentified point in the execution, it makes sense toreact to it immediately. The system responds by re-balancing the assignment of work to cores according
Algorithm 1 Temperature Aware Refinement LoadBalancing
1: On every node i at start of step k2: if tki > Tmax then3: decreaseOneLevel(Ci) {increase P-state}4: else if tki < Tmax − 2 then5: increaseOneLevel(Ci) {decrease P-state}6: end if7: On Master core8: for i ∈ [1, n] do9: taskT icksk−1
i = taskT imek−1i × fk−1
mk−1i
10: totalT icks += taskT icksk−1i
11: end for12: for i ∈ [1, p] do13: coreT icksk−1
i = coreT imek−1i × fk−1
i
14: freqSum += fki
15: end for16: createOverHeapAndUnderSet()17: while overHeap NOT NULL do18: donor = deleteMaxHeap(overHeap)19: (bestTask, bestCore) =
getBestCoreAndTask(donor, underSet)20: mk
bestTask = bestCore21: coreT icksk−1
donor− = taskT icksk−1bestTask
22: coreT icksk−1bestCore+ = taskT icksk−1
bestTask
23: updateHeapAndSet()24: end while25:26: procedure isHeavy(i)27: return coreT icksk−1
i > (1+ tolerance) ∗ totalT icks∗(fk
i /freqSum)28:29: procedure isLight(i)30: return coreT icksk−1
i < totalT icks ∗ fki /freqSum
to the strategy described by lines 7–30 of Algorithm 1.The key principle in how a load balancer must
respond to DVFS actuation is that the load statisticsmust be adjusted to reflect the various different fre-quencies at which load measurements were recordedand future work will run. At the start of step k,our load balancer retrieves load information for stepk − 1 from CHARM++’s database. This data givesthe total duration of work executed for each taskin the previous interval (taskT imek−1
i ) and the corethat executed it (mk−1
i ). Here i refers to task id andk − 1 represents last step. We normalize the taskworkloads by multiplying their execution times by theold frequency values of the core they executed on, andsum them to compute the total load, as seen in lines8–11. This normalization is an approximation to theperformance impact of different frequencies, whosevalidity can be seen in Figure 8. However, differentapplications might have different characteristics (e.g.cache hit rates at various levels, instructions per cycle)that determine the sensitivity of their execution time

6
to core frequency. We plan to incorporate more de-tailed load estimators in our future work. The schemealso calculates the work assigned to each core andsum of frequencies for all the cores to be used later(lines 12-15).
Once the load normalization is done, we createa max heap for overloaded cores (overHeap) and aset for the underloaded cores (underSet) on line 16.The cores are classified as overloaded and under-loaded by procedures isHeavy() and isLight() (lines26–30), based on how their normalized loads fromthe previous step, k − 1, compare to the frequency-weighted average load for the coming step k. We usea tolerance in identifying overloaded cores to focusour efforts on the worst instances of overload andminimize migration costs. In our experiments, we setthe tolerance to 0.07, empirically chosen for the slightimprovement it provided over the lower values usedin our previous work.
Using these data structures, the load balancer iter-atively moves work away from the most overloadedcore (donor, line 18) until none are left (line 17). Themoved task and recipient are chosen as the heaviesttask that the donor could transfer to any underloadedcore such that the underloaded core doesn’t becomeoverloaded (line 19, implementation not shown). Oncethe chosen task is reassigned (line 20), the load statis-tics are updated and the data structures are updatedaccordingly (lines 21–23).
6 EXPERIMENTAL SETUP
To evaluate our approach to reducing energy con-sumption, we must be able to measure and controlcore frequencies and temperatures, air temperature,and energy consumed by computer and cooling hard-ware. It is important to note that all the experimentswere run on real hardware, and there are no simula-tion results in this paper.
We tested our scheme on a cluster of 32 nodes (128cores). Each node has a single socket with a four-coreIntel Xeon X3430 processor chip. Each chip can be setto 10 different frequency levels (‘P-states’) between1.2 GHz and 2.4 GHz. It also supports Intel’s Turbo-Boost [25], allowing some cores to overclock up to 2.8GHz. The operating system on the nodes is CentOS5.7 with lm-sensors and the coretemp moduleinstalled to provide core temperature readings, andthe cpufreq module installed to enable software-controlled DVFS. The cluster nodes are connected bya 48-port gigabit ethernet switch. We use a Liebertpower distribution unit installed on the rack contain-ing the cluster to measure the machine power after a1 second interval on a per-node basis. We gather thesereadings for each experiment and integrate them overthe execution time to come up with the total machineenergy consumption.
The machine and CRAC are hosted in a dedi-cated machine room by the Department of Com-puter Science at the University of Illinois at Urbana-Champaign. This CRAC is an air cooler fed by chilledwater from a campus plant. It achieves the tempera-ture set-point prescribed by the operator by manipu-lating the flow of the chilled water. The exhaust aircoming from the machine room with temperature Thot
is compared to the set-point and the water flow isadjusted accordingly. This cooling design is similar tothe cooling systems of most large data centers. Wewere able to vary the CRAC set-point across a broadrange as shown in our results (following sections).
Because the CRAC unit exchanges machine roomheat with chilled water supplied by a campus-wideplant, measuring its direct energy consumption (i.e.with an electrical meter) would only include themechanical components driving air and water flow,and would miss the much larger energy expenditureused to actually cool the water. To more realisticallycapture the machine room’s cooling energy, we use amodel [11] based on measurements of how much heatthe CRAC actually expels. The instantaneous powerconsumed by the CRAC to cool the temperature ofthe exhaust air from Thot down to the cool inlet airtemperature Tac can be approximated by:
Pac = cair ∗ fac ∗ (Thot − Tac) (1)
In this equation, cair is the heat capacity constantand fac is the constant rate of air flow through thecooling system. We use temperature sensors on theCRAC’s vents to measure Thot and Tac. During ourexperiments, we recorded a series of measurementsfrom each of these sensors, and then integrated thecalculated power to produce total energy figures.
We believe that by working in a dedicated space,the present work removes a potential source of errorfrom previous data center cooling results. Most datacenters have many different jobs running at any giventime. Those jobs dissipate heat, interfering with cool-ing energy measurements and increasing the ambienttemperature in which the experimental nodes run. Incontrast, our cluster is the only heat source in thespace, and the CRAC is the primary sink for that heat.
We investigate the effectiveness of our scheme,using five different applications, of which three areCHARM++ applications and two are written in MPI.These applications have a range of CPU utilizationsand power profiles. The first one is Jacobi2D, whichis a canonical benchmark that iteratively applies afive-point stencil over a 2D grid of points. At theend of each iteration, instead of a reduction to testfor convergence, all the processors send a messageto processor zero, which causes more idle time. Weused this version of Jacobi to have some slack in thecomputation of each processor and investigate ourscheme’s behavior in this case. The second applicationis Wave2D, which uses a finite difference scheme

7
over a 2D discretized grid to calculate the pressureresulting from an initial set of perturbations. The thirdapplication is a classical molecular dynamics codecalled Mol3D. Our MPI applications are MG and FTfrom the NAS parallel benchmarks suite [26].
Most of our experiments were run for 300 secondsas it provided ample time for all the applicationsto settle to their steady state frequencies. All theresults we show are averaged over three identicallyconfigured runs, with a cool-down period before each.All normalized results are reported with respect to arun where all 128 cores were running at the maximumpossible frequency with Intel Turbo Boost in operationand the CRAC set to 12.2◦ C. To validate the ability ofour scheme to reduce energy consumption for longerexecution times, we ran Wave2D (the most power-hungry of the five applications we consider) for twoand a half hours. The longer run was consistent withour findings, with the temperature being constrainedwell within the specified range and we were able toreduce cooling energy consumption for the entire twoand half hour period.
7 CONSTRAINING CORE TEMPERATURESAND TIMING PENALTY
The approach we have described in Section 5 con-strains processor temperatures with DVFS while at-tempting to minimize the resulting timing penalty.Figure 3 shows that all of our applications when usingDVFS and TempLDB, settle to an average temperaturethat lies in the desired range (the two horizontallines at 47 ◦C and 49 ◦C on Figure 3). As the averagetemperature increases to its steady-state value, thehottest single core ends up no more than 6◦ C abovethe average (lower part of Figure 3) as compared to20◦ C above average for the run where we are notusing temperature control (Figure 1).
Figure 4 shows the timing penalty incurred by eachapplication under DVFS, contrasting its effect withand without load balancing. The effects of DVFS onthe various applications are quite varied. The worstaffected, Wave2D and NAS MG, see penalties of over50%, which load balancing reduces to below 25%.Jacobi2D was least affected, with a maximum penaltyof 12%, brought down to 3% by load balancing. Inall cases, the timing penalty sharply decreases whenload balancing is activated, generally by greater than50%. Before analyzing timing penalty for individualapplications let us first see how load balancing helpsin saving timing penalty compared to naive DVFS.
To illustrate the benefits of load balancing, weuse Projections, which is a multipurpose performancevisualization tool for CHARM++ applications. Here,we use processor timelines to see the utilization ofthe processors in different time intervals. For easeof comprehension, we show a representative 16-coresubset of the 128-core cluster. The top part of Figure 5
30
35
40
45
50
50 100 150 200
Tem
pera
ture
(C)
Cluster Average Temperature
Wave2DNPB-FT
NPB-MGMol3D
Jacobi2DAllowed range
0 2 4 6 8
10
50 100 150 200
Tem
pera
ture
dev
iatio
n (C
)
Time (s)
Highest Single-core Deviation from Cluster Average Temperature
Fig. 3. Our DVFS and load balancing scheme success-fully keeps all processors within the target temperaturerange of 47◦–49◦ C, with a CRAC set-point of 24.4◦ C.
shows the timelines for execution of Wave2D withthe naive DVFS scheme. Each timeline (horizontalline) corresponds to the course of execution of onecore visualizing its utilization. The green and pinkcolored pieces show different computation but whiteones represent idle time. The boxed area in Figure 5shows some of the cores have significant idle time.The top 4 cores in the boxed area take much longerto execute their computation than the bottom 12 coresand this is why the pink and green parts are longer forthe top 4 cores. However, the other 12 cores executetheir computation quickly and stay idle waiting forthe rest of cores. This is because DVFS decreased thefirst four cores’ frequencies and so they are slower intheir computation. This shows that the timing penaltyof naive DVFS is dictated by the slowest cores. Thebottom part of Figure 5 shows the same temperaturecontrol but using our TempLDB. In this case, there isno significant idle time because the scheme balancesthe load between slow and fast processors by takingtheir frequencies into account. Consequently, the latterapproach results in much shorter total execution time,as reflected by shorter timelines (and figure width) inthe bottom part of Figure 5.
Now let us try to understand the timing penaltydifferences amongst different applications by exam-ining more detailed data. Jacobi2D experiences thelowest impact of DVFS, regardless of load balancing(Figure 4(a)). This occurs for several interconnectedreasons. From the high level, Figure 3 shows that ittakes the longest of any application to increase tem-peratures to the upper bound of the acceptable range,where DVFS activates. This slow ramp-up in temper-ature means that its frequency does not drop untillater in the run, and then falls relatively slowly, asseen in Figure 6 which plots the minimum frequencyat which any core was running (Figure 6(a)) andthe average frequency (Figure 6(b)) for all 128 cores.Even when some processors reach their minimum fre-

8
0
10
20
30
40
50
60
70
14.4 17.8 21.1 24.4
Tim
ing
Pen
alty
(%)
CRAC Set Point (C)
Naive DVFSTempLDB
(a) Jacobi2D
0
10
20
30
40
50
60
70
14.4 17.8 21.1 24.4
Tim
ing
Pen
alty
(%)
CRAC Set Point (C)
Naive DVFSTempLDB
(b) Wave2D
0
10
20
30
40
50
60
70
14.4 17.8 21.1 24.4
Tim
ing
Pen
alty
(%)
CRAC Set Point (C)
Naive DVFSTempLDB
(c) Mol3D
0
10
20
30
40
50
60
70
14.4 17.8 21.1 24.4
Tim
ing
Pen
alty
(%)
CRAC Set Point (C)
Naive DVFSTempLDB
(d) NPB-MG
0
10
20
30
40
50
60
70
14.4 17.8 21.1 24.4
Tim
ing
Pen
alty
(%)
CRAC Set Point (C)
Naive DVFSTempLDB
(e) NPB-FT
Fig. 4. Execution timing penalty with and without Temperature Aware Load Balancing
Fig. 5. Execution timelines before and after Tempera-ture Aware Load Balancing for Wave2D
quency, Figure 6(b) shows that its average frequencydecreases more slowly than any other application, anddoes not fall as far. The difference in the averagefrequency and the minimum frequency explains thedifference between TempLDB and naive DVFS, as theexecution time for TempLDB is dependent on averagefrequency whereas the execution time for naive DVFSdepends on the minimum frequency at which anycore is running.
Another way to understand the relatively smalltiming penalty of Jacobi2D is to compare its utiliza-tion and frequency profiles. Figure 7(a) depicts eachcore’s average frequency over the course of the run.Figure 7(b) shows the utilization of each core whilerunning Jacobi2D. In both figures, each bar representsthe measurement of a single core. The green part
1.2
1.4
1.6
1.8
2
2.2
2.4
0 50 100 150 200 250 300
Min
imum
Fre
quen
cy (G
Hz)
Time (s)
Mol3DMG
Wave2DFT
Jacobi2D
(a) Minimum Core Frequency
1.2
1.4
1.6
1.8
2
2.2
2.4
0 50 100 150 200 250 300
Ave
rage
Fre
quen
cy (G
Hz)
Time (s)
Mol3DMG
Wave2DFT
Jacobi2D
(b) Average Core Frequency
Fig. 6. Minimum and average core frequencies pro-duced by DVFS for different applications at 24.4◦ C
of the utilization bars represents computation andthe white part represents idle time. As can be seen,utilizations of the right half cores are roughly higherthan the left half. Furthermore, the average frequencyof the right half processors is roughly lower thanthe other half. Thus, lower frequency has resulted inhigher utilization of those processors without much

9
0
0.5
1
1.5
2
0 20 40 60 80 100 120
Ave
rag
e F
req
ue
ncy
Core Number
(a) Average frequency of processors forJacobi2D
(b) Utilization of processors for Jacobi2D
Fig. 7. Overall execution behavior of Jacobi2D usingTempLDB
TABLE 2Performance counters for Charm++ applications on
one core
Counter Type Jacobi2D Mol3D Wave2D
MFLOP/s 373 666 832Traffic L1-L2 (MB/s) 762 1017 601Cache misses to DRAM 663 75 402(millions)
timing penalty. The reason this variation can occur isthat the application naturally has some slack time ineach iteration, which the slower processors dip intoto keep pace with faster ones.
To examine the differences among applications atanother level, Figure 8 shows the performance im-pact of running each application with the processorfrequencies fixed at a particular value (the marking2.4+ refers to the top frequency plus Turbo Boost). Allapplications slow down as CPU frequency decreases,but Jacobi2D feels this effect very lightly comparedto the others. This marked difference can be betterunderstood in light of the performance counter-basedmeasurements shown in Table 2. These measurementswere taken in equal-length runs of the three Charm++applications using the PerfSuite toolkit [27]. Jacobi2Dhas a much lower computational intensity, in terms ofFLOP/s, than the other applications. It also retrievesmuch more data from main memory, explaining itslower sensitivity to frequency shifts. Its lower in-tensity also means that it consumes less power anddissipates less heat in the CPU cores than the other
0.8
0.9
1
1.1
1.21.41.61.822.22.42.4+
Nor
mal
ized
Thr
ough
put
Frequency (GHz)
NPB-MGMol3D
NPB-FTWave2D
Jacobi2D
Fig. 8. Frequency sensitivity of the various applications
applications, explaining its slower ramp-up in tem-perature, slower ramp-down in frequency, and highersteady-state average frequency. In contrast, the higherFLOP counts and cache access rates of Wave2D andMol3D explain their high frequency sensitivity, rapidcore heating, lower steady-state frequency, and hencethe large impact DVFS has on their performance.
8 ENERGY SAVINGSIn this section, we evaluate the ability of our schemeto reduce total energy consumption. Our current loadbalancing scheme with the allowed temperature rangestrategy resulted in less than 1% time overhead forapplying DVFS and load balancing (including the costof object migration). Due to that change, we now getsavings in both cooling energy consumption as wellas machine energy consumption, although savings incooling energy consumption constitute the main partof the reduction in total energy consumption. In orderto understand the contribution for both cooling en-ergy consumption and machine energy consumption,we will look at them separately.
8.1 Cooling energy consumptionThe essence of our work is to reduce cooling energyconsumption by constraining core temperatures andavoiding hot spots. As outlined in Equation 1, thecooling power consumed by the air conditioning unitis proportional to the difference between the hot airand cold air temperatures going in and out of theCRAC respectively. As mentioned in [1], [2], [3],cooling cost can be as high as 50% of the total energybudget of the data center. However, in our calculation,we take it to be 40% of the total energy consumptionof a baseline run with the CRAC at its lowest set-point, which is equivalent to 66.6% of the measuredmachine energy during that run. Hence, we use thefollowing formula to estimate the cooling power byfeeding in actual experimental results for hot and coldair temperatures:
PLBcool =
2 ∗ (TLBhot − TLB
ac ) ∗ P basemachine
3 ∗ (T basehot − T base
ac )(2)

10
0
500
1000
1500
2000
2500
3000
3500
4000
4500
No DVFS 14.4°C 17.8°C 21.1°C 24.4°C
Mac
hine
Pow
er (W
)
CRAC Temperature
Mol3DJacobi
NPB-MGNPB-FTWave2D
(a) Machine power consumption
0
500
1000
1500
2000
2500
3000
3500
4000
4500
No DVFS 14.4°C 17.8°C 21.1°C 24.4°C
Coo
ling
Pow
er (W
)
CRAC Temperature
Mol3DJacobi
NPB-MGNPB-FTWave2D
(b) Cooling power consumption
Fig. 9. Machine and cooling power consumption for no-DVFS runs at a 12.2 ◦C set-point and various TempLDBruns
TLBhot represents the temperature of hot air leaving
the machine room (entering the CRAC) and TLBac
represents the temperature of the cold air entering themachine room. T base
hot and T baseac represent the hot and
cold air temperatures with the largest difference whilerunning Wave2D at the coolest CRAC set-point (i.e.12.2◦ C), and P base
machine is the power consumption ofthe machine for the same experiment.
Figure 9 shows the machine power consumptionand the cooling power consumption for each appli-cation using TempLDB. In Figure 9(b) we note thatthe cooling power consumption falls as we increasethe CRAC set-point for all the applications. A higherCRAC set-point means the cores heat up more rapidly,leading DVFS to set lower frequencies. Thus, machinepower consumption falls as a result of the CPUs draw-ing less power (Figure 9(a)). The machine’s decreasedpower draw and subsequent heat dissipation meansthat less energy is added to the machine room air.The lower heat flux to the ambient air means thatthe CRAC requires less power to expel that heatand maintain the set-point temperature, as seen inFigure 9(b).
Wave2D consumes the highest cooling power forthree out of the four CRAC set-points we used, whichis consistent with its high machine power consump-tion. Figure 10 shows the savings in cooling energy incomparison to the baseline run where all the cores areworking at the maximum frequency without any tem-perature control. These figures include the extra time
0.8
0.9
1
1.1
1.2
1.21.41.61.822.22.42.4+
Nor
mal
ized
Ene
rgy
Frequency (GHz)
Wave2DNPB-FT
NPB-MGMol3D
Jacobi2D
Fig. 12. Normalized machine energy consumption fordifferent frequencies using 128 cores
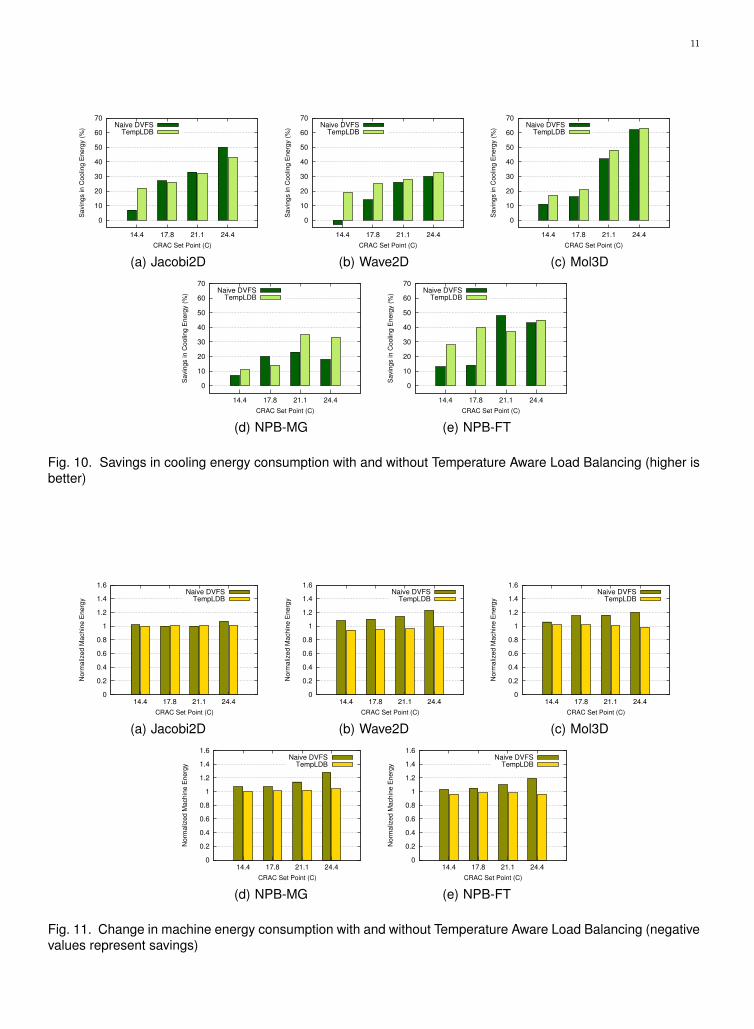
the cooling needs to run corresponding to the timingpenalty introduced because of applying DVFS. Due tothe large reduction in cooling power (Figure 9(b)) ourscheme was able to save as much as 63% of the coolingenergy in the case of Mol3D running at a CRAC set-point of 24.4 ◦C. We can see that the savings in coolingenergy consumption are better with our techniquethan naive DVFS for most of the applications andthe corresponding set-points. This is mainly due tothe higher timing penalty for naive DVFS runs, whichcauses the CRAC to work for much longer than thecorresponding TempLDB run.
8.2 Machine energy consumptionAlthough TempLDB does not optimize for reducedmachine energy consumption, we still end up show-ing savings for some applications. Figure 11 showsthe change in machine energy consumption. A neg-ative number represents a saving in machine energyconsumption whereas a positive number points to anincrease.
It is interesting to see that NPB-FT and Wave2Dend up saving machine energy consumption whenusing TempLDB. For Wave2D, we end up saving 6%of machine energy consumption when the CRAC isset to 14.4 ◦C whereas the maximum machine energysavings of NPB-FT, 4%, occurs when the CRAC is setto 14.4 ◦C or 24.4 ◦C. To find the reasons for these sav-ings in machine energy consumption, we performeda set of experiments where we ran the applicationswith the 128 cores of our cluster fixed at each ofthe available frequencies. Figure 12 plots the normal-ized machine energy for each application against thefrequency at which it was run. Power consumptionmodels dictate that CPU power consumption canbe regarded as being proportional to the cube offrequency which would imply that we should expectthe power to fall as a cubic of frequency whereas theexecution time increases only linearly in the worstcase. This would imply that we should always reduceenergy consumption by moving to a lower frequency.This proposition does not hold because of the highbase power drawn by everything other than the CPUand memory subsystem, which is 40W per node for
11
0
10
20
30
40
50
60
70
14.4 17.8 21.1 24.4
Savin
gs in C
oolin
g E
nerg
y (
%)
CRAC Set Point (C)
Naive DVFSTempLDB
(a) Jacobi2D
0
10
20
30
40
50
60
70
14.4 17.8 21.1 24.4
Savin
gs in C
oolin
g E
nerg
y (
%)
CRAC Set Point (C)
Naive DVFSTempLDB
(b) Wave2D
0
10
20
30
40
50
60
70
14.4 17.8 21.1 24.4
Savin
gs in C
oolin
g E
nerg
y (
%)
CRAC Set Point (C)
Naive DVFSTempLDB
(c) Mol3D
0
10
20
30
40
50
60
70
14.4 17.8 21.1 24.4
Savin
gs in C
oolin
g E
nerg
y (
%)
CRAC Set Point (C)
Naive DVFSTempLDB
(d) NPB-MG
0
10
20
30
40
50
60
70
14.4 17.8 21.1 24.4S
avin
gs in C
oolin
g E
nerg
y (
%)
CRAC Set Point (C)
Naive DVFSTempLDB
(e) NPB-FT
Fig. 10. Savings in cooling energy consumption with and without Temperature Aware Load Balancing (higher isbetter)
0
0.2
0.4
0.6
0.8
1
1.2
1.4
1.6
14.4 17.8 21.1 24.4
Norm
aliz
ed M
achin
e E
nerg
y
CRAC Set Point (C)
Naive DVFSTempLDB
(a) Jacobi2D
0
0.2
0.4
0.6
0.8
1
1.2
1.4
1.6
14.4 17.8 21.1 24.4
Norm
aliz
ed M
achin
e E
nerg
y
CRAC Set Point (C)
Naive DVFSTempLDB
(b) Wave2D
0
0.2
0.4
0.6
0.8
1
1.2
1.4
1.6
14.4 17.8 21.1 24.4
Norm
aliz
ed M
achin
e E
nerg
y
CRAC Set Point (C)
Naive DVFSTempLDB
(c) Mol3D
0
0.2
0.4
0.6
0.8
1
1.2
1.4
1.6
14.4 17.8 21.1 24.4
Norm
aliz
ed M
achin
e E
nerg
y
CRAC Set Point (C)
Naive DVFSTempLDB
(d) NPB-MG
0
0.2
0.4
0.6
0.8
1
1.2
1.4
1.6
14.4 17.8 21.1 24.4
Norm
aliz
ed M
achin
e E
nerg
y
CRAC Set Point (C)
Naive DVFSTempLDB
(e) NPB-FT
Fig. 11. Change in machine energy consumption with and without Temperature Aware Load Balancing (negativevalues represent savings)

12
4000
8000
12000
16000
2.4
0+
2.4
0
2.2
6
2.1
3
2.0
0
1.8
6
1.7
3
1.6
0
1.4
6
1.3
3
1.2
0
Tim
e (s
)
Frequency (GHz)
Fig. 13. The time Wave2D spent in different frequencylevels
2400
2600
2800
3000
3200
3400
3600
50 100 150 200 250 300 350 400
Clu
ster
Pow
er (W
)
Time (sec)
Jacobi2DWave2DNPB-FT
Mol3DNPB-MG
Fig. 14. Total power draw for the cluster using Temp-LDB at CRAC set-point of 24.4 ◦C
our cluster. We can say that while moving to eachsuccessive lower frequency we reach a point wherethe savings in the CPU energy consumption are offsetby an increase in base energy consumption due tothe timing penalty incurred, leading to the U-shapedenergy curves. When our scheme lowers frequency asa result of core temperature crossing the maximumtemperature value, we move into the more desirablerange of machine energy consumption i.e. closer tothe minimum of the U-shape energy curves.
To see that this is the case, Figure 13 shows thecumulative time spent by all 128 cores at differentfrequency levels for Wave2D using TempLDB at aCRAC set-point of 24.4 ◦C. We can see that most of thetime is spent at frequency levels between 1.73GHz–2.0GHz, which corresponds to the lowest point fornormalized energy for Wave2D in Figure 12.
In order to study the relationship between machinepower consumption and average frequency we plot-ted the power consumption for each application overthe course of a run using TempLDB in Figure 14. Itwas surprising for us to notice that despite startingat the same level of machine power consumptionas NPB-FT and NPB-MG, Jacobi2D ended up havinga much higher average frequency (Figure 6(b)). Theother interesting observation we can make from thisgraph is the wide variation in steady state powerconsumption among the applications.
Since all the applications are settling to the sameaverage core temperature, the laws of thermodynam-
ics dictate that a CPU running at a fixed temperaturewill transfer a particular amount of heat energy perunit of time to the environment through its heatsinkand fan assembly. Thus, each application should endup having the same CPU power consumption. Thiswould mean that the difference in power draw amongthe applications in Figure 14 is caused by somethingother than CPU power consumption. Table 2 showsJacobi2D and Wave2D have many more cache missesthan Mol3D and thus end up with a higher powerconsumption in the memory controller and DRAM,which do not contribute to increased core tempera-tures but do increase the total power draw for themachine.
In order to verify our hypothesis, we ran two ofour applications, Jacobi2D and Wave2D, on a singlenode containing a 4-core Intel Core i7-2600K, with atemperature threshold of 50◦C. Using our load bal-ancing infrastructure and the newly added hardwareenergy counters in Intel’s recent Sandy Bridge tech-nology present in this chip, we can measure the chip’spower consumption directly from machine specificregisters. Both applications begin execution with theCPU at its maximum frequency, which our systemdecreases as temperatures rise. As expected, bothapplications settled near a common steady state ofpower consumption for the CPU package (cores andmemory combined). When Sandy Bridge-EP proces-sors become available, with energy counters for thememory subsystem, it should be possible to observethe separate contributions of the cores and memoryhierarchy.
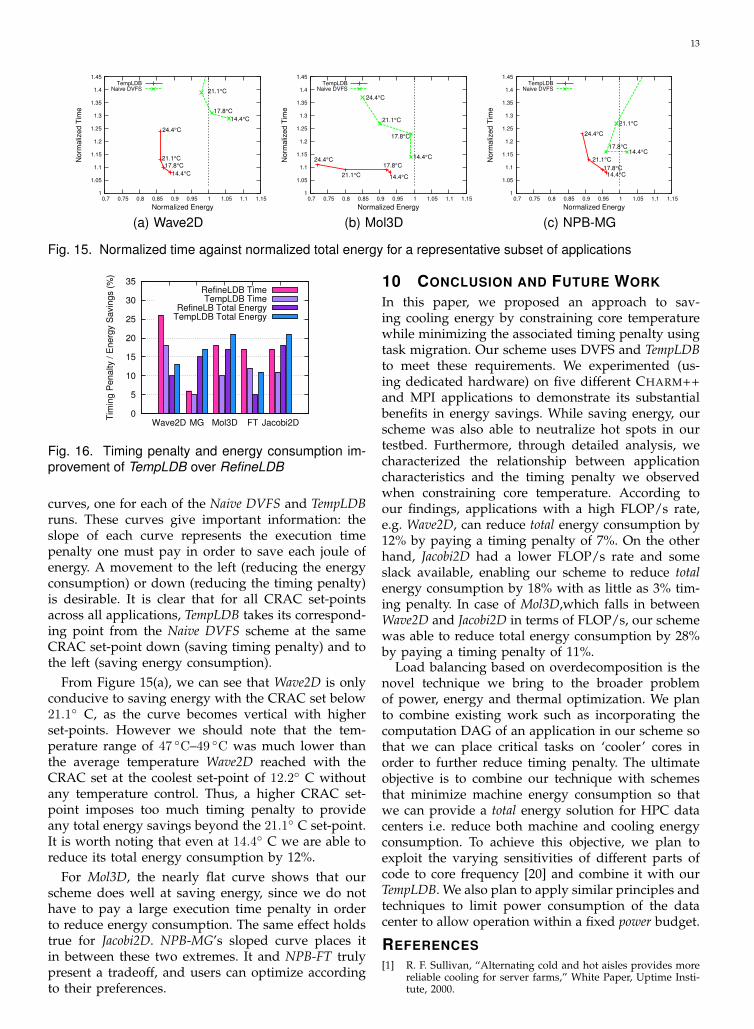
Before highlighting the key findings of our study,we compare our load balancer i.e. TempLDB, with ageneric CHARM++ load balancer i.e. RefineLDB. Re-fineLDB’s load balancing strategy relies on executiontime data for each task without taking into account thefrequency at which each core is working at. Similarto TempLDB, RefineLDB also migrates extra tasks fromthe overloaded cores to the underloaded cores. Weimplemented our temperature control scheme usingDVFS into this load balancer but kept the load bal-ancing part the same. Because RefineLDB relies onlyon task execution time data to predict future loadwithout taking into account the transitions in core fre-quencies, it ends up taking longer and consumes moreenergy to restore load balance. The improvement thatTempLDB makes can be seen from Figure 16 whichshows a comparison between both load balancers forall the applications with the CRAC set-point at 22.2◦C.
9 TRADEOFF IN EXECUTION TIME AND EN-ERGY CONSUMPTION
The essence of our results can be seen in Figure 15,which summarizes the tradeoffs between executiontime and total energy consumption for a representa-tive trio of our applications. Each application has two
13
1
1.05
1.1
1.15
1.2
1.25
1.3
1.35
1.4
1.45
0.7 0.75 0.8 0.85 0.9 0.95 1 1.05 1.1 1.15
Norm
aliz
ed T
ime
Normalized Energy
14.4°C
17.8°C
21.1°C
14.4°C
17.8°C21.1°C
24.4°C
TempLDBNaive DVFS
(a) Wave2D
1
1.05
1.1
1.15
1.2
1.25
1.3
1.35
1.4
1.45
0.7 0.75 0.8 0.85 0.9 0.95 1 1.05 1.1 1.15
Norm
aliz
ed T
ime
Normalized Energy
14.4°C
17.8°C
21.1°C
24.4°C 14.4°C
17.8°C
21.1°C
24.4°C
TempLDBNaive DVFS
(b) Mol3D
1
1.05
1.1
1.15
1.2
1.25
1.3
1.35
1.4
1.45
0.7 0.75 0.8 0.85 0.9 0.95 1 1.05 1.1 1.15
Norm
aliz
ed T
ime
Normalized Energy
14.4°C17.8°C
21.1°C
24.4°C
14.4°C17.8°C
21.1°C
TempLDBNaive DVFS
(c) NPB-MG
Fig. 15. Normalized time against normalized total energy for a representative subset of applications
0
5
10
15
20
25
30
35
Wave2D MG Mol3D FT Jacobi2DTim
ing
Pen
alty
/ E
nerg
y S
avin
gs (%
)
RefineLDB TimeTempLDB Time
RefineLB Total EnergyTempLDB Total Energy
Fig. 16. Timing penalty and energy consumption im-provement of TempLDB over RefineLDB
curves, one for each of the Naive DVFS and TempLDBruns. These curves give important information: theslope of each curve represents the execution timepenalty one must pay in order to save each joule ofenergy. A movement to the left (reducing the energyconsumption) or down (reducing the timing penalty)is desirable. It is clear that for all CRAC set-pointsacross all applications, TempLDB takes its correspond-ing point from the Naive DVFS scheme at the sameCRAC set-point down (saving timing penalty) and tothe left (saving energy consumption).
From Figure 15(a), we can see that Wave2D is onlyconducive to saving energy with the CRAC set below21.1◦ C, as the curve becomes vertical with higherset-points. However we should note that the tem-perature range of 47 ◦C–49 ◦C was much lower thanthe average temperature Wave2D reached with theCRAC set at the coolest set-point of 12.2◦ C withoutany temperature control. Thus, a higher CRAC set-point imposes too much timing penalty to provideany total energy savings beyond the 21.1◦ C set-point.It is worth noting that even at 14.4◦ C we are able toreduce its total energy consumption by 12%.
For Mol3D, the nearly flat curve shows that ourscheme does well at saving energy, since we do nothave to pay a large execution time penalty in orderto reduce energy consumption. The same effect holdstrue for Jacobi2D. NPB-MG’s sloped curve places itin between these two extremes. It and NPB-FT trulypresent a tradeoff, and users can optimize accordingto their preferences.
10 CONCLUSION AND FUTURE WORKIn this paper, we proposed an approach to sav-ing cooling energy by constraining core temperaturewhile minimizing the associated timing penalty usingtask migration. Our scheme uses DVFS and TempLDBto meet these requirements. We experimented (us-ing dedicated hardware) on five different CHARM++and MPI applications to demonstrate its substantialbenefits in energy savings. While saving energy, ourscheme was also able to neutralize hot spots in ourtestbed. Furthermore, through detailed analysis, wecharacterized the relationship between applicationcharacteristics and the timing penalty we observedwhen constraining core temperature. According toour findings, applications with a high FLOP/s rate,e.g. Wave2D, can reduce total energy consumption by12% by paying a timing penalty of 7%. On the otherhand, Jacobi2D had a lower FLOP/s rate and someslack available, enabling our scheme to reduce totalenergy consumption by 18% with as little as 3% tim-ing penalty. In case of Mol3D,which falls in betweenWave2D and Jacobi2D in terms of FLOP/s, our schemewas able to reduce total energy consumption by 28%by paying a timing penalty of 11%.
Load balancing based on overdecomposition is thenovel technique we bring to the broader problemof power, energy and thermal optimization. We planto combine existing work such as incorporating thecomputation DAG of an application in our scheme sothat we can place critical tasks on ‘cooler’ cores inorder to further reduce timing penalty. The ultimateobjective is to combine our technique with schemesthat minimize machine energy consumption so thatwe can provide a total energy solution for HPC datacenters i.e. reduce both machine and cooling energyconsumption. To achieve this objective, we plan toexploit the varying sensitivities of different parts ofcode to core frequency [20] and combine it with ourTempLDB. We also plan to apply similar principles andtechniques to limit power consumption of the datacenter to allow operation within a fixed power budget.
REFERENCES[1] R. F. Sullivan, “Alternating cold and hot aisles provides more
reliable cooling for server farms,” White Paper, Uptime Insti-tute, 2000.

14
[2] C. D. Patel, C. E. Bash, R. Sharma, M. Beitelmal, andR. Friedrich, “Smart cooling of data centers,” ASME ConferenceProceedings, vol. 2003, no. 36908b, pp. 129–137, 2003.
[3] R. Sawyer, “Calculating total power requirements for datacenters,” White Paper, American Power Conversion, 2004.
[4] O. Sarood, A. Gupta, and L. V. Kale, “Temperature aware loadbalancing for parallel applications: Preliminary work,” in TheSeventh Workshop on High-Performance, Power-Aware Computing(HPPAC’11), Anchorage, Alaska, USA, 5 2011.
[5] O. Sarood and L. V. Kale, “A ‘cool’ load balancer for parallelapplications,” in Proceedings of the 2011 ACM/IEEE conferenceon Supercomputing, Seattle, WA, November 2011.
[6] C. Bash and G. Forman, “Cool job allocation: measuring thepower savings of placing jobs at cooling-efficient locations inthe data center,” in Proceedings of the USENIX Annual TechnicalConference. Berkeley, CA, USA: USENIX Association, 2007,pp. 29:1–29:6.
[7] L. Wang, G. von Laszewski, J. Dayal, and T. Furlani, “Thermalaware workload scheduling with backfilling for green datacenters,” in Proceedings of the 2009 IEEE 28th InternationalPerformance Computing and Communications Conference (IPCCC),December 2009.
[8] L. Wang, G. von Laszewski, J. Dayal, X. He, A. Younge, andT. Furlani, “Towards thermal aware workload scheduling in adata center,” in International Symposium on Pervasive Systems,Algorithms, and Networks (ISPAN), December 2009.
[9] Q. Tang, S. Gupta, D. Stanzione, and P. Cayton, “Thermal-aware task scheduling to minimize energy usage of bladeserver based datacenters,” in 2nd IEEE International Symposiumon Dependable, Autonomic and Secure Computing, 2006.
[10] D. Rajan and P. Yu, “Temperature-aware scheduling: Whenis system-throttling good enough?” in Web-Age InformationManagement, 2008. WAIM ’08. The Ninth International Conferenceon, July 2008, pp. 397–404.
[11] H. Le, S. Li, N. Pham, J. Heo, and T. Abdelzaher, “Joint op-timization of computing and cooling energy: Analytic modeland a machine room case study,” in IEEE International Confer-ence on Distributed Computing Systems (ICDCS) (to appear), June2012.
[12] B. Rountree, D. K. Lowenthal, S. Funk, V. W. Freeh, B. R.de Supinski, and M. Schulz, “Bounding energy consumptionin large-scale MPI programs,” in Proceedings of the ACM/IEEEconference on Supercomputing, 2007, pp. 49:1–49:9.
[13] M. Y. Lim, V. W. Freeh, and D. K. Lowenthal, “Adaptive,transparent CPU scaling algorithms leveraging inter-node MPIcommunication regions,” Parallel Computing, vol. 37, no. 10-11,pp. 667–683, 2011.
[14] R. Springer, D. K. Lowenthal, B. Rountree, and V. W. Freeh,“Minimizing execution time in MPI programs on an energy-constrained, power-scalable cluster,” in Proceedings of theeleventh ACM SIGPLAN symposium on Principles and practiceof parallel programming, ser. PPoPP ’06. New York, NY, USA:ACM, 2006, pp. 230–238.
[15] S. Huang and W. Feng, “Energy-efficient cluster computing viaaccurate workload characterization,” in Proceedings of the 20099th IEEE/ACM International Symposium on Cluster Computingand the Grid, ser. CCGRID ’09. Washington, DC, USA: IEEEComputer Society, 2009, pp. 68–75.
[16] H. Hanson, S. Keckler, R. K, S. Ghiasi, F. Rawson, andJ. Rubio, “Power, performance, and thermal management forhigh-performance systems,” in IEEE International Parallel andDistributed Processing Symposium (IPDPS), March 2007.
[17] A. Banerjee, T. Mukherjee, G. Varsamopoulos, and S. Gupta,“Cooling-aware and thermal-aware workload placement forgreen HPC data centers,” in 2010 International Green ComputingConference, August 2010, pp. 245–256.
[18] Q. Tang, S. Gupta, and G. Varsamopoulos, “Energy-efficientthermal-aware task scheduling for homogeneous high-performance computing data centers: A cyber-physical ap-proach,” IEEE Transactions on Parallel and Distributed Systems,no. 11, pp. 1458–1472, November 2008.
[19] A. Merkel and F. Bellosa, “Balancing power consumptionin multiprocessor systems,” in Proceedings of the 1st ACMSIGOPS/EuroSys European Conference on Computer Systems, ser.EuroSys ’06. New York, NY, USA: ACM, 2006, pp. 403–414.
[20] V. W. Freeh and D. K. Lowenthal, “Using multiple energygears in MPI programs on a power-scalable cluster,” in
Proceedings of the tenth ACM SIGPLAN symposium on Principlesand practice of parallel programming, ser. PPoPP ’05. NewYork, NY, USA: ACM, 2005, pp. 164–173. [Online]. Available:http://doi.acm.org/10.1145/1065944.1065967
[21] L. Kale and S. Krishnan, “CHARM++: A Portable ConcurrentObject Oriented System Based on C++,” in Proceedings ofOOPSLA’93, A. Paepcke, Ed. ACM Press, September 1993.
[22] R. K. Brunner and L. V. Kale, “Handling application-inducedload imbalance using parallel objects,” in Parallel and Dis-tributed Computing for Symbolic and Irregular Applications.World Scientific Publishing, 2000, pp. 167–181.
[23] P. Jetley, F. Gioachin, C. Mendes, L. V. Kale, and T. R. Quinn,“Massively parallel cosmological simulations with ChaNGa,”in Proceedings of IEEE International Parallel and DistributedProcessing Symposium 2008, 2008.
[24] G. Zheng, A. Bhatele, E. Meneses, and L. V. Kale, “PeriodicHierarchical Load Balancing for Large Supercomputers,” In-ternational Journal of High Performance Computing Applications(IJHPCA), March 2011.
[25] “Intel turbo boost technology,”http://www.intel.com/technology/turboboost/.
[26] D. B. E. B. J. Barton, D. Browning, R. Carter, L. Dagum, R. Fa-toohi, S. Fineberg, P. Frederickson, T. Lasinski, R. Schreiber,H. Simon, V. Venkatakrishnan, and S. Weeratunga, “The NASparallel benchmarks,” NASA Ames Research Center, Tech.Rep. RNR-04-077, 1994.
[27] R. Kufrin, “Perfsuite: An accessible, open source performanceanalysis environment for linux,” in In Proc. of the Linux ClusterConference, Chapel, 2005.
Osman Sarood received his B.S. in Com-puter Science from Lahore University of Man-agement Sciences in 2004. He is cuurently aPh.D. candidate in Computer Science at theUniversity of Illinois at Urbana-Champaign,supported by a fellowship from the FulbrightProgram. His research areas include parallelprogramming and energy efficiency for HPCdata centers.
Phil Miller received his B.S. in ComputerScience from Harvey Mudd College in 2008.He is currently a Ph.D. candidate in Com-puter Science at the University of Illinois atUrbana-Champaign. He is supported by NSFgrant OCI-0725070.
Ehsan Totoni received the B.S. degree inComputer Engineering from Sharif Univer-sity of Technology. He received an MS de-gree from University of Illinois at Urbana-Champaign and is pursuing his PhD. His re-search areas include parallel programming,simulation and performance analysis, scien-tific computing and energy efficiency. He issupported by DOE grant DE-SC006706.
Laxmikant Kale received his BTech de-gree in electronics engineering from BenaresHindu University, India, in 1977, and a MEdegree in computer science from Indian Insti-tute of Science in Bangalore, India, in 1979.He received his PhD in computer sciencefrom State University of New York, StonyBrook, in 1985. He joined the faculty of theUniversity of Illinois at Urbana-Champaign asan Assistant Professor in 1985, where he iscurrently employed as a full Professor. His
research spans parallel computing, including parallel programmingabstractions, scalability, automatic load balancing, communicationoptimizations, and fault tolerance. He has collaboratively developedseveral scalable CSE applications.