active learning environments - sedl up to 25 teachers, grades k-12 time needed 3 hours: 30 minutes...
TRANSCRIPT

Active LearningwithTechnology
Active LearningwithTechnology
1
ActiveLearningEnvironments
ActiveLearningEnvironments

Southwest Educational Development Laboratory211 East Seventh Street •Austin, Texas 78701-3281
Voice: 512/476-6861 • Fax: 512/476-2286 • www.sedl.org
Contributors:
Mary Burns, Marilyn Heath, Jim Zuhn, Sharon Adams, Jackie Burniske, and K. Victoria Dimock
Copyediting, interior design and production by Fasttrack Publication GraphicsAustin, Texas * 512/441-4606
Cover design and production by Postmarks DesignAustin, Texas * 512/246-0762
Copyright, 2000. Southwest Educational Development Laboratory.
This publication was produced in whole or in part with funds from the Office ofEducational Research and Improvement, U.S. Department of Education, under contract#RJ96006801. The content herein does not necessarily reflect the views of the Departmentof Education, any other agency of the U.S. Government, or any other source. SEDL is anEqual Employment Opportunity/Affirmative Action Employer and is committed to affordingequal employment opportunities to all individuals in all employment matters. Available inalternate formats.
Titles or names of specific software discussed or described in this document are registeredtrademarks, trademarks, or copyrighted as property of the companies that produce thesoftware.
Please note that the World Wide Web is volatile and constantly changing. The URLs provided in the following references were accurate as of the date of this report, but wecan make no guarantees for their permanence.
You are welcome to reproduce the Active Learning with Technology modules and may distribute copies at no cost to recipients; please credit the Southwest EducationalDevelopment Laboratory as publisher.

To the Facilitator . . . . . . . . . . . . . . . . . . . . . . . . . . . . . . . . . . . . . . . . . . . iv
Overview . . . . . . . . . . . . . . . . . . . . . . . . . . . . . . . . . . . . . . . . . . . . . . . . . 1
Module Organizer . . . . . . . . . . . . . . . . . . . . . . . . . . . . . . . . . . . . . . . . . . 3
Activity Sequence . . . . . . . . . . . . . . . . . . . . . . . . . . . . . . . . . . . . . . . . . . 6
Facilitator Materials and Participant Handouts . . . . . . . . . . . . . . . . . 11
Table of Contents
© Southwest Educational Development Laboratory Foundations 1: Active Learning Environmentsiii

© Southwest Educational Development Laboratory Foundations 1: Active Learning Environmentsiv
This professional development module is a guide designed for a facilitator who comes to the module withno prior knowledge of its implementation; however, it is assumed that the facilitator has some expertise inproviding professional development and in the use of technology in a classroom setting. The role of thefacilitator throughout the modules is that of a guide, not necessarily a technology expert. This guideincludes the following sections and items:
• The Overview of the module provides the purpose, the participant outcomes, a brief module description, the constructivist principles represented in the module, and the instructional strategies and technology used in the module.
• The Module Organizer provides the specifics of the module such as the time and facility needed, the participant prerequisites, a general activity description, the grouping strategy, the equipment and material requirements, and other details for facilitator preparation.
• The Activity Sequence is the step-by–step guide for implementing the module. The Activity Sequence includes scripted segments in italics, which suggest possible dialogue for the beginning facilitator. It is anticipated that every individual using these modules will adapt this dialogue for his or her own use. While some modules refer to specific software, facilitators may need to adapt the activity to fit software available at the site. The facilitator should examine the Activity Sequence,handouts and software together to get a clear understanding of the module’s instructional intent.
• The Facilitator Materials and Participant Handouts section provides a template of the transparencies and handouts used in the module.
The legend below includes the visual cues used to remind the facilitator of the estimated time needed andwhen to perform various tasks throughout the module. The Activity Sequence of each module highlightsthe specific tasks required in that module.
Symbols used throughout the Activity Sequence:
To the Facilitator
Estimated time Use a Distribute a Record Software demo Watchto complete projector handout participants’ or resource a video
activities comments
�
�
�� ��✷✷ �

© Southwest Educational Development Laboratory Foundations 1: Active Learning Environments1
Purpose• Model a learning environment in which the
teacher is a facilitator, and participants areengaged as learners in self-directed, collaborativeactivities.
• Engage participants in a hands-on learning environment in which several integrated activities,some supplemented with technology, are offeredsimultaneously.
• Stimulate planning for how participants can create such environments in their classrooms.
• Gather information about the local communitythat can be used in a subsequent electronic presentation.
Participant outcomes• Experience the elements of an interdisciplinary,
collaborative, technology-assisted learning environment.
• Learn more about their community.
• Reflect upon how they can adapt this instructionalstrategy to their own classroom.
Module descriptionActive Learning Environments is the first in a seriesof professional development modules. Although it isdesigned to be an introductory activity followed byother modules, it can be successfully presented byitself. This module suggests one way to use a limitednumber of computers as part of a meaningful andactive learning experience.
To begin, the facilitator proposes a real-life situationto the group. After a brainstorming session, small
groups of participants visit 3 different learning stations, spending 30 minutes in each, gatheringinformation and planning exhibits for a proposedcommunity museum. Their assignment requires theuse of a variety of resources that they find or create.Each of the learning stations represents a differentinstructional concept.
Upon completing visits to all learning stations, par-ticipants remain at the last station to reflect on thesession’s activities and determine how this instruc-tional model might be used in their classrooms.
Learning station topics
Learning Station 1:Community Walkthrough
What does our community look like?
Groups use a digital camera to take pictures in theircommunity.
Overview

Learning Station 2:Community Culture and History
How did our community come to be?
Print resources and participants’ prior knowledgeare used for exploration into the history and cultureof the community. Use of a computer with accessto community resources on the Internet is optional.
Learning Station 3:Community Profile
Who are we?
Participants use a computer to retrieve communitycensus data from the Internet. They use those datato construct an electronic spreadsheet and chartwhich reflect the community’s population profile. (If an Internet connection is not available, printoutscan be produced in advance and included in theinformation folder for this learning station.)
Constructivist principles represented in this moduleLearners bring unique prior knowledge, experience, and beliefs to a learning situation.
Throughout the activity, participants constructknowledge about an area that holds real meaningand familiarity—their community.
Knowledge is constructed in multiple ways,through a variety of authentic tools, resources,experiences, and contexts.
Participants create schemata for 3 very distinctmuseum exhibits—a visual display, a statisticalexhibit, and a text-based presentation. Each is con-textually based (the community museum), is con-structed with authentic tools and resources, anddraws upon the participants’ own experiences ascommunity members.
Social interaction introduces multiple perspec-tives through reflection, collaboration, negotia-tion, and shared meaning.
Working in groups, participants collaborate andnegotiate the development of their exhibits andshare their reflections.
Learning is both an active and a reflectiveprocess.
Participants do the activities and discuss and reflectupon the activities both as learners and as teach-ers.
Instructional strategies used in this model• Whole group, facilitator-led discussion
• Collaborative, small group exploration of aninterdisciplinary theme
• Specific roles for group members
• Minimal direct instruction for group membersrotating through a series of learning stations
Technology used in this module• Computer with Internet access and spreadsheet
software
• Digital camera
© Southwest Educational Development Laboratory Foundations 1: Active Learning Environments2

ParticipantsUp to 25 teachers, grades K-12
Time needed3 hours: 30 minutes for activity introduction, 105minutes for the body of the activity, and 45 minutesfor reflection and whole-group discussion.
FacilitiesA room that allows participants to move easilyfrom the whole group discussion to small workgroups at separate learning stations. Few computersare needed, and a computer laboratory setting isnot recommended. A classroom or library with atleast 2 computers works well.
Prerequisites
Computer skills
• Keyboarding skills: typing a URL, entering data,executing commands
• File operations: opening and closing an applica-tion, saving to a diskette, and printing a file
General activity descriptionIn a whole group, the facilitator sets up the situation and explains the procedure for the learn-ing stations.
In small groups, participants rotate through threelearning stations as learners, and they reflect uponand discuss the instructional implications of thelearning station activities.
In a whole group, participants share the highlightsof the small group discussion.
Grouping strategyIf possible, assign participants to the small groupsbefore the professional development day. The facili-tator may select any method deemed appropriate,based on grade level, teaching specialty, or computerskills. As noted earlier, it is helpful to group thosewith low and moderate computer skills rather thanmatch low-skilled participants with highly experi-enced computer users.
Assign each group a color and mark each partici-pant’s name tag with the same color. Colored dotsare a simple way to code the name tags. This codingis very helpful in the organization of the day.
Twelve to sixteen participants can be assigned toeach large group that rotates through each of the 3 stations ( i.e. 3-4 persons at each station). If youhave 24 participants, you will need to divide theminto 2 large groups ( i.e. 2 sets of the 3 stations,with 3-4 at each station).
EquipmentThis module is spread out across 6 learning stations(see “Grouping Strategy” to accommodate partici-pants). Refer to the Materials and Handouts sectionof this module for the individual requirements foreach station.
1. Community Walkthrough: 2 digital cameras. ASony Mavica camera was used for this activity.It is a popular camera because it is easy to useand requires minimal technological skills toretrieve the images from the camera. Any
© Southwest Educational Development Laboratory Foundations 1: Active Learning Environments3
Module Organizer

© Southwest Educational Development Laboratory Foundations 1: Active Learning Environments4
digital camera may be used. The facilitatorshould become familiar with the operation ofthe camera and the process for retrieving imagesfrom the camera.
2. Community Culture and History: You can sup-plement this station with 2 computer stationswith Internet connections and links to local websites. This is optional, as the station will have avariety of print resources available.
3. Community Profile: 2 computers with Internetconnections and spreadsheet software such asMicrosoft Excel
4. A projection device such as an LCD projector ora computer-video adapter
Materials
Facilitator
Chart paper, easel, and markers for recording wholegroup discussion
Each learning station
1. 1 colored folder for keeping all of the materials and instructions for that station
2. A table tent, station instructions, and group rolecards for each station. Templates are included inthe Materials and Handouts section.
3. Additional handouts for individual learning stations. Templates are included in the Materialsand Handouts section.
Each group of participants
1. 1–2 blank, 3 1/2-in. diskettes for data and digitalcamera images
2. 1 notepad and pencil
Each participant
1. Handout 1: Brainstorming Chart
2. Handout 2: Summary/Reflection Activity
Facilitator preparation1. Community Walkthrough: The facilitator should
become familiar with the digital camera that isto be used. The day before professional devel-opment session, make sure the camera’s batteryis charged.
2. Community Culture and History: Research andgather local resources from such sources as theChamber of Commerce, local library, newspaper,museums, or history center. Local resources mayinclude brochures, booklets, flyers, and otherpromotional materials about the community.There should be enough copies so that eachCulture and History table has a copy of every-thing. If possible, ask the participants to bringresources containing information about theircommunity. If using the Internet, it is useful tocreate a web page that links to a variety of community resources.
3. Community Profile: Create an electronic spread-sheet file using Handout 3: Census DataRecording Worksheet as a template. Becomefamiliar with the U.S. Bureau of the Census website on the Internet, <http://www.census.gov>.Print a paper copy of U.S. Census web site pagethat pertains to your community—name of com-munity, two letter state code, STF3A link, TableP8—in case the live Internet connection is notavailable on the professional development day.See Instructions: Gathering Data from the U.S.Census Bureau for details. Review Instructions:Creating an Excel Spreadsheet for entering census data.
4. Make copies of learning station handouts andindividual handouts, depending upon the activity.Select one color for each learning station. Makethe folder, the table tent, and the directions allthe same color for easy management. Grouprole cards should be color-coordinated accord-ing to role; for example, make all facilitator rolecards the same color. For durability, photocopythe group role cards and table tents on cardstock if available.

© Southwest Educational Development Laboratory Foundations 1: Active Learning Environments5
5. Pre-assign participants to their groups (seeGrouping Strategy).
6. Coordinate dots on nametags with learning station colors. For example, use a different colorfor each of the stations such as red, green, and blue. Participants with red dots on theirnametag will start at the red station, green dotsstart at the green station, and blue dots start atthe blue station. For 1 large group of 12-16,assign single dots and for the second largegroup of 12-16, assign double dots.
Room preparation1. Use 1 table or a group of desks for each learning
station. Place the instructions, handouts, andgroup role cards that accompany each learningstation in a folder at the station. Arrange 1 tabletent on each table. Your color-coordinated folders will help to keep the materials organized.
2. Community Walkthrough: Prepare digital cam-eras by recharging the batteries and taking atest picture. Be sure there is a blank disketteavailable for each group.
3. Community Culture and History: If you areusing a computer at this station, open the file or browser page with local resources.
4. Community Profile: Check on Internet connec-tion. Open the browser to U.S. Census homepage <http://www.census.gov>. If you are notusing the Internet, make printouts from the U.S.Census Bureau web site of your community.Verify the spreadsheet software and add yourcensus recording data file.
5. Prepare a resource table that contains additionallocal resources (books, pamphlets) and writingsupplies (rulers, colored pencils, paper).
Follow-up activities1. The Foundations 2: Draw Learning module has
a whole group discussion that asks participantsto reflect upon their learning during theFoundations 1: Active Learning Environmentsmodule.
2. The Foundations 4: Creating ElectronicPresentations module serves as a summaryactivity. Participants create an electronic presen-tation using information from this module.
3. Module 7: Getting the Word Out provides anactivity for creating a newsletter or flyer aboutthe community.
4. Module 14: Managing Growth and Module 15:Connections are 2 other modules that have acommunity theme.

I. Introduction 10 minutes
Participants sit together in a whole group for thediscussion. The facilitator introduces Active LearningEnvironments with a series of questions:
Have you ever thought about what makes yourcommunity special? What can citizens of this com-munity be proud of? What does your community have to offer others?
The facilitator allows participants time to think a few minutes and to offer someresponses. Facilitator records participants’
comments on chart paper. If necessary, the facilitatorcan prompt ideas by asking for examples from history, commerce, recreation, or other areas.
The facilitator then develops the scenario:
Economic development is a high priority for anycommunity because it is important to preserveour community as an economically viable placeto live. The city council has proposed the idea of creating a community museum that willshowcase the attributes of our community. Themuseum is envisioned as a tourist draw that willbe the first step in attracting new businesses tothe area.
Because of your familiarity with and contribu-tions to the community, the city council has chosen you to create an overview of possiblethemes for this museum. What would you say or show about your community?
Our goal this morning is to gather ideas andmake plans for exhibits for a thematic presentationabout your community. You will use a variety ofresources from three different activity stations,some with technology, some without for gatheringyour data.
When we finish rotating through the stationsand gathering data, we will share ideas andthink about how you might recreate these activities in your classrooms.
In a subsequent module, you will use these dataand materials to create an electronic presenta-tion that will be viewed by the city council for itsmuseum planning.
The facilitator leads a brief brainstormingactivity before the learning stations work
begins. Handout 1: Brainstorming Chart is usedto guide this discussion.
Before we separate into our small groups, let’s dis-cuss what makes our community unique. What
© Southwest Educational Development Laboratory Foundations 1: Active Learning Environments6
Symbols Used in Sequence
Estimated time Distribute a Record to complete handout participants’
activities comments
�
�
�
�
�� ��
��
��
Activity Sequence

© Southwest Educational Development Laboratory Foundations 1: Active Learning Environments7
would you like tell others about your community?I’m new to this community—what should I knowabout it? What would you like to show me?
This chart has options for listing historic buildings,people, geography, and so on. Could you give mean example of a few of these options?
The participants will respond with several sugges-tions from their town. While the participants willprobably find it easy to identify local landmarks,they may not quickly generate a project theme. Thefacilitator might provide such examples as “The Oldand the New” or “Culture in Our Lives” which arethemes used by other teachers who have workedon this activity.
As you work at your table and later in your group,try to think of what you want to focus on as a wayof viewing your community. Can you think of atheme that might describe your community?
The above explanation provides a real-world frame-work to guide participants as they gather informa-tion about their community.
II. Set up the activity 20 minutes
The facilitator focuses the participants’ attention ontheir name tag codes which assign each participantto a small group for the morning’s session. Thefacilitator then explains the 3 learning stations andthe activities related to each. Although there are 6 stations in the room, each set of 3 represents 1“classroom.” This enables everyone to work insmaller groups. During the explanation, it helps to point to the stations as you describe them, andshow the materials on the tables. The GroupRotation Charts in the Materials and Handouts section of this module can be used to explain eachgroup’s location during the activity.
The following items should be included and consid-ered in the facilitator explanation.
• Station 1, Community Walkthrough, asks the question “What does our community look like?”Participants use a digital camera to photographsomething that they think represents their com-munity. Depending on the local situation, partici-pants may need to stay near the building, or theymay be able to go to a particular site to take pictures. Emphasize the 30-minute time limit forthis station. Some participants may want to takepictures of sites far away from the session. If acamera is available, this could be done duringlunch or after the session. If more than two cam-eras are available, stations one and two could becombined.
• Station 2, Community Culture and History, asks a series of questions: “How did this communitycome to be the way it is today? What was theorigin of the people who live here today? Whydid they come here? How have they influencedour community, and what contributions havethey made? What could you say about our com-munity in terms of its history and culture thatmakes it unique and important?” Participantsshare their knowledge of the community and canuse the print resources provided to describe theirregion’s history and culture. They may also use acomputer at this station to access a variety ofweb sites for information. Computer use isoptional for this station.
• Station 3, Community Profile, asks the questions“Who are the people who live in this community. . . and how many are there? What is their ethnicity? What are their ages? What other infor-mation can we find that tells more about thepeople who live in our community? How havethese data changed over the years? Have thesechanges been important? How have the changesaffected our community?” Participants use a freegovernment data resource, the U.S. CensusBureau, to obtain demographic information abouttheir community from either the Internet or print-outs of Census Bureau information prepared inadvance. Participants are asked to record their
��

© Southwest Educational Development Laboratory Foundations 1: Active Learning Environments8
data on an Excel spreadsheet and then displaythe data in different ways such as a chart ortable.
Each group has 30 minutes to work in each stationand 5 minutes to move to the next station. Grouproles are suggested for working through the learn-ing station activities. The facilitator explains:
At your first station, please distribute the group rolecards. I’d like each member to read your instruc-tions aloud and follow them. The roles are similarto the roles your students may use if they work incooperative groups. Some things to remember:
• Switch roles as you rotate stations. The rolesare slightly different at each station.
• If you are using a computer, take turns withthe keyboard and mouse.
• Keep track of the time, but I will also informyou when to rotate.
If the participants haven’t interrupted with ques-tions, the facilitator can use this time to ask if any-one has questions. It is important to make sure theyunderstand the logistics of the learning stationsbefore continuing.
Have the participants go to their first learning sta-tion based on the color dot on their name tags.
III. Rotation through 105 minuteslearning stations
(30 minutes at each station + 5 minutes for movingto the next station)
As groups rotate among the learning stations, thefacilitator should move about the groups to offerassistance as needed. Each of the learning stationsis designed to be self-explanatory. Though somespecific instruction and coaching may be necessary,the facilitator should let the groups work throughthe station tasks on their own, if possible, solvingas many of the questions and problems as they are able.
IV. Summary/ 45 minutesReflection activity
At the end of the 3 rotations, participants remain attheir last station for this activity.
Distribute Handout 2:Summary/Reflection Activity.
Distribute chart paper and markers to each group
The facilitator introduces this activity using thehandout as a guide.
You were in the role of learner as you rotatedthrough these stations. Let’s take a few moments tochange roles and reflect upon how you could usethe learning station structure in your classroom.Now, you will reflect as a teacher—and talk withyour small group about the reflection questions onthe handout entitled: Summary/Reflection Activity.Please record your responses on chart paper, andbe prepared to share some of your reflection withthe whole group.
Small group discussion: Allow participants 20minutes to respond to the questions in the handoutand write their responses. Walk around and listento participants as they converse. Offer your insightswhere appropriate. Some groups may not finish allof the questions, and some groups may become soengrossed in the discussions that they forget towrite anything down. The reflection questions aremeant to provide the participants an opportunity forreflection on the activity they have just completed.The facilitator should encourage group members tonote key points on their chart paper so they canshare with others.
Whole group: A representative from each smallgroup posts the chart paper on the wall and theentire group reconvenes for a concluding summarydiscussion. Approximately 25 minutes are allottedfor this discussion which should be framed aroundthe questions posed to the small groups in Handout2. The facilitator can work off the ideas posted onthe chart paper to lead the discussion. The facilitator
��
��
�
�

© Southwest Educational Development Laboratory Foundations 1: Active Learning Environments9
may encourage the various groups to share com-ments heard during the walk-around.
Samples of responses from previous sessions:
QUESTION 1
How would you use this activity in your classroomwith your students? What would you change foryour students and your classroom? How would youextend this activity to other curricular areas or as a unit?
Community Profile: Based on introduction to U.S.Census, have students develop their own classroomcensus, doing individual charts, then collaboratingfor class chart. The data gathered could be: haircolor, height, ethnic background, gender, eye color,age, handedness (left/right) family membership, language dominance
Other activities to use with a spreadsheet:
Language arts: Keep a family log for a family biography
Science: Make predictions based on data.
Math: Cost analysis, weather analysis, rain analysis
QUESTION 2
What particular station has the most value or appealfor you and your classroom? Why?
One group replied, “The camera, because it’s a veryconcrete activity for small children.”
QUESTION 3
Reflect on the “whole session.” That is, using a com-puter station in an interdisciplinary, collaborativeenvironment with multiple activities taking place atthe same time.
One group suggested, “We would use the same format, except the activity with the camera wouldbe with the whole class.”
Follow-up activityIf Foundations 1: Active Learning Environments isto be followed by Foundations 4: Creating ElectronicPresentations, remind participants to keep thediskettes and information they gathered. They mayalso want to gather additional information from out-side resources.

© Southwest Educational Development Laboratory Foundations 1: Active Learning Environments11
Facilitator materials
Group Rotation Chart
Participant handout templates
Handout 1: Brainstorming Chart (1 per person)
Handout 2: Summary/Reflection Activity (1 per person)
Learning station materials and templates
Learning Station 1: Community Walkthrough
• Table tent • Group roles sheet; Group role cards
• Instruction sheet • Group rotation chart
Other materials:
• 1 diskette per group for camera • A notepad and pencil
Learning Station 2: Community Culture and History
• Table tent • Group rotation chart
• Instruction sheet • 6-8 extra: Handout 1: Brainstorming Activity
• Group roles sheet; Group role cards
Other materials:
• Local resources gathered by facilitators • Printouts of community WWW resources
Learning Station 3: Community Profile
• Table tent • 6-8 extra: Census Data Recording sheet
• Instruction sheet • Instructions: Gathering Data from the U.S.
• Group roles sheet; Group role cards Census Bureau
• Group rotation chart • Instructions: Creating an Excel Spreadsheet
Other materials:
• Diskette for saving files • Hard copies of form P8 of local community
Facilitator Materials and Participant Handouts

© Southwest Educational Development Laboratory Foundations 1: Active Learning Environments12
Community WalkthroughDouble Green Dot
Community WalkthroughSingle Green Dot
Culture and History Single Red Dot
Culture and History Double Red Dot
Community ProfileSingle Blue Dot
Community ProfileDouble Blue Dot
Name Tag Codes Learning Station
Starting positions and first 30 minutes
Single Green Dot Community Walkthrough I
Double Green Dot Community Walkthrough II
Single Red Dot Culture and History I
Double Red Dot Culture and History II
Single Blue Dot Community Profile I
Double Blue Dot Community Profile II
The following 30 minute rotations move according to the diagram above:
• Green goes to Red then to Blue
• Red goes to Blue then to Green
• Blue goes to Green then to Red
Group Rotation Chart

© Southwest Educational Development Laboratory Foundations 1: Active Learning Environments1313
HA N D O UT 1
Brainstorming Chart
Use this chart to record features about your community. Describe a feature, some history, its importance,and its contribution to the community.
ArchitectureSchools, historic buildings, churches, homes, landmarks
GeographyMountains, deserts, rivers, lakes, prairies, forests
Businesses Privately owned, publicly owned
Public placesParks, libraries, museums, hospitals, points of interest
PeopleHistoric figures, local celebrities, influential people, family members
Cultural influencesFood, dance, music, traditions, stories

© Southwest Educational Development Laboratory Foundations 1: Active Learning Environments14
HA N D O UT 2
Summary/Reflection Activity
Read and discuss the following questions. Record your group’s responses on chart paper. List the names ofall group members on the chart paper.
1. Name your current station. Consider your current station in terms of the technology, the content, andthe nature of the activity.
A. How would you use this learning station in your classroom with your students?
B. What would you change for your students and your classroom?
C. How would you extend this activity to other curricular areas or as a unit?
2. What particular station has the most value or appeal for you and your classroom? Why?
3. Reflect on the “whole session” that is, using a computer station in an interdisciplinary, collaborativeenvironment with multiple activities taking place at the same time.
A. How can you use this in your classroom?
B. What were some of the strengths?
C. What were some of the weaknesses?

© Southwest Educational Development Laboratory Foundations 1: Active Learning Environments15
CommunityWalkthroughCommunity
Walkthrough
STAT I O N 1 (PAGE 1 OF 4)

© Southwest Educational Development Laboratory Foundations 1: Active Learning Environments16
Community Walkthrough
What Does Our Community Look Like?
Instructions
Objectives
Participants will photograph natural and manmade features of the community. These photographs can be used in a presentation.
Materials
1. Digital camera
2. Notepad, pencil
3. Blank diskette
Overview
What does your community look like? What is physically unique about it? The answers can be seen in many places—in its architecture, landscaping, streets, or people. The photos you take can contribute toyour presentation.
Directions
1. Distribute group roles.
2. The group will take a walk into the community.
3. Using the digital camera, group members photograph anything they think is distinctive, attractive, or interesting about the community, or anything that provides clues to its history or culture.
4. The group may take as many photos as they wish, but group members should be prepared to select the best 3.
5. Keep a record of each picture.
6. Switch roles so that each group member has a chance to use the digital camera.
7. Return to home base in 25 minutes so the next group has the full time to use the camera.
STAT I O N 1 (PAGE 2 OF 4)

Community Walkthrough
What Does Our Community Look Like?
Group Roles
Facilitator
1. Read directions aloud to the group.
2. Encourage all group members to participate.
3. Encourage all members to remain on the topic.
Timekeeper
1. Note the time that the group begins the activity and what time they should end.
2. Check the time periodically and inform the group.
3. Ensure that the group returns to the next learning station on time.
Recorder
1. Record all information for each photograph on your notepad:
• Name or item
• Location
• Photographer
• Time & date
Photographer
1. Learn how to use digital camera.
2. Instruct your team members on how to use the camera.
3. Each participant should take a turn taking photos.
4. Take photos.
© Southwest Educational Development Laboratory Foundations 1: Active Learning Environments17
STAT I O N 1 (PAGE 3 OF 4)

Community Walkthrough
What Does Our Community Look Like?
Role Cards
(cut into 4 separate cards after duplication)
© Southwest Educational Development Laboratory Foundations 1: Active Learning Environments18
Photographer• Learn how to use digital camera.
• Instruct your team members on how touse the camera.
• Each participant should take a turn tak-ing photos.
• Take photos.
Facilitator• Read directions aloud to the group.
• Encourage all group members to partici-pate.
• Encourage all group members to remainon the topic.
Timekeeper• Note the time that the group begins the
activity and what time they should end.
• Check time periodically and inform thegroup.
• Ensure that the group returns to the nextlearning station on time.
RecorderRecord all information for each photographin your note pad:
• name of item
• location
• photographer
• time and date
STAT I O N 1 (PAGE 4 OF 4)

© Southwest Educational Development Laboratory Foundations 1: Active Learning Environments19
Culture and History
Cultureand History
STAT I O N 2 (PAGE 1 OF 4)

Community Culture and History
How Did Our Community Come to Be?
Instructions
Objectives
Using available resources and the knowledge of the group members, participants will gather informationabout the culture and history of the community to develop ideas for their presentation.
Materials
1. Refer to the local print resources at the learning station and additional print resources at the resourcetable
2. Printouts of selected community and WWW resources
3. Brainstorming Chart
Overview
How did this community come to be the way it is today? What was the origin of the people who live heretoday? Why did they come here? How have they influenced our community, and what contributions havethey made? What could you say about our community in terms of its history and culture that makes itunique and important?
Directions
1. Distribute group roles.
2. Share knowledge and ideas about your community with your group. Discuss the question, “How didour community come to be?”
3. Browse through and read available print and/or Internet resources. Where could you go to get addition-al resources?
4. Discuss and take notes on information and ideas that you think you could use as a theme for your pre-sentation. You may want to use the Brainstorming Chart to organize your ideas.
© Southwest Educational Development Laboratory Foundations 1: Active Learning Environments20
STAT I O N 2 (PAGE 2 OF 4)

Community Culture and History
How Did Our Community Come to Be?
Group Roles
Facilitator
1. Read directions aloud to the group.
2. Encourage all group members to participate.
3. Encourage all members to remain on the topic.
Timekeeper
1. Note the starting and ending times.
2. Check time periodically and inform the group.
3. Alert the group 5 minutes before the end of the activity.
Recorder
1. Take notes on information and ideas that you think you could use as a theme for your presentation.
2. Use the Brainstorming Chart to help organize your ideas.
3. Coordinate ideas for your presentation.
4. Record the names of all the group members on any group products.
Materials manager
1. Review items on the resource table, and inform your group.
2. Gather materials as needed.
3. Return materials to the resource table, and organize the learning station neatly in preparation for thenext group.
© Southwest Educational Development Laboratory Foundations 1: Active Learning Environments21
STAT I O N 2 (PAGE 3 OF 4)

© Southwest Educational Development Laboratory Foundations 1: Active Learning Environments22
Community Culture and History
How Did Our Community Come to Be?
Role Cards
(cut into 4 separate cards after duplication)
Materials Manager• Review items on the resource table, and
inform your group.
• Gather materials as needed.
• Return materials to the resource table,and organize the learning station neatlyin preparation for the next group.
Facilitator• Read directions aloud to the group.
• Encourage all group members to partici-pate.
• Encourage all group members to remainon the topic.
Timekeeper• Note the starting and ending times.
• Check the time periodically and informthe group.
• Alert the group 5 minutes before theend of the activity.
Recorder• Take notes on information and ideas
that you think you could use as a themefor your presentation.
• Use the Brainstorming Chart to helporganize your ideas.
• Coordinate ideas for your presentation.
• Record the names of all the group mem-bers on any group products.
STAT I O N 2 (PAGE 4 OF 4)

© Southwest Educational Development Laboratory Foundations 1: Active Learning Environments23
CommunityProfile
CommunityProfile
STAT I O N 3 (PAGE 1 OF 5)

Community Profile
Who Are We?
Instructions
Objectives
• Gather and use population data from the U.S. Census web site to showcase the diversity of your community’s residents.
• Learn to search the U.S. Census Bureau in several ways
• Create a simple Excel spreadsheet and display it in a graph.
Materials
1. Computer station open to the Internet site <http.://www.census.gov>.
2. A blank Excel worksheet file on the computer desktop screen. Ask the facilitator if you cannot locate it.
3. Census Data Recording Worksheet
4. Instructions: Gathering Data from the U.S. Census Bureau
5. Instructions: Creating an Excel Spreadsheet
6. Printouts of community census data
7. Notepad and pencil
Overview
Who are the people who live in this community. . . and how many are there? What is their ethnicity? What are their ages? What other information can we find that tells more about the people who live in our community? How have these data changed over the years?
Directions
1. Distribute group roles.
2. Read Instructions: Gathering Data from the U.S. Census Bureau which will explain how to gather data.
3. Find the information on the Census Bureau web site and write it in the Census Data RecordingWorksheet.
4. Open the Excel spreadsheet and enter the census data you have gathered in the worksheet. Use theInstructions: Creating an Excel Spreadsheet for entering, analyzing, and creating a graph of the data.
© Southwest Educational Development Laboratory Foundations 1: Active Learning Environments24
STAT I O N 3 (PAGE 2 OF 5)

Community Profile
Who Are We?
Group Roles
Facilitator
1. Guide the group through this activity by using Instructions: Gathering Data from the U.S. Census Bureau and Instructions: Creating an Excel Spreadsheet.
2. Encourage all group members to participate.
3. Encourage all group members to remain on the topic.
Timekeeper
1. Note the starting and ending times.
2. Check time periodically and inform the group.
3. Alert the group five minutes before the end of the activity.
Recorder
1. Record census information on your notepad.
2. For future reference, make note of interesting or important information beyond the scope of this activity.
Computer manager
1. Ensure that all group members have equal time on the computer.
2. Remind group members to save important information.
© Southwest Educational Development Laboratory Foundations 1: Active Learning Environments25
STAT I O N 3 (PAGE 3 OF 5)

© Southwest Educational Development Laboratory Foundations 1: Active Learning Environments26
Community Profile
Who Are We?
Role Cards
(cut into 4 separate cards after duplication)
Computer Manager• Ensure that all group members have
equal time on the computer.
• Remind group members to save important information.
Facilitator• Guide the group through this activity
by using Instructions: Gathering Datafrom the U.S. Census Bureau andCreating an Excel Spreadsheet
• Encourage all group members to participate.
• Encourage all group members to remainon the topic.
Timekeeper• Note the starting and ending times.
• Check time periodically and inform thegroup.
• Alert the group five minutes before theend of the activity.
Recorder• Record census information on your
notepad.
• For future reference, make note of interesting or important informationbeyond the scope of this activity.
STAT I O N 3 (PAGE 4 OF 5)

Community Profile
Census Data Recording Worksheet
Read Table P8 and record the population number for each racial category below:
© Southwest Educational Development Laboratory Foundations 1: Active Learning Environments27
Racial Group Number of Persons
White
Black
American Indian, Eskimo, or Aleut
Asian or Pacific Islander
Other race
STAT I O N 3 (PAGE 5 OF 5)
© Southwest Educational Development Laboratory Foundations 1: Active Learning Environments28
I N STR U CT I O N S
Community Profile
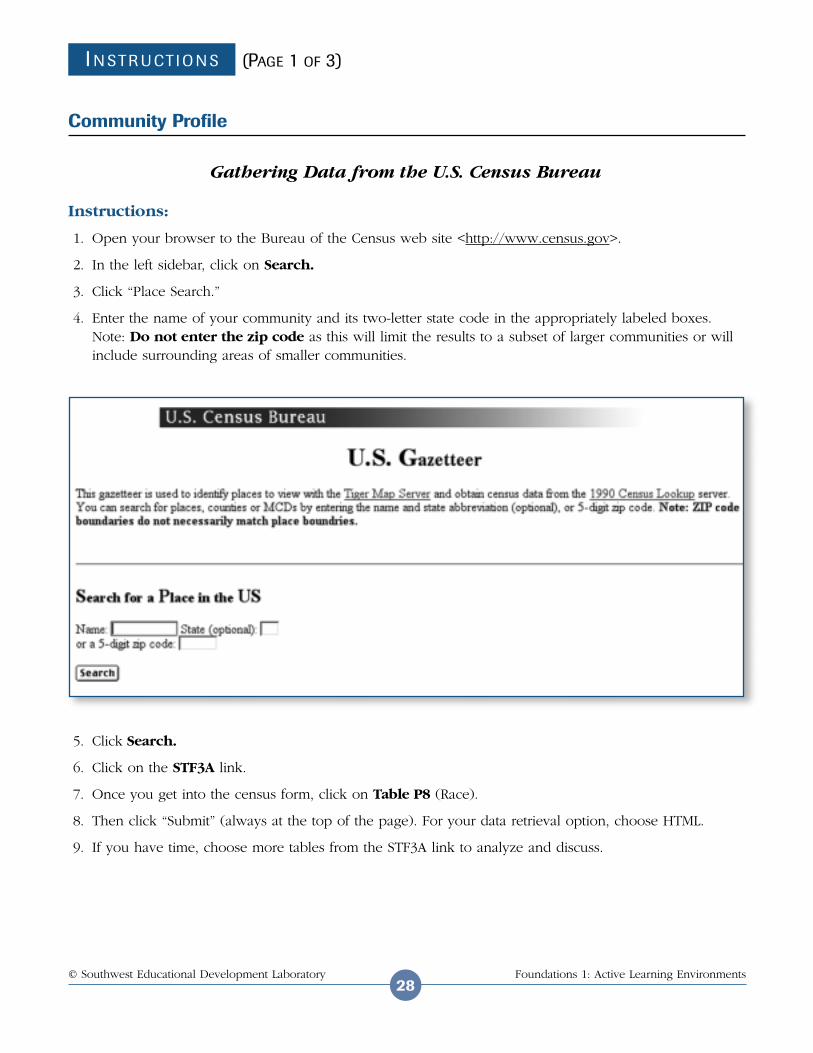
Gathering Data from the U.S. Census Bureau
Instructions:
1. Open your browser to the Bureau of the Census web site <http://www.census.gov>.
2. In the left sidebar, click on Search.
3. Click “Place Search.”
4. Enter the name of your community and its two-letter state code in the appropriately labeled boxes.Note: Do not enter the zip code as this will limit the results to a subset of larger communities or willinclude surrounding areas of smaller communities.
5. Click Search.
6. Click on the STF3A link.
7. Once you get into the census form, click on Table P8 (Race).
8. Then click “Submit” (always at the top of the page). For your data retrieval option, choose HTML.
9. If you have time, choose more tables from the STF3A link to analyze and discuss.
(PAGE 1 OF 3)

Recording the data
Once you’ve read your census data, the recorder should jot down the totals for each racial category (e.g. White, 3751) on Census Recording Work Sheet.
1. From your computer desktop screen, either open for an Excel file or open the Excel application.
2. Refer to your Instructions sheet—Creating an Excel Spreadsheet.
3. In the open Excel spreadsheet, enter the population number for each racial group that you recorded onyour worksheet.
4. Once you have entered the population data create a graph. Consider the following questions: What kindof graph is most appropriate for these data? Which will help you compare the relative populations?Which will most clearly communicate your observations? Which type of chart is most understandable forvisitors to your museum exhibit?
What have we learned?
1. What do you know now about your community that you did not know before?
2. How does the racial and ethnic diversity of your community compare with that of other communitiesthat you know?
3. Why and how do you think some of these groups arrived in this area? How is their influence felt in thecommunity now? What other questions can you think of to ask?
Background Information about the Census
The first census (from the Latin word “count”) was undertaken in 1790 in order to count the population ofthe United States. Since then a census of the U.S. population has occurred every 10 years. The census haschanged over time. The current U.S. Census measures population, income, and housing characteristics.
There are two census forms available on-line:
1. A short form (the *STF1-A) which is sent to most households
2. A long form (*STF3-A), which is really a sample and sent to selected, sample households
For this activity you will use information compiled in the long form (STF-3A).
Census limitations
The census is our most comprehensive source of population data in the United States. Yet the CensusBureau has been criticized repeatedly over the years for the structure of the census form, for its categories,and for the way it gathers data. You will probably notice lots of missing ethnic groups (especially morecommon groups, like Mexicans) and languages spoken in your community. Remember these data weregathered in 1989. You’ll also notice that Hispanics are not a treated as a race and are broken out as either
*STF is an acronym for “Standard Tape Files.”
© Southwest Educational Development Laboratory Foundations 1: Active Learning Environments29
I N STR U CT I O N S (PAGE 2 OF 3)

Hispanic or Other. This can be very confusing. Despite its obvious weaknesses, however, the census is arich example of raw and real-world data and can be a wonderful resource. Please ask for help if you haveany questions about using the census for this activity.
Census terms
Aggregate Total
Ancestry The census allows you to declare more than one ancestry. Single ancestry is obvious. Yourancestors were all Irish, Haitian, and so forth. For the majority of Americans who have ancestors from different parts of the globe, first ancestry is the ancestry that predominates. So, for example, if three grandparents were French and one Italian, your first ancestry would be French, your second, Italian.
Group quarters Nursing homes, boarding houses, prisons, and so forth. Any residence where unrelatedpersons live together.
Imputation This is the Census Bureau’s way of telling us that this figure is artificially derived. They couldn’t get the exact number, so they used a mathematical formula to calculate it.
Linguistic isolation The census term for being able to speak only one language. It usually refers to languages other than English.
Median The middle number in a series containing an odd number of items (e.g. In the series 1, 4, 7, 16,43, the median number is 7). This gives you the simplest breakdown of the ranges of numbers.
Quartile The census takes some data and divides the total into four groups of equal occurrences to look at the total distribution of the data.
Substituted The census can’t count everyone, so they guess at the number of people they miss and try to quantify this group. These missed individuals are termed substitutions.
Tenure Home ownership
Universe The specific population sampled. For example, if you were “surveying” students to see wherethey wanted to go for a class trip, your universe would be students. In the census, persons would be allpeople. Households would be all households.
© Southwest Educational Development Laboratory Foundations 1: Active Learning Environments30
I N STR U CT I O N S (PAGE 3 OF 3)

© Southwest Educational Development Laboratory Foundations 1: Active Learning Environments31
I N STR U CT I O N S
Community Profile
Creating an Excel Spreadsheet
What Do I Do After I’ve Gathered My Census Data?
1. Quit out of the U.S. Census. (FILE/QUIT)
2. On your computer desktop (i.e. on the computer screen), either open an Excel file or open the Excel application.
3. If you go into Excel application, you will need to enter the data into the appropriate rows and columns.
4. Enter the population number for each racial group. You can move to the next line by hitting RETURN.
5. To add all of the numbers together in Column B, highlight column B and then click on the ∑ symbol. A total sum will be automatically placed in the cell at the bottom of Column B.
6. To create a chart, highlight the information in Columns A and B.
7. Now you’re ready to create a chart. On your menu choose INSERT/CHART, as shown below in the sample
8. The dialog box lets you choose the type of chart you want. Once you’ve chosen the type of chart you want, click NEXT.
9. Click on the type of format you want for your chart and hit NEXT.
10. Follow the remaining steps in the wizard.
11. After previewing your chart, click Finish. There it is!
12. Save your work! (FILE/SAVE)
If there’s enough time, how about going back into the Census and looking at the ancestry of your community? (Choose table P33.) Perhaps you could make a spreadsheet chart showing the top 5 nationalities in your community.