active touchdown bearing control in magnetic bearing systems
TRANSCRIPT
University of Bath
PHD
Active Touchdown Bearing Control In Magnetic Bearing Systems
Li, Peichao
Award date:2015
Awarding institution:University of Bath
Link to publication
Alternative formatsIf you require this document in an alternative format, please contact:[email protected]
Copyright of this thesis rests with the author. Access is subject to the above licence, if given. If no licence is specified above,original content in this thesis is licensed under the terms of the Creative Commons Attribution-NonCommercial 4.0International (CC BY-NC-ND 4.0) Licence (https://creativecommons.org/licenses/by-nc-nd/4.0/). Any third-party copyrightmaterial present remains the property of its respective owner(s) and is licensed under its existing terms.
Take down policyIf you consider content within Bath's Research Portal to be in breach of UK law, please contact: [email protected] with the details.Your claim will be investigated and, where appropriate, the item will be removed from public view as soon as possible.
Download date: 15. Mar. 2022
ACTIVE TOUCHDOWN BEARING CONTROL IN
MAGNETIC BEARING SYSTEMS
Submitted by Peichao Li
for the degree of PhD
of the University of Bath
2015
COPYRIGHT
Copyright of this thesis rests with its author


i
Summary
Magnetic bearing systems are commonly used for high speed rotor applications,
having particular advantages in low pressure or vacuum environments. They
provide an alternative to conventional journal, rolling element and gas bearings.
The benefits of using magnetic bearing systems are well documented in terms of
low fiction and controllable stiffness and damping. In order to protect the
magnetic bearings in cases of power failure, intermittent faults and unexpected
external disturbances, secondary back-up or touchdown bearings are usually
included so that rotor and stator contact is prevented. If, for any reason, the rotor
should make contact with a touchdown bearing, the rotor dynamic response will
depend on many operational parameters and the rotor unbalance distribution.
Contact between the rotor and touchdown bearings could cause relatively high
contact forces, potentially damaging in terms of direct mechanical stresses and
through induced heat inputs when slip occurs.
In this thesis, parameters that allow rotor contact-free orbits and persistent
contact orbits to co-exist are investigated. These include rotational speed,
unbalance distribution, disturbance force, magnetic bearing and touchdown
bearing axial alignment. In order to alleviate the contact problem, an active
controlled touchdown bearing is used to reduce contact and friction forces with
the aim of returning the rotor to a contact-free orbit.
It is found that using active touchdown bearing motion control to achieve
contact-free levitation from a persistent contact condition is possible when
suitable touchdown bearing control strategy is applied. The effect of magnetic
bearing and touchdown bearing misalignment on rotor contact dynamics is also
analysed and found to have little effect on the effectiveness of touchdown
bearing control. The control strategies through an active touchdown bearing have
been implemented experimentally; they are demonstrated as being effective in
returning a rotor to its contact-free levitation from a persistent contact condition.
ii
Acknowledgements
I would like to thank to my PhD supervisors, Professors Patrick Keogh and
Mehmet Necip Sahinkaya, for supporting me during these past five years.
A special thanks to my wife. Words can not express how grateful I am for all of
the sacrifices that she has made on my behalf. Finally, I would like to dedicate
this thesis to all my family members.

iii
Contents
Summary .................................................................................................................i
Acknowledgements ................................................................................................ii
Contents ............................................................................................................... iii
Notation................................................................................................................vii
CHAPTER 1 Introduction................................................................................1
1.1 Literature review ........................................................................................2
1.1.1 Contact problem in rotor/magnetic bearing/touchdown bearing
system ........................................................................................................2
1.1.2 Rotor, magnetic bearing and touchdown bearing control ..............9
1.2 Research overview ...................................................................................10
CHAPTER 2 Experimental Test Rig .............................................................13
2.1 Test rig overview .....................................................................................13
2.2 Test rig modification................................................................................15
2.2.1 Rotor upgrade...............................................................................15
2.2.2 Touchdown bearing alignment.....................................................16
2.2.3 Hydraulic piston air bleeding modification..................................16
2.2.4 Piston position adjustment ...........................................................17
2.3 Rotor.........................................................................................................18
2.4 dSPACE system with DS2002 multi-channel A/D board and DS2103
multi-channel D/A board......................................................................................19
2.5 Magnetic bearing......................................................................................21
2.6 Magnetic bearing amplifier ......................................................................25
2.7 Touchdown bearing..................................................................................25
2.8 Eddy current proximity sensors ...............................................................29
2.9 Motor, motor controller and coupling......................................................30
CHAPTER 3 Modelling of Rotor, Active Magnetic Bearing and Active
Touchdown Bearing System ................................................................................32
3.1 Rotor modelling .......................................................................................32
3.1.1 Rotor stability analysis.................................................................35
3.2 Magnetic bearing modelling ....................................................................41
3.3 Touchdown bearing modelling ................................................................44
iv
3.3.1 The effect of touchdown bearing clearance on rotor and
touchdown bearing contact ......................................................................52
3.3.2 The effect of contact surface friction coefficient on rotor and
touchdown bearing contact ......................................................................60
3.3.3 The effect of touchdown bearing stiffness on rotor and touchdown
bearing contact .........................................................................................67
3.4 Conclusions..............................................................................................72
CHAPTER 4 Simulation Results ...................................................................73
4.1 Rotor re-levitation control when rotor makes contact with one touchdown
bearing..................................................................................................................73
4.1.1 Rotor re-levitation using magnetic bearing control .....................79
4.1.2 Rotor re-levitation using touchdown bearing motion ..................81
4.2 Rotor re-levitation when rotor makes contact with both touchdown
bearings ................................................................................................................85
4.2.1 Touchdown bearing control when the unbalance was higher ......96
4.2.2 Touchdown bearing control when the rotational speed was lower ..
....................................................................................................102
4.2.3 Rotor and touchdown bearing contact when touchdown bearing
has different stiffness in x and y directions ............................................109
4.2.4 Touchdown bearing control when touchdown bearing clearance
was smaller.............................................................................................115
4.3 Rotor re-levitation control when active magnetic bearing centre and
touchdown bearing centre are offset ..................................................................122
4.4 The effect of touchdown bearing motion timing on rotor re-levitation
control ................................................................................................................126
4.5 Conclusions............................................................................................129
CHAPTER 5 Experimental Results: System Parameters Identification and
Rotor Balancing 131
5.1 System parameters identification ...........................................................131
5.2 Rotor balancing ......................................................................................145
5.3 Conclusions............................................................................................149
CHAPTER 6 Active Touchdown Bearing Control to Release the Entrapped
Rotor: Zero Speed/Rotating Force Experiments ................................................150
6.1 Introduction............................................................................................150
v
6.2 Rotor radial displacement during run-up and run-down under contact with
touchdown bearing B .........................................................................................151
6.3 The effect of rotating force level on rotor/touchdown bearing contact
orbit ................................................................................................................162
6.4 The effect of magnetic bearing stiffness and damping on rotor/touchdown
bearing contact ...................................................................................................164
6.5 Active touchdown bearing radial displacement .....................................168
6.6 Using active touchdown bearing control to bring rotor out of contact ..170
6.7 Conclusions............................................................................................172
CHAPTER 7 Active Touchdown Bearing Control to Release the Entrapped
Rotor: Rotor Unbalance Experiments ................................................................173
7.1 Introduction............................................................................................173
7.2 Rotor and touchdown bearing contact region when the unbalance masses
were 9 grams ......................................................................................................174
7.3 Touchdown bearing control to bring rotor out of contact at 447 rad/s ..184
7.4 Touchdown bearing control to bring rotor out of contact at 433 rad/s and
425 rad/s .............................................................................................................191
7.5 Rotor and touchdown bearing contact region when the unbalance masses
were 7 grams ......................................................................................................197
7.6 Touchdown bearing control to bring rotor out of contact at 374 rad/s and
385 rad/s when unbalance masses were 7 grams ...............................................207
7.7 Conclusions............................................................................................211
CHAPTER 8 Conclusions and Further Work ..............................................212
References ..........................................................................................................217
Appendix A Finite Element Analysis.............................................................223
A.1 Shaft without added mass ......................................................................223
A.2 Additional masses to the shaft ...............................................................225
Appendix B Rotor Stability Analysis.............................................................227
Appendix C System Parameters Identification ..............................................233
Appendix D Magnetic bearing and touchdown bearing offset ......................237
Appendix E Rotor Balancing.........................................................................243
E.1 Rotor balancing background and overview............................................243
E.2 Calculate influence coefficient...............................................................245
E.3 Elimination of non-independent balancing planes.................................247
vi
E.4 Rotor balancing results...........................................................................249
Appendix F Rotor and bearing contact release..............................................258
Appendix G Rotor critical speed calculation .................................................267
Appendix H Synchronous magnetic bearing force calculation......................268
vii
Notation A = area
aA = magnetic force acting area
pA = effective magnetic bearing pole area
B = bulk modulus for hydraulic oil
aB = magnetic flux density
mB = magnetic bearing transformation matrix
mc = magnetic bearing clearance
tc = touchdown bearing clearance
mC = magnetic bearing damping
tC = touchdown bearing damping
adE = change of energy stored in magnetic bearing air gap
dP = change of pressure
ds = change of air gap edT = kinetic energy for beam element
ud = unbalance offset distance
eadU = axial load energy for beam element
ebdU = elastic bending energy for beam element
dV = change of volume
e = error
xe , ye = eccentricity in x, y planes
E = effective Young’s modulus
aE = energy stored in magnetic bearing air gap
f = force
+f , −f = magnetic force from the upper, lower coil
bf = cut off frequency of first order filter
pf = Piezoelectric actuator force
xf = magnetic force between two opposite magnets
viii
df = disturbance force vector
uf = unbalance force vector
mf = magnetic bearing force vector
F = beam element axial load
G = gyroscopic matrix
aH = magnetic field density
i = electrical current
0i = magnetic bearing bias current
I = Second moment of area
pJ = rotational inertia
k = magnetic bearing constant
ek = effective stiffness
ik = magnetic bearing force-current gain
sk = magnetic bearing negative stiffness
Dk = PID controller proportional gain
Ik = PID controller integral gain
Pk = PID controller proportional gain
mK = magnetic bearing stiffness
tK = touchdown bearing stiffness
K = stiffness matrix
l = length of beam element
L = Lagrangian
m = mass
tm = touchdown bearing mass
um = unbalance mass
M = mass matrix
n = number turns of the coil
1N , 2N = shape functions
3N , 4N = shape functions

ix
xN , yN = shape function vectors in x, y planes
P = proportional gain
q = displacement measurement
tq = touchdown bearing displacement
q = displacement vector
xq , yq = displacement vectors in x, y planes
Q = unbalance force vector
r = radius
rpm = revolutions per minute
s = distance
0s = nominal air gap
t = time
T = kinetic energy
u = PID controller output
U = potential energy
u = force vector matrix
aV = volume of the air gap
0V = total volume inside hydraulic line
tW = trial mass
W = unbalance mass vector matrix
x , y = displacement in x, y direction
yx − = fixed frame
yx ′−′ = rotational frame
dx , dy = translational displacement in x, y planes
rx , ry = rotational displacement in x, y planes
α = angle between centre of a pole and magnetic centre line
β = influence coefficient matrix
β = influence coefficient matrix
φ = beam element coefficient
x
Φ = angular phase
ν = Poisson’s ratio
μ = friction coefficient
0μ = magnetic field constant of the vacuum
hη = hysteretic damping
Vη = viscous damping
ω = rotational speed
Superscripts
e = beam element
o = initial condition
t = trial mass for balancing
T = transpose of matrices
Subscripts
a = air gap/axial loading
b = elastic bending
d , r = translational, rotational
disk = relating to disk on the rotor
f = fixed frame
j = point along the rotor
m = magnetic bearing
M = displacement measurement transducers
N = rotor balancing plane
p = piezoelectric actuator
r = rotational frame t = touchdown bearing
tb = touchdown bearing base motion
u = unbalance
x , y = x, y planes
1
CHAPTER 1 Introduction Magnetic bearing systems have many advantages compared to conventional anti-
friction bearings in terms of low friction and being able to operate in low
pressure and vacuum conditions. They are currently being used in high speed
applications such as electric motors/generators, pumps, gas turbines and turbo
molecular pumps. It could also be used in energy storage flywheels, maglev
systems, active magnetic dampers and high speed spindles etc. Magnetic bearing
stator cores are expensive; hence they are usually equipped with retainer or
touchdown bearings to protect the system in cases of events such as; power
failure, transient loading, system control failure or unexpected external
disturbance. Depending on the level of unbalance on the rotor, continuous
contact between the rotor and touchdown bearing might be induced by external
disturbances. High contact forces could cause damage through induced heat
dissipation at high speed.
The main objectives of this project are:
Identify areas on the test rig that require improvement, modify the
test rig including; the rotor shaft, touchdown bearing alignment and
hydraulic system used by the active touchdown bearing to meet the
active touchdown control requirement.
Understand the active magnetic bearing and touchdown bearing
system then build computer models to carry out simulation analysis.
Carry out magnetic bearing parameter identifications and perform
rotor balancing before the active touchdown bearing control
strategies are being tested.
Identify the speed region where the rotor and touchdown bearing
contact and non-contact orbits co-exist.
Design active touchdown bearing control strategy and use it to bring
the rotor out of contact to achieve contact-free levitation.
Test the active touchdown bearing control strategy in both real
experiments and simulations.
2
Propose further work to improve active touchdown bearing design
and its control strategies.
If the active touchdown bearing and its control strategy is proven to be effective,
it would significantly increase the system reliability and reduce the maintenance
cost. Following this, it might be beneficial to incorporate active touchdown
bearings into future active magnetic bearing designs.
1.1 Literature review
1.1.1 Contact problem in rotor/magnetic bearing/touchdown bearing system
A rotor assembly invariably has some unbalance due to manufacturing
imperfections; the level of unbalance has a direct relationship with rotor mass
eccentricity. It causes rotor radial displacement to vary with operating speed,
particularly around critical speeds that are related to resonance. At a certain
operating speed, the rotor might make contact with a touchdown bearing.
Continuous contact may cause local thermal stresses both on the rotor and
touchdown bearing, and therefore causing damage to the system. The issues
associated with rotor and bearing contact have been discussed by many
researchers [1]. The nonlinear rotor dynamics associated with contact have been
studied in [2-4]. Johnson [2] analysed the effect of touchdown bearing clearance
on rotor synchronous whirl and found that larger touchdown bearing clearance
could lower the speed for the critical peak amplitude to occur and cause phase
change at the critical speed. Ehrich [3] found the possibility of bistable rotor
orbits. Black [4] defined the synchronous rotor whirling interaction zones using
vector relationships of the system properties. It was stated that counterwhirl is
only possible at rotational speeds between two rotor critical frequencies. It was
also demonstrated experimentally that the synchronous whirl speed is dependent
on rotor speed; the contact friction force was found to increase with rotor speed.
The effect of rotor unbalance was studied and shows that the synchronous whirl
3
direction could change due to increase in rotor speed when the rotor has
sufficient unbalance.
Rotor and touchdown bearing contact involving rub and bounce-like motions
have been presented in [5-9]. Childs [5] used a model to simulate a portion of the
rotor orbit making contact with its housing or touchdown bearing. It was found
the radial and tangential forces increase due to the Coulomb friction. It was also
shown that there is the possibility of a very large rotor orbit when partially
rubbing and running at twice of the critical speed. In order to reduce the severity
of rotor whirl induced through partial rubbing, it was suggested that the housing
or touchdown bearing surface needs to be lubricated in order to reduce friction,
and that the touchdown bearing should be resiliently mounted. Choy et al. [7]
examined full rub contact for a touchdown bearing with small mass, rigid
bouncing for a heavy touchdown bearing, and chaotic behaviour when the
touchdown mass has an intermediate value. It is noted that the steady-state
response level is closely related to the touchdown bearing and rotor mass ratio;
higher mass ratio leads to higher steady-state response level. Lawen and Flowers
[8] studied the effect of a touchdown bearing and its coupling characteristics on
rotor dynamics during contact. The analysis was carried out analytically and
experimentally. It was found that touchdown bearing properties such as mass,
stiffness, and damping, and rotor unbalance can affect performance during
contact, hence they have to be taken into consideration for touchdown bearing
design in order to achieve desirable rotor and touchdown bearing dynamics.
Popprath and Ecker [9] generated a mathematical model to investigate the rotor
dynamics when a rotor makes intermittent contact with a touchdown bearing. In
this investigation, the influence of a visco-elastically supported stator on rotor
motion was included. It was found that the rotor orbit was seriously affected by
the stator motion; low damping in the stator mounts causes the stator vibration to
decay. In this model, only the intermittent contact was analysed due to lack of
computational power. The model needs to be developed further before it can be
used to investigate the full annular rub contact.
The functionality of touchdown bearings has been investigated by many authors
[10-14] during rotor drop, which simulates magnetic bearing electrical power
4
failure. Without electric power supply to the magnetic bearings, the rotor will
inevitably drop on to the touchdown bearings. Schmied and Pradetto [10]
performed a one tonne rotor drop test backed up with simulation. It was found
the most damaging whirling occurred when the rotor was dropped on the
touchdown bearing at full speed and full load. The chance of whirling could be
reduced by providing circumferential damping or lowering the moment of the
inertia and friction coefficient of the touchdown bearing. Also the contact force
could be reduced with smaller touchdown bearing clearance and lower
touchdown bearing stiffness. Hawkins et al. [12] also performed a rotor drop test.
Short period forward whirl was experienced at the beginning of the drop test,
followed by rocking motion as the speed decreased. The rocking motion
frequency was successfully predicted through simulation. Zeng [13] studied the
transient behaviour of rotor and touchdown bearing contact, numerically and
experimentally. Factors contributing to backward whirl were examined. It was
found that a lubricated contact surface can reduce the occurrence of backward
whirl. It was also noted the friction coefficient was not constant during rotor and
touchdown bearing contact, which increased rapidly due to abrasion on the
contact surface. The stiffness of the touchdown bearing mounts can seriously
affect abrasion level during contact; mounts with low stiffness can reduce the
abrasion, hence lead to lower friction coefficient.
High contact forces and other issues associated with contact have been observed
in [15-17]. Sun [18] used a detailed touchdown bearing model to study rotor drop
related problems. Contact friction force was mentioned as one of the critical
factors during rotor drop test, it was critical to reduce the friction coefficient in
order to keep rotor dynamics stable during rotor drop. Touchdown bearing
damping was included; lower damping may increase the chance of backward
whirl, while higher damping may increase contact force and thermal growth. It
was also indicated that when the magnetic bearings are in operation, the chance
of high speed backward whirl can be reduced by applying a side force, however,
this will increase the contact force, impulse and thermal growth on the contact
surface.
5
The transient behaviour of rotor contact has been identified by researchers [19-
21]. Markert and Wegener [19] studied the models that can be used to analyse
transient behaviour of elastic rotors on touchdown bearings, all the models have
led to similar results. Kirk et al. [20] analysed rotor drop behaviour, especially
for those systems with more than two magnetic or touchdown bearings. Larger
touchdown bearing responses and larger contact forces were observed when a
rotor drop onto a touchdown bearing was at a speed equal to one of its critical
frequencies. Ishii and Kirk [21] examined the transient response of a rotor under
touchdown bearing contact. Backward whirl was predicted when the touchdown
bearing damping was very low or very high. It was also found that the ratio
between touchdown bearing damping and damping at the contact point on the
rotor plays important role in rotor contact dynamics. If the damping ratio lies
within certain range, backward whirl would not occur even through the friction
coefficient at the contact surface is quite high. If the touchdown bearing damping
is quite low, the contact force can be very high if the touchdown bearing is
rotationally constrained. On the other hand, the backward whirl frequency can be
very high when the touchdown bearing damping is excessive; it may well exceed
the system’s first natural frequency. It was also found that the backward whirl
frequency is equal to the rotor’s first natural frequency when the touchdown
bearing damping is too high.
Research has been carried out into ways of reducing the contact force. It has
achieved by using either magnetic bearing control [22, 23] or active touchdown
bearing control [24-26]. Keogh and Cole [22] found that rotor and touchdown
bearing contact cause changes to rotor vibration amplitude and phase, which may
cause an existing PID (proportional-integral-derivative) controller to be
insufficient in attenuating rotor radial displacements. It was proposed to apply
appropriate synchronous forces to recover the rotor to its contact free orbit from
persistent contact, however, the synchronous force calculation requires accurate
contact mode prediction. Significant phase shift will occur when rotor enters a
contact mode, synchronous force calculation has to account these changes,
otherwise it will result much higher contact forces. Cole and Keogh [23]
mentioned that standard control methods based on linear assumption are not
appropriate when contact occurs, which may result in increased contact force and
6
rotor vibration amplitude. Hence a new robust controller based on H∞
optimisation was introduced in order to maintain stability during contact. The
new controller was tested experimentally; it showed much better stability
compared to the conventional controllers based on linear least square design.
Chavez et al. [26] proposed active touchdown bearing control to overcome the
problems associated with rub contact. In this investigation, a hybrid multi-body
system method was used to model the rotor touchdown bearing system and
contact was considered using a rigid body approach. The simulation results
showed that when contact occurs between the rotor and touchdown bearing,
sliding control methods were able to reduce the contact forces and bring rotor to
a stable contact orbit after disturbance force was applied to the rotor.
Re-levitation of the rotor from contact is still in the early stages of the research,
therefore little information has been documented [27, 28]. Cade et al. [27]
developed a model for the active touchdown bearing, a closed loop controller
was designed to simulate rotor and touchdown bearing contact by applying an
impulse to the rotor. It was shown that the controller was not only capable of
reducing the initial touchdown bearing contact magnitude, but it was also able to
reduce the subsequent vibration of the touchdown bearing. Keogh et al. [28] used
a model to examine rotor and touchdown bearing contact problems in fully
functional magnetic bearing systems. It was found that a stable rigid rotor may
make contact with the touchdown bearing due to an external disturbance; it may
not be possible to recover the rotor orbit from contact by changing the
characteristics of touchdown bearing. On the other hand, open-loop touchdown
bearing orbit control has shown some promise in recovering the rotor contact-
free orbit by destabilising contact orbits.
It is known that when a rotor makes contact with a touchdown bearing, it may
not be possible for the rotor to return to its contact-free orbit without further
control. It is beneficial to use external control to bring rotor out of contact in
order to ensure safe operation and to maximise the rotor operating range.
However, the external control may be only effective within an operating region;
the length of the region depends on many factors related to rotor, magnetic
bearings, touchdown bearings, operating speed and unbalance force or external
7
force. Rotor unbalance is the main input that causes a rotor to sustain its contact
orbit. Various control methods have been developed to compensate for unbalance,
but there is still scope for the rotor to make contact with touchdown bearings.
Much research has been carried on how to minimise forces when the contact
occurs. Various contact rotor dynamics were studied by Fumagalli [29], who has
explained how various parameters can affect the contact force, rotor and
touchdown bearing motion and energy dissipation. It was examined
experimentally and the whirl motion was cylindrical and its maximum speed was
close to the rotor’s first eigenfrequency when it was supported at both ends, low
levels of energy were transferred to the whirl motion. However, the whirl speed
may increase dramatically if more energy is transferred to the whirl motion. It
was also mentioned that the amount of energy transferred to the whirl motion
was closely related to the stiffness of the touchdown bearing. Various rotor
contact motion was investigated theoretically and experimentally by Ehehalt et al.
[30, 31]. It was shown that synchronous and non-synchronous motions, harmonic
and chaotic, during rotor and touchdown bearing contact may co-exist. It is
possible for the rotor to transfer from one state to another under certain
conditions, which was demonstrated during run-up and run-down.
It has been mentioned by many researchers that backward whirl during rotor and
touchdown bearing contact is very destructive. Backward whirl motion is
analysed in many papers [32-39]. Greenhill and Cornejo [33] used a model to
simulate backward whirl contact using a rotor supported by fluid film bearings,
the contact was initiated by unbalance forces. It was found that for the backward
whirl to occur, the symmetry of touchdown bearing stiffness has a very important
role to play. If touchdown bearings have symmetrical stiffness arrangement, it is
less unlikely for the backward whirl motion to get excited compared to the
asymmetrical arrangement. It was also noted that fluid film bearings provide
significant damping, which can reduce the chance of backward whirl motion. Lee
et al. [35] discuss methods to find the reason why there is no backward whirl
critical speed for isotropic rotors while there is backward whirl critical speed for
anisotropic rotors. It was found that it was possible to use a complex formulation
method to explain the backward whirl critical speed. Vlajic et al. [38] built a
scaled test rig to investigate bumping and backward whirl motions for a drill
8
string inside a wellbore. It was observed, as the driving speed or unbalance
increases, the rotor may make contact with the shell. If the friction coefficient is
small between the contact surfaces, the rotor may have a bounce-like contact
orbit. On the other hand, the rotor may make continuous backward whirl contact
with the shell when the friction coefficient is relatively large.
The various response characteristics of backward whirl have been researched by
Jiang et al. [40] using a generic rotor and stator model. The rotor dynamics,
contact friction and deformation of the contact surfaces were taken into
consideration. Two possible backward whirl frequency regions were identified
and they were closely related to the touchdown bearing stiffness; it was also
found the rotor could jump from one region to another with variation of
operating speed. When the touchdown bearing stiffness was relatively large, the
two regions do not overlap each other. As the stiffness decreases, the two regions
may start to move and overlap each other, which may create a region where two
backward whirl motions and two backward whirl frequencies coexist. Childs [41]
developed a model that can accurately predict whirl and whip contact frequency.
In this paper, a multimode rotor and stator model with an arbitrary axial contact
location was used, which is the extension of model used by Black [42]. It
overcame the problem of previous models that were not able to accurately predict
the transition speed from whirl to whip. The contact location and contact sliding
direction were found to be important factors that related to model’s accuracy and
they are accounted in the new model. The new model was used in numerical
simulation; the results provide good agreement with the experimental data.
Cade et al. [27] and Keogh et al. [28] have used touchdown bearing to alleviate
contact problems between the rotor and touchdown bearing. Although it has
shown in simulation that using open-loop touchdown bearing control is capable
of destabilising rotor’s contact orbit and Ginzinger et al. [43] have used active
touchdown bearing to avoid backward whirl, no one has used active touchdown
bearing to bring rotor out of persistent contact. In this thesis, using active
touchdown bearing to achieve contact-free re-levitation has been demonstrated
theoretically and experimentally.
9
1.1.2 Rotor, magnetic bearing and touchdown bearing control
The most common method to levitate and stabilise a rotor inside magnetic
bearings is to use a conventional PID (proportional-integral-derivative) control
[44]. PID control enables the setting of magnetic bearing stiffness and damping,
but it has some inherent limitations. For a PID controlled rotor/magnetic bearing
system, the level of unbalance on the rotor has a direct effect on its operating
orbit. For some rotor assemblies, at a certain operating speed, contact and non-
contact rotor dynamics may co-exist. If the unbalance is low, the rotor may never
make contact with a touchdown bearing, or it may be insufficient to sustain
contact with the touchdown bearing, the rotor returns to contact-free levitation
without further control action. At an intermediate level of unbalance, the rotor
may have two stable orbits, one without contact and the other with contact. When
the unbalance level is sufficiently high, contact-free levitation may not exist at all.
The main research of this thesis will focus on intermediate levels of unbalance.
An unbalance force is synchronous with the rotor rotating speed. Burrows and
Sahinkaya [45] have successfully designed an open-loop control strategy,
accompanied by a PID controller, to alleviate the effect of unbalance force. Cole
and Keogh [23] used a related method to recover rotor position from contact. The
method was further developed by Larsonneur et al. [46] by using a closed loop
control strategy. However, this strategy is dependent on any unbalance
distribution on the rotor.
Until recently, modern control strategies based on H∞ optimisation were
developed to reduce the rotor vibration. Keogh et al. [47] successfully designed a
H∞ controller to reduce the rotor vibration by incorporating rotor shaft surface
roughness into the controller design. Shiau [48] used the H∞ method to improve
rotor stability by reducing the effect of the spillover problem. Jiang and Zmood
[49] used H∞ control to attenuate severe rotor vibration when a small disturbance
is applied to a long slender shaft. H∞ controller performance is often associated
with controller robustness and model error; hence this method was later
improved and led to a more accurate and reliable methods, for instance μ-
synthesis (Nonami and Ito [50]). The H∞ method is normally optimised for one
10
speed, the controller may not be effective any more when the speed changes, also
it may cause instability in some extreme cases.
1.2 Research overview
In this thesis, the problem of rotor touchdown bearing contact is investigated and
possible solutions to minimise contact frequency region are covered. Chapter 2
explains the basic working principles of a test rig used in the experimental
investigation, some fundamental parts such as the rotor, magnetic bearings,
touchdown bearings and displacement sensors are described. The parameters
associated to each part of the test rig are also given out in this chapter. Chapter 3
outlines the modelling techniques used to simulate the test rig, especially the
finite element method used to model the rotor. The magnetic bearing model is
based on the equation between electrical current input and the resultant magnetic
bearing force. The test rig stability analysis is carried out in Chapter 3. Two
magnetic bearing and displacement sensor arrangements are analysed, the
displacement sensors can be either arranged inboard or outboard of the magnetic
bearings. First, the stability analysis method is checked with a stable system by
assuming that the magnetic bearings and sensor are co-located. For a stable
system, all system eigenvalues should have negative real part and damping
factors should always be positive.
In Chapter 4, rotor and touchdown bearing contact is simulated and active
magnetic bearing or active touchdown bearing control methods to reduce contact
are considered. First, an unbalance mass is mounted onto a non-driven end
balancing disk, the rotor rotational speed range where the rotor non-contact and
contact orbit coexist are investigated. Within the speed range, rotor may move
from a contact-free orbit to a contact orbit when an external disturbance force is
applied to the rotor. Various magnetic bearing control and touchdown bearing
control procedures are used to bring rotor back to a contact-free orbit. The
magnetic bearing control is through the generation of a synchronous force to
compensate for the inherent unbalance force and bring rotor out of contact.
Touchdown bearing control is used to reduce the contact force and encourage the
11
rotor to drop out of contact. The synchronous magnetic bearing control force is
calculated based on the test rig arrangement, the amount of unbalance force and
operating speed, then the synchronous control force is applied onto the rotor after
it makes contact with the touchdown bearing. The touchdown bearing is
controlled by moving it in the same direction as the rotor in order to reduce the
contact force between the rotor and touchdown bearing. Three equal unbalance
masses are mounted onto three balancing disks at the same angular positions; a
disturbance force is applied to the middle of the rotor to initiate rotor contact
with both touchdown bearings. Magnetic bearing synchronous control and
touchdown bearing control are applied in sequence to bring rotor out of the
contact orbit for different levels of unbalance masses. Afterwards, the magnetic
bearing synchronous control and touchdown bearing control are tested when
touchdown bearing clearance is smaller. Finally, touchdown bearing control
strategies are studied when the magnetic bearing centres and touchdown bearing
centres are not axially aligned.
In Chapter 5, the properties of active magnetic bearings used on the test rig are
studied. The magnetic bearing current gain and negative stiffness are calculated
based on the design parameters, which may not be accurate enough compared to
the true values. Various tests and computer simulations are carried out to identify
the parameters of the magnetic bearings. The method is based on accurately
identifying one of the rotor’s critical frequencies in simulation and on the test rig.
The rotor is balanced using the influence coefficient method.
In Chapter 6, the touchdown bearing control to move the rotor from the contact
orbit to a contact-free orbit is demonstrated. Before demonstrating the
touchdown bearing control strategy used in simulation, the rotor operating speed
range where the contact orbit and contact-free orbit coexist is identified. To
minimise potential damage, the speed range is identified around the rotor’s first
critical speed instead of the first flexural mode as in simulation. Moreover, the
unbalance force on the rotor is provided as a rotating force through magnetic
bearings, without actually rotating the rotor. Once the potential speed range and
the level of unbalance are identified, the same touchdown bearing control
12
strategy used in the simulation is applied to the test rig to bring rotor out of
contact.
In Chapter 7, the use of active touchdown bearing to achieve contact-free
levitation is demonstrated when unbalance masses of 9 and 7 grams are attached
to the rotor. Again, the rotor operating speed range is identified for each
unbalance mass and appropriate active touchdown bearing controls are used to
bring rotor out of contacts. A phase shift is introduced to the touchdown bearing
control demand in order to find the phase range where the touchdown bearing
control is effective.
Conclusions and suggestions for future research work are given in Chapter 8.
13
CHAPTER 2 Experimental Test Rig
2.1 Test rig overview
In order to investigate the rotor and touchdown bearing contact problem, an
experimental rotor dynamic system has been developed. Using this system, a
series of active touchdown bearing control strategies can be tested with the aim
to alleviate the rotor and touchdown bearing contact problem. The active
touchdown bearing concept is relatively new and it is still at the early stage of the
research; only one active touchdown bearing is used in this thesis to test the
effectiveness of proposed control strategies.
Figure 2.1 Rotor active magnetic bearing and touchdown bearing test rig
Piston
Disk 1 Disk 2 Disk 3Motor Coupling TDB-A
Sensor AMB-A AMB-BShaft
14
The test rig consists of:
(a) One 800 mm long, 30 mm diameter stainless steel shaft mounted with
three balancing disks, two magnetic bearings cores, and two touchdown
bearing contact sleeves.
(b) Two active magnetic bearings (AMBs), each active magnetic bearing has
a force capacity of 700 N and a bandwidth of 250 Hz.
(c) One active touchdown bearing (TDB) and one passive touchdown
bearing. The touchdown bearing active motion is achieved by using four
hydraulic pistons pushing the touchdown bearing. The hydraulic pistons
are arranged 90 degrees to each other. The active touchdown bearing
consists of:
1. Four high force (12 kN) piezoelectric stack actuators.
2. Four pairs of hydraulic pistons are used to move the touchdown
bearing. Each pair is connected by a ‘rigid’ hydraulic pipe. As a
piezoelectric actuator pushes one piston the force is transmitted by
the hydraulic line to the other piston, which displaces the
touchdown bearing in one direction.
3. Each touchdown bearing is a ball bearing, having an internal
diameter of 50 mm and outer diameter of 80 mm.
The passive touchdown bearing is positioned by the four hydraulic
pistons, but the hydraulic line is sealed by a cap at the other end.
(d) Eight eddy current proximity sensors. Four sensors measure rotor
displacement at two locations next to the magnetic bearings; the other
four measure the displacement of the two touchdown bearings.
(e) A dSPACE controller system with DS2002 Multi-Channel A/D Board
and DS2103 Multi-Channel D/A Board.
(f) One brushless DC motor with flexible coupling.
(g) One Baumer CH-8501 encoder.
The magnetic and touchdown bearings are located inside housings, which are
self-aligned axially. There are two possible configurations; the magnetic bearings
maybe situated inboard of the touchdown bearings or outboard of the touchdown
bearings. As shown in Figure 2.1, the magnetic bearings are inboard of
15
touchdown bearings, which was considered as better for protection from
excessive rotor vibration.
2.2 Test rig modification
2.2.1 Rotor upgrade
The original rotor was 600 mm long and 30 mm in diameter, its critical
frequencies are being too high for touchdown bearing testing. For example, its
first flexural critical speed was above 18,000 rpm (see Appendix G for matlab
calculation method). The motor used on this rig is only capable of running at
around 10,000 rpm; hence it was not possible to run the rotor supercritical. The
rotor was replaced by an 800 mm long shaft; the first flexural critical speed was
reduced to around 12,000 rpm. To reduce further its first flexural critical speed,
three stainless steel disks were attached to the rotor. Two are located near each
end of the rotor, while the third disk is in the middle of the rotor. Each disk is 30
mm long and has an outer diameter of 80 mm, weighing 1.08 kg. The internal
surface of each disk is tapered, which is designed to match the outer surface of a
SKF H2307 adaptor sleeve. The internal surface of the adaptor sleeve is designed
for a plain shaft with 30 mm diameter; the adaptor sleeve is freely to move on the
shaft before being fixed in position using the locking nut on the end. After the
disks were installed on the new shaft, the rotor’s first flexural critical speed was
reduced to around 8,000 rpm (below motor’s maximum speed).
Figure 2.2 Balancing disk and SKF H2307 adaptor sleeve

16
2.2.2 Touchdown bearing alignment
It is important to align the touchdown bearing with the magnetic bearing. A tool
was manufactured to align the touchdown bearing with its housing, hence also
with the magnetic bearing housing. There are two chamfers on the alignment tool;
one chamfer centres the touchdown against the alignment tool, while the other
chamfer centres the alignment tool against the touchdown bearing housing. The
alignment tool is removed after the touchdown bearing is fixed into position.
Figure 2.3 Touchdown bearing alignment and tool
2.2.3 Hydraulic piston air bleeding modification
Originally, the hydraulic piston was filled with hydraulic oil before being placed
inside the touchdown bearing housing. The joints were connected after the
touchdown bearings were placed inside the touchdown bearings, which gave rise
to the problem of air being entrapped inside the hydraulic line. To avoid air gaps,
the touchdown bearing housing was modified so that an air bleeding device could
be connected to the piston. Using this method, all the hydraulic pipes can be
connected before being filled up by using hydraulic oil and air can escape from
the air bleeding tool as shown in Figure 2.4.
Touchdown Bearing
Alignment Tool
17
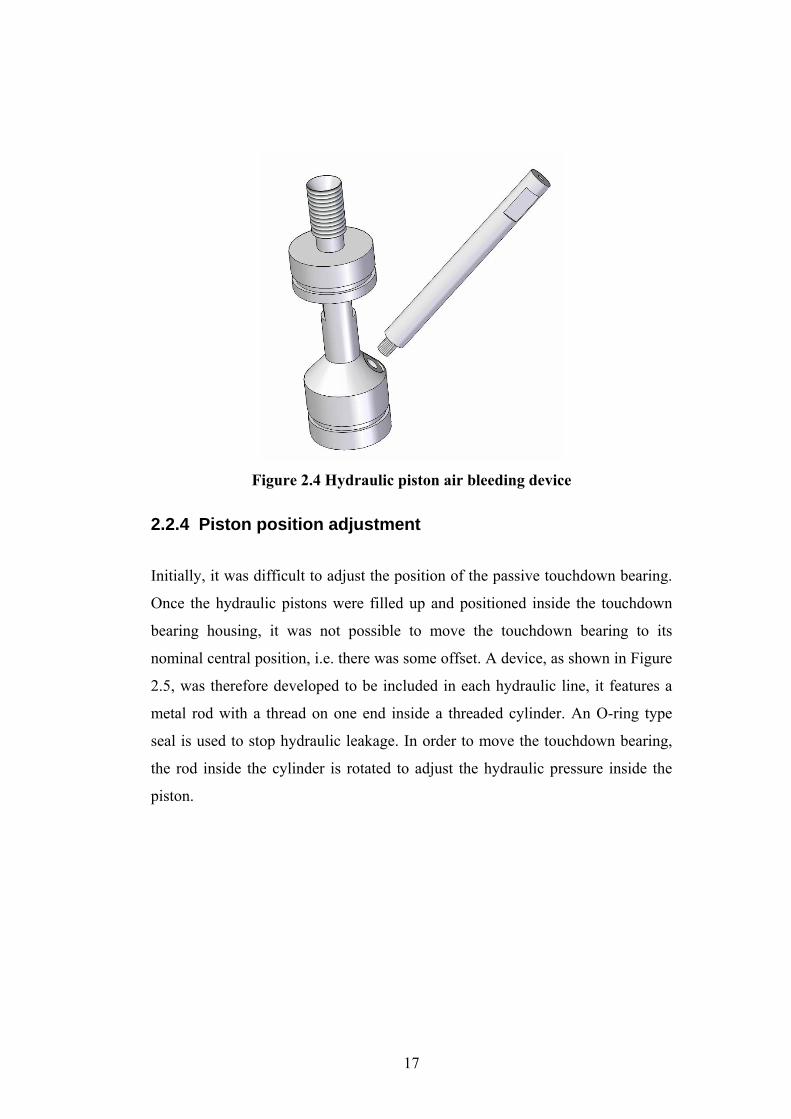
Figure 2.4 Hydraulic piston air bleeding device
2.2.4 Piston position adjustment
Initially, it was difficult to adjust the position of the passive touchdown bearing.
Once the hydraulic pistons were filled up and positioned inside the touchdown
bearing housing, it was not possible to move the touchdown bearing to its
nominal central position, i.e. there was some offset. A device, as shown in Figure
2.5, was therefore developed to be included in each hydraulic line, it features a
metal rod with a thread on one end inside a threaded cylinder. An O-ring type
seal is used to stop hydraulic leakage. In order to move the touchdown bearing,
the rod inside the cylinder is rotated to adjust the hydraulic pressure inside the
piston.

18
Figure 2.5 Hydraulic piston adjustable cap
2.3 Rotor
Figure 2.6 Rotor shaft with attachments
The shaft is 800 mm long, 30 mm in diameter and made from stainless steel.
There are seven cylindrical disks mounted on the shaft. Disks 1-3 are 80 mm in
diameter and 30 mm in length, each disk has eight equally spaced 3 mm
balancing holes on a pitch diameter of 70 mm. Two magnetic bearing cores and
two touchdown bearing sleeves are mounted on the shaft. Each magnetic bearing
core is 70.4 mm in diameter and 39 mm long, made from laminated steel. The
touchdown bearing sleeves are made from brass; each is 49.2 mm in diameter
and 30 mm long. For the free-free rotor assembly, two rigid modes and first five
flexural modes natural frequencies are shown in Table 2.1. These were evaluated
using finite element analysis, as described in Chapter 3.
Disk 2Shaft Disk 3
TDB Contact Core Disk 1 AMB Core

19
-Dis
plac
emen
t (no
uni
ts)
Table 2.1 Rotor free-free natural frequencies Mode 1 0 rad/s Mode 2 0 rad/s Mode 3 830 rad/s Mode 4 2270 rad/s Mode 5 4210 rad/s Mode 6 7970 rad/s Mode 7 9730 rad/s
The rotor mode shape for two rigid modes and first two flexural modes are
shown in Figure 2.7.
0 0.2 0.4 0.6 0.8-0.1
-0.05
0
0.05
0.1
Rotor Length (m)
Mode1 Mode2 Mode3 Mode4
Figure 2.7 Rotor mode shape
2.4 dSPACE system with DS2002 multi-channel A/D board and DS2103 multi-channel D/A board
dSPACE is a digital signal processing and control unit, capable of real-time
processing. It exchanges data with a PC through a dual port memory; software,
such as Simulink, can be used to generate models that can be uploaded for
control purposes. Information from dSPACE can be displayed on a PC and a
demand signal can be sent to dSPACE from the PC through a dSPACE user
interface program called ‘control desk’. It allows the user to change demand
20
signals, including bearing controller parameters, electrical motor speed and
sampling frequency. It also allows input and output data recording. The
maximum sampling frequency of the dSPACE is 5 kHz, so the maximum
calculation time is 0.2 ms for each time step in order to avoid overrun problems.
It has two input/output boards with part numbers DS2002 and DS2103 installed.
The DS2002 multi-channel A/D (analogue to digital) board has 32 single-ended
input channels, and 2 independent A/D converters with separate sample and hold.
The resolution is programmable, but it is limited to 4, 8, 12 and 16 bits. It has the
option to select two input voltage ranges, which are ±5 V and ±10 V. The higher
voltage range is used on the test rig, all the input voltages have to be kept within
±10 V. Therefore, the displacement sensor signal has to be shifted from -20~0 V
to -10~10 V. The offset and gain errors are ±2 mV and ±0.2%, respectively, of
the full-scale range, which are too small to have any effect on the input signals.
This board takes all the input signals such as displacement transducer
measurements, piezoelectric actuator displacements and rotor speed from the
encoder in the form the voltage before being processed by the dSPACE system.
The DS2103 multi-channel D/A (digital to analogue) board features 32 parallel
channels, each channel has its own 14 bit resolution D/A converter. The output
voltage range can be programmed to either ±5 V or ±10 V. If the voltage range is
not suitable for the active magnetic bearing amplifier, piezoelectric actuator
amplifier or electric motor controller input, the output voltage has be to be
adjusted by a signal conditioning circuit before being connected to amplifiers.
The offset error and gain error are relatively very small, which are ±1 mV and
±0.2% of the full-scale range, respectively.
21
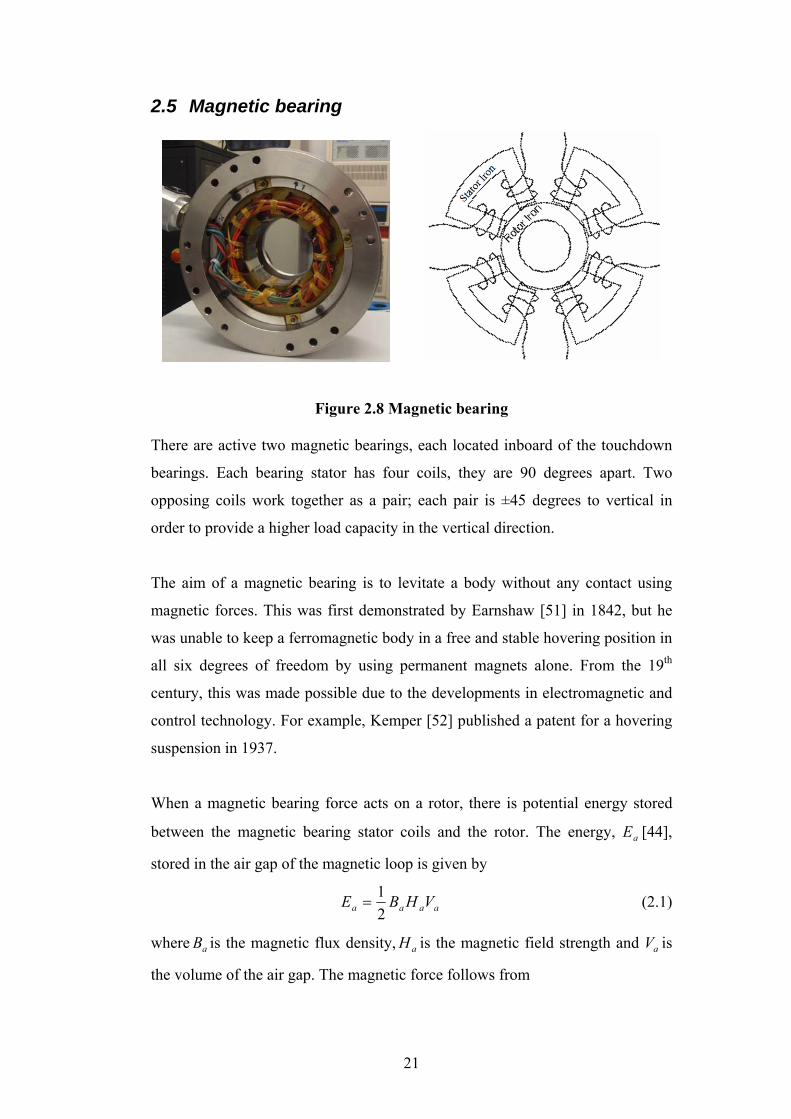
2.5 Magnetic bearing
Figure 2.8 Magnetic bearing
There are active two magnetic bearings, each located inboard of the touchdown
bearings. Each bearing stator has four coils, they are 90 degrees apart. Two
opposing coils work together as a pair; each pair is ±45 degrees to vertical in
order to provide a higher load capacity in the vertical direction.
The aim of a magnetic bearing is to levitate a body without any contact using
magnetic forces. This was first demonstrated by Earnshaw [51] in 1842, but he
was unable to keep a ferromagnetic body in a free and stable hovering position in
all six degrees of freedom by using permanent magnets alone. From the 19th
century, this was made possible due to the developments in electromagnetic and
control technology. For example, Kemper [52] published a patent for a hovering
suspension in 1937.
When a magnetic bearing force acts on a rotor, there is potential energy stored
between the magnetic bearing stator coils and the rotor. The energy, aE [44],
stored in the air gap of the magnetic loop is given by
aaaa VHBE21
= (2.1)
where aB is the magnetic flux density, aH is the magnetic field strength and aV is
the volume of the air gap. The magnetic force follows from
22
0
2
μaa
aaaa AB
AHBds
dEf === (2.2)
The flux density aB , can be expressed as
sniBa 20μ= (2.3)
Here, 70 104 −×= πμ Vs/Am is the magnetic field constant of the vacuum, n is
the number of turns of the coil, i is the coil current.
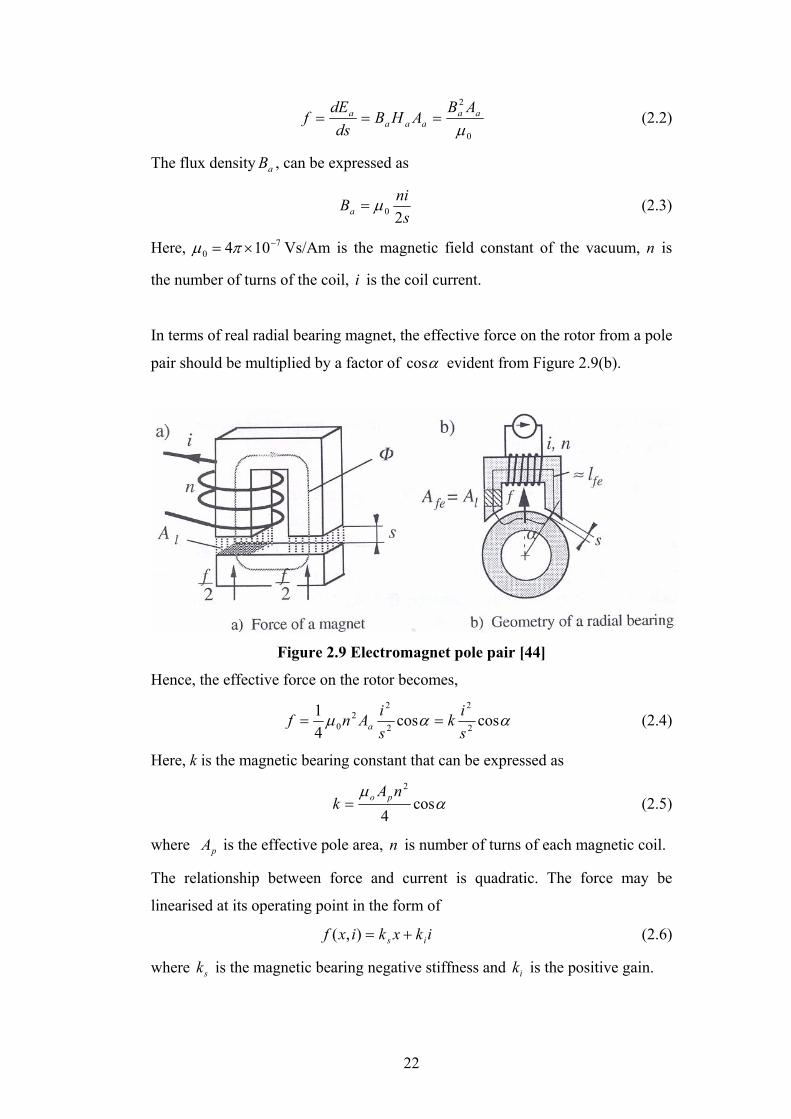
In terms of real radial bearing magnet, the effective force on the rotor from a pole
pair should be multiplied by a factor of αcos evident from Figure 2.9(b).
Figure 2.9 Electromagnet pole pair [44]
Hence, the effective force on the rotor becomes,
ααμ coscos41
2
2
2
22
0 sik
siAnf a == (2.4)
Here, k is the magnetic bearing constant that can be expressed as
αμ
cos4
2nAk po= (2.5)
where pA is the effective pole area, n is number of turns of each magnetic coil.
The relationship between force and current is quadratic. The force may be
linearised at its operating point in the form of
ikxkixf is +=),( (2.6)
where sk is the magnetic bearing negative stiffness and ik is the positive gain.
23
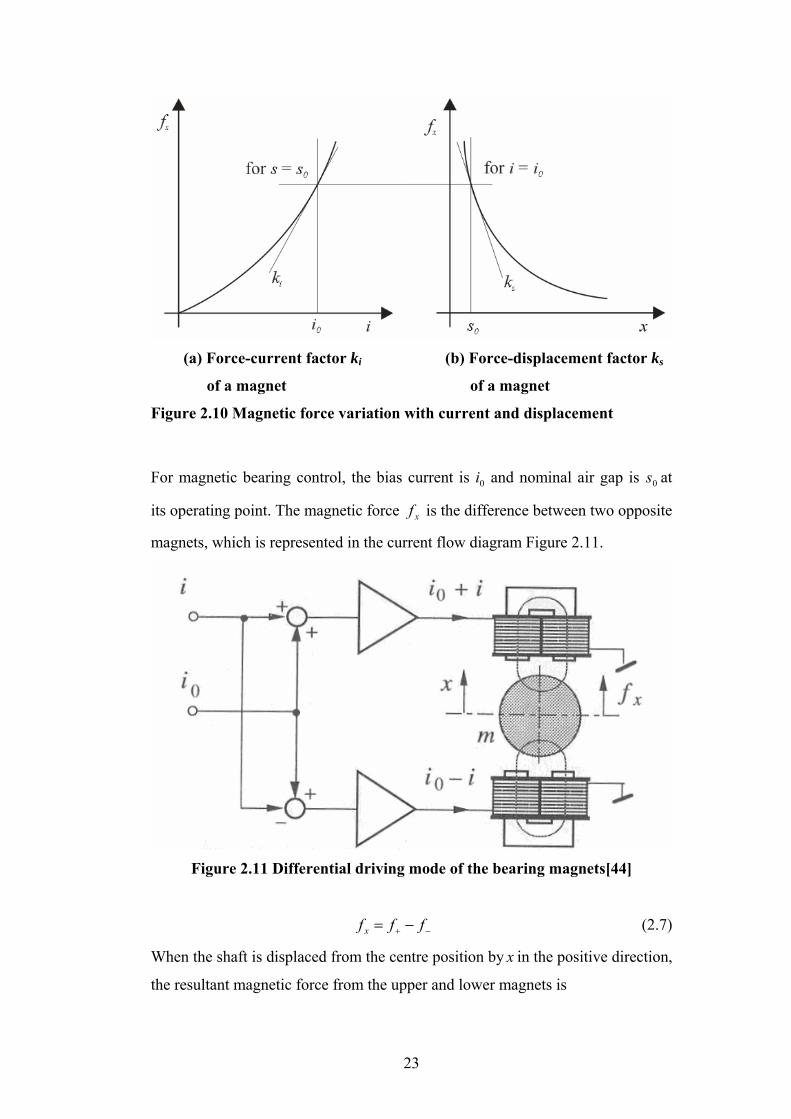
(a) Force-current factor ki (b) Force-displacement factor ks
of a magnet of a magnet
Figure 2.10 Magnetic force variation with current and displacement
For magnetic bearing control, the bias current is 0i and nominal air gap is 0s at
its operating point. The magnetic force xf is the difference between two opposite
magnets, which is represented in the current flow diagram Figure 2.11.
Figure 2.11 Differential driving mode of the bearing magnets[44]
−+ −= fff x (2.7)
When the shaft is displaced from the centre position by x in the positive direction,
the resultant magnetic force from the upper and lower magnets is
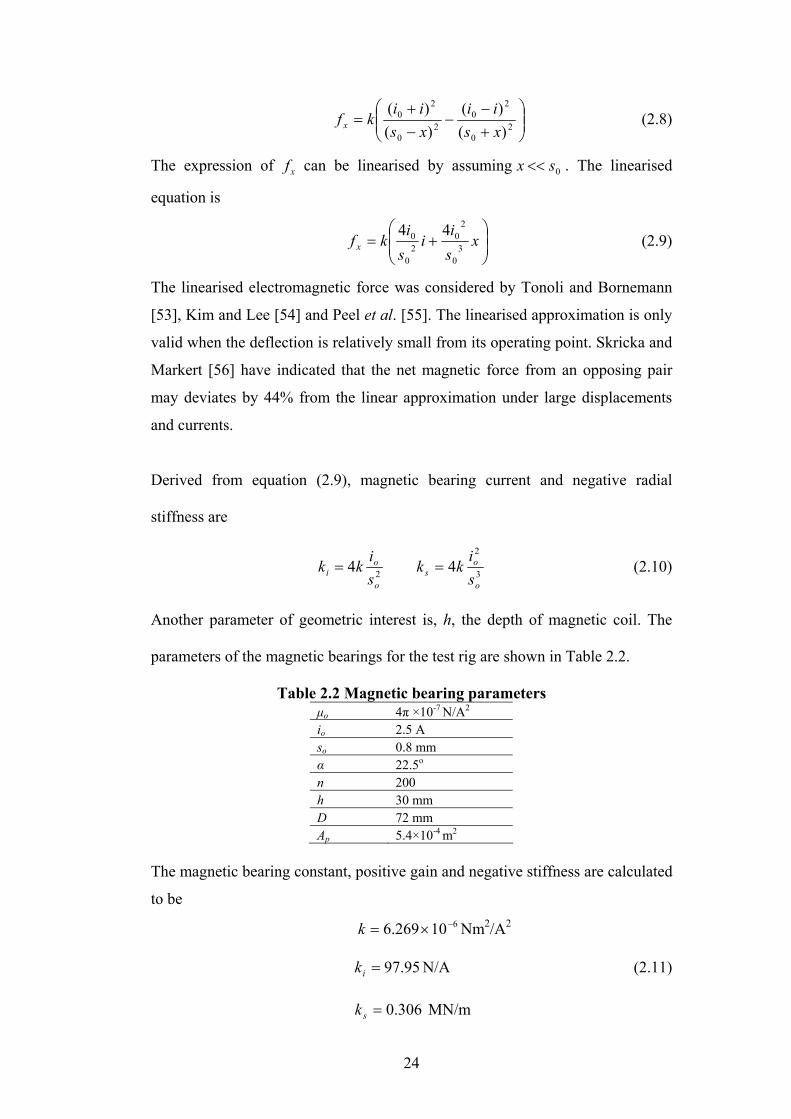
24
⎟⎟⎠
⎞⎜⎜⎝
⎛+−
−−+
= 20
20
20
20
)()(
)()(
xsii
xsii
kf x (2.8)
The expression of xf can be linearised by assuming 0sx << . The linearised
equation is
⎟⎟⎠
⎞⎜⎜⎝
⎛+= x
si
isi
kf x 30
20
20
0 44 (2.9)
The linearised electromagnetic force was considered by Tonoli and Bornemann
[53], Kim and Lee [54] and Peel et al. [55]. The linearised approximation is only
valid when the deflection is relatively small from its operating point. Skricka and
Markert [56] have indicated that the net magnetic force from an opposing pair
may deviates by 44% from the linear approximation under large displacements
and currents.
Derived from equation (2.9), magnetic bearing current and negative radial
stiffness are
24o
oi s
ikk = 3
2
4o
os s
ikk = (2.10)
Another parameter of geometric interest is, h, the depth of magnetic coil. The
parameters of the magnetic bearings for the test rig are shown in Table 2.2.
Table 2.2 Magnetic bearing parameters μo 4π ×10-7 N/A2 io 2.5 A so 0.8 mm α 22.5o n 200 h 30 mm D 72 mm Ap 5.4×10⁻⁴ m2
The magnetic bearing constant, positive gain and negative stiffness are calculated
to be
610269.6 −×=k Nm2/A2
95.97=ik N/A (2.11)
306.0=sk MN/m
25
2.6 Magnetic bearing amplifier
Each magnetic bearing has four pairs of coils; each coil pair is powered by a
Xenus XTL type amplifier made by Copley Controls. The amplifier model
number is XTL-230-18, which gives out the control current. It has continuous
current output of 6 A, and a peak current output of 18 A; the magnetic bearing
coil current is limited to 5 A to meet the amplifier output requirement. The
amplifier control input voltage is ±10 V, which matches with the dSPACE D/A
board output voltage. It has a sampling frequency of 15 kHz, which is well above
the dSPACE sampling rate. The amplifier requires both AC and DC power inputs.
The AC power input requirement is 100~240 V with a frequency range of 47~63
Hz, while the DC power input should be 24 V, which can be taken from an AC to
DC converter. The amplifier also gives an output current measurement signal as
well as output current, but the current measurement is a digital signal and it
cannot be used by the A/D board in the dSPACE system.
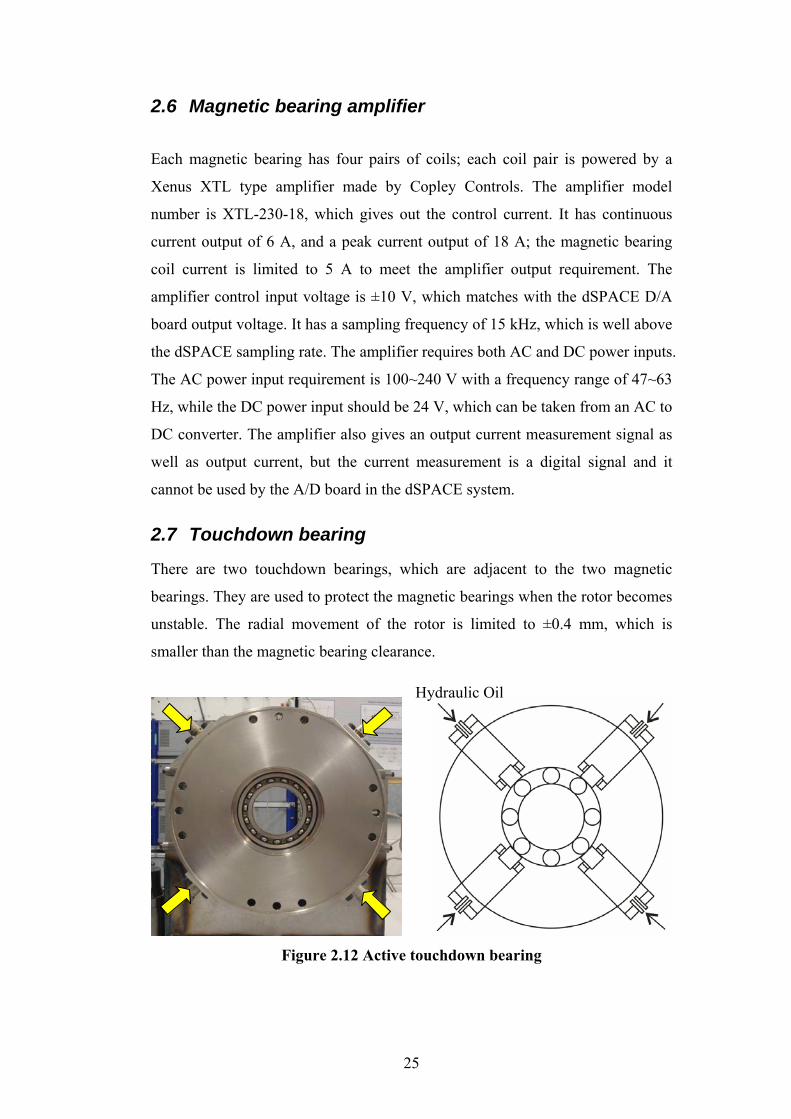
2.7 Touchdown bearing
There are two touchdown bearings, which are adjacent to the two magnetic
bearings. They are used to protect the magnetic bearings when the rotor becomes
unstable. The radial movement of the rotor is limited to ±0.4 mm, which is
smaller than the magnetic bearing clearance.
Figure 2.12 Active touchdown bearing
Hydraulic Oil
26
The active touchdown bearing (TDB B, Figure 2.1) is the touchdown bearing
close to the non-driven rotor end. It consists of a ball bearing or a journal bearing
pushed by four hydraulic pistons in two orthogonal axes; the hydraulic fluid
inside the piston provides high stiffness to the touchdown bearing. The hydraulic
pistons are sealed by using lip-type and O-ring seals, and the operating pressure
may be up to 344 bar (5000 psi). The touchdown bearing pistons have the same
orientation as the magnetic bearing pole pairs; they are arranged 45 degrees to
vertical. For the passive touchdown bearing, each piston is sealed by a cap screw
after it is filled with hydraulic fluid. The pistons for the active touchdown
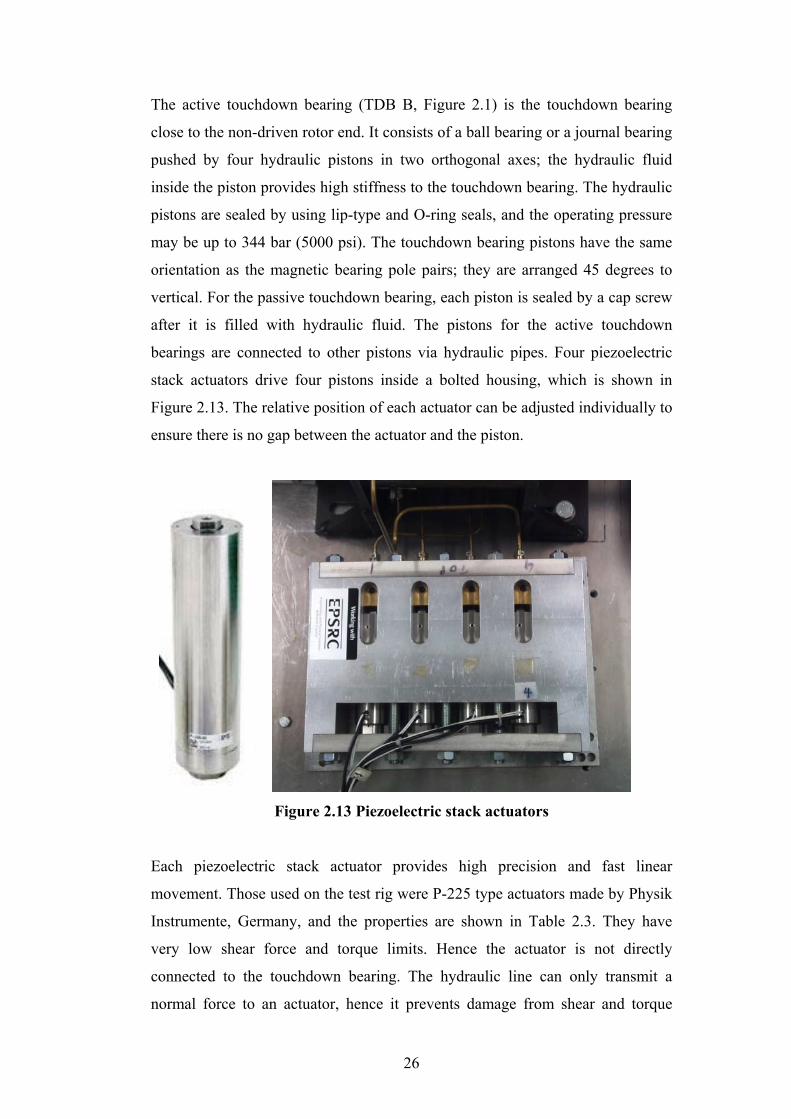
bearings are connected to other pistons via hydraulic pipes. Four piezoelectric
stack actuators drive four pistons inside a bolted housing, which is shown in
Figure 2.13. The relative position of each actuator can be adjusted individually to
ensure there is no gap between the actuator and the piston.
Figure 2.13 Piezoelectric stack actuators
Each piezoelectric stack actuator provides high precision and fast linear
movement. Those used on the test rig were P-225 type actuators made by Physik
Instrumente, Germany, and the properties are shown in Table 2.3. They have
very low shear force and torque limits. Hence the actuator is not directly
connected to the touchdown bearing. The hydraulic line can only transmit a
normal force to an actuator, hence it prevents damage from shear and torque

27
loads. The drawback of transmitting actuator force/movement by using a
hydraulic system is that the travel distance might be lost due to possible leakage
in the system or increased hydraulic fluid compressibility when air is entrapped
in the hydraulic fluid.
Table 2.3 Piezoelectric stack actuator properties
Operating voltage 0 V to 1,000 V Closed-loop travel 120 μm Closed-loop resolution 2.4 nm Linearity 0.20% Static large-signal stiffness 110 N/μm Crystal frequency 4 kHz Push/pull force capacity 12,500 N/2,000 N Shear force limit 73 N Torque limit (on tip) 1.5 Nm Mass 900 g
The maximum actuator (blocking) force occurs at the maximum input voltage
when the displacement is zero. The force gradually decreases with displacement.
0 0.5 1 1.5x 10⁻⁴
0
2000
4000
6000
8000
10000
12000
14000
Displacement (m)
Forc
e (N
)
Figure 2.14 Piezoelectric stack actuator force and displacement relationship
At maximum input voltage, the force and displacement relationship is shown in
the Figure 2.14 by assuming a linear relationship:
xf 810042.112500 ×−= (2.12)
where f is the actuator force and x is the actuation displacement.
28
It was not be easy to eliminate all possible leakage in the hydraulic system and
remove all the air inside hydraulic fluid. The hydraulic oil compressibility is
expressible from its bulk modulus:
dVdPVB o= (2.13)
The bulk modulus for hydraulic oil at room temperature with 0.1% air is 16,000
bar. A high bulk modulus means low compressibility, or vice versa. The fluid
compressibility is normally ignored when the pressure and volume is moderate.
When the pressure is higher than 340 bar, it is possible to get a delayed response
if the compressibility is relatively high. It is useful to evaluate the maximum
possible operating pressure inside any hydraulic pipe to ensure the desired
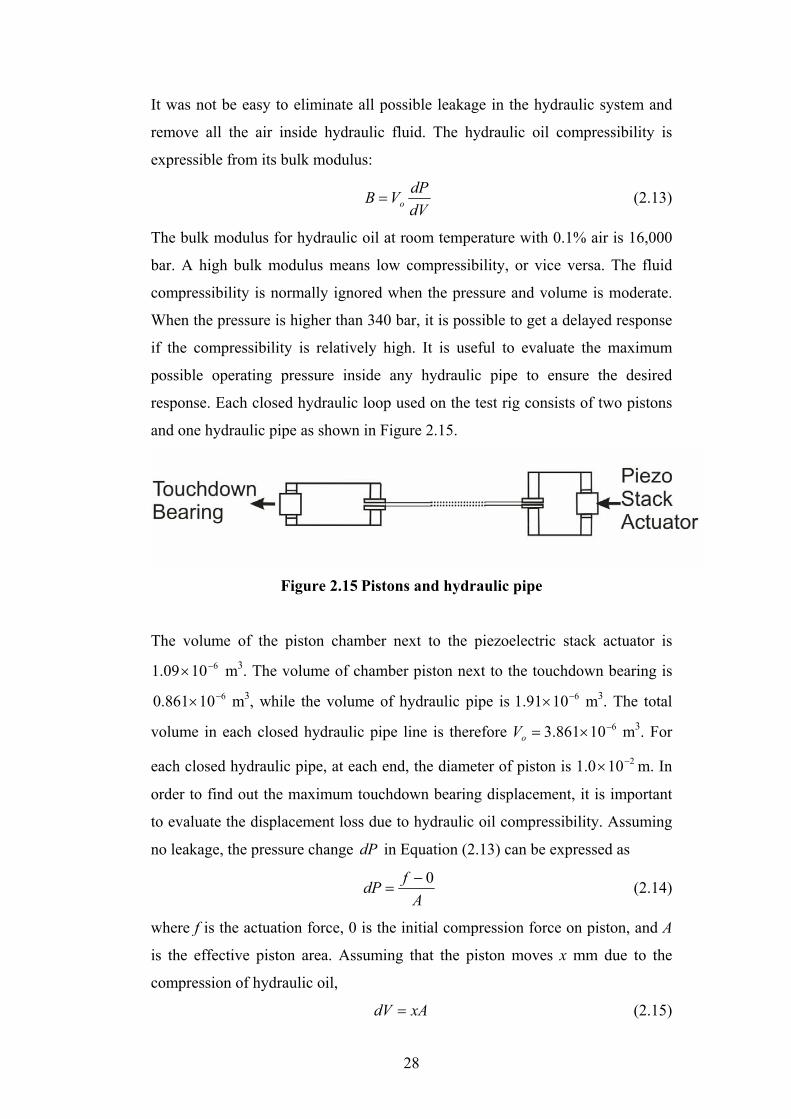
response. Each closed hydraulic loop used on the test rig consists of two pistons
and one hydraulic pipe as shown in Figure 2.15.
Figure 2.15 Pistons and hydraulic pipe
The volume of the piston chamber next to the piezoelectric stack actuator is 61009.1 −× m3. The volume of chamber piston next to the touchdown bearing is
610861.0 −× m3, while the volume of hydraulic pipe is 61091.1 −× m3. The total
volume in each closed hydraulic pipe line is therefore 610861.3 −×=oV m3. For
each closed hydraulic pipe, at each end, the diameter of piston is 2100.1 −× m. In
order to find out the maximum touchdown bearing displacement, it is important
to evaluate the displacement loss due to hydraulic oil compressibility. Assuming
no leakage, the pressure change dP in Equation (2.13) can be expressed as
AfdP 0−
= (2.14)
where f is the actuation force, 0 is the initial compression force on piston, and A
is the effective piston area. Assuming that the piston moves x mm due to the
compression of hydraulic oil,
xAdV = (2.15)
29
Using equations (2.12)-(2.15), the piston movement x due to compression is
found to be 11100.3 −×=x m (2.16)
which is negligible compared to the actuator maximum displacement. The
maximum possible operating pressure is found to be 1,591 bar, which is beyond
the piston seal pressure limit. The piston may still respond to the piezoelectric
actuator motion, but the total available touchdown bearing displacement may be
significantly reduced. The maximum pressure only occurs when supplying
maximum voltage to two opposite piezoelectric stack actuators at the same time,
which may not occur under normal operating conditions. If the operating
pressure exceeds the lip-seal pressure limit, it may result leakage in the system.
Once air is trapped inside the hydraulic oil, the bulk modulus will reduce
significantly and the touchdown bearing movement range and bandwidth will
decrease.
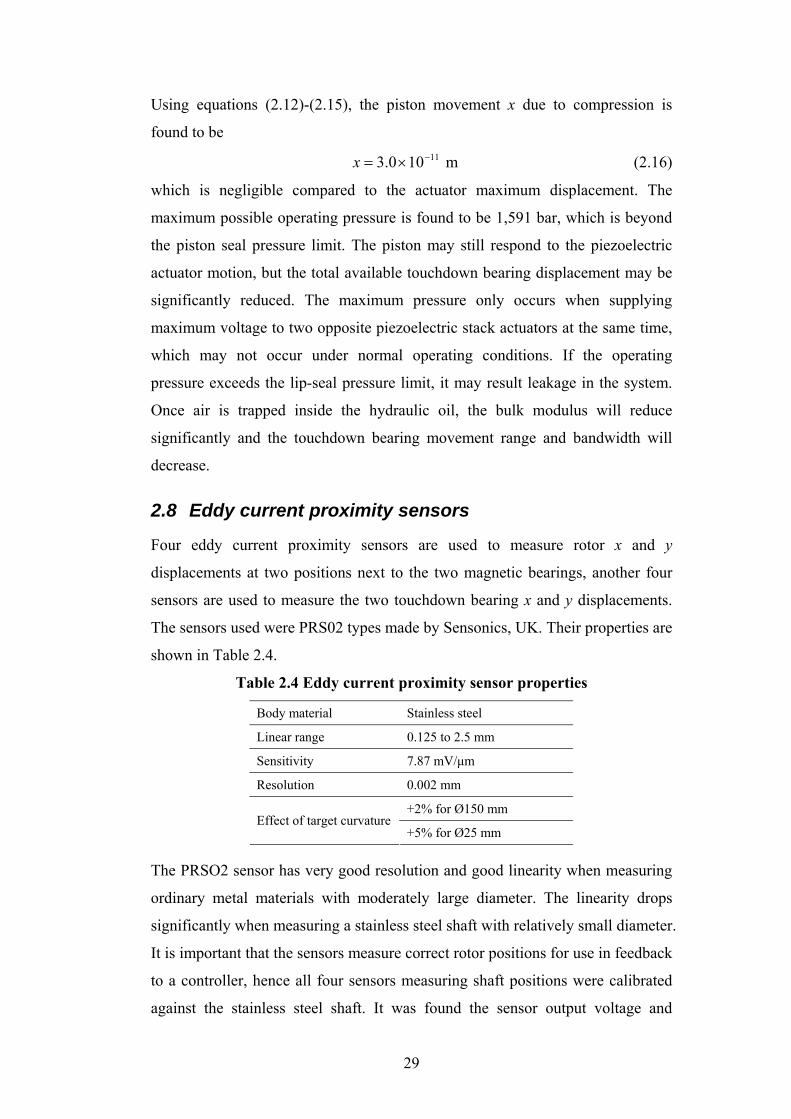
2.8 Eddy current proximity sensors
Four eddy current proximity sensors are used to measure rotor x and y
displacements at two positions next to the two magnetic bearings, another four
sensors are used to measure the two touchdown bearing x and y displacements.
The sensors used were PRS02 types made by Sensonics, UK. Their properties are
shown in Table 2.4.
Table 2.4 Eddy current proximity sensor properties
Body material Stainless steel
Linear range 0.125 to 2.5 mm
Sensitivity 7.87 mV/μm
Resolution 0.002 mm
+2% for Ø150 mm Effect of target curvature
+5% for Ø25 mm
The PRSO2 sensor has very good resolution and good linearity when measuring
ordinary metal materials with moderately large diameter. The linearity drops
significantly when measuring a stainless steel shaft with relatively small diameter.
It is important that the sensors measure correct rotor positions for use in feedback
to a controller, hence all four sensors measuring shaft positions were calibrated
against the stainless steel shaft. It was found the sensor output voltage and
30
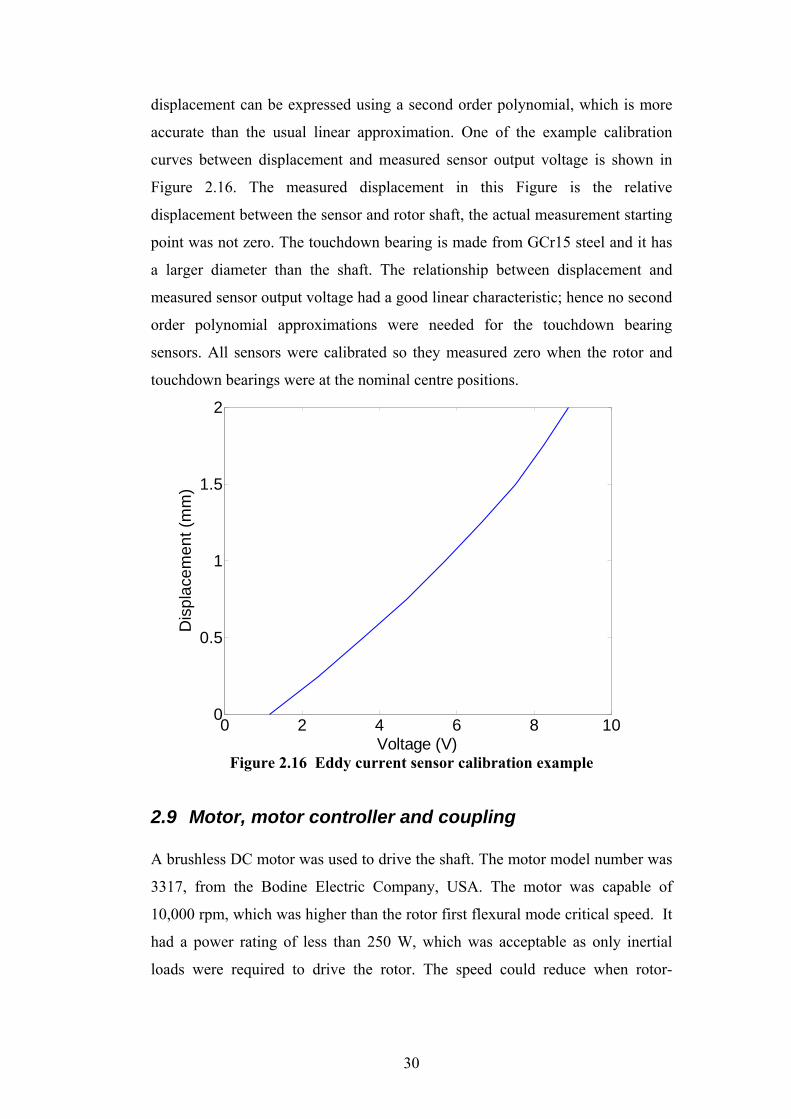
displacement can be expressed using a second order polynomial, which is more
accurate than the usual linear approximation. One of the example calibration
curves between displacement and measured sensor output voltage is shown in
Figure 2.16. The measured displacement in this Figure is the relative
displacement between the sensor and rotor shaft, the actual measurement starting
point was not zero. The touchdown bearing is made from GCr15 steel and it has
a larger diameter than the shaft. The relationship between displacement and
measured sensor output voltage had a good linear characteristic; hence no second
order polynomial approximations were needed for the touchdown bearing
sensors. All sensors were calibrated so they measured zero when the rotor and
touchdown bearings were at the nominal centre positions.
0 2 4 6 8 100
0.5
1
1.5
2
Voltage (V)
Dis
plac
emen
t (m
m)
Figure 2.16 Eddy current sensor calibration example
2.9 Motor, motor controller and coupling A brushless DC motor was used to drive the shaft. The motor model number was
3317, from the Bodine Electric Company, USA. The motor was capable of
10,000 rpm, which was higher than the rotor first flexural mode critical speed. It
had a power rating of less than 250 W, which was acceptable as only inertial
loads were required to drive the rotor. The speed could reduce when rotor-

31
touchdown bearing contact occurred, which is due to additional friction induced
torque. Information about the motor is shown in Table 2.5.
Table 2.5 Brushless DC motor
Speed 10000 rpm
Voltage DC 130 V
Power 248.6 W
Torque 0.233 Nm
Rotor Inertia 3106.3 −× kgm2
The motor was controlled by using a Brushless DC control module 3921, also
manufactured by Bodine. It can be controlled manually or controller by the
computer using the external control signal port.
Table 2.6 Motor Controller
Input Voltage (AC) 115 V
Output Voltage (DC) 0-130 V
Continuous Output Current 6 A
Peak Output Current 6 A
The motor was connected to the shaft using a bellows coupling made by Huco,
UK. It had a maximum allowable radial movement of 1.2 mm, which is larger
than the rotor maximum movement range of ±0.4 mm inside the touchdown
bearings. It had a large torsional stiffness and a low radial stiffness, which
ensured that the rotor had a rapid response to motor demand without significant
radial load transmitted between the rotor and the motor. The detailed information
about the coupling is shown in Table 2.7.
Table 2.7 Huco bellows coupling
Mass 107 g
Peak Torque 5 Nm
Max Radial Compensation 1.2 mm
Max Axial Compensation 2.5 mm
Torsional Stiffness 1310 Nm/rad
Angular Stiffness 0.52 Nm/rad
Radial Stiffness 9.3 Nm/rad
32
CHAPTER 3 Modelling of Rotor, Active Magnetic Bearing and Active Touchdown Bearing System
In this thesis, experimental work will involve rotor and touchdown bearing
contact, which could cause damage to the equipment. It is necessary to simulate
the rotor and touchdown bearing contact as well as checking the active
touchdown bearing control strategy prior to the real experiments. Simulation is a
powerful tool for identifying the influence of system parameters on rotor and
touchdown bearing contact. The method used to model the test rig is described in
this chapter. The modelling of the rotor is based on finite element analysis.
Depending on the size of the rotor model, model reduction may be performed if
the number of the states causes execution times to be excessive. For practical
design reasons, magnetic bearings and displacement sensors are not normally
collocated, which may cause system instability. Therefore a stability analysis is
also carried out in this section when the sensors are inboard and outboard of the
magnetic bearings. The magnetic bearings are modelled in terms of the electrical
supply current, rotor radial position, and the magnetic bearing force equation.
The touchdown bearing stiffness, damping and its motion generated by the
piezoelectric actuator force is considered in the modelling of the touchdown
bearings. The effects of touchdown bearing clearance, contact surface friction
and touchdown bearing contact are also analysed.
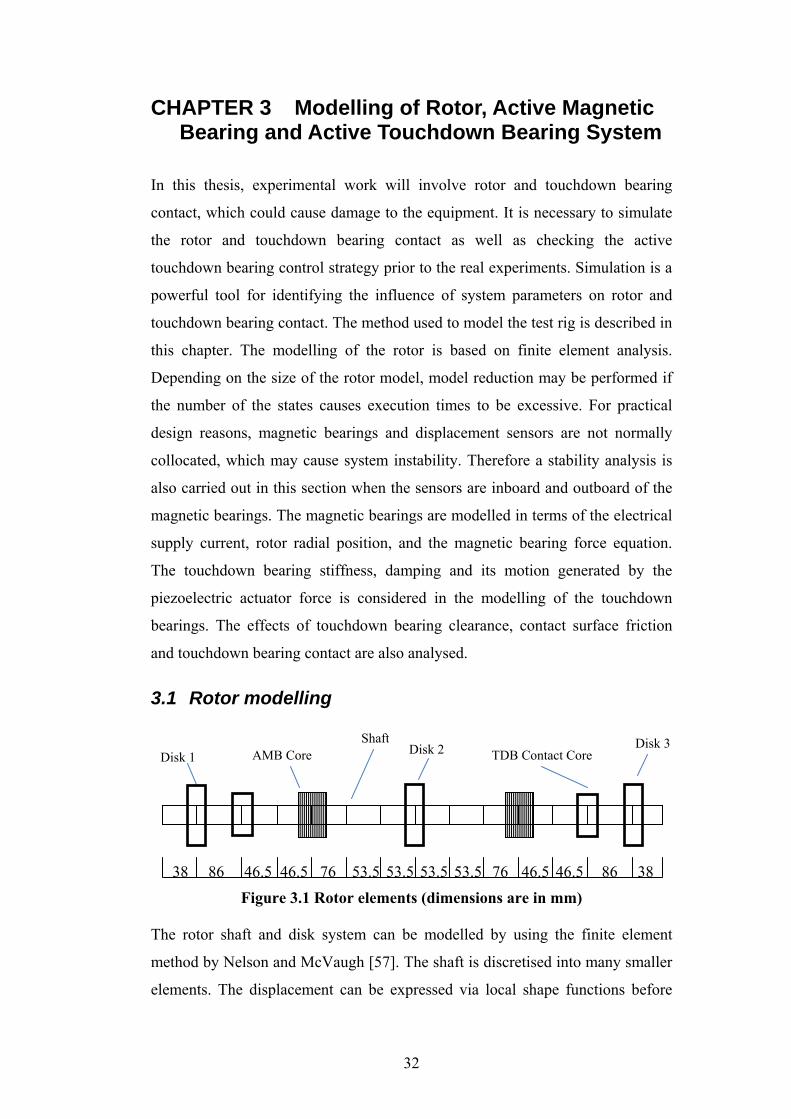
3.1 Rotor modelling
Figure 3.1 Rotor elements (dimensions are in mm)
The rotor shaft and disk system can be modelled by using the finite element
method by Nelson and McVaugh [57]. The shaft is discretised into many smaller
elements. The displacement can be expressed via local shape functions before
53.5
Disk 2Shaft Disk 3
TDB Contact Core Disk 1 AMB Core
38 86 46.5 76 53.5 53.5 53.5 76 46.5 46.5 46.5 86 38
33
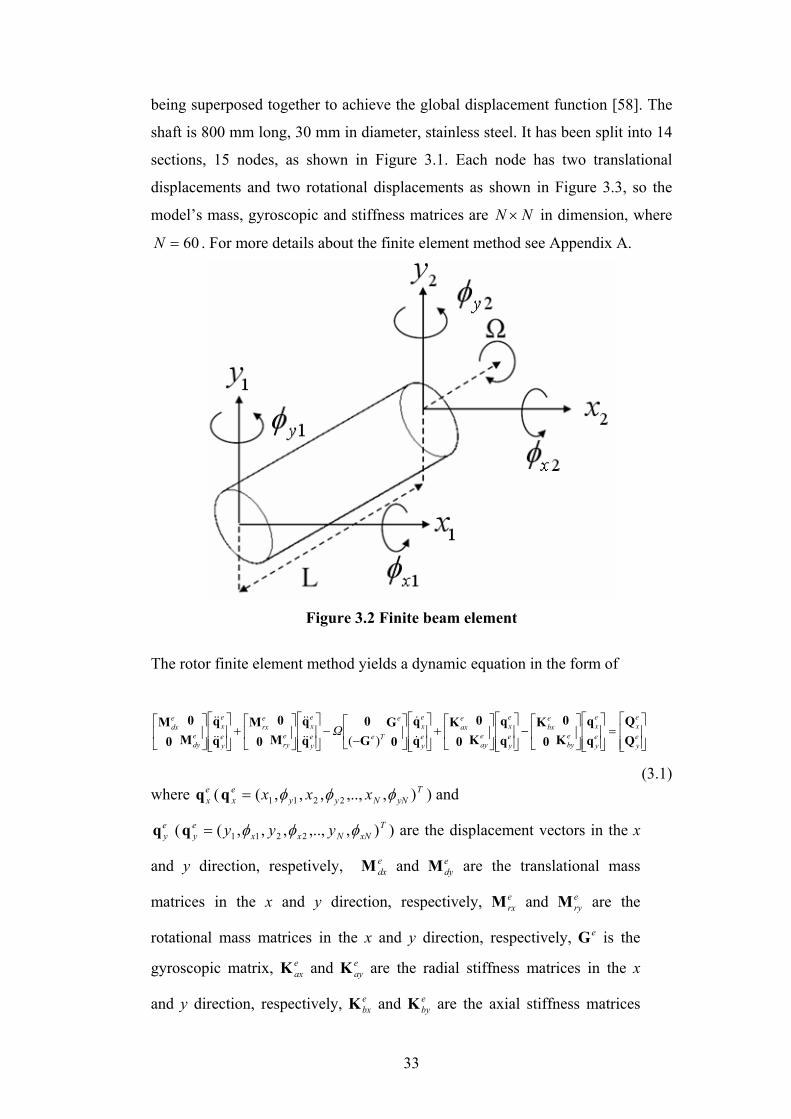
being superposed together to achieve the global displacement function [58]. The
shaft is 800 mm long, 30 mm in diameter, stainless steel. It has been split into 14
sections, 15 nodes, as shown in Figure 3.1. Each node has two translational
displacements and two rotational displacements as shown in Figure 3.3, so the
model’s mass, gyroscopic and stiffness matrices are NN × in dimension, where
60=N . For more details about the finite element method see Appendix A.
Figure 3.2 Finite beam element
The rotor finite element method yields a dynamic equation in the form of
⎢⎢⎣
⎡
⎥⎥⎦
⎤=
⎢⎢⎣
⎡
⎥⎥⎦
⎤⎥⎦
⎤⎢⎣
⎡−
⎢⎢⎣
⎡
⎥⎥⎦
⎤⎥⎦
⎤⎢⎣
⎡+
⎢⎢⎣
⎡
⎥⎥⎦
⎤⎥⎦
⎤⎢⎣
⎡−
−⎢⎢⎣
⎡
⎥⎥⎦
⎤⎥⎦
⎤⎢⎣
⎡+
⎢⎢⎣
⎡
⎥⎥⎦
⎤⎥⎦
⎤⎢⎣
⎡ey
ex
ey
ex
eby
ebx
ey
ex
eay
eax
ey
ex
e
Teey
ex
ery
erx
ey
ex
edy
edx Ω
K0
0K
K0
0K
0G
G0
M0
0M
M0
0M
&
&
&&
&&
&&
&&
)(
(3.1) where e
xq ( TyNNyy
ex xxx ),,..,,,,( 2211 φφφ=q ) and
eyq ( T
xNNxxey yyy ),,..,,,,( 2211 φφφ=q ) are the displacement vectors in the x
and y direction, respetively, edxM and e
dyM are the translational mass
matrices in the x and y direction, respectively, erxM and e
ryM are the
rotational mass matrices in the x and y direction, respectively, eG is the
gyroscopic matrix, eaxK and e
ayK are the radial stiffness matrices in the x
and y direction, respectively, ebxK and e
byK are the axial stiffness matrices
34
in the x and y direction, respectively, exQ and e
yQ are the unbalance
matrices in the x and y direction, respectively.
For disks attached to the rotor,
⎥⎦
⎤⎢⎣
⎡=⎥
⎦
⎤⎢⎣
⎡⎥⎦
⎤⎢⎣
⎡−
−⎥⎦
⎤⎢⎣
⎡⎥⎦
⎤⎢⎣
⎡
disky
diskx
disky
diskxdiskT
diskdisky
diskx
disky
diskx ΩQQ
0G
G0
M0
0M
&
&
&&
&&
)( (3.2)
where T
diskyNdiskNdiskydiskdiskydiskediskx xxx ),,..,,,,( 2211 φφφ=q and
TdiskxNdiskNdiskxdiskdiskxdisk
edisky yyy ),,..,,,,( 2211 φφφ=q
Normally, internal friction is not considered in finite element analysis as it has
little effect on rotor dynamics at low speed. It only becomes noticeable for high
speed applications. Sometimes, it can destabilise the rotor. The rotor system
including the effect from internal friction is derived by Zorzi and Nelson [59]:
( )⎢⎢⎣
⎡
⎥⎥⎦
⎤=
⎢⎢⎣
⎡
⎥⎥⎦
⎤
⎟⎟⎟
⎠
⎞
⎜⎜⎜
⎝
⎛
⎥⎥⎦
⎤
⎢⎢⎣
⎡−⎟⎟⎟
⎠
⎞
⎜⎜⎜
⎝
⎛
+
+++⎥
⎦
⎤⎢⎣
⎡
+
++⎥
⎦
⎤⎢⎣
⎡+
+⎢⎢⎣
⎡
⎥⎥⎦
⎤⎟⎟⎠
⎞⎜⎜⎝
⎛⎥⎦
⎤⎢⎣
⎡−
−⎥⎦
⎤⎢⎣
⎡+
⎢⎢⎣
⎡
⎥⎥⎦
⎤⎟⎟⎠
⎞⎜⎜⎝
⎛⎥⎦
⎤⎢⎣
⎡+⎥
⎦
⎤⎢⎣
⎡
ey
ex
ey
ex
ec
Tec
h
hve
by
ebx
h
heay
eax
ey
ex
e
Teeby
ebx
vey
ex
ery
erx
edy
edx
Ω
Ω
K0
0K
K0
0K
K0
0K
0G
G0
K0
0K
M0
0M
M0
0M
22 1
1
1
1
)(
η
ηη
η
η
η&
&
&&
&&
(3.3)
where all matrices in (3.1)-(3.3) are defined in Appendix A and Vη is the rotor
viscous damping, hη is the rotor hysteretic damping.
Due to the large size of matrices generated from the finite element analysis, it is
necessary to reduce the model size without changing the dynamic characteristics
within the operating speed range. To reduce the model size, the eigenvectors of
the original model are evaluated, then the eigenvector associated with high
frequencies are removed. In order to maintain the accuracy of the reduced order
model, eigenvectors with frequency below 3107.9 × rad/s were retained. The
model’s mass, gyroscopic and stiffness matrices were reduced to 2828× in
dimension. To assess the reduced model accuracy, the maximum singular values
are compared between the original model and the reduced order model. The
singular value is the square root of the eigenvalues of the self-adjoint operator,
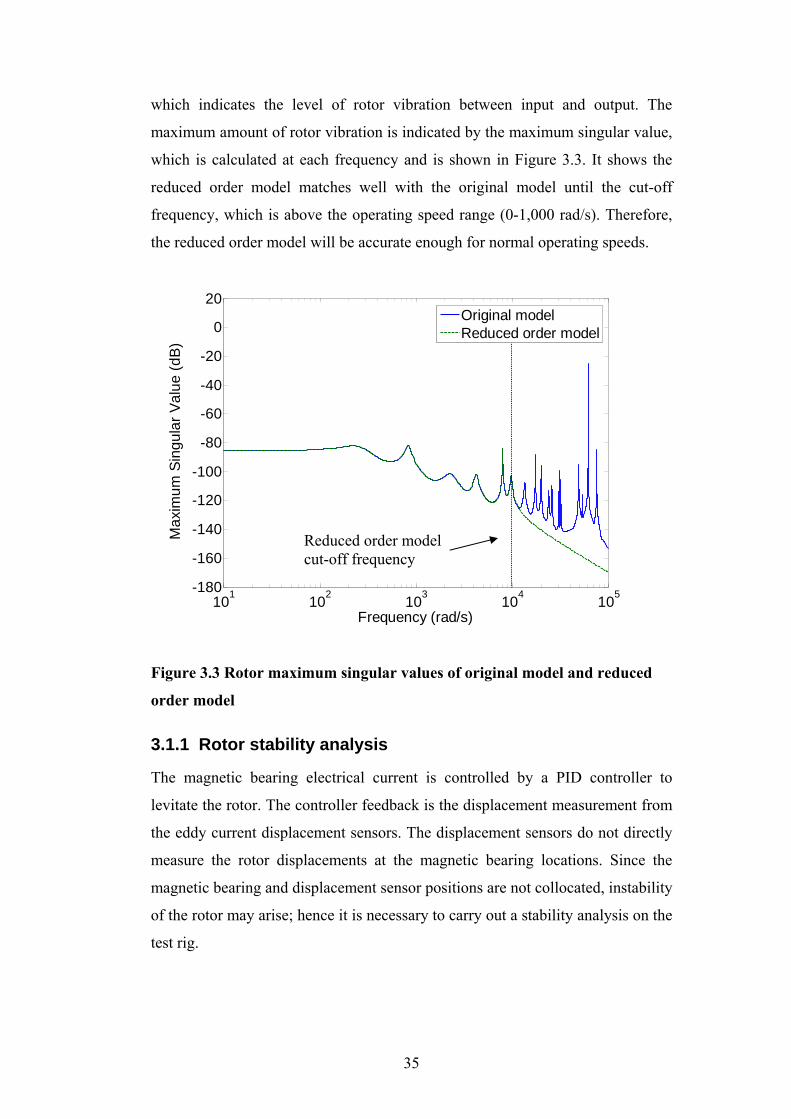
35
which indicates the level of rotor vibration between input and output. The
maximum amount of rotor vibration is indicated by the maximum singular value,
which is calculated at each frequency and is shown in Figure 3.3. It shows the
reduced order model matches well with the original model until the cut-off
frequency, which is above the operating speed range (0-1,000 rad/s). Therefore,
the reduced order model will be accurate enough for normal operating speeds.
101 102 103 104 105-180
-160
-140
-120
-100
-80
-60
-40
-20
0
20
Frequency (rad/s)
Max
imum
Sin
gula
r Val
ue (d
B)
Original modelReduced order model
Figure 3.3 Rotor maximum singular values of original model and reduced
order model
3.1.1 Rotor stability analysis
The magnetic bearing electrical current is controlled by a PID controller to
levitate the rotor. The controller feedback is the displacement measurement from
the eddy current displacement sensors. The displacement sensors do not directly
measure the rotor displacements at the magnetic bearing locations. Since the
magnetic bearing and displacement sensor positions are not collocated, instability
of the rotor may arise; hence it is necessary to carry out a stability analysis on the
test rig.
Reduced order model cut-off frequency
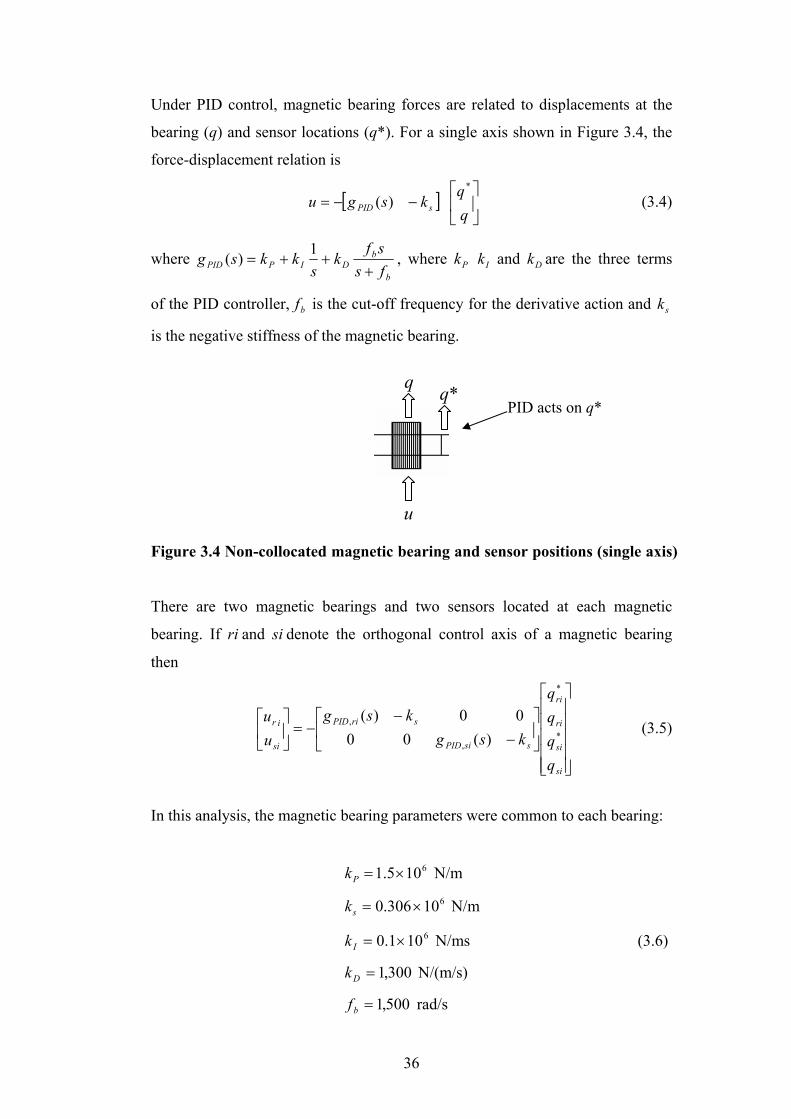
36
Under PID control, magnetic bearing forces are related to displacements at the
bearing (q) and sensor locations (q*). For a single axis shown in Figure 3.4, the
force-displacement relation is
[ ] ⎥⎦
⎤⎢⎣
⎡−−=
ksgu sPID
*
)( (3.4)
where b
bDIPPID fs
sfk
skksg
+++=
1)( , where Pk Ik and Dk are the three terms
of the PID controller, bf is the cut-off frequency for the derivative action and sk
is the negative stiffness of the magnetic bearing.
Figure 3.4 Non-collocated magnetic bearing and sensor positions (single axis)
There are two magnetic bearings and two sensors located at each magnetic
bearing. If ri and si denote the orthogonal control axis of a magnetic bearing
then
⎥⎥⎥⎥⎥
⎦
⎤
⎢⎢⎢⎢⎢
⎣
⎡
⎥⎦
⎤⎢⎣
⎡−
−−=⎥
⎦
⎤⎢⎣
⎡
si
si
ri
ri
ssiPID
sriPID
si
ir
qqqq
ksgksg
uu
*
*
,
,
)(0000)(
(3.5)
In this analysis, the magnetic bearing parameters were common to each bearing:
6105.1 ×=Pk N/m
610306.0 ×=sk N/m
6101.0 ×=Ik N/ms (3.6)
300,1=Dk N/(m/s)
500,1=bf rad/s
q q*
u
PID acts on q*
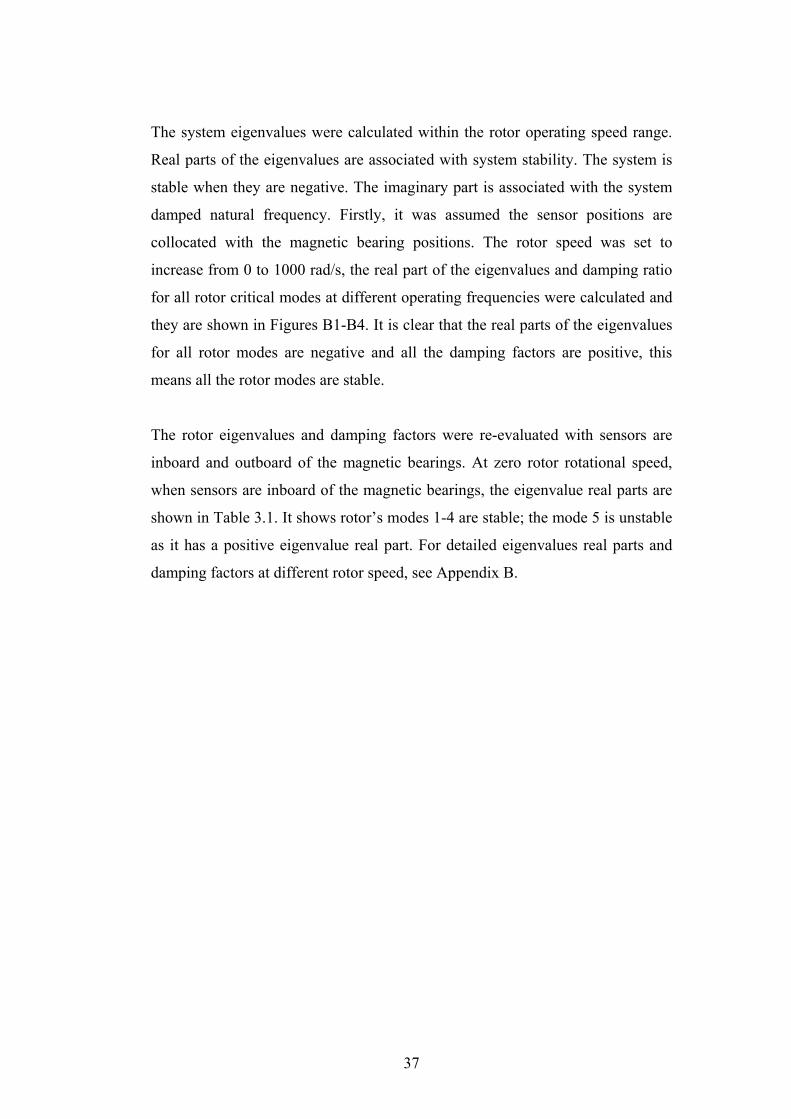
37
The system eigenvalues were calculated within the rotor operating speed range.
Real parts of the eigenvalues are associated with system stability. The system is
stable when they are negative. The imaginary part is associated with the system
damped natural frequency. Firstly, it was assumed the sensor positions are
collocated with the magnetic bearing positions. The rotor speed was set to
increase from 0 to 1000 rad/s, the real part of the eigenvalues and damping ratio
for all rotor critical modes at different operating frequencies were calculated and
they are shown in Figures B1-B4. It is clear that the real parts of the eigenvalues
for all rotor modes are negative and all the damping factors are positive, this
means all the rotor modes are stable.
The rotor eigenvalues and damping factors were re-evaluated with sensors are
inboard and outboard of the magnetic bearings. At zero rotor rotational speed,
when sensors are inboard of the magnetic bearings, the eigenvalue real parts are
shown in Table 3.1. It shows rotor’s modes 1-4 are stable; the mode 5 is unstable
as it has a positive eigenvalue real part. For detailed eigenvalues real parts and
damping factors at different rotor speed, see Appendix B.

38
Table 3.1 Rotor and magnetic bearing system damping factors and eigenvalue real parts when the sensors are inboard of the magnetic bearings
Mode Number Frequency (rad/s) Eigenvalue Real Part Stability 1 2.482E+02 -3.739E+01 Stable 2 4.746E+02 -7.441E+01 Stable 3 9.868E+02 -1.069E+02 Stable 4 2.436E+03 -5.739E+01 Stable 5 4.190E+03 3.574E+00 Unstable 6 7.993E+03 -2.074E+00 Stable 7 9.758E+03 -2.220E+00 Stable 8 1.338E+04 1.874E+00 Unstable 9 1.730E+04 3.900E-01 Unstable 10 1.986E+04 -6.870E-02 Stable 11 2.400E+04 6.559E-01 Unstable 12 2.574E+04 3.003E-01 Unstable 13 3.046E+04 1.024E-01 Unstable 14 3.205E+04 1.611E-01 Unstable 15 4.909E+04 5.997E-06 Unstable 16 4.909E+04 -3.640E-04 Stable 17 5.287E+04 9.154E-02 Unstable 18 5.373E+04 9.039E-02 Unstable 19 6.104E+04 1.963E-07 Unstable 20 6.104E+04 2.496E-07 Unstable 21 7.556E+04 3.821E-04 Unstable 22 7.556E+04 3.971E-04 Unstable 23 1.391E+05 -2.675E-03 Stable 24 1.404E+05 -2.911E-03 Stable 25 2.388E+05 4.647E-04 Unstable 26 2.389E+05 3.645E-04 Unstable 27 2.495E+05 -2.829E-03 Stable 28 2.528E+05 -2.615E-03 Stable 29 3.816E+05 5.821E-11 Unstable 30 3.816E+05 4.184E-11 Unstable
Further analysis was carried out when sensors are outboard of the magnetic
bearings. At zero rotational speed, the results in terms of eigenvalues real parts
are shown Table 3.2. It shows rotor’s modes 1-5 are stable, more stable
compared with the inboard arrangement. It also shows modes 6 and 7 are
unstable, but their frequencies are too high to get excited due to amplifier
bandwidth. The eigenvalues can be affected by the rotational speed slightly, for
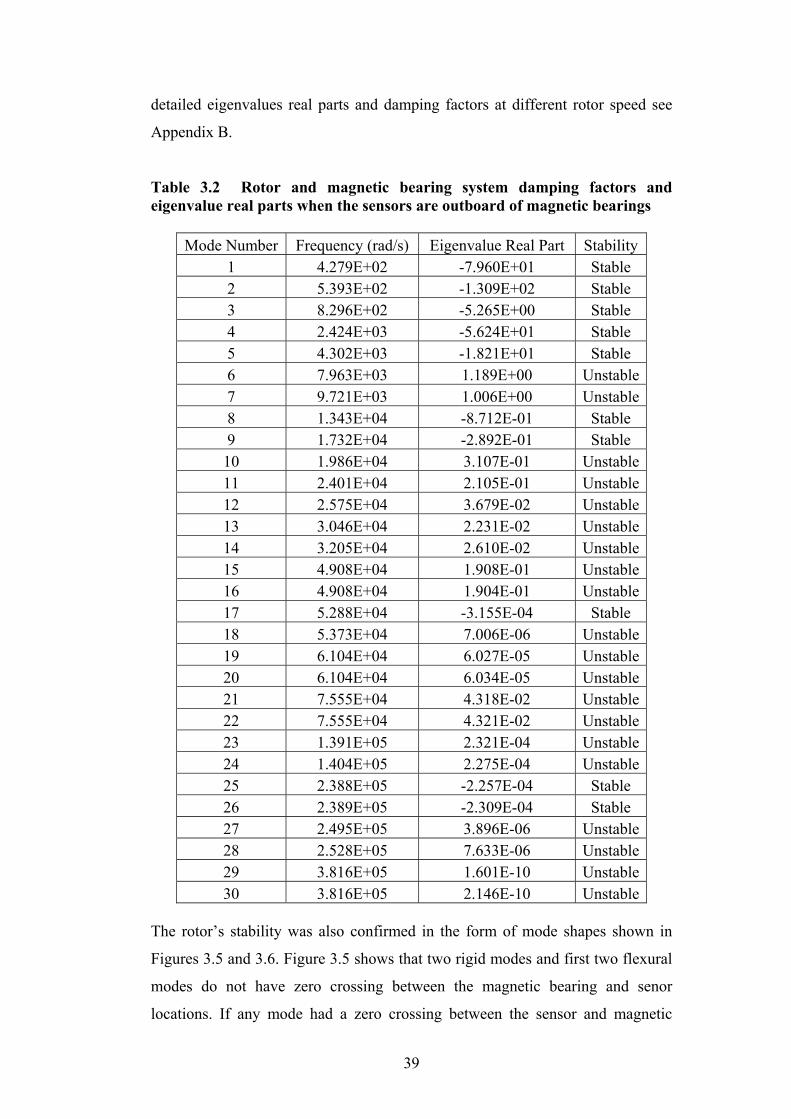
39
detailed eigenvalues real parts and damping factors at different rotor speed see
Appendix B.
Table 3.2 Rotor and magnetic bearing system damping factors and eigenvalue real parts when the sensors are outboard of magnetic bearings
Mode Number Frequency (rad/s) Eigenvalue Real Part Stability 1 4.279E+02 -7.960E+01 Stable 2 5.393E+02 -1.309E+02 Stable 3 8.296E+02 -5.265E+00 Stable 4 2.424E+03 -5.624E+01 Stable 5 4.302E+03 -1.821E+01 Stable 6 7.963E+03 1.189E+00 Unstable 7 9.721E+03 1.006E+00 Unstable 8 1.343E+04 -8.712E-01 Stable 9 1.732E+04 -2.892E-01 Stable 10 1.986E+04 3.107E-01 Unstable 11 2.401E+04 2.105E-01 Unstable 12 2.575E+04 3.679E-02 Unstable 13 3.046E+04 2.231E-02 Unstable 14 3.205E+04 2.610E-02 Unstable 15 4.908E+04 1.908E-01 Unstable 16 4.908E+04 1.904E-01 Unstable 17 5.288E+04 -3.155E-04 Stable 18 5.373E+04 7.006E-06 Unstable 19 6.104E+04 6.027E-05 Unstable 20 6.104E+04 6.034E-05 Unstable 21 7.555E+04 4.318E-02 Unstable 22 7.555E+04 4.321E-02 Unstable 23 1.391E+05 2.321E-04 Unstable 24 1.404E+05 2.275E-04 Unstable 25 2.388E+05 -2.257E-04 Stable 26 2.389E+05 -2.309E-04 Stable 27 2.495E+05 3.896E-06 Unstable 28 2.528E+05 7.633E-06 Unstable 29 3.816E+05 1.601E-10 Unstable 30 3.816E+05 2.146E-10 Unstable
The rotor’s stability was also confirmed in the form of mode shapes shown in
Figures 3.5 and 3.6. Figure 3.5 shows that two rigid modes and first two flexural
modes do not have zero crossing between the magnetic bearing and senor
locations. If any mode had a zero crossing between the sensor and magnetic
40
bearing, the sensor measurement and actual displacement at the magnetic bearing
position would be 180o out of phase. As the magnetic bearing controller uses
sensor signals with 180o phase differences would result instability. It is the
equivalent of applying negative stiffness to the rotor through the magnetic
bearings. Figure 3.6 shows that mode 5 has zero crossings between magnetic
bearings and sensors if they were arranged inboard of the magnetic bearings,
while it shows no crossing if the sensors are arranged outboard of the magnetic
bearings. It also shows that there are zero crossings for mode 6 if the sensors are
arranged outboard. Mode 6 has a natural frequency of 7,900 rad/s, which is too
high to get excited as it is above the amplifier bandwidth.
0 0.2 0.4 0.6 0.8-0.1
-0.05
0
0.05
0.1
Rotor Length (m)
Mode1 Mode2 Mode3 Mode4
Figure 3.5 Rotor mode shapes for modes 1 to 4
Inboard Sensor Outboard
Sensor AMB
41
0 0.2 0.4 0.6 0.8
0.05
0
-0.05Rotor Length (m)
Mode 5Mode 6
Figure 3.6 Rotor mode shapes for modes 5 and 6
3.2 Magnetic bearing modelling
A magnetic bearing is a device to levitate a rotor. The electrical current is
automatically corrected by a controller based on the measured rotor radial
displacements. The relationship between electrical current, measured rotor
positions and resultant magnetic bearing force is given by equations (2.6) and
(2.8). The linearised equation (2.6) will be less accurate compared to equation
(2.8), when the rotor radial displacement is large. Hence the magnetic bearing
force is modelled using equation (2.8).
The total magnetic bearing force will be a 14× vector:
⎥⎥⎥⎥⎥
⎦
⎤
⎢⎢⎢⎢⎢
⎣
⎡
=
yB
yA
xB
xA
ffff
mf (3.7)
where xAf and xBf are the magnetic bearing forces in x direction at magnetic
bearings A and B respectively, and yAf and yBf are the magnetic bearing forces
in y direction at magnetic bearings A and B, respectively.
Inbound Sensor
Outbound Sensor
AMB
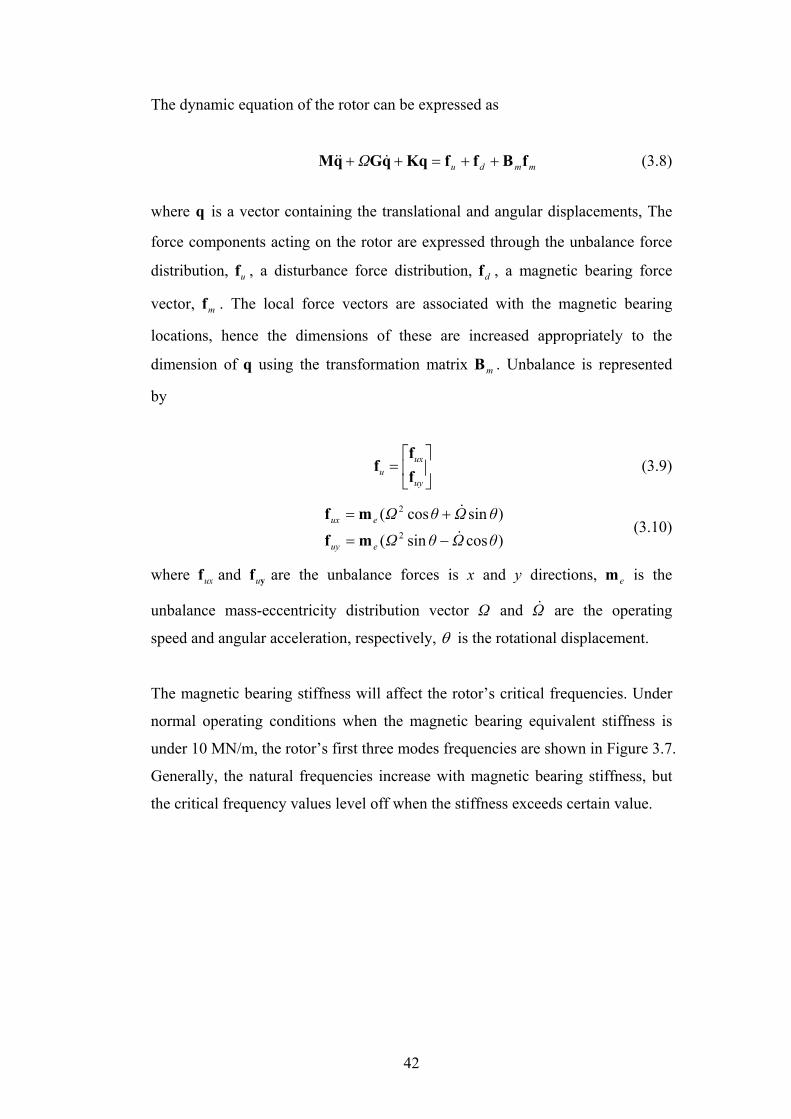
42
The dynamic equation of the rotor can be expressed as
mmduΩ fBffKqqGqM ++=++ &&& (3.8)
where q is a vector containing the translational and angular displacements, The
force components acting on the rotor are expressed through the unbalance force
distribution, uf , a disturbance force distribution, df , a magnetic bearing force
vector, mf . The local force vectors are associated with the magnetic bearing
locations, hence the dimensions of these are increased appropriately to the
dimension of q using the transformation matrix mB . Unbalance is represented
by
⎥⎦
⎤⎢⎣
⎡=
uy
uxu f
ff (3.9)
)cossin(
)sincos(2
2
θΩθΩ
θΩθΩ
euy
eux
&
&
−=
+=
mf
mf (3.10)
where uxf and yfu are the unbalance forces is x and y directions, em is the
unbalance mass-eccentricity distribution vector Ω and Ω& are the operating
speed and angular acceleration, respectively, θ is the rotational displacement.
The magnetic bearing stiffness will affect the rotor’s critical frequencies. Under
normal operating conditions when the magnetic bearing equivalent stiffness is
under 10 MN/m, the rotor’s first three modes frequencies are shown in Figure 3.7.
Generally, the natural frequencies increase with magnetic bearing stiffness, but
the critical frequency values level off when the stiffness exceeds certain value.
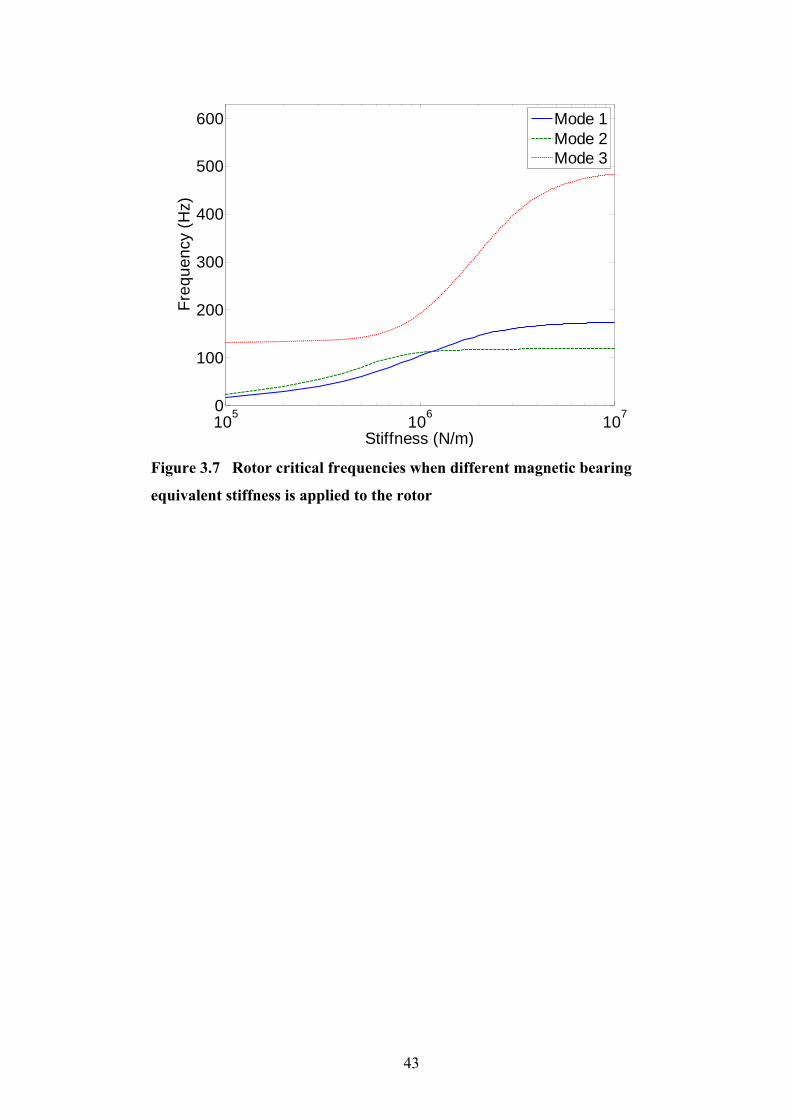
43
105 106 1070
100
200
300
400
500
600
Stiffness (N/m)
Freq
uenc
y (H
z)
Mode 1Mode 2Mode 3
Figure 3.7 Rotor critical frequencies when different magnetic bearing
equivalent stiffness is applied to the rotor
44
3.3 Touchdown bearing modelling As explained in Section 2.7, the active touchdown bearing motion is controlled
by the movement of four pistons, which are pushed by four piezoelectric stack
actuators. The movement of the touchdown bearing in each direction is
determined by the force difference between two opposing pistons. The simplified
touchdown bearing model is shown in Figure 3.8, which has stiffness and
damping in x and y direction.
Figure 3.8 Touchdown bearing simulation model
Control force from a piezoelectric actuator is applied to drive a piston. The
hydraulic piston stiffness is very high due to the high bulk modulus of the
hydraulic fluid. The touchdown bearing moves to the desired position with
minimum time delay when the position demand is applied to the touchdown
bearing. When no contact occurs, the equation of motion for each touchdown
bearing is
tbttbttttttt qKqCqKqCqm +=++ &&&& (3.11)
Rotor
Touchdown bearing
rδ
Ω cf
cfμ tK
tC
Piston
45
where tm is the mass of the touchdown bearing, tq and tbq are the touchdown
bearing displacement and touchdown bearing base displacement respectively,
and tC and tK are the touchdown bearing damping and stiffness, respectively.
When the rotor makes contact with a touchdown bearing, the equation of motion
for touchdown bearing becomes
cctbttbttttttt ffqKqCqKqCqm μ+++=++ &&&& (3.12)
where cf is the normal contact force. The contact force between rotor and
touchdown bearing may be evaluated using a Hertzian contact model [60].
Consider a single contact plane in which rδ is the radial displacement of the
rotor relative to the touchdown bearing. Contact occurs when its radial clearance
is exceeded:
ttr cqqr ≥−=δ (3.13)
where rδ is the rotor movement relative to the touchdown bearing, and tc
is the clearance gap between the rotor and the touchdown bearing.
The relationship between the radial contact depth and the contact force, at a
single location is given by the simplified equation
⎟⎟⎠
⎞⎜⎜⎝
⎛+
−=−
c
tt
t
ctr f
lEcEl
fc 23.4
32ln
32)1(2
πν
δ (3.14)
where E is Young’s modulus, ν is the Poisson’s ratio, tl is the length of the
touchdown bearing. The contact force is determined by using an inverse
numerical method. The metal to metal contact penetration level tr c−δ is
calculated using already known contact force ranging from 0 to 80,000 N. Then
the relationship between tr c−δ and contact force is implemented in the form of a
look-up table in simulation. The contact force variation with the contact
penetration is shown in Figure 3.9.

46
0 0.2 0.4 0.6 0.8 1
x 10-4
0
1
2
3
4
5
6
7
8x 10⁴
(m)
Con
tact
For
ce (N
)
Figure 3.9 The relationship between contact force and the metal to metal
penetration level
The touchdown bearing base motion is generated by the movement of a
piezoelectric actuator, then the movement is transmitted to the touchdown
bearing through the hydraulic line. For simulation purpose, hydraulic losses were
not considered.
As shown in Section 2.7, the displacement for each piezoelectric actuator
displacement is derived from equation (2.12):
810042.1500,12
×−
=fVx (3.15)
where V is the supply voltage to the piezoelectric actuator, and f is the actuator
force.
tr c−δ
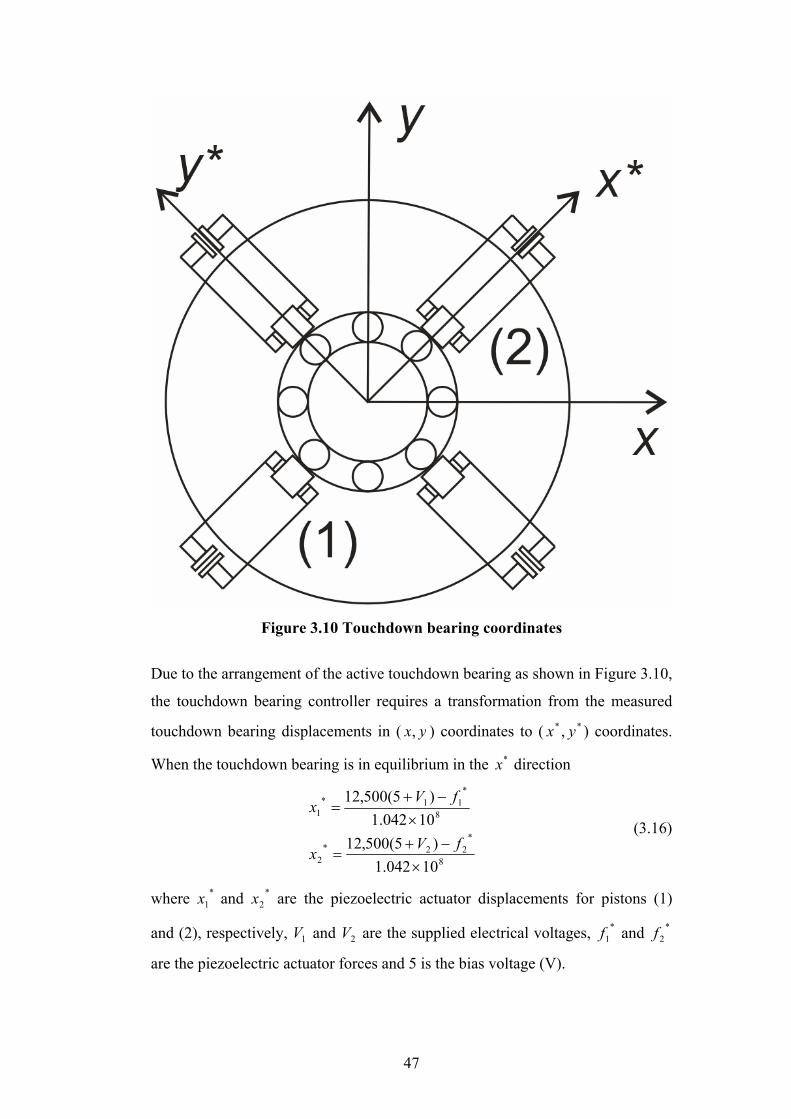
47
Figure 3.10 Touchdown bearing coordinates
Due to the arrangement of the active touchdown bearing as shown in Figure 3.10,
the touchdown bearing controller requires a transformation from the measured
touchdown bearing displacements in ( yx, ) coordinates to ( ** , yx ) coordinates.
When the touchdown bearing is in equilibrium in the *x direction
8
*22*
2
8
*11*
1
10042.1)5(500,12
10042.1)5(500,12
×−+
=
×−+
=
fVx
fVx
(3.16)
where *1x and *
2x are the piezoelectric actuator displacements for pistons (1)
and (2), respectively, 1V and 2V are the supplied electrical voltages, *1f and *
2f
are the piezoelectric actuator forces and 5 is the bias voltage (V).
48
When the touchdown bearing is at its nominal equilibrium position *
2*
1 xx = (3.17)
*2
*1 ff = (3.18)
If the touchdown bearing moves *x mm in the positive *x direction and force *f in the positive *x direction is required from the piezoelectric actuators to
compensate other external forces acting on the touchdown bearing, then **
2*
1 2xxx =− (3.19)
**2
*1 fff =− (3.20)
Combining equations (3.16), (3.19) and (3.20)
500,12
10084.2 **8
21fxVV −×
=− (3.21)
Hence, the input voltages to the piezoelectric actuators in the opposing direction
become
500,122
10042.1
500,122
10042.1
**8
2
**8
1
fxV
fxV
−×−=
−×=
(3.22)
When the rotor makes contact with a touchdown bearing, the touchdown bearing
stiffness will affect rotor’s natural frequencies. In order to investigate the effect
of touchdown bearing stiffness on rotor critical frequencies, the touchdown
bearing stiffness was applied to the rotor directly without consideration of
magnetic bearing stiffness. The first three modal frequencies are shown in Figure
3.11. The touchdown bearing stiffness was applied to the rotor at different
positions compared with the magnetic bearing stiffness.
Figures 3.7 and 3.11 show that the first mode critical frequency increases with
stiffness and saturated at around 710 N/m; the critical frequency is higher when
the stiffness is applied at the magnetic bearing locations at 710 N/m. The Mode 2
critical frequency can be seriously affected by the stiffness locations. The critical
frequency for Mode 2 saturates at stiffness of 610 N/m when it is applied at the
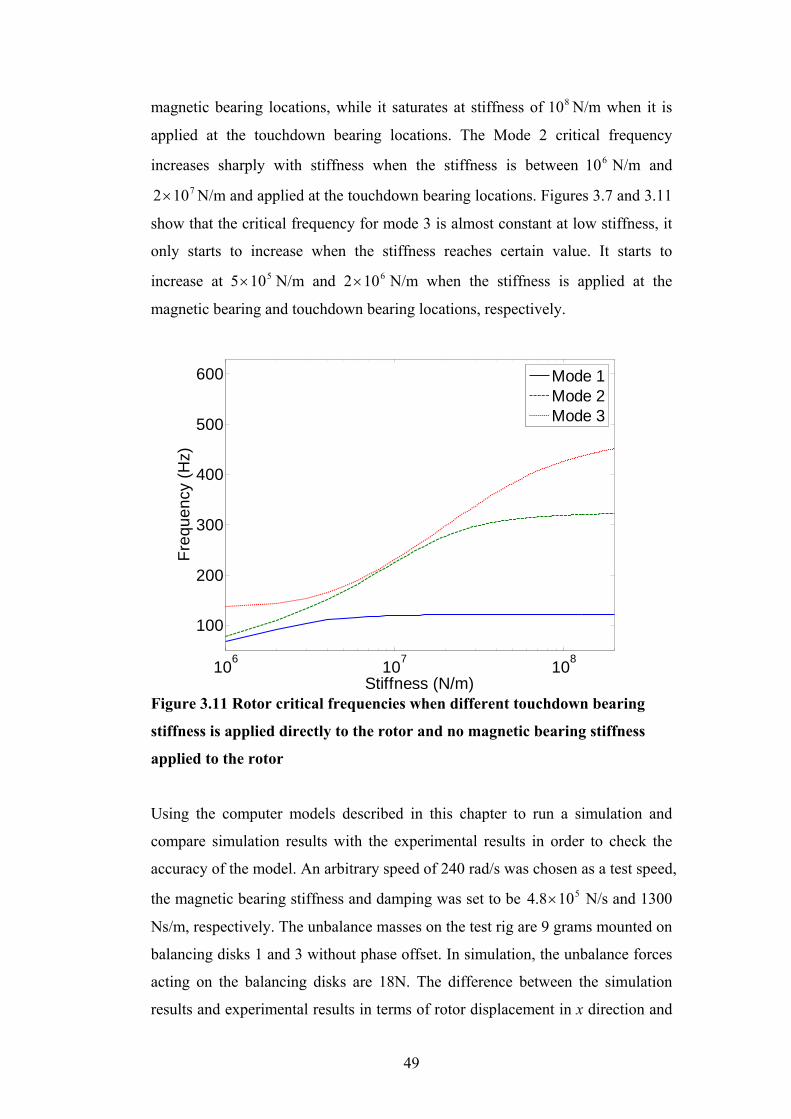
49
magnetic bearing locations, while it saturates at stiffness of 810 N/m when it is
applied at the touchdown bearing locations. The Mode 2 critical frequency
increases sharply with stiffness when the stiffness is between 610 N/m and 7102× N/m and applied at the touchdown bearing locations. Figures 3.7 and 3.11
show that the critical frequency for mode 3 is almost constant at low stiffness, it
only starts to increase when the stiffness reaches certain value. It starts to
increase at 5105× N/m and 6102× N/m when the stiffness is applied at the
magnetic bearing and touchdown bearing locations, respectively.
106 107 108
100
200
300
400
500
600
Stiffness (N/m)
Freq
uenc
y (H
z)
Mode 1Mode 2Mode 3
Figure 3.11 Rotor critical frequencies when different touchdown bearing
stiffness is applied directly to the rotor and no magnetic bearing stiffness
applied to the rotor
Using the computer models described in this chapter to run a simulation and
compare simulation results with the experimental results in order to check the
accuracy of the model. An arbitrary speed of 240 rad/s was chosen as a test speed,
the magnetic bearing stiffness and damping was set to be 5108.4 × N/s and 1300
Ns/m, respectively. The unbalance masses on the test rig are 9 grams mounted on
balancing disks 1 and 3 without phase offset. In simulation, the unbalance forces
acting on the balancing disks are 18N. The difference between the simulation
results and experimental results in terms of rotor displacement in x direction and

50
radial displacement are shown in Figures 3.12 and 3.13, respectively. Figure 3.12
shows that both experimental and simulation results are stable and have the same
vibration frequencies. It also shows that the experimental results have slightly
larger amplitude, which is also confirmed by the radial displacement results
shown in Figure 3.13. The larger radial displacement might be caused by larger
unbalance level on the rotor, the actual unbalance on the rotor might be slightly
larger than attached unbalance mass of 9 gram due to some residual unbalance on
the rotor. Figure 3.15 also shows some fluctuation on the radial displacement; it
might be caused by electrical noise in the measurement signal or additional
amplified vibration in the system.
0 0.5 1 2.5 2 2.5-0.2
-0.1
0
0.1
0.2
Time (s)
Dis
plac
emen
t (m
m)
Experimental dataSimulation data
Figure 3.12 Rotor displacement in x direction comparison between
experimental results and simulation results at 240 rad/s, when the magnetic
bearing stiffness and damping are 5104.8× N/s and 1300 Ns/m, respectively

51
0 0.5 1 1.5 2 2.50
0.05
0.1
0.15
0.2
Time (s)
Rad
ial D
ispl
acem
ent (
mm
)
Experimental dataSimulation data
Figure 3.13 Rotor radial displacement comparison between experimental
results and simulation results at 240 rad/s, when the magnetic bearing
stiffness and damping are 5104.8× N/s and 1300 Ns/m, respectively
Using the rotor, active magnetic bearing and touchdown bearing model, a series
of simulations on rotor and touchdown bearing contact are carried out in this
Chapter. The effect from different parameters on rotor and touchdown bearing
contact are studied and listed in Table 3.3.
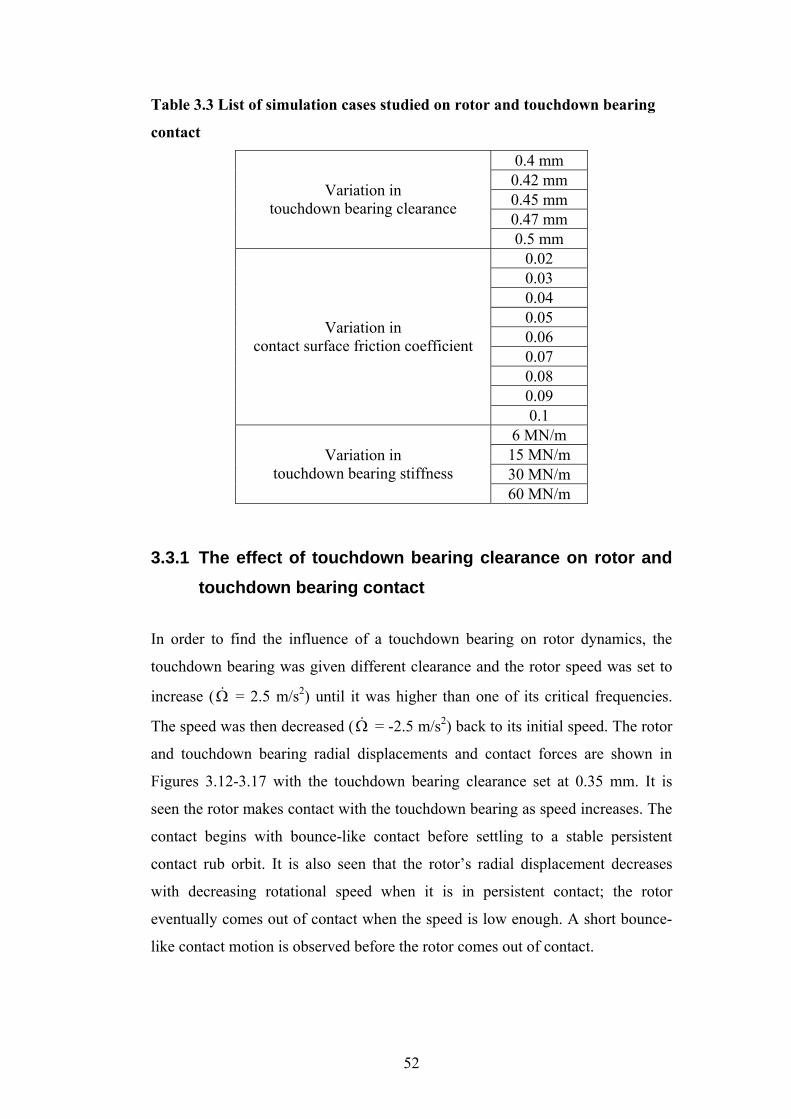
52
Table 3.3 List of simulation cases studied on rotor and touchdown bearing
contact
0.4 mm 0.42 mm 0.45 mm 0.47 mm
Variation in touchdown bearing clearance
0.5 mm 0.02 0.03 0.04 0.05 0.06 0.07 0.08 0.09
Variation in contact surface friction coefficient
0.1 6 MN/m 15 MN/m 30 MN/m
Variation in touchdown bearing stiffness
60 MN/m
3.3.1 The effect of touchdown bearing clearance on rotor and touchdown bearing contact
In order to find the influence of a touchdown bearing on rotor dynamics, the
touchdown bearing was given different clearance and the rotor speed was set to
increase (Ω& = 2.5 m/s2) until it was higher than one of its critical frequencies.
The speed was then decreased (Ω& = -2.5 m/s2) back to its initial speed. The rotor
and touchdown bearing radial displacements and contact forces are shown in
Figures 3.12-3.17 with the touchdown bearing clearance set at 0.35 mm. It is
seen the rotor makes contact with the touchdown bearing as speed increases. The
contact begins with bounce-like contact before settling to a stable persistent
contact rub orbit. It is also seen that the rotor’s radial displacement decreases
with decreasing rotational speed when it is in persistent contact; the rotor
eventually comes out of contact when the speed is low enough. A short bounce-
like contact motion is observed before the rotor comes out of contact.
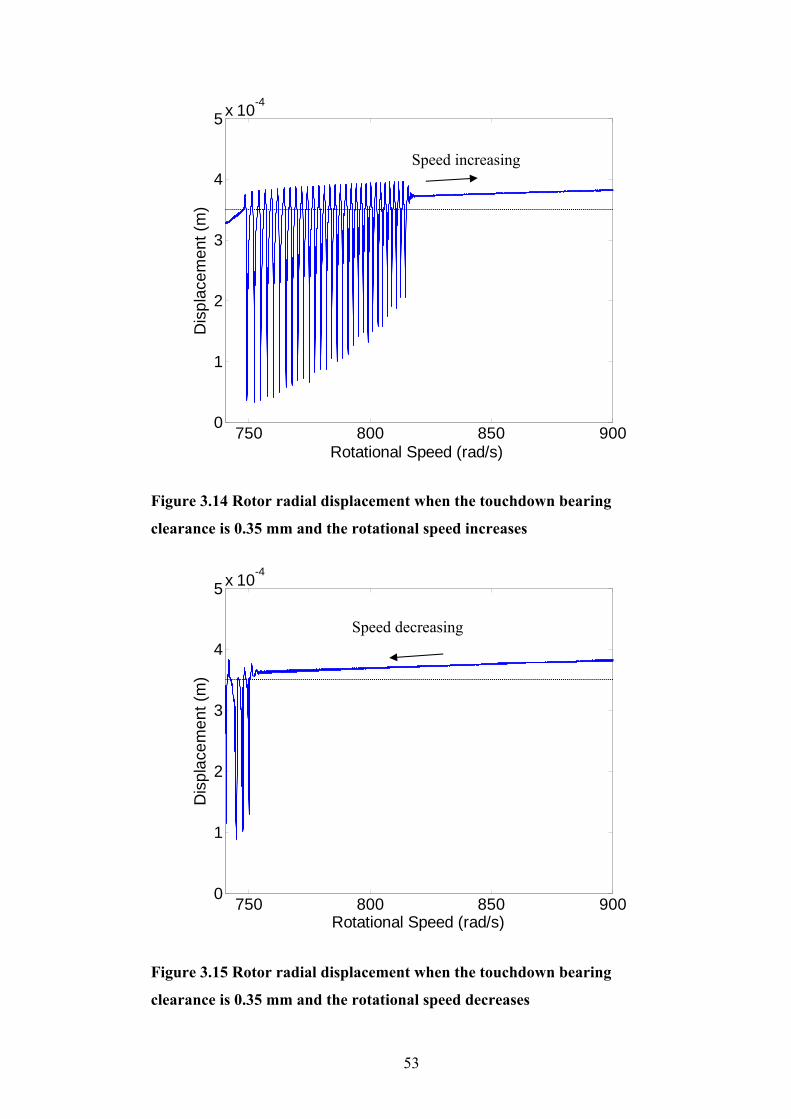
53
750 800 850 9000
1
2
3
4
5x 10⁻⁴
Rotational Speed (rad/s)
Dis
plac
emen
t (m
)
Figure 3.14 Rotor radial displacement when the touchdown bearing
clearance is 0.35 mm and the rotational speed increases
750 800 850 9000
1
2
3
4
5x 10⁻⁴
Rotational Speed (rad/s)
Dis
plac
emen
t (m
)
Figure 3.15 Rotor radial displacement when the touchdown bearing
clearance is 0.35 mm and the rotational speed decreases
Speed decreasing
Speed increasing
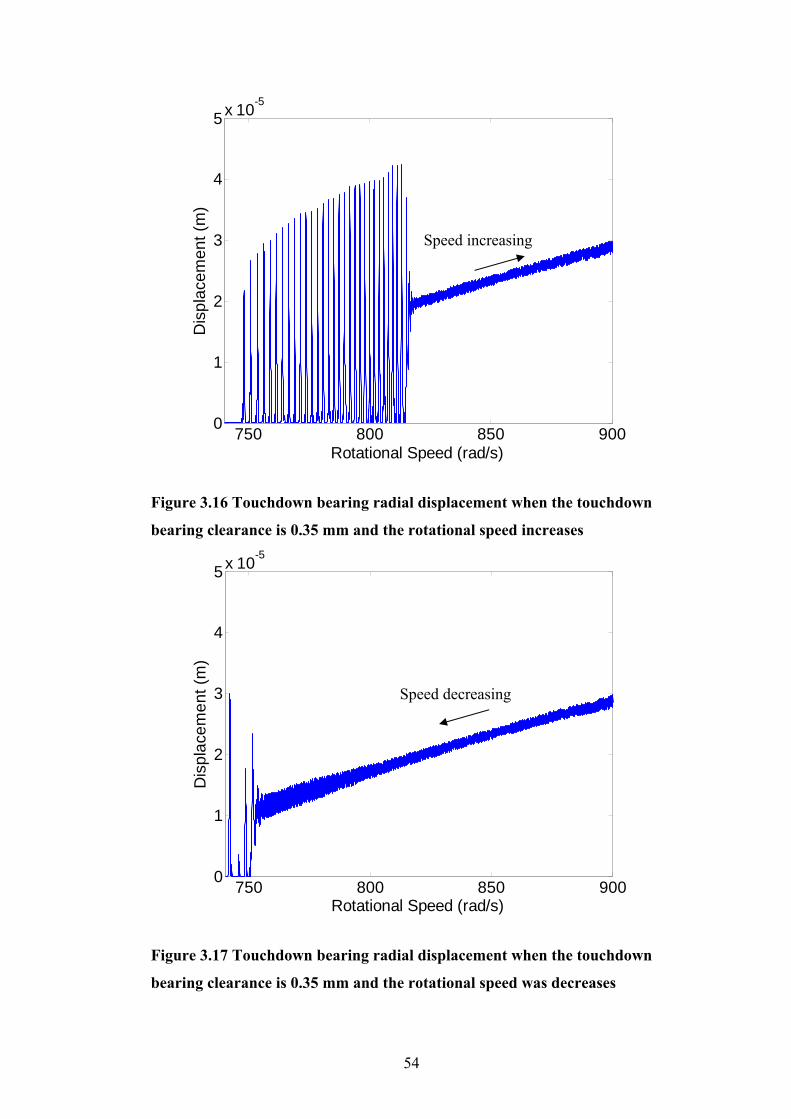
54
750 800 850 9000
1
2
3
4
5x 10⁻⁵
Rotational Speed (rad/s)
Dis
plac
emen
t (m
)
Figure 3.16 Touchdown bearing radial displacement when the touchdown
bearing clearance is 0.35 mm and the rotational speed increases
750 800 850 9000
1
2
3
4
5x 10⁻⁵
Rotational Speed (rad/s)
Dis
plac
emen
t (m
)
Figure 3.17 Touchdown bearing radial displacement when the touchdown
bearing clearance is 0.35 mm and the rotational speed was decreases
Speed increasing
Speed decreasing
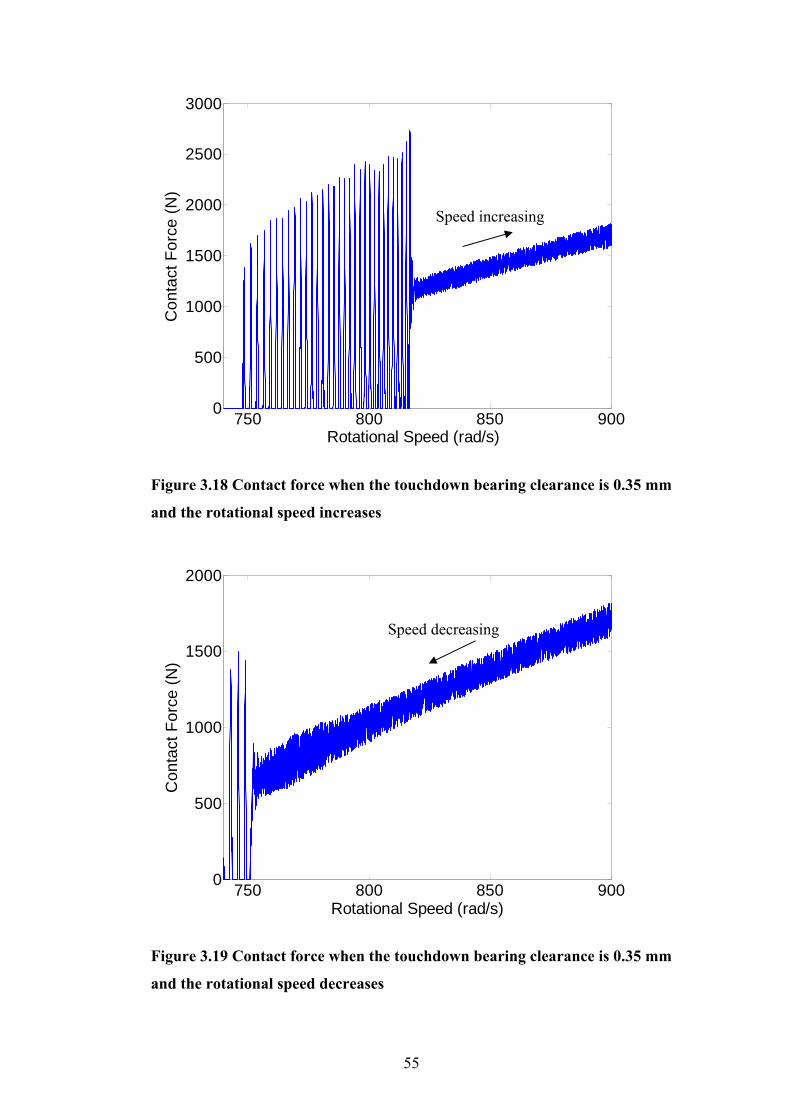
55
750 800 850 9000
500
1000
1500
2000
2500
3000
Rotational Speed (rad/s)
Con
tact
For
ce (N
)
Figure 3.18 Contact force when the touchdown bearing clearance is 0.35 mm
and the rotational speed increases
750 800 850 9000
500
1000
1500
2000
Rotational Speed (rad/s)
Con
tact
For
ce (N
)
Figure 3.19 Contact force when the touchdown bearing clearance is 0.35 mm
and the rotational speed decreases
Speed increasing
Speed decreasing
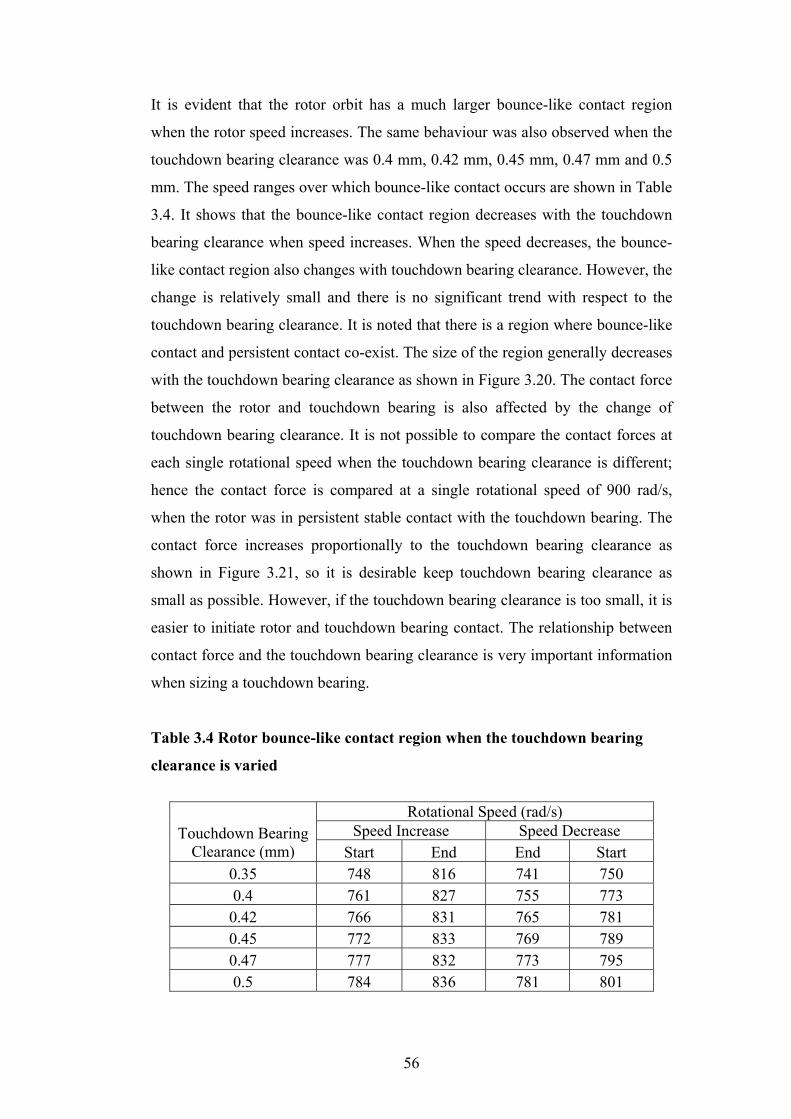
56
It is evident that the rotor orbit has a much larger bounce-like contact region
when the rotor speed increases. The same behaviour was also observed when the
touchdown bearing clearance was 0.4 mm, 0.42 mm, 0.45 mm, 0.47 mm and 0.5
mm. The speed ranges over which bounce-like contact occurs are shown in Table
3.4. It shows that the bounce-like contact region decreases with the touchdown
bearing clearance when speed increases. When the speed decreases, the bounce-
like contact region also changes with touchdown bearing clearance. However, the
change is relatively small and there is no significant trend with respect to the
touchdown bearing clearance. It is noted that there is a region where bounce-like
contact and persistent contact co-exist. The size of the region generally decreases
with the touchdown bearing clearance as shown in Figure 3.20. The contact force
between the rotor and touchdown bearing is also affected by the change of
touchdown bearing clearance. It is not possible to compare the contact forces at
each single rotational speed when the touchdown bearing clearance is different;
hence the contact force is compared at a single rotational speed of 900 rad/s,
when the rotor was in persistent stable contact with the touchdown bearing. The
contact force increases proportionally to the touchdown bearing clearance as
shown in Figure 3.21, so it is desirable keep touchdown bearing clearance as
small as possible. However, if the touchdown bearing clearance is too small, it is
easier to initiate rotor and touchdown bearing contact. The relationship between
contact force and the touchdown bearing clearance is very important information
when sizing a touchdown bearing.
Table 3.4 Rotor bounce-like contact region when the touchdown bearing
clearance is varied
Rotational Speed (rad/s)
Speed Increase Speed Decrease Touchdown Bearing Clearance (mm) Start End End Start
0.35 748 816 741 750 0.4 761 827 755 773 0.42 766 831 765 781 0.45 772 833 769 789 0.47 777 832 773 795 0.5 784 836 781 801
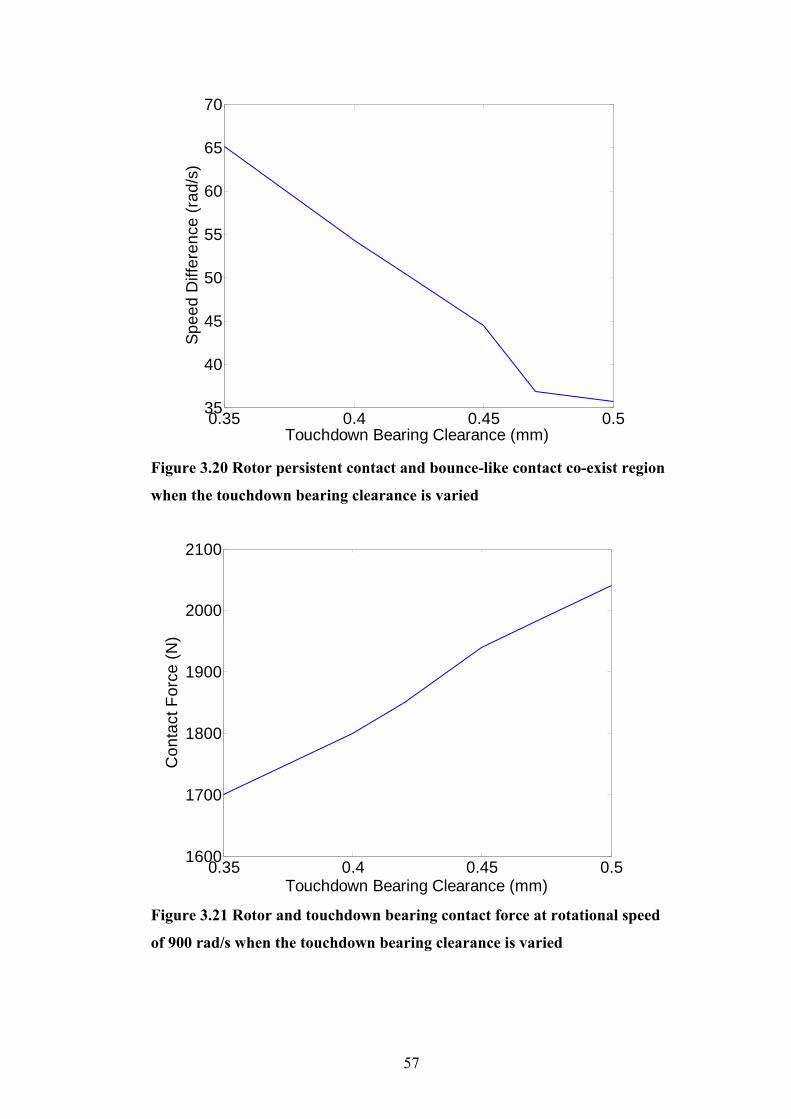
57
0.35 0.4 0.45 0.535
40
45
50
55
60
65
70
Touchdown Bearing Clearance (mm)
Spee
d D
iffer
ence
(rad
/s)
Figure 3.20 Rotor persistent contact and bounce-like contact co-exist region
when the touchdown bearing clearance is varied
0.35 0.4 0.45 0.51600
1700
1800
1900
2000
2100
Touchdown Bearing Clearance (mm)
Con
tact
For
ce (N
)
Figure 3.21 Rotor and touchdown bearing contact force at rotational speed
of 900 rad/s when the touchdown bearing clearance is varied
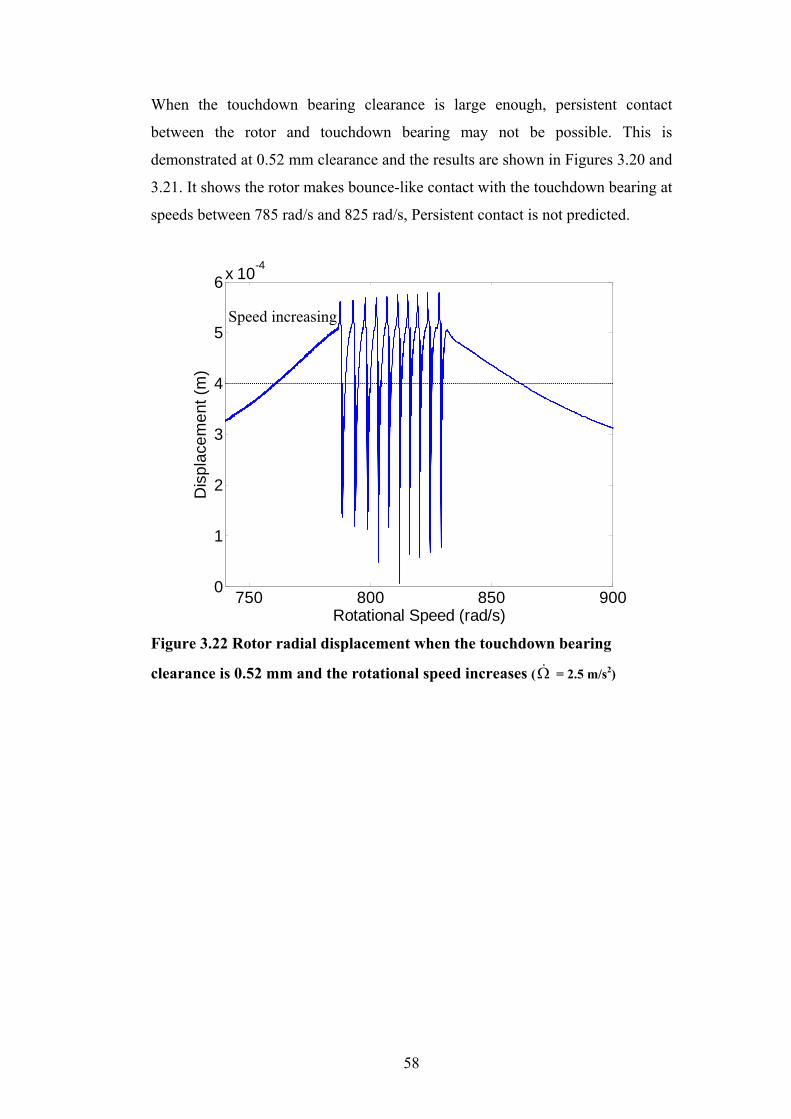
58
When the touchdown bearing clearance is large enough, persistent contact
between the rotor and touchdown bearing may not be possible. This is
demonstrated at 0.52 mm clearance and the results are shown in Figures 3.20 and
3.21. It shows the rotor makes bounce-like contact with the touchdown bearing at
speeds between 785 rad/s and 825 rad/s, Persistent contact is not predicted.
750 800 850 9000
1
2
3
4
5
6x 10⁻⁴
Rotational Speed (rad/s)
Dis
plac
emen
t (m
)
Figure 3.22 Rotor radial displacement when the touchdown bearing
clearance is 0.52 mm and the rotational speed increases (Ω& = 2.5 m/s2)
Speed increasing
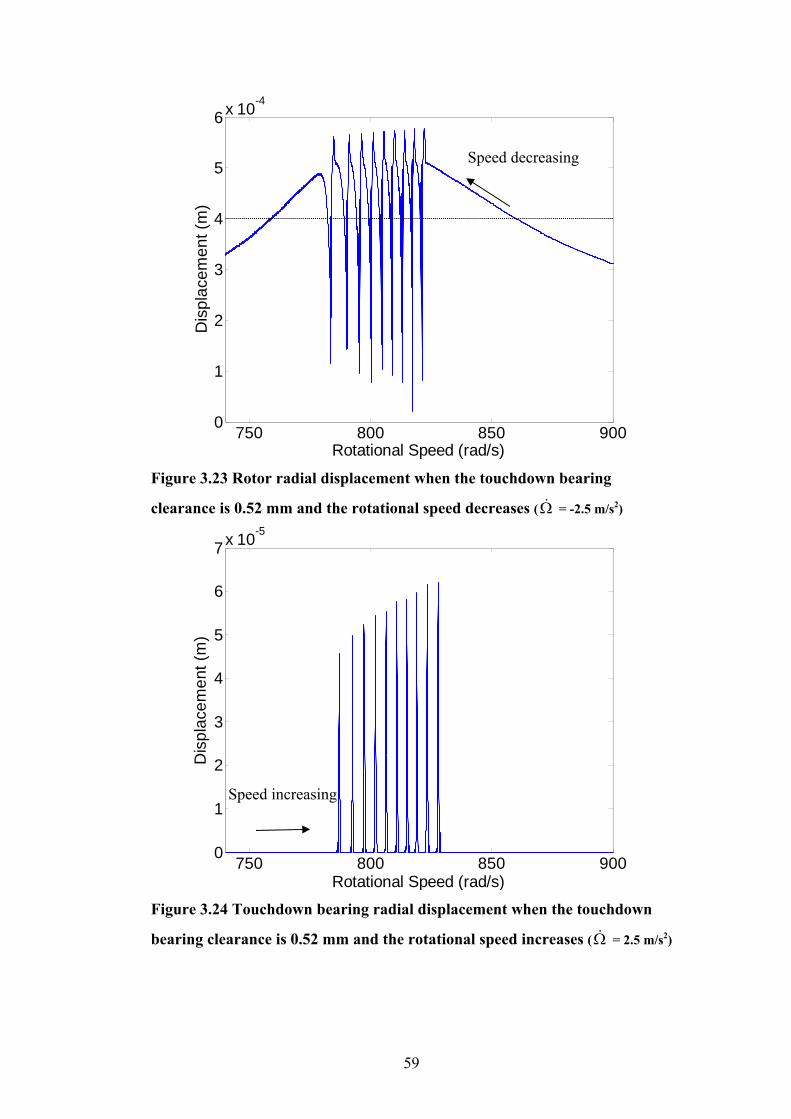
59
750 800 850 9000
1
2
3
4
5
6x 10⁻⁴
Rotational Speed (rad/s)
Dis
plac
emen
t (m
)
Figure 3.23 Rotor radial displacement when the touchdown bearing
clearance is 0.52 mm and the rotational speed decreases (Ω& = -2.5 m/s2)
750 800 850 9000
1
2
3
4
5
6
7x 10⁻⁵
Rotational Speed (rad/s)
Dis
plac
emen
t (m
)
Figure 3.24 Touchdown bearing radial displacement when the touchdown
bearing clearance is 0.52 mm and the rotational speed increases (Ω& = 2.5 m/s2)
Speed decreasing
Speed increasing
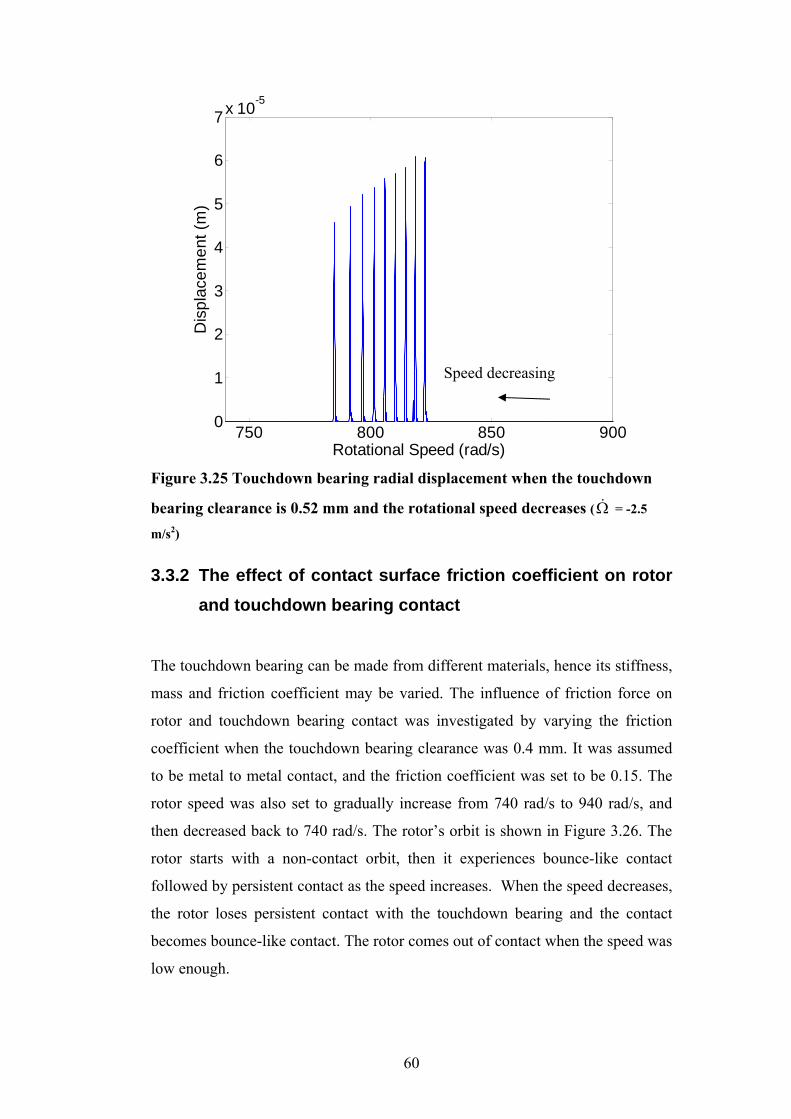
60
750 800 850 9000
1
2
3
4
5
6
7x 10⁻⁵
Rotational Speed (rad/s)
Dis
plac
emen
t (m
)
Figure 3.25 Touchdown bearing radial displacement when the touchdown
bearing clearance is 0.52 mm and the rotational speed decreases (Ω& = -2.5
m/s2)
3.3.2 The effect of contact surface friction coefficient on rotor and touchdown bearing contact
The touchdown bearing can be made from different materials, hence its stiffness,
mass and friction coefficient may be varied. The influence of friction force on
rotor and touchdown bearing contact was investigated by varying the friction
coefficient when the touchdown bearing clearance was 0.4 mm. It was assumed
to be metal to metal contact, and the friction coefficient was set to be 0.15. The
rotor speed was also set to gradually increase from 740 rad/s to 940 rad/s, and
then decreased back to 740 rad/s. The rotor’s orbit is shown in Figure 3.26. The
rotor starts with a non-contact orbit, then it experiences bounce-like contact
followed by persistent contact as the speed increases. When the speed decreases,
the rotor loses persistent contact with the touchdown bearing and the contact
becomes bounce-like contact. The rotor comes out of contact when the speed was
low enough.
Speed decreasing
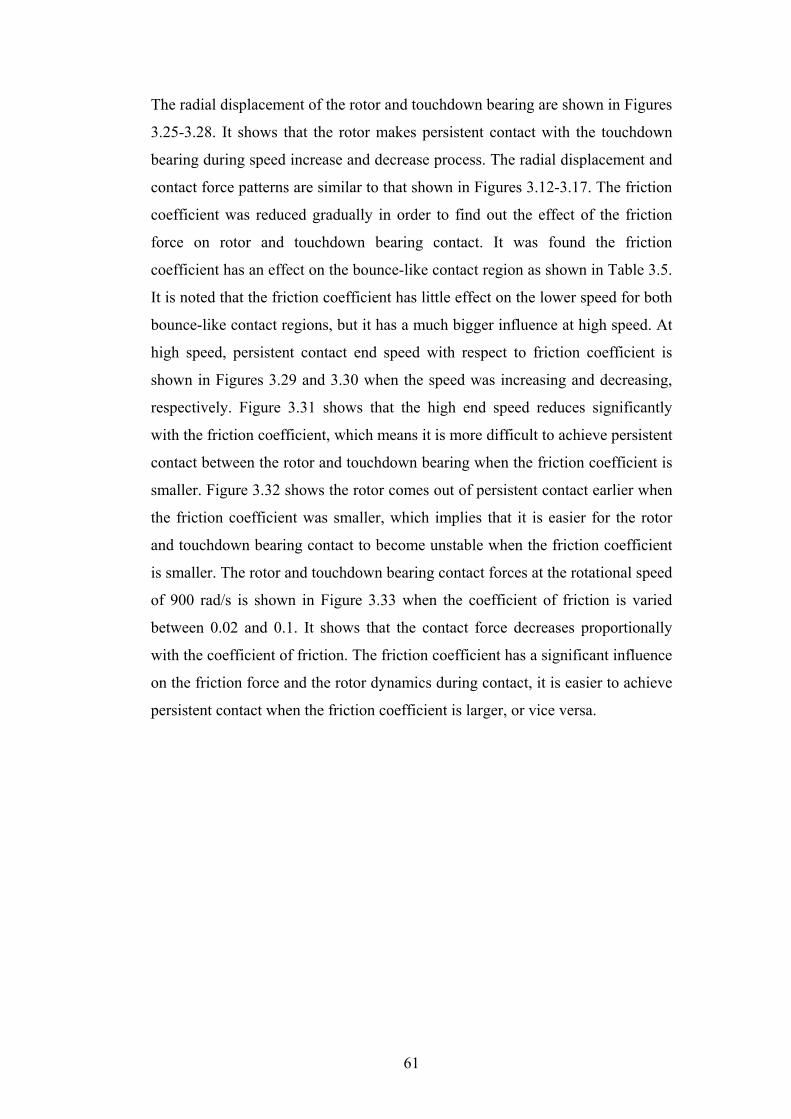
61
The radial displacement of the rotor and touchdown bearing are shown in Figures
3.25-3.28. It shows that the rotor makes persistent contact with the touchdown
bearing during speed increase and decrease process. The radial displacement and
contact force patterns are similar to that shown in Figures 3.12-3.17. The friction
coefficient was reduced gradually in order to find out the effect of the friction
force on rotor and touchdown bearing contact. It was found the friction
coefficient has an effect on the bounce-like contact region as shown in Table 3.5.
It is noted that the friction coefficient has little effect on the lower speed for both
bounce-like contact regions, but it has a much bigger influence at high speed. At
high speed, persistent contact end speed with respect to friction coefficient is
shown in Figures 3.29 and 3.30 when the speed was increasing and decreasing,
respectively. Figure 3.31 shows that the high end speed reduces significantly
with the friction coefficient, which means it is more difficult to achieve persistent
contact between the rotor and touchdown bearing when the friction coefficient is
smaller. Figure 3.32 shows the rotor comes out of persistent contact earlier when
the friction coefficient was smaller, which implies that it is easier for the rotor
and touchdown bearing contact to become unstable when the friction coefficient
is smaller. The rotor and touchdown bearing contact forces at the rotational speed
of 900 rad/s is shown in Figure 3.33 when the coefficient of friction is varied
between 0.02 and 0.1. It shows that the contact force decreases proportionally
with the coefficient of friction. The friction coefficient has a significant influence
on the friction force and the rotor dynamics during contact, it is easier to achieve
persistent contact when the friction coefficient is larger, or vice versa.
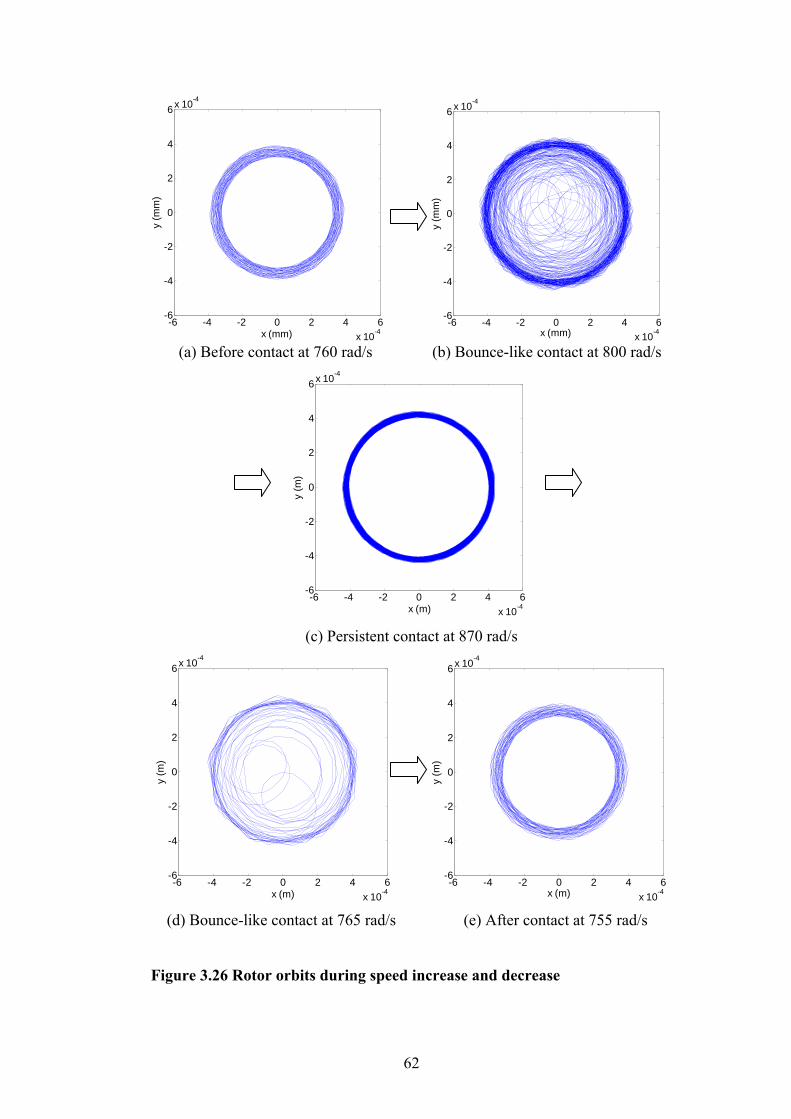
62
-6 -4 -2 0 2 4 6x 10⁻⁴
-6
-4
-2
0
2
4
6x 10⁻⁴
x (mm)
y (m
m)
-6 -4 -2 0 2 4 6
x 10-4
-6
-4
-2
0
2
4
6x 10⁻⁴
x (mm)
y (m
m)
(a) Before contact at 760 rad/s (b) Bounce-like contact at 800 rad/s
-6 -4 -2 0 2 4 6x 10⁻⁴
-6
-4
-2
0
2
4
6x 10⁻⁴
x (m)
y (m
)
(c) Persistent contact at 870 rad/s
-6 -4 -2 0 2 4 6x 10⁻⁴
-6
-4
-2
0
2
4
6x 10⁻⁴
x (m)
y (m
)
-6 -4 -2 0 2 4 6
x 10-4
-6
-4
-2
0
2
4
6x 10⁻⁴
x (m)
y (m
)
(d) Bounce-like contact at 765 rad/s (e) After contact at 755 rad/s
Figure 3.26 Rotor orbits during speed increase and decrease
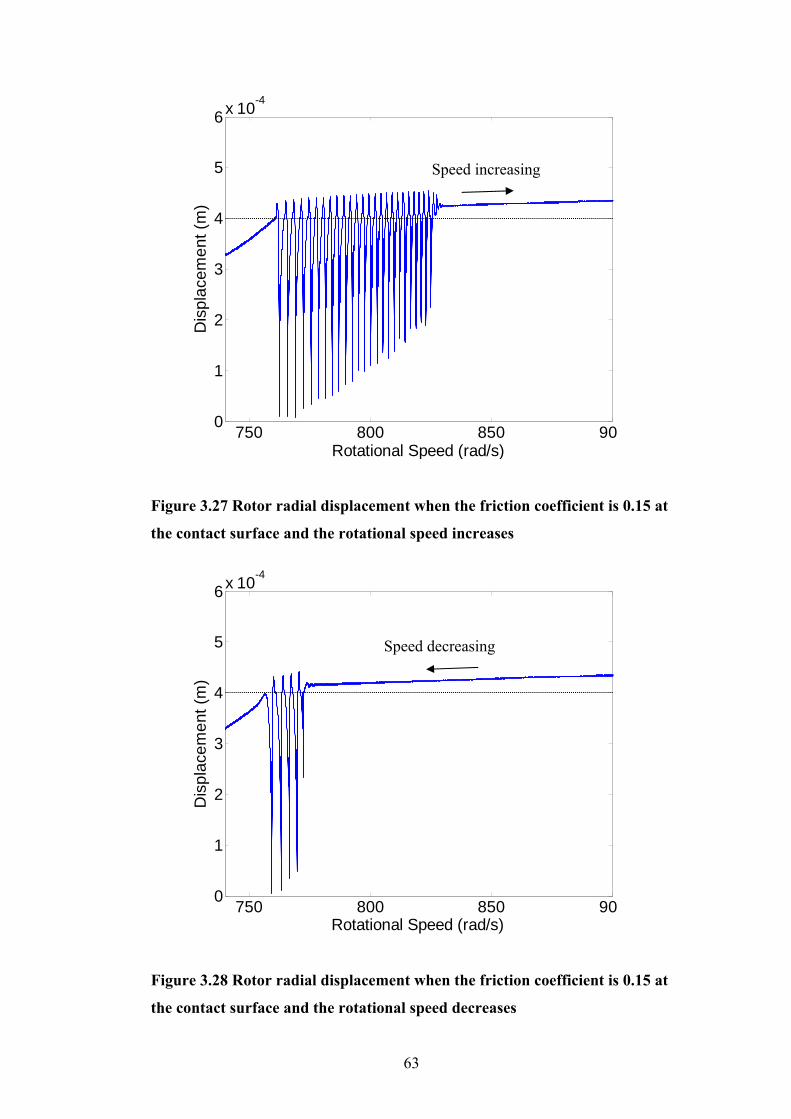
63
750 800 850 900
1
2
3
4
5
6x 10⁻⁴
Rotational Speed (rad/s)
Dis
plac
emen
t (m
)
Figure 3.27 Rotor radial displacement when the friction coefficient is 0.15 at
the contact surface and the rotational speed increases
750 800 850 900
1
2
3
4
5
6x 10⁻⁴
Rotational Speed (rad/s)
Dis
plac
emen
t (m
)
Figure 3.28 Rotor radial displacement when the friction coefficient is 0.15 at
the contact surface and the rotational speed decreases
Speed increasing
Speed decreasing
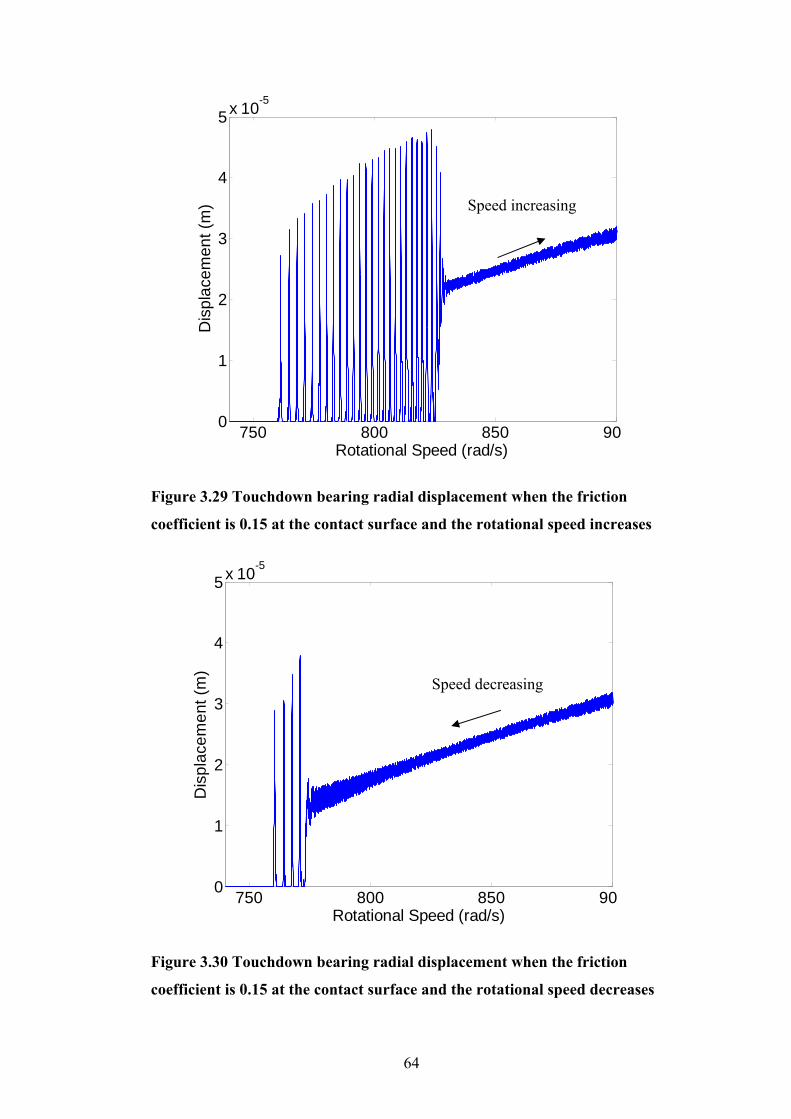
64
750 800 850 900
1
2
3
4
5x 10⁻⁵
Rotational Speed (rad/s)
Dis
plac
emen
t (m
)
Figure 3.29 Touchdown bearing radial displacement when the friction
coefficient is 0.15 at the contact surface and the rotational speed increases
750 800 850 900
1
2
3
4
5x 10⁻⁵
Rotational Speed (rad/s)
Dis
plac
emen
t (m
)
Figure 3.30 Touchdown bearing radial displacement when the friction
coefficient is 0.15 at the contact surface and the rotational speed decreases
Speed increasing
Speed decreasing
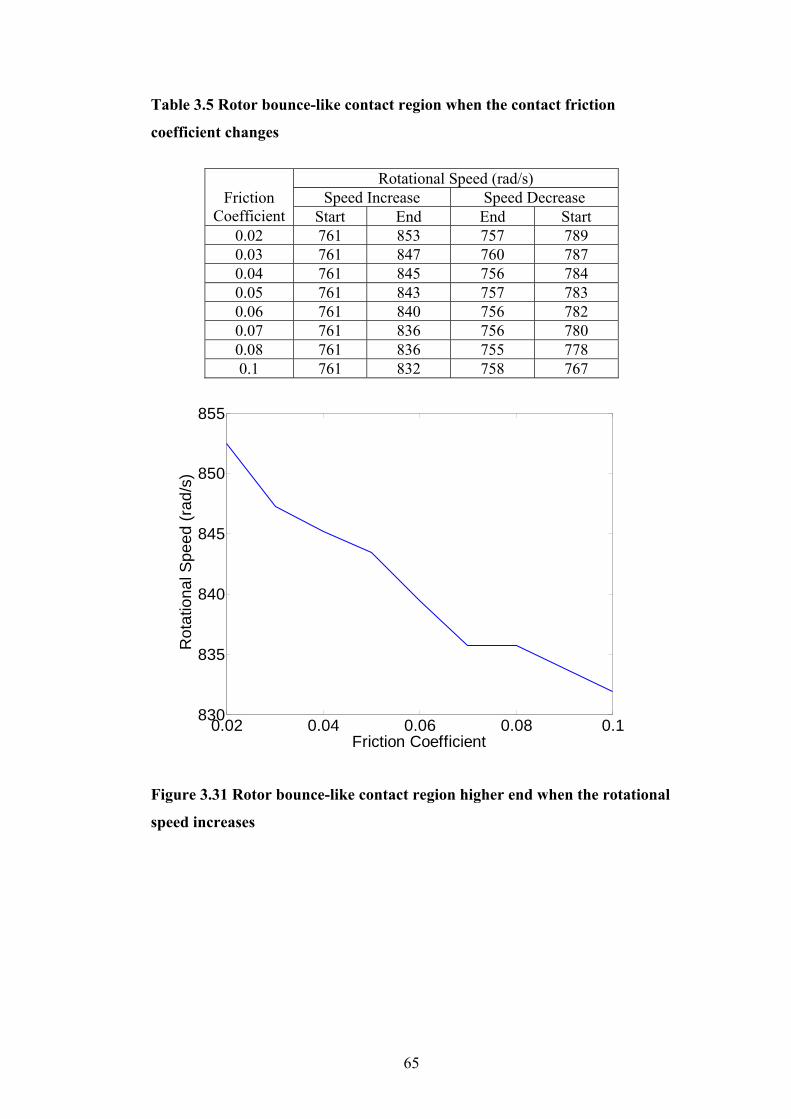
65
Table 3.5 Rotor bounce-like contact region when the contact friction
coefficient changes
Rotational Speed (rad/s)
Speed Increase Speed Decrease Friction Coefficient Start End End Start
0.02 761 853 757 789 0.03 761 847 760 787 0.04 761 845 756 784 0.05 761 843 757 783 0.06 761 840 756 782 0.07 761 836 756 780 0.08 761 836 755 778 0.1 761 832 758 767
0.02 0.04 0.06 0.08 0.1830
835
840
845
850
855
Friction Coefficient
Rot
atio
nal S
peed
(rad
/s)
Figure 3.31 Rotor bounce-like contact region higher end when the rotational
speed increases
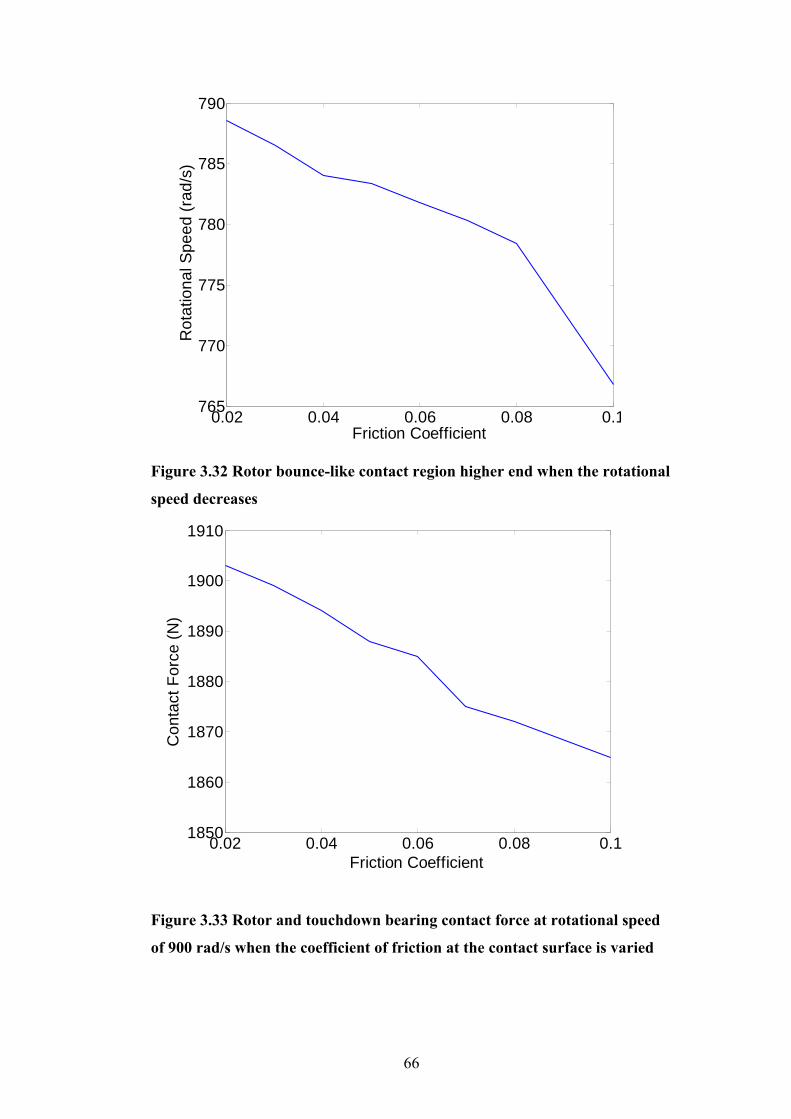
66
0.02 0.04 0.06 0.08 0.1765
770
775
780
785
790
Friction Coefficient
Rot
atio
nal S
peed
(rad
/s)
Figure 3.32 Rotor bounce-like contact region higher end when the rotational
speed decreases
0.02 0.04 0.06 0.08 0.11850
1860
1870
1880
1890
1900
1910
Friction Coefficient
Con
tact
For
ce (N
)
Figure 3.33 Rotor and touchdown bearing contact force at rotational speed
of 900 rad/s when the coefficient of friction at the contact surface is varied
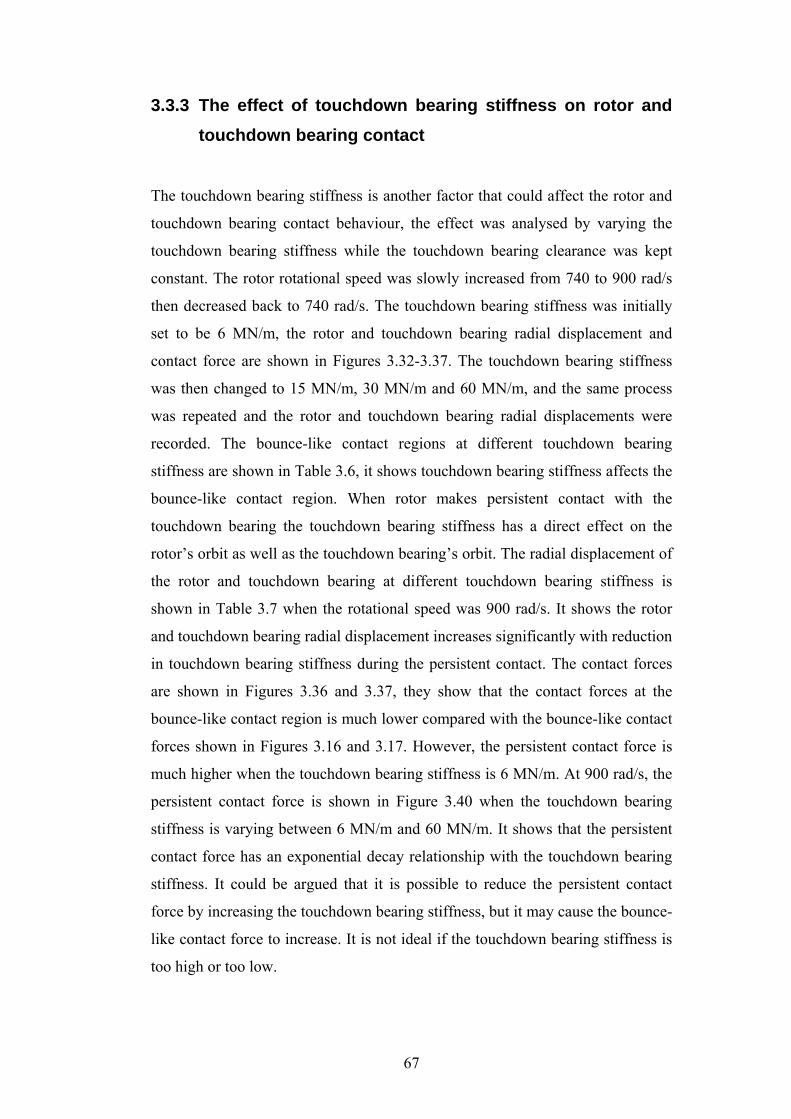
67
3.3.3 The effect of touchdown bearing stiffness on rotor and touchdown bearing contact
The touchdown bearing stiffness is another factor that could affect the rotor and
touchdown bearing contact behaviour, the effect was analysed by varying the
touchdown bearing stiffness while the touchdown bearing clearance was kept
constant. The rotor rotational speed was slowly increased from 740 to 900 rad/s
then decreased back to 740 rad/s. The touchdown bearing stiffness was initially
set to be 6 MN/m, the rotor and touchdown bearing radial displacement and
contact force are shown in Figures 3.32-3.37. The touchdown bearing stiffness
was then changed to 15 MN/m, 30 MN/m and 60 MN/m, and the same process
was repeated and the rotor and touchdown bearing radial displacements were
recorded. The bounce-like contact regions at different touchdown bearing
stiffness are shown in Table 3.6, it shows touchdown bearing stiffness affects the
bounce-like contact region. When rotor makes persistent contact with the
touchdown bearing the touchdown bearing stiffness has a direct effect on the
rotor’s orbit as well as the touchdown bearing’s orbit. The radial displacement of
the rotor and touchdown bearing at different touchdown bearing stiffness is
shown in Table 3.7 when the rotational speed was 900 rad/s. It shows the rotor
and touchdown bearing radial displacement increases significantly with reduction
in touchdown bearing stiffness during the persistent contact. The contact forces
are shown in Figures 3.36 and 3.37, they show that the contact forces at the
bounce-like contact region is much lower compared with the bounce-like contact
forces shown in Figures 3.16 and 3.17. However, the persistent contact force is
much higher when the touchdown bearing stiffness is 6 MN/m. At 900 rad/s, the
persistent contact force is shown in Figure 3.40 when the touchdown bearing
stiffness is varying between 6 MN/m and 60 MN/m. It shows that the persistent
contact force has an exponential decay relationship with the touchdown bearing
stiffness. It could be argued that it is possible to reduce the persistent contact
force by increasing the touchdown bearing stiffness, but it may cause the bounce-
like contact force to increase. It is not ideal if the touchdown bearing stiffness is
too high or too low.
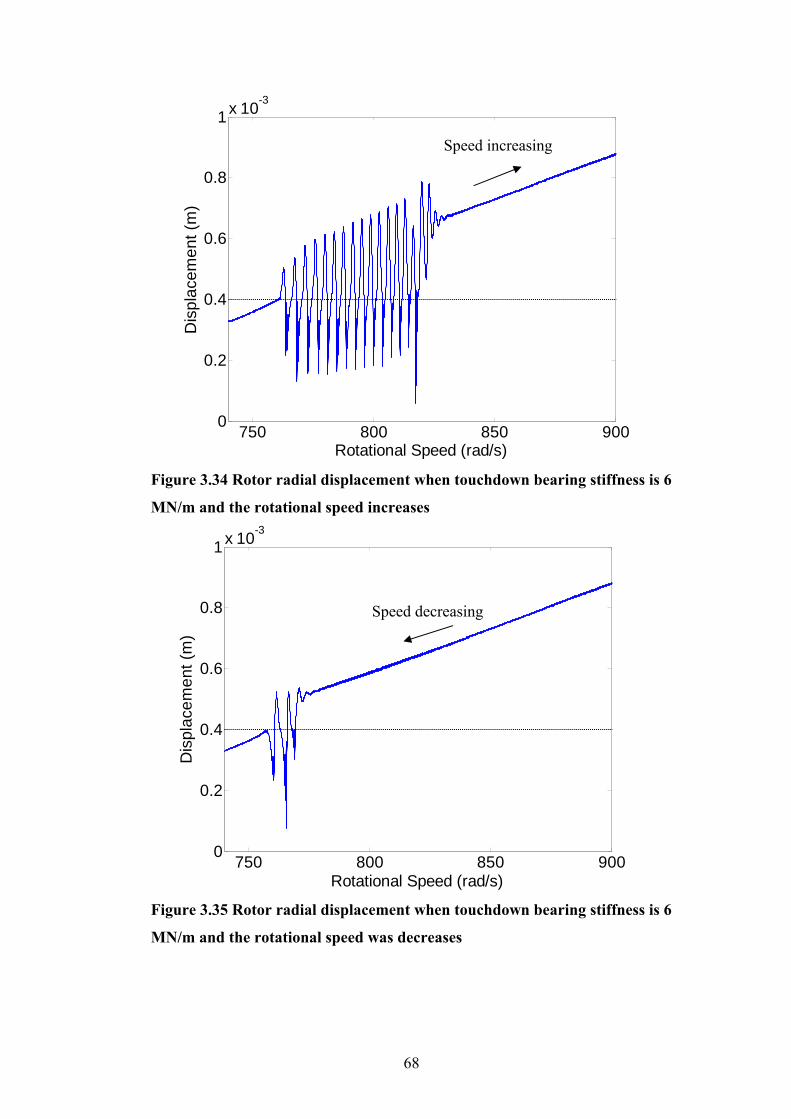
68
750 800 850 9000
0.2
0.4
0.6
0.8
1x 10⁻³
Rotational Speed (rad/s)
Dis
plac
emen
t (m
)
Figure 3.34 Rotor radial displacement when touchdown bearing stiffness is 6
MN/m and the rotational speed increases
750 800 850 9000
0.2
0.4
0.6
0.8
1x 10⁻³
Rotational Speed (rad/s)
Dis
plac
emen
t (m
)
Figure 3.35 Rotor radial displacement when touchdown bearing stiffness is 6
MN/m and the rotational speed was decreases
Speed increasing
Speed decreasing
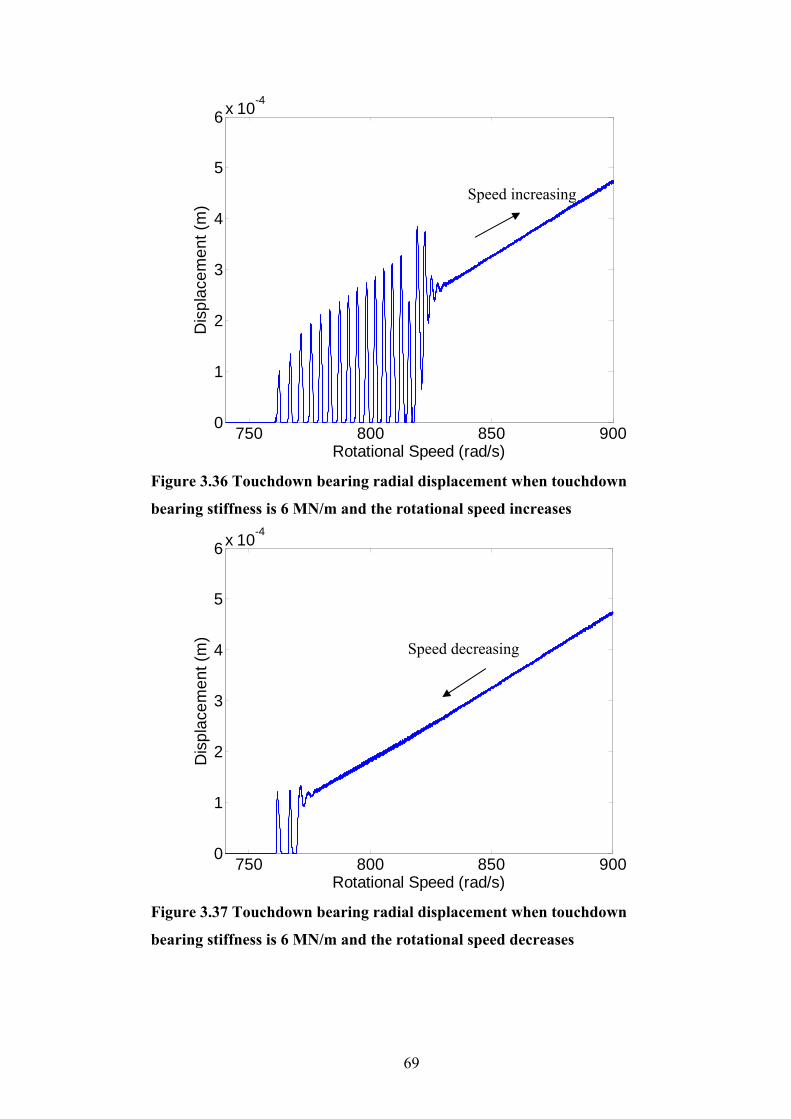
69
750 800 850 9000
1
2
3
4
5
6x 10⁻⁴
Rotational Speed (rad/s)
Dis
plac
emen
t (m
)
Figure 3.36 Touchdown bearing radial displacement when touchdown
bearing stiffness is 6 MN/m and the rotational speed increases
750 800 850 9000
1
2
3
4
5
6x 10⁻⁴
Rotational Speed (rad/s)
Dis
plac
emen
t (m
)
Figure 3.37 Touchdown bearing radial displacement when touchdown
bearing stiffness is 6 MN/m and the rotational speed decreases
Speed increasing
Speed decreasing
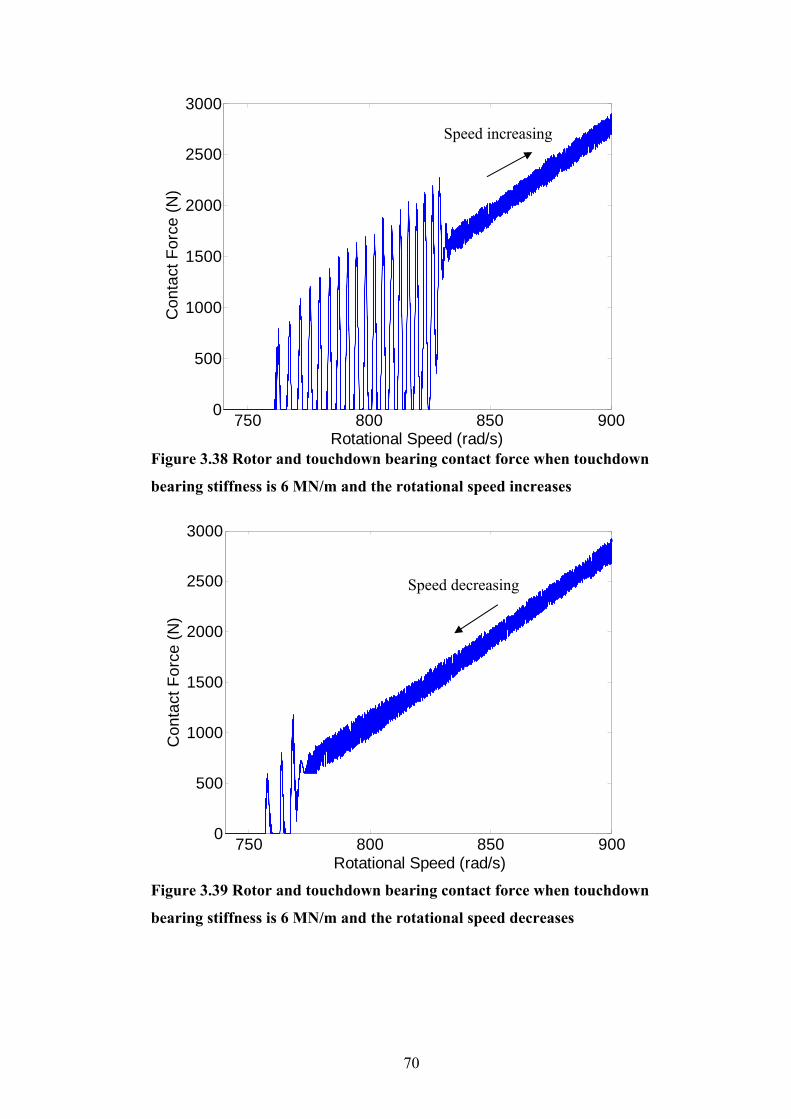
70
750 800 850 9000
500
1000
1500
2000
2500
3000
Rotational Speed (rad/s)
Dis
plac
emen
t (m
)
Figure 3.38 Rotor and touchdown bearing contact force when touchdown
bearing stiffness is 6 MN/m and the rotational speed increases
750 800 850 9000
500
1000
1500
2000
2500
3000
Rotational Speed (rad/s)
Con
tact
For
ce (N
)
Figure 3.39 Rotor and touchdown bearing contact force when touchdown
bearing stiffness is 6 MN/m and the rotational speed decreases
Speed decreasing
Speed increasing
Con
tact
For
ce (N
)
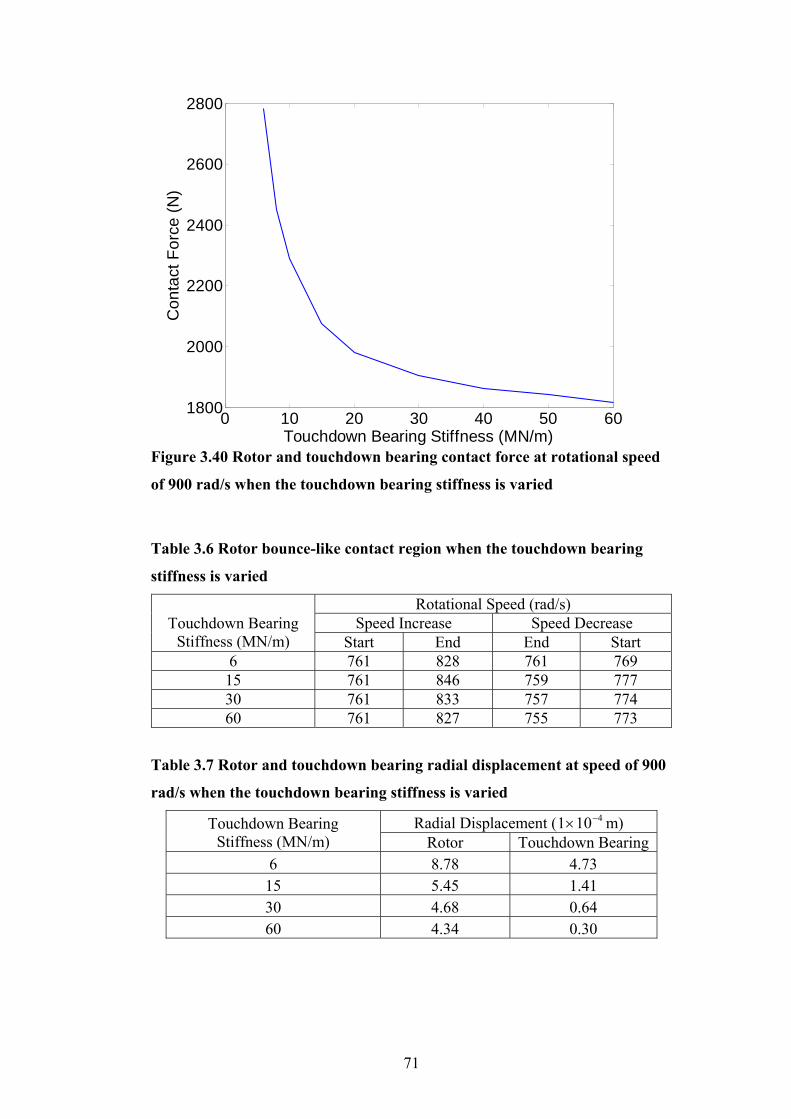
71
0 10 20 30 40 50 601800
2000
2200
2400
2600
2800
Touchdown Bearing Stiffness (MN/m)
Con
tact
For
ce (N
)
Figure 3.40 Rotor and touchdown bearing contact force at rotational speed
of 900 rad/s when the touchdown bearing stiffness is varied
Table 3.6 Rotor bounce-like contact region when the touchdown bearing
stiffness is varied
Rotational Speed (rad/s) Speed Increase Speed Decrease Touchdown Bearing
Stiffness (MN/m) Start End End Start 6 761 828 761 769 15 761 846 759 777 30 761 833 757 774 60 761 827 755 773
Table 3.7 Rotor and touchdown bearing radial displacement at speed of 900
rad/s when the touchdown bearing stiffness is varied
Radial Displacement ( 4101 −× m) Touchdown Bearing Stiffness (MN/m) Rotor Touchdown Bearing
6 8.78 4.73 15 5.45 1.41 30 4.68 0.64 60 4.34 0.30

72
3.4 Conclusions
Chapter 3 explains modelling method on rotor, active magnetic bearing and
active touchdown bearing. Using the model, rotor and magnetic bearing system
stability was analysed, it was found that the rotor is more stable if the sensors
were arranged outboard of the magnetic bearing compared with the inboard
arrangement. A series of simulation was carried out to assess the touchdown
bearing clearance, contact surface friction coefficient and touchdown bearing
stiffness on rotor and touchdown bearing contact. It was found that the region of
bounce-like contact region decreases with touchdown bearing clearance.
However, the contact force increases with touchdown bearing clearance. The
contact surface friction coefficient is another factor that could affect rotor and
touchdown bearing contact, it was found that it is easier to achieve persistent
contact with higher friction coefficient. It was also noted that the contact force
increase proportionally with friction coefficient. Finally, the effect of touchdown
bearing stiffness on rotor and touchdown bearing contact was assessed, it was
found that the touchdown bearing stiffness has a direct influence on rotor and
touchdown bearing orbit at contact. Reducing touchdown bearing stiffness can
significantly increase the rotor and touchdown bearing contact orbit and contact
force.
73
CHAPTER 4 Simulation Results Unbalance forces always exist in rotating machinery due to machining and
assembly imperfections, which affect the rotor orbit under normal operating
conditions. They also influence the rotor dynamics under contact between the
rotor and the touchdown bearing. By considering the rotor dynamics with and
without contact, an unbalance force tends to keep a rotor in persistent contact
with touchdown bearing(s). Although much research has been reported to use
magnetic bearing control to alleviate rotor/touchdown bearing contact forces,
little research has been carried out on how to use touchdown bearing motion to
achieve rotor re-levitation from a persistent contact condition. A system has been
developed to return a rotor to contact-free levitation by using either magnetic
bearing control or active touchdown bearing control. In this chapter, simulations
are presented to assess the influence of the control strategies on the active
magnetic bearing and touchdown bearing systems before being deployed on the
test rig.
The problems when a rotor makes contact with one or more touchdown bearings
are described. Control methods using either magnetic bearings and/or active
touchdown bearings to return the rotor back to a contact-free orbit are then
explained. The magnetic and touchdown bearings may not be axially aligned,
hence the effect of magnetic and touchdown bearing offset on the rotor contact
orbit and active touchdown bearing control are also investigated in this chapter.
The simulation results in this chapter also lead to the experimental programme of
Chapter 6 and Chapter 7.
4.1 Rotor re-levitation control when rotor makes contact with one touchdown bearing
Simulation of the rotor/magnetic/touchdown bearing system was undertaken
using the data in Table 4.1. The unbalance force was created by offsetting the
non-driven end disk of mass 1.08 kg radially by 0.55 mm. The rotor speed was
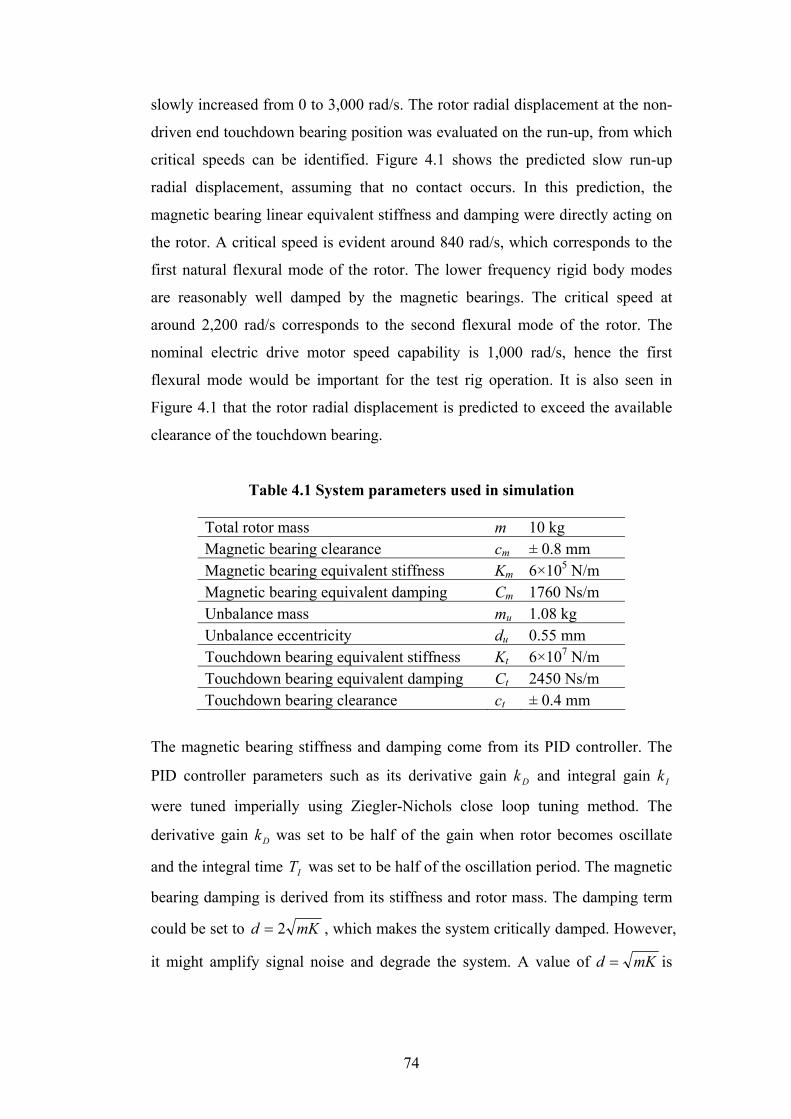
74
slowly increased from 0 to 3,000 rad/s. The rotor radial displacement at the non-
driven end touchdown bearing position was evaluated on the run-up, from which
critical speeds can be identified. Figure 4.1 shows the predicted slow run-up
radial displacement, assuming that no contact occurs. In this prediction, the
magnetic bearing linear equivalent stiffness and damping were directly acting on
the rotor. A critical speed is evident around 840 rad/s, which corresponds to the
first natural flexural mode of the rotor. The lower frequency rigid body modes
are reasonably well damped by the magnetic bearings. The critical speed at
around 2,200 rad/s corresponds to the second flexural mode of the rotor. The
nominal electric drive motor speed capability is 1,000 rad/s, hence the first
flexural mode would be important for the test rig operation. It is also seen in
Figure 4.1 that the rotor radial displacement is predicted to exceed the available
clearance of the touchdown bearing.
Table 4.1 System parameters used in simulation
Total rotor mass m 10 kg Magnetic bearing clearance cm ± 0.8 mm Magnetic bearing equivalent stiffness Km 6×10⁵ N/m Magnetic bearing equivalent damping Cm 1760 Ns/m Unbalance mass mu 1.08 kg Unbalance eccentricity du 0.55 mm Touchdown bearing equivalent stiffness Kt 6×10⁷ N/m Touchdown bearing equivalent damping Ct 2450 Ns/m Touchdown bearing clearance ct ± 0.4 mm
The magnetic bearing stiffness and damping come from its PID controller. The
PID controller parameters such as its derivative gain Dk and integral gain Ik
were tuned imperially using Ziegler-Nichols close loop tuning method. The
derivative gain Dk was set to be half of the gain when rotor becomes oscillate
and the integral time IT was set to be half of the oscillation period. The magnetic
bearing damping is derived from its stiffness and rotor mass. The damping term
could be set to mKd 2= , which makes the system critically damped. However,
it might amplify signal noise and degrade the system. A value of mKd = is
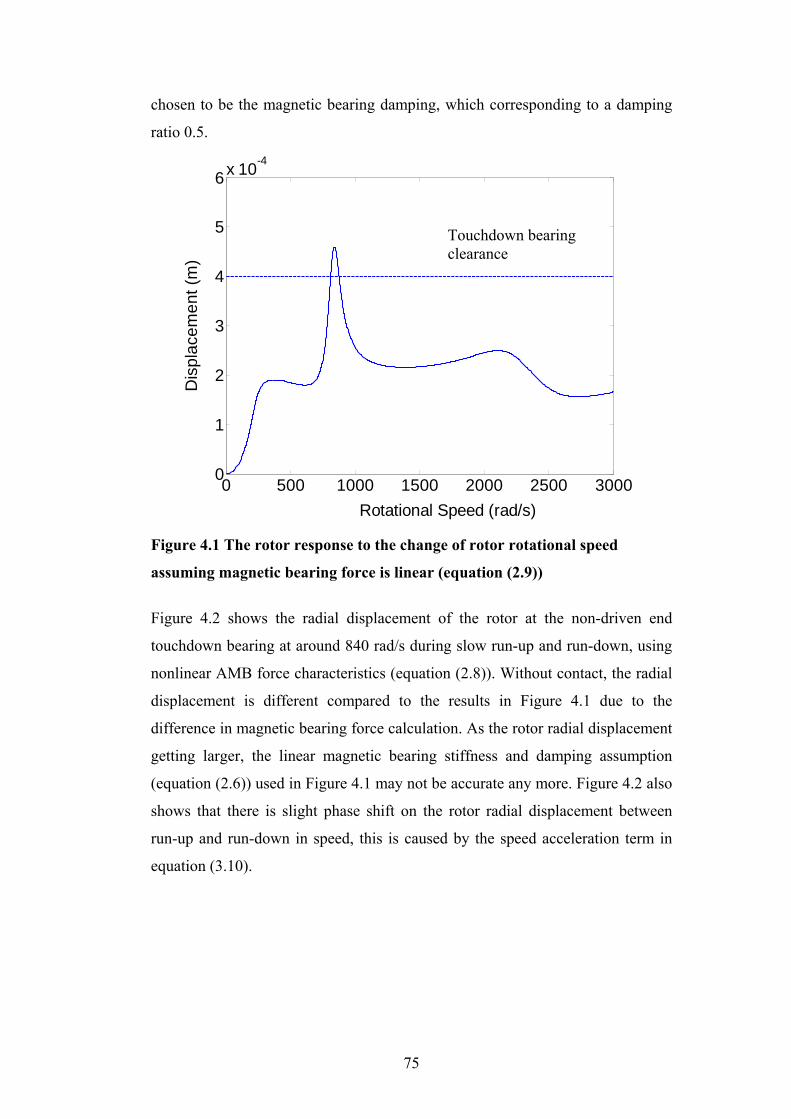
75
chosen to be the magnetic bearing damping, which corresponding to a damping
ratio 0.5.
0 500 1000 1500 2000 2500 30000
1
2
3
4
5
6x 10⁻⁴
Rotational Speed (rad/s)
Dis
plac
emen
t (m
)
Figure 4.1 The rotor response to the change of rotor rotational speed
assuming magnetic bearing force is linear (equation (2.9))
Figure 4.2 shows the radial displacement of the rotor at the non-driven end
touchdown bearing at around 840 rad/s during slow run-up and run-down, using
nonlinear AMB force characteristics (equation (2.8)). Without contact, the radial
displacement is different compared to the results in Figure 4.1 due to the
difference in magnetic bearing force calculation. As the rotor radial displacement
getting larger, the linear magnetic bearing stiffness and damping assumption
(equation (2.6)) used in Figure 4.1 may not be accurate any more. Figure 4.2 also
shows that there is slight phase shift on the rotor radial displacement between
run-up and run-down in speed, this is caused by the speed acceleration term in
equation (3.10).
Touchdown bearing clearance
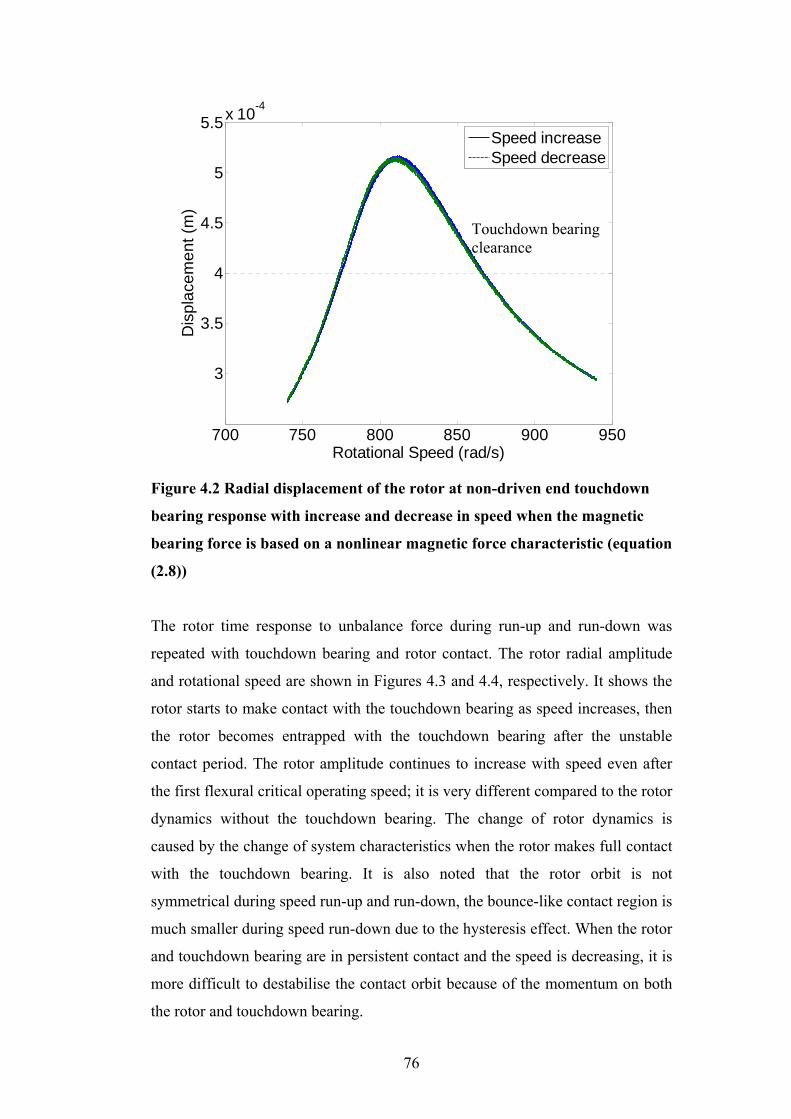
76
700 750 800 850 900 950
3
3.5
4
4.5
5
5.5x 10⁻⁴
Rotational Speed (rad/s)
Dis
plac
emen
t (m
)
Speed increaseSpeed decrease
Figure 4.2 Radial displacement of the rotor at non-driven end touchdown
bearing response with increase and decrease in speed when the magnetic
bearing force is based on a nonlinear magnetic force characteristic (equation
(2.8))
The rotor time response to unbalance force during run-up and run-down was
repeated with touchdown bearing and rotor contact. The rotor radial amplitude
and rotational speed are shown in Figures 4.3 and 4.4, respectively. It shows the
rotor starts to make contact with the touchdown bearing as speed increases, then
the rotor becomes entrapped with the touchdown bearing after the unstable
contact period. The rotor amplitude continues to increase with speed even after
the first flexural critical operating speed; it is very different compared to the rotor
dynamics without the touchdown bearing. The change of rotor dynamics is
caused by the change of system characteristics when the rotor makes full contact
with the touchdown bearing. It is also noted that the rotor orbit is not
symmetrical during speed run-up and run-down, the bounce-like contact region is
much smaller during speed run-down due to the hysteresis effect. When the rotor
and touchdown bearing are in persistent contact and the speed is decreasing, it is
more difficult to destabilise the contact orbit because of the momentum on both
the rotor and touchdown bearing.
Touchdown bearing clearance
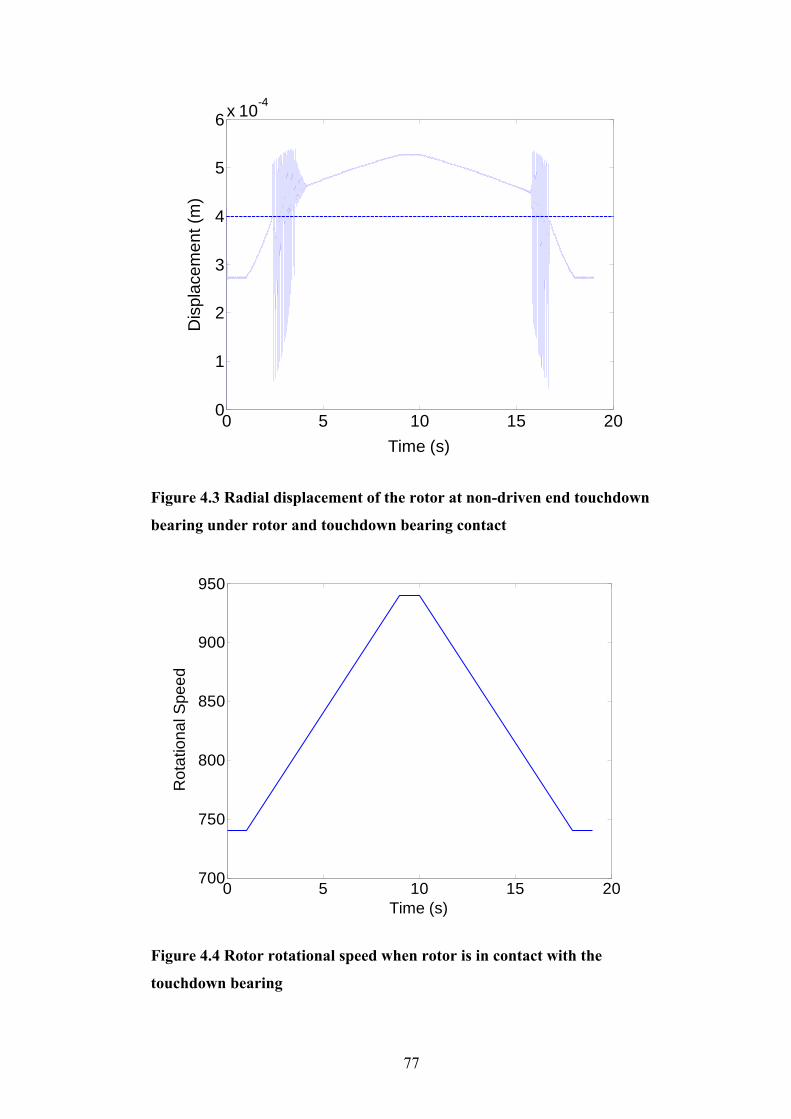
77
0 5 10 15 200
1
2
3
4
5
6x 10⁻⁴
Time (s)
Dis
plac
emen
t (m
)
Figure 4.3 Radial displacement of the rotor at non-driven end touchdown
bearing under rotor and touchdown bearing contact
0 5 10 15 20700
750
800
850
900
950
Time (s)
Rot
atio
nal S
peed
Figure 4.4 Rotor rotational speed when rotor is in contact with the
touchdown bearing
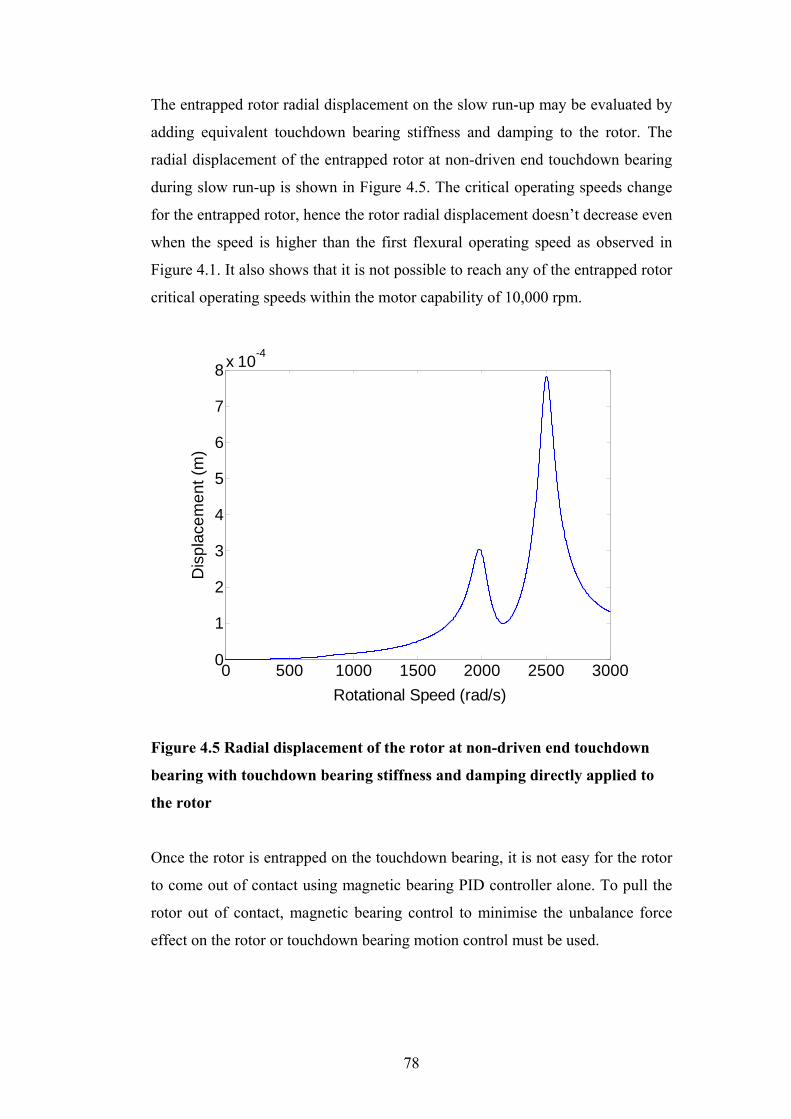
78
The entrapped rotor radial displacement on the slow run-up may be evaluated by
adding equivalent touchdown bearing stiffness and damping to the rotor. The
radial displacement of the entrapped rotor at non-driven end touchdown bearing
during slow run-up is shown in Figure 4.5. The critical operating speeds change
for the entrapped rotor, hence the rotor radial displacement doesn’t decrease even
when the speed is higher than the first flexural operating speed as observed in
Figure 4.1. It also shows that it is not possible to reach any of the entrapped rotor
critical operating speeds within the motor capability of 10,000 rpm.
0 500 1000 1500 2000 2500 30000
1
2
3
4
5
6
7
8x 10⁻⁴
Rotational Speed (rad/s)
Dis
plac
emen
t (m
)
Figure 4.5 Radial displacement of the rotor at non-driven end touchdown
bearing with touchdown bearing stiffness and damping directly applied to
the rotor
Once the rotor is entrapped on the touchdown bearing, it is not easy for the rotor
to come out of contact using magnetic bearing PID controller alone. To pull the
rotor out of contact, magnetic bearing control to minimise the unbalance force
effect on the rotor or touchdown bearing motion control must be used.
79
4.1.1 Rotor re-levitation using magnetic bearing control
The unbalance and contact forces are the drivers that keep a rotor in contact with
the touchdown bearing. If it is possible to reduce the unbalance force effect, it
would help rotor’s recovery. The proposed method to use a magnetic bearing to
generate appropriate synchronous forces to compensate the unbalance force,
hence reduce the rotor orbit. However, this method requires accurate
synchronous force calculation; also it could add much more load on the magnetic
bearing. In extreme cases, it may exceed the magnetic bearing capacity.
This method is initially demonstrated at a constant operating speed of 840 rad/s.
The synchronous force was calculated in advance before being applied, in a
Simulink model, through the magnetic bearings. The methodology of using
synchronous forces to reduce the rotor vibration at the displacement sensor
locations is explained in [61]. Synchronous force amplitude (complex) were
calculated to be 116.5 – 301.7i N and 128.3 – 200.6i N at magnetic bearings A
and B, respectively when an unbalance of 0.594 kg·mm mounted on the non-
driven end disk, please see Appendix H for the calculation process. Figure 4.6
shows that the rotor is initially entrapped with the touchdown bearing due to the
large unbalance of 0.594 kg·mm from Table 4.1. Then the synchronous force is
applied at st 5.1= , then the rotor radial displacement and contact force (Figure
4.7) reduce until the rotor comes out of the contact. By applying the synchronous
force, the rotor radial displacement is kept below the touchdown bearing
clearance even at the first flexural critical operating speed. The rotor orbit at
other points along the shaft could also be affected, which has not been considered
here.
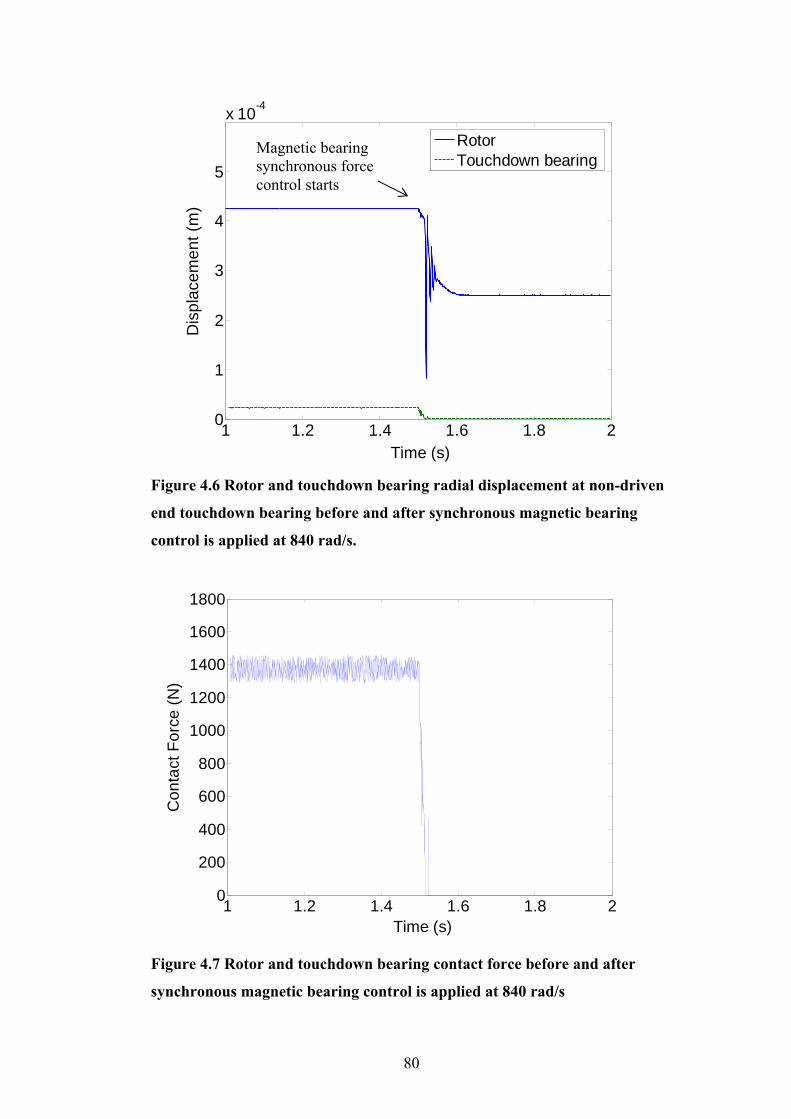
80
1 1.2 1.4 1.6 1.8 20
1
2
3
4
5
x 10-4
Time (s)
Dis
plac
emen
t (m
)
RotorTouchdown bearing
Figure 4.6 Rotor and touchdown bearing radial displacement at non-driven
end touchdown bearing before and after synchronous magnetic bearing
control is applied at 840 rad/s.
1 1.2 1.4 1.6 1.8 20
200
400
600
800
1000
1200
1400
1600
1800
Time (s)
Con
tact
For
ce (N
)
Figure 4.7 Rotor and touchdown bearing contact force before and after
synchronous magnetic bearing control is applied at 840 rad/s
Magnetic bearing synchronous force control starts
81
This method has been demonstrated to be efficient at one operating speed. The
result may be different at another different operating speed or with a different
unbalance force distribution. During normal operation, the rotational speed might
vary, hence a variable synchronous force may be necessary at different operating
speeds. However, there is a limit on the synchronous force that can be applied
through the magnetic bearing; it can’t exceed the magnetic bearing load capacity.
The synchronous force is normally calculated before it is applied. If the rotor
suffers sudden change in unbalance mass, the synchronous force has to be
changed accordingly.
4.1.2 Rotor re-levitation using touchdown bearing motion
When contact occurs between the rotor and touchdown bearing, contact force and
friction force are generated. If it is possible to use touchdown bearing motion to
reduce the contact force hence the friction force, the rotor might come out of
contact from the touchdown bearing. When the rotor is in persistent contact, to
reduce the contact force the touchdown bearing has to move in the same
direction as the rotor in order to reduce the penetration level into the touchdown
bearing. This method is demonstrated at an operating speed at which there is
scope to bring the rotor out of contact. To use this method, correct touchdown
bearing motion is essential.
As explained in Section 2.7, the activation of the touchdown bearing is achieved
by using four piezoelectric actuators to push the touchdown bearing through four
hydraulic pistons. The overall touchdown bearing movement due to external
force such as contact force and the actuated motion from the piezoelectric
actuator can be formulated as
tbttbttttttt qKqCfqKqCqm ++=++ &&&& (5.1)
where f is the external force acting on the touchdown bearing, tq and tbq are
the touchdown bearing displacement and its actuated displacement, respectively.
The initial simulation was carried out at operating speed of 940 rad/s, where the
rotor can either have a contact-free orbit or a full contacting mode when a single
unbalance is generated by offsetting the non-driven end disk by 0.55 mm.
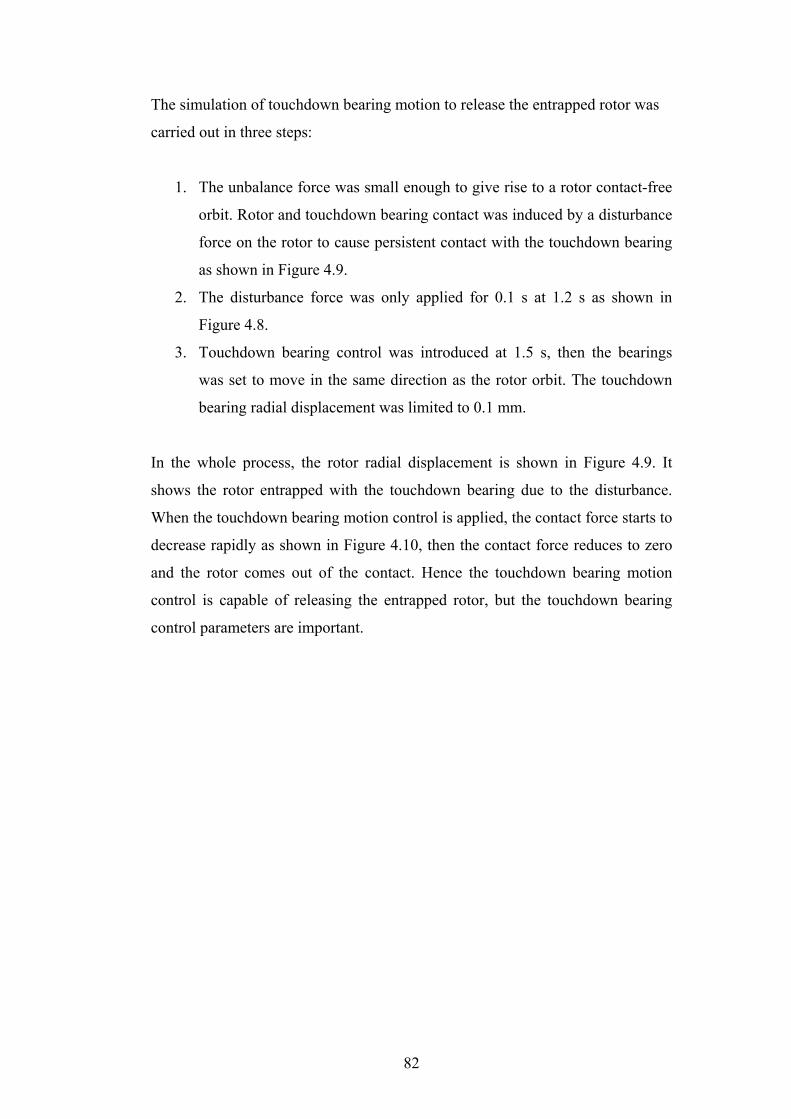
82
The simulation of touchdown bearing motion to release the entrapped rotor was
carried out in three steps:
1. The unbalance force was small enough to give rise to a rotor contact-free
orbit. Rotor and touchdown bearing contact was induced by a disturbance
force on the rotor to cause persistent contact with the touchdown bearing
as shown in Figure 4.9.
2. The disturbance force was only applied for 0.1 s at 1.2 s as shown in
Figure 4.8.
3. Touchdown bearing control was introduced at 1.5 s, then the bearings
was set to move in the same direction as the rotor orbit. The touchdown
bearing radial displacement was limited to 0.1 mm.
In the whole process, the rotor radial displacement is shown in Figure 4.9. It
shows the rotor entrapped with the touchdown bearing due to the disturbance.
When the touchdown bearing motion control is applied, the contact force starts to
decrease rapidly as shown in Figure 4.10, then the contact force reduces to zero
and the rotor comes out of the contact. Hence the touchdown bearing motion
control is capable of releasing the entrapped rotor, but the touchdown bearing
control parameters are important.
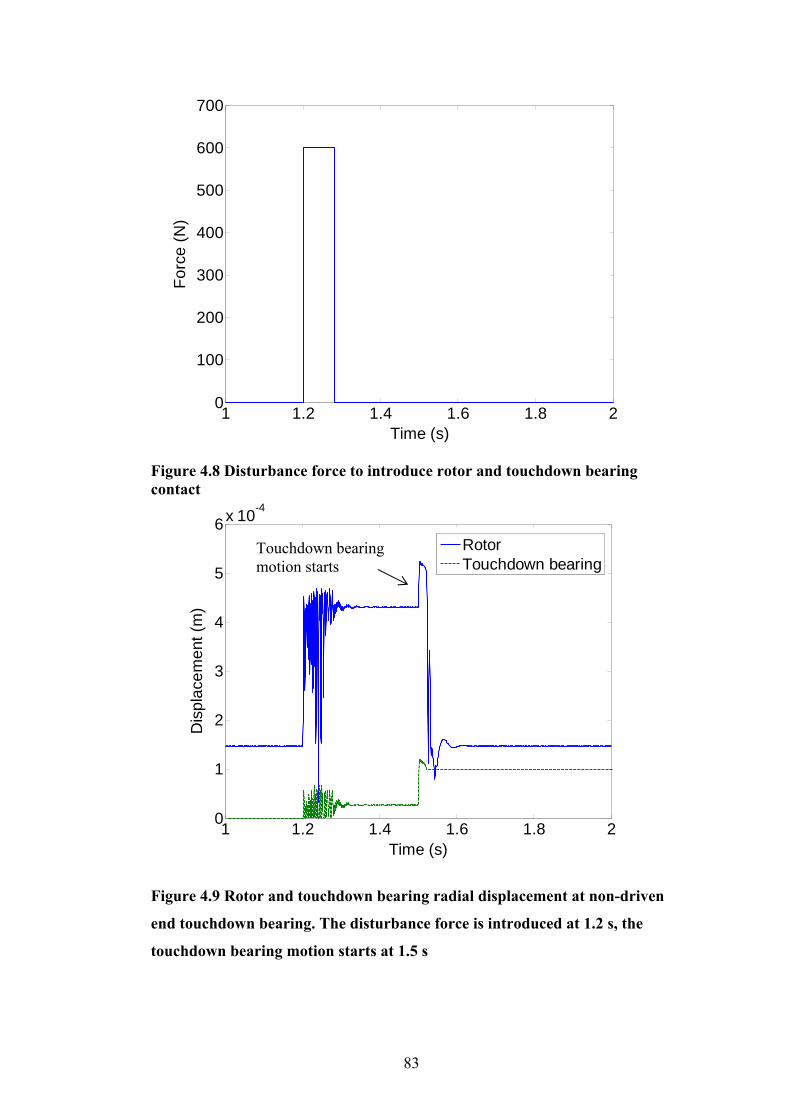
83
1 1.2 1.4 1.6 1.8 20
100
200
300
400
500
600
700
Time (s)
Forc
e (N
)
Figure 4.8 Disturbance force to introduce rotor and touchdown bearing contact
1 1.2 1.4 1.6 1.8 20
1
2
3
4
5
6x 10⁻⁴
Time (s)
Dis
plac
emen
t (m
)
RotorTouchdown bearing
Figure 4.9 Rotor and touchdown bearing radial displacement at non-driven
end touchdown bearing. The disturbance force is introduced at 1.2 s, the
touchdown bearing motion starts at 1.5 s
Touchdown bearing motion starts
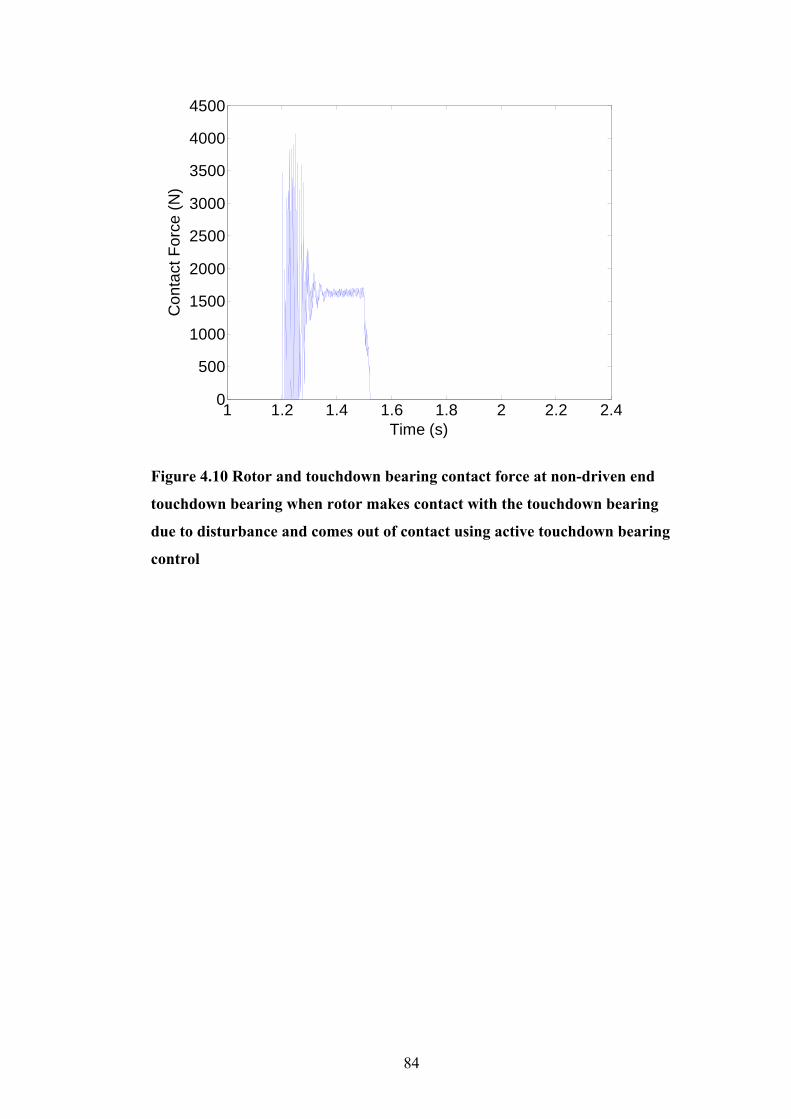
84
1 1.2 1.4 1.6 1.8 2 2.2 2.40
500
1000
1500
2000
2500
3000
3500
4000
4500
Time (s)
Con
tact
For
ce (N
)
Figure 4.10 Rotor and touchdown bearing contact force at non-driven end
touchdown bearing when rotor makes contact with the touchdown bearing
due to disturbance and comes out of contact using active touchdown bearing
control
85
4.2 Rotor re-levitation when rotor makes contact with both touchdown bearings
It is not usually possible to ascertain the exact unbalance distribution on a rotor.
In simulation, unbalance masses were added onto any of its three disks on the
rotor. The amount of unbalance mass was chosen so that the rotor contact orbit
and non-contact orbit could co-exist at a given speed. The contact between the
rotor and touchdown bearings (TDBs) can be initiated by applying some
disturbance force on the rotor, appropriate touchdown bearing and active
magnetic bearing (AMB) control can be used to try to return the rotor to the
contact-free orbit. The same effective magnetic bearings and touchdown bearings
stiffness and damping as Section 4.1 are used. The amounts of unbalance masses
and offset distance have been changed according to the dimension of the test rig.
The amount of unbalance mass and offset distance is shown in Table 4.2.
Table 4.2 Unbalance mass and effective eccentricity
Unbalance mass mu 13.5 g Unbalance eccentricity du 35 mm
Firstly, the unbalance mass um was considered added to Disk 1 (Figure 2.1) and
the rotor rotational speed was slowly increased from 0 to 3,000 rad/s. The rotor
radial displacements at both touchdown bearings were evaluated to identify the
critical operating speed of the rotor assembly. In the calculation, the linearized
AMB equivalent stiffness and damping were applied directly to the rotor. The
same calculation was then repeated with the same amount unbalance masses
attached to both Disks 1 and 2, then again for unbalance masses on Disks 1, 2
and 3. Figures 4.11 and 4.12 show the slow run-up rotor radial displacement at
TDB’s A and B, respectively, assuming that no contact occurs. Several critical
speeds are noted, the most obvious one is at around 840 rad/s, which corresponds
to the first flexural mode of the rotor. The two rigid body critical speeds below
the first flexural mode are well damped. The critical speed at around 2,200 rad/s
corresponds to the second flexural mode, which is well above the motor
operating speed of 10,000 rpm. It also shows the critical speed at 2,200 rad/s is
86
not obvious when three disks are unbalanced. The rotor radial displacement is
highest around the first flexural critical speed at both TDB positions. The rotor
radial displacement would exceed the TDB clearance of 0.4 mm, hence the rotor
assembly with three unbalanced disks at around operating speed of 840 rad/s will
be the focus for further simulations. It could be argued that the maximum radial
displacement is larger than half of the magnetic bearing clearance hence it is not
realistic to use equivalent linearised magnetic bearing stiffness and damping.
0 500 1000 1500 2000 2500 30000
1
2
3
4
5
6x 10⁻⁴
Rotational Speed (rad/s)
Dis
plac
emen
t (m
)
Unbalance mass on Disk 1Unbalance mass on Disk 1 and 2Unbalance mass on Disk 1, 2 and 3
Figure 4.11 Rotor radial displacements at TDB A position, when unbalance
masses are attached onto different disks, each unbalance mass is 13.5 g
located at the same angular position on each disk
87
0 500 1000 1500 2000 2500 30000
1
2
3
4
5
6x 10⁻⁴
Rotational Speed (rad/s)
Dis
plac
emen
t (m
)
Unbalance mass on Disk 1Unbalance mass on Disk 1 and 2Unbalance mass on Disk 1, 2 and 3
Figure 4.12 Rotor radial displacements at TDB B position, when unbalance
masses are attached onto different disks, each unbalance mass is 13.5 g
located at the same angular position on each disk
It is predicted from Figures 4.11 and 4.12 that when the TDB clearance is 0.4
mm, the rotor will make contact with both TDB s when unbalance masses of 13.5
g are attached to the three balancing disks with offset of 35 mm at speeds
between 740 rad/s and 940 rad/s. Simulation was therefore undertaken with the
TDBs included for the contact events. The results include rotor radial
displacement and operating speed as shown in Figures 4.13-4.17. They show the
rotor radial displacement increases at both TDB positions as speed increases. The
rotor starts to make contact with both TDBs at about 2 s. After initial bouncing
contact with both TDBs, the rotor makes continuous contact with TDB A and
enters a full rub contact condition, but the rotor comes out of contact from TDB
B. A symmetrical rotor with symmetrical unbalance distribution should make
continuous contact with both TDBs if the properties of both TDBs are the same.
Contact between the rotor and TDB A continues up to 940 rad/s, beyond which
the results of Figure 4.11 indicate no contact. Hence there could be two stable
and co-existing orbits for the rotor at 940 rad/s. Due to some external disturbance
or force, the rotor could enter full rub contact with one or two TDBs from
88
contact-free levitation or vice-versa. It would be beneficial to use magnetic
bearing control and/or TDB control to keep the rotor in contact-free levitation if
some uncontrolled external force strikes the rotor. The worst case would be for
the rotor to make full rub contact with both TDBs at the same time. Simulation
was carried to simulate the rotor entering full rub contact with both TDBs using
an external disturbance, and then to bring rotor out of contact from both TDBs
using magnetic bearing and TDB control. The following steps were followed:
1. A contact-free rotor orbit was established with an unbalanced masses of
7.5 g mounted 35 mm from the centre of all three disks, all three
unbalance masses having the same angular position. The maximum rotor
orbit radius was established to be 0.195 mm, which is within the radial
clearance of 0.4 mm.
2. A disturbance force of 900 N was applied to the middle of the rotor after
1.2 s, lasting for 0.1 s, which was at a sufficient level to induce rotor and
TDB contact.
3. Motion control on the TDBs was used to recover the rotor to contact-free
levitation by moving the TDBs in the same radial direction as the rotor at
all times under the constraint of TDB radial displacement being limited to
0.1 mm. Control of TDB motion could be applied at any time.
Firstly, the motion control for both TDBs was applied at 1.7s. Figures 4.18 and
4.20 show the rotor and TDB radial displacement at TDBs A and B, respectively,
while Figures 4.19 and 4.21 show the rotor and TDB contact force at TDBs A
and B, respectively. It shows the rotor dynamics are the same at both TDB
locations, which is due to the symmetrical unbalance distribution on the rotor.
The rotor radial displacement moves from 0.145 mm (no contact) to full rub
contact at 0.43 mm. The TDB radial displacement moves from no motion to 0.03
mm radial displacement under passive contact forces. The contact force includes
significant overshoot to 4,000 N before settling at around 1,600 N for both
TDBs. When the active TDB motion was applied to both bearings at the same
time, the rotor radial displacement moves to 0.53 mm and the TDB displacement
moves to 1.3 mm though a transient phase, the contact force increases to 1,800 N
from 1,600 N. The rotor is still in full rub contact with both TDBs. This motion

89
control of the TDBs has increased the rotor and TDB contact displacement
together with the contact forces.
0 5 10 15 20700
750
800
850
900
950
Time (s)
Rot
atio
nal S
peed
(rad
/s)
Figure 4.13 Rotor operating speed
90
0 5 10 15 200
1
2
3
4
5
6x 10⁻⁴
Time (s)
Dis
plac
emen
t (m
)
Figure 4.14 Rotor radial displacement at TDB A when unbalance masses of
13.5 g are mounted onto all three balancing disks at the same angular
positions
0 5 10 15 200
500
1000
1500
2000
2500
3000
Time (s)
Con
tact
For
ce (N
)
Figure 4.15 Rotor and TDB contact force at TDB A when unbalance masses
of 13.5 g are mounted onto all three balancing disks at the same angular
positions
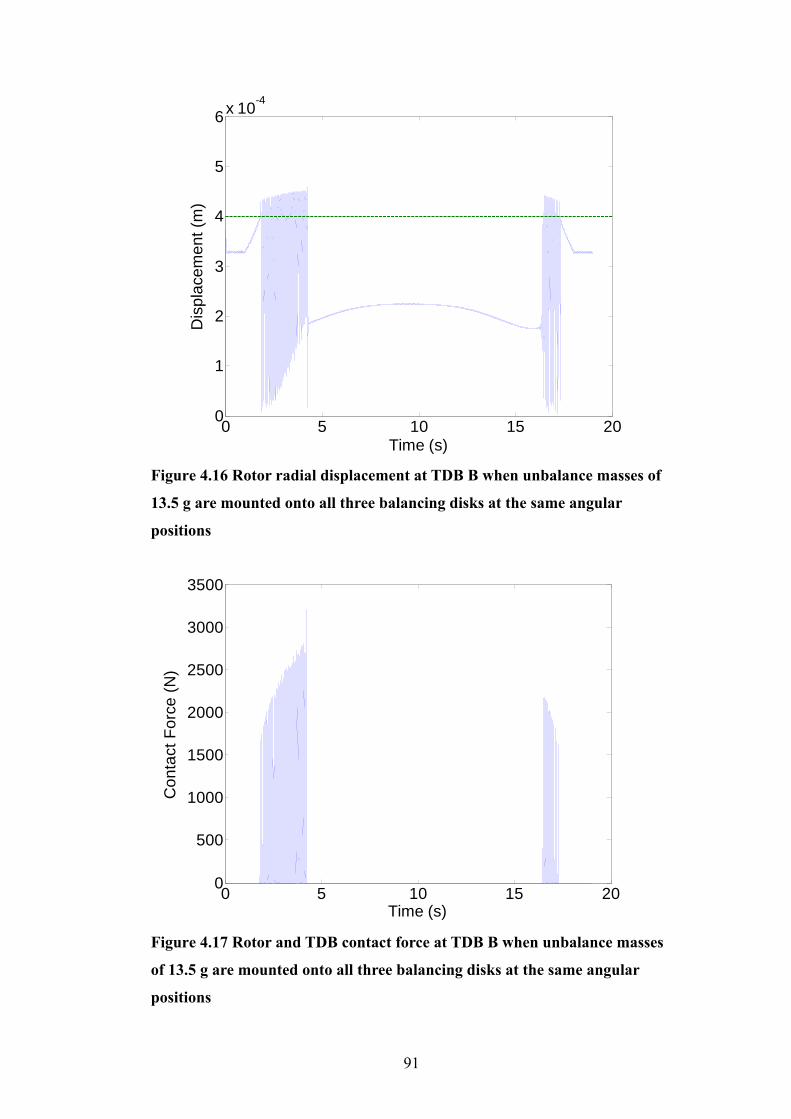
91
0 5 10 15 200
1
2
3
4
5
6x 10⁻⁴
Time (s)
Dis
plac
emen
t (m
)
Figure 4.16 Rotor radial displacement at TDB B when unbalance masses of
13.5 g are mounted onto all three balancing disks at the same angular
positions
0 5 10 15 200
500
1000
1500
2000
2500
3000
3500
Time (s)
Con
tact
For
ce (N
)
Figure 4.17 Rotor and TDB contact force at TDB B when unbalance masses
of 13.5 g are mounted onto all three balancing disks at the same angular
positions

92
1 1.5 2 2.50
1
2
3
4
5
6
7x 10⁻⁴
Time (s)
Dis
plac
emen
t (m
)
Rotor Touchdown Bearing
Figure 4.18 Rotor and TDB radial displacement at TDB A when the TDB
motion control is applied to both TDBs at 1.7 s
1 1.5 2 2.50
1000
2000
3000
4000
5000
Time (s)
Con
tact
For
ce (N
)
Figure 4.19 Rotor and TDB contact force at TDB A when the TDB motion
control is applied to both TDBs at 1.7 s
RotorTouchdown bearing
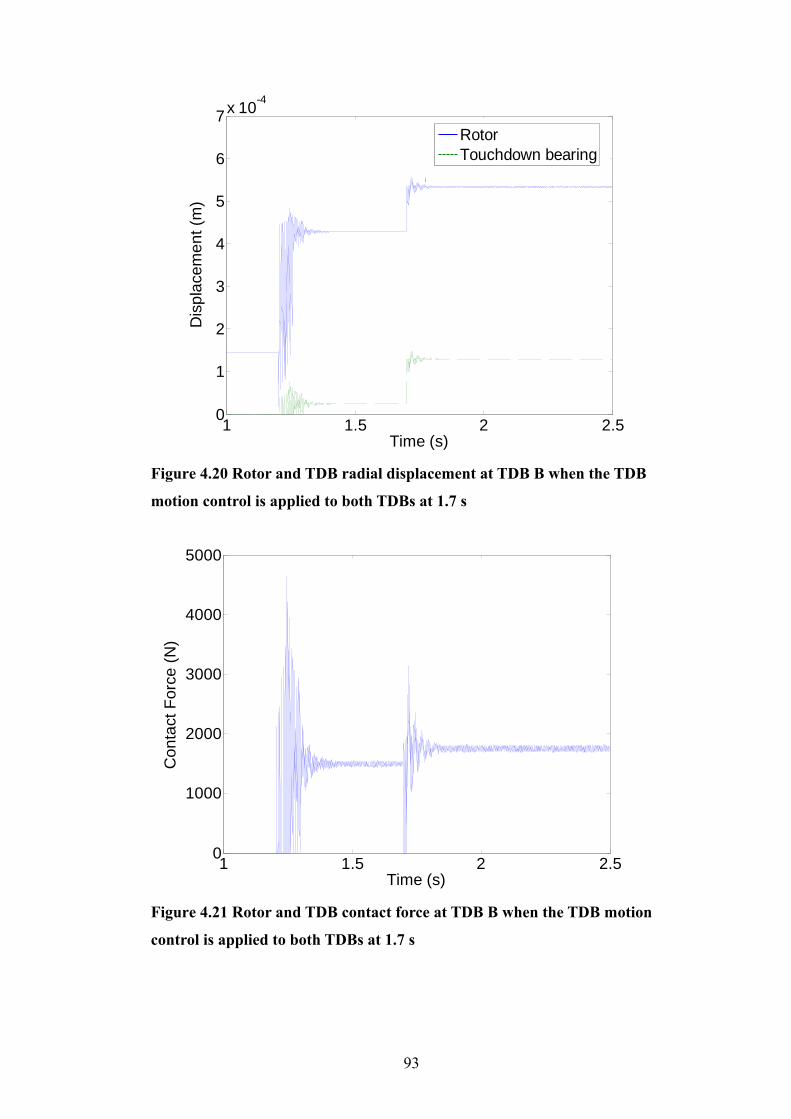
93
1 1.5 2 2.50
1
2
3
4
5
6
7x 10⁻⁴
Time (s)
Dis
plac
emen
t (m
)
Rotor Touchdown Bearing
Figure 4.20 Rotor and TDB radial displacement at TDB B when the TDB
motion control is applied to both TDBs at 1.7 s
1 1.5 2 2.50
1000
2000
3000
4000
5000
Time (s)
Con
tact
For
ce (N
)
Figure 4.21 Rotor and TDB contact force at TDB B when the TDB motion
control is applied to both TDBs at 1.7 s
RotorTouchdown bearing
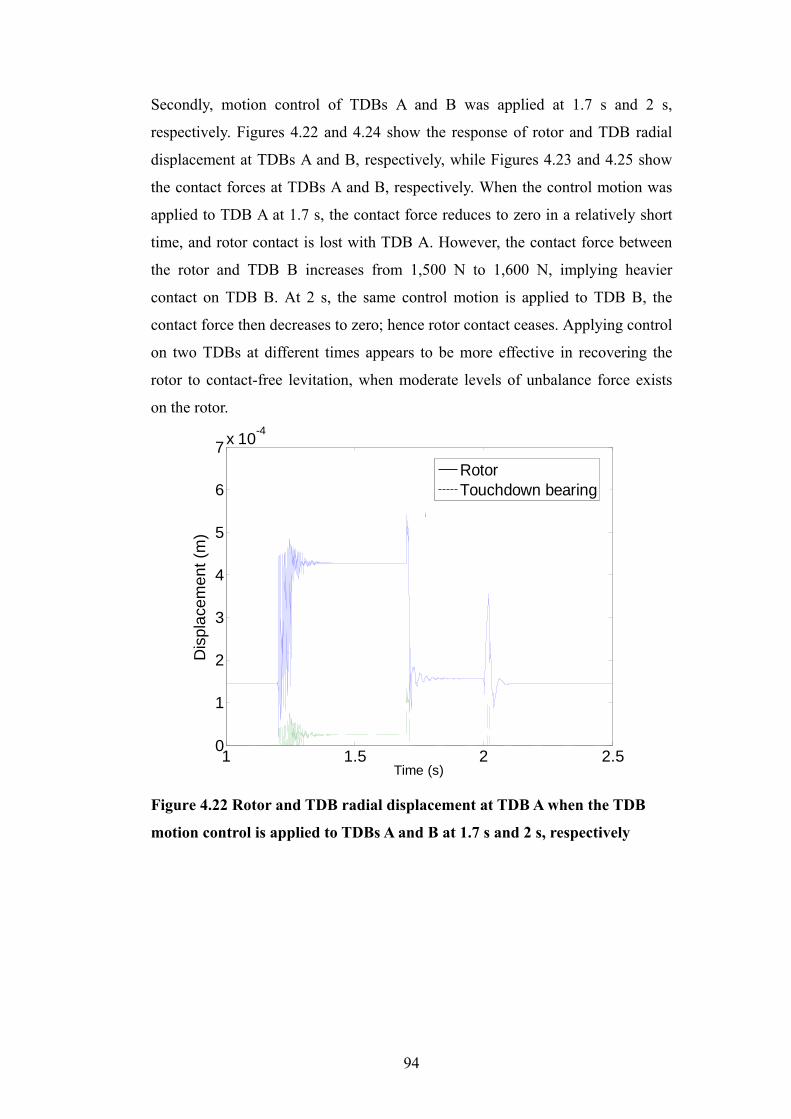
94
Secondly, motion control of TDBs A and B was applied at 1.7 s and 2 s,
respectively. Figures 4.22 and 4.24 show the response of rotor and TDB radial
displacement at TDBs A and B, respectively, while Figures 4.23 and 4.25 show
the contact forces at TDBs A and B, respectively. When the control motion was
applied to TDB A at 1.7 s, the contact force reduces to zero in a relatively short
time, and rotor contact is lost with TDB A. However, the contact force between
the rotor and TDB B increases from 1,500 N to 1,600 N, implying heavier
contact on TDB B. At 2 s, the same control motion is applied to TDB B, the
contact force then decreases to zero; hence rotor contact ceases. Applying control
on two TDBs at different times appears to be more effective in recovering the
rotor to contact-free levitation, when moderate levels of unbalance force exists
on the rotor.
1 1.5 2 2.50
1
2
3
4
5
6
7x 10⁻⁴
Time (s)
Dis
plac
emen
t (m
)
RotorTouchdown Bearing
Figure 4.22 Rotor and TDB radial displacement at TDB A when the TDB
motion control is applied to TDBs A and B at 1.7 s and 2 s, respectively
RotorTouchdown bearing
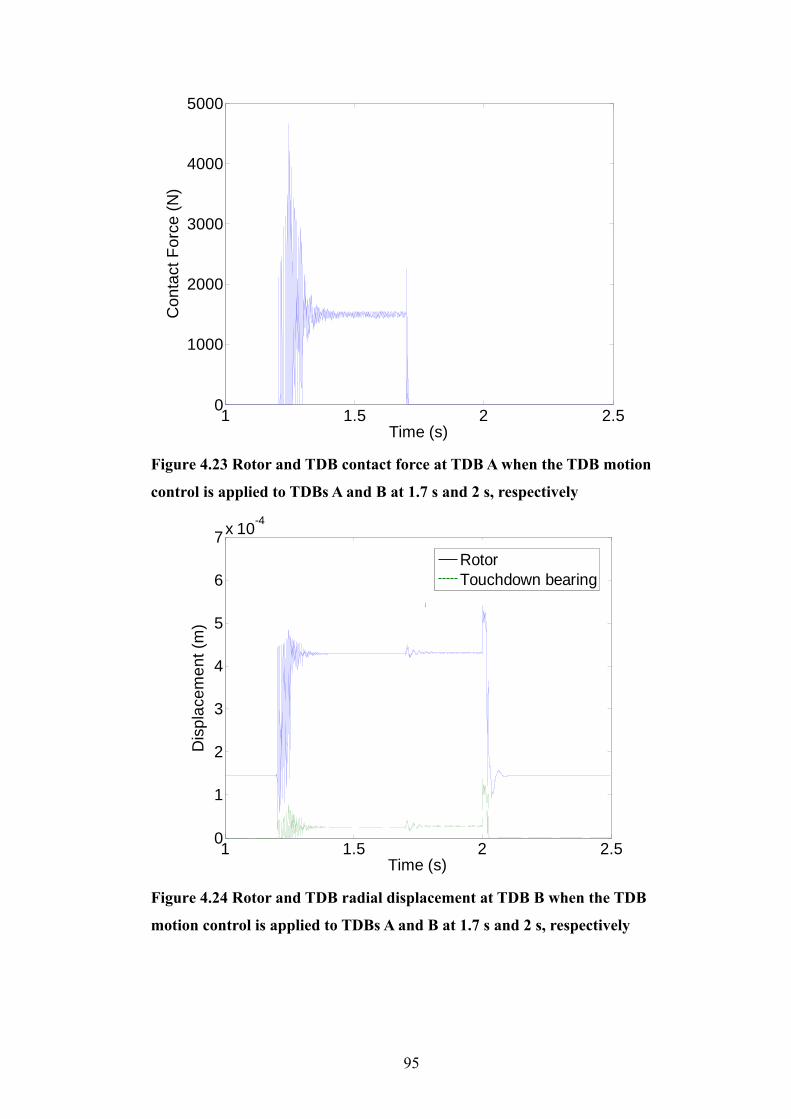
95
1 1.5 2 2.50
1000
2000
3000
4000
5000
Time (s)
Con
tact
For
ce (N
)
Figure 4.23 Rotor and TDB contact force at TDB A when the TDB motion
control is applied to TDBs A and B at 1.7 s and 2 s, respectively
1 1.5 2 2.50
1
2
3
4
5
6
7x 10⁻⁴
Time (s)
Dis
plac
emen
t (m
)
RotorTouchdown Bearing
Figure 4.24 Rotor and TDB radial displacement at TDB B when the TDB
motion control is applied to TDBs A and B at 1.7 s and 2 s, respectively
RotorTouchdown bearing
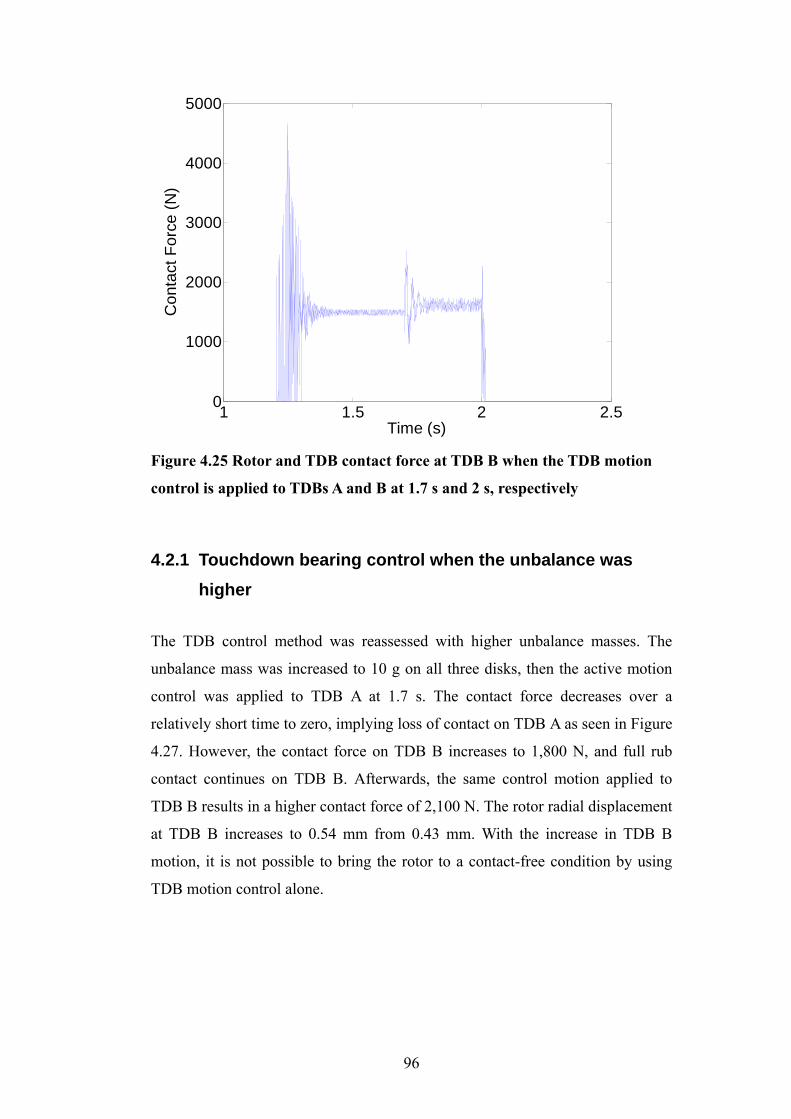
96
1 1.5 2 2.50
1000
2000
3000
4000
5000
Time (s)
Con
tact
For
ce (N
)
Figure 4.25 Rotor and TDB contact force at TDB B when the TDB motion
control is applied to TDBs A and B at 1.7 s and 2 s, respectively
4.2.1 Touchdown bearing control when the unbalance was higher
The TDB control method was reassessed with higher unbalance masses. The
unbalance mass was increased to 10 g on all three disks, then the active motion
control was applied to TDB A at 1.7 s. The contact force decreases over a
relatively short time to zero, implying loss of contact on TDB A as seen in Figure
4.27. However, the contact force on TDB B increases to 1,800 N, and full rub
contact continues on TDB B. Afterwards, the same control motion applied to
TDB B results in a higher contact force of 2,100 N. The rotor radial displacement
at TDB B increases to 0.54 mm from 0.43 mm. With the increase in TDB B
motion, it is not possible to bring the rotor to a contact-free condition by using
TDB motion control alone.
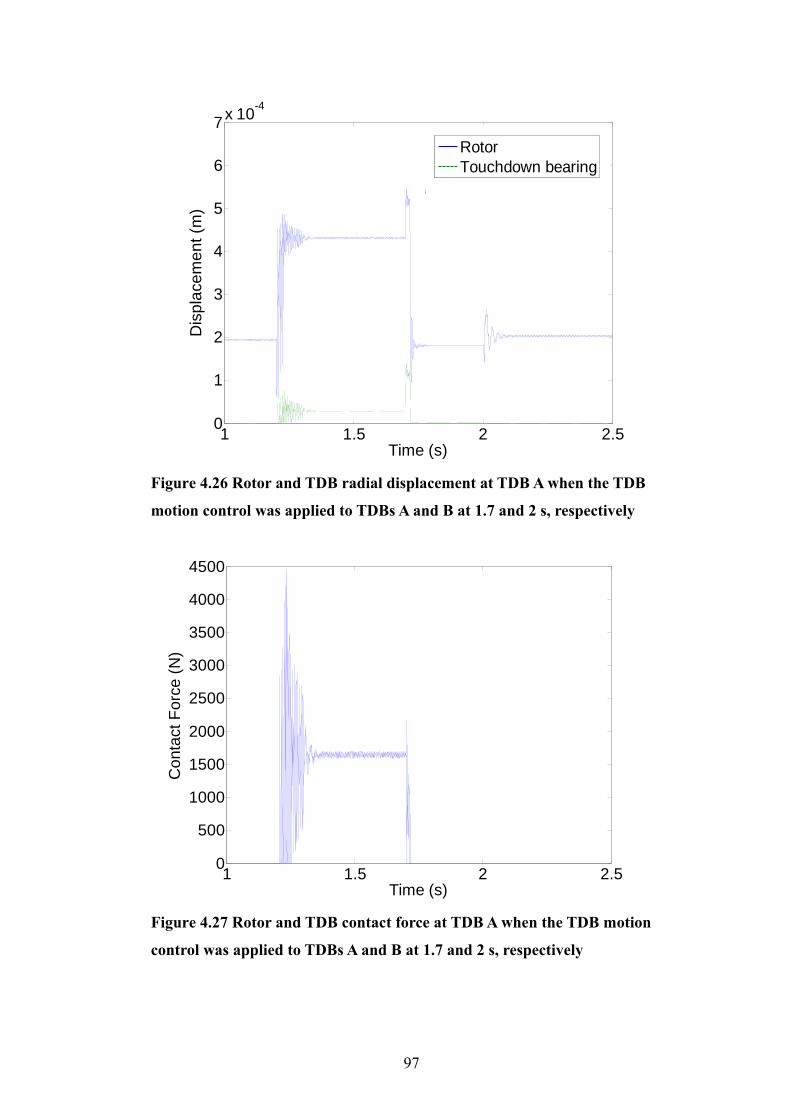
97
1 1.5 2 2.50
1
2
3
4
5
6
7x 10⁻⁴
Time (s)
Dis
plac
emen
t (m
)
Rotor Touchdown Bearing
Figure 4.26 Rotor and TDB radial displacement at TDB A when the TDB
motion control was applied to TDBs A and B at 1.7 and 2 s, respectively
1 1.5 2 2.50
500
1000
1500
2000
2500
3000
3500
4000
4500
Time (s)
Con
tact
For
ce (N
)
Figure 4.27 Rotor and TDB contact force at TDB A when the TDB motion
control was applied to TDBs A and B at 1.7 and 2 s, respectively
RotorTouchdown bearing

98
1 1.5 2 2.50
1
2
3
4
5
6
7x 10⁻⁴
Time (s)
Dis
plac
emen
t (m
)
RotorTouchdown Bearing
Figure 4.28 Rotor and TDB radial displacement at TDB B when the TDB
motion control is applied to TDBs A and B at 1.7 s and 2 s, respectively
1 1.5 2 2.50
500
1000
1500
2000
2500
3000
3500
4000
4500
Time (s)
Con
tact
For
ce (N
)
Figure 4.29 Rotor and TDB contact force at TDB B when the TDB motion
control is applied to TDBs A and B at 1.7 s and 2 s, respectively
RotorTouchdown bearing
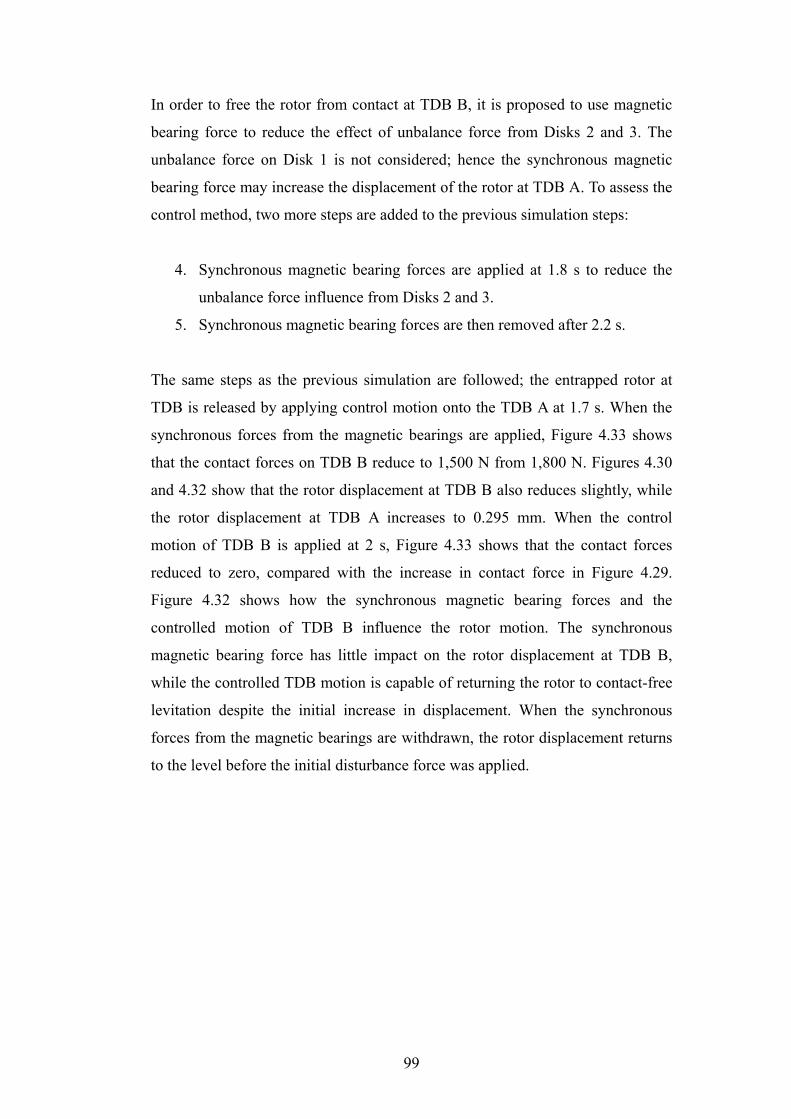
99
In order to free the rotor from contact at TDB B, it is proposed to use magnetic
bearing force to reduce the effect of unbalance force from Disks 2 and 3. The
unbalance force on Disk 1 is not considered; hence the synchronous magnetic
bearing force may increase the displacement of the rotor at TDB A. To assess the
control method, two more steps are added to the previous simulation steps:
4. Synchronous magnetic bearing forces are applied at 1.8 s to reduce the
unbalance force influence from Disks 2 and 3.
5. Synchronous magnetic bearing forces are then removed after 2.2 s.
The same steps as the previous simulation are followed; the entrapped rotor at
TDB is released by applying control motion onto the TDB A at 1.7 s. When the
synchronous forces from the magnetic bearings are applied, Figure 4.33 shows
that the contact forces on TDB B reduce to 1,500 N from 1,800 N. Figures 4.30
and 4.32 show that the rotor displacement at TDB B also reduces slightly, while
the rotor displacement at TDB A increases to 0.295 mm. When the control
motion of TDB B is applied at 2 s, Figure 4.33 shows that the contact forces
reduced to zero, compared with the increase in contact force in Figure 4.29.
Figure 4.32 shows how the synchronous magnetic bearing forces and the
controlled motion of TDB B influence the rotor motion. The synchronous
magnetic bearing force has little impact on the rotor displacement at TDB B,
while the controlled TDB motion is capable of returning the rotor to contact-free
levitation despite the initial increase in displacement. When the synchronous
forces from the magnetic bearings are withdrawn, the rotor displacement returns
to the level before the initial disturbance force was applied.
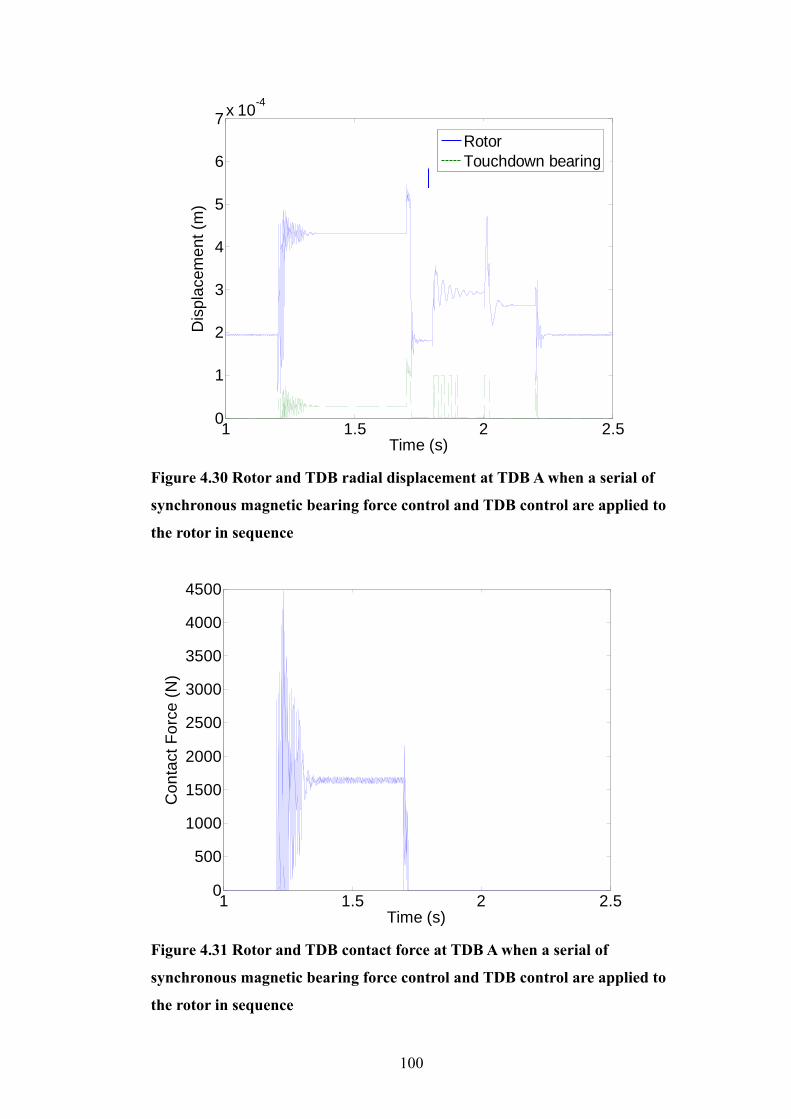
100
1 1.5 2 2.50
1
2
3
4
5
6
7x 10⁻⁴
Time (s)
Dis
plac
emen
t (m
)
RotorTouchdown Bearing
Figure 4.30 Rotor and TDB radial displacement at TDB A when a serial of
synchronous magnetic bearing force control and TDB control are applied to
the rotor in sequence
1 1.5 2 2.50
500
1000
1500
2000
2500
3000
3500
4000
4500
Time (s)
Con
tact
For
ce (N
)
Figure 4.31 Rotor and TDB contact force at TDB A when a serial of
synchronous magnetic bearing force control and TDB control are applied to
the rotor in sequence
RotorTouchdown bearing
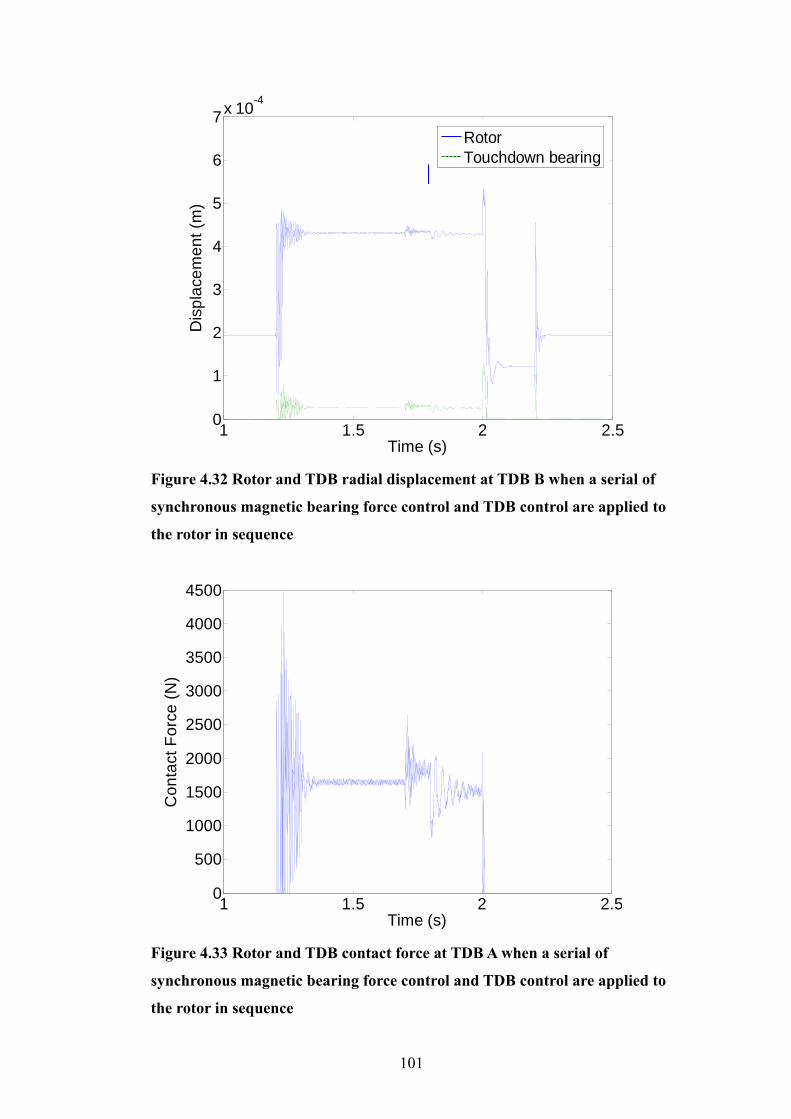
101
1 1.5 2 2.50
1
2
3
4
5
6
7x 10⁻⁴
Time (s)
Dis
plac
emen
t (m
)
RotorTouchdown Bearing
Figure 4.32 Rotor and TDB radial displacement at TDB B when a serial of
synchronous magnetic bearing force control and TDB control are applied to
the rotor in sequence
1 1.5 2 2.50
500
1000
1500
2000
2500
3000
3500
4000
4500
Time (s)
Con
tact
For
ce (N
)
Figure 4.33 Rotor and TDB contact force at TDB A when a serial of
synchronous magnetic bearing force control and TDB control are applied to
the rotor in sequence
RotorTouchdown bearing
102
It has been demonstrated that, for certain levels of unbalance and running speeds,
the rotor may co-exist in either a normal contact-free orbit or in a persistent
condition involving rub or bounce-like contact with one or more TDBs. The rotor
may undergo the transition from the contact-free orbit to the contact condition if
an external disturbance is applied to the system. In principle, the reverse
transition is possible if another force is applied to the rotor at the correct position
and in the correct time. It has been found that it is possible to use available active
magnetic bearing force or to use active motion of the TDBs. The rotor dynamics
under TDB contact are complex and nonlinear, which makes definitive control
strategies difficult to specify. For certain unbalance distributions, when rotor
makes contact with one TDB, active TDB motion alone or active magnetic
bearing synchronous control may be sufficient to bring the rotor out of contact.
However, at the same running speed, the rotor may make contact with more than
one TDBs with a different unbalance distribution. It may require active TDB
control in tandem with active magnetic bearing synchronous control to bring
rotor out of contact when the level of unbalance force is high. It may also be
beneficial to sequence the control of the active TDB with appropriate time delays
to achieve rotor contact-free levitation from a persistent consistent contact
condition.
4.2.2 Touchdown bearing control when the rotational speed was lower
The active TDB control method has been demonstrated to be effective about the
rotor’s first flexural critical frequency. The rotor’s rigid body modes are also
important at relatively low operating speed, hence the active TDB control
method was analysed at speeds above its first natural critical frequency. As
shown in the previous simulation results, the rotor’s rigid body mode was well
damped by high magnetic bearing damping influences. For demonstration
purposes, the magnetic bearing damping was reduced to make the rotor’s rigid
body mode become more noticeable. The magnetic bearing stiffness was also
adjusted with the aim to keep the rotor’s first critical frequency well below its
first flexural frequency. The magnetic bearing stiffness and damping are shown
in Table 4.3.
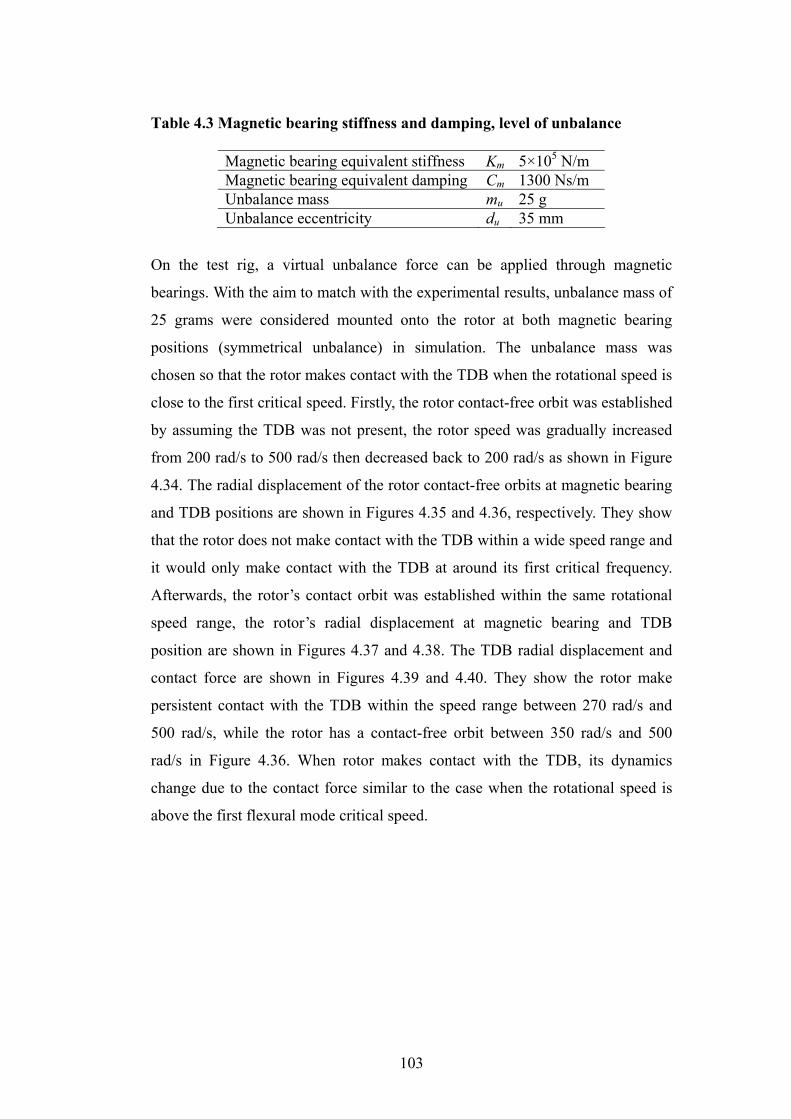
103
Table 4.3 Magnetic bearing stiffness and damping, level of unbalance
Magnetic bearing equivalent stiffness Km 5×10⁵ N/m Magnetic bearing equivalent damping Cm 1300 Ns/m Unbalance mass mu 25 g Unbalance eccentricity du 35 mm
On the test rig, a virtual unbalance force can be applied through magnetic
bearings. With the aim to match with the experimental results, unbalance mass of
25 grams were considered mounted onto the rotor at both magnetic bearing
positions (symmetrical unbalance) in simulation. The unbalance mass was
chosen so that the rotor makes contact with the TDB when the rotational speed is
close to the first critical speed. Firstly, the rotor contact-free orbit was established
by assuming the TDB was not present, the rotor speed was gradually increased
from 200 rad/s to 500 rad/s then decreased back to 200 rad/s as shown in Figure
4.34. The radial displacement of the rotor contact-free orbits at magnetic bearing
and TDB positions are shown in Figures 4.35 and 4.36, respectively. They show
that the rotor does not make contact with the TDB within a wide speed range and
it would only make contact with the TDB at around its first critical frequency.
Afterwards, the rotor’s contact orbit was established within the same rotational
speed range, the rotor’s radial displacement at magnetic bearing and TDB
position are shown in Figures 4.37 and 4.38. The TDB radial displacement and
contact force are shown in Figures 4.39 and 4.40. They show the rotor make
persistent contact with the TDB within the speed range between 270 rad/s and
500 rad/s, while the rotor has a contact-free orbit between 350 rad/s and 500
rad/s in Figure 4.36. When rotor makes contact with the TDB, its dynamics
change due to the contact force similar to the case when the rotational speed is
above the first flexural mode critical speed.
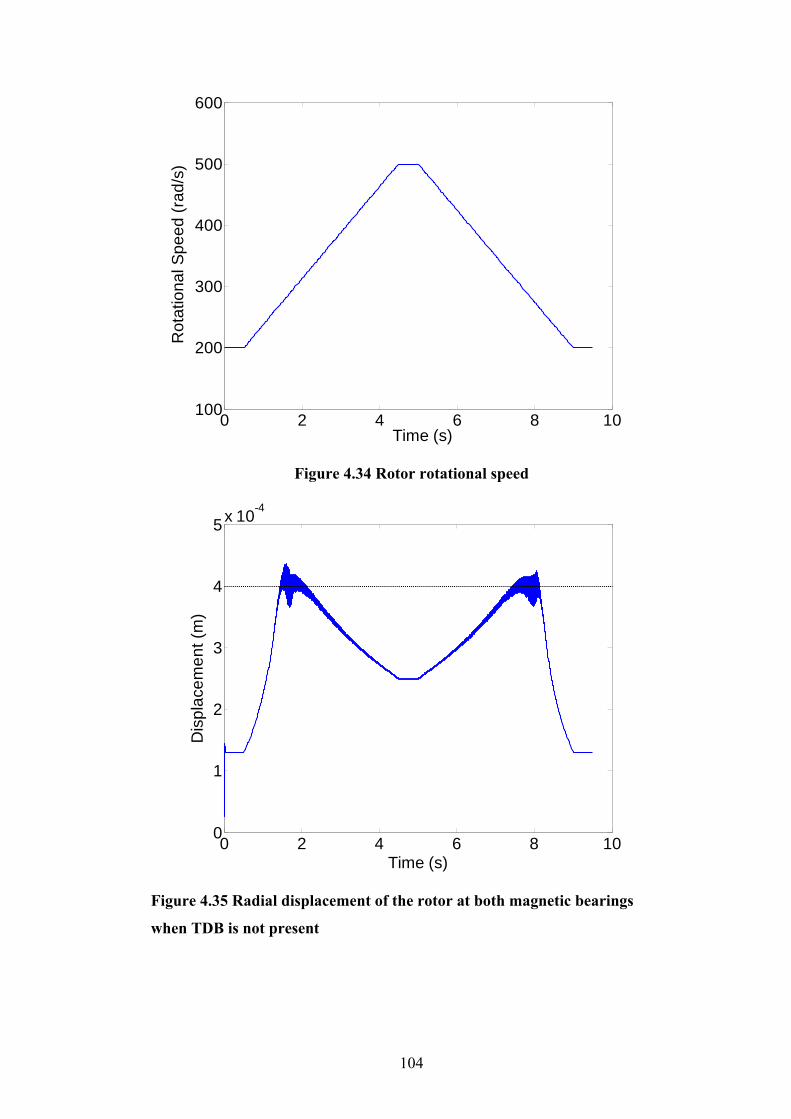
104
0 2 4 6 8 10100
200
300
400
500
600
Time (s)
Rot
atio
nal S
peed
(rad
/s)
Figure 4.34 Rotor rotational speed
0 2 4 6 8 100
1
2
3
4
5x 10⁻⁴
Time (s)
Dis
plac
emen
t (m
)
Figure 4.35 Radial displacement of the rotor at both magnetic bearings
when TDB is not present
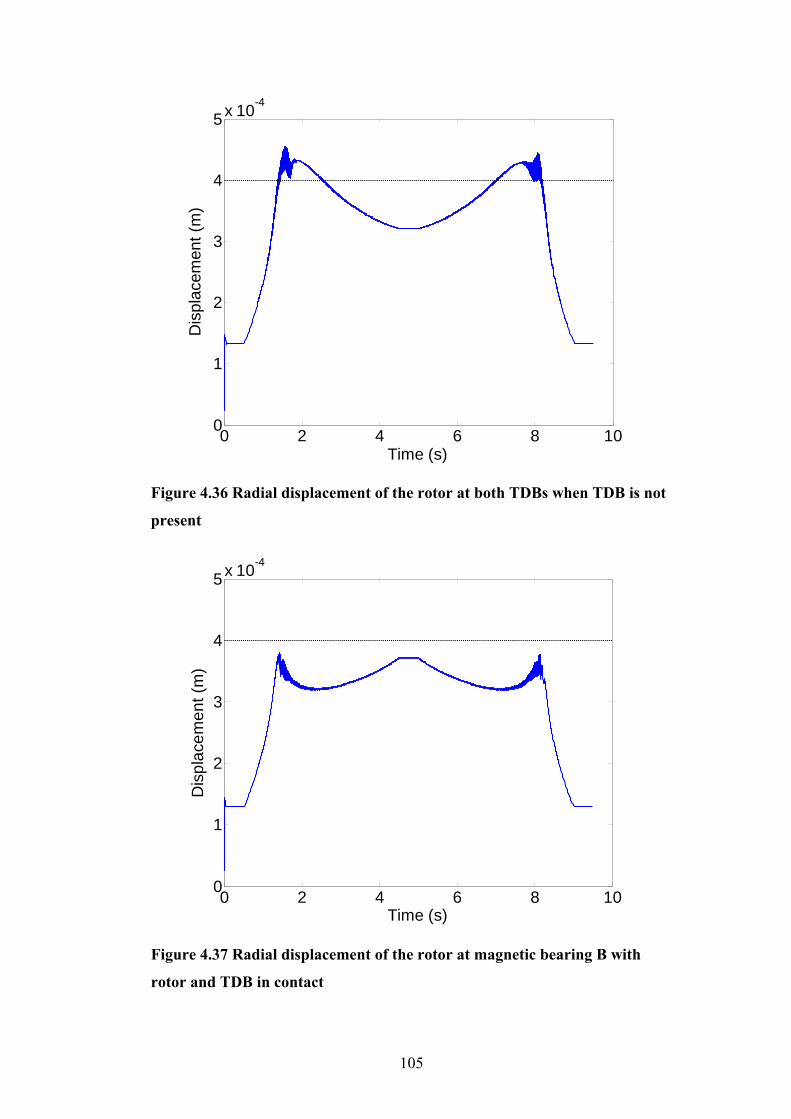
105
0 2 4 6 8 100
1
2
3
4
5x 10⁻⁴
Time (s)
Dis
plac
emen
t (m
)
Figure 4.36 Radial displacement of the rotor at both TDBs when TDB is not
present
0 2 4 6 8 100
1
2
3
4
5x 10⁻⁴
Time (s)
Dis
plac
emen
t (m
)
Figure 4.37 Radial displacement of the rotor at magnetic bearing B with
rotor and TDB in contact
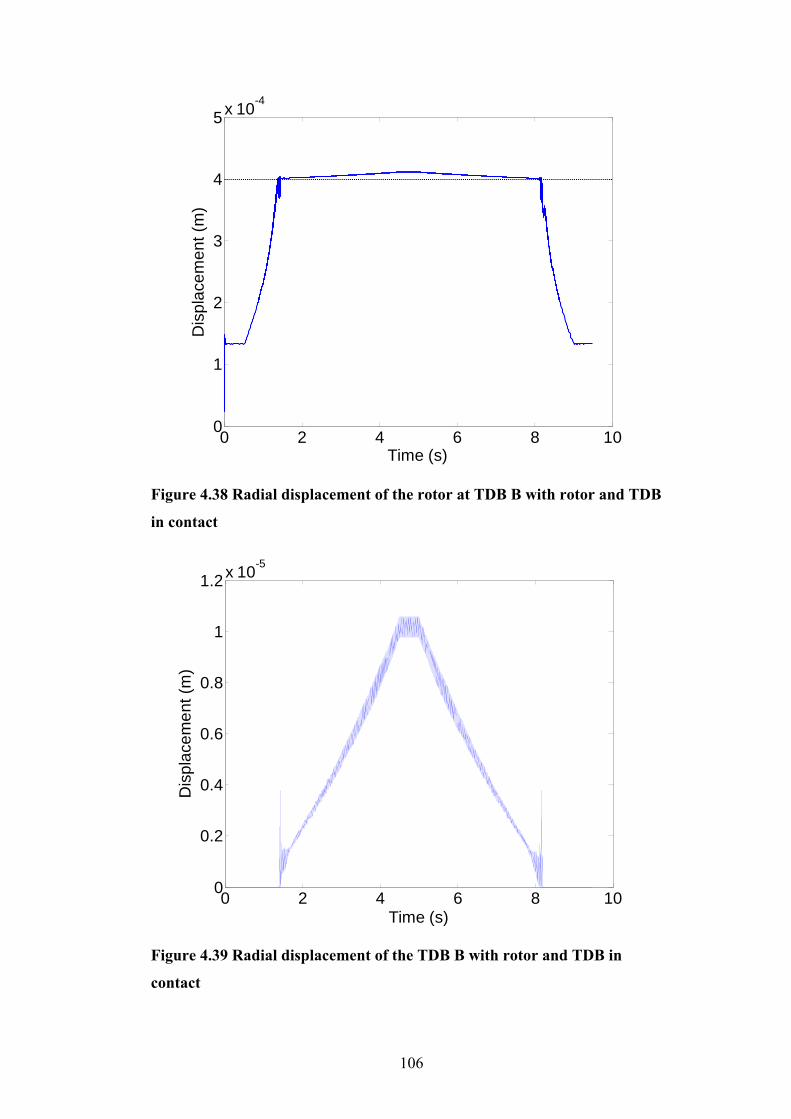
106
0 2 4 6 8 100
1
2
3
4
5x 10⁻⁴
Time (s)
Dis
plac
emen
t (m
)
Figure 4.38 Radial displacement of the rotor at TDB B with rotor and TDB
in contact
0 2 4 6 8 100
0.2
0.4
0.6
0.8
1
1.2x 10⁻⁵
Time (s)
Dis
plac
emen
t (m
)
Figure 4.39 Radial displacement of the TDB B with rotor and TDB in
contact
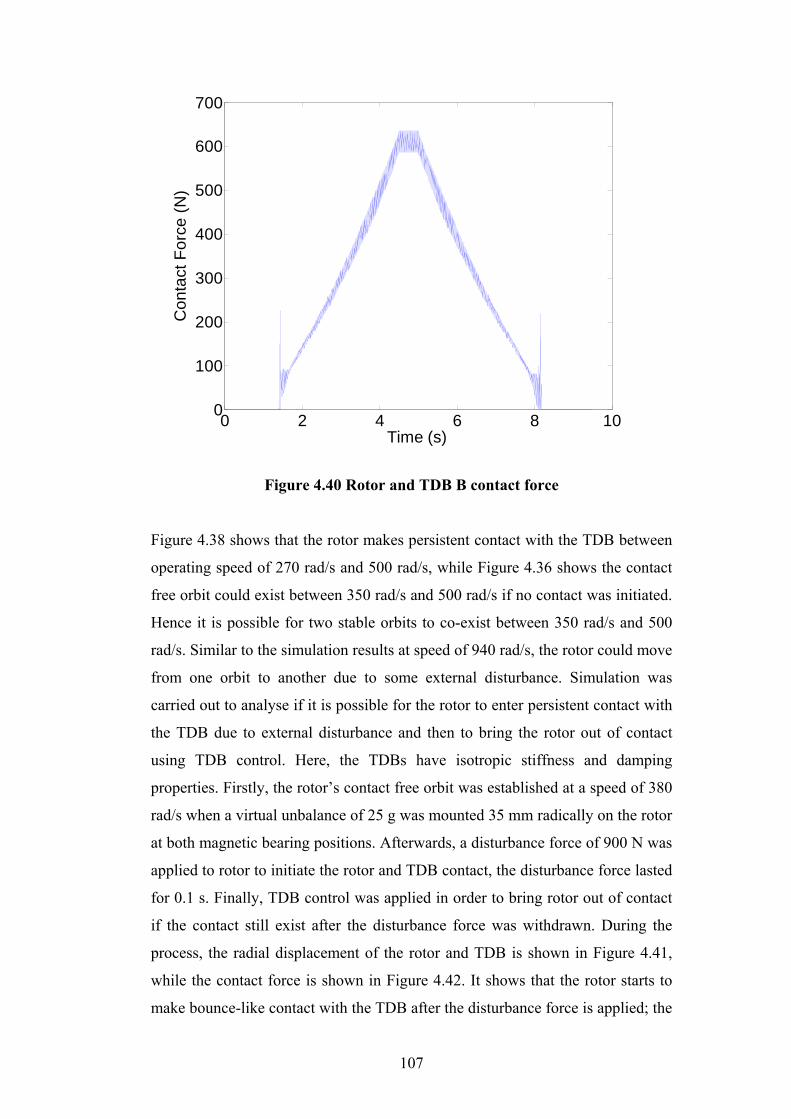
107
0 2 4 6 8 100
100
200
300
400
500
600
700
Time (s)
Con
tact
For
ce (N
)
Figure 4.40 Rotor and TDB B contact force
Figure 4.38 shows that the rotor makes persistent contact with the TDB between
operating speed of 270 rad/s and 500 rad/s, while Figure 4.36 shows the contact
free orbit could exist between 350 rad/s and 500 rad/s if no contact was initiated.
Hence it is possible for two stable orbits to co-exist between 350 rad/s and 500
rad/s. Similar to the simulation results at speed of 940 rad/s, the rotor could move
from one orbit to another due to some external disturbance. Simulation was
carried out to analyse if it is possible for the rotor to enter persistent contact with
the TDB due to external disturbance and then to bring the rotor out of contact
using TDB control. Here, the TDBs have isotropic stiffness and damping
properties. Firstly, the rotor’s contact free orbit was established at a speed of 380
rad/s when a virtual unbalance of 25 g was mounted 35 mm radically on the rotor
at both magnetic bearing positions. Afterwards, a disturbance force of 900 N was
applied to rotor to initiate the rotor and TDB contact, the disturbance force lasted
for 0.1 s. Finally, TDB control was applied in order to bring rotor out of contact
if the contact still exist after the disturbance force was withdrawn. During the
process, the radial displacement of the rotor and TDB is shown in Figure 4.41,
while the contact force is shown in Figure 4.42. It shows that the rotor starts to
make bounce-like contact with the TDB after the disturbance force is applied; the

108
rotor orbit increases from 2.65 mm to 4.1 mm. Persistent contact is achieved after
the disturbance is withdrawn. High contact forces of 2500 N are observed when
the disturbance force is applied. The contact force reduces to zero when the TDB
control was applied at 0.4 s, with the rotor radial displacement reduced back to
2.65 mm. The same TDB control method of moving the TDB in the same
direction as the rotor was used here.
0.1 0.2 0.3 0.4 0.5 0.60
1
2
3
4
5
6
x 10-4
Time (s)
Dis
plac
emen
t (m
)
RotorTouchdown Bearing
Figure 4.41 Rotor and TDB radial displacement when disturbance force is
applied at 0.2 s and the TDB motion control is applied at 0.4 s
RotorTouchdown bearing
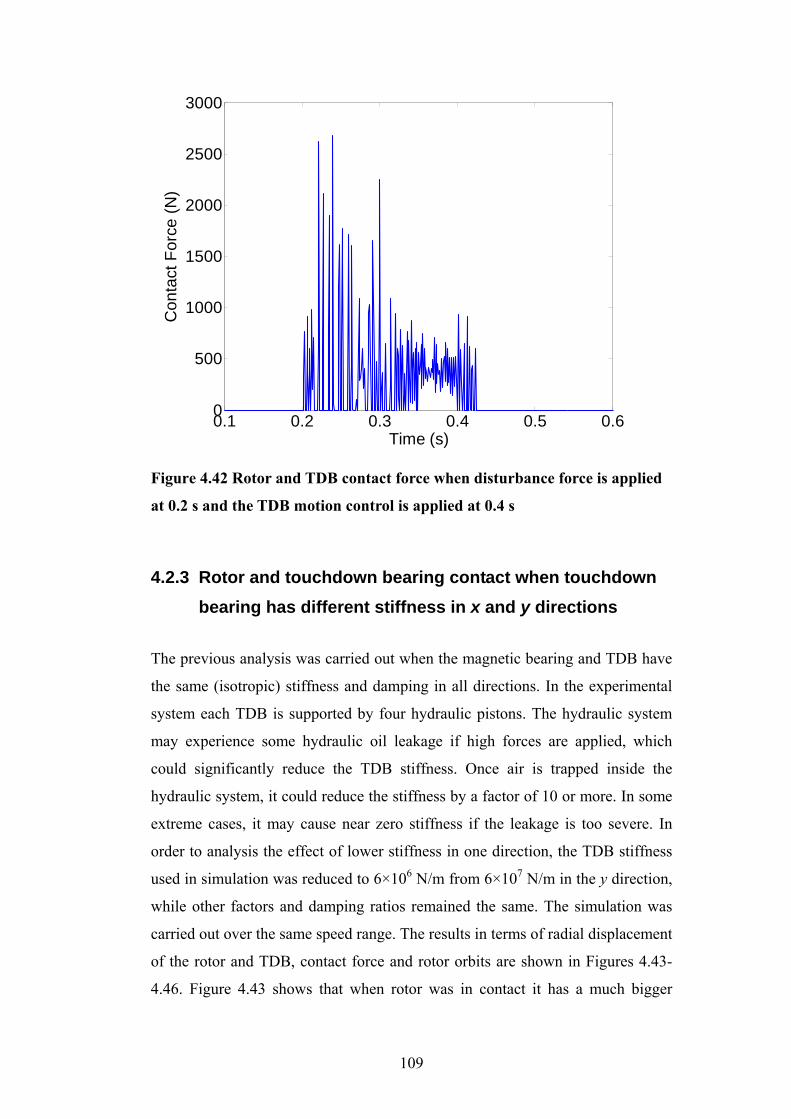
109
0.1 0.2 0.3 0.4 0.5 0.60
500
1000
1500
2000
2500
3000
Time (s)
Con
tact
For
ce (N
)
Figure 4.42 Rotor and TDB contact force when disturbance force is applied
at 0.2 s and the TDB motion control is applied at 0.4 s
4.2.3 Rotor and touchdown bearing contact when touchdown bearing has different stiffness in x and y directions
The previous analysis was carried out when the magnetic bearing and TDB have
the same (isotropic) stiffness and damping in all directions. In the experimental
system each TDB is supported by four hydraulic pistons. The hydraulic system
may experience some hydraulic oil leakage if high forces are applied, which
could significantly reduce the TDB stiffness. Once air is trapped inside the
hydraulic system, it could reduce the stiffness by a factor of 10 or more. In some
extreme cases, it may cause near zero stiffness if the leakage is too severe. In
order to analysis the effect of lower stiffness in one direction, the TDB stiffness
used in simulation was reduced to 6×10⁶ N/m from 6×10⁷ N/m in the y direction,
while other factors and damping ratios remained the same. The simulation was
carried out over the same speed range. The results in terms of radial displacement
of the rotor and TDB, contact force and rotor orbits are shown in Figures 4.43-
4.46. Figure 4.43 shows that when rotor was in contact it has a much bigger
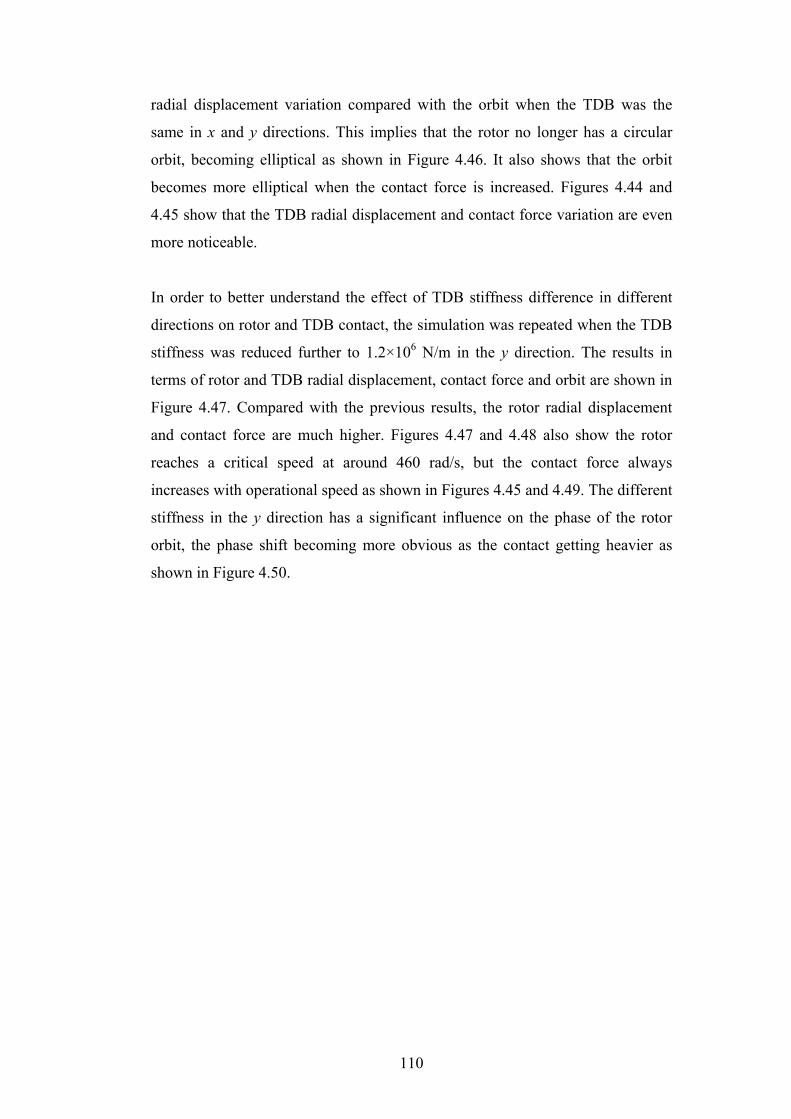
110
radial displacement variation compared with the orbit when the TDB was the
same in x and y directions. This implies that the rotor no longer has a circular
orbit, becoming elliptical as shown in Figure 4.46. It also shows that the orbit
becomes more elliptical when the contact force is increased. Figures 4.44 and
4.45 show that the TDB radial displacement and contact force variation are even
more noticeable.
In order to better understand the effect of TDB stiffness difference in different
directions on rotor and TDB contact, the simulation was repeated when the TDB
stiffness was reduced further to 1.2×10⁶ N/m in the y direction. The results in
terms of rotor and TDB radial displacement, contact force and orbit are shown in
Figure 4.47. Compared with the previous results, the rotor radial displacement
and contact force are much higher. Figures 4.47 and 4.48 also show the rotor
reaches a critical speed at around 460 rad/s, but the contact force always
increases with operational speed as shown in Figures 4.45 and 4.49. The different
stiffness in the y direction has a significant influence on the phase of the rotor
orbit, the phase shift becoming more obvious as the contact getting heavier as
shown in Figure 4.50.
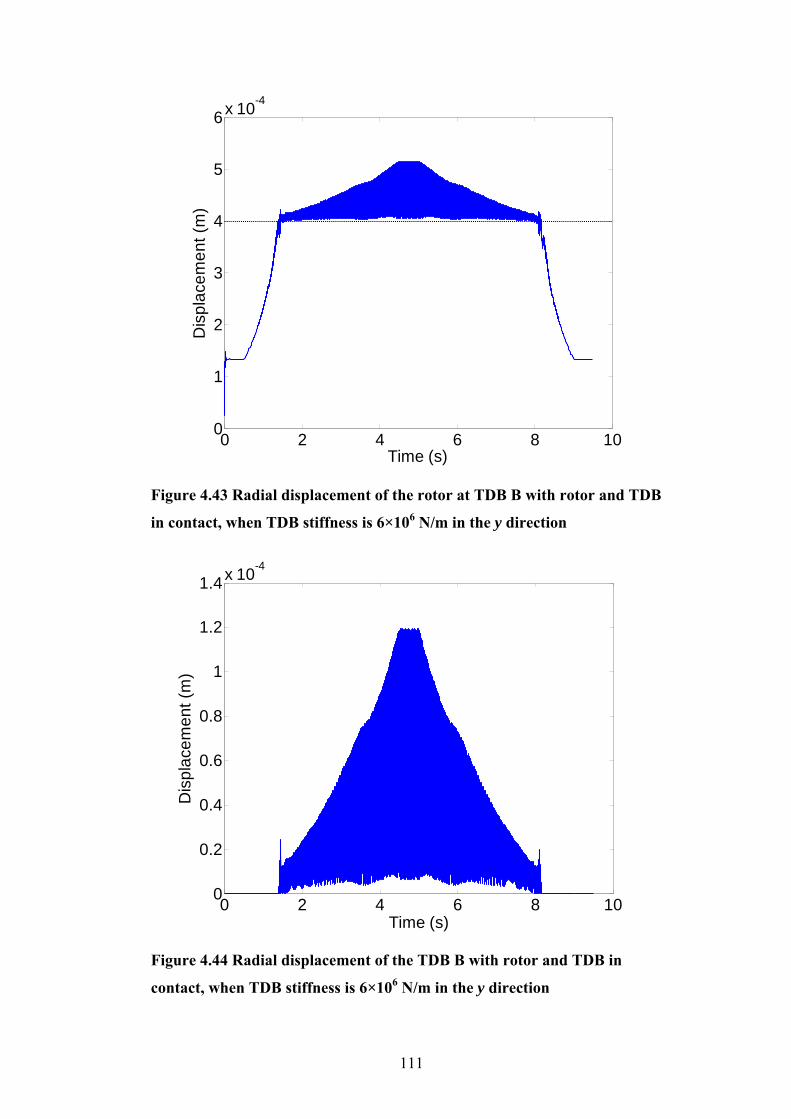
111
0 2 4 6 8 100
1
2
3
4
5
6x 10⁻⁴
Time (s)
Dis
plac
emen
t (m
)
Figure 4.43 Radial displacement of the rotor at TDB B with rotor and TDB
in contact, when TDB stiffness is 6×10⁶ N/m in the y direction
0 2 4 6 8 100
0.2
0.4
0.6
0.8
1
1.2
1.4x 10⁻⁴
Time (s)
Dis
plac
emen
t (m
)
Figure 4.44 Radial displacement of the TDB B with rotor and TDB in
contact, when TDB stiffness is 6×10⁶ N/m in the y direction

112
0 2 4 6 8 100
200
400
600
800
1000
Time (s)
Con
tact
For
ce (N
)
Figure 4.45 Rotor and TDB B contact force when TDB stiffness is 6×10⁶ N/m
in the y direction
-6 -4 -2 0 2 4 6x 10⁻⁴
-6
-4
-2
0
2
4
6x 10⁻⁴
x (m)
y (m
)
-6 -4 -2 0 2 4
x 10-4
-6
-4
-2
0
2
4
6x 10⁻⁴
x (mm)
y (m
m)
Figure 4.46 Rotor orbit at TDB B at rotational speed of 380 rad/s (left) and
500 rad/s (right) when TDB stiffness is 6×10⁶ N/m in the y direction
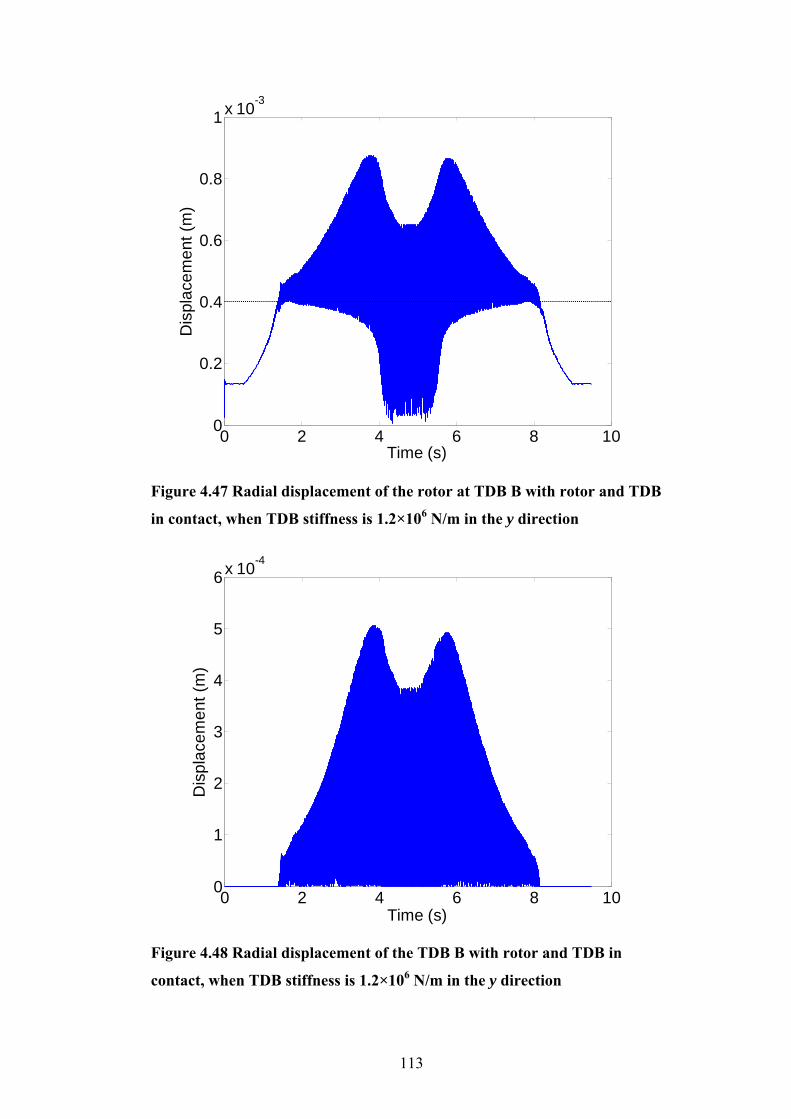
113
0 2 4 6 8 100
0.2
0.4
0.6
0.8
1x 10⁻³
Time (s)
Dis
plac
emen
t (m
)
Figure 4.47 Radial displacement of the rotor at TDB B with rotor and TDB
in contact, when TDB stiffness is 1.2×10⁶ N/m in the y direction
0 2 4 6 8 100
1
2
3
4
5
6x 10⁻⁴
Time (s)
Dis
plac
emen
t (m
)
Figure 4.48 Radial displacement of the TDB B with rotor and TDB in
contact, when TDB stiffness is 1.2×10⁶ N/m in the y direction
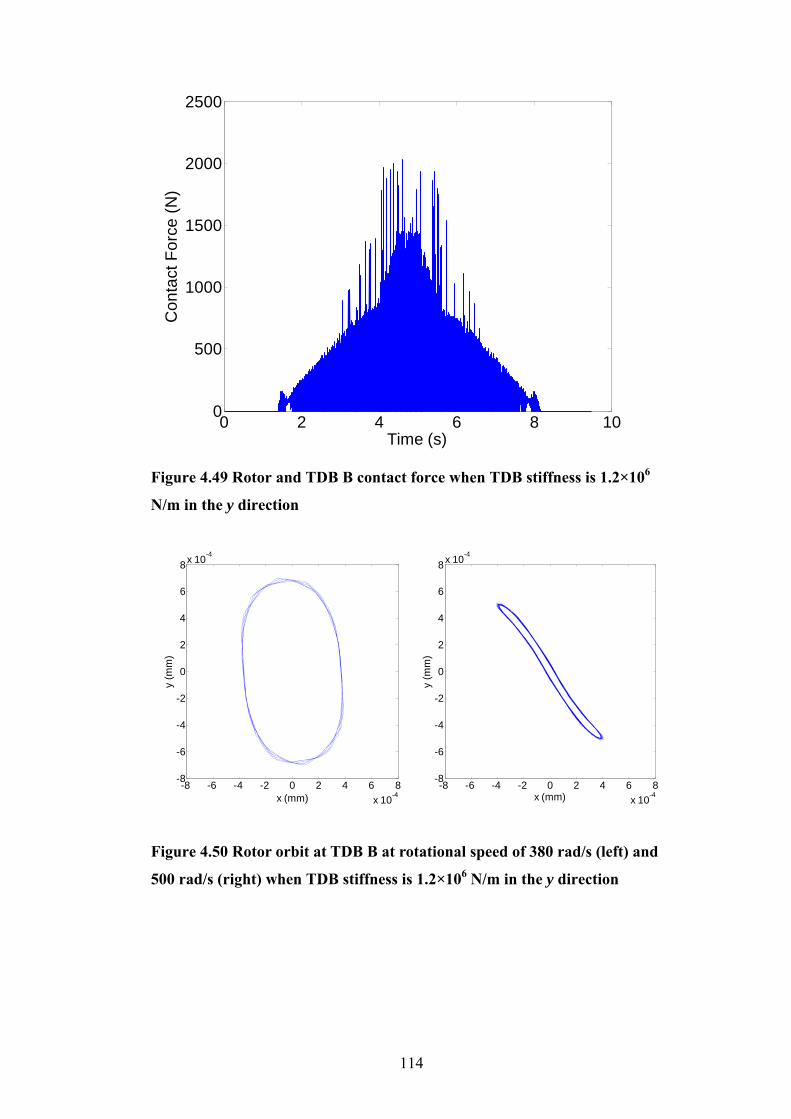
114
0 2 4 6 8 100
500
1000
1500
2000
2500
Time (s)
Con
tact
For
ce (N
)
Figure 4.49 Rotor and TDB B contact force when TDB stiffness is 1.2×10⁶
N/m in the y direction
-8 -6 -4 -2 0 2 4 6 8x 10⁻⁴
-8
-6
-4
-2
0
2
4
6
8x 10⁻⁴
x (mm)
y (m
m)
-8 -6 -4 -2 0 2 4 6 8
x 10-4
-8
-6
-4
-2
0
2
4
6
8x 10⁻⁴
x (mm)
y (m
m)
Figure 4.50 Rotor orbit at TDB B at rotational speed of 380 rad/s (left) and
500 rad/s (right) when TDB stiffness is 1.2×10⁶ N/m in the y direction
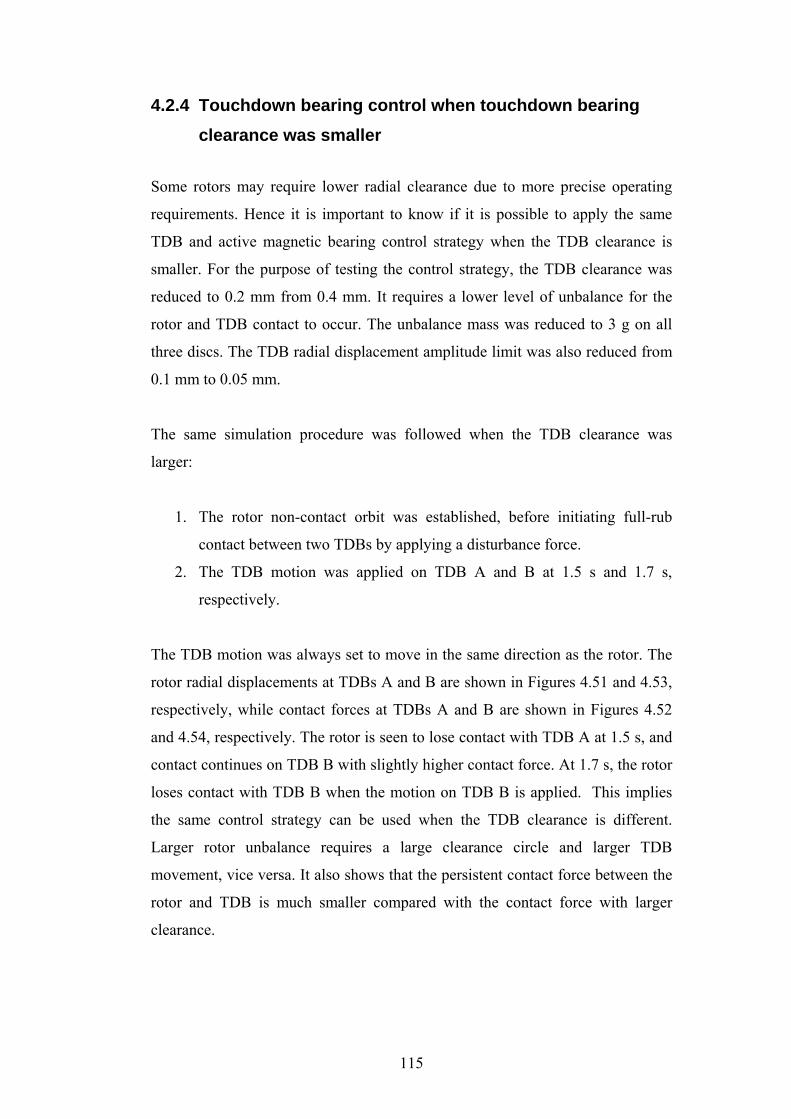
115
4.2.4 Touchdown bearing control when touchdown bearing clearance was smaller
Some rotors may require lower radial clearance due to more precise operating
requirements. Hence it is important to know if it is possible to apply the same
TDB and active magnetic bearing control strategy when the TDB clearance is
smaller. For the purpose of testing the control strategy, the TDB clearance was
reduced to 0.2 mm from 0.4 mm. It requires a lower level of unbalance for the
rotor and TDB contact to occur. The unbalance mass was reduced to 3 g on all
three discs. The TDB radial displacement amplitude limit was also reduced from
0.1 mm to 0.05 mm.
The same simulation procedure was followed when the TDB clearance was
larger:
1. The rotor non-contact orbit was established, before initiating full-rub
contact between two TDBs by applying a disturbance force.
2. The TDB motion was applied on TDB A and B at 1.5 s and 1.7 s,
respectively.
The TDB motion was always set to move in the same direction as the rotor. The
rotor radial displacements at TDBs A and B are shown in Figures 4.51 and 4.53,
respectively, while contact forces at TDBs A and B are shown in Figures 4.52
and 4.54, respectively. The rotor is seen to lose contact with TDB A at 1.5 s, and
contact continues on TDB B with slightly higher contact force. At 1.7 s, the rotor
loses contact with TDB B when the motion on TDB B is applied. This implies
the same control strategy can be used when the TDB clearance is different.
Larger rotor unbalance requires a large clearance circle and larger TDB
movement, vice versa. It also shows that the persistent contact force between the
rotor and TDB is much smaller compared with the contact force with larger
clearance.

116
1 1.2 1.4 1.6 1.8 20
1
2
3x 10⁻⁴
Time (s)
Dis
plac
emen
t (m
)
RotorTouchdown Bearing
Figure 4.51 Rotor and TDB radial displacement at TDB A , when the TDB
motion control is applied to TDBs A and B at 1.5 s and 1.7 s, respectively
1 1.2 1.4 1.6 1.8 20
200
400
600
800
1000
1200
1400
1600
1800
Time (s)
Con
tact
For
ce (N
)
Figure 4.52 Rotor and TDB contact force at TDB A when the TDB motion
control is applied to TDBs A and B at 1.5 s and 1.7 s, respectively
RotorTouchdown bearing

117
1 1.2 1.4 1.6 1.8 20
1
2
3
x 10-4
Time (s)
Dis
plac
emen
t (m
)
RotorTouchdown Bearing
Figure 4.53 Rotor and TDB radial displacement at TDB B , when the TDB
motion control is applied to TDBs A and B at 1.5 s and 1.7 s, respectively
1 1.2 1.4 1.6 1.8 20
200
400
600
800
1000
1200
1400
1600
1800
Time (s)
Con
tact
For
ce (N
)
Figure 4.54 Rotor and TDB contact force at TDB B when the TDB motion
control is applied to TDBs A and B at 1.5 s and 1.7 s, respectively
RotorTouchdown bearing
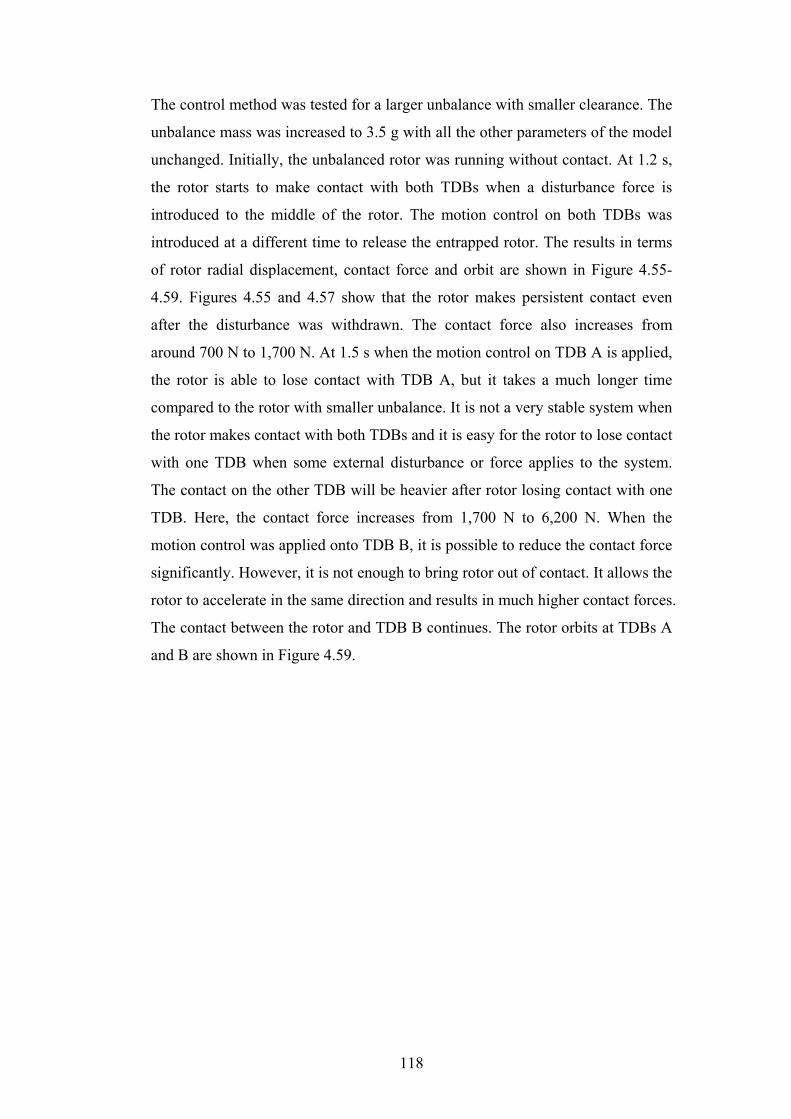
118
The control method was tested for a larger unbalance with smaller clearance. The
unbalance mass was increased to 3.5 g with all the other parameters of the model
unchanged. Initially, the unbalanced rotor was running without contact. At 1.2 s,
the rotor starts to make contact with both TDBs when a disturbance force is
introduced to the middle of the rotor. The motion control on both TDBs was
introduced at a different time to release the entrapped rotor. The results in terms
of rotor radial displacement, contact force and orbit are shown in Figure 4.55-
4.59. Figures 4.55 and 4.57 show that the rotor makes persistent contact even
after the disturbance was withdrawn. The contact force also increases from
around 700 N to 1,700 N. At 1.5 s when the motion control on TDB A is applied,
the rotor is able to lose contact with TDB A, but it takes a much longer time
compared to the rotor with smaller unbalance. It is not a very stable system when
the rotor makes contact with both TDBs and it is easy for the rotor to lose contact
with one TDB when some external disturbance or force applies to the system.
The contact on the other TDB will be heavier after rotor losing contact with one
TDB. Here, the contact force increases from 1,700 N to 6,200 N. When the
motion control was applied onto TDB B, it is possible to reduce the contact force
significantly. However, it is not enough to bring rotor out of contact. It allows the
rotor to accelerate in the same direction and results in much higher contact forces.
The contact between the rotor and TDB B continues. The rotor orbits at TDBs A
and B are shown in Figure 4.59.
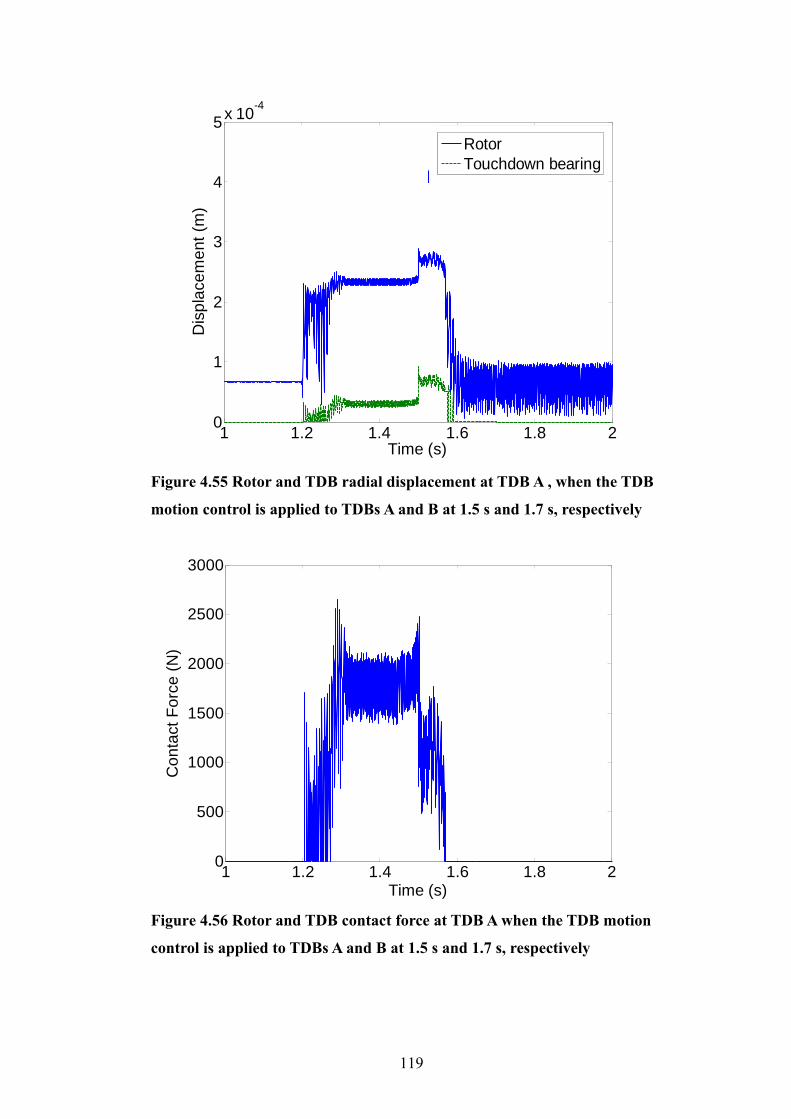
119
1 1.2 1.4 1.6 1.8 20
1
2
3
4
5x 10⁻⁴
Time (s)
Dis
plac
emen
t (m
)
RotorTouchdown Bearing
Figure 4.55 Rotor and TDB radial displacement at TDB A , when the TDB
motion control is applied to TDBs A and B at 1.5 s and 1.7 s, respectively
1 1.2 1.4 1.6 1.8 20
500
1000
1500
2000
2500
3000
Time (s)
Con
tact
For
ce (N
)
Figure 4.56 Rotor and TDB contact force at TDB A when the TDB motion
control is applied to TDBs A and B at 1.5 s and 1.7 s, respectively
RotorTouchdown bearing
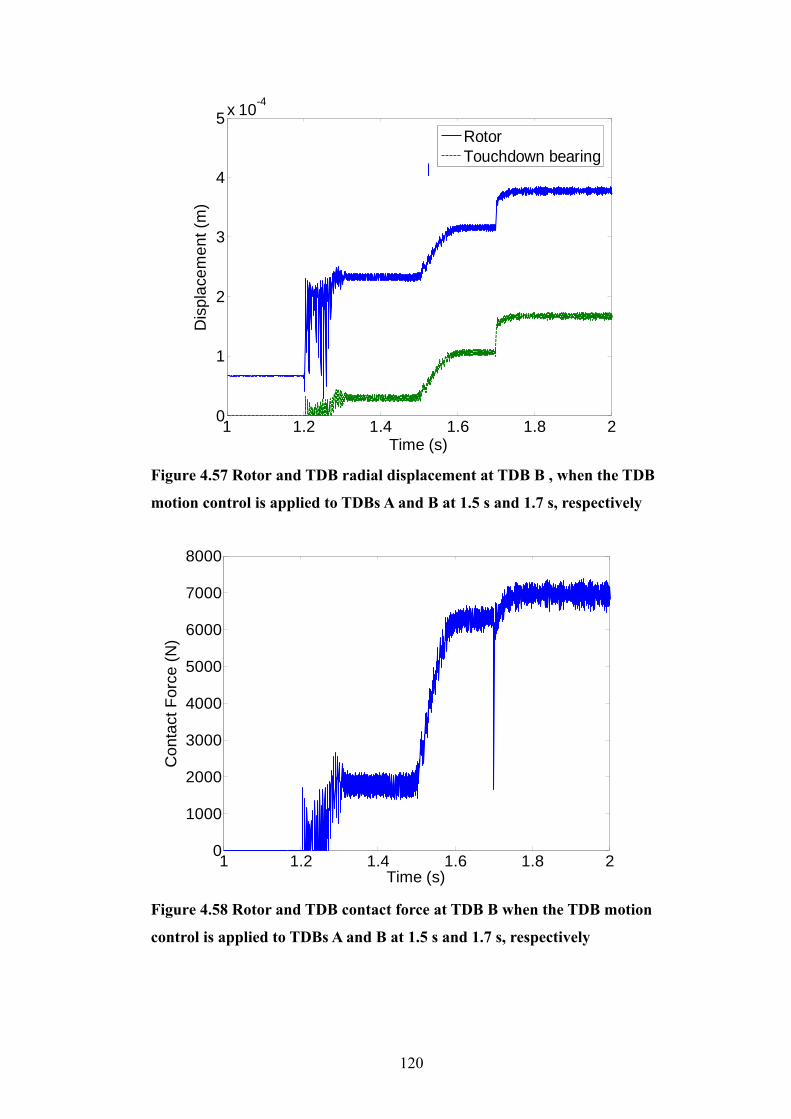
120
1 1.2 1.4 1.6 1.8 20
1
2
3
4
5x 10⁻⁴
Time (s)
Dis
plac
emen
t (m
)
RotorTouchdown Bearing
Figure 4.57 Rotor and TDB radial displacement at TDB B , when the TDB
motion control is applied to TDBs A and B at 1.5 s and 1.7 s, respectively
1 1.2 1.4 1.6 1.8 20
1000
2000
3000
4000
5000
6000
7000
8000
Time (s)
Con
tact
For
ce (N
)
Figure 4.58 Rotor and TDB contact force at TDB B when the TDB motion
control is applied to TDBs A and B at 1.5 s and 1.7 s, respectively
RotorTouchdown bearing

121
-4 -2 0 2 4x 10⁻⁴
-4
-3
-2
-1
0
1
2
3
4x 10⁻⁴
x (m)
y (m
)
-4 -2 0 2 4
x 10-4
-4
-3
-2
-1
0
1
2
3
4x 10⁻⁴
x (m)
y (m
)
Figure 4.59 Rotor orbits at TDB A (left) and B (right) when the TDB motion
control is applied to TDBs A and B at 1.5 s and 1.7 s, respectively

122
4.3 Rotor re-levitation control when active magnetic bearing centre and touchdown bearing centre are offset
The previous simulations assumed that the magnetic bearings and touchdown
bearings (TDBs) are aligned. In reality, the magnetic bearings and TDBs may not
have the same centre due to manufacturing and assembly imperfections. In order
to assess the effect of the offset, the TDB centre was offset by 0.1 mm in the
positive x direction. Without changing any other parameter, the simulation using
external disturbance to initiate unbalanced rotor and TDB contact, using
magnetic bearing control and TDB control to return rotor back to the contact-free
orbit was repeated. The TDB radial clearance was 0.2 mm and the unbalance
mass was 3.5 g mounted on all three disks. The simulation results in terms of
rotor and TDB radial displacement, contact force and rotor x-y orbit are shown in
Figures 4.60-4.64. Figures 4.61 and 4.63 show that the contact force varies
significantly when the contact is first introduced. Afterwards, it gradually settles
at around 750 N. At this point, the rotor makes persistent contact with the TDBs.
It is shown in Figure 4.64, in a full rub contact condition, that the rotor orbit
follows the contact surface of the TDBs. When the motion control on the TDBs
is applied at 1.5 s and 1.7 s, the rotor loses contact with both TDBs. The offset
between the magnetic bearing centre and TDB centre has little effect on the
release of the rotor to contact-free levitation from the persistent contact state.
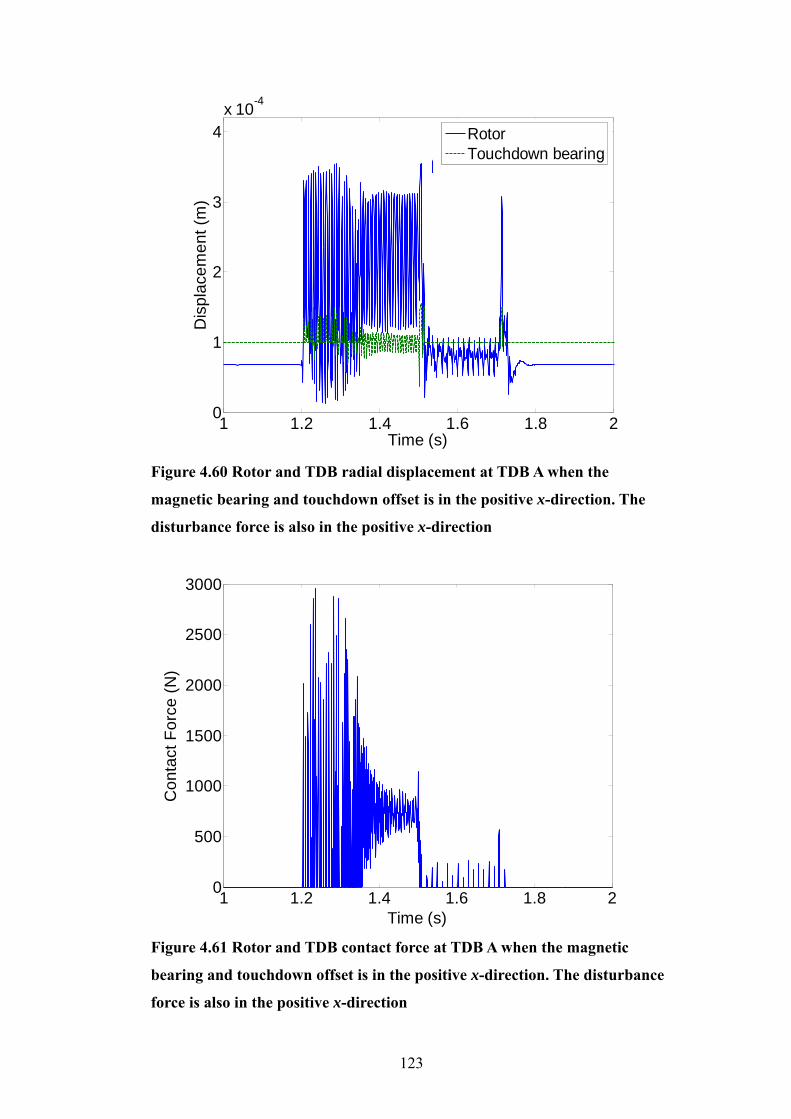
123
1 1.2 1.4 1.6 1.8 20
1
2
3
4x 10⁻⁴
Time (s)
Dis
plac
emen
t (m
)
Rotor Touchdown Bearing
Figure 4.60 Rotor and TDB radial displacement at TDB A when the
magnetic bearing and touchdown offset is in the positive x-direction. The
disturbance force is also in the positive x-direction
1 1.2 1.4 1.6 1.8 20
500
1000
1500
2000
2500
3000
Time (s)
Con
tact
For
ce (N
)
Figure 4.61 Rotor and TDB contact force at TDB A when the magnetic
bearing and touchdown offset is in the positive x-direction. The disturbance
force is also in the positive x-direction
RotorTouchdown bearing
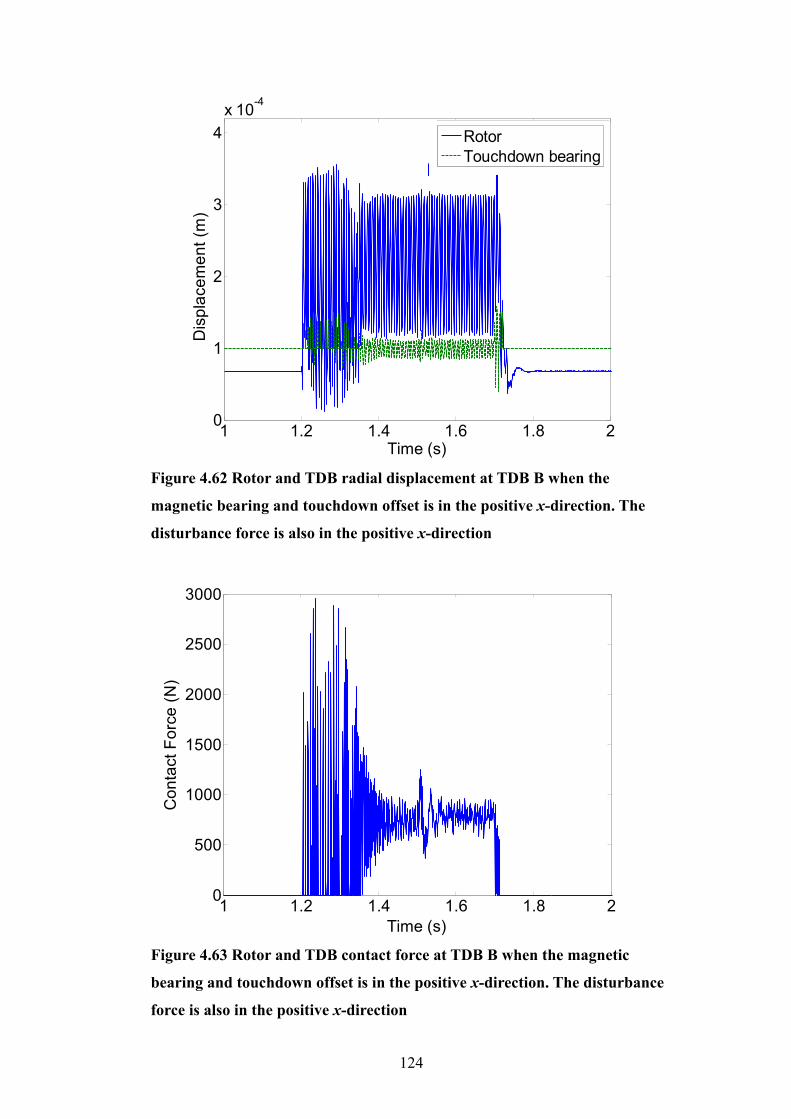
124
1 1.2 1.4 1.6 1.8 20
1
2
3
4x 10⁻⁴
Time (s)
Dis
plac
emen
t (m
)
RotorTouchdown Bearing
Figure 4.62 Rotor and TDB radial displacement at TDB B when the
magnetic bearing and touchdown offset is in the positive x-direction. The
disturbance force is also in the positive x-direction
1 1.2 1.4 1.6 1.8 20
500
1000
1500
2000
2500
3000
Time (s)
Con
tact
For
ce (N
)
Figure 4.63 Rotor and TDB contact force at TDB B when the magnetic
bearing and touchdown offset is in the positive x-direction. The disturbance
force is also in the positive x-direction
RotorTouchdown bearing
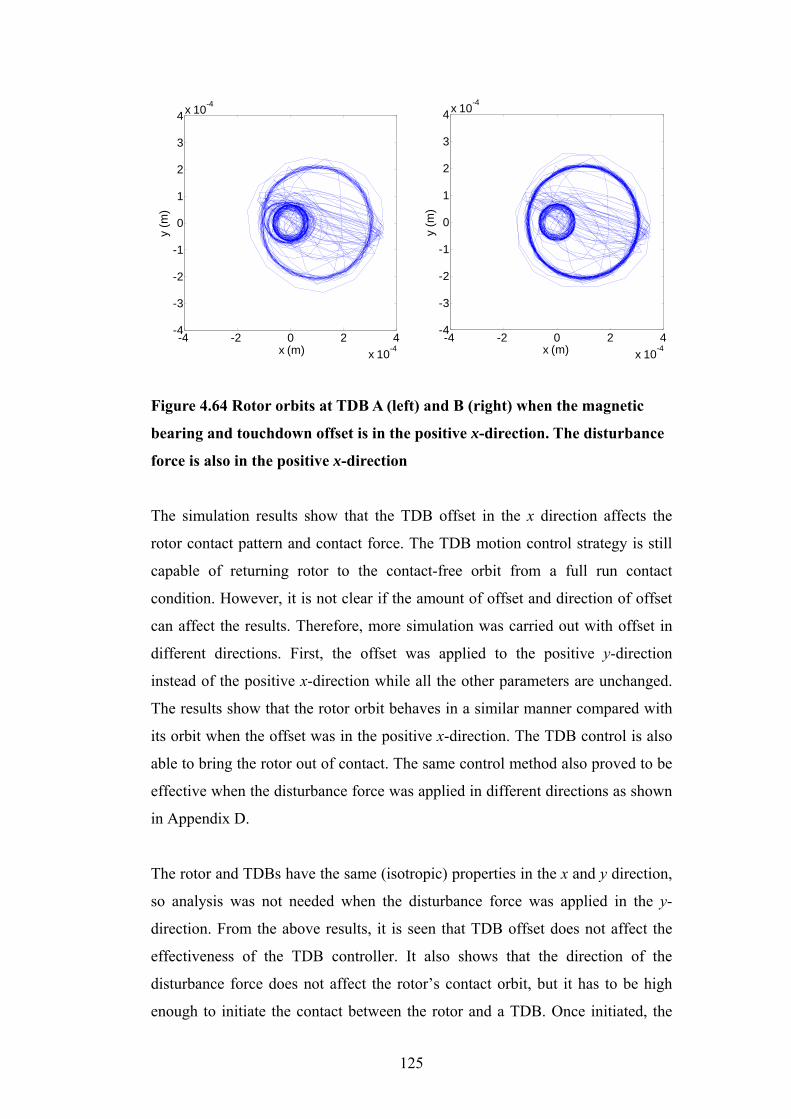
125
-4 -2 0 2 4x 10⁻⁴
-4
-3
-2
-1
0
1
2
3
4x 10⁻⁴
x (m)
y (m
)
-4 -2 0 2 4
x 10-4
-4
-3
-2
-1
0
1
2
3
4x 10⁻⁴
x (m)
y (m
)
Figure 4.64 Rotor orbits at TDB A (left) and B (right) when the magnetic
bearing and touchdown offset is in the positive x-direction. The disturbance
force is also in the positive x-direction
The simulation results show that the TDB offset in the x direction affects the
rotor contact pattern and contact force. The TDB motion control strategy is still
capable of returning rotor to the contact-free orbit from a full run contact
condition. However, it is not clear if the amount of offset and direction of offset
can affect the results. Therefore, more simulation was carried out with offset in
different directions. First, the offset was applied to the positive y-direction
instead of the positive x-direction while all the other parameters are unchanged.
The results show that the rotor orbit behaves in a similar manner compared with
its orbit when the offset was in the positive x-direction. The TDB control is also
able to bring the rotor out of contact. The same control method also proved to be
effective when the disturbance force was applied in different directions as shown
in Appendix D.
The rotor and TDBs have the same (isotropic) properties in the x and y direction,
so analysis was not needed when the disturbance force was applied in the y-
direction. From the above results, it is seen that TDB offset does not affect the
effectiveness of the TDB controller. It also shows that the direction of the
disturbance force does not affect the rotor’s contact orbit, but it has to be high
enough to initiate the contact between the rotor and a TDB. Once initiated, the
126
resultant rotor orbits should not be affected by the disturbance force direction.
However, the rotor orbit could be affected by the position where the disturbance
force is applied along the shaft. Depending on the arrangement of the test rig, the
disturbance force position can cause rotor contact with different TDBs or contact
with more than one TDBs.
4.4 The effect of touchdown bearing motion timing on rotor re-levitation control
Any contact between the rotor and TDB could cause damage to the system,
hence it is important to release the rotor as soon as possible after it makes contact
with a TDB. The TDB control was applied at the beginning of the contact to
provide a soft landing for the rotor. The results in terms of rotor and TDB radial
displacements, contact forces and rotor orbits are shown in Figures 4.65-4.69. In
this simulation, the rotor was also set to move in the same direction as the TDB
(as before). The TDB becomes active when the rotor radial position is higher
than 0.15 mm, the TDB returns back to its original position when rotor radial
displacement is smaller than 0.15 mm. It shows that the rotor starts to make
contact with both TDBs at 1.2 s, the rotor returns back to the contact-free orbit
after the disturbance force is withdrawn. Persistent contact is avoided.
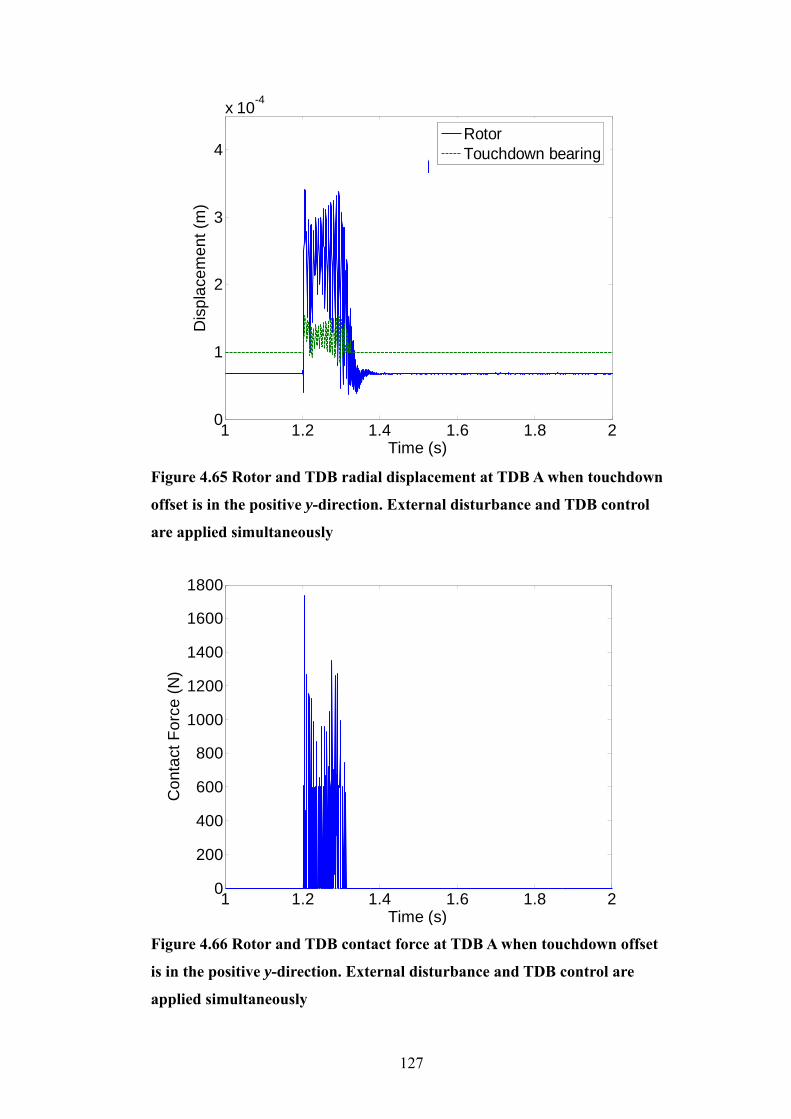
127
1 1.2 1.4 1.6 1.8 20
1
2
3
4
x 10-4
Time (s)
Dis
plac
emen
t (m
)
RotorTouchdown Bearing
Figure 4.65 Rotor and TDB radial displacement at TDB A when touchdown
offset is in the positive y-direction. External disturbance and TDB control
are applied simultaneously
1 1.2 1.4 1.6 1.8 20
200
400
600
800
1000
1200
1400
1600
1800
Time (s)
Con
tact
For
ce (N
)
Figure 4.66 Rotor and TDB contact force at TDB A when touchdown offset
is in the positive y-direction. External disturbance and TDB control are
applied simultaneously
RotorTouchdown bearing

128
1 1.2 1.4 1.6 1.8 20
1
2
3
4
x 10-4
Time (s)
Dis
plac
emen
t (m
)
RotorTouchdown Bearing
Figure 4.67 Rotor and TDB radial displacement at TDB B when touchdown
offset is in the positive y-direction. External disturbance and TDB control
are applied simultaneously
1 1.2 1.4 1.6 1.8 20
200
400
600
800
1000
1200
1400
1600
1800
Time (s)
Dis
plac
emen
t (m
)
Figure 4.68 Rotor and TDB contact force at TDB B when touchdown offset
is in the positive y-direction. External disturbance and TDB control are
applied simultaneously
RotorTouchdown bearing
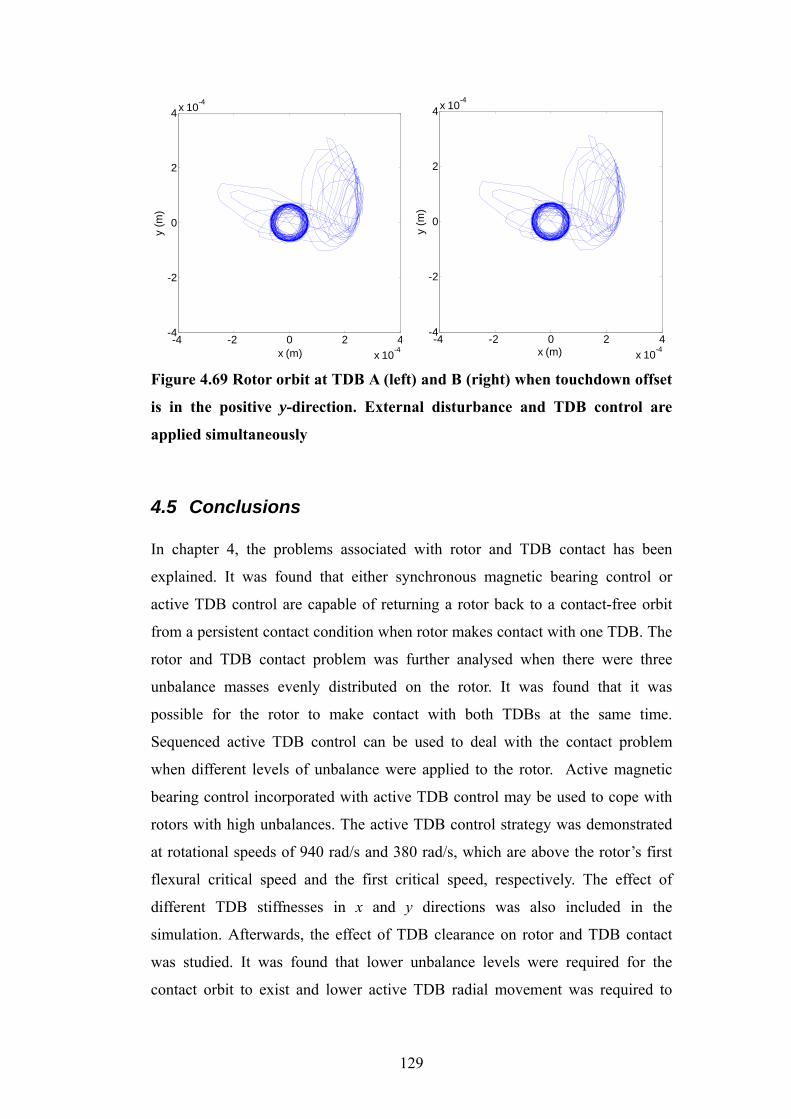
129
-4 -2 0 2 4x 10⁻⁴
-4
-2
0
2
4x 10⁻⁴
x (m)
y (m
)
-4 -2 0 2 4
x 10-4
-4
-2
0
2
4x 10⁻⁴
x (m)
y (m
)
Figure 4.69 Rotor orbit at TDB A (left) and B (right) when touchdown offset
is in the positive y-direction. External disturbance and TDB control are
applied simultaneously
4.5 Conclusions In chapter 4, the problems associated with rotor and TDB contact has been
explained. It was found that either synchronous magnetic bearing control or
active TDB control are capable of returning a rotor back to a contact-free orbit
from a persistent contact condition when rotor makes contact with one TDB. The
rotor and TDB contact problem was further analysed when there were three
unbalance masses evenly distributed on the rotor. It was found that it was
possible for the rotor to make contact with both TDBs at the same time.
Sequenced active TDB control can be used to deal with the contact problem
when different levels of unbalance were applied to the rotor. Active magnetic
bearing control incorporated with active TDB control may be used to cope with
rotors with high unbalances. The active TDB control strategy was demonstrated
at rotational speeds of 940 rad/s and 380 rad/s, which are above the rotor’s first
flexural critical speed and the first critical speed, respectively. The effect of
different TDB stiffnesses in x and y directions was also included in the
simulation. Afterwards, the effect of TDB clearance on rotor and TDB contact
was studied. It was found that lower unbalance levels were required for the
contact orbit to exist and lower active TDB radial movement was required to

130
return the rotor back to its contact free orbit. The active TDB control also proved
to be effective when the magnetic bearing and TDB were axially misaligned.
131
CHAPTER 5 Experimental Results: System Parameters Identification and Rotor Balancing
5.1 System parameters identification For the experimental rotor system (Figure 2.1), the magnetic bearing stiffness
was initially calculated using design parameters. The magnetic bearing current
gain was calculated to be 97.95 N/A with a negative stiffness of 51006.3 × N/mm.
The calculation was based on equation (2.10). It was not known if the calculated
value was accurate enough compared with the test rig, hence it was necessary to
undertake system identification to ascertain the accuracy of the magnetic bearing
gain and negative stiffness.
In order to give the magnetic bearing a higher vertical load capacity, the
magnetic bearing pole pairs were arranged in 45 degrees to vertical. This
produces a 2 factor increase over a single pole pair. To identify the magnetic
bearing properties for each opposing pole pair, the x-y coordinates were rotated
by 45 degrees to match the coil orientation. The new coordinates are defined as
r-s. All the displacement measurements in the x-y coordinates were transformed
to the r-s coordinates (Figure 5.1).
132
Figure 5.1 Magnetic bearing x-y and r-s coordinates
The magnetic bearing parameter identification was carried out in the following
six steps:
1. Use PID (proportional-integral-derivative) control to levitate the rotor.
Choose any reasonable proportional gain value and derivative gain term;
the derivative gain should not be so large as to over damp the rotor rigid
body modes.
2. The rotor speed was set to gradually increase above its first critical speed.
Record all displacement measurements in the r-s system and identify the
rotor first critical speed frequency.
3. In computer simulation, repeat Steps 1 and 2 using the same magnetic
bearing parameters and compare with the rotor first critical speed
frequency identified in Step 2. Adjust the proportional gain in simulation
until the rotor first critical speed frequency matches the experimental
result.
x
r
y
s
45o
Rotor
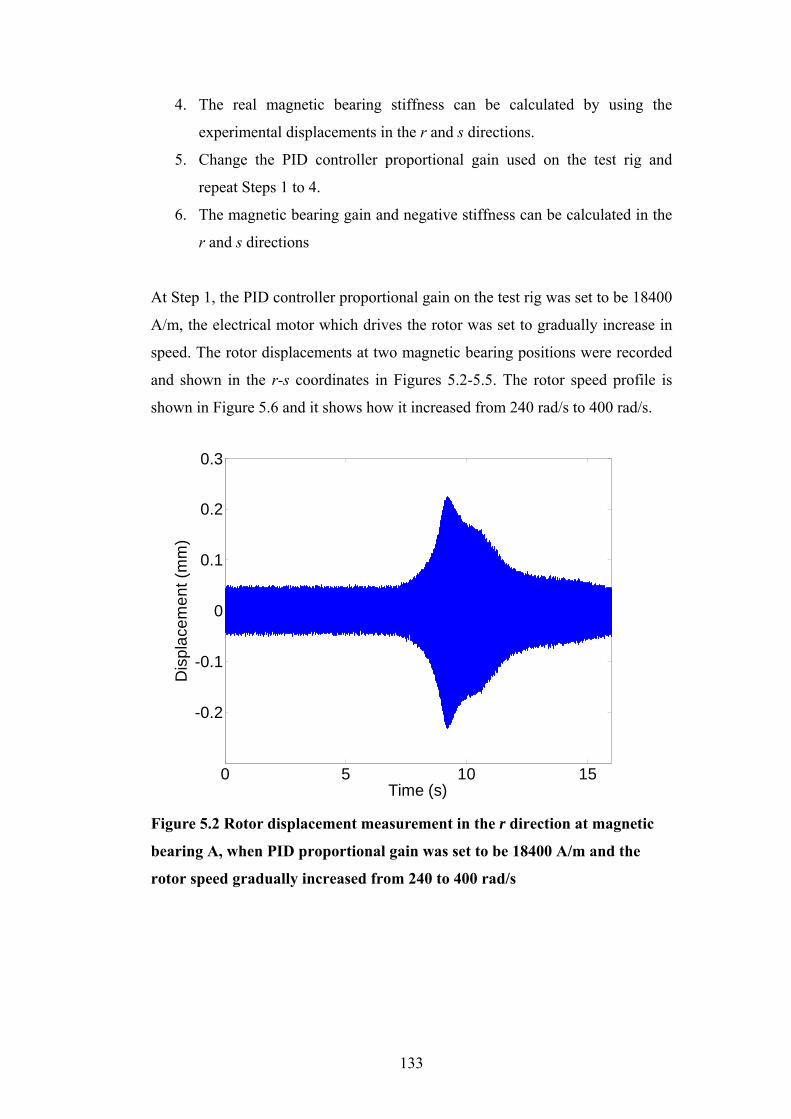
133
4. The real magnetic bearing stiffness can be calculated by using the
experimental displacements in the r and s directions.
5. Change the PID controller proportional gain used on the test rig and
repeat Steps 1 to 4.
6. The magnetic bearing gain and negative stiffness can be calculated in the
r and s directions
At Step 1, the PID controller proportional gain on the test rig was set to be 18400
A/m, the electrical motor which drives the rotor was set to gradually increase in
speed. The rotor displacements at two magnetic bearing positions were recorded
and shown in the r-s coordinates in Figures 5.2-5.5. The rotor speed profile is
shown in Figure 5.6 and it shows how it increased from 240 rad/s to 400 rad/s.
0 5 10 15
-0.2
-0.1
0
0.1
0.2
0.3
Time (s)
Dis
plac
emen
t (m
m)
Figure 5.2 Rotor displacement measurement in the r direction at magnetic
bearing A, when PID proportional gain was set to be 18400 A/m and the
rotor speed gradually increased from 240 to 400 rad/s
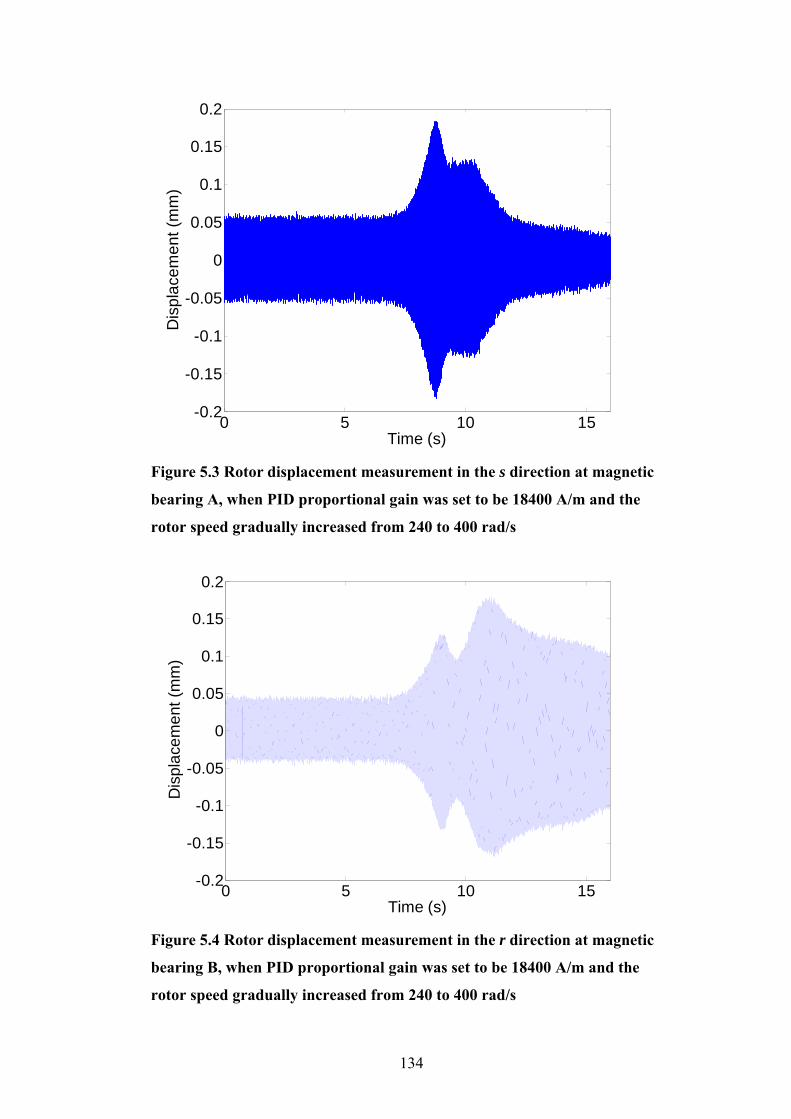
134
0 5 10 15-0.2
-0.15
-0.1
-0.05
0
0.05
0.1
0.15
0.2
Time (s)
Dis
plac
emen
t (m
m)
Figure 5.3 Rotor displacement measurement in the s direction at magnetic
bearing A, when PID proportional gain was set to be 18400 A/m and the
rotor speed gradually increased from 240 to 400 rad/s
0 5 10 15-0.2
-0.15
-0.1
-0.05
0
0.05
0.1
0.15
0.2
Time (s)
Dis
plac
emen
t (m
m)
Figure 5.4 Rotor displacement measurement in the r direction at magnetic
bearing B, when PID proportional gain was set to be 18400 A/m and the
rotor speed gradually increased from 240 to 400 rad/s
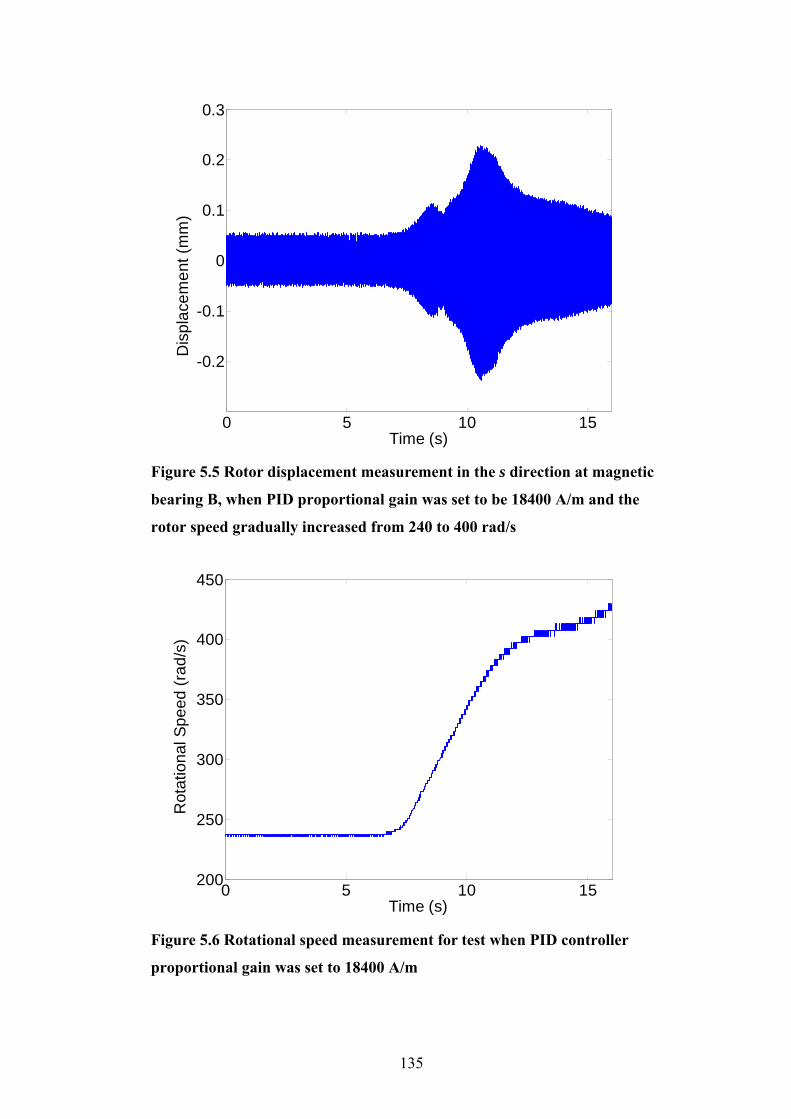
135
0 5 10 15
-0.2
-0.1
0
0.1
0.2
0.3
Time (s)
Dis
plac
emen
t (m
m)
Figure 5.5 Rotor displacement measurement in the s direction at magnetic
bearing B, when PID proportional gain was set to be 18400 A/m and the
rotor speed gradually increased from 240 to 400 rad/s
0 5 10 15200
250
300
350
400
450
Time (s)
Rot
atio
nal S
peed
(rad
/s)
Figure 5.6 Rotational speed measurement for test when PID controller
proportional gain was set to 18400 A/m
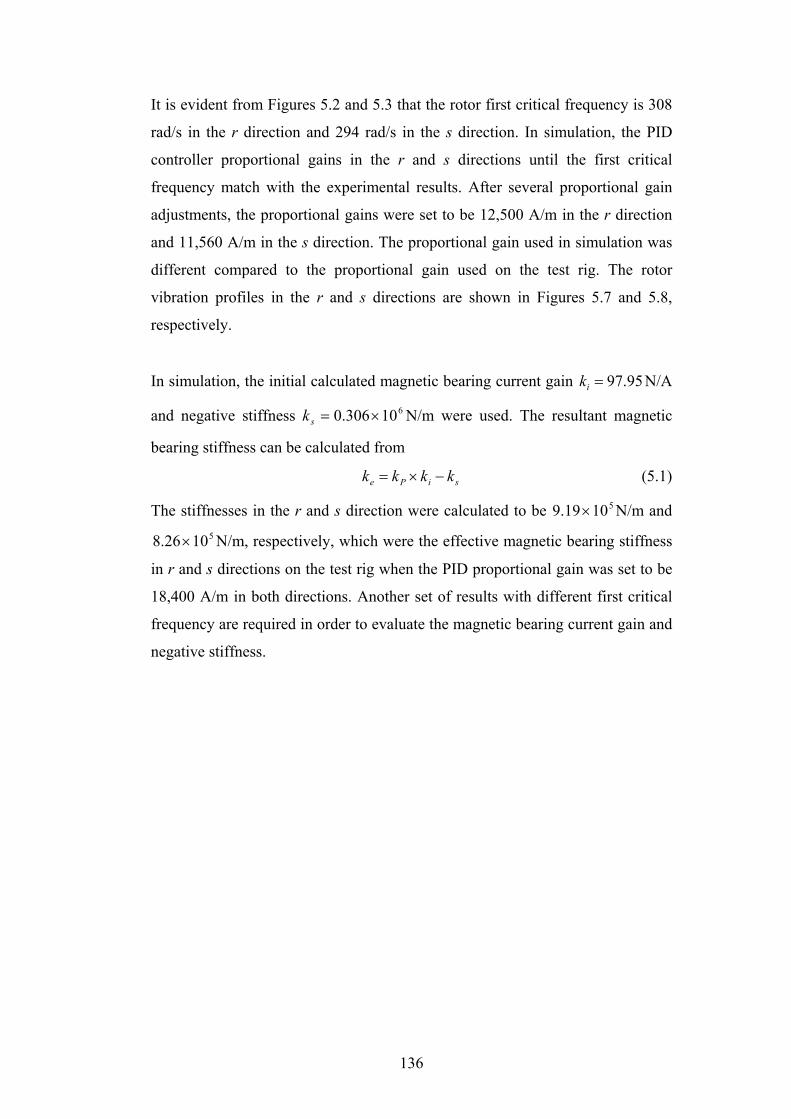
136
It is evident from Figures 5.2 and 5.3 that the rotor first critical frequency is 308
rad/s in the r direction and 294 rad/s in the s direction. In simulation, the PID
controller proportional gains in the r and s directions until the first critical
frequency match with the experimental results. After several proportional gain
adjustments, the proportional gains were set to be 12,500 A/m in the r direction
and 11,560 A/m in the s direction. The proportional gain used in simulation was
different compared to the proportional gain used on the test rig. The rotor
vibration profiles in the r and s directions are shown in Figures 5.7 and 5.8,
respectively.
In simulation, the initial calculated magnetic bearing current gain 95.97=ik N/A
and negative stiffness 610306.0 ×=sk N/m were used. The resultant magnetic
bearing stiffness can be calculated from
siPe kkkk −×= (5.1)
The stiffnesses in the r and s direction were calculated to be 51019.9 × N/m and 51026.8 × N/m, respectively, which were the effective magnetic bearing stiffness
in r and s directions on the test rig when the PID proportional gain was set to be
18,400 A/m in both directions. Another set of results with different first critical
frequency are required in order to evaluate the magnetic bearing current gain and
negative stiffness.
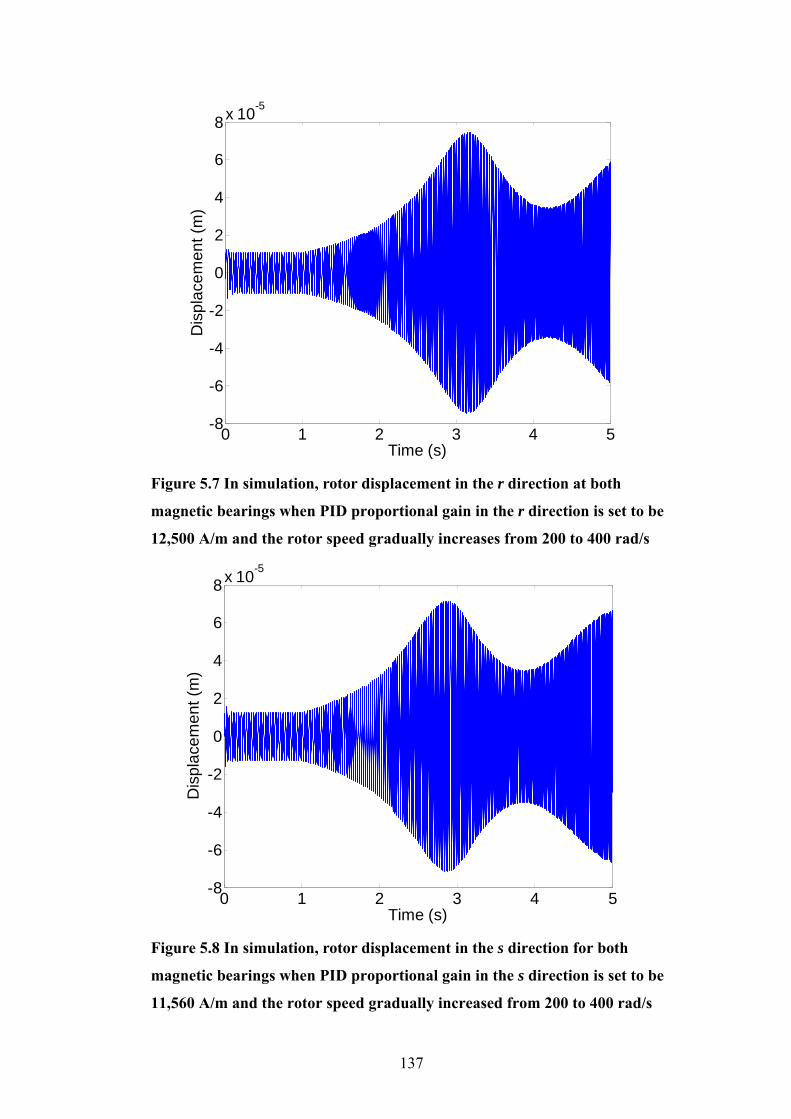
137
0 1 2 3 4 5-8
-6
-4
-2
0
2
4
6
8x 10⁻⁵
Time (s)
Dis
plac
emen
t (m
)
Figure 5.7 In simulation, rotor displacement in the r direction at both
magnetic bearings when PID proportional gain in the r direction is set to be
12,500 A/m and the rotor speed gradually increases from 200 to 400 rad/s
0 1 2 3 4 5-8
-6
-4
-2
0
2
4
6
8x 10⁻⁵
Time (s)
Dis
plac
emen
t (m
)
Figure 5.8 In simulation, rotor displacement in the s direction for both
magnetic bearings when PID proportional gain in the s direction is set to be
11,560 A/m and the rotor speed gradually increased from 200 to 400 rad/s
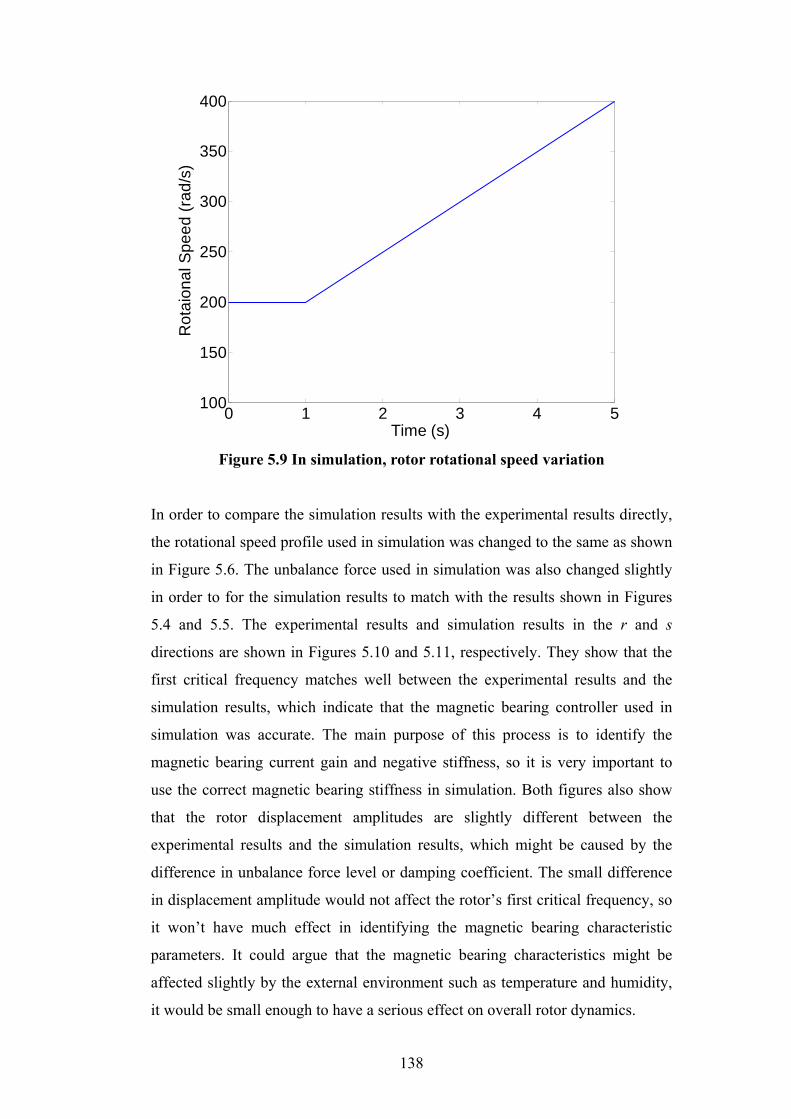
138
0 1 2 3 4 5100
150
200
250
300
350
400
Time (s)
Rot
aion
al S
peed
(rad
/s)
Figure 5.9 In simulation, rotor rotational speed variation
In order to compare the simulation results with the experimental results directly,
the rotational speed profile used in simulation was changed to the same as shown
in Figure 5.6. The unbalance force used in simulation was also changed slightly
in order to for the simulation results to match with the results shown in Figures
5.4 and 5.5. The experimental results and simulation results in the r and s
directions are shown in Figures 5.10 and 5.11, respectively. They show that the
first critical frequency matches well between the experimental results and the
simulation results, which indicate that the magnetic bearing controller used in
simulation was accurate. The main purpose of this process is to identify the
magnetic bearing current gain and negative stiffness, so it is very important to
use the correct magnetic bearing stiffness in simulation. Both figures also show
that the rotor displacement amplitudes are slightly different between the
experimental results and the simulation results, which might be caused by the
difference in unbalance force level or damping coefficient. The small difference
in displacement amplitude would not affect the rotor’s first critical frequency, so
it won’t have much effect in identifying the magnetic bearing characteristic
parameters. It could argue that the magnetic bearing characteristics might be
affected slightly by the external environment such as temperature and humidity,
it would be small enough to have a serious effect on overall rotor dynamics.
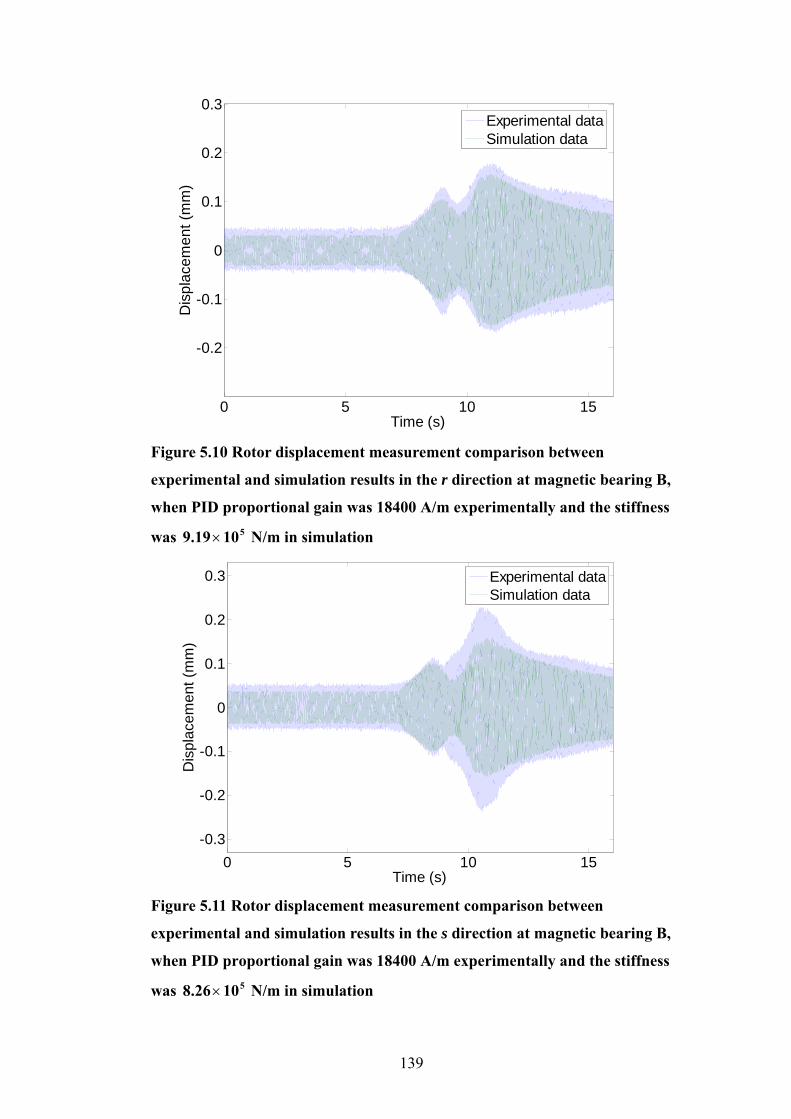
139
0 5 10 15
-0.2
-0.1
0
0.1
0.2
0.3
Time (s)
Dis
plac
emen
t (m
m)
Experimental dataSimulation data
Figure 5.10 Rotor displacement measurement comparison between
experimental and simulation results in the r direction at magnetic bearing B,
when PID proportional gain was 18400 A/m experimentally and the stiffness
was 5109.19× N/m in simulation
0 5 10 15-0.3
-0.2
-0.1
0
0.1
0.2
0.3
Time (s)
Dis
plac
emen
t (m
m)
Experimental dataSimulation data
Figure 5.11 Rotor displacement measurement comparison between
experimental and simulation results in the s direction at magnetic bearing B,
when PID proportional gain was 18400 A/m experimentally and the stiffness
was 5108.26× N/m in simulation
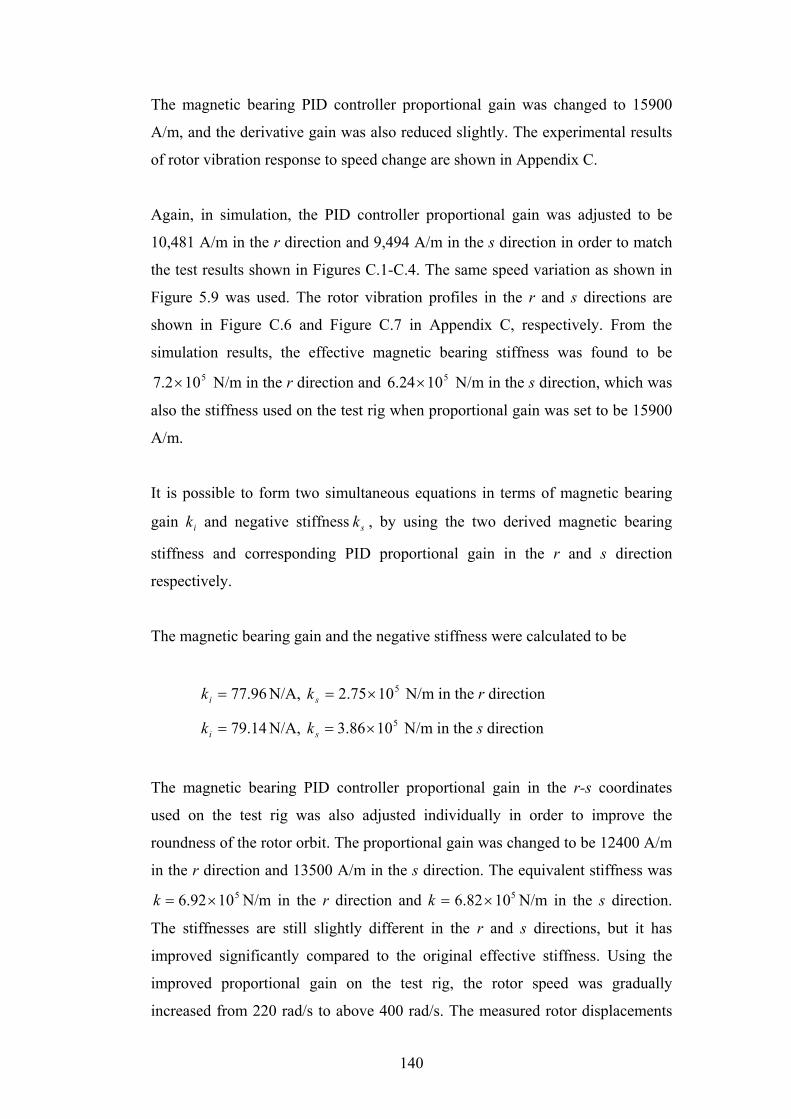
140
The magnetic bearing PID controller proportional gain was changed to 15900
A/m, and the derivative gain was also reduced slightly. The experimental results
of rotor vibration response to speed change are shown in Appendix C.
Again, in simulation, the PID controller proportional gain was adjusted to be
10,481 A/m in the r direction and 9,494 A/m in the s direction in order to match
the test results shown in Figures C.1-C.4. The same speed variation as shown in
Figure 5.9 was used. The rotor vibration profiles in the r and s directions are
shown in Figure C.6 and Figure C.7 in Appendix C, respectively. From the
simulation results, the effective magnetic bearing stiffness was found to be 5102.7 × N/m in the r direction and 51024.6 × N/m in the s direction, which was
also the stiffness used on the test rig when proportional gain was set to be 15900
A/m.
It is possible to form two simultaneous equations in terms of magnetic bearing
gain ik and negative stiffness sk , by using the two derived magnetic bearing
stiffness and corresponding PID proportional gain in the r and s direction
respectively.
The magnetic bearing gain and the negative stiffness were calculated to be
96.77=ik N/A, 51075.2 ×=sk N/m in the r direction
14.79=ik N/A, 51086.3 ×=sk N/m in the s direction
The magnetic bearing PID controller proportional gain in the r-s coordinates
used on the test rig was also adjusted individually in order to improve the
roundness of the rotor orbit. The proportional gain was changed to be 12400 A/m
in the r direction and 13500 A/m in the s direction. The equivalent stiffness was 51092.6 ×=k N/m in the r direction and 51082.6 ×=k N/m in the s direction.
The stiffnesses are still slightly different in the r and s directions, but it has
improved significantly compared to the original effective stiffness. Using the
improved proportional gain on the test rig, the rotor speed was gradually
increased from 220 rad/s to above 400 rad/s. The measured rotor displacements
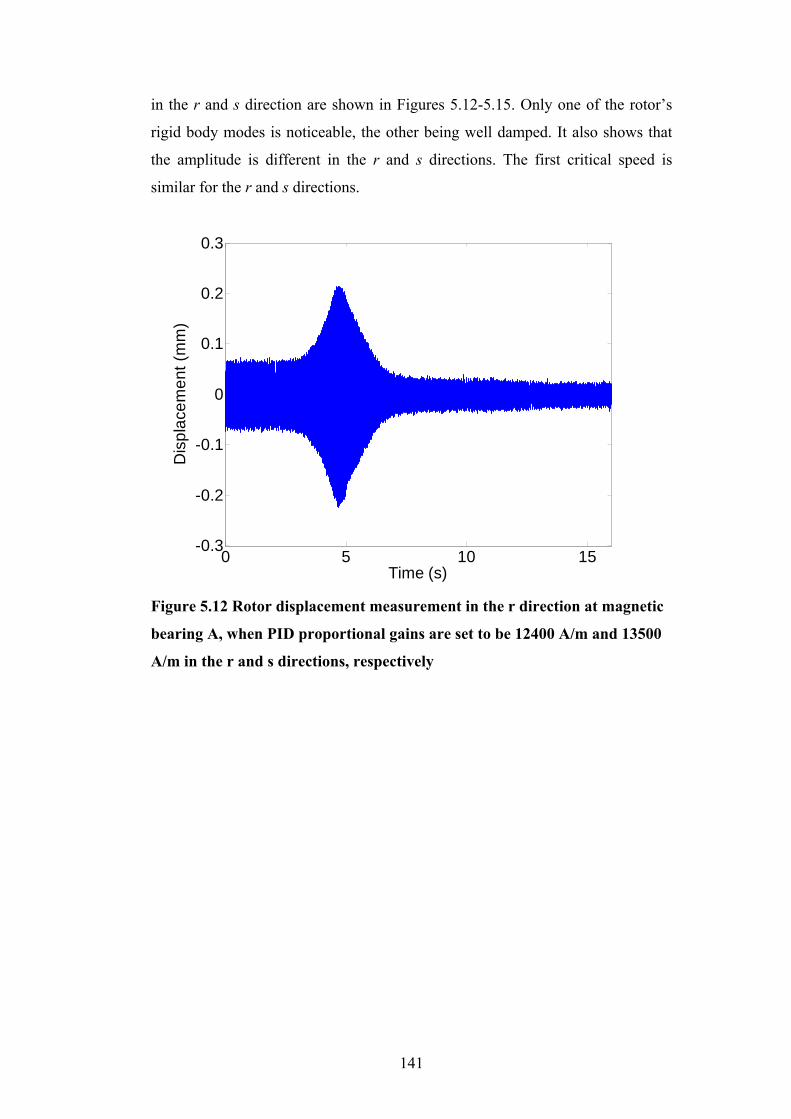
141
in the r and s direction are shown in Figures 5.12-5.15. Only one of the rotor’s
rigid body modes is noticeable, the other being well damped. It also shows that
the amplitude is different in the r and s directions. The first critical speed is
similar for the r and s directions.
0 5 10 15
-0.3
-0.2
-0.1
0
0.1
0.2
0.3
Time (s)
Dis
plac
emen
t (m
m)
Figure 5.12 Rotor displacement measurement in the r direction at magnetic
bearing A, when PID proportional gains are set to be 12400 A/m and 13500
A/m in the r and s directions, respectively

142
0 5 10 15-0.2
-0.15
-0.1
-0.05
0
0.05
0.1
0.15
0.2
Time (s)
Dis
plac
emen
t (m
m)
Figure 5.13 Rotor displacement measurement in the s direction at magnetic
bearing A, when PID proportional gains are set to be 12400 A/m and 13500
A/m in the r and s directions, respectively
0 5 10 15-0.2
-0.15
-0.1
-0.05
0
0.05
0.1
0.15
0.2
Time (s)
Dis
plac
emen
t (m
m)
Figure 5.14 Rotor displacement measurement in the r direction at magnetic
bearing B, when PID proportional gains are set to be 12400 A/m and 13500
A/m in the r and s directions, respectively
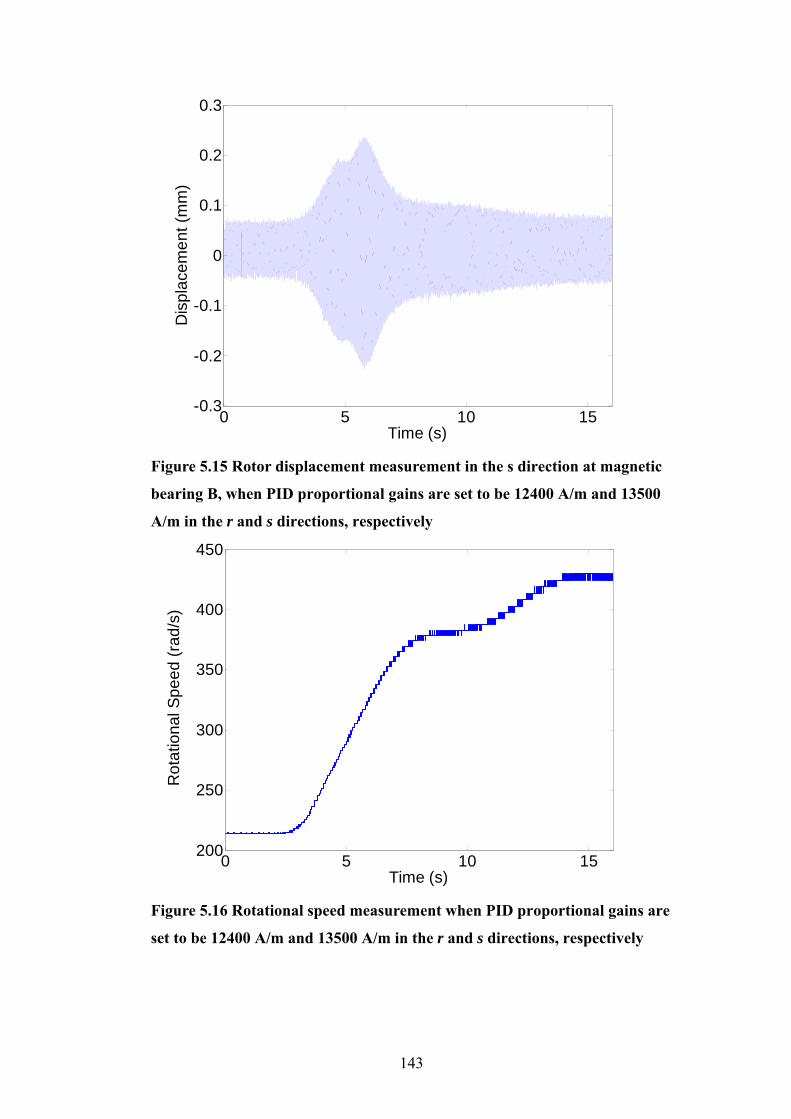
143
0 5 10 15
-0.3
-0.2
-0.1
0
0.1
0.2
0.3
Time (s)
Dis
plac
emen
t (m
m)
Figure 5.15 Rotor displacement measurement in the s direction at magnetic
bearing B, when PID proportional gains are set to be 12400 A/m and 13500
A/m in the r and s directions, respectively
0 5 10 15200
250
300
350
400
450
Time (s)
Rot
atio
nal S
peed
(rad
/s)
Figure 5.16 Rotational speed measurement when PID proportional gains are
set to be 12400 A/m and 13500 A/m in the r and s directions, respectively
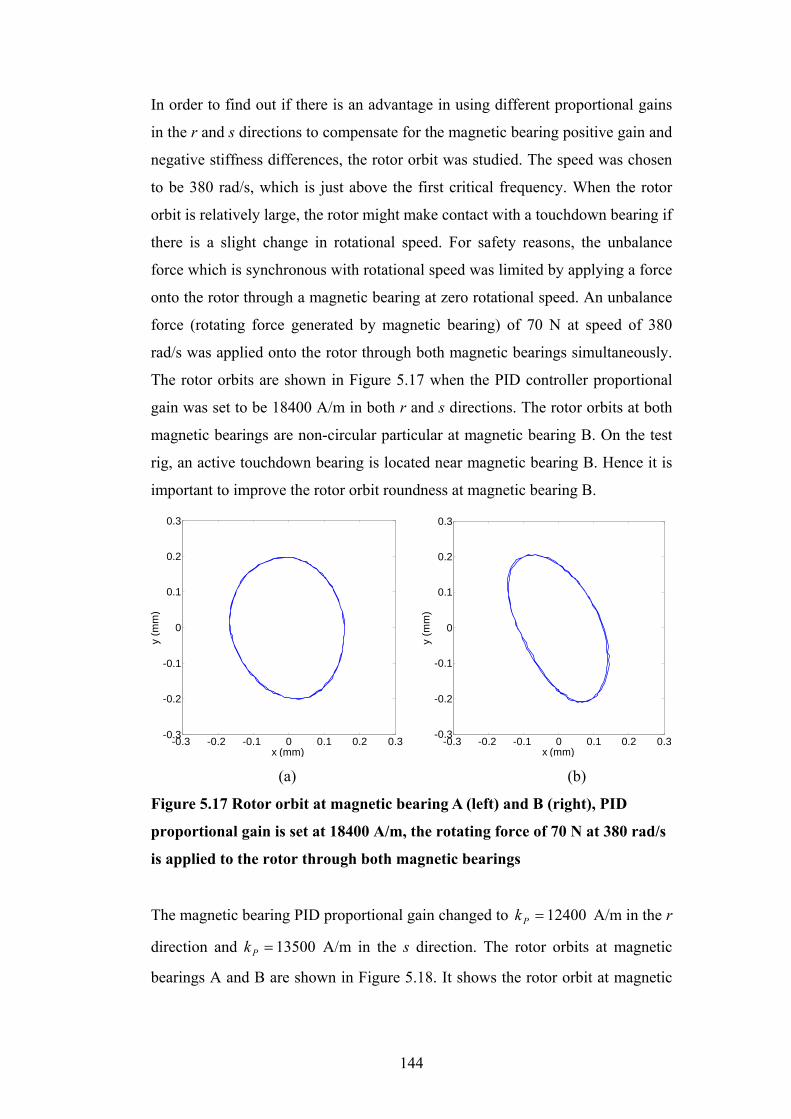
144
In order to find out if there is an advantage in using different proportional gains
in the r and s directions to compensate for the magnetic bearing positive gain and
negative stiffness differences, the rotor orbit was studied. The speed was chosen
to be 380 rad/s, which is just above the first critical frequency. When the rotor
orbit is relatively large, the rotor might make contact with a touchdown bearing if
there is a slight change in rotational speed. For safety reasons, the unbalance
force which is synchronous with rotational speed was limited by applying a force
onto the rotor through a magnetic bearing at zero rotational speed. An unbalance
force (rotating force generated by magnetic bearing) of 70 N at speed of 380
rad/s was applied onto the rotor through both magnetic bearings simultaneously.
The rotor orbits are shown in Figure 5.17 when the PID controller proportional
gain was set to be 18400 A/m in both r and s directions. The rotor orbits at both
magnetic bearings are non-circular particular at magnetic bearing B. On the test
rig, an active touchdown bearing is located near magnetic bearing B. Hence it is
important to improve the rotor orbit roundness at magnetic bearing B.
-0.3 -0.2 -0.1 0 0.1 0.2 0.3-0.3
-0.2
-0.1
0
0.1
0.2
0.3
x (mm)
y (m
m)
-0.3 -0.2 -0.1 0 0.1 0.2 0.3
-0.3
-0.2
-0.1
0
0.1
0.2
0.3
x (mm)
y (m
m)
(a) (b)
Figure 5.17 Rotor orbit at magnetic bearing A (left) and B (right), PID
proportional gain is set at 18400 A/m, the rotating force of 70 N at 380 rad/s
is applied to the rotor through both magnetic bearings
The magnetic bearing PID proportional gain changed to 12400=Pk A/m in the r
direction and 13500=Pk A/m in the s direction. The rotor orbits at magnetic
bearings A and B are shown in Figure 5.18. It shows the rotor orbit at magnetic
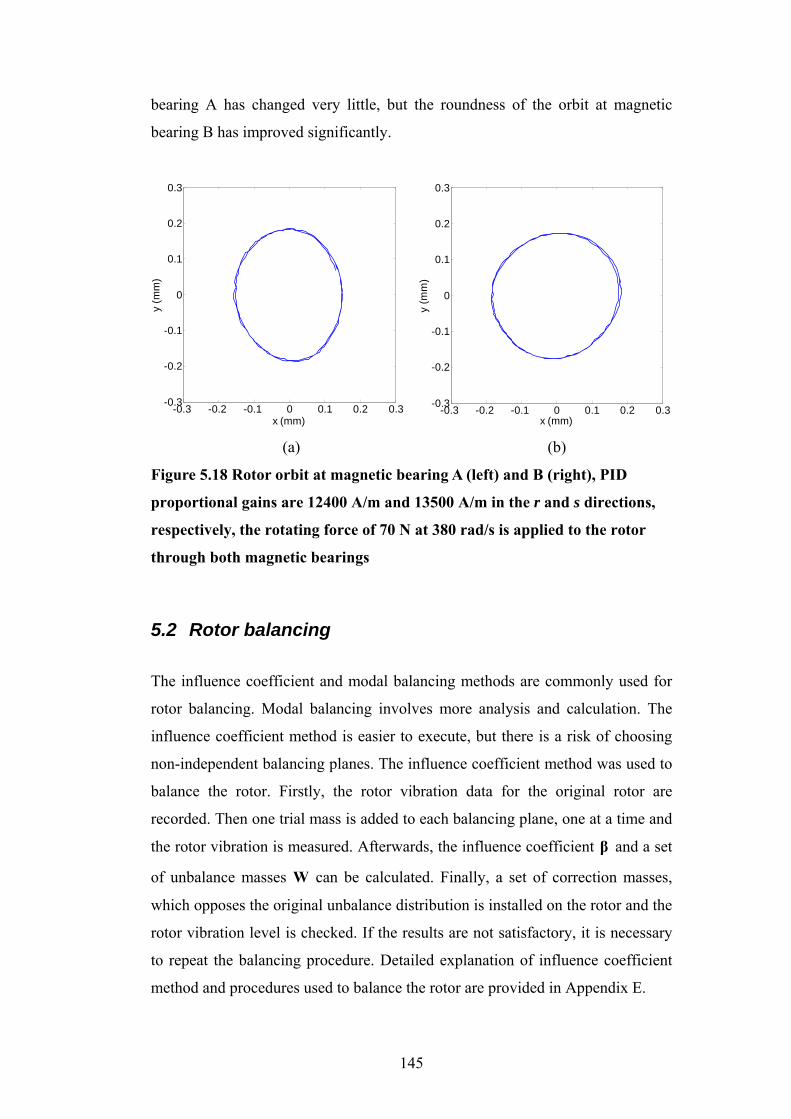
145
bearing A has changed very little, but the roundness of the orbit at magnetic
bearing B has improved significantly.
-0.3 -0.2 -0.1 0 0.1 0.2 0.3-0.3
-0.2
-0.1
0
0.1
0.2
0.3
x (mm)
y (m
m)
-0.3 -0.2 -0.1 0 0.1 0.2 0.3-0.3
-0.2
-0.1
0
0.1
0.2
0.3
x (mm)y
(mm
)
(a) (b)
Figure 5.18 Rotor orbit at magnetic bearing A (left) and B (right), PID
proportional gains are 12400 A/m and 13500 A/m in the r and s directions,
respectively, the rotating force of 70 N at 380 rad/s is applied to the rotor
through both magnetic bearings
5.2 Rotor balancing
The influence coefficient and modal balancing methods are commonly used for
rotor balancing. Modal balancing involves more analysis and calculation. The
influence coefficient method is easier to execute, but there is a risk of choosing
non-independent balancing planes. The influence coefficient method was used to
balance the rotor. Firstly, the rotor vibration data for the original rotor are
recorded. Then one trial mass is added to each balancing plane, one at a time and
the rotor vibration is measured. Afterwards, the influence coefficient β and a set
of unbalance masses W can be calculated. Finally, a set of correction masses,
which opposes the original unbalance distribution is installed on the rotor and the
rotor vibration level is checked. If the results are not satisfactory, it is necessary
to repeat the balancing procedure. Detailed explanation of influence coefficient
method and procedures used to balance the rotor are provided in Appendix E.
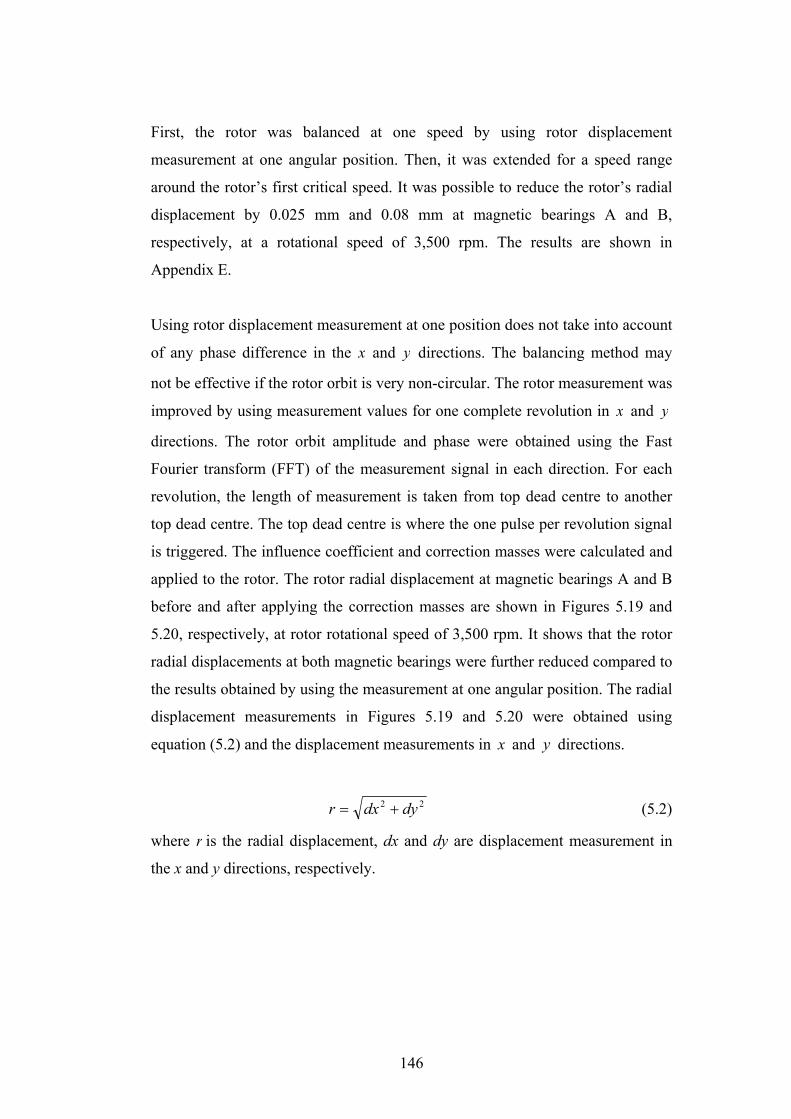
146
First, the rotor was balanced at one speed by using rotor displacement
measurement at one angular position. Then, it was extended for a speed range
around the rotor’s first critical speed. It was possible to reduce the rotor’s radial
displacement by 0.025 mm and 0.08 mm at magnetic bearings A and B,
respectively, at a rotational speed of 3,500 rpm. The results are shown in
Appendix E.
Using rotor displacement measurement at one position does not take into account
of any phase difference in the x and y directions. The balancing method may
not be effective if the rotor orbit is very non-circular. The rotor measurement was
improved by using measurement values for one complete revolution in x and y
directions. The rotor orbit amplitude and phase were obtained using the Fast
Fourier transform (FFT) of the measurement signal in each direction. For each
revolution, the length of measurement is taken from top dead centre to another
top dead centre. The top dead centre is where the one pulse per revolution signal
is triggered. The influence coefficient and correction masses were calculated and
applied to the rotor. The rotor radial displacement at magnetic bearings A and B
before and after applying the correction masses are shown in Figures 5.19 and
5.20, respectively, at rotor rotational speed of 3,500 rpm. It shows that the rotor
radial displacements at both magnetic bearings were further reduced compared to
the results obtained by using the measurement at one angular position. The radial
displacement measurements in Figures 5.19 and 5.20 were obtained using
equation (5.2) and the displacement measurements in x and y directions.
22 dydxr += (5.2)
where r is the radial displacement, dx and dy are displacement measurement in
the x and y directions, respectively.
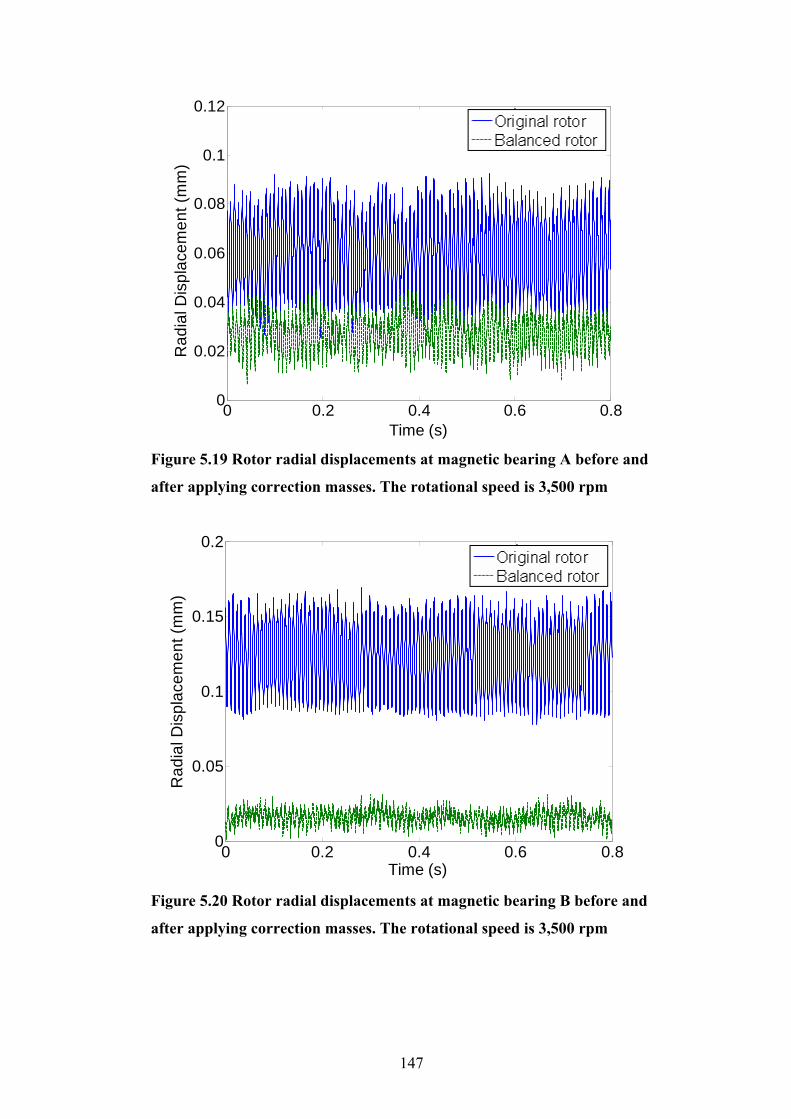
147
0 0.2 0.4 0.6 0.80
0.02
0.04
0.06
0.08
0.1
0.12
Time (s)
Dis
plac
emen
t (m
m)
Original RotorBalanced Rotor
Figure 5.19 Rotor radial displacements at magnetic bearing A before and
after applying correction masses. The rotational speed is 3,500 rpm
0 0.2 0.4 0.6 0.80
0.05
0.1
0.15
0.2
Time (s)
Dis
plac
emen
t (m
m)
Original RotorBalanced Rotor
Figure 5.20 Rotor radial displacements at magnetic bearing B before and
after applying correction masses. The rotational speed is 3,500 rpm
Rad
ial D
ispl
acem
ent (
mm
)R
adia
l Dis
plac
emen
t (m
m)
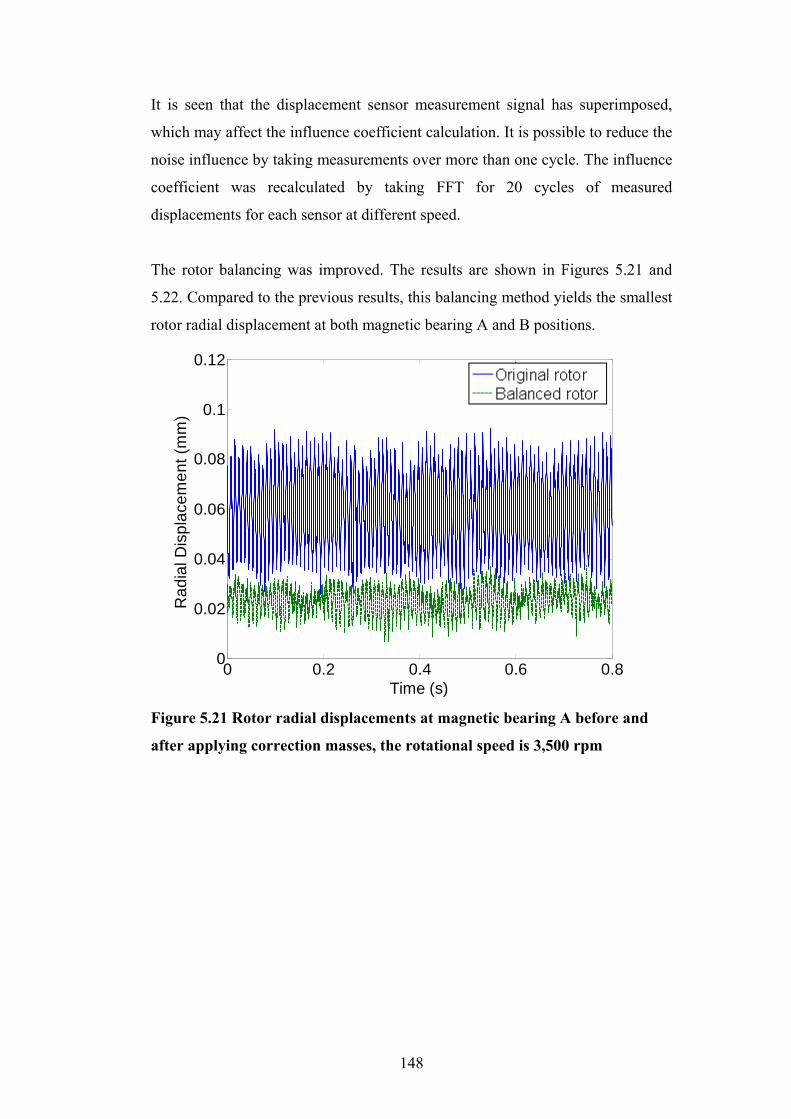
148
It is seen that the displacement sensor measurement signal has superimposed,
which may affect the influence coefficient calculation. It is possible to reduce the
noise influence by taking measurements over more than one cycle. The influence
coefficient was recalculated by taking FFT for 20 cycles of measured
displacements for each sensor at different speed.
The rotor balancing was improved. The results are shown in Figures 5.21 and
5.22. Compared to the previous results, this balancing method yields the smallest
rotor radial displacement at both magnetic bearing A and B positions.
0 0.2 0.4 0.6 0.80
0.02
0.04
0.06
0.08
0.1
0.12
Time (s)
Dis
plac
emen
t (m
m)
Original RotorBalanced Rotor
Figure 5.21 Rotor radial displacements at magnetic bearing A before and
after applying correction masses, the rotational speed is 3,500 rpm
Rad
ial D
ispl
acem
ent (
mm
)
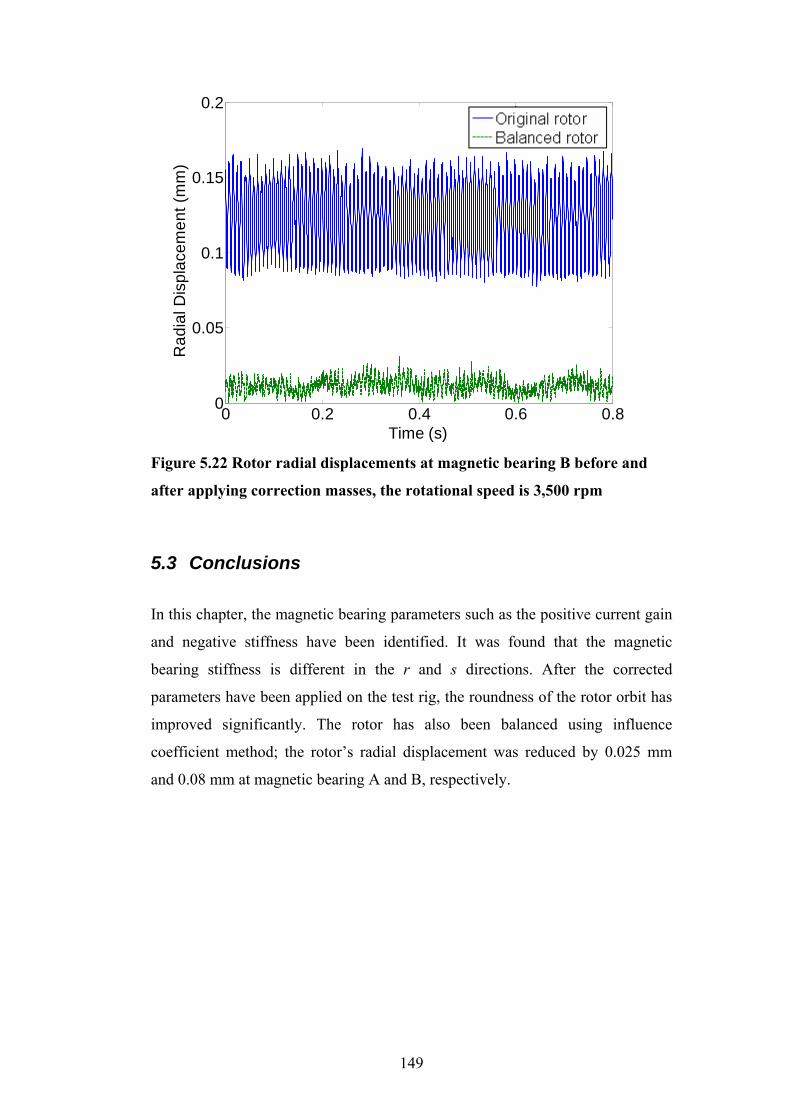
149
0 0.2 0.4 0.6 0.80
0.05
0.1
0.15
0.2
Time (s)
Dis
plac
emen
t (m
m)
Original RotorBalanced Rotor
Figure 5.22 Rotor radial displacements at magnetic bearing B before and
after applying correction masses, the rotational speed is 3,500 rpm
5.3 Conclusions
In this chapter, the magnetic bearing parameters such as the positive current gain
and negative stiffness have been identified. It was found that the magnetic
bearing stiffness is different in the r and s directions. After the corrected
parameters have been applied on the test rig, the roundness of the rotor orbit has
improved significantly. The rotor has also been balanced using influence
coefficient method; the rotor’s radial displacement was reduced by 0.025 mm
and 0.08 mm at magnetic bearing A and B, respectively.
Rad
ial D
ispl
acem
ent (
mm
)
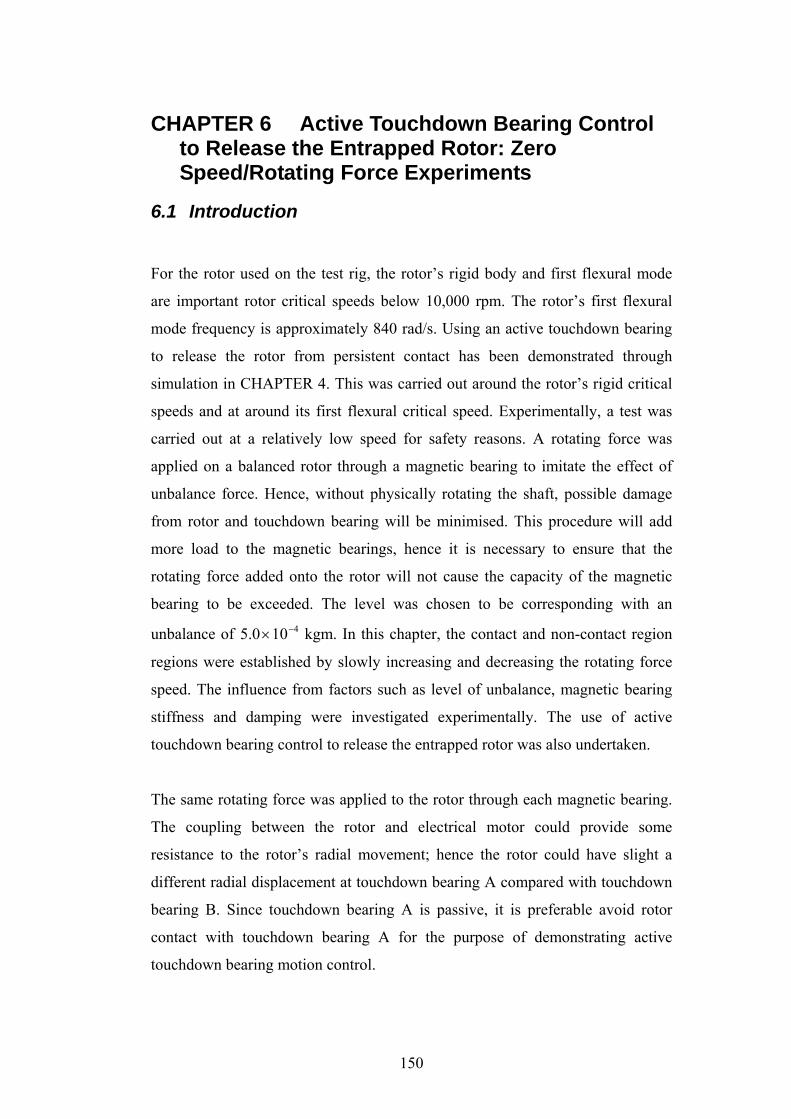
150
CHAPTER 6 Active Touchdown Bearing Control to Release the Entrapped Rotor: Zero Speed/Rotating Force Experiments
6.1 Introduction
For the rotor used on the test rig, the rotor’s rigid body and first flexural mode
are important rotor critical speeds below 10,000 rpm. The rotor’s first flexural
mode frequency is approximately 840 rad/s. Using an active touchdown bearing
to release the rotor from persistent contact has been demonstrated through
simulation in CHAPTER 4. This was carried out around the rotor’s rigid critical
speeds and at around its first flexural critical speed. Experimentally, a test was
carried out at a relatively low speed for safety reasons. A rotating force was
applied on a balanced rotor through a magnetic bearing to imitate the effect of
unbalance force. Hence, without physically rotating the shaft, possible damage
from rotor and touchdown bearing will be minimised. This procedure will add
more load to the magnetic bearings, hence it is necessary to ensure that the
rotating force added onto the rotor will not cause the capacity of the magnetic
bearing to be exceeded. The level was chosen to be corresponding with an
unbalance of 4100.5 −× kgm. In this chapter, the contact and non-contact region
regions were established by slowly increasing and decreasing the rotating force
speed. The influence from factors such as level of unbalance, magnetic bearing
stiffness and damping were investigated experimentally. The use of active
touchdown bearing control to release the entrapped rotor was also undertaken.
The same rotating force was applied to the rotor through each magnetic bearing.
The coupling between the rotor and electrical motor could provide some
resistance to the rotor’s radial movement; hence the rotor could have slight a
different radial displacement at touchdown bearing A compared with touchdown
bearing B. Since touchdown bearing A is passive, it is preferable avoid rotor
contact with touchdown bearing A for the purpose of demonstrating active
touchdown bearing motion control.
151
6.2 Rotor radial displacement during run-up and run-down under contact with touchdown bearing B
To investigate the effect of operating speed on rotor orbit during contact, the
rotating force speed was manually controlled to increase from 200 rad/s to 450
rad/s then reduce back to 200 rad/s. During the process, the resultant magnetic
bearing stiffness was set to be 5108.4 × N/m and the damping term was set to be
1300 Ns/m. The rotor speed the maximum rotor radial displacement at magnetic
bearings A and B are shown in Figures 6.1 and 6.2, respectively. The maximum
touchdown bearing B radial displacement at each speed is shown in Figure 6.3.
200 250 300 350 400 4500
0.1
0.2
0.3
0.4
0.5
Frequency (rad/s)
Rad
ial D
ispl
acem
ent (
mm
)
Increase in frequencyDecrease in frequency
Figure 6.1 Rotor maximum radial displacement at magnetic bearing A with
respect to gradual change of the rotating force speed. The rotating force was
equivalent to 4105.0 −× kgm and applied through each magnetic bearing
Touchdown bearing clearance
Increase in speedDecrease in speed

152
200 250 300 350 400 4500
0.1
0.2
0.3
0.4
0.5
Frequency (rad/s)
Rad
ial D
ispl
acem
ent (
mm
)
Increase in frequencyDecrease in frequency
Figure 6.2 Rotor maximum radial displacement at magnetic bearing B with
respect to gradual change of the rotating force speed. The rotating force was
equivalent to 4105.0 −× kgm and applied through each magnetic bearing
200 250 300 350 400 4500
0.01
0.02
0.03
0.04
Frequency (rad/s)
Rad
ial D
ispl
acem
ent (
mm
)
Increase in speedDecrease in speed
Figure 6.3 Touchdown bearing B maximum radial displacement with
respect to gradual change of the rotating force speed. The rotating force was
equivalent to 4105.0 −× kgm and applied through each magnetic bearing
Touchdown bearing clearance
Increase in speedDecrease in speed
153
The rotor displacements in the x and y directions were measured by displacement
sensors close to both magnetic bearings. Despite the touchdown bearing
clearance being 4.0± mm, the rotor could make contact with the touchdown
bearing at smaller radial displacement due to some misalignment and offset
during the manufacturing and assembly process. The rotor displacements are not
measured at the touchdown bearings, so the clearance used in Figure 6.1 is not
0.4 mm. At low rotational speed, it is possible to assume the rotor is rigid. The
rotor radial displacements measured at the magnetic bearing positions might be
smaller than its radial displacement at the touchdown bearing positions. At high
rotating speed, when rotor is flexural, the rotor displacements measured at
magnetic bearing positions may not reflect its displacements at touchdown
bearing positions. It was found the rotor starts to make contact with touchdown
bearing B when its radial displacement measured at magnetic bearing B
exceeded 0.32 mm. Figure 6.1 shows the rotor radial displacement variation with
speed, so that no contact occurs between the rotor and touchdown bearing A
between 200 rad/s and 450 rad/s. Figure 6.2 shows that when the speed increases
its radial displacement first increases and the rotor started to make contact with
the touchdown bearing B at around 325 rad/s. The rotor remains in contact with
the touchdown bearing until the speed increases to 410 rad/s, which is also
indicated from the radial displacement of the touchdown bearing in Figure 6.3.
At frequencies between 330 rad/s and 400 rad/s, the rotor radial displacement
reaches a new constant level, as its movement is restricted by the touchdown
bearing. Figure 6.2 also shows that the rotor radial displacement variation when
the speed gradually decreased. The speed decrease curve shows that the rotor
radial displacement starts to increase when the speed decreases. As the speed
moves towards its first critical frequency, contact occurs at around 330 rad/s and
it continues until the speed reduces to around 300 rad/s. It shows that the rotor
has different orbits during contact when the speed increases and decreases.
As the rotating force speed increases from 200 rad/s to 450 rad/s, the shapes of
the rotor orbits change especially between contact and non-contact orbits. The
rotor orbits at magnetic bearing A and B just before the rotor makes contact
touchdown bearing B are shown in Figure 6.4. The speed was 315 rad/s and the
rotor position is measured on the rotor directly. The orbit of touchdown bearing
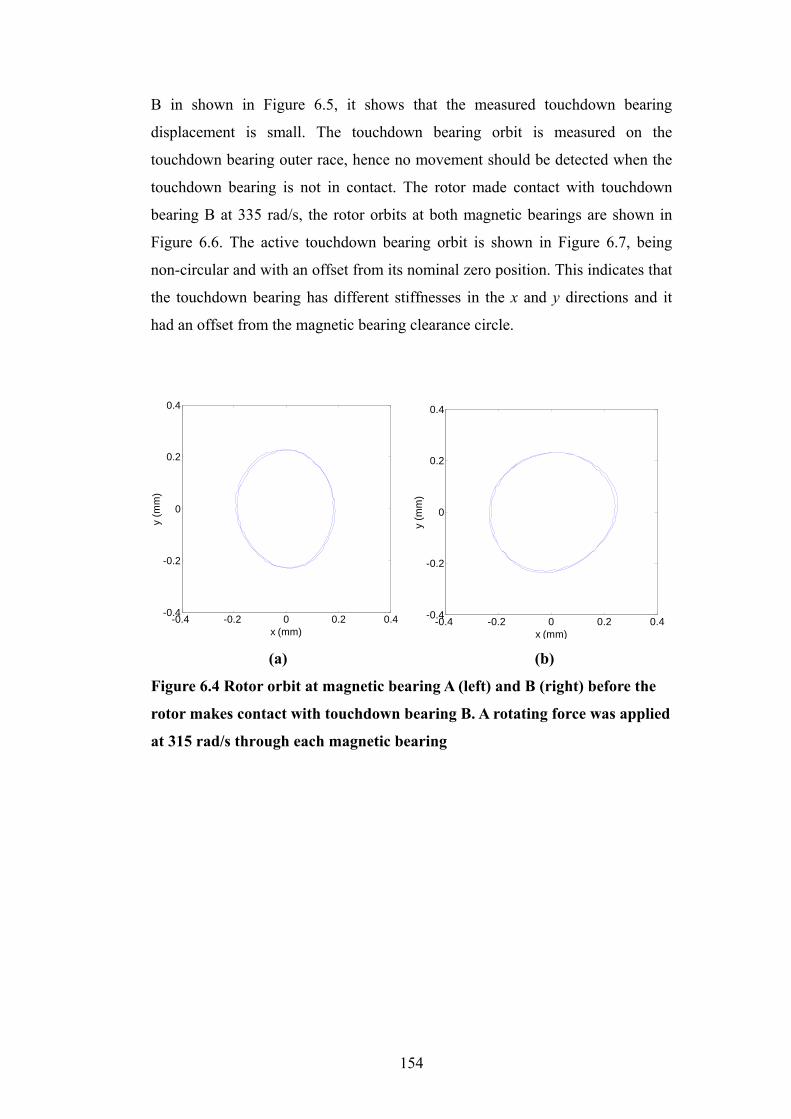
154
B in shown in Figure 6.5, it shows that the measured touchdown bearing
displacement is small. The touchdown bearing orbit is measured on the
touchdown bearing outer race, hence no movement should be detected when the
touchdown bearing is not in contact. The rotor made contact with touchdown
bearing B at 335 rad/s, the rotor orbits at both magnetic bearings are shown in
Figure 6.6. The active touchdown bearing orbit is shown in Figure 6.7, being
non-circular and with an offset from its nominal zero position. This indicates that
the touchdown bearing has different stiffnesses in the x and y directions and it
had an offset from the magnetic bearing clearance circle.
-0.4 -0.2 0 0.2 0.4-0.4
-0.2
0
0.2
0.4
x (mm)
y (m
m)
-0.4 -0.2 0 0.2 0.4-0.4
-0.2
0
0.2
0.4
x (mm)
y (m
m)
(a) (b)
Figure 6.4 Rotor orbit at magnetic bearing A (left) and B (right) before the
rotor makes contact with touchdown bearing B. A rotating force was applied
at 315 rad/s through each magnetic bearing

155
-0.04 -0.02 0 0.02 0.04-0.04
-0.02
0
0.02
0.04
x (mm)
y (m
m)
Figure 6.5 Touchdown bearing B orbit before the rotor makes contact with
touchdown bearing B. A rotating force was applied at 315 rad/s through
each magnetic bearing
-0.4 -0.2 0 0.2 0.4-0.4
-0.2
0
0.2
0.4
x (mm)
y (m
m)
-0.4 -0.2 0 0.2 0.4-0.4
-0.2
0
0.2
0.4
x (mm)
y (m
m)
(a) (b)
Figure 6.6 Rotor orbit at magnetic bearing A (left) and B (right) during
contact between rotor and touchdown bearing B. A rotating force was
applied at 335 rad/s through each magnetic bearing
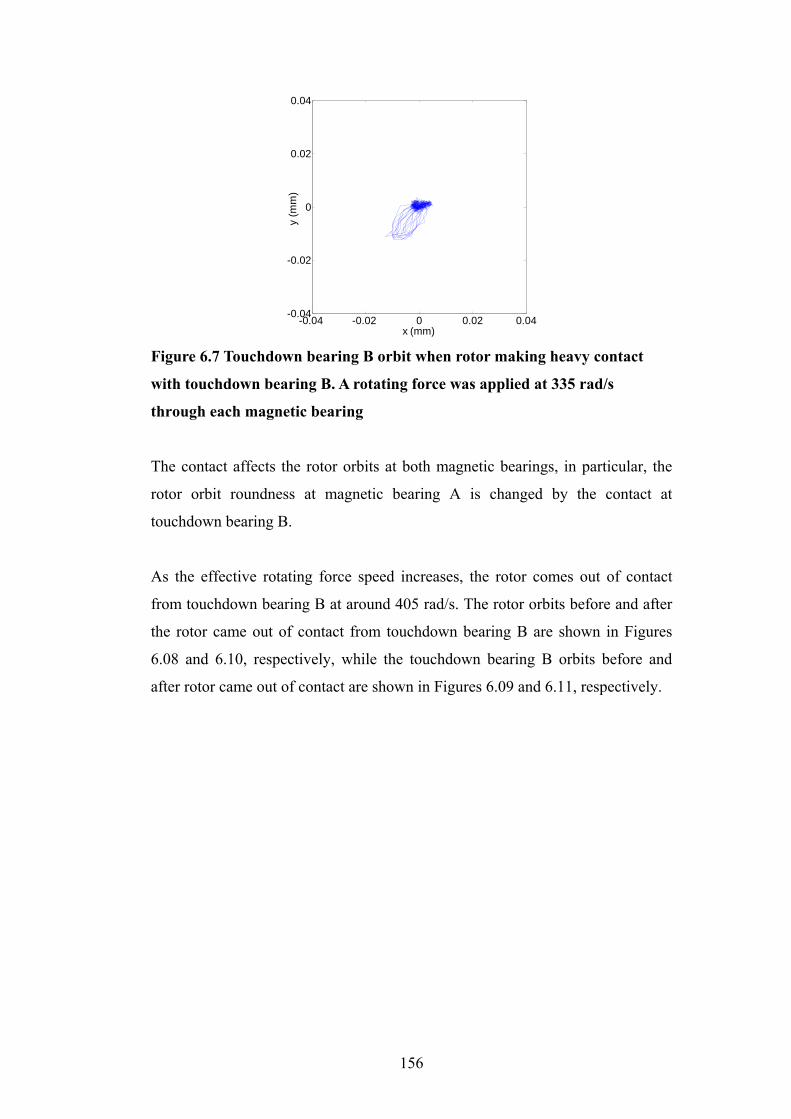
156
-0.04 -0.02 0 0.02 0.04-0.04
-0.02
0
0.02
0.04
x (mm)
y (m
m)
Figure 6.7 Touchdown bearing B orbit when rotor making heavy contact
with touchdown bearing B. A rotating force was applied at 335 rad/s
through each magnetic bearing
The contact affects the rotor orbits at both magnetic bearings, in particular, the
rotor orbit roundness at magnetic bearing A is changed by the contact at
touchdown bearing B.
As the effective rotating force speed increases, the rotor comes out of contact
from touchdown bearing B at around 405 rad/s. The rotor orbits before and after
the rotor came out of contact from touchdown bearing B are shown in Figures
6.08 and 6.10, respectively, while the touchdown bearing B orbits before and
after rotor came out of contact are shown in Figures 6.09 and 6.11, respectively.
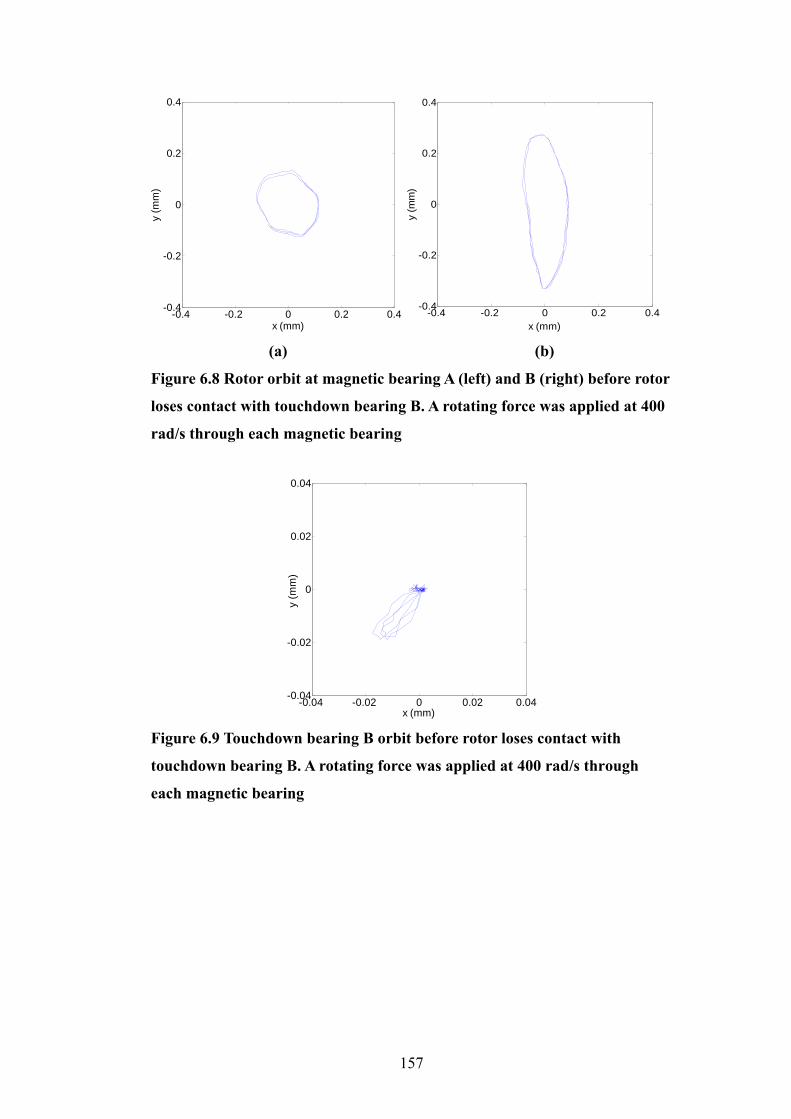
157
-0.4 -0.2 0 0.2 0.4-0.4
-0.2
0
0.2
0.4
x (mm)
y (m
m)
-0.4 -0.2 0 0.2 0.4-0.4
-0.2
0
0.2
0.4
x (mm)
y (m
m)
(a) (b)
Figure 6.8 Rotor orbit at magnetic bearing A (left) and B (right) before rotor
loses contact with touchdown bearing B. A rotating force was applied at 400
rad/s through each magnetic bearing
-0.04 -0.02 0 0.02 0.04-0.04
-0.02
0
0.02
0.04
x (mm)
y (m
m)
Figure 6.9 Touchdown bearing B orbit before rotor loses contact with
touchdown bearing B. A rotating force was applied at 400 rad/s through
each magnetic bearing

158
-0.4 -0.2 0 0.2 0.4-0.4
-0.2
0
0.2
0.4
x (mm)
y (m
m)
-0.4 -0.2 0 0.2 0.4-0.4
-0.2
0
0.2
0.4
x (mm)
y (m
m)
(a) (b)
Figure 6.10 Rotor orbit at magnetic bearing A (left) and B (right) after rotor
loses contact with touchdown bearing B. A rotating force was applied at 405
rad/s through each magnetic bearing
-0.04 -0.02 0 0.02 0.04-0.04
-0.02
0
0.02
0.04
x (mm)
y (m
m)
Figure 6.11 Touchdown bearing B orbit after the rotor loses contact with
touchdown bearing B. A rotating force was applied at 405 rad/s through
each magnetic bearing
With the same rotating force level, the speed was decreased from 450 rad/s to
200 rad/s. The rotor started to make contact with touchdown bearing B at about
330 rad/s. The rotor orbits at magnetic bearings A and B before and after the
contact are shown in Figures 6.12 and 6.14, respectively, while the orbits of
touchdown bearing B before and after the contact are shown in Figures 6.13 and
6.15, respectively.
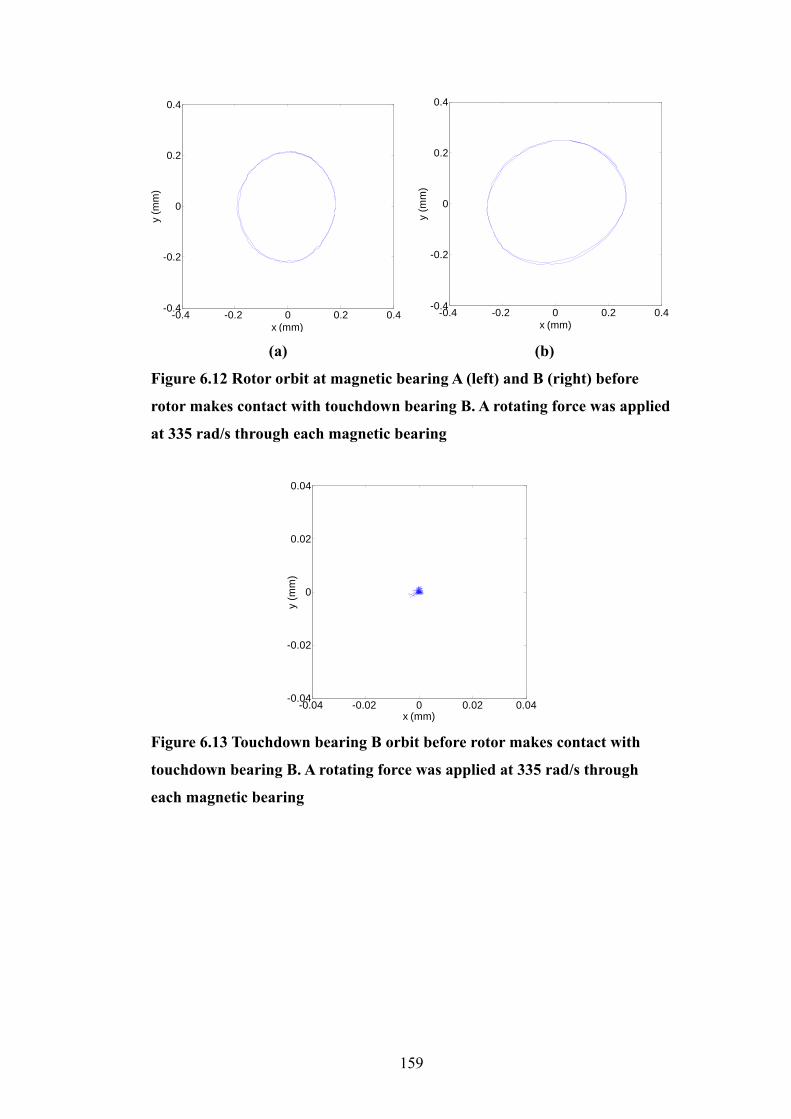
159
-0.4 -0.2 0 0.2 0.4-0.4
-0.2
0
0.2
0.4
x (mm)
y (m
m)
-0.4 -0.2 0 0.2 0.4-0.4
-0.2
0
0.2
0.4
x (mm)
y (m
m)
(a) (b)
Figure 6.12 Rotor orbit at magnetic bearing A (left) and B (right) before
rotor makes contact with touchdown bearing B. A rotating force was applied
at 335 rad/s through each magnetic bearing
-0.04 -0.02 0 0.02 0.04-0.04
-0.02
0
0.02
0.04
x (mm)
y (m
m)
Figure 6.13 Touchdown bearing B orbit before rotor makes contact with
touchdown bearing B. A rotating force was applied at 335 rad/s through
each magnetic bearing
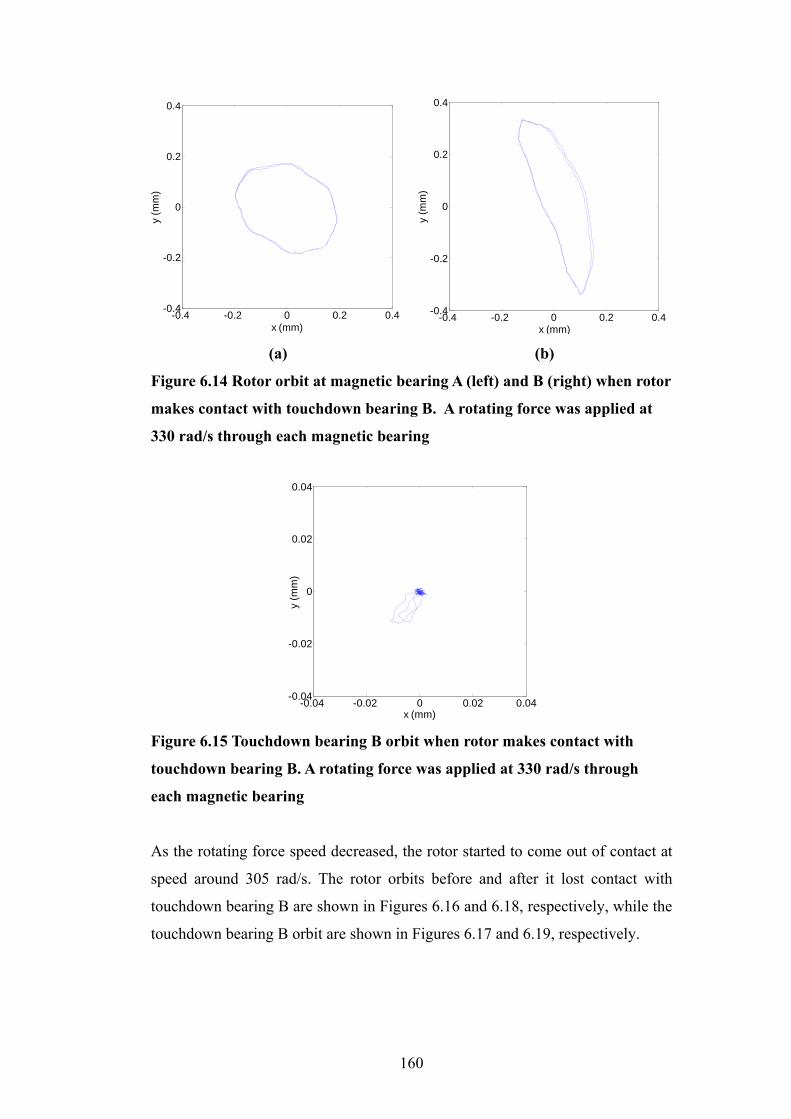
160
-0.4 -0.2 0 0.2 0.4-0.4
-0.2
0
0.2
0.4
x (mm)
y (m
m)
-0.4 -0.2 0 0.2 0.4-0.4
-0.2
0
0.2
0.4
x (mm)
y (m
m)
(a) (b)
Figure 6.14 Rotor orbit at magnetic bearing A (left) and B (right) when rotor
makes contact with touchdown bearing B. A rotating force was applied at
330 rad/s through each magnetic bearing
-0.04 -0.02 0 0.02 0.04-0.04
-0.02
0
0.02
0.04
x (mm)
y (m
m)
Figure 6.15 Touchdown bearing B orbit when rotor makes contact with
touchdown bearing B. A rotating force was applied at 330 rad/s through
each magnetic bearing
As the rotating force speed decreased, the rotor started to come out of contact at
speed around 305 rad/s. The rotor orbits before and after it lost contact with
touchdown bearing B are shown in Figures 6.16 and 6.18, respectively, while the
touchdown bearing B orbit are shown in Figures 6.17 and 6.19, respectively.
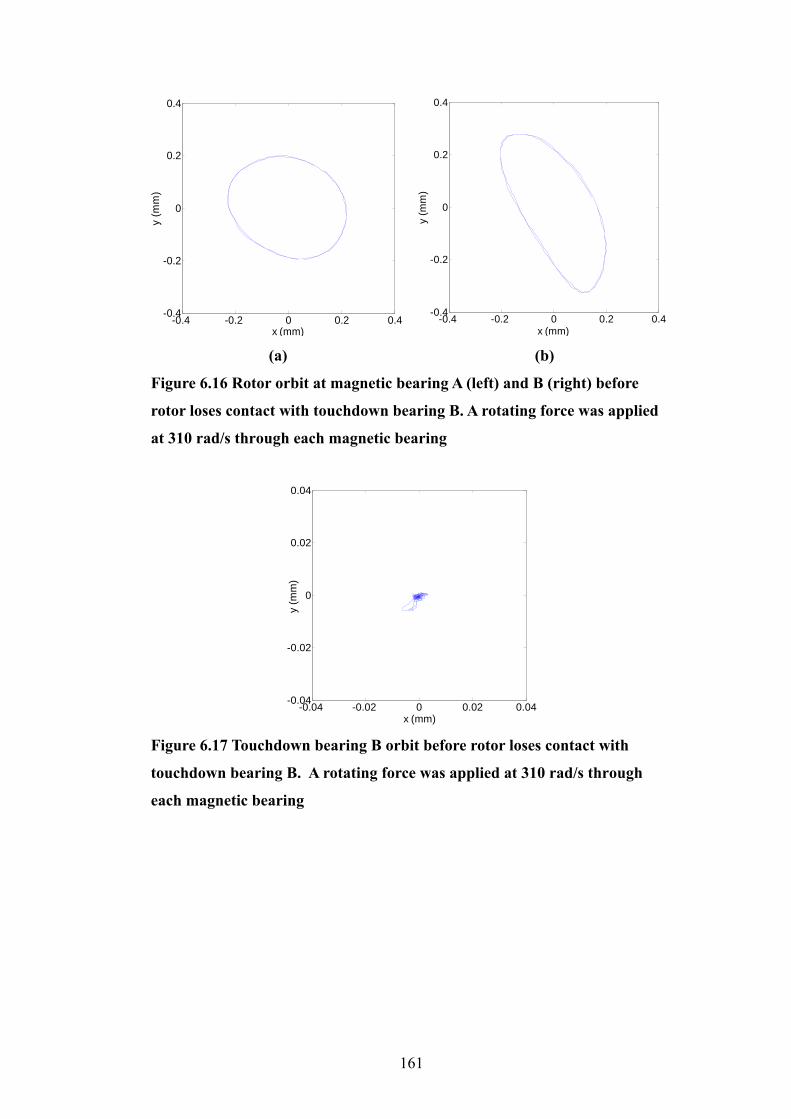
161
-0.4 -0.2 0 0.2 0.4-0.4
-0.2
0
0.2
0.4
x (mm)
y (m
m)
-0.4 -0.2 0 0.2 0.4-0.4
-0.2
0
0.2
0.4
x (mm)
y (m
m)
(a) (b)
Figure 6.16 Rotor orbit at magnetic bearing A (left) and B (right) before
rotor loses contact with touchdown bearing B. A rotating force was applied
at 310 rad/s through each magnetic bearing
-0.04 -0.02 0 0.02 0.04-0.04
-0.02
0
0.02
0.04
x (mm)
y (m
m)
Figure 6.17 Touchdown bearing B orbit before rotor loses contact with
touchdown bearing B. A rotating force was applied at 310 rad/s through
each magnetic bearing
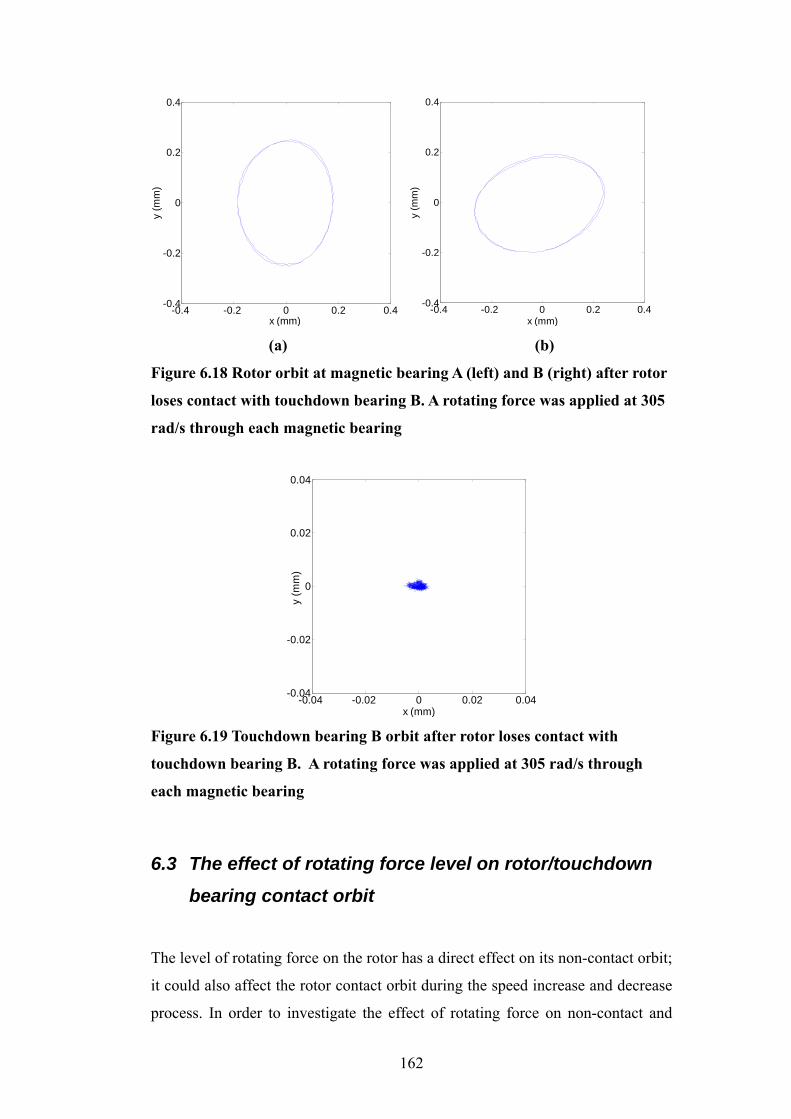
162
-0.4 -0.2 0 0.2 0.4-0.4
-0.2
0
0.2
0.4
x (mm)
y (m
m)
-0.4 -0.2 0 0.2 0.4-0.4
-0.2
0
0.2
0.4
x (mm)
y (m
m)
(a) (b)
Figure 6.18 Rotor orbit at magnetic bearing A (left) and B (right) after rotor
loses contact with touchdown bearing B. A rotating force was applied at 305
rad/s through each magnetic bearing
-0.04 -0.02 0 0.02 0.04-0.04
-0.02
0
0.02
0.04
x (mm)
y (m
m)
Figure 6.19 Touchdown bearing B orbit after rotor loses contact with
touchdown bearing B. A rotating force was applied at 305 rad/s through
each magnetic bearing
6.3 The effect of rotating force level on rotor/touchdown bearing contact orbit
The level of rotating force on the rotor has a direct effect on its non-contact orbit;
it could also affect the rotor contact orbit during the speed increase and decrease
process. In order to investigate the effect of rotating force on non-contact and

163
contact orbits, a higher level of rotating force was used. The level of rotating
mass eccentricity on the rotor was set to be 4100.7 −× kgm. The rotor and
touchdown bearing maximum radial displacements are shown in Figures 6.20
and 6.21 when the speed varies between 250 rad/s and 450 rad/s. The rotor
maximum radial displacement has a similar profile when the speed increases
compared with Figure 6.2. The rotor orbit is slightly larger and should make
contact with a touchdown bearing earlier when the level of rotating force is
higher. It also shows the rotor to come out of contact at similar frequencies
despite the difference in rotating force level. The level of rotating force has a
larger effect on the persistent contact range when the speed decreases, while it
has a smaller effect when the speed increases. When the rotating force is larger,
the speed region where the contact and non-contact orbits co-exist is much
smaller, which indicates that the region where touchdown bearing control would
bring rotor out of contact is smaller. Although any rotating force or unbalance
force on the rotor is not desirable, it may not be possible to eliminate it.
250 300 350 400 4500
0.1
0.2
0.3
0.4
0.5
Frequency (rad/s)
Rad
ial D
ispl
acem
ent (
mm
)
Increase in speedDecrease in speed
Figure 6.20 Rotor maximum radial displacement at magnetic bearing B with
respect to gradual change of the rotating force speed. The rotating force was
equivalent to 4107.0 −× kgm unbalance and applied through each magnetic
bearing
Clearance
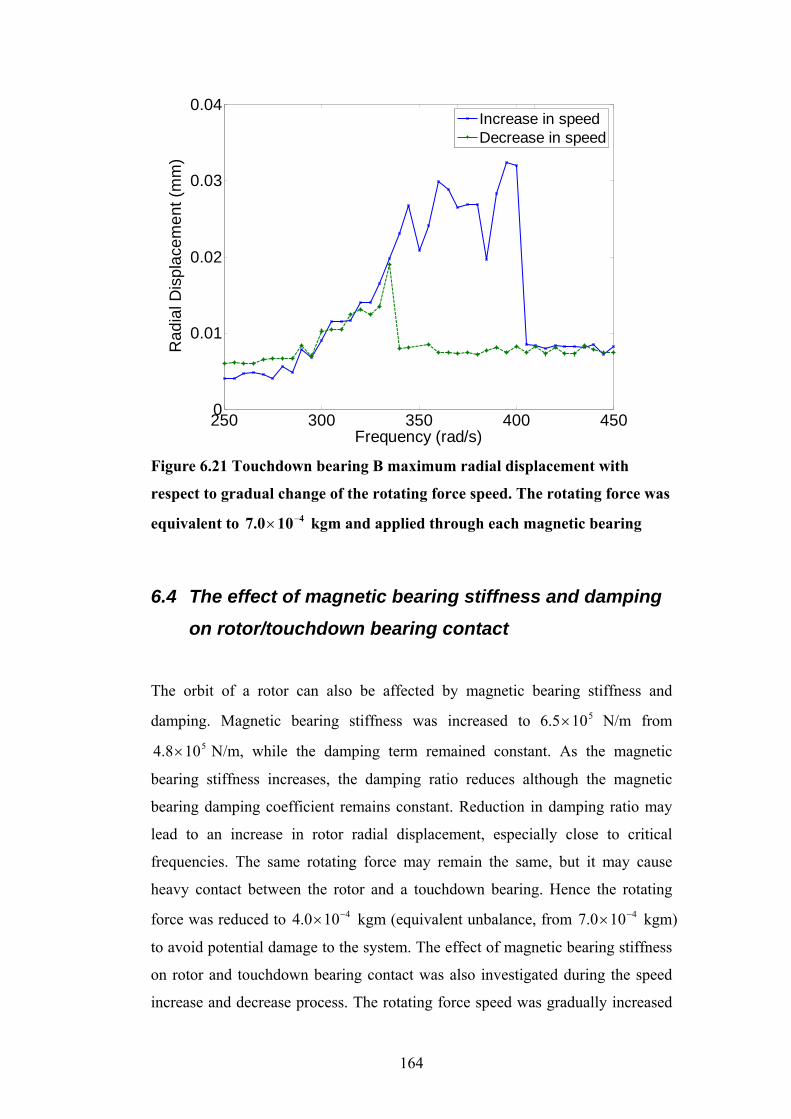
164
250 300 350 400 4500
0.01
0.02
0.03
0.04
Frequency (rad/s)
Rad
ial D
ispl
acem
ent (
mm
)
Increase in frequencyDecrease in frequency
Figure 6.21 Touchdown bearing B maximum radial displacement with
respect to gradual change of the rotating force speed. The rotating force was
equivalent to 4107.0 −× kgm and applied through each magnetic bearing
6.4 The effect of magnetic bearing stiffness and damping on rotor/touchdown bearing contact
The orbit of a rotor can also be affected by magnetic bearing stiffness and
damping. Magnetic bearing stiffness was increased to 5105.6 × N/m from 5108.4 × N/m, while the damping term remained constant. As the magnetic
bearing stiffness increases, the damping ratio reduces although the magnetic
bearing damping coefficient remains constant. Reduction in damping ratio may
lead to an increase in rotor radial displacement, especially close to critical
frequencies. The same rotating force may remain the same, but it may cause
heavy contact between the rotor and a touchdown bearing. Hence the rotating
force was reduced to 4100.4 −× kgm (equivalent unbalance, from 4100.7 −× kgm)
to avoid potential damage to the system. The effect of magnetic bearing stiffness
on rotor and touchdown bearing contact was also investigated during the speed
increase and decrease process. The rotating force speed was gradually increased
Increase in speedDecrease in speed
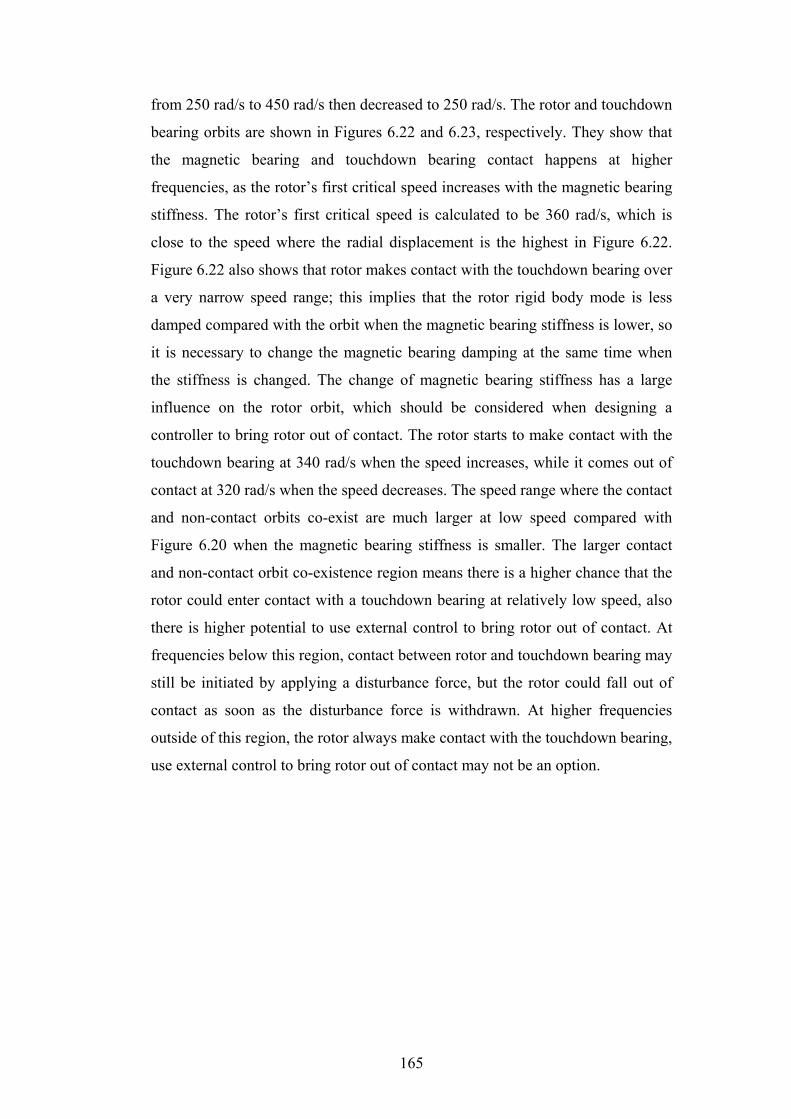
165
from 250 rad/s to 450 rad/s then decreased to 250 rad/s. The rotor and touchdown
bearing orbits are shown in Figures 6.22 and 6.23, respectively. They show that
the magnetic bearing and touchdown bearing contact happens at higher
frequencies, as the rotor’s first critical speed increases with the magnetic bearing
stiffness. The rotor’s first critical speed is calculated to be 360 rad/s, which is
close to the speed where the radial displacement is the highest in Figure 6.22.
Figure 6.22 also shows that rotor makes contact with the touchdown bearing over
a very narrow speed range; this implies that the rotor rigid body mode is less
damped compared with the orbit when the magnetic bearing stiffness is lower, so
it is necessary to change the magnetic bearing damping at the same time when
the stiffness is changed. The change of magnetic bearing stiffness has a large
influence on the rotor orbit, which should be considered when designing a
controller to bring rotor out of contact. The rotor starts to make contact with the
touchdown bearing at 340 rad/s when the speed increases, while it comes out of
contact at 320 rad/s when the speed decreases. The speed range where the contact
and non-contact orbits co-exist are much larger at low speed compared with
Figure 6.20 when the magnetic bearing stiffness is smaller. The larger contact
and non-contact orbit co-existence region means there is a higher chance that the
rotor could enter contact with a touchdown bearing at relatively low speed, also
there is higher potential to use external control to bring rotor out of contact. At
frequencies below this region, contact between rotor and touchdown bearing may
still be initiated by applying a disturbance force, but the rotor could fall out of
contact as soon as the disturbance force is withdrawn. At higher frequencies
outside of this region, the rotor always make contact with the touchdown bearing,
use external control to bring rotor out of contact may not be an option.

166
250 300 350 400 4500
0.1
0.2
0.3
0.4
0.5
Frequency (rad/s)
Rad
ial D
ispl
acem
ent (
mm
)
Increase in speedDecrease in speed
Figure 6.22 Rotor maximum radial displacement at magnetic bearing B with
respect to gradual change of rotating force speed. The effective magnetic
bearing stiffness is 5106.5× N/m
250 300 350 400 4500
0.005
0.01
0.015
0.02
0.025
Frequency (rad/s)
Rad
ial D
ispl
acem
ent (
mm
)
Increase in speedDecrease in speed
Figure 6.23 Touchdown bearing B maximum radial displacement with
respect to gradual change of rotating force speed. The effective magnetic
bearing stiffness is 5106.5× N/m
Clearance
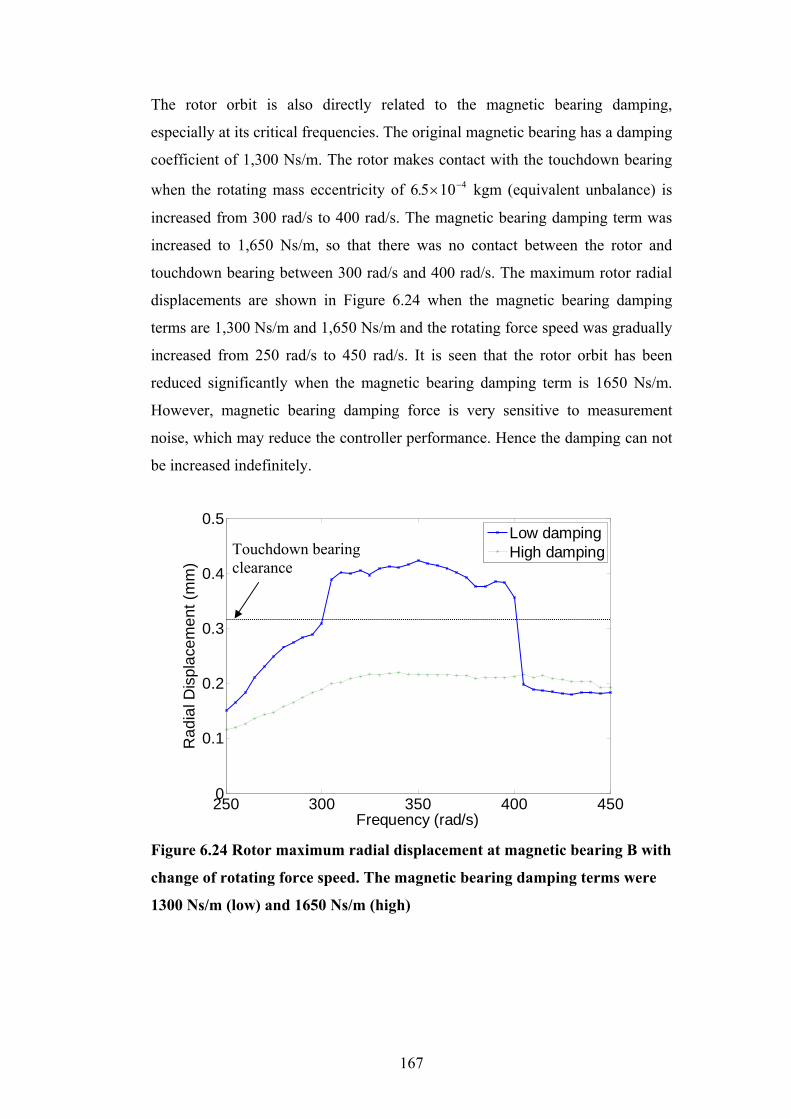
167
The rotor orbit is also directly related to the magnetic bearing damping,
especially at its critical frequencies. The original magnetic bearing has a damping
coefficient of 1,300 Ns/m. The rotor makes contact with the touchdown bearing
when the rotating mass eccentricity of 41056 −×. kgm (equivalent unbalance) is
increased from 300 rad/s to 400 rad/s. The magnetic bearing damping term was
increased to 1,650 Ns/m, so that there was no contact between the rotor and
touchdown bearing between 300 rad/s and 400 rad/s. The maximum rotor radial
displacements are shown in Figure 6.24 when the magnetic bearing damping
terms are 1,300 Ns/m and 1,650 Ns/m and the rotating force speed was gradually
increased from 250 rad/s to 450 rad/s. It is seen that the rotor orbit has been
reduced significantly when the magnetic bearing damping term is 1650 Ns/m.
However, magnetic bearing damping force is very sensitive to measurement
noise, which may reduce the controller performance. Hence the damping can not
be increased indefinitely.
250 300 350 400 4500
0.1
0.2
0.3
0.4
0.5
Rad
ial D
ispl
acem
ent (
mm
)
Frequency (rad/s)
Low dampingHigh damping
Figure 6.24 Rotor maximum radial displacement at magnetic bearing B with
change of rotating force speed. The magnetic bearing damping terms were
1300 Ns/m (low) and 1650 Ns/m (high)
Touchdown bearing clearance

168
6.5 Active touchdown bearing radial displacement The radial displacement of the touchdown bearing is restricted by the movement
of the piezoelectric stack actuators, which have a stroke of 0.12 mm.
Theoretically, the touchdown bearing should have a maximum possible radial
amplitude of 0.06 mm when a circular motion is applied to the touchdown
bearing. The maximum radial displacement may not be achieved due to losses
through the hydraulic lines. In order to find the maximum possible touchdown
bearing radial displacement, a circular motion demand signal was assigned to the
touchdown bearing. The touchdown bearing circular motion demand was 0.05
mm for frequencies between 10 and 1,000 rad/s. It was found that the touchdown
bearing radial displacement never reached the demand value. Its orbits at 20 rad/s
and 500 rad/s are shown in Figures 6.25 (a) and (b), respectively. It shows that
the actual touchdown bearing radial displacement was much smaller than the
demand. The actual average touchdown bearing radial displacement at different
frequencies is shown in Figure 6.26. The radial displacement levels off at 0.024
mm when the speed is higher than 400 rad/s. The touchdown bearing orbit was
not quite circular especially at low frequencies due to the saturation of the
hydraulic piston movement, but the orbit roundness improves with increasing
speed. It is also noticeable that the touchdown bearing orbit centre shifts slightly
from the coordinate centre, because the stiffness may be different in each
hydraulic piston and the pistons may not return to the original positions due to
the friction in the hydraulic seals.
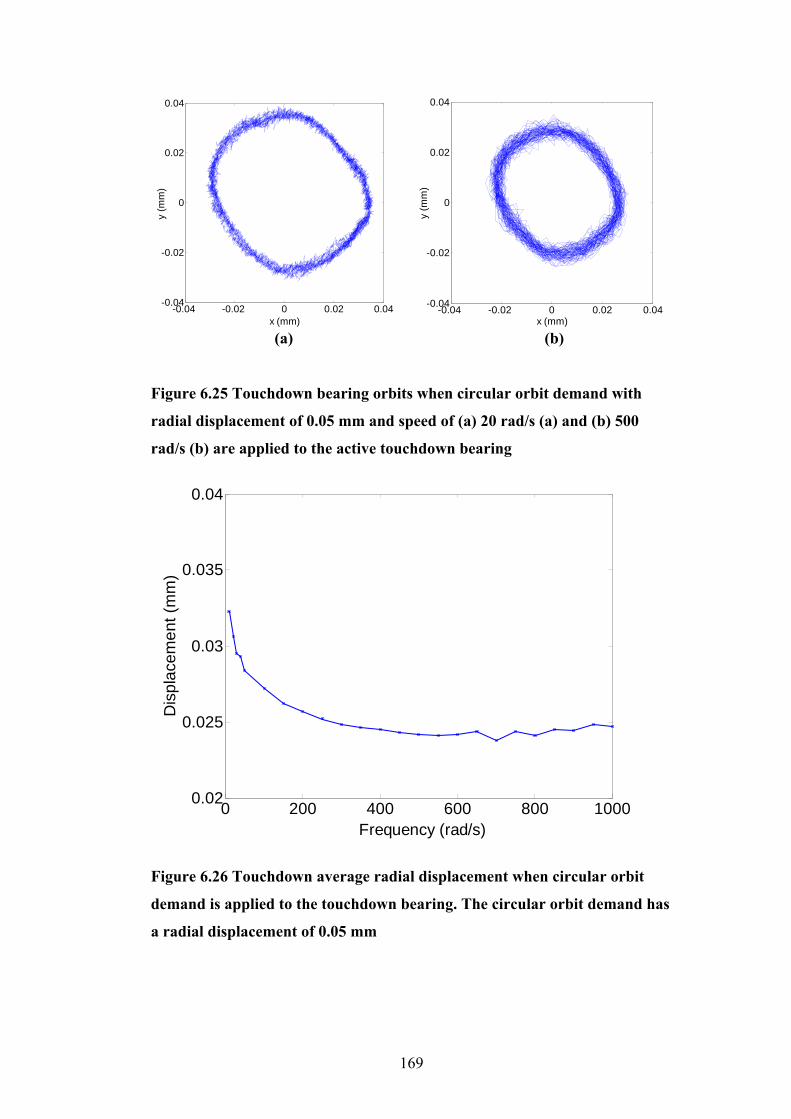
169
-0.04 -0.02 0 0.02 0.04-0.04
-0.02
0
0.02
0.04
x (mm)
y (m
m)
-0.04 -0.02 0 0.02 0.04-0.04
-0.02
0
0.02
0.04
x (mm)
y (m
m)
(a) (b)
Figure 6.25 Touchdown bearing orbits when circular orbit demand with
radial displacement of 0.05 mm and speed of (a) 20 rad/s (a) and (b) 500
rad/s (b) are applied to the active touchdown bearing
0 200 400 600 800 10000.02
0.025
0.03
0.035
0.04
Speed (rad/s)
Dis
plac
emen
t (m
m)
Figure 6.26 Touchdown average radial displacement when circular orbit
demand is applied to the touchdown bearing. The circular orbit demand has
a radial displacement of 0.05 mm
Frequency (rad/s)
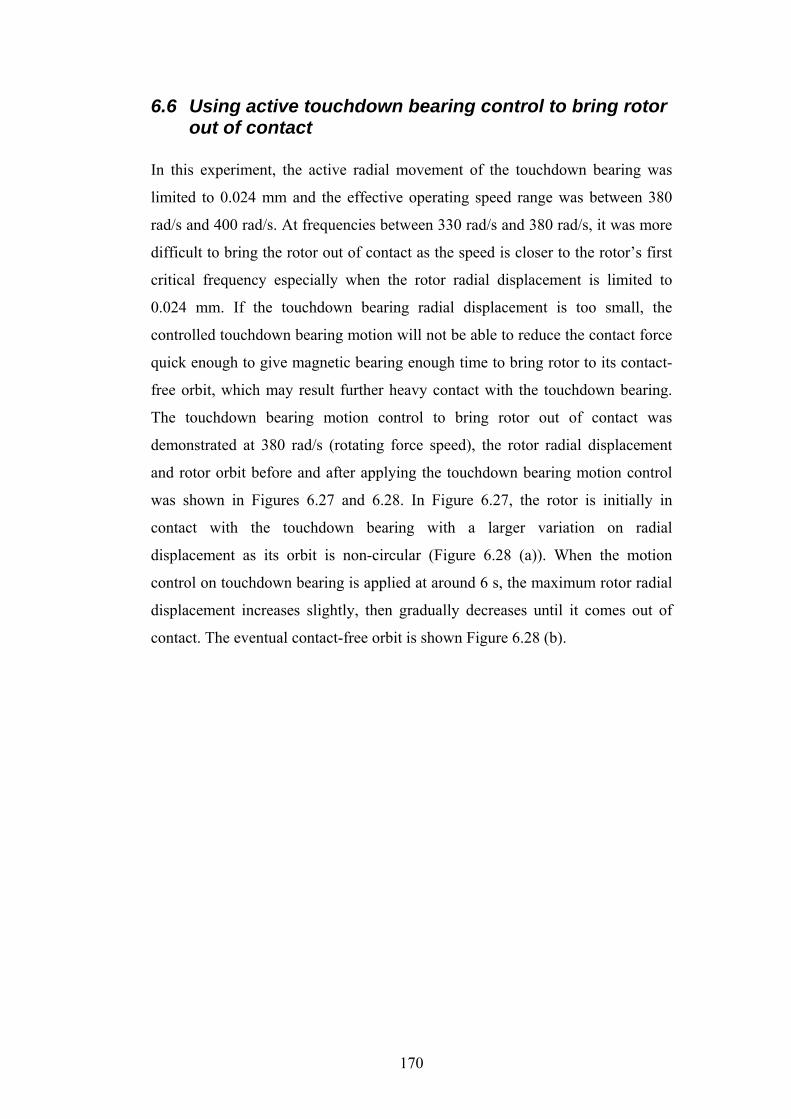
170
6.6 Using active touchdown bearing control to bring rotor out of contact
In this experiment, the active radial movement of the touchdown bearing was
limited to 0.024 mm and the effective operating speed range was between 380
rad/s and 400 rad/s. At frequencies between 330 rad/s and 380 rad/s, it was more
difficult to bring the rotor out of contact as the speed is closer to the rotor’s first
critical frequency especially when the rotor radial displacement is limited to
0.024 mm. If the touchdown bearing radial displacement is too small, the
controlled touchdown bearing motion will not be able to reduce the contact force
quick enough to give magnetic bearing enough time to bring rotor to its contact-
free orbit, which may result further heavy contact with the touchdown bearing.
The touchdown bearing motion control to bring rotor out of contact was
demonstrated at 380 rad/s (rotating force speed), the rotor radial displacement
and rotor orbit before and after applying the touchdown bearing motion control
was shown in Figures 6.27 and 6.28. In Figure 6.27, the rotor is initially in
contact with the touchdown bearing with a larger variation on radial
displacement as its orbit is non-circular (Figure 6.28 (a)). When the motion
control on touchdown bearing is applied at around 6 s, the maximum rotor radial
displacement increases slightly, then gradually decreases until it comes out of
contact. The eventual contact-free orbit is shown Figure 6.28 (b).

171
0 5 10 150
0.05
0.1
0.15
0.2
0.25
0.3
0.35
0.4
Time (s)
Rad
ial D
ispl
acem
ent (
mm
)
Figure 6.27 Rotor radial displacement at magnetic bearing B. Touchdown
bearing control is applied at around 6 s to bring rotor out of contact
-0.4 -0.2 0 0.2 0.4-0.4
-0.2
0
0.2
0.4
x (mm)
y (m
m)
-0.4 -0.2 0 0.2 0.4-0.4
-0.2
0
0.2
0.4
x (mm)
y (m
m)
(a) (b)
Figure 6.28 Rotor orbit at magnetic bearing B before (a) and after (b)
touchdown bearing control is applied.
The touchdown bearing orbit before and after applying control is shown in
Figures 6.29 (a) and (b), respectively. The touchdown bearing controlled orbit is
shown in Figure 6.29 (b) and it is non-circular. It indicates that the hydraulic
pistons used to push the touchdown bearing are at their saturation level. This may
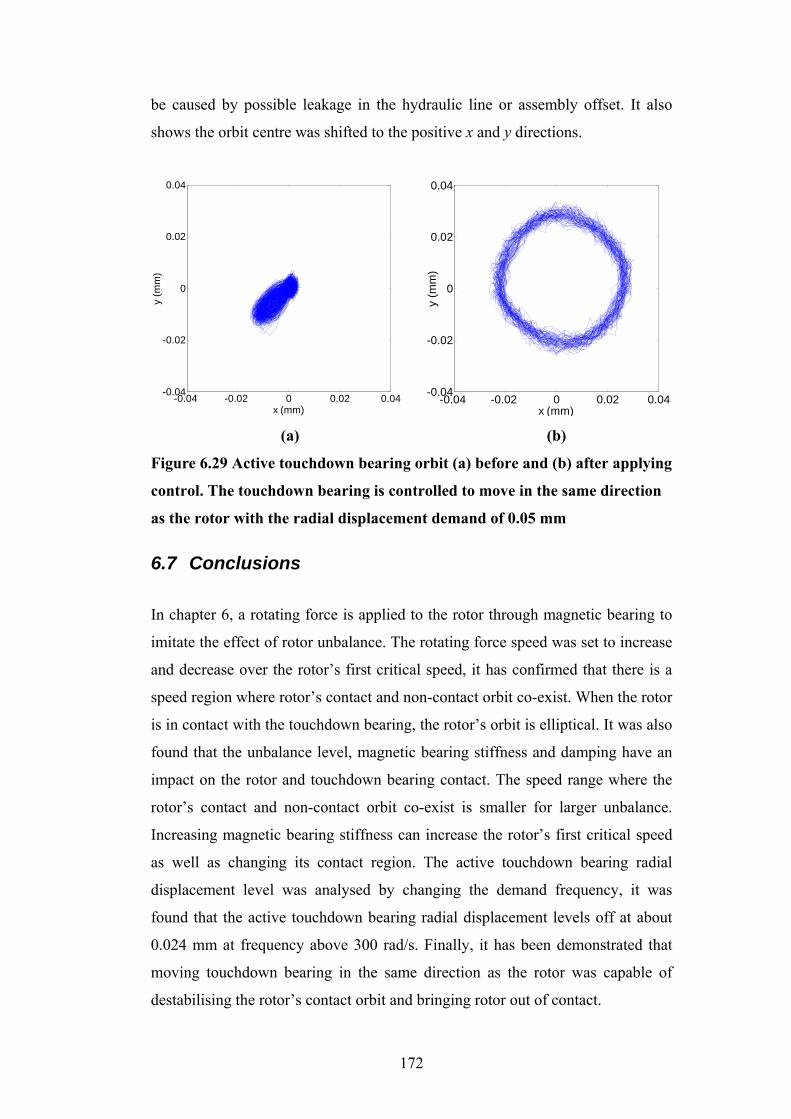
172
be caused by possible leakage in the hydraulic line or assembly offset. It also
shows the orbit centre was shifted to the positive x and y directions.
-0.04 -0.02 0 0.02 0.04-0.04
-0.02
0
0.02
0.04
x (mm)
y (m
m)
-0.04 -0.02 0 0.02 0.04-0.04
-0.02
0
0.02
0.04
x (mm)
y (m
m)
(a) (b)
Figure 6.29 Active touchdown bearing orbit (a) before and (b) after applying
control. The touchdown bearing is controlled to move in the same direction
as the rotor with the radial displacement demand of 0.05 mm
6.7 Conclusions
In chapter 6, a rotating force is applied to the rotor through magnetic bearing to
imitate the effect of rotor unbalance. The rotating force speed was set to increase
and decrease over the rotor’s first critical speed, it has confirmed that there is a
speed region where rotor’s contact and non-contact orbit co-exist. When the rotor
is in contact with the touchdown bearing, the rotor’s orbit is elliptical. It was also
found that the unbalance level, magnetic bearing stiffness and damping have an
impact on the rotor and touchdown bearing contact. The speed range where the
rotor’s contact and non-contact orbit co-exist is smaller for larger unbalance.
Increasing magnetic bearing stiffness can increase the rotor’s first critical speed
as well as changing its contact region. The active touchdown bearing radial
displacement level was analysed by changing the demand frequency, it was
found that the active touchdown bearing radial displacement levels off at about
0.024 mm at frequency above 300 rad/s. Finally, it has been demonstrated that
moving touchdown bearing in the same direction as the rotor was capable of
destabilising the rotor’s contact orbit and bringing rotor out of contact.
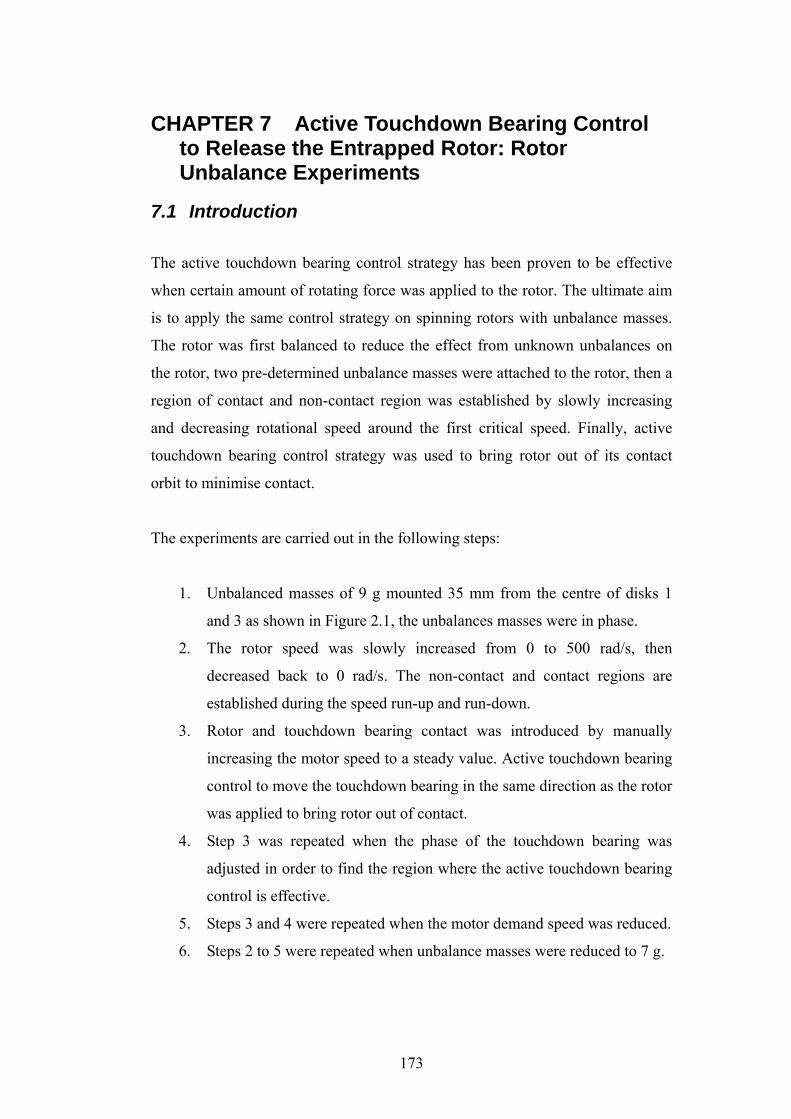
173
CHAPTER 7 Active Touchdown Bearing Control to Release the Entrapped Rotor: Rotor Unbalance Experiments
7.1 Introduction
The active touchdown bearing control strategy has been proven to be effective
when certain amount of rotating force was applied to the rotor. The ultimate aim
is to apply the same control strategy on spinning rotors with unbalance masses.
The rotor was first balanced to reduce the effect from unknown unbalances on
the rotor, two pre-determined unbalance masses were attached to the rotor, then a
region of contact and non-contact region was established by slowly increasing
and decreasing rotational speed around the first critical speed. Finally, active
touchdown bearing control strategy was used to bring rotor out of its contact
orbit to minimise contact.
The experiments are carried out in the following steps:
1. Unbalanced masses of 9 g mounted 35 mm from the centre of disks 1
and 3 as shown in Figure 2.1, the unbalances masses were in phase.
2. The rotor speed was slowly increased from 0 to 500 rad/s, then
decreased back to 0 rad/s. The non-contact and contact regions are
established during the speed run-up and run-down.
3. Rotor and touchdown bearing contact was introduced by manually
increasing the motor speed to a steady value. Active touchdown bearing
control to move the touchdown bearing in the same direction as the rotor
was applied to bring rotor out of contact.
4. Step 3 was repeated when the phase of the touchdown bearing was
adjusted in order to find the region where the active touchdown bearing
control is effective.
5. Steps 3 and 4 were repeated when the motor demand speed was reduced.
6. Steps 2 to 5 were repeated when unbalance masses were reduced to 7 g.
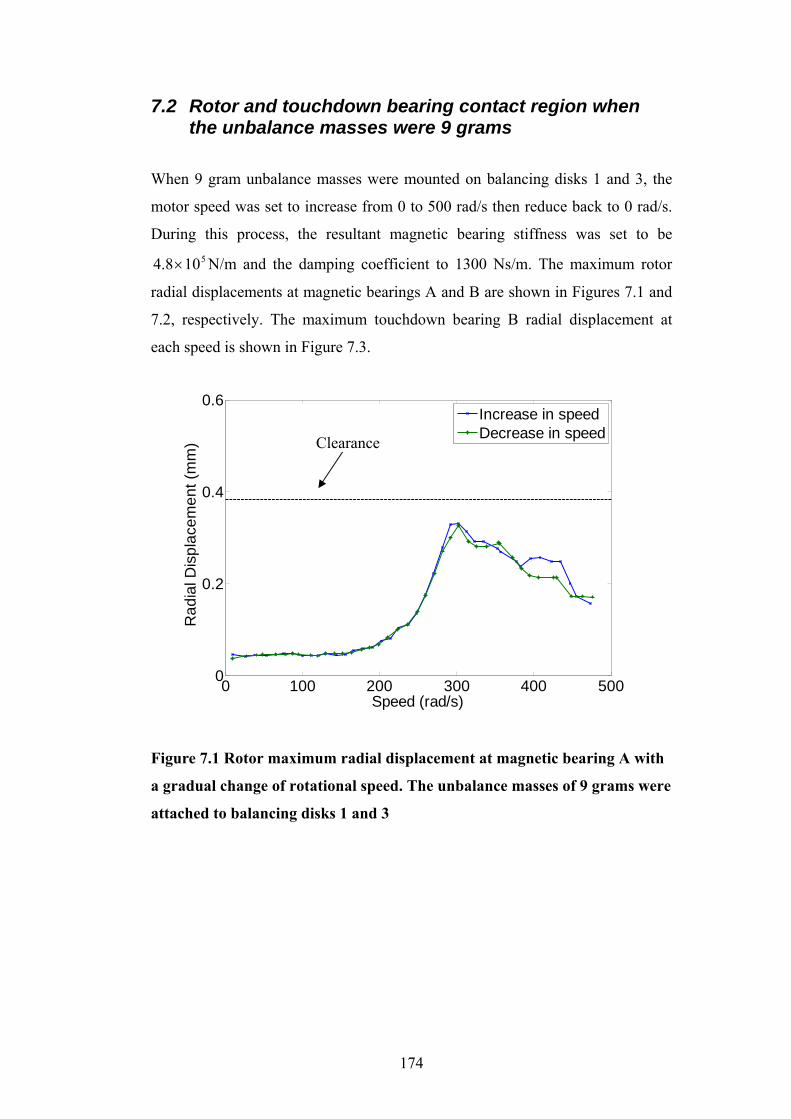
174
7.2 Rotor and touchdown bearing contact region when the unbalance masses were 9 grams
When 9 gram unbalance masses were mounted on balancing disks 1 and 3, the
motor speed was set to increase from 0 to 500 rad/s then reduce back to 0 rad/s.
During this process, the resultant magnetic bearing stiffness was set to be 5108.4 × N/m and the damping coefficient to 1300 Ns/m. The maximum rotor
radial displacements at magnetic bearings A and B are shown in Figures 7.1 and
7.2, respectively. The maximum touchdown bearing B radial displacement at
each speed is shown in Figure 7.3.
0 100 200 300 400 5000
0.2
0.4
0.6
Speed (rad/s)
Rad
ial D
ispl
acem
ent (
mm
)
Increase in speedDecrease in speed
Figure 7.1 Rotor maximum radial displacement at magnetic bearing A with
a gradual change of rotational speed. The unbalance masses of 9 grams were
attached to balancing disks 1 and 3
Clearance
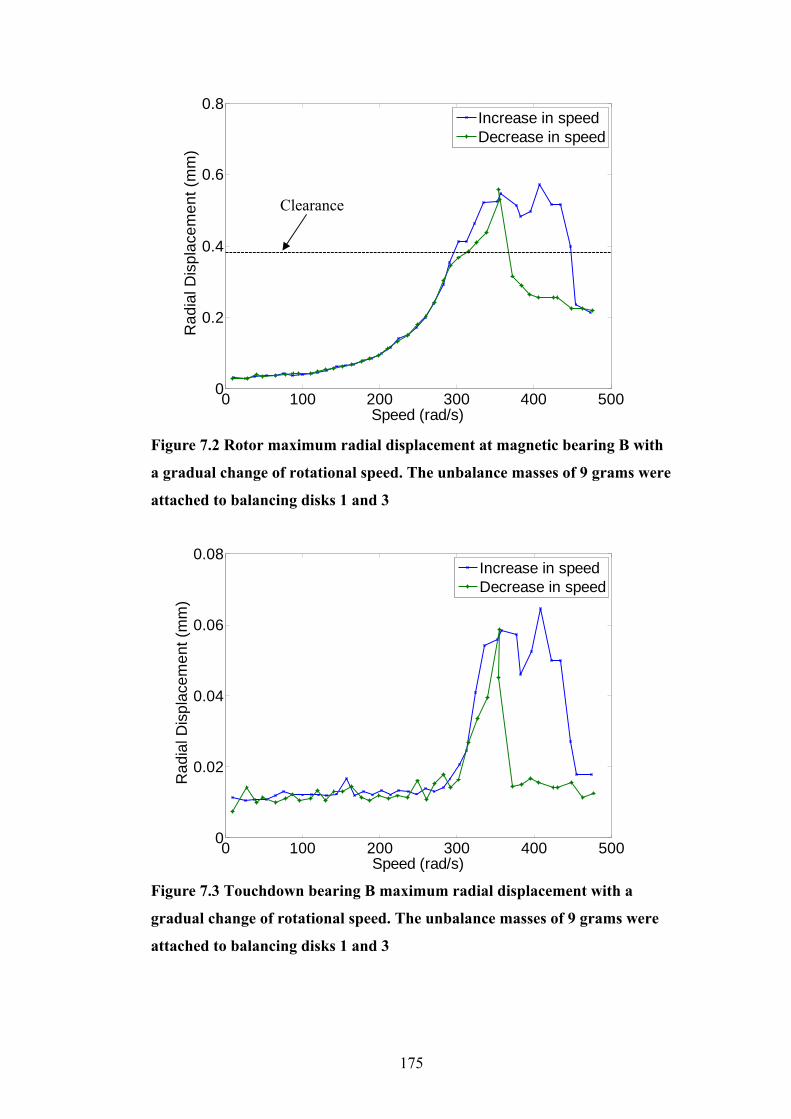
175
0 100 200 300 400 5000
0.2
0.4
0.6
0.8
Speed (rad/s)
Rad
ial D
ispl
acem
ent (
mm
)
Increase in speedDecrease in speed
Figure 7.2 Rotor maximum radial displacement at magnetic bearing B with
a gradual change of rotational speed. The unbalance masses of 9 grams were
attached to balancing disks 1 and 3
0 100 200 300 400 5000
0.02
0.04
0.06
0.08
Speed (rad/s)
Rad
ial D
ispl
acem
ent (
mm
)
Increase in speedDecrease in speed
Figure 7.3 Touchdown bearing B maximum radial displacement with a
gradual change of rotational speed. The unbalance masses of 9 grams were
attached to balancing disks 1 and 3
Clearance
176
Figure 7.1 shows that no contact occurs between the rotor and touchdown
bearing A between 0 and 500 rad/s. Figure 7.2 shows that rotor does not make
contact with the touchdown bearing B at speeds below 291 rad/s, it starts to make
contact when its radial displacement at magnetic bearing B was higher than 0.38
mm. For the purpose of ensuring more consistent results, the TDB journal
bearing was changed to give a slightly larger radial clearance (less sensitive to
the alignment) compared with the clearance 0.32 mm in Figure 6.2. The rotor
makes contact with the touchdown bearing until the motor speed reaches 447
rad/s during the speed run up process, which is also shown by the touchdown
bearing radial displacement in Figure 7.3. When the speed decreases from 476 to
0 rad/s, Figure 7.2 shows that the rotor radial displacement starts to increase with
speed. As the speed approaches the first critical frequency, contact occurs at
around 357 rad/s and continues until the speed reduces to 302 rad/s. It shows that
the rotor has a region where contact and non-contact co-exist between 373 and
447 rad/s. The function of the active touchdown bearing control is to move the
rotor from the contact orbit to the non-contact orbit within this region.
The rotor orbits at magnetic bearings A and B before rotor makes contact with
touchdown bearing B are shown in Figure 7.4 when the motor speed was 291
rad/s. Touchdown bearing B orbit is shown in Figure 7.5. When the motor speed
increased to 303 rad/s, rotor started to make contact with touchdown bearing B.
The rotor and touchdown bearing orbits are shown in Figures 7.6 and 7.7,
respectively. Rotor and touchdown bearing contact continuous until 447 rad/s,
the rotor orbits at both magnetic bearings are shown in Figure 7.8. The active
touchdown bearing orbit is chaotic as shown in Figure 7.9. It shows that
magnetic bearing and touchdown bearing are offset. When the motor speed
increased to about 455 rad/s, rotor came out of contact with touchdown bearing B.
The rotor and touchdown bearing radial displacements are shown in Figure 7.10
and 7.11, respectively. They show that rotor orbits were reduced and touchdown
bearing returned back to its original position.

177
-0.4 -0.2 0 0.2 0.4-0.4
-0.2
0
0.2
0.4
x (mm)
y (m
m)
-0.4 -0.2 0 0.2 0.4-0.4
-0.2
0
0.2
0.4
x (mm)
y (m
m)
(a) (b)
Figure 7.4 Rotor orbits at magnetic bearing A (left) and B (right) before the
rotor makes contact with touchdown bearing B during speed run up, when
the speed was 291 rad/s
-0.04 -0.02 0 0.02 0.04-0.04
-0.02
0
0.02
0.04
x (mm)
y (m
m)
Figure 7.5 Touchdown bearing B orbit before the rotor makes contact with
touchdown bearing B during speed run up. The motor speed was 291 rad/s
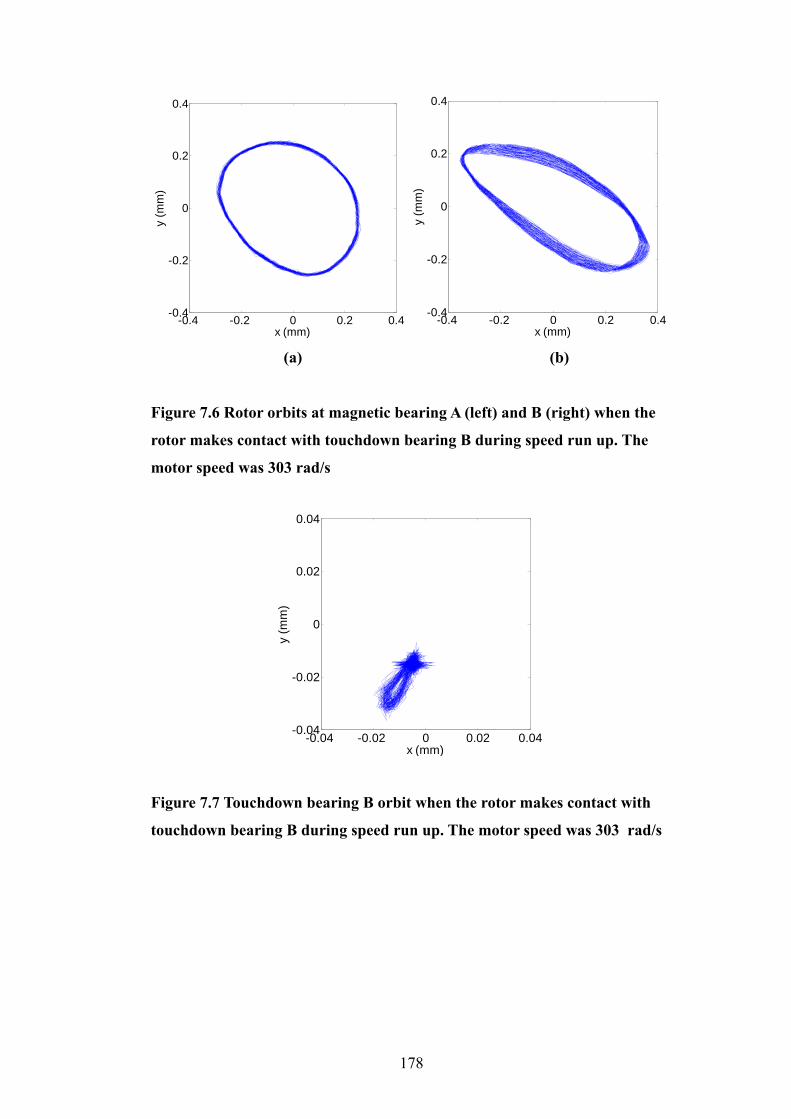
178
-0.4 -0.2 0 0.2 0.4-0.4
-0.2
0
0.2
0.4
x (mm)
y (m
m)
-0.4 -0.2 0 0.2 0.4-0.4
-0.2
0
0.2
0.4
x (mm)
y (m
m)
(a) (b)
Figure 7.6 Rotor orbits at magnetic bearing A (left) and B (right) when the
rotor makes contact with touchdown bearing B during speed run up. The
motor speed was 303 rad/s
-0.04 -0.02 0 0.02 0.04-0.04
-0.02
0
0.02
0.04
x (mm)
y (m
m)
Figure 7.7 Touchdown bearing B orbit when the rotor makes contact with
touchdown bearing B during speed run up. The motor speed was 303 rad/s
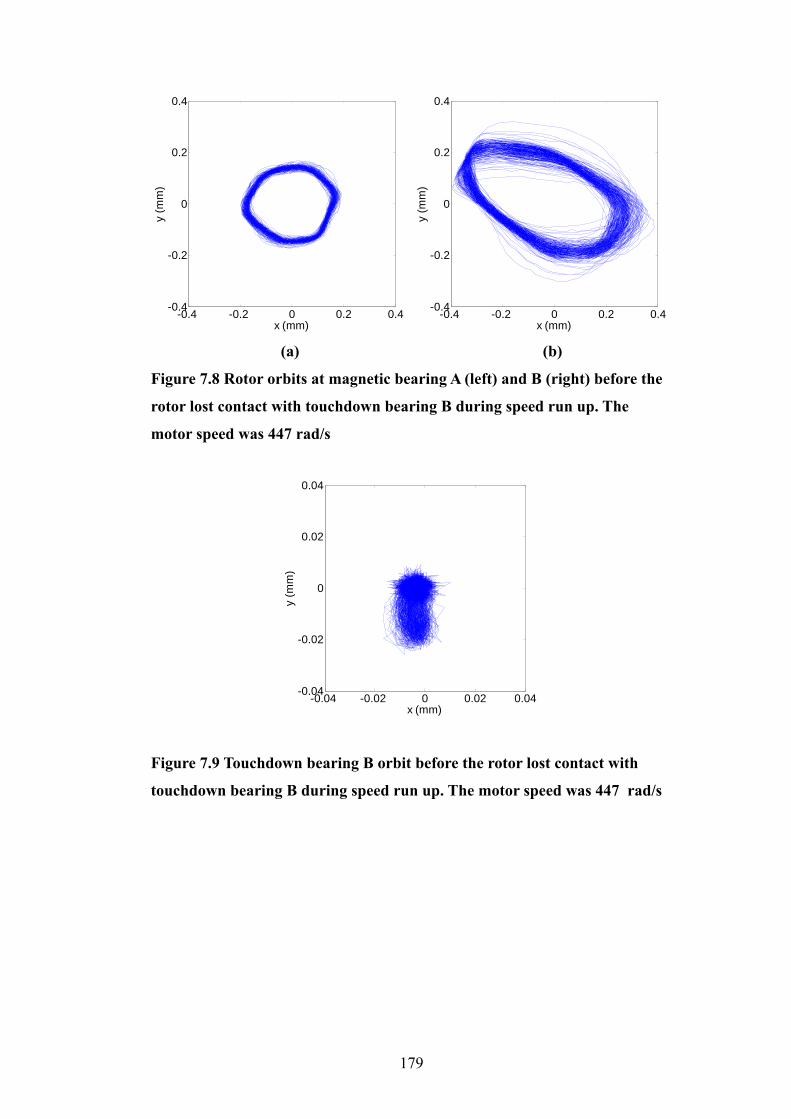
179
-0.4 -0.2 0 0.2 0.4-0.4
-0.2
0
0.2
0.4
x (mm)
y (m
m)
-0.4 -0.2 0 0.2 0.4-0.4
-0.2
0
0.2
0.4
x (mm)
y (m
m)
(a) (b)
Figure 7.8 Rotor orbits at magnetic bearing A (left) and B (right) before the
rotor lost contact with touchdown bearing B during speed run up. The
motor speed was 447 rad/s
-0.04 -0.02 0 0.02 0.04-0.04
-0.02
0
0.02
0.04
x (mm)
y (m
m)
Figure 7.9 Touchdown bearing B orbit before the rotor lost contact with
touchdown bearing B during speed run up. The motor speed was 447 rad/s
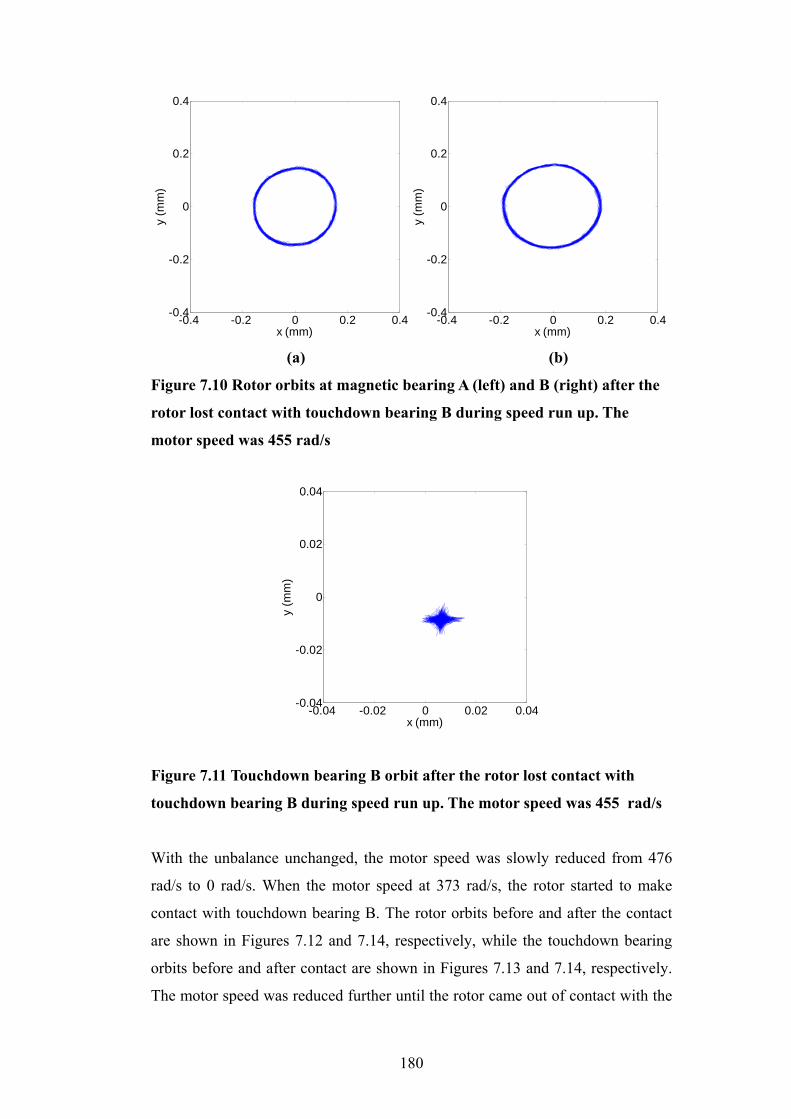
180
-0.4 -0.2 0 0.2 0.4-0.4
-0.2
0
0.2
0.4
x (mm)
y (m
m)
-0.4 -0.2 0 0.2 0.4-0.4
-0.2
0
0.2
0.4
x (mm)
y (m
m)
(a) (b)
Figure 7.10 Rotor orbits at magnetic bearing A (left) and B (right) after the
rotor lost contact with touchdown bearing B during speed run up. The
motor speed was 455 rad/s
-0.04 -0.02 0 0.02 0.04-0.04
-0.02
0
0.02
0.04
x (mm)
y (m
m)
Figure 7.11 Touchdown bearing B orbit after the rotor lost contact with
touchdown bearing B during speed run up. The motor speed was 455 rad/s
With the unbalance unchanged, the motor speed was slowly reduced from 476
rad/s to 0 rad/s. When the motor speed at 373 rad/s, the rotor started to make
contact with touchdown bearing B. The rotor orbits before and after the contact
are shown in Figures 7.12 and 7.14, respectively, while the touchdown bearing
orbits before and after contact are shown in Figures 7.13 and 7.14, respectively.
The motor speed was reduced further until the rotor came out of contact with the

181
touchdown bearing at 292 rad/s. The rotor orbits before and after it lost contact
with touchdown bearing are shown in Figures 7.16 and 7.17, respectively. The
touchdown bearing orbits before and after rotor came out of contact are shown in
Figures 7.17 and 7.19, respectively.
-0.4 -0.2 0 0.2 0.4-0.4
-0.2
0
0.2
0.4
x (mm)
y (m
m)
-0.4 -0.2 0 0.2 0.4-0.4
-0.2
0
0.2
0.4
x (mm)
y (m
m)
(a) (b)
Figure 7.12 Rotor orbits at magnetic bearing A (left) and B (right) before it
makes contact with touchdown bearing B during speed run down, the motor
speed was 350 rad/s
-0.04 -0.02 0 0.02 0.04-0.04
-0.02
0
0.02
0.04
x (mm)
y (m
m)
Figure 7.13 Touchdown bearing B orbit before rotor makes contact with it,
during speed run down. The motor speed was 350 rad/s
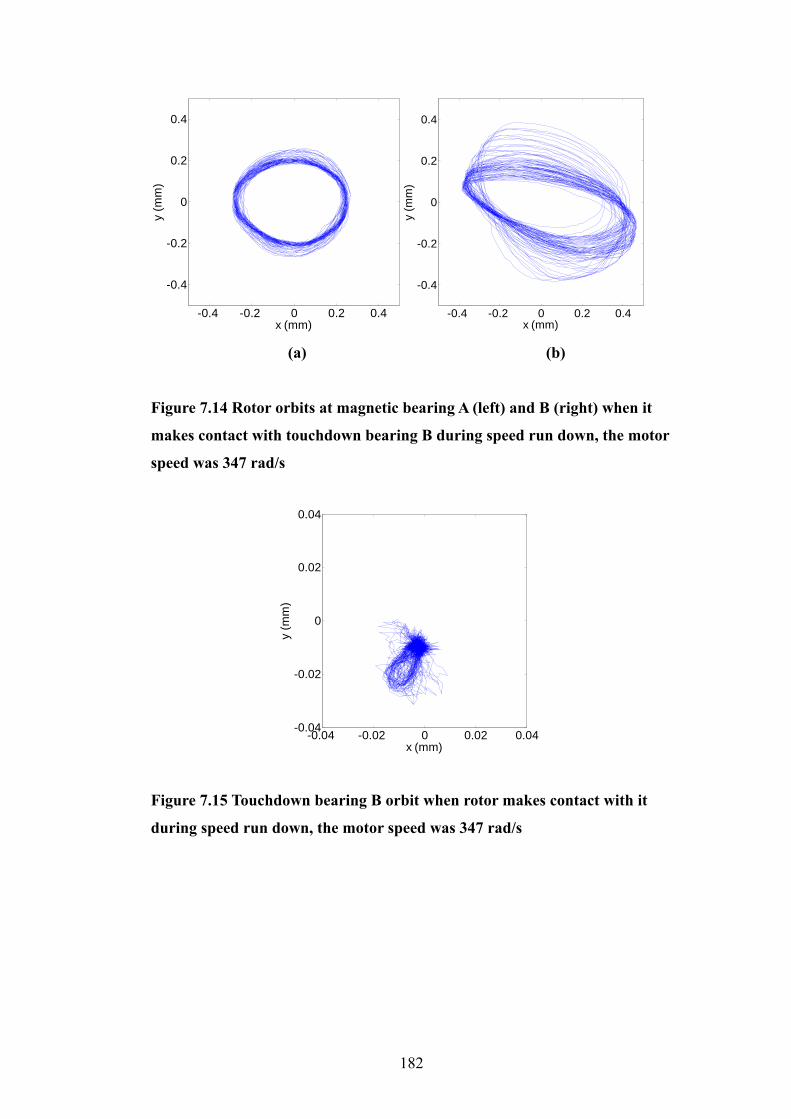
182
-0.4 -0.2 0 0.2 0.4
-0.4
-0.2
0
0.2
0.4
x (mm)
y (m
m)
-0.4 -0.2 0 0.2 0.4
-0.4
-0.2
0
0.2
0.4
x (mm)
y (m
m)
(a) (b)
Figure 7.14 Rotor orbits at magnetic bearing A (left) and B (right) when it
makes contact with touchdown bearing B during speed run down, the motor
speed was 347 rad/s
-0.04 -0.02 0 0.02 0.04-0.04
-0.02
0
0.02
0.04
x (mm)
y (m
m)
Figure 7.15 Touchdown bearing B orbit when rotor makes contact with it
during speed run down, the motor speed was 347 rad/s
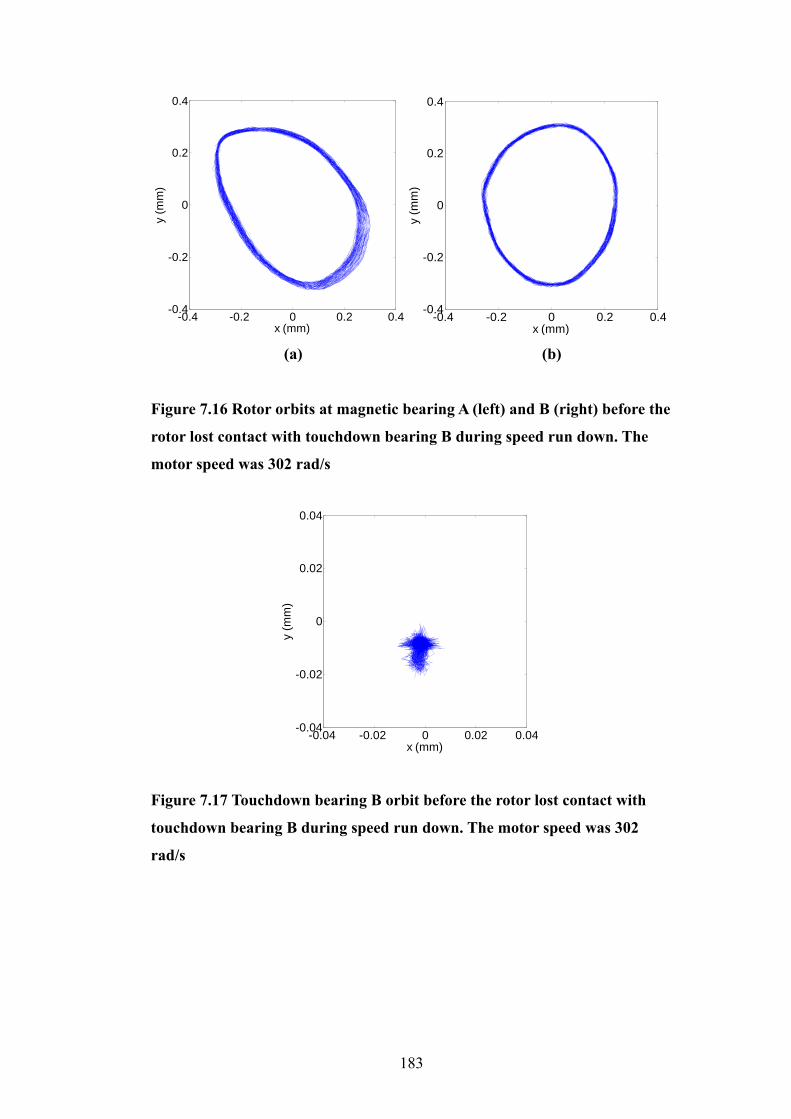
183
-0.4 -0.2 0 0.2 0.4-0.4
-0.2
0
0.2
0.4
x (mm)
y (m
m)
-0.4 -0.2 0 0.2 0.4-0.4
-0.2
0
0.2
0.4
x (mm)
y (m
m)
(a) (b)
Figure 7.16 Rotor orbits at magnetic bearing A (left) and B (right) before the
rotor lost contact with touchdown bearing B during speed run down. The
motor speed was 302 rad/s
-0.04 -0.02 0 0.02 0.04-0.04
-0.02
0
0.02
0.04
x (mm)
y (m
m)
Figure 7.17 Touchdown bearing B orbit before the rotor lost contact with
touchdown bearing B during speed run down. The motor speed was 302
rad/s
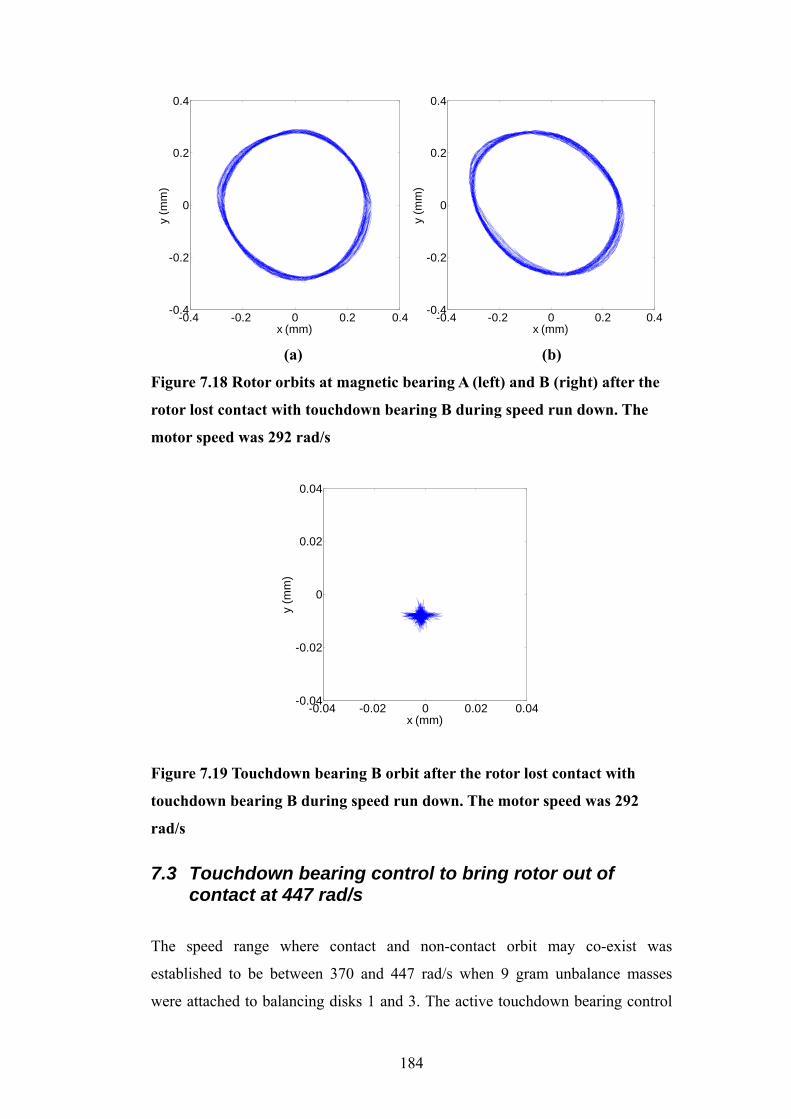
184
-0.4 -0.2 0 0.2 0.4-0.4
-0.2
0
0.2
0.4
x (mm)
y (m
m)
-0.4 -0.2 0 0.2 0.4-0.4
-0.2
0
0.2
0.4
x (mm)
y (m
m)
(a) (b)
Figure 7.18 Rotor orbits at magnetic bearing A (left) and B (right) after the
rotor lost contact with touchdown bearing B during speed run down. The
motor speed was 292 rad/s
-0.04 -0.02 0 0.02 0.04-0.04
-0.02
0
0.02
0.04
x (mm)
y (m
m)
Figure 7.19 Touchdown bearing B orbit after the rotor lost contact with
touchdown bearing B during speed run down. The motor speed was 292
rad/s
7.3 Touchdown bearing control to bring rotor out of contact at 447 rad/s
The speed range where contact and non-contact orbit may co-exist was
established to be between 370 and 447 rad/s when 9 gram unbalance masses
were attached to balancing disks 1 and 3. The active touchdown bearing control
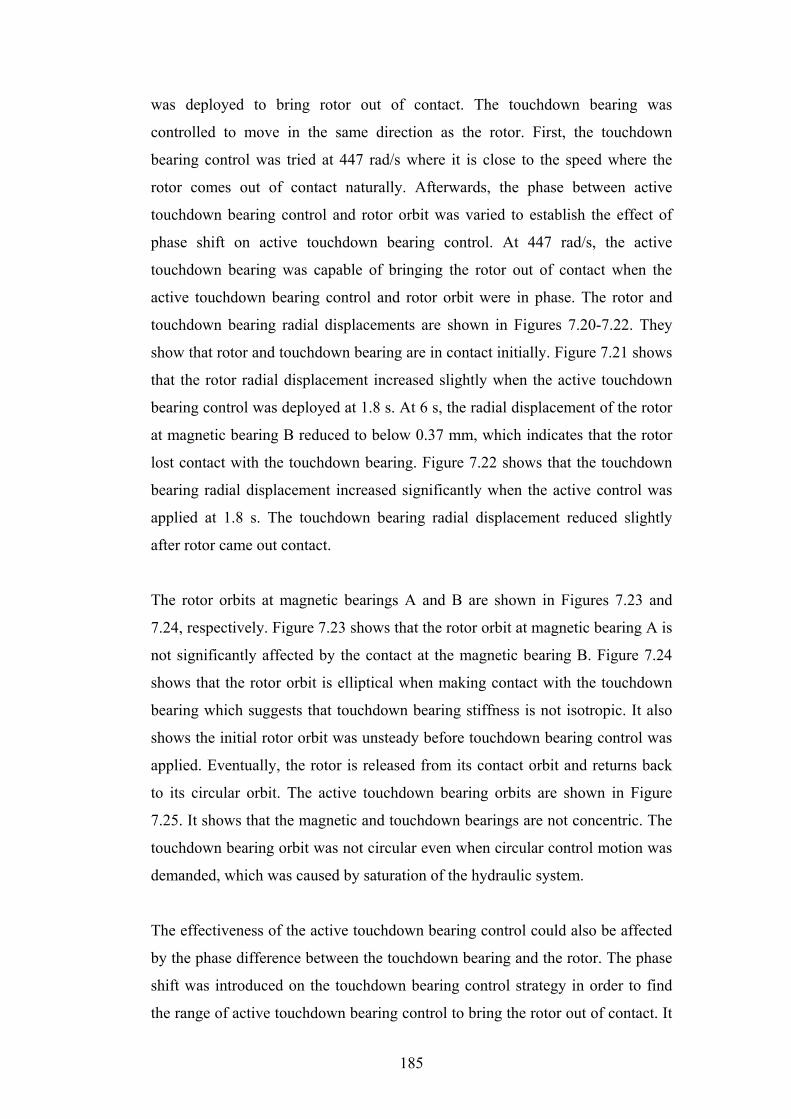
185
was deployed to bring rotor out of contact. The touchdown bearing was
controlled to move in the same direction as the rotor. First, the touchdown
bearing control was tried at 447 rad/s where it is close to the speed where the
rotor comes out of contact naturally. Afterwards, the phase between active
touchdown bearing control and rotor orbit was varied to establish the effect of
phase shift on active touchdown bearing control. At 447 rad/s, the active
touchdown bearing was capable of bringing the rotor out of contact when the
active touchdown bearing control and rotor orbit were in phase. The rotor and
touchdown bearing radial displacements are shown in Figures 7.20-7.22. They
show that rotor and touchdown bearing are in contact initially. Figure 7.21 shows
that the rotor radial displacement increased slightly when the active touchdown
bearing control was deployed at 1.8 s. At 6 s, the radial displacement of the rotor
at magnetic bearing B reduced to below 0.37 mm, which indicates that the rotor
lost contact with the touchdown bearing. Figure 7.22 shows that the touchdown
bearing radial displacement increased significantly when the active control was
applied at 1.8 s. The touchdown bearing radial displacement reduced slightly
after rotor came out contact.
The rotor orbits at magnetic bearings A and B are shown in Figures 7.23 and
7.24, respectively. Figure 7.23 shows that the rotor orbit at magnetic bearing A is
not significantly affected by the contact at the magnetic bearing B. Figure 7.24
shows that the rotor orbit is elliptical when making contact with the touchdown
bearing which suggests that touchdown bearing stiffness is not isotropic. It also
shows the initial rotor orbit was unsteady before touchdown bearing control was
applied. Eventually, the rotor is released from its contact orbit and returns back
to its circular orbit. The active touchdown bearing orbits are shown in Figure
7.25. It shows that the magnetic and touchdown bearings are not concentric. The
touchdown bearing orbit was not circular even when circular control motion was
demanded, which was caused by saturation of the hydraulic system.
The effectiveness of the active touchdown bearing control could also be affected
by the phase difference between the touchdown bearing and the rotor. The phase
shift was introduced on the touchdown bearing control strategy in order to find
the range of active touchdown bearing control to bring the rotor out of contact. It
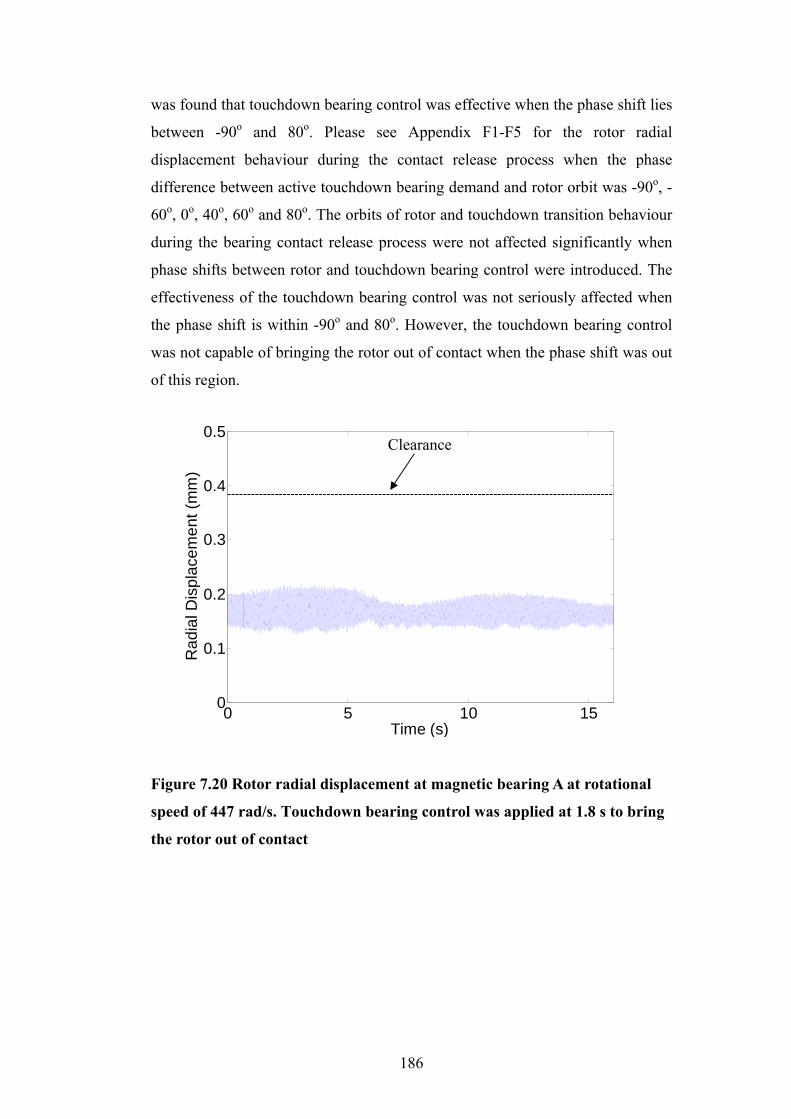
186
was found that touchdown bearing control was effective when the phase shift lies
between -90o and 80o. Please see Appendix F1-F5 for the rotor radial
displacement behaviour during the contact release process when the phase
difference between active touchdown bearing demand and rotor orbit was -90o, -
60o, 0o, 40o, 60o and 80o. The orbits of rotor and touchdown transition behaviour
during the bearing contact release process were not affected significantly when
phase shifts between rotor and touchdown bearing control were introduced. The
effectiveness of the touchdown bearing control was not seriously affected when
the phase shift is within -90o and 80o. However, the touchdown bearing control
was not capable of bringing the rotor out of contact when the phase shift was out
of this region.
0 5 10 150
0.1
0.2
0.3
0.4
0.5
Time (s)
Rad
ial D
ispl
acem
ent (
mm
)
Figure 7.20 Rotor radial displacement at magnetic bearing A at rotational
speed of 447 rad/s. Touchdown bearing control was applied at 1.8 s to bring
the rotor out of contact
Clearance
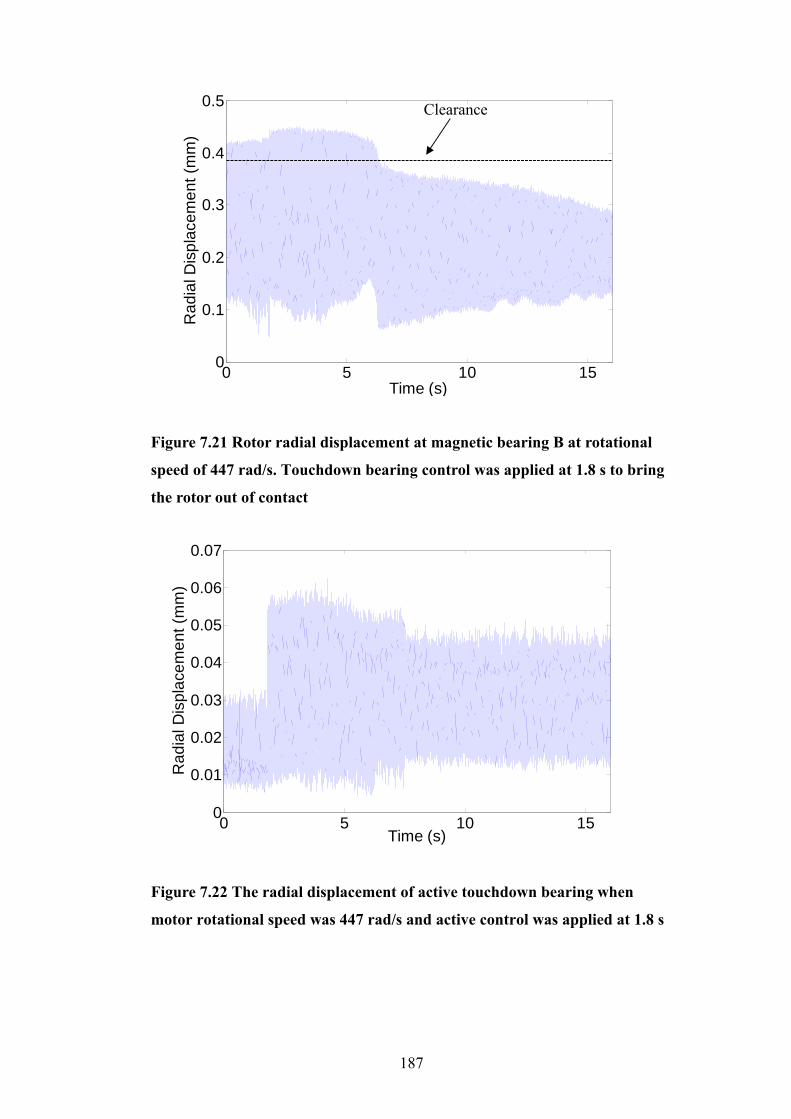
187
0 5 10 150
0.1
0.2
0.3
0.4
0.5
Time (s)
Rad
ial D
ispl
acem
ent (
mm
)
Figure 7.21 Rotor radial displacement at magnetic bearing B at rotational
speed of 447 rad/s. Touchdown bearing control was applied at 1.8 s to bring
the rotor out of contact
0 5 10 150
0.01
0.02
0.03
0.04
0.05
0.06
0.07
Time (s)
Rad
ial D
ispl
acem
ent (
mm
)
Figure 7.22 The radial displacement of active touchdown bearing when
motor rotational speed was 447 rad/s and active control was applied at 1.8 s
Clearance
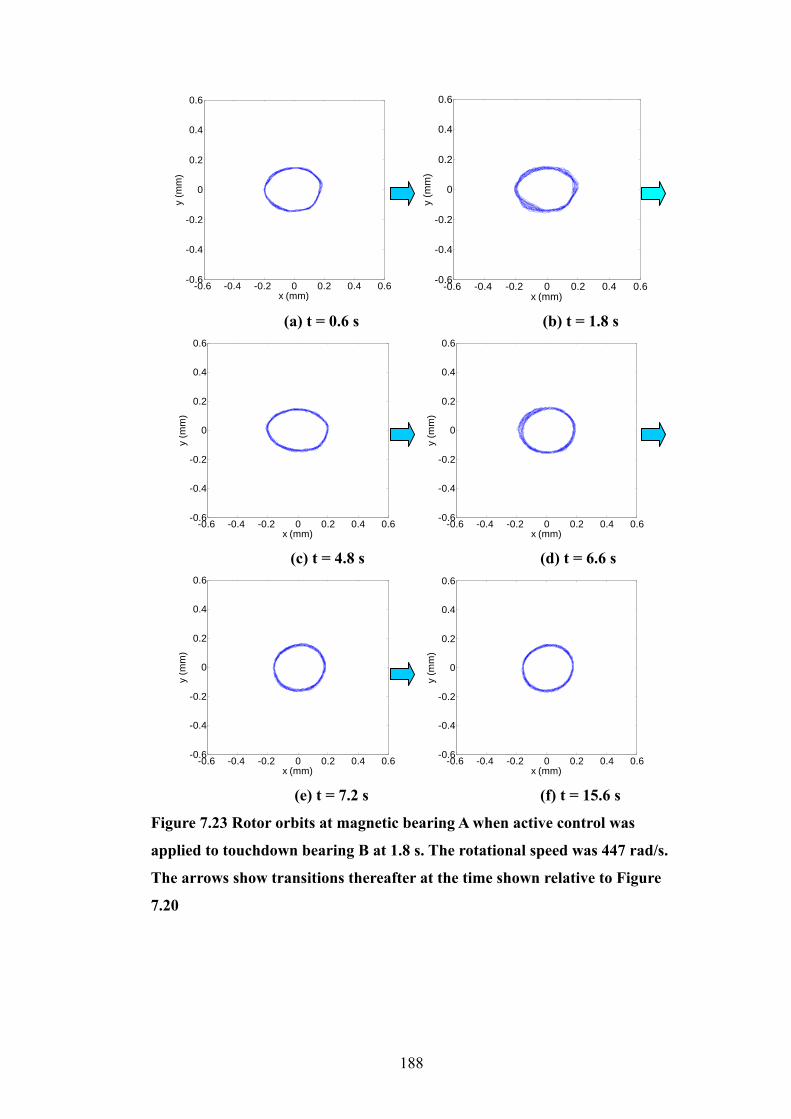
188
-0.6 -0.4 -0.2 0 0.2 0.4 0.6-0.6
-0.4
-0.2
0
0.2
0.4
0.6
x (mm)
y (m
m)
-0.6 -0.4 -0.2 0 0.2 0.4 0.6-0.6
-0.4
-0.2
0
0.2
0.4
0.6
x (mm)
y (m
m)
(a) t = 0.6 s (b) t = 1.8 s
-0.6 -0.4 -0.2 0 0.2 0.4 0.6-0.6
-0.4
-0.2
0
0.2
0.4
0.6
x (mm)
y (m
m)
-0.6 -0.4 -0.2 0 0.2 0.4 0.6-0.6
-0.4
-0.2
0
0.2
0.4
0.6
x (mm)
y (m
m)
(c) t = 4.8 s (d) t = 6.6 s
-0.6 -0.4 -0.2 0 0.2 0.4 0.6-0.6
-0.4
-0.2
0
0.2
0.4
0.6
x (mm)
y (m
m)
-0.6 -0.4 -0.2 0 0.2 0.4 0.6-0.6
-0.4
-0.2
0
0.2
0.4
0.6
x (mm)
y (m
m)
(e) t = 7.2 s (f) t = 15.6 s
Figure 7.23 Rotor orbits at magnetic bearing A when active control was
applied to touchdown bearing B at 1.8 s. The rotational speed was 447 rad/s.
The arrows show transitions thereafter at the time shown relative to Figure
7.20

189
-0.6 -0.4 -0.2 0 0.2 0.4 0.6-0.6
-0.4
-0.2
0
0.2
0.4
0.6
x (mm)
y (m
m)
-0.6 -0.4 -0.2 0 0.2 0.4 0.6-0.6
-0.4
-0.2
0
0.2
0.4
0.6
x (mm)
y (m
m)
(a) t = 0.6 s (b) t = 1.8 s
-0.6 -0.4 -0.2 0 0.2 0.4 0.6-0.6
-0.4
-0.2
0
0.2
0.4
0.6
x (mm)
y (m
m)
-0.6 -0.4 -0.2 0 0.2 0.4 0.6-0.6
-0.4
-0.2
0
0.2
0.4
0.6
x (mm)
y (m
m)
(c) t = 4.8 s (d) t = 6.6 s
-0.6 -0.4 -0.2 0 0.2 0.4 0.6-0.6
-0.4
-0.2
0
0.2
0.4
0.6
x (mm)
y (m
m)
-0.6 -0.4 -0.2 0 0.2 0.4 0.6-0.6
-0.4
-0.2
0
0.2
0.4
0.6
x (mm)
y (m
m)
(e) t = 7.2 s (f) t = 15.6 s
Figure 7.24 Rotor orbits at magnetic bearing B when active control was
applied to touchdown bearing B at 1.8 s. The rotational speed was 447 rad/s.
The arrows show transitions thereafter at the time shown relative to Figure
7.21
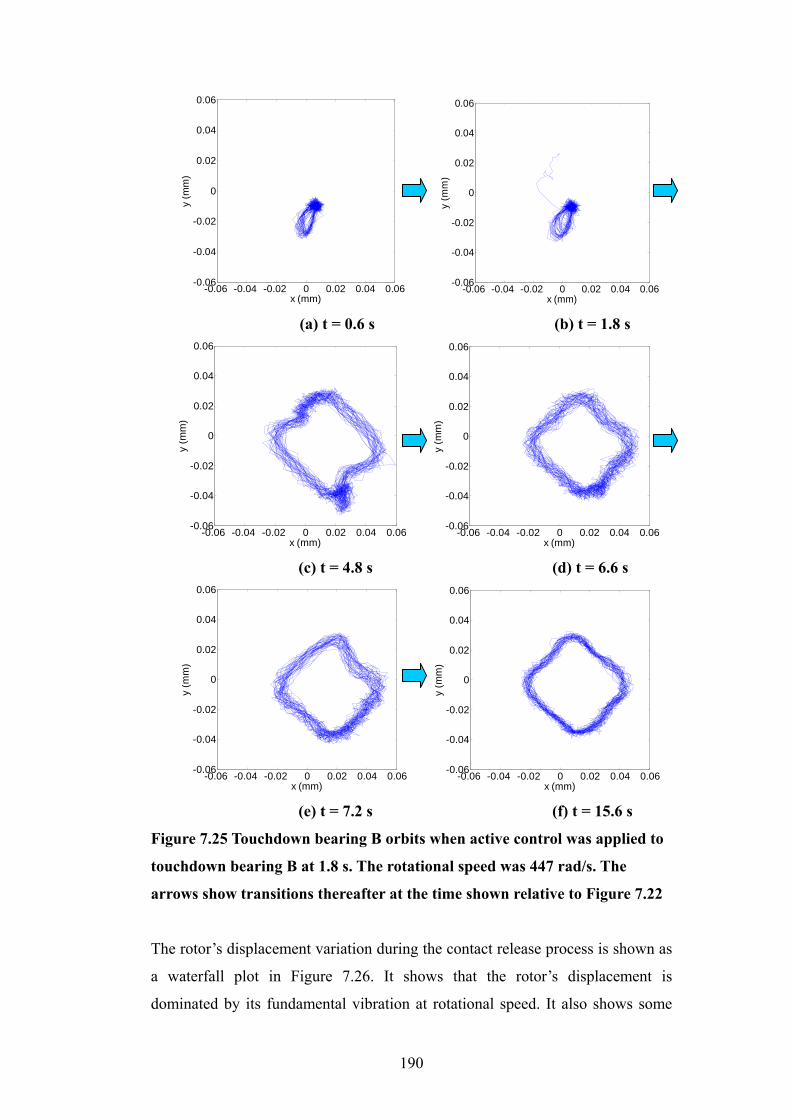
190
-0.06 -0.04 -0.02 0 0.02 0.04 0.06-0.06
-0.04
-0.02
0
0.02
0.04
0.06
x (mm)
y (m
m)
-0.06 -0.04 -0.02 0 0.02 0.04 0.06-0.06
-0.04
-0.02
0
0.02
0.04
0.06
x (mm)
y (m
m)
(a) t = 0.6 s (b) t = 1.8 s
-0.06 -0.04 -0.02 0 0.02 0.04 0.06-0.06
-0.04
-0.02
0
0.02
0.04
0.06
x (mm)
y (m
m)
-0.06 -0.04 -0.02 0 0.02 0.04 0.06-0.06
-0.04
-0.02
0
0.02
0.04
0.06
x (mm)
y (m
m)
(c) t = 4.8 s (d) t = 6.6 s
-0.06 -0.04 -0.02 0 0.02 0.04 0.06-0.06
-0.04
-0.02
0
0.02
0.04
0.06
x (mm)
y (m
m)
-0.06 -0.04 -0.02 0 0.02 0.04 0.06-0.06
-0.04
-0.02
0
0.02
0.04
0.06
x (mm)
y (m
m)
(e) t = 7.2 s (f) t = 15.6 s
Figure 7.25 Touchdown bearing B orbits when active control was applied to
touchdown bearing B at 1.8 s. The rotational speed was 447 rad/s. The
arrows show transitions thereafter at the time shown relative to Figure 7.22
The rotor’s displacement variation during the contact release process is shown as
a waterfall plot in Figure 7.26. It shows that the rotor’s displacement is
dominated by its fundamental vibration at rotational speed. It also shows some
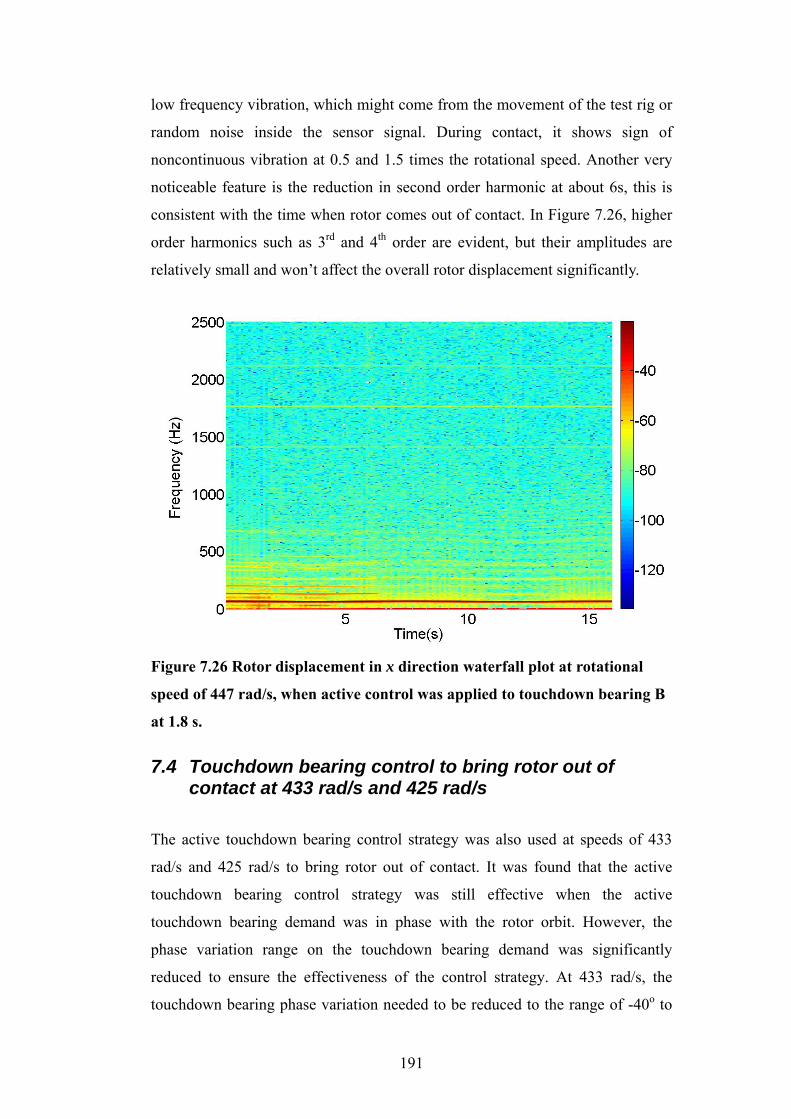
191
low frequency vibration, which might come from the movement of the test rig or
random noise inside the sensor signal. During contact, it shows sign of
noncontinuous vibration at 0.5 and 1.5 times the rotational speed. Another very
noticeable feature is the reduction in second order harmonic at about 6s, this is
consistent with the time when rotor comes out of contact. In Figure 7.26, higher
order harmonics such as 3rd and 4th order are evident, but their amplitudes are
relatively small and won’t affect the overall rotor displacement significantly.
Figure 7.26 Rotor displacement in x direction waterfall plot at rotational
speed of 447 rad/s, when active control was applied to touchdown bearing B
at 1.8 s.
7.4 Touchdown bearing control to bring rotor out of contact at 433 rad/s and 425 rad/s
The active touchdown bearing control strategy was also used at speeds of 433
rad/s and 425 rad/s to bring rotor out of contact. It was found that the active
touchdown bearing control strategy was still effective when the active
touchdown bearing demand was in phase with the rotor orbit. However, the
phase variation range on the touchdown bearing demand was significantly
reduced to ensure the effectiveness of the control strategy. At 433 rad/s, the
touchdown bearing phase variation needed to be reduced to the range of -40o to
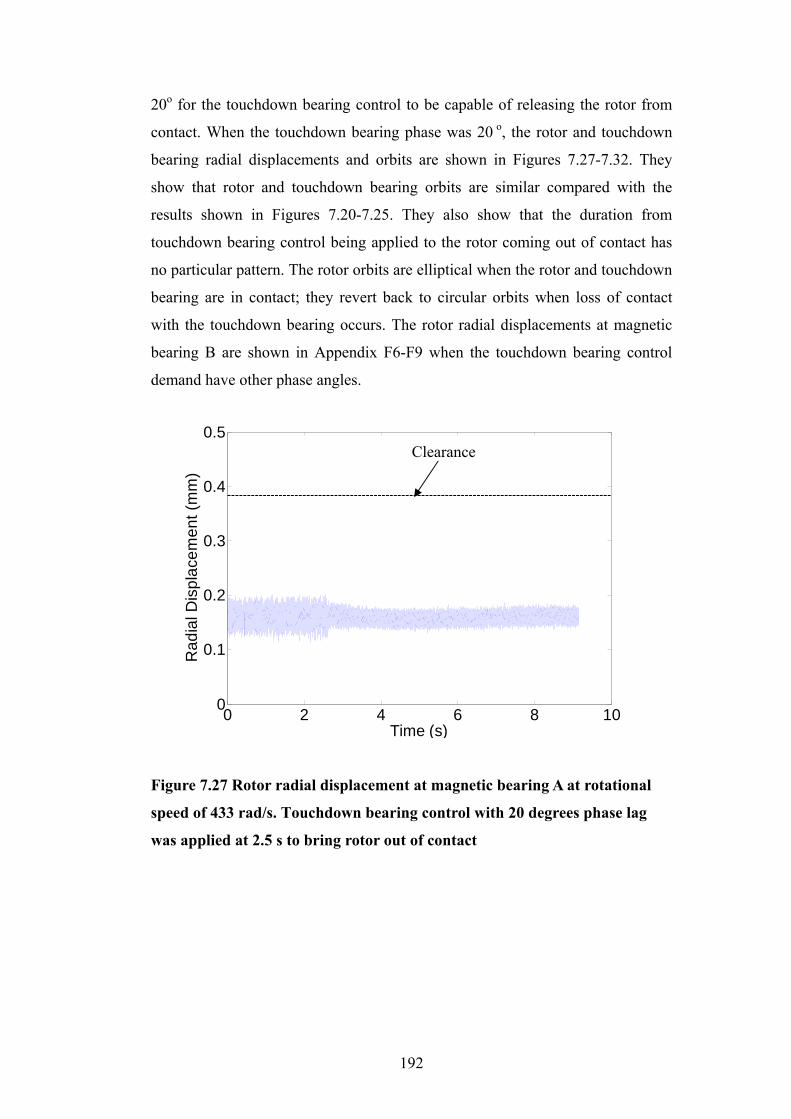
192
20o for the touchdown bearing control to be capable of releasing the rotor from
contact. When the touchdown bearing phase was 20 o, the rotor and touchdown
bearing radial displacements and orbits are shown in Figures 7.27-7.32. They
show that rotor and touchdown bearing orbits are similar compared with the
results shown in Figures 7.20-7.25. They also show that the duration from
touchdown bearing control being applied to the rotor coming out of contact has
no particular pattern. The rotor orbits are elliptical when the rotor and touchdown
bearing are in contact; they revert back to circular orbits when loss of contact
with the touchdown bearing occurs. The rotor radial displacements at magnetic
bearing B are shown in Appendix F6-F9 when the touchdown bearing control
demand have other phase angles.
0 2 4 6 8 100
0.1
0.2
0.3
0.4
0.5
Time (s)
Rad
ial D
ispl
acem
ent (
mm
)
Figure 7.27 Rotor radial displacement at magnetic bearing A at rotational
speed of 433 rad/s. Touchdown bearing control with 20 degrees phase lag
was applied at 2.5 s to bring rotor out of contact
Clearance

193
0 2 4 6 8 100
0.1
0.2
0.3
0.4
0.5
Time (s)
Rad
ial D
ispl
acem
ent (
mm
)
Figure 7.28 Rotor radial displacement at magnetic bearing B at rotational
speed of 433 rad/s. Touchdown bearing control with 20 degrees phase lag
was applied at 2.5 s to bring rotor out of contact
0 2 4 6 8 100
0.01
0.02
0.03
0.04
0.05
Time (s)
Rad
ial D
ispl
acem
ent (
mm
)
Figure 7.29 The radial displacement of active touchdown bearing when
rotational speed was 433 rad/s and active control with 20 degrees phase lag
was applied at 2.5 s
Clearance

194
-0.6 -0.4 -0.2 0 0.2 0.4 0.6-0.6
-0.4
-0.2
0
0.2
0.4
0.6
x (mm)
y (m
m)
-0.6 -0.4 -0.2 0 0.2 0.4 0.6-0.6
-0.4
-0.2
0
0.2
0.4
0.6
x (mm)
y (m
m)
(a) t = 2.4 s (b) t = 3 s
-0.6 -0.4 -0.2 0 0.2 0.4 0.6-0.6
-0.4
-0.2
0
0.2
0.4
0.6
x (mm)
y (m
m)
-0.6 -0.4 -0.2 0 0.2 0.4 0.6-0.6
-0.4
-0.2
0
0.2
0.4
0.6
x (mm)
y (m
m)
(c) t = 3.6 s (d) t = 9 s
Figure 7.30 Rotor orbits at magnetic bearing A when active control with 20
degrees phase lag was applied to touchdown bearing A at 2.5 s. The
rotational speed was 433 rad/s. The arrows show transitions thereafter at the
time shown relative to Figure 7.27
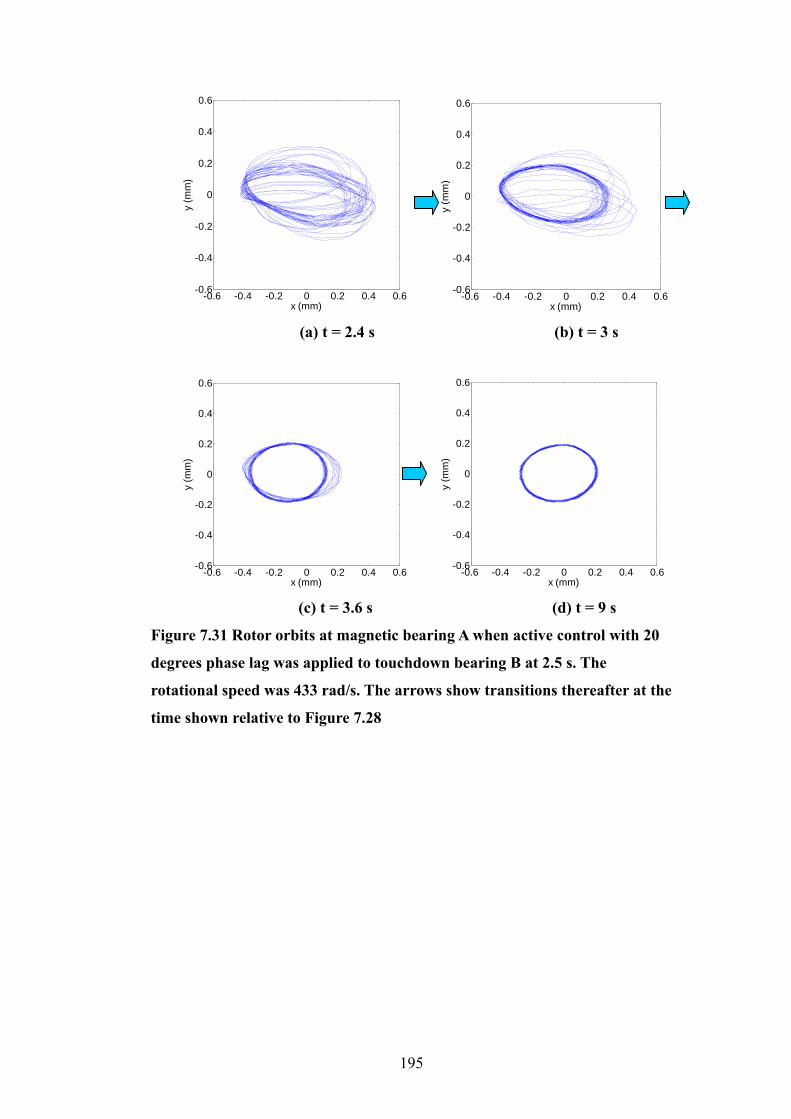
195
-0.6 -0.4 -0.2 0 0.2 0.4 0.6-0.6
-0.4
-0.2
0
0.2
0.4
0.6
x (mm)
y (m
m)
-0.6 -0.4 -0.2 0 0.2 0.4 0.6-0.6
-0.4
-0.2
0
0.2
0.4
0.6
x (mm)
y (m
m)
(a) t = 2.4 s (b) t = 3 s
-0.6 -0.4 -0.2 0 0.2 0.4 0.6-0.6
-0.4
-0.2
0
0.2
0.4
0.6
x (mm)
y (m
m)
-0.6 -0.4 -0.2 0 0.2 0.4 0.6-0.6
-0.4
-0.2
0
0.2
0.4
0.6
x (mm)
y (m
m)
(c) t = 3.6 s (d) t = 9 s
Figure 7.31 Rotor orbits at magnetic bearing A when active control with 20
degrees phase lag was applied to touchdown bearing B at 2.5 s. The
rotational speed was 433 rad/s. The arrows show transitions thereafter at the
time shown relative to Figure 7.28

196
-0.06 -0.04 -0.02 0 0.02 0.04 0.06-0.06
-0.04
-0.02
0
0.02
0.04
0.06
x (mm)
y (m
m)
-0.06 -0.04 -0.02 0 0.02 0.04 0.06-0.06
-0.04
-0.02
0
0.02
0.04
0.06
x (mm)
y (m
m)
(a) t = 2.4 s (b) t = 3 s
-0.06 -0.04 -0.02 0 0.02 0.04 0.06-0.06
-0.04
-0.02
0
0.02
0.04
0.06
x (mm)
y (m
m)
-0.06 -0.04 -0.02 0 0.02 0.04 0.06-0.06
-0.04
-0.02
0
0.02
0.04
0.06
x (mm)
y (m
m)
(c) t = 3.6 s (d) t = 9 s
Figure 7.32 Touchdown bearing B orbits when active control with 20 degrees
phase lag was applied to touchdown bearing B at 2.5 s. The rotational speed
was 433 rad/s. The arrows show transitions thereafter at the time shown
relative to Figure 7.29
At 425 rad/s, the phase range that touchdown bearing control was capable of
bringing the rotor out of contact was reduced further to the range -20o to 0o. The
rotor radial displacements variation during the contact release process are shown
in Appendix F10-F12. At 447, 433 and 425 rad/s, the phase lag of touchdown
bearing control demand that touchdown bearing control could release rotor back
to contact free orbit is illustrated in Figure 7.33. It shows that a small reduction
in rotational speed could seriously affect the touchdown bearing control
capability, hence speed is an important factor to be considered when designing a
touchdown bearing control strategy. It is also noted that the negative phase angle
hence lead is more effective in bringing the rotor out of contact. This implies that
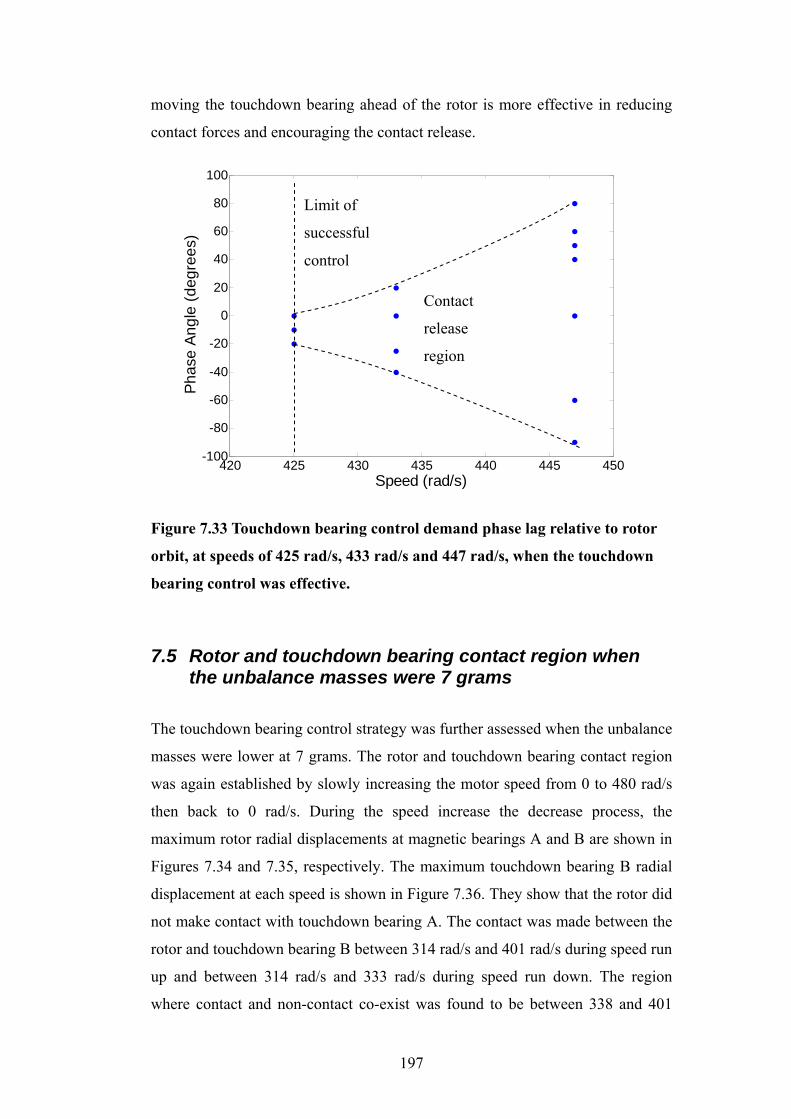
197
moving the touchdown bearing ahead of the rotor is more effective in reducing
contact forces and encouraging the contact release.
420 425 430 435 440 445 450-100
-80
-60
-40
-20
0
20
40
60
80
100
Speed (rad/s)
Phas
e An
gle
(deg
rees
)
Figure 7.33 Touchdown bearing control demand phase lag relative to rotor
orbit, at speeds of 425 rad/s, 433 rad/s and 447 rad/s, when the touchdown
bearing control was effective.
7.5 Rotor and touchdown bearing contact region when the unbalance masses were 7 grams
The touchdown bearing control strategy was further assessed when the unbalance
masses were lower at 7 grams. The rotor and touchdown bearing contact region
was again established by slowly increasing the motor speed from 0 to 480 rad/s
then back to 0 rad/s. During the speed increase the decrease process, the
maximum rotor radial displacements at magnetic bearings A and B are shown in
Figures 7.34 and 7.35, respectively. The maximum touchdown bearing B radial
displacement at each speed is shown in Figure 7.36. They show that the rotor did
not make contact with touchdown bearing A. The contact was made between the
rotor and touchdown bearing B between 314 rad/s and 401 rad/s during speed run
up and between 314 rad/s and 333 rad/s during speed run down. The region
where contact and non-contact co-exist was found to be between 338 and 401
Limit of
successful
control
Contact
release
region

198
rad/s. Figure 7.36 shows that the touchdown bearing orbit increased significantly
when the rotor makes contacts with it.
The rotor and active touchdown bearing orbits before the rotor makes contact
with touchdown bearing B are shown in Figures 7.37 and 7.38, respectively.
Rotor and touchdown bearing contact was made when the speed was increased
from 303 rad/s to 314 rad/s. The rotor contact orbit was elliptical as shown in
Figure 7.39, it is very similar to the rotor orbit when the unbalance masses were
9 grams. Rotor and touchdown bearing came out of contact at about 408 rad/s.
The rotor radial displacement at magnetic bearing B reduced significantly after
the rotor came out of contact, while the effect on rotor orbit at magnetic bearing
A was not seriously affected.
0 100 200 300 400 5000
0.2
0.4
0.6
Speed (rad/s)
Rad
ial D
ispl
acem
ent (
mm
)
Increase in speedDecrease in speed
Figure 7.34 Rotor maximum radial displacement at magnetic bearing A
with a gradual change of rotational speed. The unbalance masses of 7 grams
were attached to balancing disks 1 and 3
Clearance
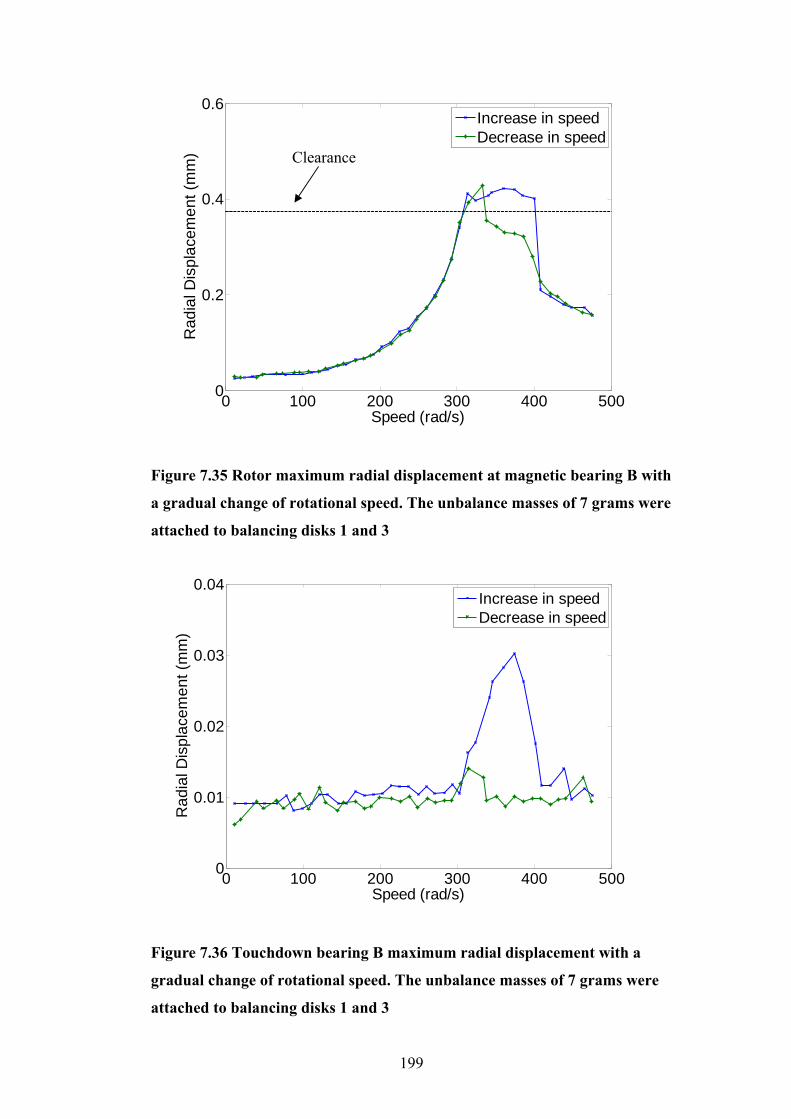
199
0 100 200 300 400 5000
0.2
0.4
0.6
Speed (rad/s)
Rad
ial D
ispl
acem
ent (
mm
)
Increase in speedDecrease in speed
Figure 7.35 Rotor maximum radial displacement at magnetic bearing B with
a gradual change of rotational speed. The unbalance masses of 7 grams were
attached to balancing disks 1 and 3
0 100 200 300 400 5000
0.01
0.02
0.03
0.04
Speed (rad/s)
Rad
ial D
ispl
acem
ent (
mm
)
Increase in speedDecrease in speed
Figure 7.36 Touchdown bearing B maximum radial displacement with a
gradual change of rotational speed. The unbalance masses of 7 grams were
attached to balancing disks 1 and 3
Clearance

200
-0.4 -0.2 0 0.2 0.4-0.4
-0.2
0
0.2
0.4
x (mm)
y (m
m)
-0.4 -0.2 0 0.2 0.4-0.4
-0.2
0
0.2
0.4
x (mm)
y (m
m)
(a) (b)
Figure 7.37 Rotor orbits at magnetic bearing A (left) and B (right) before the
rotor makes contact with touchdown bearing B, when the unbalance masses
were 7 grams and the speed was 303 rad/s.
-0.04 -0.02 0 0.02 0.04-0.04
-0.02
0
0.02
0.04
x (mm)
y (m
m)
Figure 7.38 Touchdown bearing B orbits before the rotor makes contact with
touchdown bearing B. The unbalance masses were 7 grams and the speed
was 303 rad/s
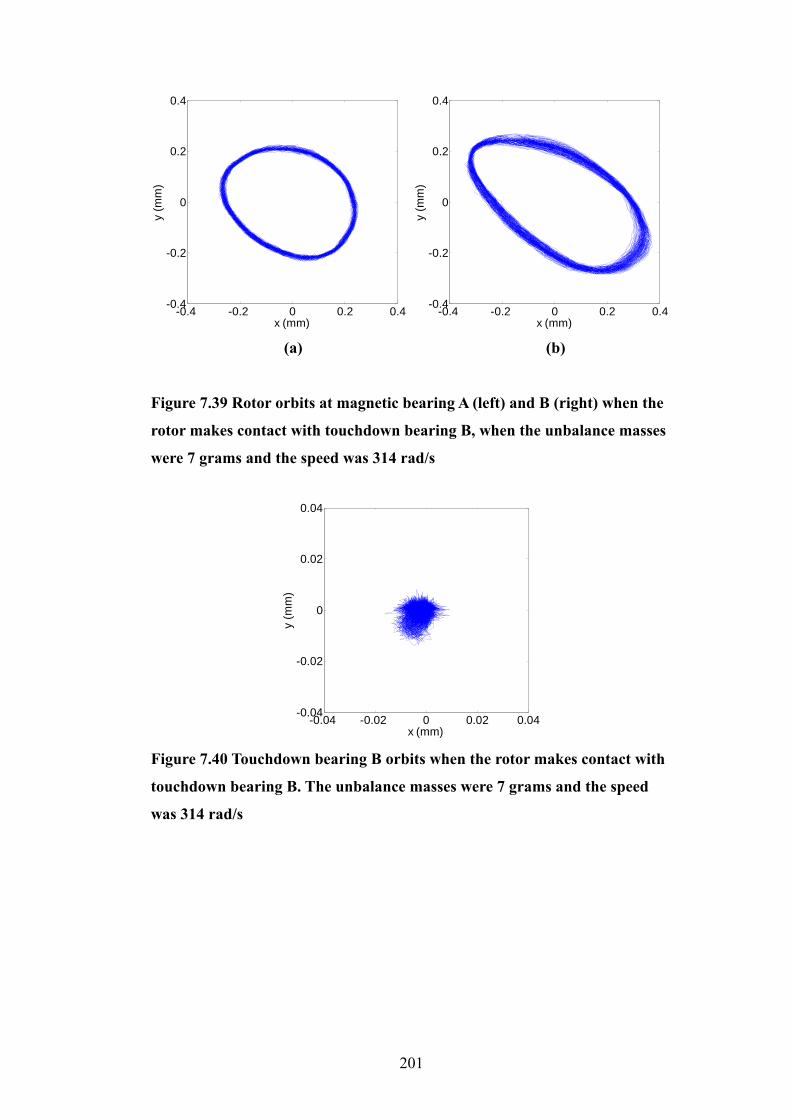
201
-0.4 -0.2 0 0.2 0.4-0.4
-0.2
0
0.2
0.4
x (mm)
y (m
m)
-0.4 -0.2 0 0.2 0.4-0.4
-0.2
0
0.2
0.4
x (mm)
y (m
m)
(a) (b)
Figure 7.39 Rotor orbits at magnetic bearing A (left) and B (right) when the
rotor makes contact with touchdown bearing B, when the unbalance masses
were 7 grams and the speed was 314 rad/s
-0.04 -0.02 0 0.02 0.04-0.04
-0.02
0
0.02
0.04
x (mm)
y (m
m)
Figure 7.40 Touchdown bearing B orbits when the rotor makes contact with
touchdown bearing B. The unbalance masses were 7 grams and the speed
was 314 rad/s
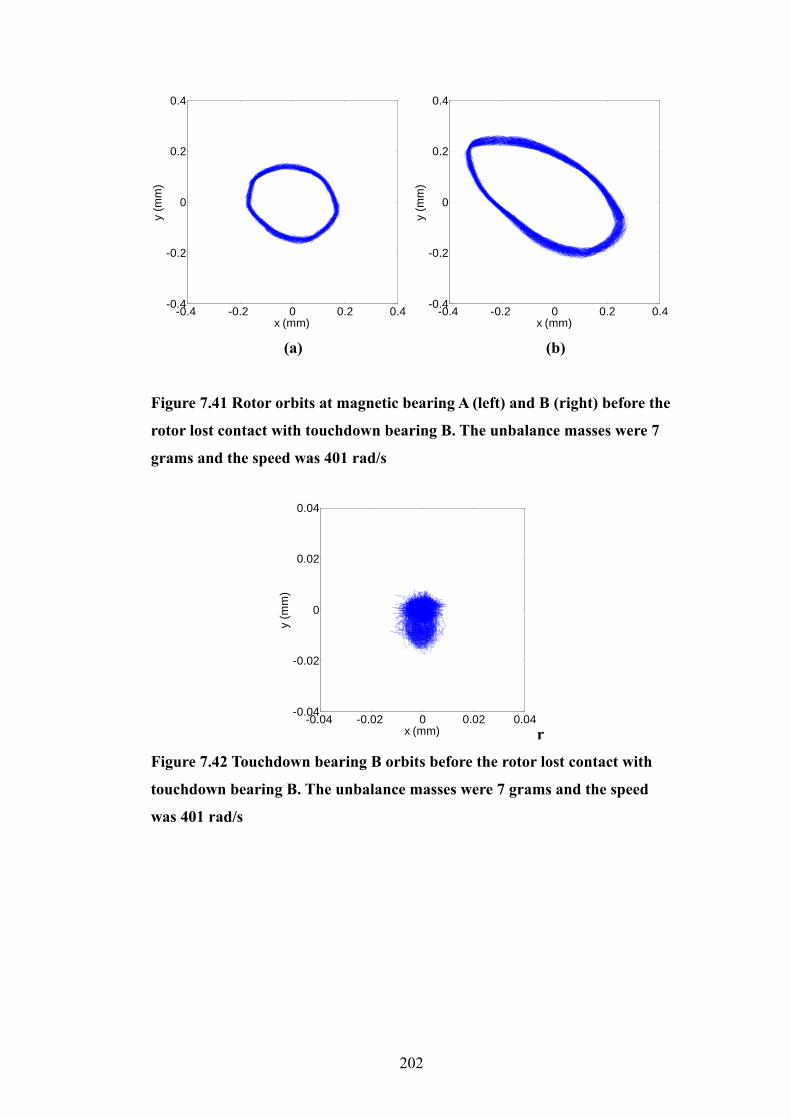
202
-0.4 -0.2 0 0.2 0.4-0.4
-0.2
0
0.2
0.4
x (mm)
y (m
m)
-0.4 -0.2 0 0.2 0.4-0.4
-0.2
0
0.2
0.4
x (mm)
y (m
m)
(a) (b)
Figure 7.41 Rotor orbits at magnetic bearing A (left) and B (right) before the
rotor lost contact with touchdown bearing B. The unbalance masses were 7
grams and the speed was 401 rad/s
-0.04 -0.02 0 0.02 0.04-0.04
-0.02
0
0.02
0.04
x (mm)
y (m
m)
r
Figure 7.42 Touchdown bearing B orbits before the rotor lost contact with
touchdown bearing B. The unbalance masses were 7 grams and the speed
was 401 rad/s

203
-0.4 -0.2 0 0.2 0.4-0.4
-0.2
0
0.2
0.4
x (mm)
y (m
m)
-0.4 -0.2 0 0.2 0.4-0.4
-0.2
0
0.2
0.4
x (mm)
y (m
m)
Figure 7.43 Rotor orbits at magnetic bearing A (left) and B (right) after the
rotor lost contact with touchdown bearing B. The unbalance masses were 7
grams and the speed was 408 rad/s
-0.04 -0.02 0 0.02 0.04-0.04
-0.02
0
0.02
0.04
x (mm)
y (m
m)
Figure 7.44 Touchdown bearing B orbit after the rotor lost contact with
touchdown bearing B. The unbalance masses were 7 grams and the speed
was 408 rad/s
When the speed was gradually decreased from 480 to 0 rad/s, the rotor started to
make contact with touchdown bearing B at about 333 rad/s. The rotor and
touchdown bearing orbits are shown in Figures 7.47 and 7.48, respectively.
Again, it shows that the rotor’s contact orbit is elliptical and it has similar
orientation compared with its contact orbit at other speeds. The rotor came out of
contact at about 304 rad/s, the rotor and touchdown bearing orbits are shown in
Figures 7.51 and 7.52, respectively.
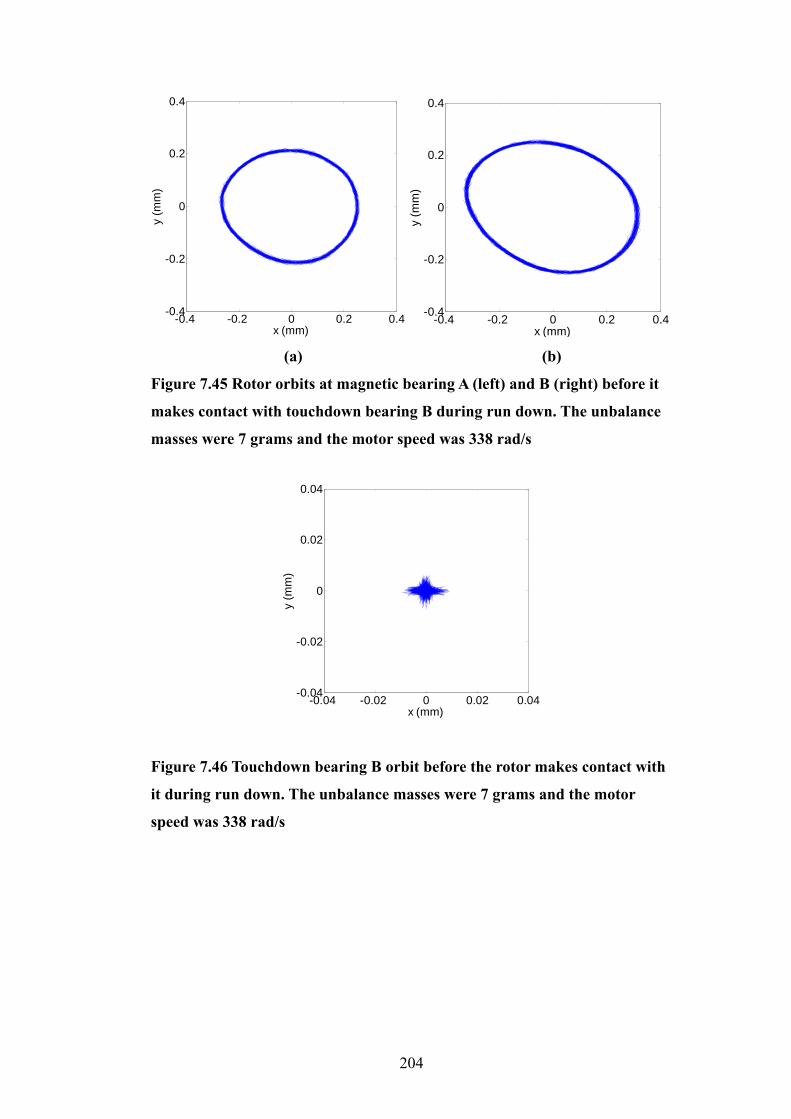
204
-0.4 -0.2 0 0.2 0.4-0.4
-0.2
0
0.2
0.4
x (mm)
y (m
m)
-0.4 -0.2 0 0.2 0.4-0.4
-0.2
0
0.2
0.4
x (mm)
y (m
m)
(a) (b)
Figure 7.45 Rotor orbits at magnetic bearing A (left) and B (right) before it
makes contact with touchdown bearing B during run down. The unbalance
masses were 7 grams and the motor speed was 338 rad/s
-0.04 -0.02 0 0.02 0.04-0.04
-0.02
0
0.02
0.04
x (mm)
y (m
m)
Figure 7.46 Touchdown bearing B orbit before the rotor makes contact with
it during run down. The unbalance masses were 7 grams and the motor
speed was 338 rad/s
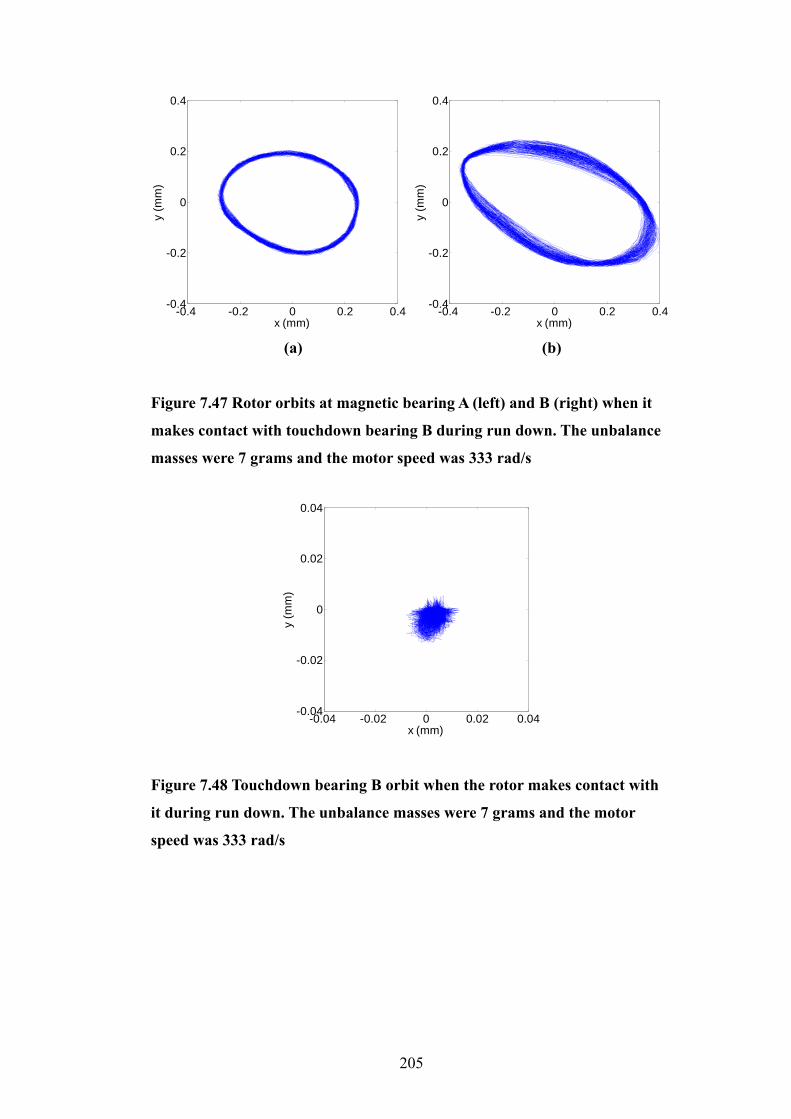
205
-0.4 -0.2 0 0.2 0.4-0.4
-0.2
0
0.2
0.4
x (mm)
y (m
m)
-0.4 -0.2 0 0.2 0.4-0.4
-0.2
0
0.2
0.4
x (mm)
y (m
m)
(a) (b)
Figure 7.47 Rotor orbits at magnetic bearing A (left) and B (right) when it
makes contact with touchdown bearing B during run down. The unbalance
masses were 7 grams and the motor speed was 333 rad/s
-0.04 -0.02 0 0.02 0.04-0.04
-0.02
0
0.02
0.04
x (mm)
y (m
m)
Figure 7.48 Touchdown bearing B orbit when the rotor makes contact with
it during run down. The unbalance masses were 7 grams and the motor
speed was 333 rad/s

206
-0.4 -0.2 0 0.2 0.4-0.4
-0.2
0
0.2
0.4
x (mm)
y (m
m)
-0.4 -0.2 0 0.2 0.4-0.4
-0.2
0
0.2
0.4
x (mm)
y (m
m)
(a) (b)
Figure 7.49 Rotor orbits at magnetic bearing A (left) and B (right) before the
rotor lost contact with touchdown bearing B during run down. The
unbalance masses were 7 grams and the motor speed was 314.5 rad/s
-0.04 -0.02 0 0.02 0.04-0.04
-0.02
0
0.02
0.04
x (mm)
y (m
m)
Figure 7.50 Touchdown bearing B orbit before the rotor lost contact with
touchdown bearing B during run down. The unbalance masses were 7 grams
and the motor speed was 314.5 rad/s
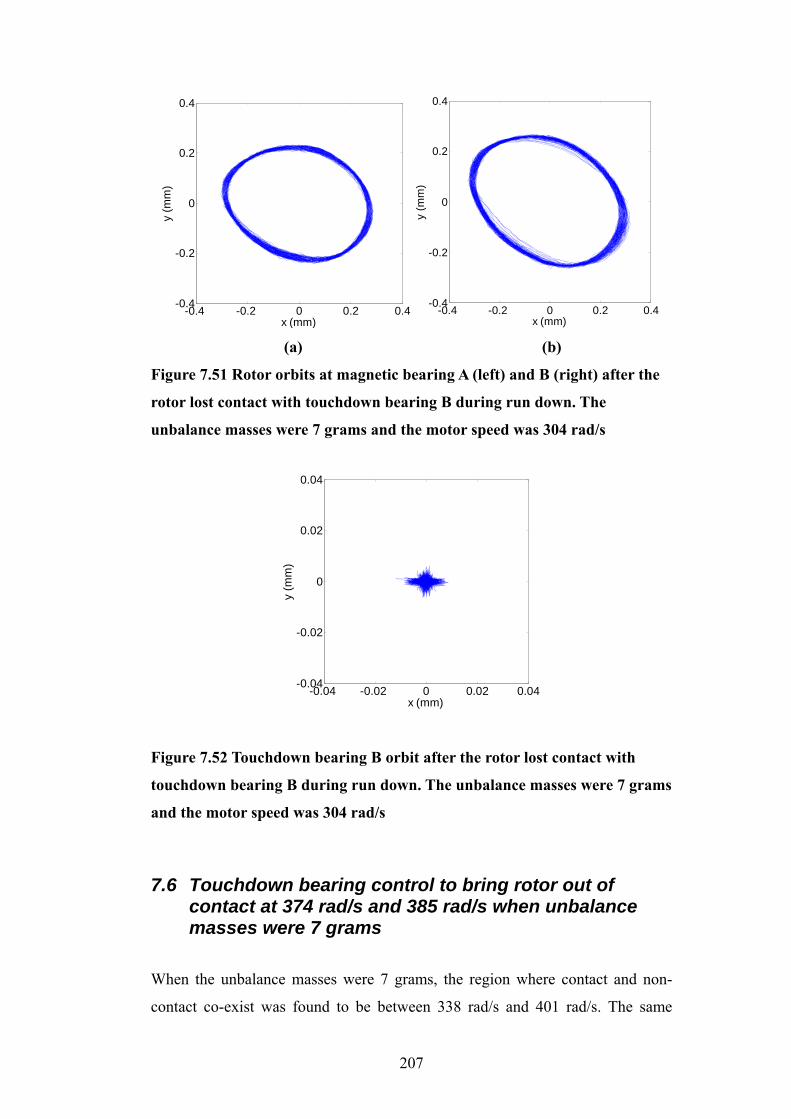
207
-0.4 -0.2 0 0.2 0.4-0.4
-0.2
0
0.2
0.4
x (mm)
y (m
m)
-0.4 -0.2 0 0.2 0.4-0.4
-0.2
0
0.2
0.4
x (mm)
y (m
m)
(a) (b)
Figure 7.51 Rotor orbits at magnetic bearing A (left) and B (right) after the
rotor lost contact with touchdown bearing B during run down. The
unbalance masses were 7 grams and the motor speed was 304 rad/s
-0.04 -0.02 0 0.02 0.04-0.04
-0.02
0
0.02
0.04
x (mm)
y (m
m)
Figure 7.52 Touchdown bearing B orbit after the rotor lost contact with
touchdown bearing B during run down. The unbalance masses were 7 grams
and the motor speed was 304 rad/s
7.6 Touchdown bearing control to bring rotor out of contact at 374 rad/s and 385 rad/s when unbalance masses were 7 grams
When the unbalance masses were 7 grams, the region where contact and non-
contact co-exist was found to be between 338 rad/s and 401 rad/s. The same
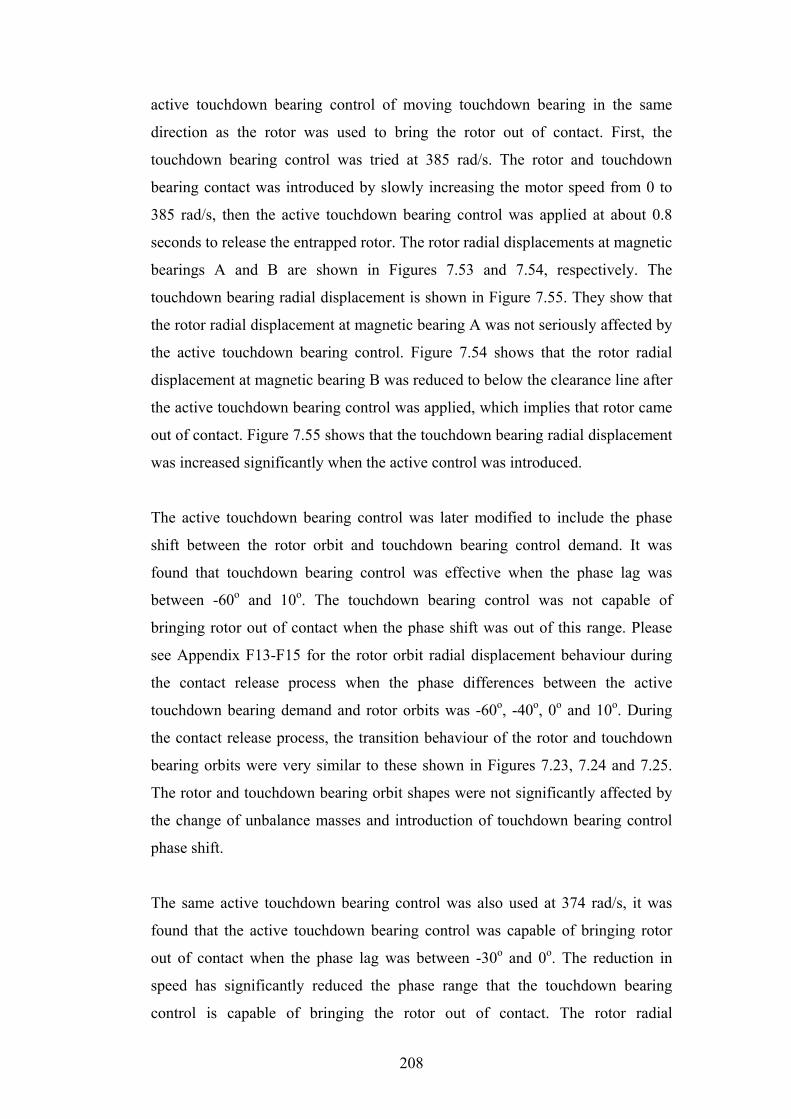
208
active touchdown bearing control of moving touchdown bearing in the same
direction as the rotor was used to bring the rotor out of contact. First, the
touchdown bearing control was tried at 385 rad/s. The rotor and touchdown
bearing contact was introduced by slowly increasing the motor speed from 0 to
385 rad/s, then the active touchdown bearing control was applied at about 0.8
seconds to release the entrapped rotor. The rotor radial displacements at magnetic
bearings A and B are shown in Figures 7.53 and 7.54, respectively. The
touchdown bearing radial displacement is shown in Figure 7.55. They show that
the rotor radial displacement at magnetic bearing A was not seriously affected by
the active touchdown bearing control. Figure 7.54 shows that the rotor radial
displacement at magnetic bearing B was reduced to below the clearance line after
the active touchdown bearing control was applied, which implies that rotor came
out of contact. Figure 7.55 shows that the touchdown bearing radial displacement
was increased significantly when the active control was introduced.
The active touchdown bearing control was later modified to include the phase
shift between the rotor orbit and touchdown bearing control demand. It was
found that touchdown bearing control was effective when the phase lag was
between -60o and 10o. The touchdown bearing control was not capable of
bringing rotor out of contact when the phase shift was out of this range. Please
see Appendix F13-F15 for the rotor orbit radial displacement behaviour during
the contact release process when the phase differences between the active
touchdown bearing demand and rotor orbits was -60o, -40o, 0o and 10o. During
the contact release process, the transition behaviour of the rotor and touchdown
bearing orbits were very similar to these shown in Figures 7.23, 7.24 and 7.25.
The rotor and touchdown bearing orbit shapes were not significantly affected by
the change of unbalance masses and introduction of touchdown bearing control
phase shift.
The same active touchdown bearing control was also used at 374 rad/s, it was
found that the active touchdown bearing control was capable of bringing rotor
out of contact when the phase lag was between -30o and 0o. The reduction in
speed has significantly reduced the phase range that the touchdown bearing
control is capable of bringing the rotor out of contact. The rotor radial
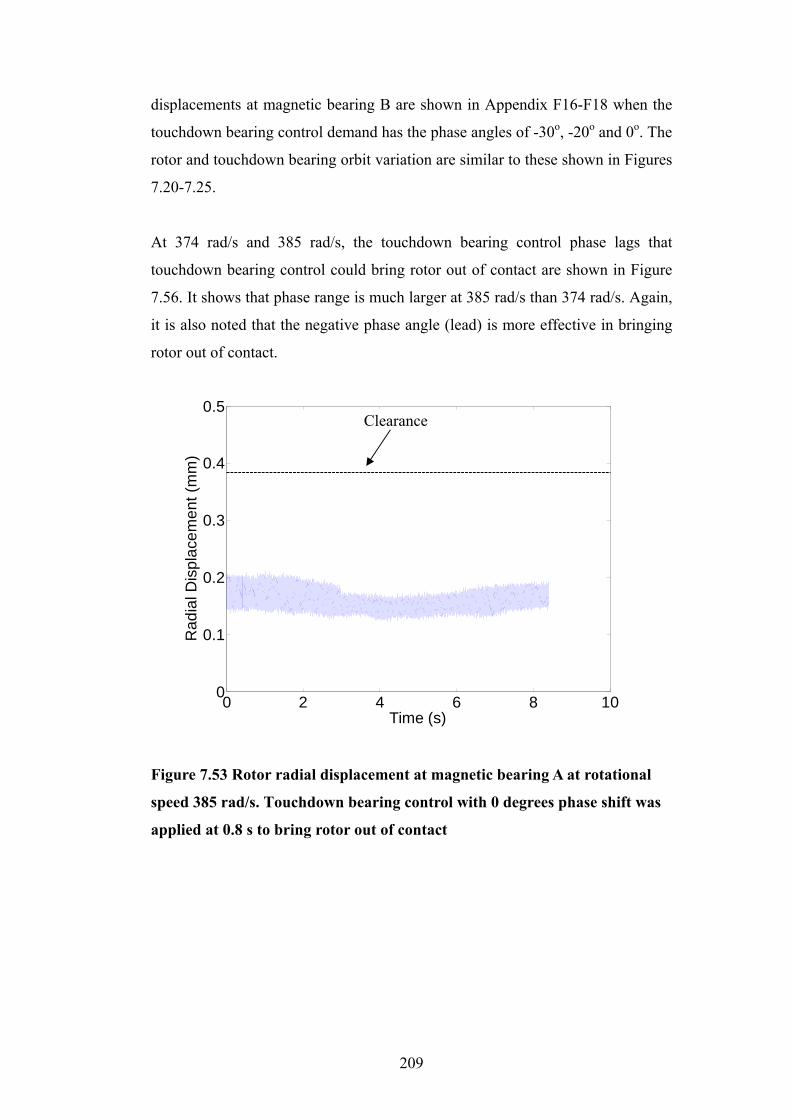
209
displacements at magnetic bearing B are shown in Appendix F16-F18 when the
touchdown bearing control demand has the phase angles of -30o, -20o and 0o. The
rotor and touchdown bearing orbit variation are similar to these shown in Figures
7.20-7.25.
At 374 rad/s and 385 rad/s, the touchdown bearing control phase lags that
touchdown bearing control could bring rotor out of contact are shown in Figure
7.56. It shows that phase range is much larger at 385 rad/s than 374 rad/s. Again,
it is also noted that the negative phase angle (lead) is more effective in bringing
rotor out of contact.
0 2 4 6 8 100
0.1
0.2
0.3
0.4
0.5
Time (s)
Rad
ial D
ispl
acem
ent (
mm
)
Figure 7.53 Rotor radial displacement at magnetic bearing A at rotational
speed 385 rad/s. Touchdown bearing control with 0 degrees phase shift was
applied at 0.8 s to bring rotor out of contact
Clearance
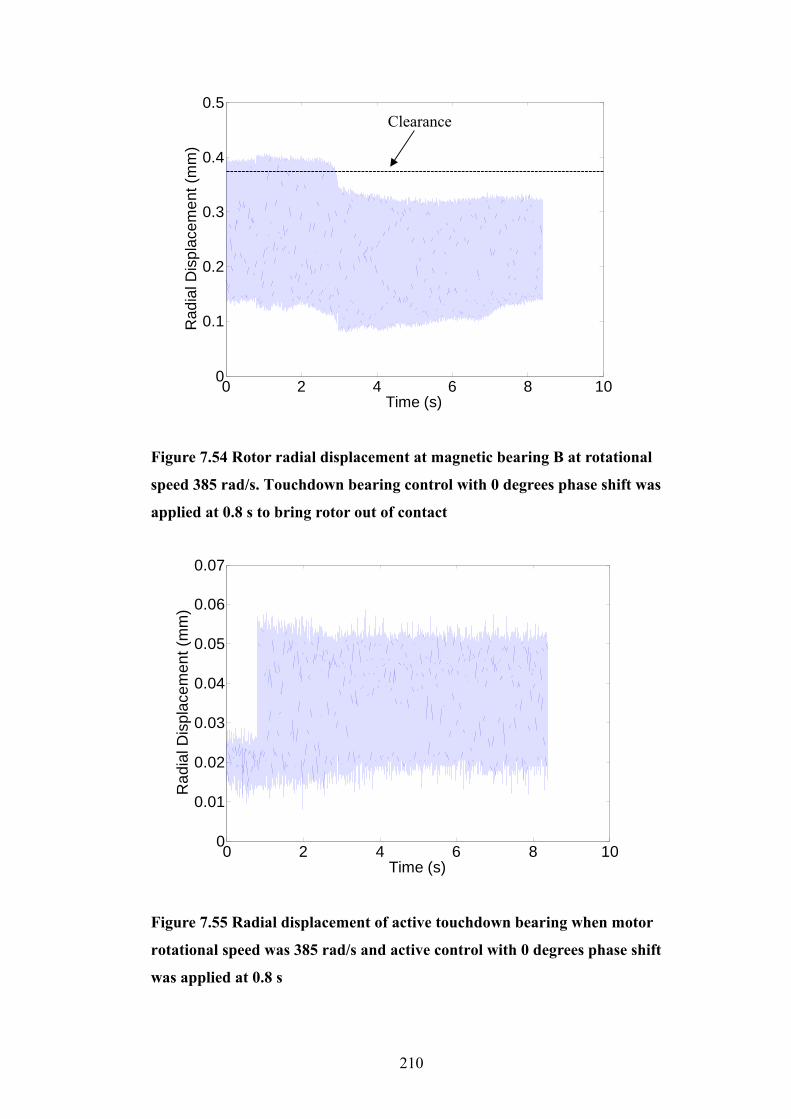
210
0 2 4 6 8 100
0.1
0.2
0.3
0.4
0.5
Time (s)
Rad
ial D
ispl
acem
ent (
mm
)
Figure 7.54 Rotor radial displacement at magnetic bearing B at rotational
speed 385 rad/s. Touchdown bearing control with 0 degrees phase shift was
applied at 0.8 s to bring rotor out of contact
0 2 4 6 8 100
0.01
0.02
0.03
0.04
0.05
0.06
0.07
Time (s)
Rad
ial D
ispl
acem
ent (
mm
)
Figure 7.55 Radial displacement of active touchdown bearing when motor
rotational speed was 385 rad/s and active control with 0 degrees phase shift
was applied at 0.8 s
Clearance
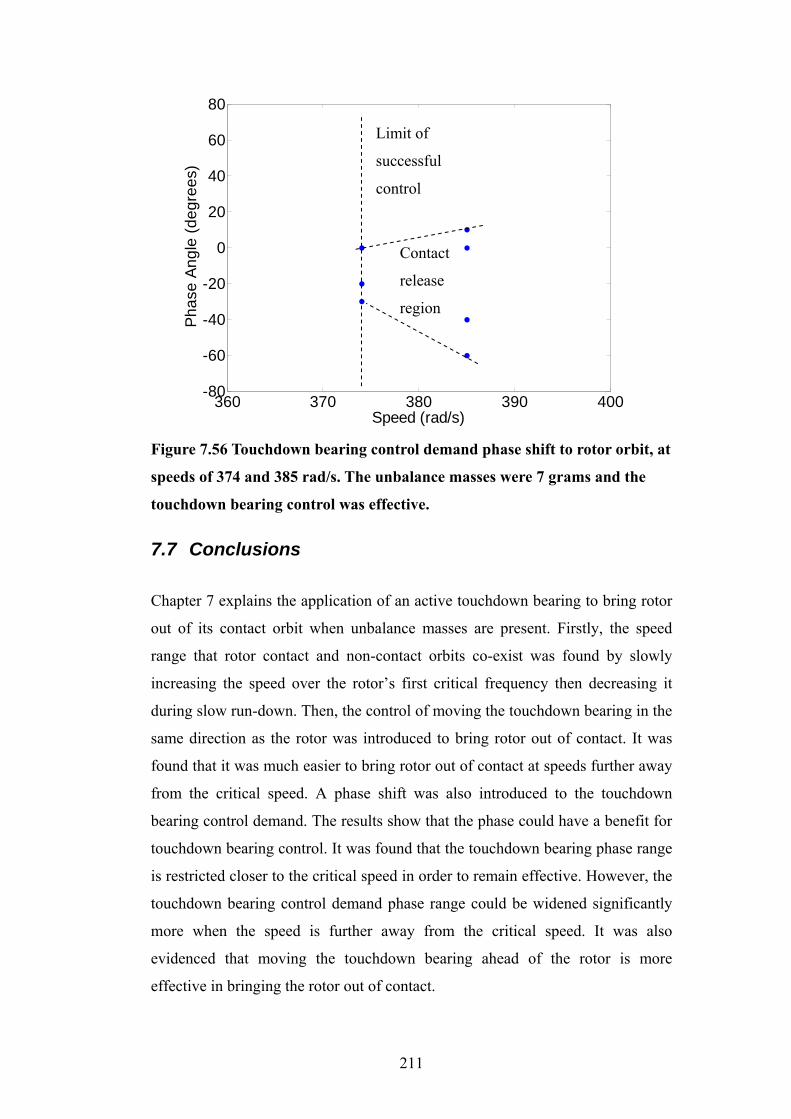
211
360 370 380 390 400-80
-60
-40
-20
0
20
40
60
80
Speed (rad/s)
Phas
e An
gle
(deg
rees
)
Figure 7.56 Touchdown bearing control demand phase shift to rotor orbit, at
speeds of 374 and 385 rad/s. The unbalance masses were 7 grams and the
touchdown bearing control was effective.
7.7 Conclusions
Chapter 7 explains the application of an active touchdown bearing to bring rotor
out of its contact orbit when unbalance masses are present. Firstly, the speed
range that rotor contact and non-contact orbits co-exist was found by slowly
increasing the speed over the rotor’s first critical frequency then decreasing it
during slow run-down. Then, the control of moving the touchdown bearing in the
same direction as the rotor was introduced to bring rotor out of contact. It was
found that it was much easier to bring rotor out of contact at speeds further away
from the critical speed. A phase shift was also introduced to the touchdown
bearing control demand. The results show that the phase could have a benefit for
touchdown bearing control. It was found that the touchdown bearing phase range
is restricted closer to the critical speed in order to remain effective. However, the
touchdown bearing control demand phase range could be widened significantly
more when the speed is further away from the critical speed. It was also
evidenced that moving the touchdown bearing ahead of the rotor is more
effective in bringing the rotor out of contact.
Limit of
successful
control
Contact
release
region
212
CHAPTER 8 Conclusions and Further Work
It has been identified that the problem of dynamic contact may occur in a fully
functional rotor/magnetic bearing system having conventional touchdown
bearings. An external disturbance to such a system may lead to persistent contact
between the rotor and the touchdown bearing involving high contact forces,
potentially resulting in premature touchdown bearing failures. An active
touchdown bearing system has been developed to alleviate this problem by
returning the rotor back to its contact-free orbit using appropriate control. This
Chapter summarise the work that has been carried out and explains the work that
is required in the future.
Test rig modifications
1. The original 600 mm long rotor shaft was replaced by an 800 mm long
shaft with three disks attached. The rotor’s natural frequencies were
significantly reduced. For example, its first flexural critical speed was
reduced from 18,000 rpm to 7,800 rpm.
2. A touchdown bearing tool was designed and manufactured to improve
the alignment between the magnetic bearing and the touchdown bearing.
3. A hydraulic system was used to control the movement of the touchdown
bearing. It was not possible to release all the entrapped air in the
hydraulic line, which could seriously affect the touchdown bearing
performance. One air bleeding device was added to the hydraulic valve
to ensure that no air was left in each hydraulic line.
4. Initially, the position of the touchdown bearing was fixed once the
hydraulic pistons chambers were filled, since it could seriously
compromise the touchdown bearing performance if it is out of position.
A piston positioning device was developed to make it possible to control
the position of the bearing position and to apply bearing radial pre-load.
213
Modelling and simulation
Simulation was carried out to predict rotor and touchdown bearing contact
dynamics, and to use active magnetic bearing and active touchdown bearing
control to bring the rotor out of contact. The rotor model was built using the
finite element method. Model reduction was performed to improve the
model efficiency. Rotor model stability was also analysed by evaluating the
rotor and bearing system eigenvalues for two arrangements:
1. Displacement sensors inboard of the magnetic bearings.
2. Displacement sensors outboard of the magnetic bearings.
The touchdown bearing was modelled by including stiffness and damping
parameters in the x and y directions. Using this model, the following factors
that could influence rotor and touchdown bearing contact were analysed:
1. Touchdown bearing clearance.
2. Touchdown bearing contact surface friction coefficient.
3. Touchdown bearing stiffness.
Main findings:
1. For the specific test rig, the outboard arrangement of the touchdown
bearings was more stable than the inboard arrangement.
2. There is a speed range where a rotor may co-exist in contact-free and
persistent contact orbits when certain levels of unbalance are present.
3. The rotor and touchdown bearing contact orbits are elliptical if the
touchdown bearing stiffness is non-isotropic.
4. The contact force increases with touchdown bearing clearance and
decreases with coefficient of contact surface friction, but it reduces
significantly with the touchdown bearing stiffness.
5. The rotor and touchdown bearing persistent contact region decreases
with lower values of friction coefficient.
6. The touchdown bearing control strategy of moving touchdown bearing in
the same direction as the rotor to bring rotor out of contact is effective at

214
speeds above the rotor’s first natural critical frequency and its first
flexural critical frequency.
7. The touchdown bearing control is more efficient at speeds away from a
rotor’s critical speed.
8. For low levels of symmetrical unbalance distribution, it is effective to
apply the same touchdown bearing control strategy on both touchdown
bearings at the same time. If the unbalance level is increased, it is also
beneficial to sequence the control of touchdown bearings.
Experimental work: active touchdown bearing control at zero speed
Experimentally, using active touchdown bearing to release the entrapped
rotor was first tested at zero speed. The rotor orbit was established by
applying rotating force through magnetic bearings. The rotating force speed
was increased from zero to above its first critical speed then decreased back
to zero in order to find the speed region where rotor contact and contact-free
orbits co-exist. The following factors that influence rotor and touchdown
bearing contact are:
1. The magnitude of rotating forces applied through magnetic bearings.
2. The magnetic bearing stiffness and damping.
Finally, touchdown bearing control was used to bring rotor out of contact.
Main findings:
1. The rotor contact orbit is generally non-circular, with an off-set from its
nominal zero position.
2. The frequency region where contact and non-contact orbits co-exist is
smaller when the rotating force is higher.
3. The frequency range where contact and non-contact orbits co-exist
increases with the magnetic bearing stiffness.

215
Experimental work: rotor unbalance experiments
The active touchdown bearing control strategy to bring rotor out of contact
was tested when unbalance masses were mounted onto the rotor. Firstly, a 9
gram unbalance mass was used and the contact-free and contact regions were
established during the speed run-up and run-down process. The active
touchdown bearing control was used to bring rotor out of contact at
difference speeds. The phase of the active touchdown bearing demand was
varied to determine the phase boundary where the active touchdown bearing
control is effective. The same process was repeated when the unbalance
mass was reduced to 7 grams.
Main finding:
1. The rotor and touchdown bearing contact is sensitive to
clearance/misalignment.
2. It is more difficult to bring rotor out of contact at speeds closer the
rotor’s critical speed.
3. When the touchdown bearing control is effective, the touchdown
bearing demand phase variation is much wider at speeds further away
from the rotor’s critical speed.
4. Moving the touchdown bearing ahead of rotor/negative phase shift (lead)
is more effective in releasing the entrapped rotor.
5. Reducing unbalance levels enlarges the speed range where the
touchdown bearing control is effective.
6. Magnetic and touchdown bearing off-set can affect rotor and touchdown
bearing contact. Active touchdown bearing control may still be effective
despite small the off-set.
Further work
The phase between the rotor and touchdown bearing demand was fixed
during the process of releasing entrapped rotor. During the contact release
process, the touchdown bearing demand may not always have the most
effective phase angle relative to the rotor. The variable phase angle of
216
touchdown bearing demand may improve the effectiveness of the touchdown
bearing control; however, the rate of variation is yet to be determined.
In this thesis, the touchdown bearing radial displacement was limited to a
relatively small value. The touchdown bearing control could be improved
significantly by increasing the touchdown bearing radial displacement. To
ensure the effectiveness of the active touchdown bearing control, the
relationship between the touchdown bearing radial displacement and
maximum allowable rotor unbalance is yet to be established.
The active touchdown bearing control of moving touchdown bearing in the
same direction as the rotor may not always be effective to deal with every
contact situation. If the touchdown bearing is not capable of bringing a rotor
out of contact, alternative touchdown bearing control may be more effective
in minimising contact forces.
The active touchdown bearing and its control strategy has only been
demonstrated on a system with two magnetic bearings. For some magnetic
bearing systems, they might require more than two magnetic bearings; the
active touchdown bearing and its control strategy may be extended to a
system with more than two active magnetic bearings. The rotor dynamics at
contact may be different for a system with more magnetic bearings; the
active touchdown bearing control strategy may need to be adapted for
different systems.
217
References
1. Keogh, P.S. Contact dynamic phenomena in rotating machines: Active/passive considerations. 2012.
2. Johnson, D.C., Synchronous whirl of vertical shaft having clearance in one bearing. Journal of Mechanical Engineering Science, 1962. 4(1): p. 85-93.
3. Ehrich, F.F. Bistable vibration of rotors in bearing clearance. in ASME Meeting WA/MD-1, Nov 7-11 1965. 1965. New York, NY, United States: American Society of Mechanical Engineers (ASME).
4. Black, H.F., Interaction of a whirling rotor with a vibrating stator across a clearance annulus. Journal of Mechanical Engineering Science, 1968. 10(1): p. 1-&.
5. Childs, D.W., Rub-induced parametric-excitation in rotors. Journal of Mechanical Design-Transactions of the Asme, 1979. 101(4): p. 640-644.
6. Muszynska, A. Partical lateral rotor to stator rubs. Third International Conference on Vibrations in Rotating Machinery. 1984. Heslington, Engl: r Inst of Mechanical Engineers, London, Engl by Mechanical Engineering Publ Ltd.
7. Choy, F.K., Padovan, J., and Yu, J.C., Full rubs, bouncing and quasi chaotic orbits in rotating equipment. Journal of the Franklin Institute, 1990. 327(1): p. 25-47.
8. Lawen Jr, J.L. and Flowers, G.T. Synchronous dynamics of a coupled shaft/bearing/housing system with auxiliary support from a clearance bearing: analysis and experiment. in Proceedings of the International Gas Turbine and Aeroengine Congress and Exposition, June 5, 1995 - June 8, 1995. 1995. Houston, TX, USA: ASME.
9. Popprath, S. and Ecker, H., Nonlinear dynamics of a rotor contacting an elastically suspended stator. Journal of Sound and Vibration, 2007. 308(3-5): p. 767-784.
10. Schmied, J., and Pradetto, J.C. Behavior of a one ton rotor being dropped into auxiliary bearings. Proc. 3rd Int. Symp. Magnetic Bearings. July, 1992. Alexandria, VA.
11. Kirk, R.G., Swanson, E. E. , Kavarana, F. H. and Wang, X. Rotor drop test stand for AMB rotating machinery, part I: Description of test stand and initial results, Proc. 4th International Symposium on Magnetic Bearings, Zurich, 1994, p. 207–212.
12. Hawkins, L., Alexei, F. and Shamim, I.. Test results and analytical predictions for rotor drop testing of an active megnetic bearing expander/generator. Journal of Engineering for Gas Turbines and Power, 2007. 129(2): p. 522-529.
13. Zeng, S. Modelling and experimental study of the transient response of an active magnetic bearing rotor during rotor drop on back-up bearings. 2003: Professional Engineering Publishing Ltd.
14. Zhu, C., Nonlinear dynamics of rotor drop on rolling element backup bearings after active magnetic bearings failure. Jixie Gongcheng Xuebao/Chinese Journal of Mechanical Engineering, 2006. 42(7): p. 196-202.

218
15. Fumagalli, M., Varadi, P., and Schweitzer, G. Impact dynamics of high speed rotors in retainer bearings and measurement concepts. in Proc. 4th Int. Symp. Magnetic Bearings. Aug. 1994. ETH Zurich.
16. Bartha, A.R., Dry Friction induced backward whirl: theory and experiment, Proc. 5th IFToMM Conf. Rotor Dynamics, Darmstadt, Sept. 1998, p. 756-767.
17. Cuesta, E.N., V. R. Rastelli, L. U. Medina, N. I. Montbrun and S. E. Diaz. Non-linear behaviors in the motion of a magnetically supported rotor on the catcher bearing during levitation loss, an experimental description. in Proceedings of the ASME turbo expo 2002: Ceramics Industrial and Cogeneration Structures and Dynamics, June 3, 2002 - June 6, 2002. 2002. Amsterdam, Netherlands: American Society of Mechanical Engineers.
18. Sun, G., Rotor drop and following thermal growth simulations using detailed auxiliary bearing and damper models. Journal of Sound and Vibration, 2006. 289(1-2): p. 334-359.
19. Markert, R., and Wegener, G, Transient vibration of elastic rotors in retainer bearings, Proc. ISROMAC-7, Hawaii, Feb. 1998, p. 764-774.
20. Kirk, R.G., Gunter, E.J., and Chen, W.J. Rotor drop transient analysis of AMB machinery. in DETC2005: ASME International Design Engineering Technical Conferences and Computers and Information in Engineering Conference, September 24, 2005 - September 28, 2005. 2005. Long Beach, CA, United States: ASME.
21. Ishii, T. and Kirk, R.G., Transient response technique applied to active magnetic bearing machinery during rotor drop. Journal of Vibration and Acoustics-Transactions of the Asme, 1996. 118(2): p. 154-163.
22. Keogh, P.S. and Cole, M.O.T., Rotor vibration with auxiliary bearing contact in magnetic bearing systems part 1: Synchronous dynamics. Proceedings of the Institution of Mechanical Engineers, Part C: Journal of Mechanical Engineering Science, 2003. 217(4): p. 377-392.
23. Cole, M.O.T. and Keogh, P.S., Rotor vibration with auxiliary bearing contact in magnetic bearing systems Part 2: Robust synchronous control for rotor position recovery. Proceedings of the Institution of Mechanical Engineers, Part C: Journal of Mechanical Engineering Science, 2003. 217(4): p. 393-410.
24. Ulbrich, H., Chavez, A., and Dhima, R, Minimization of contact forces in case of rotor rubbing using an actively controlled auxiliary bearing, Proc. 10th Int. Symp. Transport Phenomena and Dynamics of Rotating Machinery, Honolulu, Hawaii, March 2004, p. 1-10.
25. Ulbrich, H., and Ginzinger, L, Stabilization of a rubbing rotor using a robust feedback control, Paper-ID: 306, Proc. 7th IFToMM Conf. Rotor Dynamics, Vienna, Austria, 2006.
26. Chavez, A., Ulbrich, H., and Ginzinger, L., Reduction of contact forces in a rotor-stator-system in case of rubbing through active auxiliary bearing. Shock and Vibration, 2006. 13(4): p. 505-518.
27. Cade, I.S., Sahinkaya, M.N., Burrows, C.R., and Keogh, P.S., On the design of an active auxiliary bearing for rotor/magnetic bearing systems, Proc. 11th Int. Symp. Magnetic Bearings, Nara, Japan, Sept. 2008.
28. Keogh, P.S., Sahinkaya, M.N., Burrows, C.R., and Cade, I.S., Rotor/auxiliary bearing dynamic contact modes in magnetic bearing
219
systems, Proc. 11th Int. Symp. Magnetic Bearings, Nara, Japan, Sept. 2008.
29. Fumagalli, M.A., Modelling and measurement analysis of the contact interaction between a high speed rotor and its stator. Swiss Federal Institute of Technology, 1997.
30. Ehehalt, U., Hahn, E., and Markert, R. Motion patterns at rotor stator contact. in DETC2005: ASME International Design Engineering Technical Conferences and Computers and Information in Engineering Conference, September 24, 2005 - September 28, 2005. 2005. Long Beach, CA, United states: American Society of Mechanical Engineers.
31. Ehehalt, U., Hahn, E., and Markert, R. Experimental validation of various motion patterns at rotor stator contact. in 11th International Symposium on Transport Phenomena and Dynamics of Rotating Machinery, ISROMAC-11, February 26, 2006 - March 2, 2006. 2006. Honolulu, HI, United states: Curran Associates Inc.
32. Subbiah, R., Bhat, R.B., Sankar, T.S., and Rao, J.S.,. Backward whirl in a simple rotor supported on hydraulic bearings. Instability in Rotating Machinery. 1985. Washington, DC, USA: NASA, Scientific & Technical Information Branch.
33. Greenhill, L.M. and Cornejo, G.A. Critical speeds resulting from unbalance excitation of backward whirl modes. in Proceedings of the 1995 ASME Design Engineering Technical Conference. Part C, September 17, 1995 - September 20, 1995. 1995. Boston, MA, USA.
34. Millsaps, K.T. and Vejvoda, C.E. Origin of split resonance and backward whirl in a simple rotor. in Proceedings of the 1996 International Gas Turbine and Aeroengine Congress; Exhibition, June 10, 1996 - June 13, 1996. 1996. UK: ASME.
35. Lee, S.U., Leontopoulos, C., and Besant, C. Backward whirl investigations in isotropic and anisotropic systems with gyroscopic effects. in Proceedings of the 1999 17th International Modal Analysis Conference, IMAC. Part 1 (of 2), Febrary 8, 1999 - Febrary 11, 1999. 1999. Kissimmee, FL, USA: SEM.
36. Rao, J.S. Transient forward and backward whirl of beam and solid rotors with stiffening and softening effects. in ASME 2011 International Design Engineering Technical Conferences and Computers and Information in Engineering Conference, IDETC/CIE 2011, August 28, 2011 - August 31, 2011. 2011. Washington, DC, United states: American Society of Mechanical Engineers.
37. Stroud, D.R.H., Lines, L.A., and Minett-Smith, D.J. Analytical and experimental backward whirl simulations for rotary steerable bottom hole assemblies. in SPE/IADC Drilling Conference and Exhibition 2011, March 1, 2011 - March 3, 2011. 2011. Amsterdam, Netherlands: Society of Petroleum Engineers (SPE).
38. Vlajic, N., et al. Stick-slip and whirl motions of drill strings: Numerical and experimental studies. in ASME 2011 International Design Engineering Technical Conferences and Computers and Information in Engineering Conference, IDETC/CIE 2011, August 28, 2011 - August 31, 2011. 2011. Washington, DC, United states: American Society of Mechanical Engineers.

220
39. Stroud, D., Bird, N., Norton, P., Kennedy, M. and Greener, M.. Roller reamer fulcrum in point-the-bit rotary steerable system reduces stick-slip and backward whirl. in IADC/SPE Drilling Conference and Exhibition 2012, March 6, 2012 - March 8, 2012. 2012. San Diego, CA, United States: Society of Petroleum Engineers (SPE).
40. Jiang, J., Shang, Z., and Hong, L., Characteristics of dry friction backward whirl-A self-excited oscillation in rotor-to-stator contact systems. Science China Technological Sciences, 2010. 53(3): p. 674-683.
41. Childs, D., Prediction of dry-friction whirl and whip between a rotor and a stator. Journal of vibration and acoustics, 2007. 129(3): p. 355-362.
42. Black, H. Paper 4: Synchronous whirling of a shaft within a radially flexible annulus having small radial clearance. Proceedings of the Institution of Mechanical Engineers, Conference Proceedings. 1966: SAGE Publications.
43. Ginzinger, L., Heckmann, B., and Ulbrich, H. Feedback control to prevent damage by rotor rubbing after an impact load. 2009 ASME Turbo Expo, June 8, 2009 - June 12, 2009. 2009. Orlando, FL, United states: American Society of Mechanical Engineers.
44. Schweitzer, G., Bleuler, H., and Traxler, A., Active magnetic bearings, basics, properties and application of active magnetic bearings. 1994, Zürich: VDF Hochschulverlag AG.
45. Burrows, C.R. and Sahinkaya, M.N., Vibration control of multi-mode rotor-bearing systems. Proceedings of The Royal Society of London, Series A: Mathematical and Physical Sciences, 1983. 386(1790): p. 77-94.
46. Larsonneur, R., Siegwart, R., and Traxler, A. Active magnetic bearing control strategies for solving vibration problems in industrial rotor systems. Institude of mechanical engineers conference publications. 1992: Medical engineering publications Ltd.
47. Keogh, P., Mu, C., and Burrows, C., Optimized design of vibration controllers for steady and transient excitation of flexible rotors. Proceedings of the Institution of Mechanical Engineers, Part C: Journal of Mechanical Engineering Science, 1995. 209(3): p. 155-168.
48. Shiau, T., Sheu, G., and Yang, C., Vibration and control of a flexible rotor in magnetic bearings using hybrid method and H∞ control theory. Journal of Engineering for Gas Turbines and Power, 1997. 119(1): p. 178-185.
49. Jiang, Y. and Zmood, R. H infinity control of magnetic bearings to ensure both system and external periodic disturbance robustness. Royal Melbourne Inst. of Tech, Third International Symposium on Magnetic Suspension Technology, p 165-175 (SEE N 96-35897 12-18). 1996.
50. Nonami, K. and Ito, T., μ synthesis of flexible rotor-magnetic bearing systems. Control Systems Technology, IEEE Transactions on, 1996. 4(5): p. 503-512.
51. Earnshaw, S., On the nature of the molecular forces which regulate the constitution of the luminferous ether. Trans. Camb. Phil. Soc, 1842. 7: p. 97–112.
52. Kemper, H., Overhead suspension railway with wheel-less vehicles employing magnetic suspension from iron rails, Germ, 1937.
221
53. Tonoli, A. and Bornemann, H.J., Analysis of losses due to rotor vibrations in a high-T-c superconducting flywheel system. Journal of Sound and Vibration, 1998. 212(4): p. 649-662.
54. Kim, S.J. and Lee, C.W., On-line identification of current and position stiffnesses by lms algorithm in active magnetic bearing system equipped with force transducers. Mechanical Systems and Signal Processing, 1999. 13(5): p. 681-690.
55. Peel, D.J., Bingham, C. M., Wu, Y. and Howe, D., Simplified characteristics of active magnetic bearings. Proceedings of the Institution of Mechanical Engineers Part C-Journal of Mechanical Engineering Science, 2002. 216(5): p. 623-628.
56. Skricka, N. and Markert, R., Improvements in the integration of active magnetic bearings. Control Engineering Practice, 2002. 10(8): p. 917-922.
57. Nelson, H.D. and McVaugh, J.M., Dynamics of Roto-Bearing Systems Using Finite-Elements. Journal of Engineering for Industry-Transactions of the Asme, 1976. 98(2): p. 593-600.
58. Astley, R., Finite Elements in Solids and Structures. 1993: Chapman & Hall.
59. Zorzi, E.S. and Nelson, H.D., Finite-element simulation of rotor-bearing systems with internal damping. Journal of Engineering for Power-Transactions of the Asme, 1977. 99(1): p. 71-76.
60. Roark, R.J. and Young, W.C., Formulas for Stress and Strain, 5th edition. 1975 McGraw-Hill.
61. Burrows, C. and Sahinkaya, M., Vibration control of multi-mode rotor-bearing systems. Proceedings of the Royal Society of London. A. Mathematical and Physical Sciences, 1983. 386(1790): p. 77-94.
62. Iwakuma, T., AI, M., and Nishino, F., On the derivation of timoshenko beam stiffness equation. Proc. of JSCE, No 312, 1981: p. 119-128.
63. Bishop, R.E.D. and Parkinson, A.G., On the Use of Balancing Machines for Flexible Rotors. Journal of Engineering for Industry, 1972. 94(2): p. 561-572.
64. Rieger, N.F., Flexible rotors bearing systems dynamics. ASME, 1973: p. 2-29.
65. Parkinson, A.G., Balancing of rotating machinery. Proceedings of the Institution of Mechanical Engineers; Part C; Journal of Mechanical Engineering Science, 1991. 205(1): p. 53-66.
66. Rieger, N.F., Balancing of Rigid and Flexible Rotors. 1986: Shock and Vibration Information Center, U.S. Department of Defense.
67. Thearle, E.L., Dynamic balancing of rRotating machinery in the field. Journal of Applied Mechanics, ASME, 1934(56): p. 745-753.
68. Baker, J., Methods of rotor-unbalance determination. ASME Journal of Applied Mechanics, 1939. 61: p. A1-A6.
69. Goodman, T.P., A Least-squares method for computing balance corrections. Journal of Engineering for Industry, 1964. 86(3): p. 273-277.
70. Lund, J.W. and Tonnesen, J., Analysis and experiments on multi-plane balancing of a flexible rotor. Journal of Engineering for Industry, 1972. 94(1): p. 233-242.
71. Tessarzik, J. and Badgley, R., Experimental evaluation of the exact point-speed and least-squares procedures for flexible rotor balancing by the
222
influence coefficient method. ASME, Transactions, Series B-Journal of Engineering for Industry, 1974. 96: p. 633-643.
72. Pilkey, W.D. and Bailey, J.T., Constrained balancing techniques for flexible rotors. Journal of Mechanical Design, 1979. 101(2): p. 304-308.
73. Darlow, M.S., Balancing of high-speed machinery - Theory, methosa and experimental results. Mechanical Systems and Signal Processing, 1987. 1(1): p. 105-134.
74. Li, G.X., Lin, Z.L., and Allaire, P.E., Robust optimal balancing of high-speed machinery using convex optimization. Journal of Vibration and Acoustics-Transactions of the Asme, 2008. 130(3).
75. Bishop, R. and Gladwell, G., The vibration and balancing of an unbalanced flexible rotor. Journal of Mechanical Engineering Science, 1959. 1(1): p. 66-77.
76. Gnielka, P., Modal balancing of flexible rotors without test runs: an experimental investigation. Journal of Sound and Vibration, 1983. 90(2): p. 157-172.
77. Moore, L.S. and Dodd, E.G., Mass balancing of large flexible rotors. G.E.C. Journal of Science and Technology, 1964. 31(2): p. 74-83.
78. Parkinson, A.G. and Bishop, R.E.D., Residual vibration in modal balancing. Journal of Mechanical Engineering Science, 1965. 7(1): p. 33-39.
79. Bishop, R.E.D. and Mahalingam, S., Some experiments in the vibration of a rotating shaft. Proceedings of the Royal Society of London. Series A, Mathematical and Physical Sciences, 1966. 292(1431): p. 537-561.
80. Parkinson, A.G., The modal interpretation of the vibration of a damped rotating shaft. Vibrations in Rotating Machinery, Institution of Mechanical Engineers Conference, 1976.
81. Rao, J., Rotor dynamics. 1996: New Age International. 82. Kellenberger, W. and Rihak, P. C292/88. Vibrations in Rotating
Machinery: proceedings of the Institution of Mechanical Engineers International Conference, 13-15 September 1988, Heriot-Watt University, Edinburgh. 1988: Published for the Institution of Mechanical Engineers by Mechanical Engineering Publications.
83. Darlow, M.S. Identification and elimination of non-independent balace planes in influcence coefficient balancing. 27th International Gas Turbine Conference and Exhibit. 1982. London, England: ASME, USA 82-GT-269.
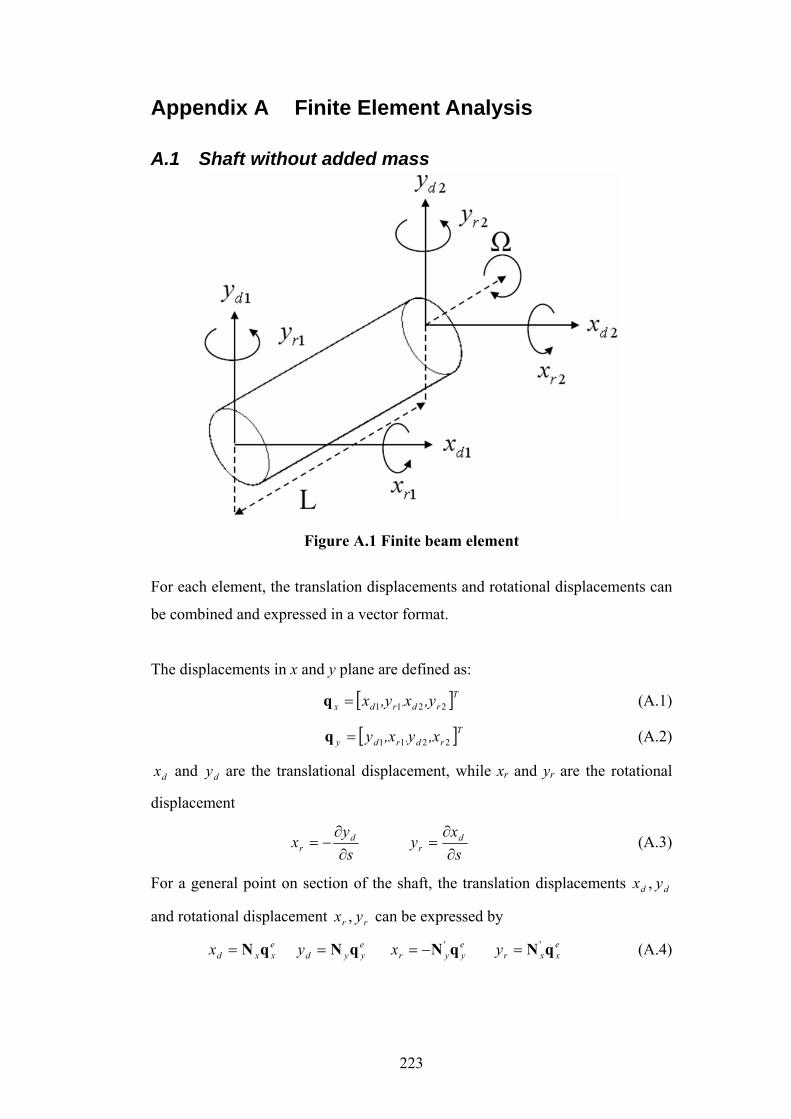
223
Appendix A Finite Element Analysis
A.1 Shaft without added mass
Figure A.1 Finite beam element
For each element, the translation displacements and rotational displacements can
be combined and expressed in a vector format.
The displacements in x and y plane are defined as:
[ ]Trd,rdx ,yx,yx 2211=q (A.1)
[ ]Trd,rdy ,xy,xy 2211=q (A.2)
dx and dy are the translational displacement, while xr and yr are the rotational
displacement
sy
x dr ∂
∂−=
sx
y dr ∂
∂= (A.3)
For a general point on section of the shaft, the translation displacements dd yx ,
and rotational displacement rr yx , can be expressed by
exxdx qN= e
yydy qN= ey
'yrx qN−= e
xxry qN '= (A.4)
224
where xN and yN are the vectors for shape functions in x and y plane,
respectively:
),,,( 4321x NNNN=N ),,,( 4321y NNNN −−=N (A.5)
The shape functions are given by
⎟⎟⎠
⎞⎜⎜⎝
⎛⎟⎠⎞
⎜⎝⎛+⎟
⎠⎞
⎜⎝⎛−−+
+=
32
1 2311
1ls
ls
lsN φφ
φ (A.6)
⎟⎟⎠
⎞⎜⎜⎝
⎛⎟⎠⎞
⎜⎝⎛+⎟
⎠⎞
⎜⎝⎛−⎟
⎠⎞
⎜⎝⎛−+
+=
322
2 22
21 ls
ls
ls
ls
lslN φφ
φ (A.7)
⎟⎟⎠
⎞⎜⎜⎝
⎛⎟⎠⎞
⎜⎝⎛−⎟
⎠⎞
⎜⎝⎛+
+=
32
3 231
1ls
ls
lsN φ
φ (A.8)
⎟⎟⎠
⎞⎜⎜⎝
⎛⎟⎠⎞
⎜⎝⎛+⎟
⎠⎞
⎜⎝⎛+⎟
⎠⎞
⎜⎝⎛−−
+=
322
4 221 ls
ls
ls
lslN φφ
φ (A.9)
where 2/)1(24 kEAlEI νφ += for the Timoshenko element. The shape functions
for the Timshenko beam element derivation is shown by Iwakuma et al.[62]. For
the Euler-Bernoulli beam element, 0=φ , which is explained in [57].
In each element, the incremental elastic bending, axial load and kinetic energies
are expressed by
Elastic bending energy:
dsyx
EIEI
yx
dUd
d
T
d
deb
⎥⎥⎦
⎤⎢⎣
⎡⎥⎦
⎤⎢⎣
⎡
⎥⎥⎦
⎤⎢⎣
⎡= ''
''
''
'' 002
1 (A.10)
Axial load energy:
dsyx
FF
yx
dUd
d
T
d
dea
⎥⎥⎦
⎤⎢⎣
⎡⎥⎦
⎤⎢⎣
⎡
⎥⎥⎦
⎤⎢⎣
⎡= '
'
'
' 002
1 (A.11)
Kinetic energy:
dsJxydsyx
II
yx
dsJdsyx
yx
dT prrr
rT
r
rp
d
dT
d
d &&&
&
&
&&&
&
&
&φφ
μμ
−⎥⎦
⎤⎢⎣
⎡⎥⎦
⎤⎢⎣
⎡⎥⎦
⎤⎢⎣
⎡++⎢
⎣
⎡⎥⎦
⎤⎥⎦
⎤⎢⎣
⎡⎢⎣
⎡⎥⎦
⎤=
002
1210
021 2
(A.12)
Substituting rrdd yxyx ,,, into the energy equation and integrating the energy
equations over the length of the element yield forms that are applicable to the
Euler-Lagrange equation.
225
The Euler-Lagrange equation is
0=−⎟⎠⎞
⎜⎝⎛
dxdL
xddL
dtd
& (A.13)
where UTL −= is the Lagrangian.
After applying the Euler-Lagrange equation on the system, it yields
⎢⎢⎣
⎡
⎥⎥⎦
⎤=
⎢⎢⎣
⎡
⎥⎥⎦
⎤⎥⎦
⎤⎢⎣
⎡+
⎢⎢⎣
⎡
⎥⎥⎦
⎤⎥⎦
⎤⎢⎣
⎡+
⎢⎢⎣
⎡
⎥⎥⎦
⎤⎥⎦
⎤⎢⎣
⎡−
Ω−⎢⎢⎣
⎡
⎥⎥⎦
⎤⎥⎦
⎤⎢⎣
⎡+
⎢⎢⎣
⎡
⎥⎥⎦
⎤⎥⎦
⎤⎢⎣
⎡ey
ex
ey
ex
eby
ebx
ey
ex
eay
eax
ey
ex
e
Teey
ex
ery
erx
ey
ex
edy
edx
K0
0K
K0
0K
0G
G0
M0
0M
M0
0M
&
&
&&
&&
&&
&&
)(
(A.14)
where
[ ] [ ]∫=l
xT
xedx dsμ
0
NNM [ ] [ ]∫=l
yT
yedy dsμ
0
NNM (A.15)
∫=l
'x
T'x
erx dsI
0
][][ NNM ∫ −−=l
'y
T'y
ery dsI
0
][][ NNM (A.16)
∫ −=l '
yT'
xpe dsJ
0][][ NNG (A.17)
∫=l
''x
T''x
eax dsEI
0
][][ NNK ∫=l
''y
T''y
eay dsEI
0
][][ NNK (A.18)
∫=l
'x
T'x
ebx dsF
0
][][ NΝK ∫=l
'y
T'y
eby dsF
0
][][ NNK (A.19)
∫ −=l
yxT
xex dsΩteΩteμΩ
0
2 )sincos(][NQ (A.20)
∫ +=l
xyT
yey dsΩteΩteμΩ
0
2 )sincos(][NQ (A.21)
A.2 Additional masses to the shaft
Normally, additional cylindrical disks are added to the shaft. In the simulation,
the disks are normally assumed to be thin, rigid and axially symmetric. Each
additional disk is expressed in the matrices
226
⎥⎦
⎤⎢⎣
⎡ −−
=disk
diskdisk
diskdisk
diskdiskx I
mlml
mM (A.22)
⎥⎦
⎤⎢⎣
⎡=
disk
diskdisl
diskdisk
diskdisky I
mlml
mM (A.23)
⎥⎦
⎤⎢⎣
⎡=
pdiskdisk J
000
G (A.24)
Without taking into account of the unbalanced force from the disks, it leads to
⎥⎦
⎤⎢⎣
⎡=⎥
⎦
⎤⎢⎣
⎡⎥⎦
⎤⎢⎣
⎡−
−⎥⎦
⎤⎢⎣
⎡⎥⎦
⎤⎢⎣
⎡00
0G
G0
M0
0M
diskx
diskxdiskT
diskdiskx
diskx
disky
diskx Ω&
&
&&
&&
)( (A.25)
If the unbalanced force on the disk is considered, equation (3.33) becomes
⎥⎦
⎤⎢⎣
⎡=⎥
⎦
⎤⎢⎣
⎡⎥⎦
⎤⎢⎣
⎡−
−⎥⎦
⎤⎢⎣
⎡⎥⎦
⎤⎢⎣
⎡
disky
diskx
disky
diskxdiskT
diskdisky
diskx
disky
diskx ΩQQ
0G
G0
M0
0M
&
&
&&
&&
)( (A.26)
where
⎟⎟⎠
⎞⎜⎜⎝
⎛⎥⎦
⎤⎢⎣
⎡ −+⎥
⎦
⎤⎢⎣
⎡−
= Ωtlem
emΩt
lemem
Ωdiskdiskydisk
diskydisk
diskdiskxdisk
diskxdiskdiskx sincos2Q (A.27)
⎟⎟⎠
⎞⎜⎜⎝
⎛⎥⎦
⎤⎢⎣
⎡+⎥
⎦
⎤⎢⎣
⎡= Ωt
lemem
Ωtlem
emΩ
diskdiskxdisk
diskxdisk
diskdiskydisk
diskydiskdisky sincos2Q (A.28)
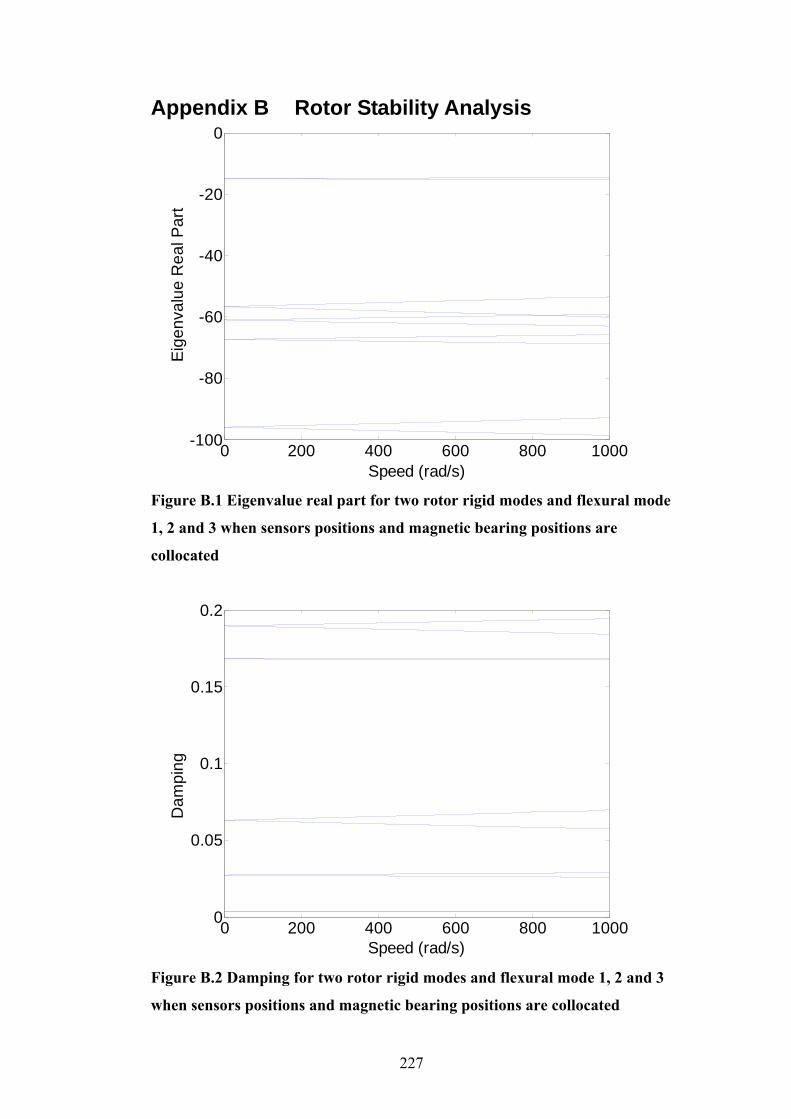
227
Appendix B Rotor Stability Analysis
0 200 400 600 800 1000-100
-80
-60
-40
-20
0
Speed (rad/s)
Eige
nval
ue R
eal P
art
Figure B.1 Eigenvalue real part for two rotor rigid modes and flexural mode
1, 2 and 3 when sensors positions and magnetic bearing positions are
collocated
0 200 400 600 800 10000
0.05
0.1
0.15
0.2
Dam
ping
Rat
io
Speed (rad/s) Figure B.2 Damping for two rotor rigid modes and flexural mode 1, 2 and 3
when sensors positions and magnetic bearing positions are collocated
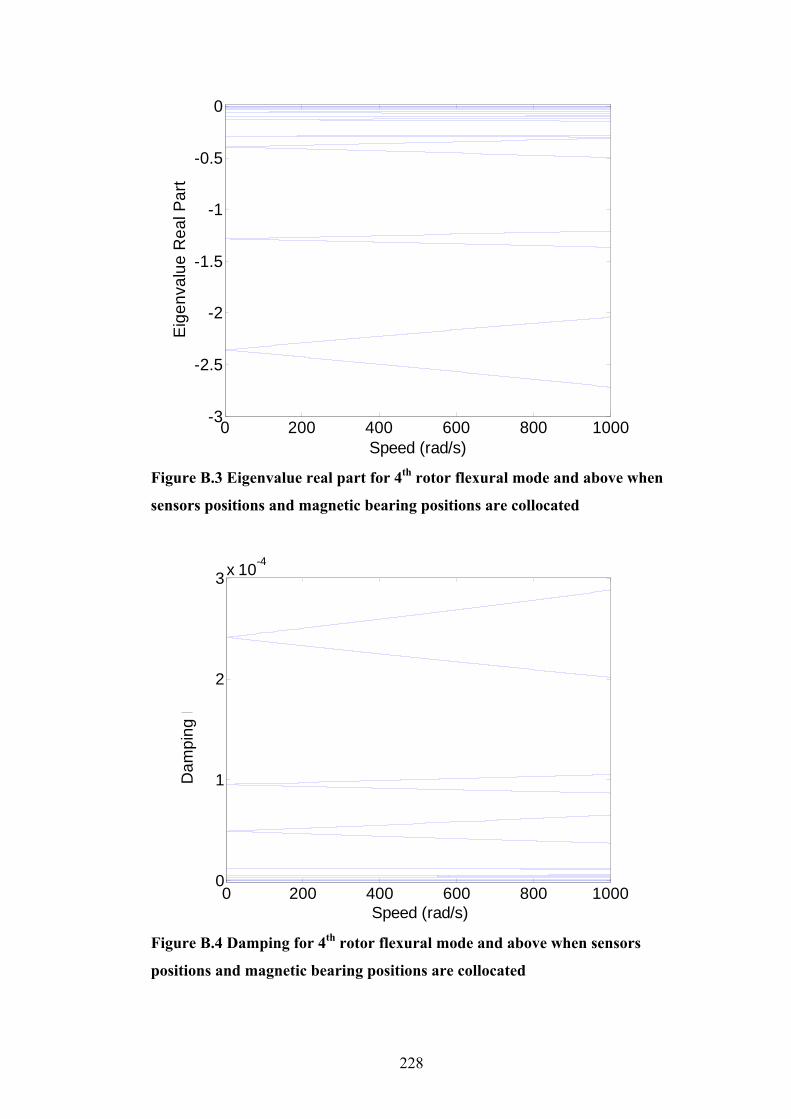
228
0 200 400 600 800 1000-3
-2.5
-2
-1.5
-1
-0.5
0
Speed (rad/s)
Eige
nval
ue R
eal P
art
Figure B.3 Eigenvalue real part for 4th rotor flexural mode and above when
sensors positions and magnetic bearing positions are collocated
0 200 400 600 800 1000
0
1
2
3x 10⁻⁴
Speed (rad/s)
Dam
ping
Rat
io
Figure B.4 Damping for 4th rotor flexural mode and above when sensors
positions and magnetic bearing positions are collocated
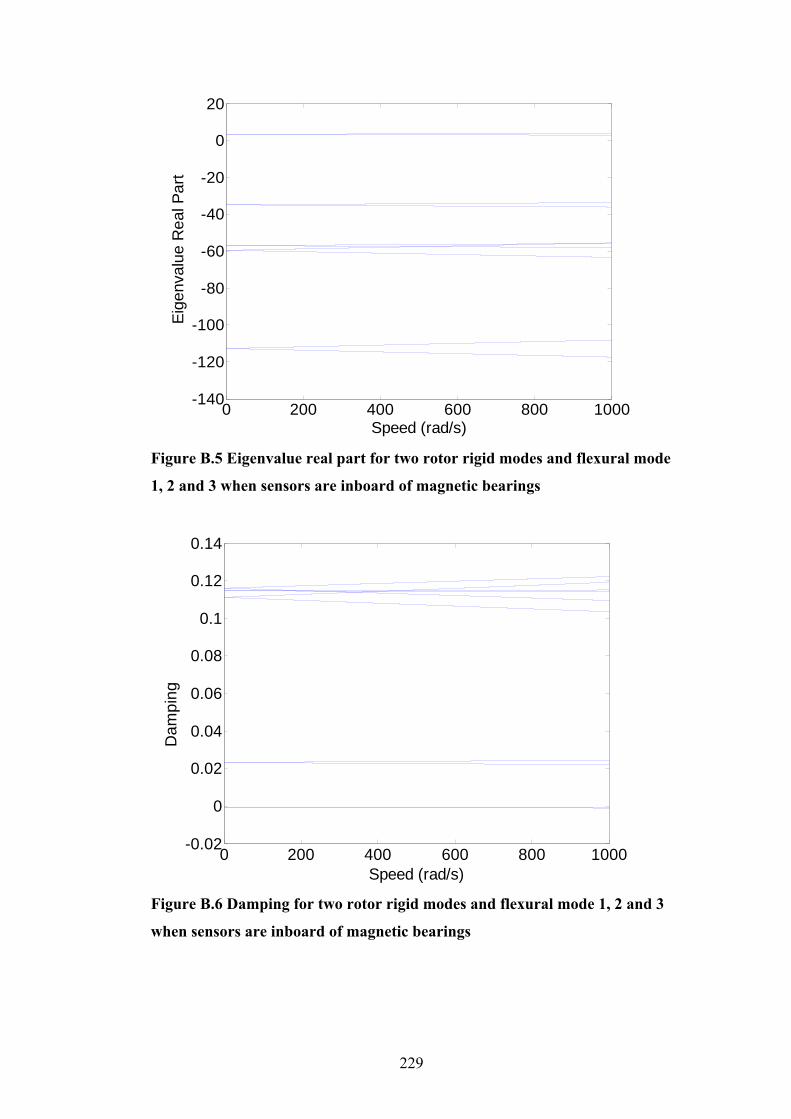
229
0 200 400 600 800 1000-140
-120
-100
-80
-60
-40
-20
0
20
Speed (rad/s)
Eige
nval
ue R
eal P
art
Figure B.5 Eigenvalue real part for two rotor rigid modes and flexural mode
1, 2 and 3 when sensors are inboard of magnetic bearings
0 200 400 600 800 1000-0.02
0
0.02
0.04
0.06
0.08
0.1
0.12
0.14
Speed (rad/s)
Dam
ping
Rat
io
Figure B.6 Damping for two rotor rigid modes and flexural mode 1, 2 and 3
when sensors are inboard of magnetic bearings
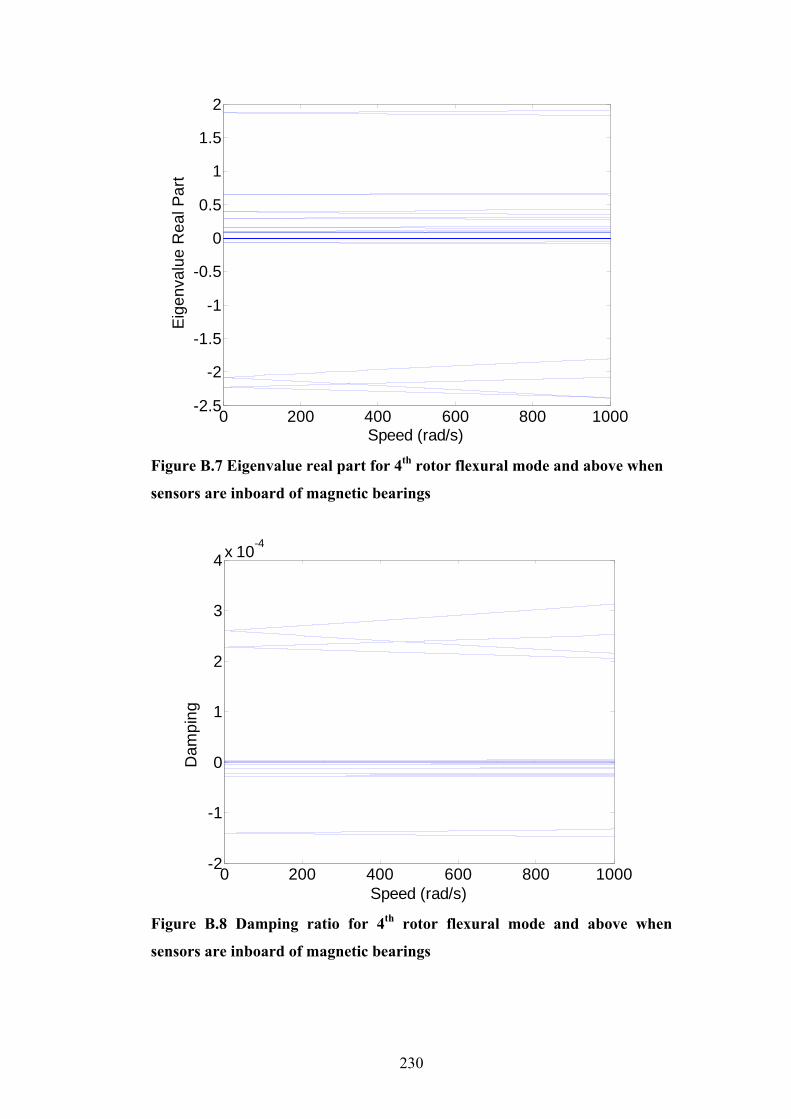
230
Figure B.7 Eigenvalue real part for 4th rotor flexural mode and above when
sensors are inboard of magnetic bearings
0 200 400 600 800 1000-2
-1
0
1
2
3
4x 10⁻⁴
Speed (rad/s)
Dam
ping
Rat
io
Figure B.8 Damping ratio for 4th rotor flexural mode and above when
sensors are inboard of magnetic bearings
0 200 400 600 800 1000-2.5
-2
-1.5
-1
-0.5
0
0.5
1
1.5
2
Speed (rad/s)
Eige
nval
ue R
eal P
art

231
0 200 400 600 800 1000-120
-100
-80
-60
-40
-20
0
Speed (rad/s)
Eige
nval
ue R
eal P
art
Figure B.9 Eigenvalue real part for two rotor rigid modes and flexural mode
1, 2 and 3 when sensors are outboard of magnetic bearings
0 200 400 600 800 10000
0.05
0.1
0.15
0.2
Speed (rad/s)
Dam
ping
Rat
io
Figure B.10 Damping ratio for two rotor rigid modes and flexural mode 1, 2
and 3 when sensors are outboard of magnetic bearings
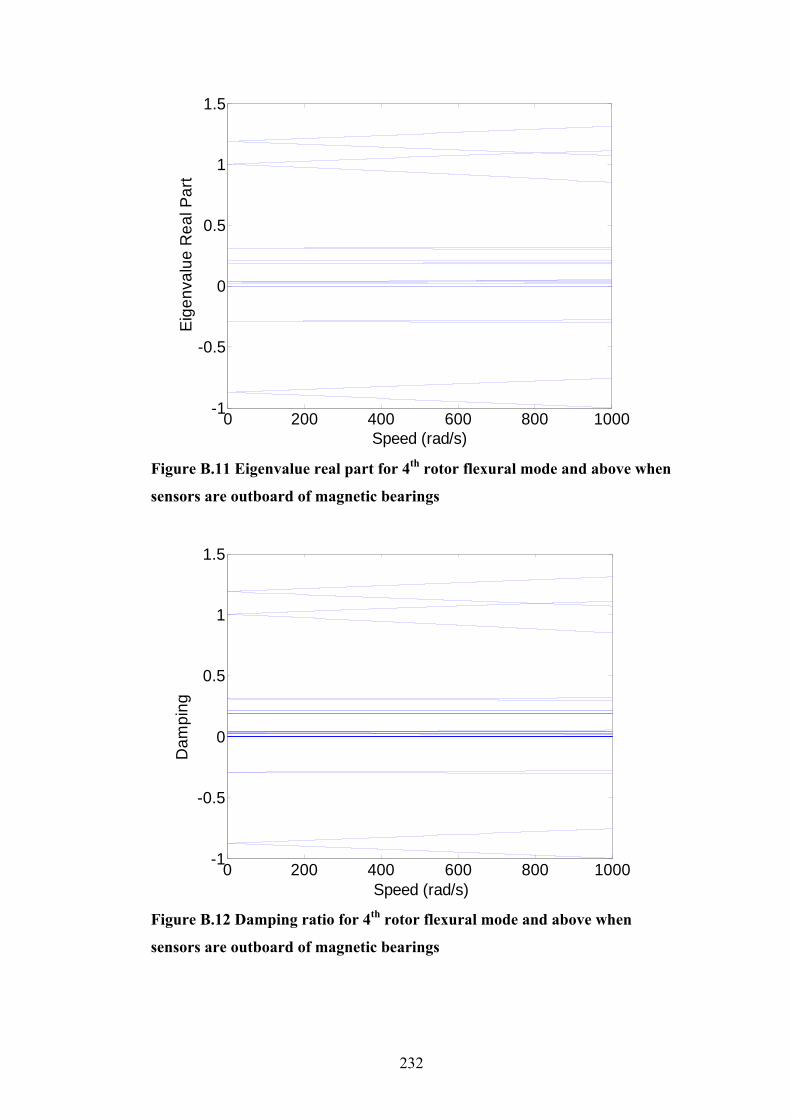
232
0 200 400 600 800 1000-1
-0.5
0
0.5
1
1.5
Speed (rad/s)
Eige
nval
ue R
eal P
art
Figure B.11 Eigenvalue real part for 4th rotor flexural mode and above when
sensors are outboard of magnetic bearings
0 200 400 600 800 1000-1
-0.5
0
0.5
1
1.5
Speed (rad/s)
Dam
ping
Rat
io
Figure B.12 Damping ratio for 4th rotor flexural mode and above when
sensors are outboard of magnetic bearings
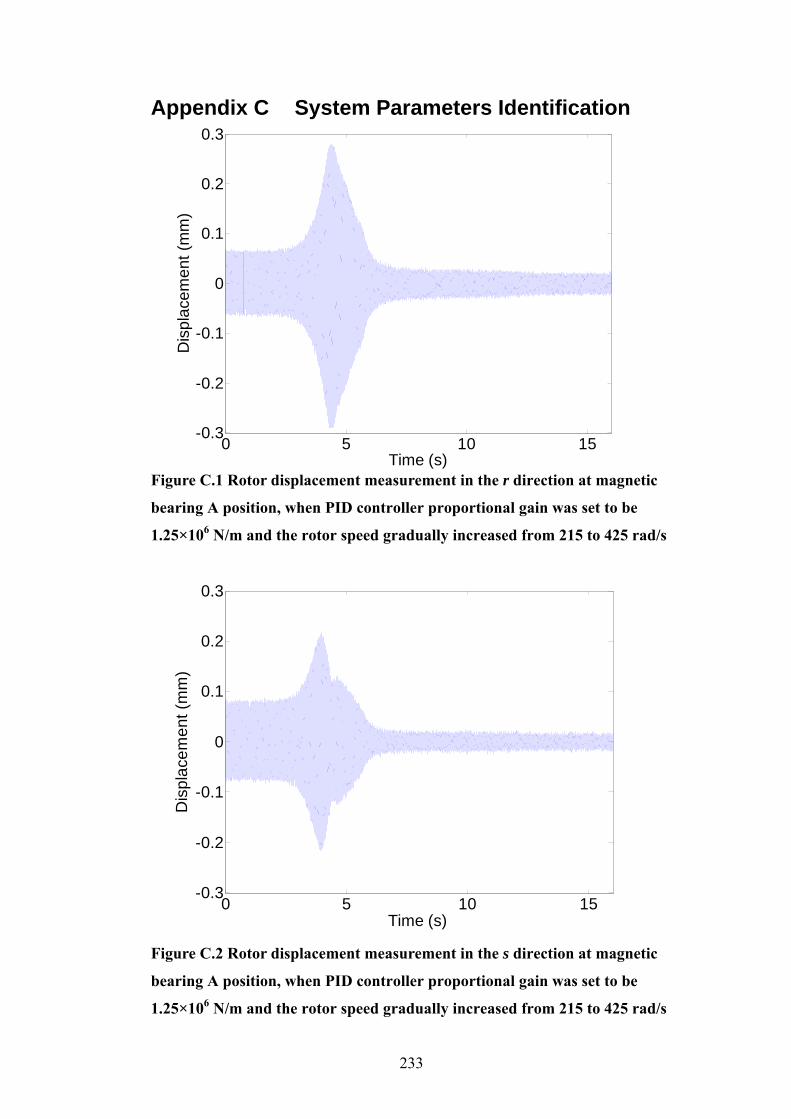
233
Appendix C System Parameters Identification
0 5 10 15
-0.3
-0.2
-0.1
0
0.1
0.2
0.3
Time (s)
Dis
plac
emen
t (m
m)
Figure C.1 Rotor displacement measurement in the r direction at magnetic
bearing A position, when PID controller proportional gain was set to be
1.25×10⁶ N/m and the rotor speed gradually increased from 215 to 425 rad/s
0 5 10 15
-0.3
-0.2
-0.1
0
0.1
0.2
0.3
Time (s)
Dis
plac
emen
t (m
m)
Figure C.2 Rotor displacement measurement in the s direction at magnetic
bearing A position, when PID controller proportional gain was set to be
1.25×10⁶ N/m and the rotor speed gradually increased from 215 to 425 rad/s

234
0 5 10 15-0.2
-0.15
-0.1
-0.05
0
0.05
0.1
0.15
0.2
Time (s)
Dis
plac
emen
t (m
m)
Figure C.3 Rotor displacement measurement in the r direction at magnetic
bearing B position, when PID controller proportional gain was set to be
1.25×10⁶ N/m and the rotor speed gradually increased from 215 to 425 rad/s
0 5 10 15
-0.3
-0.2
-0.1
0
0.1
0.2
0.3
Time (s)
Dis
plac
emen
t (m
m)
Figure C.4 Rotor displacement measurement in the s direction at magnetic
bearing B position, when PID controller proportional gain was set to be
1.25×10⁶ N/m and the rotor speed gradually increased from 215 to 425 rad/s

235
0 5 10 15200
250
300
350
400
450
Time (s)
Rot
atio
nal S
peed
(rad
/s)
Figure C.5 Rotor rotational speed measurement when PID controller
proportional gain was set to 1.25×10⁶ N/m
0 1 2 3 4 5-8
-6
-4
-2
0
2
4
6
8x 10⁻⁵
Time (s)
Dis
plac
emen
t (m
)
Figure C.6 In simulation, rotor displacement measurement in the r direction
for both magnetic bearings, PID controller proportional gain in the r
direction was set to be 10481 m/A and the rotor speed gradually increased
from 200 to 400 rad/s

236
0 1 2 3 4 5-8
-6
-4
-2
0
2
4
6
8x 10⁻⁵
Time (s)
Dis
plac
emen
t (m
)
Figure C.7 In simulation, rotor displacement measurement in the s direction
for both magnetic bearings, PID controller proportional gain in the s
direction was set to be 9494 m/A and the rotor speed gradually increased
from 200 to 400 rad/s
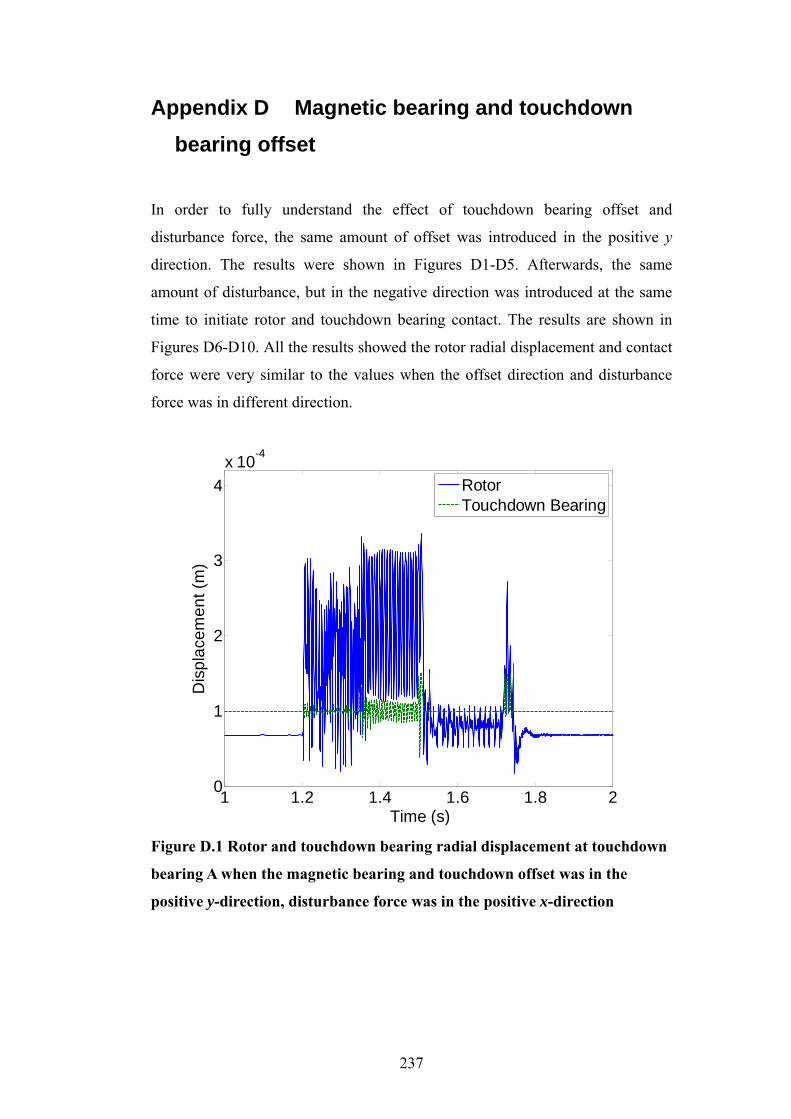
237
Appendix D Magnetic bearing and touchdown bearing offset
In order to fully understand the effect of touchdown bearing offset and
disturbance force, the same amount of offset was introduced in the positive y
direction. The results were shown in Figures D1-D5. Afterwards, the same
amount of disturbance, but in the negative direction was introduced at the same
time to initiate rotor and touchdown bearing contact. The results are shown in
Figures D6-D10. All the results showed the rotor radial displacement and contact
force were very similar to the values when the offset direction and disturbance
force was in different direction.
1 1.2 1.4 1.6 1.8 20
1
2
3
4x 10⁻⁴
Time (s)
Dis
plac
emen
t (m
)
RotorTouchdown Bearing
Figure D.1 Rotor and touchdown bearing radial displacement at touchdown
bearing A when the magnetic bearing and touchdown offset was in the
positive y-direction, disturbance force was in the positive x-direction
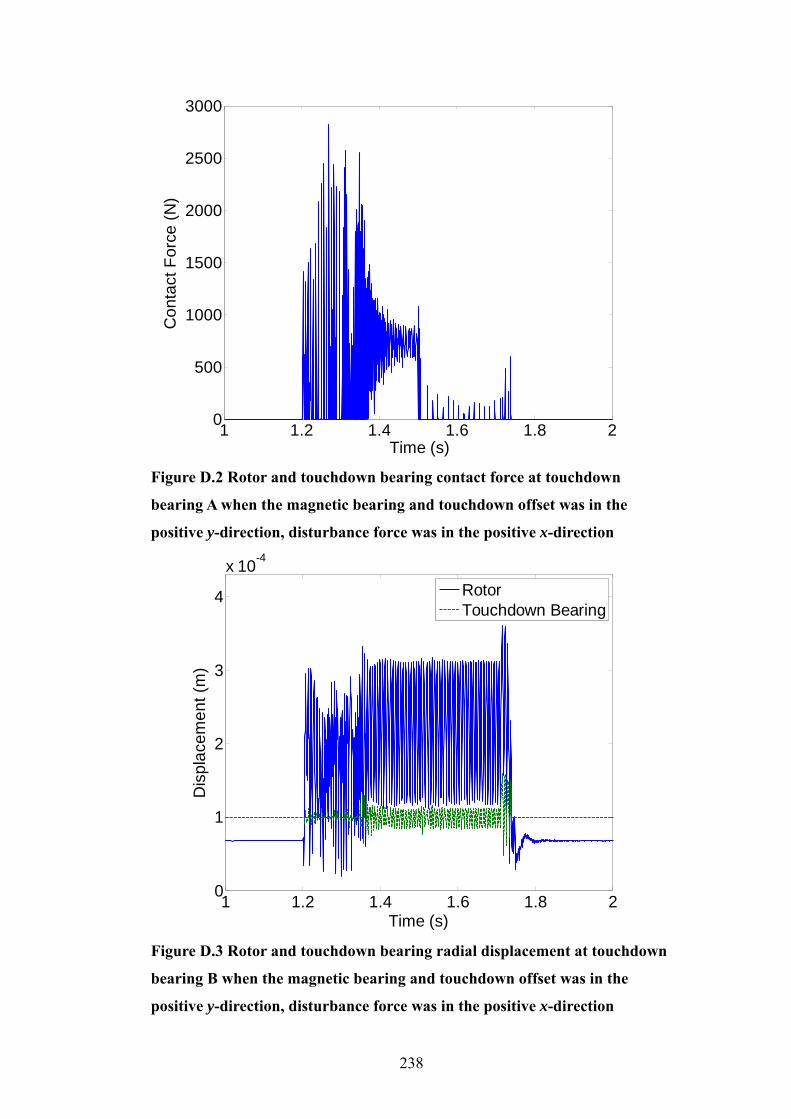
238
1 1.2 1.4 1.6 1.8 20
500
1000
1500
2000
2500
3000
Time (s)
Con
tact
For
ce (N
)
Figure D.2 Rotor and touchdown bearing contact force at touchdown
bearing A when the magnetic bearing and touchdown offset was in the
positive y-direction, disturbance force was in the positive x-direction
1 1.2 1.4 1.6 1.8 20
1
2
3
4
x 10-4
Time (s)
Dis
plac
emen
t (m
)
RotorTouchdown Bearing
Figure D.3 Rotor and touchdown bearing radial displacement at touchdown
bearing B when the magnetic bearing and touchdown offset was in the
positive y-direction, disturbance force was in the positive x-direction
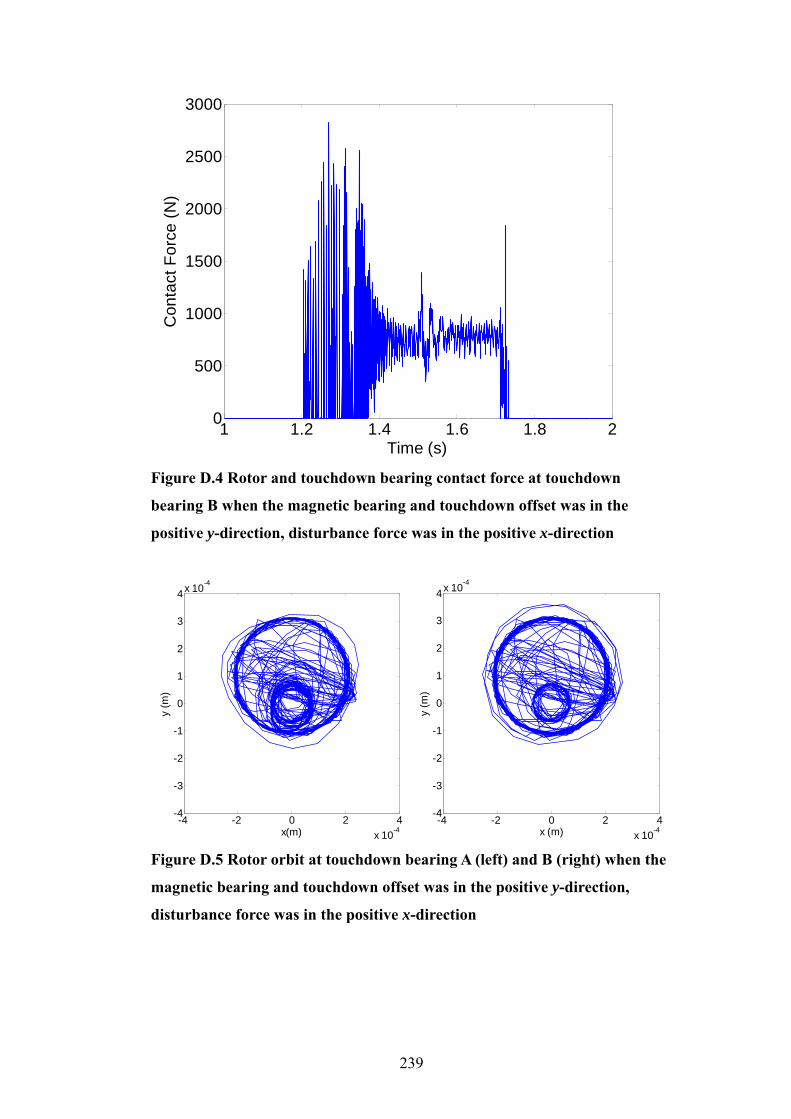
239
1 1.2 1.4 1.6 1.8 20
500
1000
1500
2000
2500
3000
Time (s)
Con
tact
For
ce (N
)
Figure D.4 Rotor and touchdown bearing contact force at touchdown
bearing B when the magnetic bearing and touchdown offset was in the
positive y-direction, disturbance force was in the positive x-direction
-4 -2 0 2 4x 10⁻⁴
-4
-3
-2
-1
0
1
2
3
4x 10⁻⁴
x(m)
y (m
)
-4 -2 0 2 4
x 10-4
-4
-3
-2
-1
0
1
2
3
4x 10⁻⁴
x (m)
y (m
)
Figure D.5 Rotor orbit at touchdown bearing A (left) and B (right) when the
magnetic bearing and touchdown offset was in the positive y-direction,
disturbance force was in the positive x-direction

240
1 1.2 1.4 1.6 1.8 20
1
2
3
4
x 10-4
Time (s)
Dis
plac
emen
t (m
)
RotorTouchdown Bearing
Figure D.6 Rotor and touchdown bearing radial displacement at touchdown
bearing A when the magnetic bearing and touchdown offset was in the
positive y-direction, disturbance force was in the negative x-direction
1 1.2 1.4 1.6 1.8 20
200
400
600
800
1000
1200
1400
1600
1800
Time (s)
Con
tact
For
ce (N
)
Figure D.7 Rotor and touchdown bearing contact force at touchdown
bearing A when the magnetic bearing and touchdown offset was in the
positive y-direction, disturbance force was in the negative x-direction
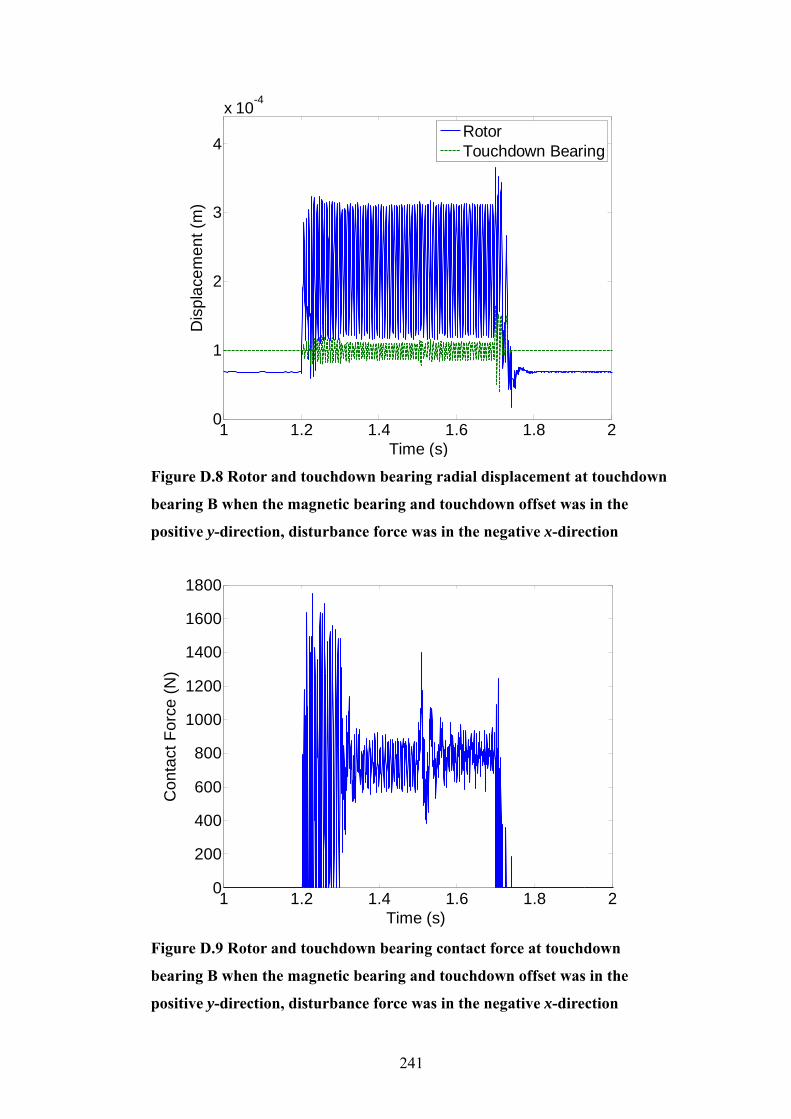
241
1 1.2 1.4 1.6 1.8 20
1
2
3
4
x 10-4
Dis
plac
emen
t (m
)
Time (s)
RotorTouchdown Bearing
Figure D.8 Rotor and touchdown bearing radial displacement at touchdown
bearing B when the magnetic bearing and touchdown offset was in the
positive y-direction, disturbance force was in the negative x-direction
1 1.2 1.4 1.6 1.8 20
200
400
600
800
1000
1200
1400
1600
1800
Time (s)
Con
tact
For
ce (N
)
Figure D.9 Rotor and touchdown bearing contact force at touchdown
bearing B when the magnetic bearing and touchdown offset was in the
positive y-direction, disturbance force was in the negative x-direction
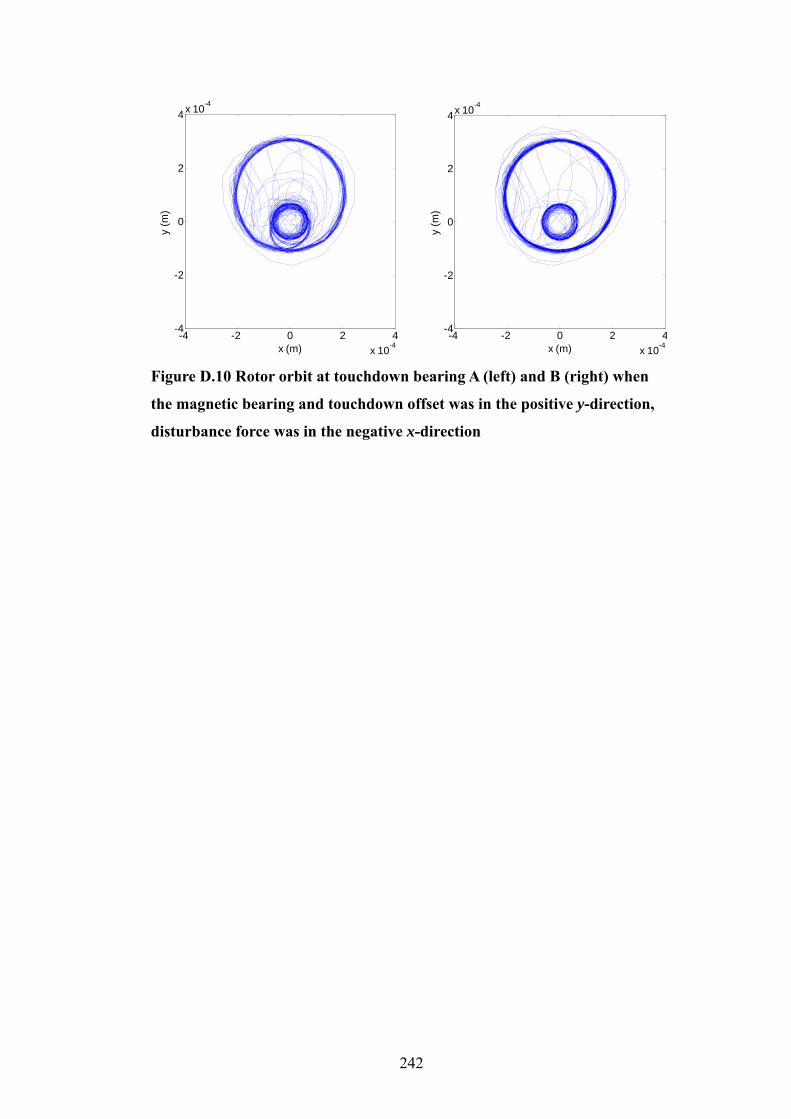
242
-4 -2 0 2 4x 10⁻⁴
-4
-2
0
2
4x 10⁻⁴
x (m)
y (m
)
-4 -2 0 2 4
x 10-4
-4
-2
0
2
4x 10⁻⁴
x (m)
y (m
)
Figure D.10 Rotor orbit at touchdown bearing A (left) and B (right) when
the magnetic bearing and touchdown offset was in the positive y-direction,
disturbance force was in the negative x-direction
243
Appendix E Rotor Balancing
E.1 Rotor balancing background and overview Rotor balancing has been discussed in review papers published by many different
people for instance Bishop and Parkinson [63], Riegr [64] and Parkinson[65]. In
the book written by Rieger [66], he explained the unbalance response and
balancing of rigid and flexural rotors with some experimental work. Also
different balancing methods are compared in the book. The most commonly used
methods are Modal Balancing and Influence Coefficient balancing. Mainly, the
influence coefficient balancing methods will be discussed here. One of earliest
researching into rotor balancing was conducted by Thearle [67] in 1934, he was
the first person researched into two plane balancing techniques. In 1939,
Baker[68] suggested using a set of trial masses to influence the vibration at one
bearing and at one speed a time, then the technique was extend to two and three
bearings. The two plane balance was limited for many years, only becomes
practical recently due to the development of computing power. The influence
coefficient method assumes rotor subject to unbalance and individual unbalance
can be imposed to produce final unbalance effect. This was proposed by
Goodman[69] in 1964, the method was refined in 1972 by Lund and
Tonneson[70] and verified by Tessarzik[71]. In some cases, the number of
vibration reading is more than balancing planes, some least square methods can
be deployed to provide a solution. A method to narrow the correction mass range
was discussed by Pilky and Bailey[72]. In 1987, Darlow[73] tried to combine the
modal method and influence coefficient method in order to reduce the number of
run without compromise the accuracy. Li etc [74] suggested using convex
optimization method to achieve optimum balancing at high speed. The rotor
could also be balanced using Modal balancing method, which is more based on
analysis and calculation. More details about modal balancing method is
explained in [75-82].
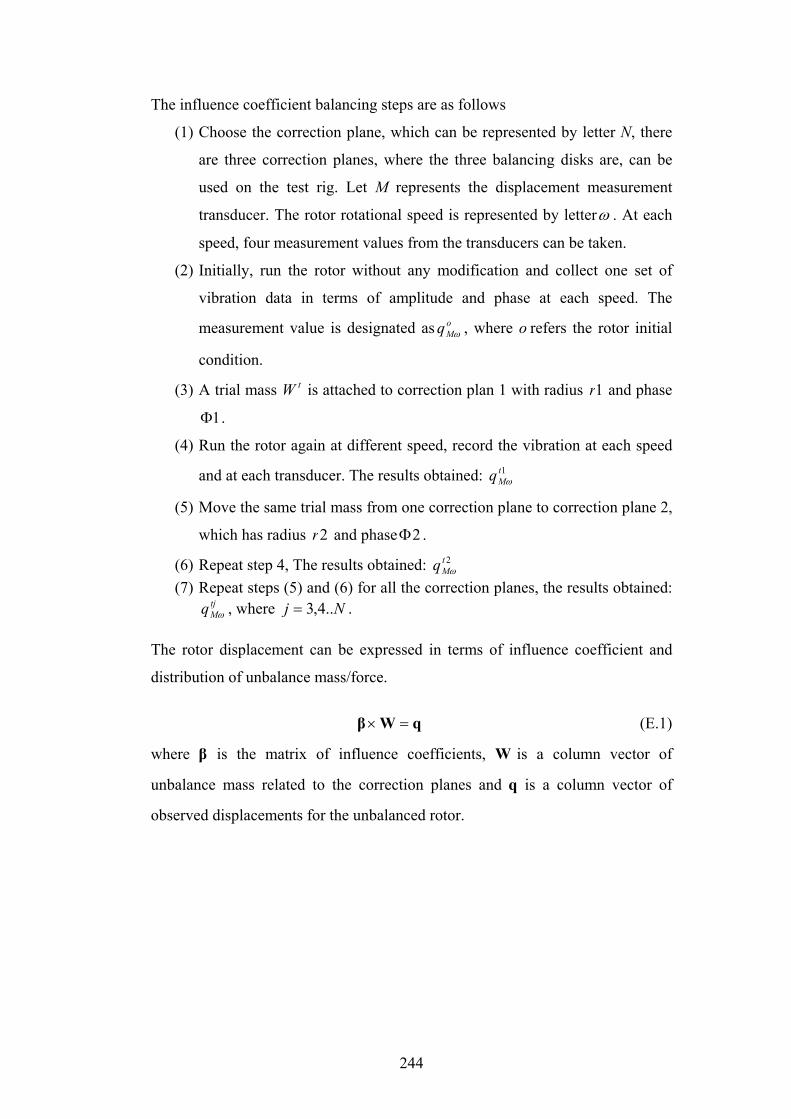
244
The influence coefficient balancing steps are as follows
(1) Choose the correction plane, which can be represented by letter N, there
are three correction planes, where the three balancing disks are, can be
used on the test rig. Let M represents the displacement measurement
transducer. The rotor rotational speed is represented by letterω . At each
speed, four measurement values from the transducers can be taken.
(2) Initially, run the rotor without any modification and collect one set of
vibration data in terms of amplitude and phase at each speed. The
measurement value is designated as oMq ω , where o refers the rotor initial
condition.
(3) A trial mass tW is attached to correction plan 1 with radius 1r and phase
1Φ .
(4) Run the rotor again at different speed, record the vibration at each speed
and at each transducer. The results obtained: 1tMq ω
(5) Move the same trial mass from one correction plane to correction plane 2,
which has radius 2r and phase 2Φ .
(6) Repeat step 4, The results obtained: 2tMq ω
(7) Repeat steps (5) and (6) for all the correction planes, the results obtained: tjMq ω , where Nj ..4,3= .
The rotor displacement can be expressed in terms of influence coefficient and
distribution of unbalance mass/force.
qWβ =× (E.1)
where β is the matrix of influence coefficients, W is a column vector of
unbalance mass related to the correction planes and q is a column vector of
observed displacements for the unbalanced rotor.
245
E.2 Calculate influence coefficient
Figure E.1 Rotor rotational frame and fixed frame
To calculate the influence coefficients, the rotor displacement can be expressed
in a rotational frame. As shown in Figure E.1, x-y is the fixed frame, x’-y’ is the
rotational frame by assuming x’-y’ is attached to the rotor and rotating with the
rotor. When the rotor is running at constant speedω , at any point j along the
shaft
tytxy
tytxx
jjj
jjj
ωω
ωω
cos'sin'
sin'cos'
+=
−= (E.2)
The rotor amplitude on the rotational frame x’-y’ can be expressed in complex
notation:
'' jjrj iyxq += (E.3)
In fixed frame x-y, the rotor amplitude fjq is
jjfj iyxq += (E.4)
fjrj qq = (E.5)
Using Equation E.2, at any constant speed ω, when there are M number of
measurement stations and N number of balancing planes, the relationship
between the unbalance and vibration amplitude in shown below
246
⎥⎥⎥⎥⎥⎥
⎦
⎤
⎢⎢⎢⎢⎢⎢
⎣
⎡
⋅⋅=
⎥⎥⎥⎥⎥⎥
⎦
⎤
⎢⎢⎢⎢⎢⎢
⎣
⎡
⋅⋅
⎥⎥⎥⎥⎥⎥
⎦
⎤
⎢⎢⎢⎢⎢⎢
⎣
⎡
⋅⋅⋅⋅⋅⋅⋅⋅⋅⋅⋅⋅
⋅⋅⋅⋅
ω
ω
ω
βββ
ββββββ
Mq
WN
WW
MNMM
NN
2
1
21
21
2222111211
(E.6)
Here, the amplitude measurement and unbalance are expressed in complex
number format; hence the influence coefficient matrix elements are also complex
number.
There are three balancing planes and two measurement stations on the test rig.
The first trial operating speed, the radial displacements of the rotor without any
trial mass were taken. It yields the result
⎥⎦
⎤⎢⎣
⎡=
⎥⎥⎥
⎦
⎤
⎢⎢⎢
⎣
⎡
⎥⎦
⎤⎢⎣
⎡o
o
WWW
ω
ω
ββββββ
2
1
321
232221131211
(E.7)
oq ω1 and oq ω2 are the original displacement results expressed as complex numbers,
which can be measurement in the rotational frame or fixed frame. When the trial
mass was added onto correction plane no 1, the equation becomes
⎥⎦
⎤⎢⎣
⎡=
⎥⎥⎥
⎦
⎤
⎢⎢⎢
⎣
⎡ +
⎥⎦
⎤⎢⎣
⎡1
2
11
1
32
1
232221131211
t
tt
WW
WW
ω
ω
ββββββ
(E.8)
It is easy to find 11β and 21β can be resolved by subtract Equation E.7 from
Equation E.8.
12
12
11
11
21
11
t
ot
t
ot
Wqq
Wqq
ωω
ωω
β
β
−=
−=
(E.9)
Other elements in the matrix can be found by using the same methods
22
22
21
21
22
12
t
ot
t
ot
Wqq
Wqq
ωω
ωω
β
β
−=
−=
(E.10)
247
32
32
31
31
33
13
t
ot
t
ot
Wqq
Wqq
ωω
ωω
β
β
−=
−=
(E.11)
The same process can be repeated at different operating speed, if the rotor needs
to be balanced for more than one speed. All the measurement results and
unbalance mass can form one big matrix.
(E.12)
where ωβ is one influence coefficient matrix at speed ω, ωq is the rotor
vibration amplitude matrix at speed ω. The unbalance mass can be calculated by
taking an inverse when the influence coefficient matrix is a square matrix.
qβW 1−= (E.13)
If the too many measurements were taken and β is not a square matrix, it has
more rows than columns, some least square techniques can be deployed.
[ ] qβββW T1T −= (E.14)
Where Tβ is the conjugate transpose of matrix β .
The correction mass is the negative value of W , which will be attached to the
correct correction plane.
E.3 Elimination of non-independent balancing planes The influence coefficient Method of balancing is to determine the correction
weight to be added to the pre-determined balance planes by a series runs with
trial masses. The aim is to minimise vibration at a particular rotational speed.
The influence coefficient method is efficient, but requires high number of rotor
runs. Sometimes, wrong choice of balancing plane or measurement location
could result ill-conditioned influence coefficient hence correction masses. These
planes are called non-independent balancing planes. The use of non-independent
⎥⎥⎥⎥⎥⎥
⎦
⎤
⎢⎢⎢⎢⎢⎢
⎣
⎡
⋅⋅=
⎥⎥⎥⎥⎥⎥
⎦
⎤
⎢⎢⎢⎢⎢⎢
⎣
⎡
⋅⋅
⎥⎥⎥⎥⎥⎥
⎦
⎤
⎢⎢⎢⎢⎢⎢
⎣
⎡
⋅⋅
ωω q
q2q1
Wn
W2W1
β
β2β1
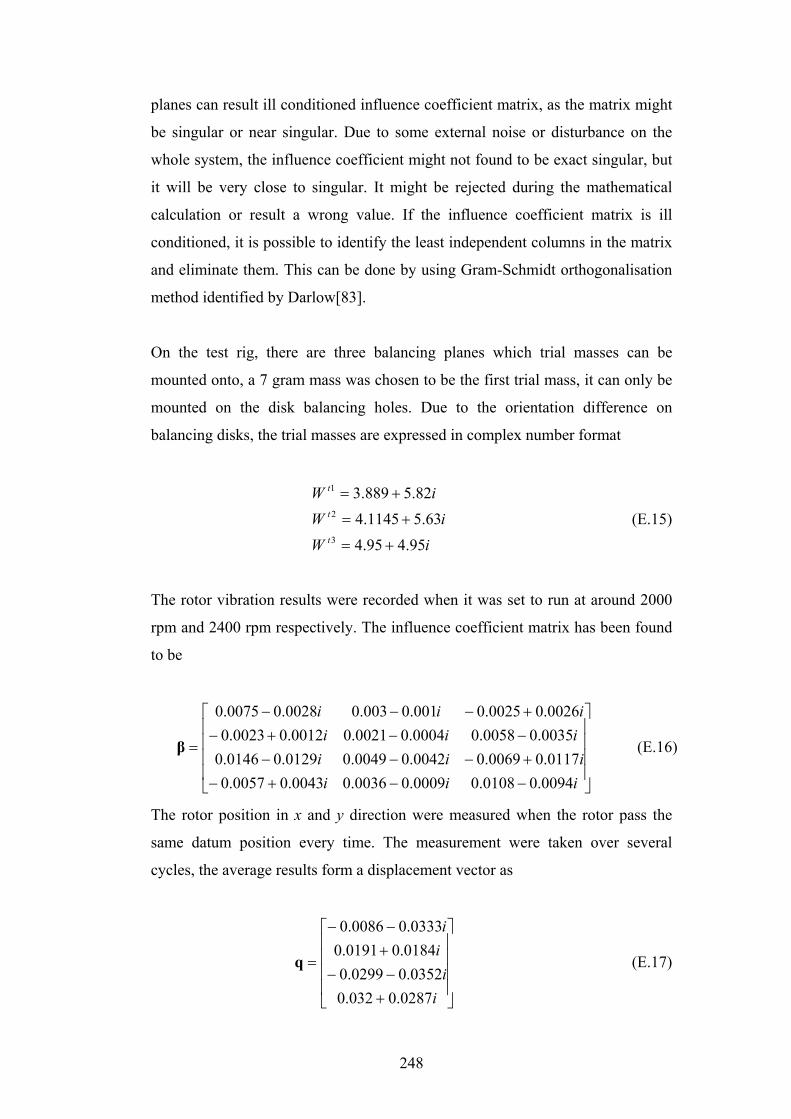
248
planes can result ill conditioned influence coefficient matrix, as the matrix might
be singular or near singular. Due to some external noise or disturbance on the
whole system, the influence coefficient might not found to be exact singular, but
it will be very close to singular. It might be rejected during the mathematical
calculation or result a wrong value. If the influence coefficient matrix is ill
conditioned, it is possible to identify the least independent columns in the matrix
and eliminate them. This can be done by using Gram-Schmidt orthogonalisation
method identified by Darlow[83].
On the test rig, there are three balancing planes which trial masses can be
mounted onto, a 7 gram mass was chosen to be the first trial mass, it can only be
mounted on the disk balancing holes. Due to the orientation difference on
balancing disks, the trial masses are expressed in complex number format
iWiW
iW
t
t
t
95.495.463.51145.4
82.5889.3
3
2
1
+=
+=
+=
(E.15)
The rotor vibration results were recorded when it was set to run at around 2000
rpm and 2400 rpm respectively. The influence coefficient matrix has been found
to be
⎥⎥⎥⎥
⎦
⎤
⎢⎢⎢⎢
⎣
⎡
−−+−+−−−−−+−+−−−
=
iiiiii
iiiiii
0094.00108.00009.00036.00043.00057.00117.00069.00042.00049.00129.00146.0
0035.00058.00004.00021.00012.00023.00026.00025.0001.0003.00028.00075.0
β (E.16)
The rotor position in x and y direction were measured when the rotor pass the
same datum position every time. The measurement were taken over several
cycles, the average results form a displacement vector as
⎥⎥⎥⎥
⎦
⎤
⎢⎢⎢⎢
⎣
⎡
+−−+−−
=
ii
ii
0287.0032.00352.00299.0
0184.00191.00333.00086.0
q (E.17)
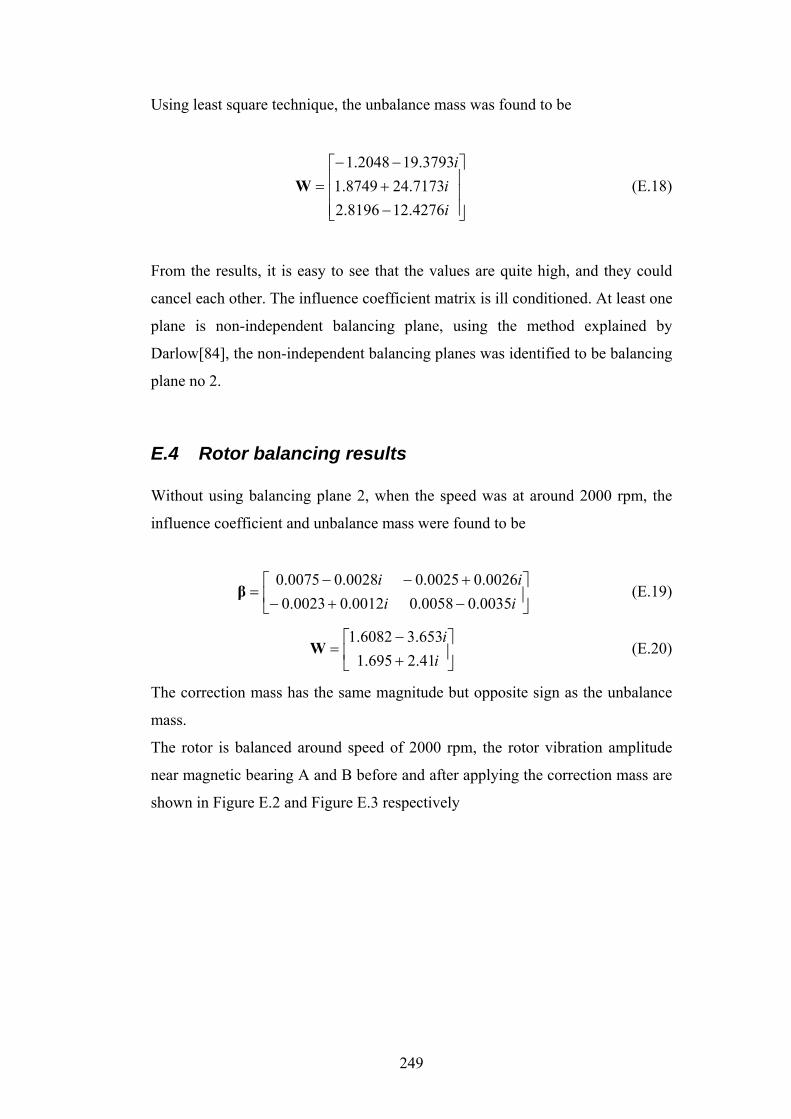
249
Using least square technique, the unbalance mass was found to be
⎥⎥⎥
⎦
⎤
⎢⎢⎢
⎣
⎡
−+−−
=ii
i
4276.128196.27173.248749.1
3793.192048.1W (E.18)
From the results, it is easy to see that the values are quite high, and they could
cancel each other. The influence coefficient matrix is ill conditioned. At least one
plane is non-independent balancing plane, using the method explained by
Darlow[84], the non-independent balancing planes was identified to be balancing
plane no 2.
E.4 Rotor balancing results Without using balancing plane 2, when the speed was at around 2000 rpm, the
influence coefficient and unbalance mass were found to be
⎥⎦
⎤⎢⎣
⎡−+−+−−
=iiii
0035.00058.00012.00023.00026.00025.00028.00075.0
β (E.19)
⎥⎦
⎤⎢⎣
⎡+−
=i
i41.2695.1653.36082.1
W (E.20)
The correction mass has the same magnitude but opposite sign as the unbalance
mass.
The rotor is balanced around speed of 2000 rpm, the rotor vibration amplitude
near magnetic bearing A and B before and after applying the correction mass are
shown in Figure E.2 and Figure E.3 respectively
250
0 0.2 0.4 0.6 0.80
0.01
0.02
0.03
0.04
0.05
0.06
Time (s)
Dis
plac
emen
t (m
m)
UnbalancedBalanced
Figure E.2 Rotor radial displacement at magnetic bearing A position before
and after applying correction masses at rotational speed of 2000 rpm
0 0.2 0.4 0.6 0.80
0.01
0.02
0.03
0.04
0.05
Time (s)
Dis
plac
emen
t (m
m)
UnbalancedBalanced
Figure E.3 Rotor radial displacement at magnetic bearing B position before
and after applying correction masses at rotational speed of 2000 rpm
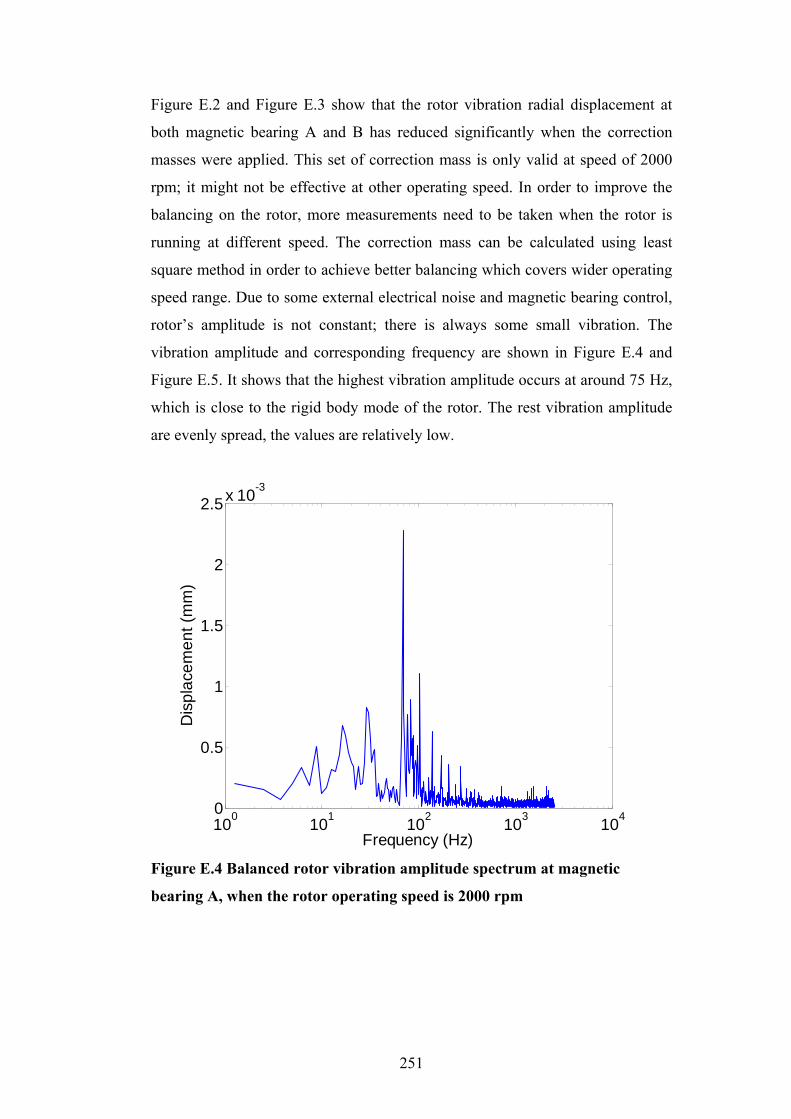
251
Figure E.2 and Figure E.3 show that the rotor vibration radial displacement at
both magnetic bearing A and B has reduced significantly when the correction
masses were applied. This set of correction mass is only valid at speed of 2000
rpm; it might not be effective at other operating speed. In order to improve the
balancing on the rotor, more measurements need to be taken when the rotor is
running at different speed. The correction mass can be calculated using least
square method in order to achieve better balancing which covers wider operating
speed range. Due to some external electrical noise and magnetic bearing control,
rotor’s amplitude is not constant; there is always some small vibration. The
vibration amplitude and corresponding frequency are shown in Figure E.4 and
Figure E.5. It shows that the highest vibration amplitude occurs at around 75 Hz,
which is close to the rigid body mode of the rotor. The rest vibration amplitude
are evenly spread, the values are relatively low.
100 101 102 103 1040
0.5
1
1.5
2
2.5x 10⁻³
Frequency (Hz)
Dis
plac
emen
t (m
m)
Figure E.4 Balanced rotor vibration amplitude spectrum at magnetic
bearing A, when the rotor operating speed is 2000 rpm

252
100 101 102 103 1040
0.2
0.4
0.6
0.8
1
1.2x 10⁻³
Frequency (Hz)
Dis
plac
emen
t (m
m)
Figure E.5 Balanced rotor vibration amplitude spectrum at magnetic
bearing B, when the rotor operating speed is 2000 rpm
The initial trial speed of 2000 rpm and 2400 rpm are below the first critical speed,
in order for the balancing mass to cover a wider operating range, another trial
speed was chosen to be 3500 rpm which is above the rotor first critical frequency.
The trial mass was reduced to 3.8 grams, as the rotor might make contact with
the touchdown bearing if the trial mass is too heavy. The new trial mass is
expressed in the complex format as below:
iWiW
W
t
t
t
3.8-0.000
3.16i + 2.11
3
2
1
=
+=
=
(E.21)
The newly calculated influence coefficient at 3500 rpm becomes
⎥⎦
⎤⎢⎣
⎡−++−−−
=iiii
0099.00000.00384.00255.00185.00124.00231.00154.0
β (E.22)
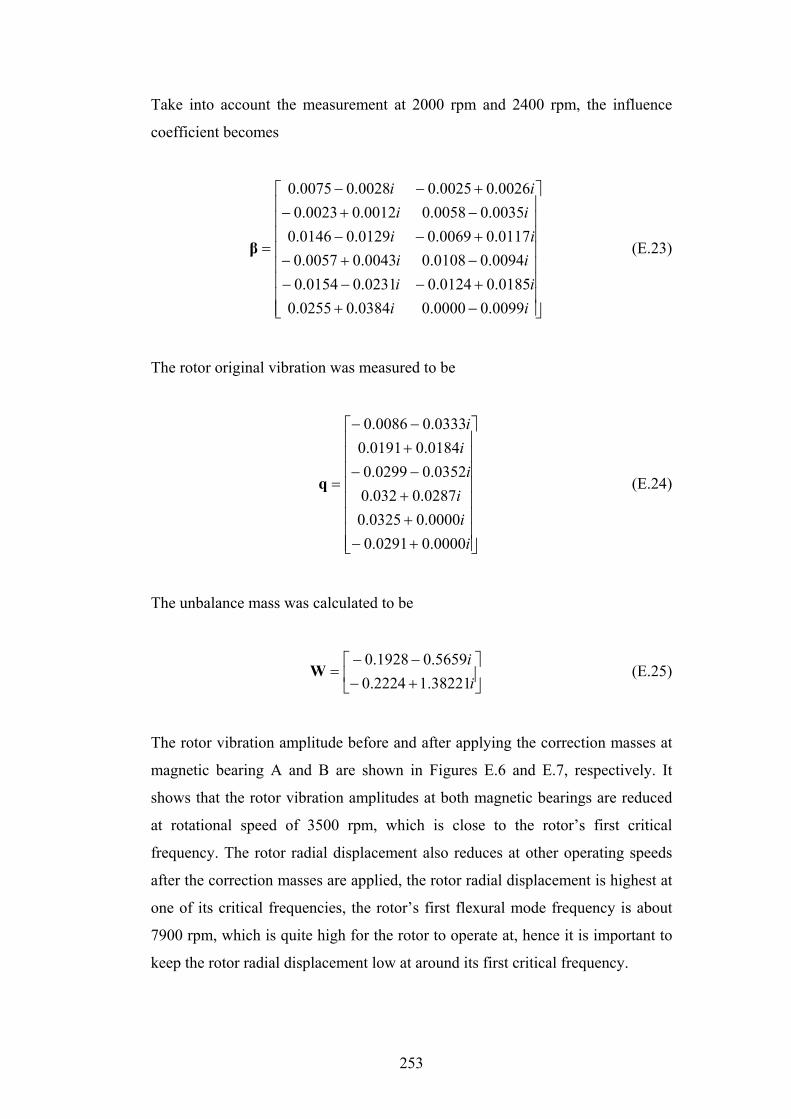
253
Take into account the measurement at 2000 rpm and 2400 rpm, the influence
coefficient becomes
⎥⎥⎥⎥⎥⎥⎥⎥
⎦
⎤
⎢⎢⎢⎢⎢⎢⎢⎢
⎣
⎡
−++−−−−+−+−−−+−+−−
=
iiii
iiii
iiii
0099.00000.00384.00255.00185.00124.00231.00154.0
0094.00108.00043.00057.00117.00069.00129.00146.0
0035.00058.00012.00023.00026.00025.00028.00075.0
β (E.23)
The rotor original vibration was measured to be
⎥⎥⎥⎥⎥⎥⎥⎥
⎦
⎤
⎢⎢⎢⎢⎢⎢⎢⎢
⎣
⎡
+−++−−+−−
=
iii
iii
0000.00291.00000.00325.00287.0032.0
0352.00299.00184.00191.00333.00086.0
q (E.24)
The unbalance mass was calculated to be
⎥⎦
⎤⎢⎣
⎡+−−−
=ii
38221.12224.05659.01928.0
W (E.25)
The rotor vibration amplitude before and after applying the correction masses at
magnetic bearing A and B are shown in Figures E.6 and E.7, respectively. It
shows that the rotor vibration amplitudes at both magnetic bearings are reduced
at rotational speed of 3500 rpm, which is close to the rotor’s first critical
frequency. The rotor radial displacement also reduces at other operating speeds
after the correction masses are applied, the rotor radial displacement is highest at
one of its critical frequencies, the rotor’s first flexural mode frequency is about
7900 rpm, which is quite high for the rotor to operate at, hence it is important to
keep the rotor radial displacement low at around its first critical frequency.
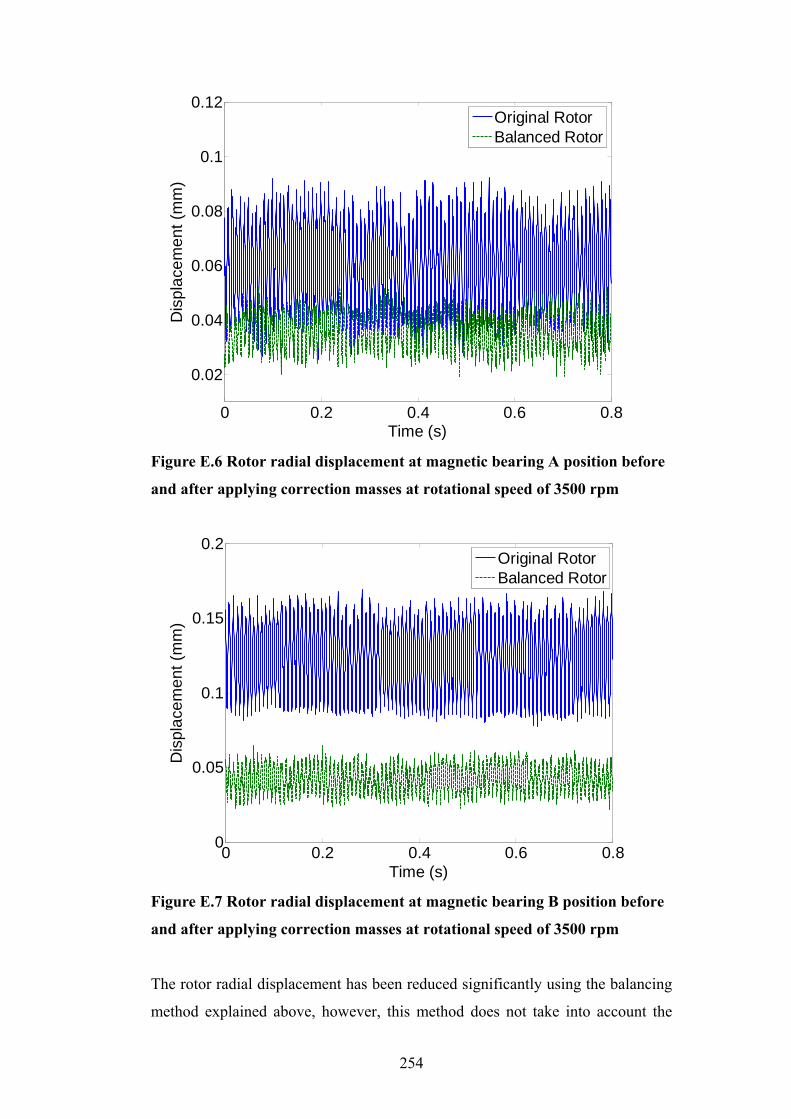
254
0 0.2 0.4 0.6 0.8
0.02
0.04
0.06
0.08
0.1
0.12
Time (s)
Dis
plac
emen
t (m
m)
Original RotorBalanced Rotor
Figure E.6 Rotor radial displacement at magnetic bearing A position before
and after applying correction masses at rotational speed of 3500 rpm
0 0.2 0.4 0.6 0.80
0.05
0.1
0.15
0.2
Time (s)
Dis
plac
emen
t (m
m)
Original RotorBalanced Rotor
Figure E.7 Rotor radial displacement at magnetic bearing B position before
and after applying correction masses at rotational speed of 3500 rpm
The rotor radial displacement has been reduced significantly using the balancing
method explained above, however, this method does not take into account the
255
noise in the system and it is less effective when the rotor orbit is elliptical by
taking rotor displacement measurement at one point. Hence, the balancing mass
was calculated again by using the data recorded in one complete revolution. The
vibration amplitude and phase for all four sensors are obtained using fast Fourier
transform (FFT) before and after the trial mass was added, and then the influence
coefficient can be calculated.
⎥⎥⎥⎥⎥⎥⎥⎥⎥⎥⎥⎥⎥⎥⎥⎥⎥
⎦
⎤
⎢⎢⎢⎢⎢⎢⎢⎢⎢⎢⎢⎢⎢⎢⎢⎢⎢
⎣
⎡
=
0.0327i - 0.0589-0.0137i - 0.00720.0385i + 0.0118-0.0014i - 0.0045-0.0262i - 0.0138-0.0144i - 0.0224-0.0010i + 0.0131-0.0222i + 0.0166-
0.0060i - 0.01370.0022i + 0.0082-0.0106i - 0.0079-0.0056i + 0.00390.0076i + 0.0110-0.0073i - 0.02250.0047i + 0.00890.0145i - 0.0110-0.0021i - 0.00610.0008i + 0.0029-0.0052i - 0.0028-0.0020i + 0.00090.0019i + 0.0042-0.0011i - 0.00880.0025i + 0.00200.0081i - 0.0029-
β (E.26)
The original rotor vibration amplitude and phase for all four sensors at each
speed can be expressed in complex format below; the results were obtained by
taking FFT for each sensor signal in one rotational revolution.
⎥⎥⎥⎥⎥⎥⎥⎥⎥⎥⎥⎥⎥⎥⎥⎥⎥
⎦
⎤
⎢⎢⎢⎢⎢⎢⎢⎢⎢⎢⎢⎢⎢⎢⎢⎢⎢
⎣
⎡
=
0.1362i - 0.06900.0265i - 0.0886-
0.0523i - 0.05920.0319i - 0.0116-0.0389i + 0.02710.0351i - 0.03140.0527i - 0.0263-0.0342i + 0.0362-
0.0229i + 0.01850.0189i - 0.01980.0344i - 0.0052-0.0120i + 0.0326-
q (E.27)

256
The unbalance mass was calculated to be
⎥⎦
⎤⎢⎣
⎡+−
=ii
4891.21169.04544.00767.0
W (E.28)
The correction masses, which are the negative of the unbalance masses, are
applied on to the correct balancing planes. The rotor radial displacement at
magnetic bearing A and B before and after applying the correction masses are
shown in Figures E.8 and E.9, respectively, when the rotor rotating speed is 3500
rpm. It shows the rotor radial displacements at both magnetic bearings have been
reduced more significantly compared to the previous results shown in Figures
E.6 and E.7.
0 0.2 0.4 0.6 0.80
0.02
0.04
0.06
0.08
0.1
0.12
Time (s)
Dis
plac
emen
t (m
m)
Original RotorBalanced Rotor
Figure E.8 Rotor radial displacement at magnetic bearing A position before
and after applying correction masses, the rotor rotational speed is 3500 rpm

257
0 0.2 0.4 0.6 0.80
0.05
0.1
0.15
0.2
Time (s)
Dis
plac
emen
t (m
m)
Original RotorBalanced Rotor
Figure E.9 Rotor radial displacement at magnetic bearing B position before
and after applying correction, the rotor rotational speed is 3500 rpm

258
Appendix F Rotor and bearing contact release
0 2 4 6 8 100
0.1
0.2
0.3
0.4
0.5
Time (s)
Rad
ial D
ispl
acem
ent (
mm
)
Figure F.1 Rotor radial displacement at magnetic bearing B at rotational
speed of 447 rad/s. Active touchdown bearing control with 90 degrees phase
lead was applied to bring rotor out of contact
0 2 4 6 8 100
0.1
0.2
0.3
0.4
0.5
Time (s)
Rad
ial D
ispl
acem
ent (
mm
)
Figure F.2 Rotor radial displacement at magnetic bearing B at rotational
speed of 447 rad/s. Active touchdown bearing control with 60 degrees phase
lead was applied to bring rotor out of contact
Clearance
Clearance

259
0 2 4 6 8 100
0.1
0.2
0.3
0.4
0.5
Time (s)
Rad
ial D
ispl
acem
ent (
mm
)
Figure F.3 Rotor radial displacement at magnetic bearing B at rotational
speed of 447 rad/s. Active touchdown bearing control with 40 degrees phase
lag was applied to bring rotor out of contact
0 2 4 6 8 100
0.1
0.2
0.3
0.4
0.5
Time (s)
Rad
ial D
ispl
acem
ent (
mm
)
Figure F.4 Rotor radial displacement at magnetic bearing B at rotational
speed of 447 rad/s. Active touchdown bearing control with 60 degrees phase
lag was applied to bring rotor out of contact
Clearance
Clearance

260
0 2 4 6 8 100
0.1
0.2
0.3
0.4
0.5
Time (s)
Rad
ial D
ispl
acem
ent (
mm
)
Figure F.5 Rotor radial displacement at magnetic bearing B at rotational
speed of 447 rad/s. Active touchdown bearing control with 80 degrees phase
lag was applied to bring rotor out of contact
0 2 4 6 8 100
0.1
0.2
0.3
0.4
0.5
Time (s)
Rad
ial D
ispl
acem
ent (
mm
)
Figure F.6 Rotor radial displacement at magnetic bearing B at rotational
speed of 433 rad/s. Active touchdown bearing control with 40 degrees phase
lead was applied to bring rotor out of contact
Clearance
Clearance
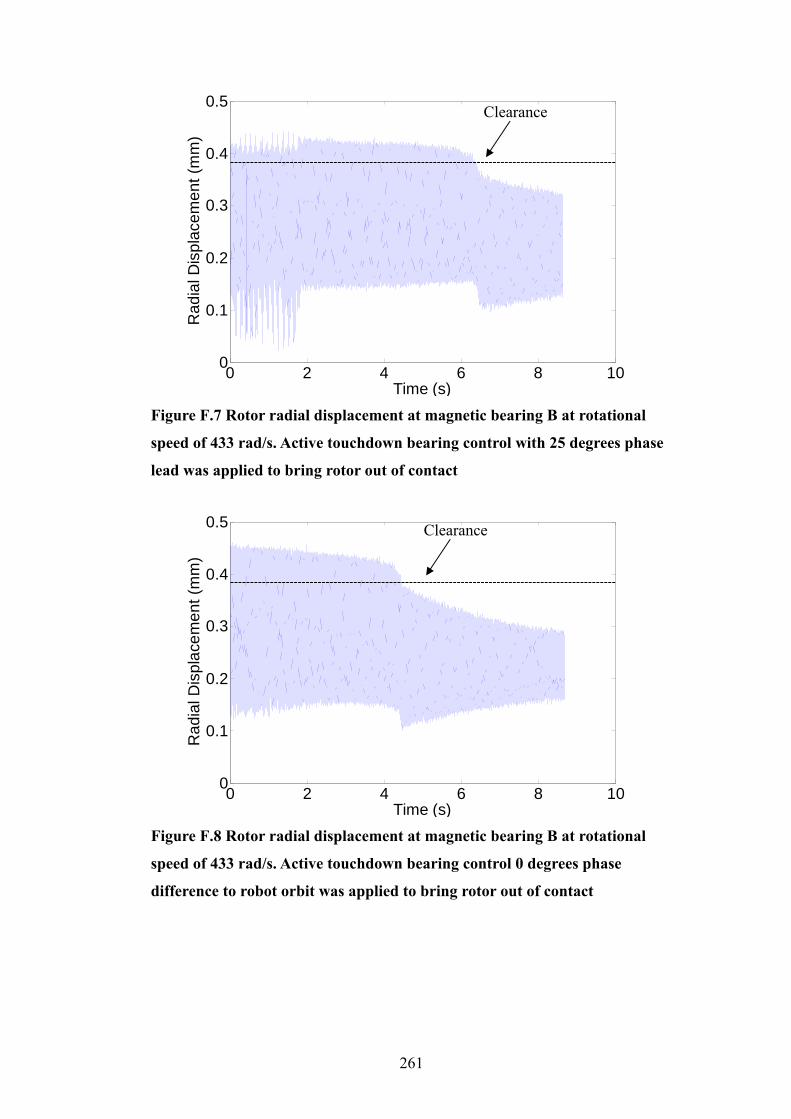
261
0 2 4 6 8 100
0.1
0.2
0.3
0.4
0.5
Time (s)
Rad
ial D
ispl
acem
ent (
mm
)
Figure F.7 Rotor radial displacement at magnetic bearing B at rotational
speed of 433 rad/s. Active touchdown bearing control with 25 degrees phase
lead was applied to bring rotor out of contact
0 2 4 6 8 100
0.1
0.2
0.3
0.4
0.5
Time (s)
Rad
ial D
ispl
acem
ent (
mm
)
Figure F.8 Rotor radial displacement at magnetic bearing B at rotational
speed of 433 rad/s. Active touchdown bearing control 0 degrees phase
difference to robot orbit was applied to bring rotor out of contact
Clearance
Clearance

262
0 2 4 6 8 100
0.1
0.2
0.3
0.4
0.5
Time (s)
Rad
ial D
ispl
acem
ent (
mm
)
Figure F.9 Rotor radial displacement at magnetic bearing B at rotational
speed of 433 rad/s. Active touchdown bearing control with 20 degrees phase
lag was applied to bring rotor out of contact
0 2 4 6 8 100
0.1
0.2
0.3
0.4
0.5
Time (s)
Rad
ial D
ispl
acem
ent (
mm
)
Figure F.10 Rotor radial displacement at magnetic bearing B at rotational
speed of 425 rad/s. Active touchdown bearing control with 20 degrees phase
lead was applied to bring rotor out of contact
Clearance
Clearance
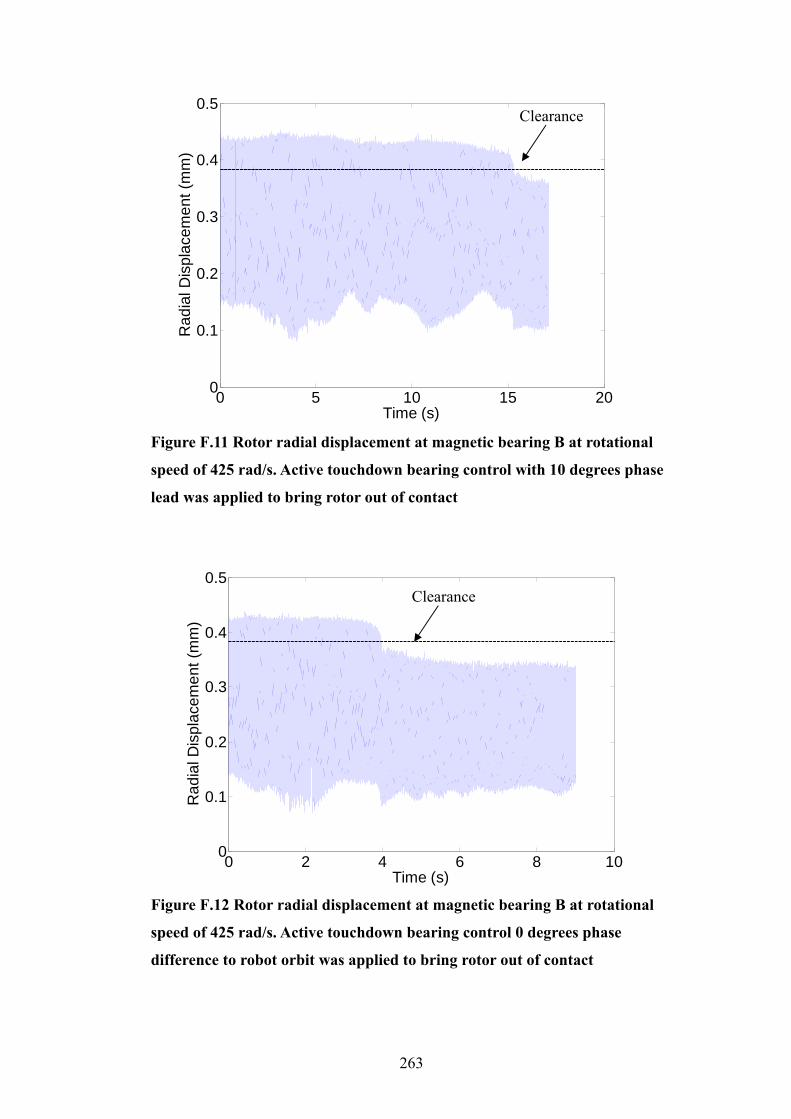
263
0 5 10 15 200
0.1
0.2
0.3
0.4
0.5
Time (s)
Rad
ial D
ispl
acem
ent (
mm
)
Figure F.11 Rotor radial displacement at magnetic bearing B at rotational
speed of 425 rad/s. Active touchdown bearing control with 10 degrees phase
lead was applied to bring rotor out of contact
0 2 4 6 8 100
0.1
0.2
0.3
0.4
0.5
Time (s)
Rad
ial D
ispl
acem
ent (
mm
)
Figure F.12 Rotor radial displacement at magnetic bearing B at rotational
speed of 425 rad/s. Active touchdown bearing control 0 degrees phase
difference to robot orbit was applied to bring rotor out of contact
Clearance
Clearance
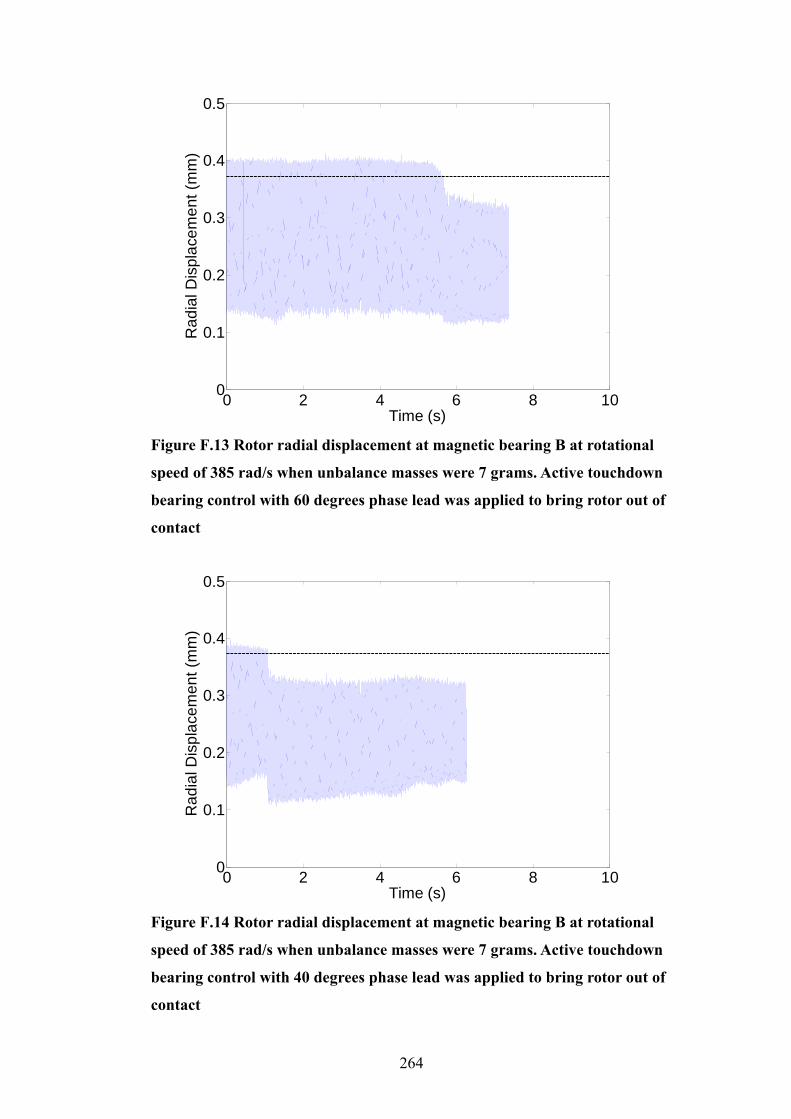
264
0 2 4 6 8 100
0.1
0.2
0.3
0.4
0.5
Time (s)
Rad
ial D
ispl
acem
ent (
mm
)
Figure F.13 Rotor radial displacement at magnetic bearing B at rotational
speed of 385 rad/s when unbalance masses were 7 grams. Active touchdown
bearing control with 60 degrees phase lead was applied to bring rotor out of
contact
0 2 4 6 8 100
0.1
0.2
0.3
0.4
0.5
Time (s)
Rad
ial D
ispl
acem
ent (
mm
)
Figure F.14 Rotor radial displacement at magnetic bearing B at rotational
speed of 385 rad/s when unbalance masses were 7 grams. Active touchdown
bearing control with 40 degrees phase lead was applied to bring rotor out of
contact
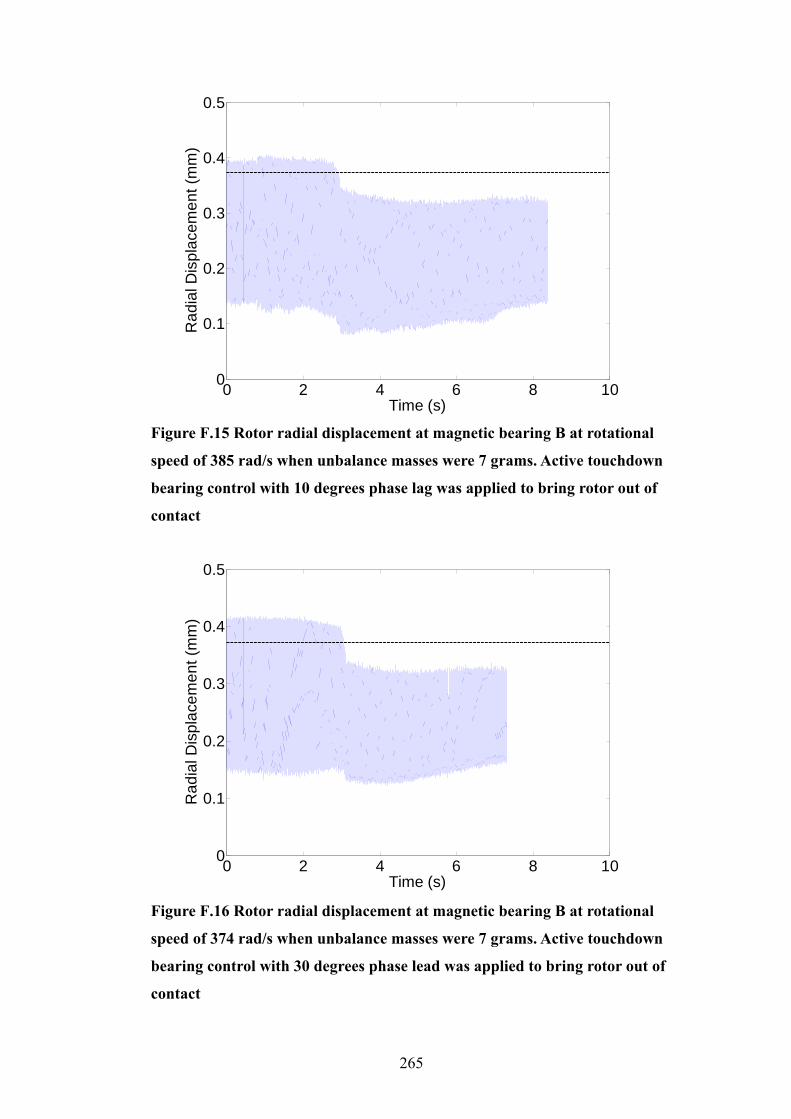
265
0 2 4 6 8 100
0.1
0.2
0.3
0.4
0.5
Time (s)
Rad
ial D
ispl
acem
ent (
mm
)
Figure F.15 Rotor radial displacement at magnetic bearing B at rotational
speed of 385 rad/s when unbalance masses were 7 grams. Active touchdown
bearing control with 10 degrees phase lag was applied to bring rotor out of
contact
0 2 4 6 8 100
0.1
0.2
0.3
0.4
0.5
Time (s)
Rad
ial D
ispl
acem
ent (
mm
)
Figure F.16 Rotor radial displacement at magnetic bearing B at rotational
speed of 374 rad/s when unbalance masses were 7 grams. Active touchdown
bearing control with 30 degrees phase lead was applied to bring rotor out of
contact
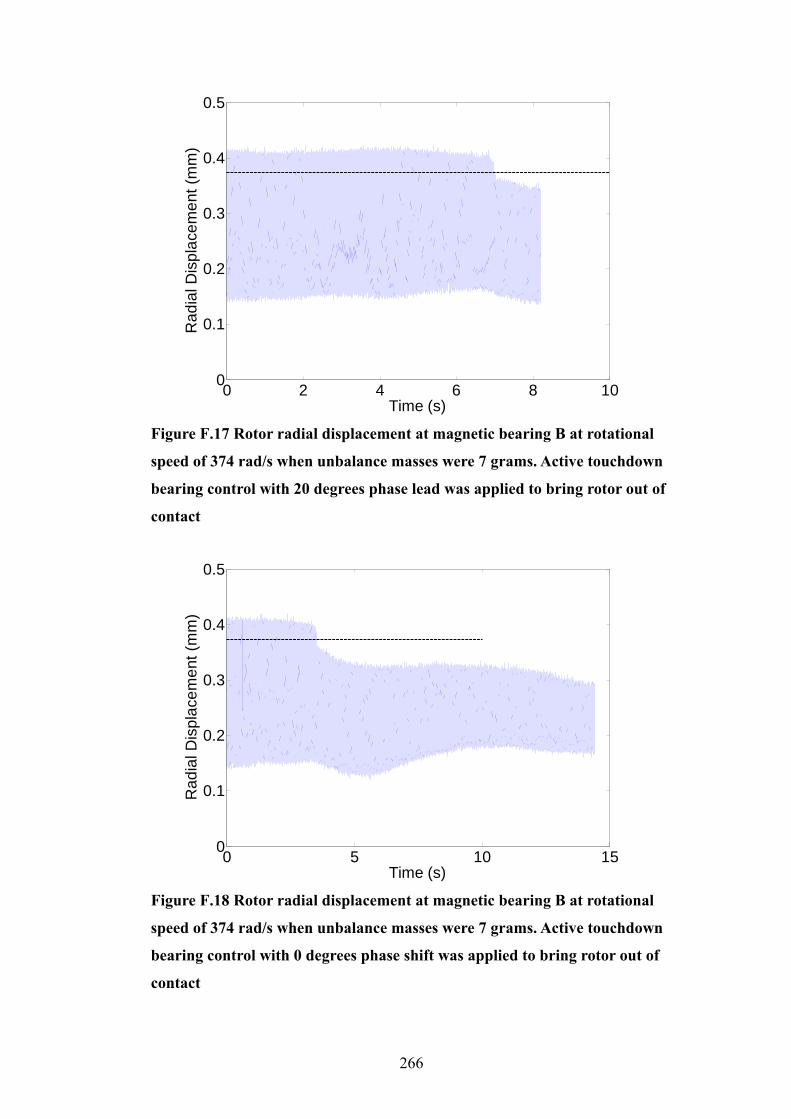
266
0 2 4 6 8 100
0.1
0.2
0.3
0.4
0.5
Time (s)
Rad
ial D
ispl
acem
ent (
mm
)
Figure F.17 Rotor radial displacement at magnetic bearing B at rotational
speed of 374 rad/s when unbalance masses were 7 grams. Active touchdown
bearing control with 20 degrees phase lead was applied to bring rotor out of
contact
0 5 10 150
0.1
0.2
0.3
0.4
0.5
Time (s)
Rad
ial D
ispl
acem
ent (
mm
)
Figure F.18 Rotor radial displacement at magnetic bearing B at rotational
speed of 374 rad/s when unbalance masses were 7 grams. Active touchdown
bearing control with 0 degrees phase shift was applied to bring rotor out of
contact

267
Appendix G Rotor critical speed calculation
The rotor’s critical speeds are calculated using finite element analysis method
explained in Chapter 3. Its calculation is based on the system characteristic
matrices (M and K matrices), then the rotor’s critical speeds are calculated by
taken eigenvalues of K/M. All the calculations are done in Matlab, the Matlab
code is attached below. [V,D]=eig(inv(M)*K); % eigenvalue calculation w=sqrt(diag(D)); % speed in rad/s freq=w/2/pi; % frequency calculation
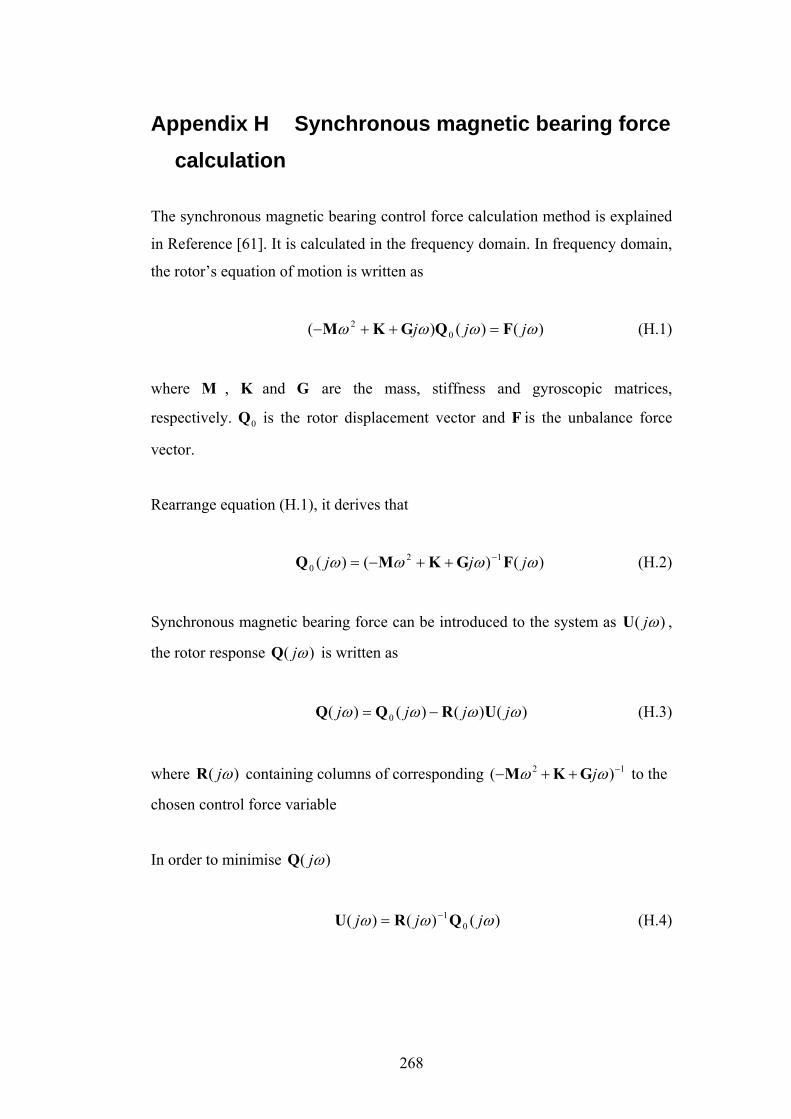
268
Appendix H Synchronous magnetic bearing force calculation
The synchronous magnetic bearing control force calculation method is explained
in Reference [61]. It is calculated in the frequency domain. In frequency domain,
the rotor’s equation of motion is written as
)()()( 02 ωωωω jjj FQGKM =++− (H.1)
where M , K and G are the mass, stiffness and gyroscopic matrices,
respectively. 0Q is the rotor displacement vector and F is the unbalance force
vector.
Rearrange equation (H.1), it derives that
)()()( 120 ωωωω jjj FGKMQ −++−= (H.2)
Synchronous magnetic bearing force can be introduced to the system as )( ωjU ,
the rotor response )( ωjQ is written as
)()()()( 0 ωωωω jjjj URQQ −= (H.3)
where )( ωjR containing columns of corresponding 12 )( −++− ωω jGKM to the
chosen control force variable
In order to minimise )( ωjQ
)()()( 01 ωωω jjj QRU −= (H.4)