activity 4: locating vent fields using ctd data · vent plumes is the ctd (conductivity-...
TRANSCRIPT

Overview:This lesson applies the concepts from the previous lessons to the task
of actually locating vent regions by remotely collecting water tempera-ture and density data from the ocean floor. In this activity, students simu-late the task of locating hydrothermal vents on the Juan de Fuca ridge.Students examine a series of actual temperature and density graphs andcompare them to known ambient ocean floor conditions. They look forclues that something differentis happening below. When con-ditions change, students exam-ine the differences, developexplanations for the differencesand note the location so Alvincan go down and verify thepresence of vents.
Background:One instrument that scien-
tists use to locate hydrothermalvent plumes is the CTD(Conductivity- Temperature -Depth) instrument. There aretwo methods used to studyhydrothermal plumes with thisinstrument from the ship:
A) Lowering a CTD in a seriesof vertical “casts.”
Essential Concept:HTVs can be located by looking for
variations in Conductivity,Temperature and Density.
Learning Objectives:Students will be able to:
• explain how data from CTDsensors are used to locatehydrothermal vents.
• read data from CTD sensorsand predict when an HTVis present.
• describe how a hydrothermalvent works.
• make observations & infer-ences from graphs.
National Standards:• Unifying concepts and processes:
• Evidence, models and expla-nation
• Physical Science• Properties and changes of
properties in matter• Transfer of energy
• Earth and Space Science:• Structure of the earth system
Materials• CTD Graphs• Set up 6 “Waypoint” stations
using the graphs
Activity 4: Locating Vent Fields Using CTD Data
Cruise 3 - Activity 4 - Page 1
SEASStudent Experiments At Sea

B) Raising and lowering the CTD while slowly towing it from the ship,called a “Tow-Yo.”
Information about the characteristics of the seawater is sent to the ship’scomputer lab through cables where scientists analyze it to determine if infact a hydrothermal vent site is below. They capture water samples foronboard analysis and when the right pieces of the puzzle come together, adive plan is prepared for Alvin.
Development of Lesson (Steps):1. Explain to students that we will simulate actual events of a cruise to theJuan de Fuca ridge and the search for new hydrothermal vents. You maywant to point out the location on the Ridge Multibeam Synthesis ProjectWorld Map (cruise 2, activity 2). It is the area outlined by the green boxlabeled Northeast Pacific Ridge.
2. Arrange students in groups around the room forming six stations that willserve as “waypoints” or spots where the ship does the “Tow-Yo” casts.
3. Display Graph 1.Explain that the graphindicates temperature anddensity and is used to scanfor anomalies.
• The blue line showstemperatureanomalies (i.e.irregularities). Inocean water whereno plume is pre-sent, we expect theblue line to extend
Resources:RevelTo follow the REVEL voyage to
the Juan de Fuca plate onwhich science teacher CindyMaldanado participated incollecting the data the stu-dents will be using check outSeptember 5, 6 and 7 at
http://www.ocean.washington.edu/outreach/revel00/sublogbooktext.html
Dive and DiscoverCTD For a great real life explanation
about what CTD sensor crewsdo visit the HydrothermalVent Prospecting Team pageon Hot topics [Expedition 4-7:Daily Update: Hot Topics:Hydrothermal VentProspecting Team]
MAPRMAPRs are instruments that col-
lect similar information andhelp to locate HTVs more onMAPRs can be found in HotTopics as well [Expedition 3-7:Daily Update : Hot Topics:Finding Telltale HydrothermalPlumes With MAPRs(Miniature AutonomousPlume Recorders]
http://www.divediscover.whoi.edu/American Museum of Natural
History: Resources forLearning
This site offers an opportunity todo a simulated search for ahydrothermal vent.
http://www.amnh.org/education/resources/card_frame.php?rid=756&rurlid=733
Activity 4 (cont.):
SEASStudent Experiments At Sea
Cruise 3 - Activity 4 - Page 2

down the graph with only slight squiggles indicating no significant temperature changes or anomalies.If the line spikes, indicating an increase in temperature, we are near a plume.
• The green line shows density, which is a measure of salinity and temperature combined. In oceans, thedenser (saltier) water is at the bottom. In ocean water where no plume is present, we expect this densityline to move from left to right across the graph signifying an increase in density with depth. HTV fluidsare less dense than surrounding seawater and therefore rise, until they reach a point in the water columnwhere the surrounding seawater density is the same. This point is called the neutrally buoyant point. Ifthe density line inverts (i.e. changes direction), we have hit a pocket of water that is less dense and islikely a plume of rising vent fluids.
When both of these trends are broken, we have evidence of hydrothermal vent activity.
3. Distribute graphs for waypoints 1-6 to the six stations, instructing students not to reveal them until we reachthat waypoint with our ship.
4. Direct the following enactment of the ship’s night activities with the students:
Since we are on a ship that never sleeps and our days are busy with Alvin dives, we spend our nights in search ofnew hydrothermal vent sites. The captain moves the ship to waypoint 1 and we lower the CTD package over theside of the ship and down towards the seafloor.
WAYPOINT 1
Have students at waypoint 1 reveal their graph and discusswhether or not there is evidence of hydrothermal vent activity.
(Nothing is happening here. The temperature and density linesare as expected without the presence of venting.)
Raise the CTD to 1800 m and instruct the ship’s captain to con-tinue to waypoint 2.
WAYPOINT 2
Lower the CTD to 2150 m and analyze the graph as the CTDdescends.
Have students at waypoint 2 reveal their graph and discusswhether or not there is evidence of hydrothermal vent activity.
(There is a jump in the temperature graph indicating that somewarm water has been detected, but the density graph showsnothing unexpected.)
Again raise the CTD to 1800 m and instruct the ship’s captain tomove on to waypoint 3.
Activity 4 (cont.):
Cruise 3 - Activity 4 - Page 3
SEASStudent Experiments At Sea
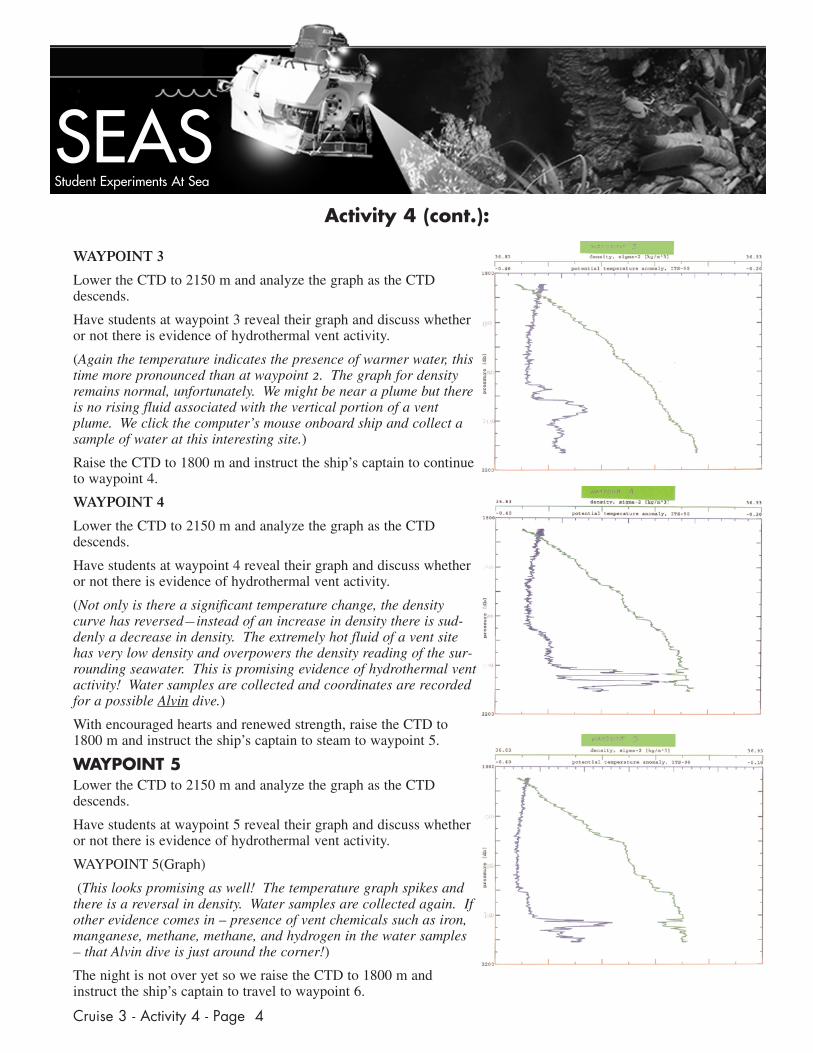
WAYPOINT 3
Lower the CTD to 2150 m and analyze the graph as the CTDdescends.
Have students at waypoint 3 reveal their graph and discuss whetheror not there is evidence of hydrothermal vent activity.
(Again the temperature indicates the presence of warmer water, thistime more pronounced than at waypoint 2. The graph for densityremains normal, unfortunately. We might be near a plume but thereis no rising fluid associated with the vertical portion of a ventplume. We click the computer’s mouse onboard ship and collect asample of water at this interesting site.)
Raise the CTD to 1800 m and instruct the ship’s captain to continueto waypoint 4.
WAYPOINT 4
Lower the CTD to 2150 m and analyze the graph as the CTDdescends.
Have students at waypoint 4 reveal their graph and discuss whetheror not there is evidence of hydrothermal vent activity.
(Not only is there a significant temperature change, the densitycurve has reversed—instead of an increase in density there is sud-denly a decrease in density. The extremely hot fluid of a vent sitehas very low density and overpowers the density reading of the sur-rounding seawater. This is promising evidence of hydrothermal ventactivity! Water samples are collected and coordinates are recordedfor a possible Alvin dive.)
With encouraged hearts and renewed strength, raise the CTD to1800 m and instruct the ship’s captain to steam to waypoint 5.
WAYPOINT 5Lower the CTD to 2150 m and analyze the graph as the CTDdescends.
Have students at waypoint 5 reveal their graph and discuss whetheror not there is evidence of hydrothermal vent activity.
WAYPOINT 5(Graph)
(This looks promising as well! The temperature graph spikes andthere is a reversal in density. Water samples are collected again. Ifother evidence comes in – presence of vent chemicals such as iron,manganese, methane, methane, and hydrogen in the water samples– that Alvin dive is just around the corner!)
The night is not over yet so we raise the CTD to 1800 m andinstruct the ship’s captain to travel to waypoint 6.
Activity 4 (cont.):
SEASStudent Experiments At Sea
Cruise 3 - Activity 4 - Page 4

WAYPOINT 6
Lower the CTD to 2150 m and analyze the graph as the CTDdescends.
Have students at waypoint 6 reveal their graph and discusswhether or not there is evidence of hydrothermal vent activity.
(There is a tiny temperature anomaly but nothing to get excitedabout as the density graph moves along as expected.)
Having found two promising sites, we call it a night!
(Graphs are from REVEL 2000 Cruise 2 (September 1 – 20,2000). Marv Lilley of University of Washington’s School ofOceanography was in charge of CTD activities. Brian Kristall,also at Univ. of Washington helped decipher the graphs.)
Discussion Questions: 1. You have an opportunity to take Alvin for a dive on just one site. Where will you go and what evidencegained through CTD operations supports your choice? (we’d recommend going for waypoint 4 or 5 since boththe temperature spiked and the density inverted.)
2. What other evidence would you like to support your decision? (water samples indicating the presence of min-erals common in vent fluids)
3. What do you expect to see when you reach the seafloor? (a Hydrothermal Vent)
4. Why do we need to measure both temperature and density? (The vent plume will rise until it reaches neutralbuoyancy at which point it will level out and move horizontally. This portion of the plume is still hot, but is nolonger rising. The CTD instrument would register a temperature anomaly but no density anomaly, indicatingthat the instrument is not directly OVER the vent but away from it at some distance. We’re near but we need tokeep searching.)
Extensions: Try your hand at using the CTD to find a hydrothermal vent on the Juan de Fuca Ridge.
http://www.amnh.org/education/resources/card_index.php?rid=756
Activity 4 (cont.):
Cruise 3 - Activity 4 - Page 5
SEASStudent Experiments At Sea