activity-based standard costing product-mix decision in
TRANSCRIPT
sustainability
Article
Activity-Based Standard Costing Product-MixDecision in the Future Digital Era: Green RecyclingSteel-Scrap Material for Steel Industry
Wen-Hsien Tsai *, Shu-Hui Lan and Cheng-Tsu Huang
Department of Business Administration, National Central University, Jhongli, Taoyuan 32001, Taiwan;[email protected] (S.-H.L.); [email protected] (C.-T.H.)* Correspondence: [email protected]; Tel.: +886-3-426-7247; Fax: +886-3-422-2891
Received: 21 December 2018; Accepted: 5 February 2019; Published: 10 February 2019
Abstract: According to the advanced technologies of digitalization and automation, theinterconnection with each individual object is created from data acquisitions into data feedbackin the integrated platform of the Manufacturing Execution System (MES). MES automatically andimmediately links various functional systems. The time of electronic production management iscoming soon, and Activity-Based Standard Costing (ABSC) will be used in the new era. On theother hand, there are environmental protection issues; thus, the high-tech method of the Electric ArcFurnace (EAF) uses the complicated recycling material of steel-scrap, which hypothetically enhancesproduct-mix decisions, as based on the ABSC theory, with a mathematical programming approach.
Keywords: Activity-Based Standard Costing (ABSC); Manufacturing Execution System (MES);Activity-Based Costing (ABC); Enterprise Resource Planning (ERP)
1. Introduction
This study integrates two important issues that have received a lot of attention. One attempts tocreate the Activity-Based Standard Costing (ABSC) theory for the future Digital Era, which followsthe simultaneously automatic technology of Data Acquisition in the Manufacturing Execution System(MES) [1–3]. The other is the environmental protection issue of steel manufacturing [4], as conductedin a steel factory case, which adapts the complicated recycling of steel-scrap material [4,5] and furtherexamines more value-enhancing measures regarding the quantity of the output and profit producedduring the production processes of steel products. Furthermore, we design the various operatingresource parameters of the steel company-related data, which includes the diversified information of apublic steel company report, an interview with a top steel manager, seminars, government agencies,etc., in order to fulfill the ABSC product-mix decision goals of a steel factory case.
Traditionally, the Activity-Based Costing (ABC) development was from Cooper and Kaplan (1988)for creating accurate cost management in the accounting field. ABC has been applied to variousindustries and used in efficiency improvement, set-up time reduction, performance measurement,product-mix analysis, and budgeting [3,6]. The ABC theory is applied to activity analyses relatedto factory, company, product, and customer levels [3,7,8] by using the various levels of activities,including unit-, batch-, product-, and facility-level activities [7,8]. The ABC model uses two stagesin cost assignment: (1) to assign resource costs to activities using various resource drivers and (2) toassign activity costs to various cost objects (parts, products, channels, districts, etc.) using variousresource drivers. [3,6,7]. However, while the ABC method has been used in the Enterprise ResourcePlanning (ERP) system for a long time, in the Industry 4.0 environment, there is a huge gap regardinghow to deal with ABC [9–11]. Some researchers have used the five CPS (Cyber-Physical system)
Sustainability 2019, 11, 899; doi:10.3390/su11030899 www.mdpi.com/journal/sustainability

Sustainability 2019, 11, 899 2 of 30
attributes of connection, conversion, cyber, cognition, and configuration to further develop industry4.0 digital environments [1,12,13]. Additionally, Internet of Things (IoT) technology network smartobjects, the internet, and mobile devices [1,9,12] can be automated for real-time data acquisition [1,9,14].In other words, the data of resource drivers and activity drivers consumed by products during allmanufacturing processes can be recorded in real-time using the technologies of sensor-monitoring,the Internet of Things (IoT), CPS, and Manufacturing Execution Systems (MES) under Industry4.0 [1,9,15]. Therefore, Activity-Based Standard Costing (ABSC) is the future trend in cost accountingunder the smart ERP and links the modern MES of Industry 4.0 [10,15]. Practically, the standardsof material, labor, and manufacturing overhead data should be installed into the MES databaseusing the advanced technologies of digitalization before starting production [1,16,17]. All resourcesused in all manufacturing processes should be tracked, and their real-time status data should bedisplayed in the MES system [1,18]. The above technologies and approaches can integrate all activitydata to automatically manage and control production processes in real-time and measure operatingperformance in all operating departments in a digital manner [1,19,20].
Indeed, the functions of MES, including data acquisition and information systems, makeproduction management computerization possible in the digital age [1,2,9]. An MES canautomatically communicate with all subsystems of the enterprise operations management-relatedapplications through a workshop, including resource management, interface management, informationmanagement, personnel management, quality management, data acquisition, data processing, andperformance analysis [1,10,14]. Certainly, MES can easily integrate all production managementsubsystems into its system from data acquisition to data collection, calculation, and storage, aswell as data analysis and data application [2,16,20]. However, creating a powerful MES platformin a manufacturing factory must consider the different industry production models for variousindustries, such as continuous or process manufacturing, batch manufacturing, lot-oriented continuousmanufacturing, or item-oriented manufacturing [2,3,7]. The data acquisition order in any productionline is from resource input, to work-in-process (WIP), to finish goods, and then, the data is tracked,collected, and stored in a timely manner [1,18,20]. Its advantage is the strict control of all the operatingprocesses to execute the standard procedures of each process, which shows real-time reporting,including various management reports and analysis. All data can be stored in the MES system, whichcan be used to control all operating activities for the incoming order, from production planning,machining process, assembly process, quality process, and logistic process [1,2,9]. Importantly, MESplays an integrating role that links various individual function systems for data collection, combination,and evaluation, which will synchronize to perform related tasks regarding interfacing about orders,materials, machines, tools, and the latest status information of personnel [1,10,15]. Smartly, whenthe production process cannot be run according to the original plan, all information is automaticallypooled and appropriately prepared to facilitate good decisions [1,16,18].
In the digital era of global competition, it is noteworthy that MES and ABSC are indivisible andhave become more and more important issues. This paper offers an important future developmentfor the study of the relationship between MES and ABSC. There are two main points of view inthis business strategy. First, in the market-based view, smart business models should be optimizedto communicate with customers, products, and services [9,18,20]. Second, in the resource-basedview, the integration of resources, capabilities, and processes can create smart business strategicdecision capabilities. As all future manufacturing resources can automatically connect and shareinformation, factories will become more intelligent and consciously predict and maintain productionlines by autonomously controlling and managing the machines [1,9,18]. Furthermore, the SmartBusiness Model (SBM) will connect its smart products already sold to customers to monitor productcomponents and provide customers with more services [17–19].
Regarding another issue of environmental protection, the Paris Agreement is an agreement within“the United Nations Framework Convention on Climate Change (UNFCCC)”, which is for mitigatinggas emissions around the world. The 195 UNFCCC members signed the agreement in August 2017 [21].

Sustainability 2019, 11, 899 3 of 30
How to protect the environment has become a very important global issue. This paper introducesthe literature on steelmaking production by using the complex recycled material of steel-scrap, whichlargely replaces the global natural resources of iron ore and coal [5,22].
The traditional steelmaking process of a Blast Furnace (BF) has caused serious air pollutionand water pollution due to the use of the raw materials of iron ore and coking coal [4,5,22]. Themanufacturing process of a BF not only causes severe decay of the natural global resources of ironore and coke but also causes the huge problems of global environmental pollution and gas emission.Fortunately, the development of the modern green manufacturing technology of the Electric ArcFurnace (EAF) replaces the traditional high polluting manufacturing process of a BF; moreover, therecycled raw material of steel-scrap substitutes the natural raw materials of iron ore and coal [4,5,22].An impressive 97% of all global steel product waste can be recycled to achieve an 86% recoveryrate [5,22]. As EAF manufacturing technology can use any kind of steel-scrap as its material andremanufacture any new steel product, steel-scrap has become the greenest material of the steel industry.The transformation of modern EAF steelmaking technology and traditional raw materials replaces theprocesses of mining, ore dressing, coking, and ironmaking to save our natural resources and energy;thus, the steelmaking industry will truly become a natural eco-industry [4,5,22].
In this paper, the first major contribution is to propose a concept of ABSC (Activity-Based StandardCosting) integrated into ERP and MES for achieving efficient production management in a digitalenvironment. Smart ABSC analysis and operations will support smart manufacturing, including workforecasting, status monitoring, WIP tracking, throughput tracking, and capacity feedback for all objectsbecause various standard data (including Material Master and Master Data) are installed into therelated objects prior to the production process. Smartly, each object can automatically display itsinformation and then share its information with the related requesters in a timely manner through thesmart MES platform and the smart subsystem of ERP.
The second major contribution of this study is for environmental protection. The rubbish ofsteel-scrap has become a raw material for producing steel billets (P#1) because of EAF technology.Next, the steel billets (P#1) produce various new steel products, which certainly help to improveenvironmental protection. Moreover, enhancing the value of recycled steel-scrap and improving itsquality can produce more steel billet (P#1) outputs in its process. On the other hand, reusing iron oreand coking coal can significantly reduce mining.
The remainder of this paper is as follows: Section 2 presents the research background including(1) the evolution of cost management from the traditional ABC to the innovative ABSC, (2) how tointegrate functional subsystems into an MES system for immediate and automatic data acquisitionin the system, and (3) a description of the green steelmaking industry. Section 3 creates the ABSCconcept by combining the basic theory of ABC and the standards for the resources and activitiesof MES. Further, it defines ABSC and describes how to automatically calculate the costs of variouscost objects by using the two stages of ABC, where related data can be immediately used for variousmanagerial tasks and decisions, and finally, can build “a powerful MES integrating system“. Section 4describes an ABSC mixed decision model by using mathematical programming for the steelmakingmanufacturing industry. Section 5 discusses an illustrative case study. Finally, a numerical example isprovided to illustrate how to use the model to obtain an optimal solution using LINGO software. InSection 6, a scenario analysis of four cases is used to demonstrate the profit analysis [7,8,23] to achievethe maximum profit for steelmaking production. Finally, the summary and conclusions are presentedin Section 7.
2. Research Background
The era of global high-tech digital is coming. MES systems can automatically and immediatelyintegrate a large amount of software from specific internal functions to external suppliers andcustomers [2,10,18]. A Smart Network and unified interface technologies create a powerful MESintegration system, which automatically connects various independent subsystems via networking

Sustainability 2019, 11, 899 4 of 30
technology and exchanges data in real-time via interfaces [1,9,18]. Moreover, as it can supportsimple input devices, conduct accurate plausibility checks for erroneous inputs, and has convenientinformation use [1,19,20], MES can provide a reliable and available system for productionmanagement [2,9]. However, the readiness of the ABSC model is necessary for the future digital era.
In this steelmaking case, the development of EAF steelmaking technology and the creation ofdemand for recycled steel-scrap materials will effectively improve climate change [4,5,22]. This steelcompany wants to focus on accurately evaluating its relevant production costs, including the costsof the raw steel-scrap material, operating costs, and environmental costs, in order to develop theircore competencies.
2.1. The Evolution from the Traditional ABC to the Innovative ABSC
The traditional ABC was developed around 1988 and has been widely used by most enterprisesuntil now. The accurate cost accounting ability of the ABC model was highly recognized during themass production of Industry 2.0 and the automated production era of Industry 3.0 [7–9]. However,the 4th industrial revolution, which began in Germany in 2011 [13–15], has the aim of reducingmanpower, shortening product lifecycle between design and production, and making efficient useof all resources [10,12]. Industry 4.0 develops towards smart factories, smart products, and smartservices in the Internet of Things (IoT) environment [13,16,17]. In this paper, the innovative ABSCmodel, which is based on the traditional ABC theory, will be used in the future industry 4.0. Thefollowing presents the technological gaps between ABC and ABSC as well as three key points for theinnovative ABSC in the future Industry 4.0 environment.
• CPS: All smart objects can be intelligently connected together and can continuously interchangedata in a timely manner [1,24].
• IoT: The IoT is a ubiquitous virtual infrastructure, also called industrial internet [25,26].• Sensor technology: Smart objects are embedded with various different sensors and can be
perceived, observed, and understood through computers without the need to enter data [10,16,27].
On the other hand, the ABC model has been used in the ERP system for a long time. Assumingthat the ABSC model will be used in the ERP system, we must consider the issue of system integration.For example: (1) Smart data are embedded in the ERP system and can share all smart data to relatedsmart objects before production [10,15]. The system-to-system issue, ERP, and MES system-relateddata issues are from data acquistion to data feedback [15,24,27].
Finally, the ABC model has been adopted by many industries to improve efficiency [3,6]. Fromthe point of view of business strategy and planning, the ABC/ABSC product-mix decision model canbe solved by using the LINGO software to obtain the optimal decision solution to maximize profit,which is helpful to enterprises [7,8,23]. In the future Industry 4.0, Big Data and cloud computing canbe used to make real-time decisions [14,28,29]. In this subsection, we recommend that the ABC/ABSCproduct-mix decision model can be used to determine the optimal solutions regarding business strategyand enterprise budget [23,28,29] in the Industry 4.0 era. On the other hand, we recommend that thereference LINGO software system be part of the specification for Big Data policy systems.
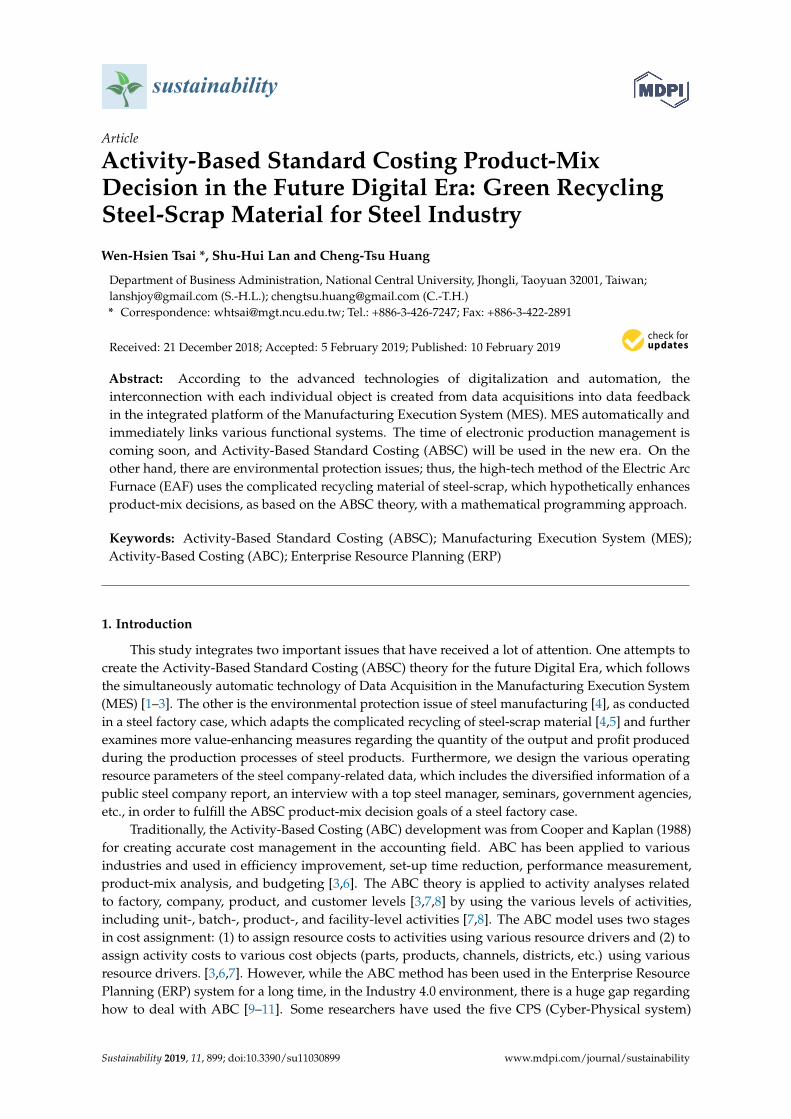
To sum up, this subsection describes the evolution of cost management from the traditional ABCmodel to the innovative ABSC model, including the technological developments and the applicationof ABSC in Industry 4.0, as shown in Table 1. Figure 1 shows a smart ABSC operational roadmap fromstrategy to planning and execution in the future industry 4.0 Environment.
2.2. Integrating Functional Subsystems into an MES
Obviously, a large number of traditionally independent software (such as ERP) can onlyprovide a one-way supply of the related data; however, MES plays a dialogue platform andintegrates all independent systems [2,15]. Smartly, various resources are applied to different systemsindividually, which execute during the production process to manufacture the products [15,20,30].

Sustainability 2019, 11, 899 5 of 30
Many independent systems are applied and integrated by MES systems [2,9], meaning MES systemscan integrate a variety of various independent function systems, and this subsection will introducesome of the functional systems. First, in the production area, MES integrates a ProgrammableLogic Controller (PLC) system [2,25], which is a digital control system that prevents operationalerrors and automatically collects all relevant manufacturing information [1,2,18]. The StatisticalProcess Control (SPC) system is a quality management system [1,10] which features rapid reaction toproduction-line abnormalities and effective dispatch of expert personnel to repair and immediatelyeliminate mechanical or personnel processing anomalies. In addition, the Shop Floor Control (SFC)system can carry out quantity control and transfer on the production line [1,2,10]. Second, in thewarehouse area, MES integrates the Warehouse Management System (WMS) for accurate inventorymanagement [2,15,30]. Third, in the inventory area, MES can be vertically integrated into the SupplyChain Management (SCM) system [2,10,14] with its suppliers to achieve “Just in time” (JIT) [7]management to reduce inventory. Fourth, in the data area, currently, Enterprise Resource Planning(ERP) provides complete information about a company or group; however, the actual details ofmanufacturing processes are difficult to provide [2,15]. Therefore, a wide variety of individualhardware and software have been developed, and all hardware are distributed in one factory inorder to generate their data in a timely and automated manner, which is due to CPS and the IoTtechnologies [31–34]. MES can immediately receive data from all individual systems and send real-timedata to those in demand.
Table 1. Innovative Activity-Based Standard Costing (ABSC) and applications.
Traditional Activity-Based Costing(ABC) Technological Development Innovative ABSC
Resources
1. Technology environment: Cyber-Physical system (CPS)and Internet of Things (IoT)
2. Software and hardware: Integrated ManufacturingExecution System (MES) and various independentsystems (system-to-system)
3. Data acquisition infrastructure (ID reader,Scales interface)
4. Connection of the automation level (Scale, Barcode, RFID)
5. Smart Data: Standards of Material Master andStandards of Master Data
6. Applications: Automated and real-time data acquistionÔ data feedback Machine-to-Machine (becomeconscious and intelligent)
Smart resources:
1. Resource standards: Smart Data2. Smart resource objects: Advance Robots,
Automatic Machines . . .
Activities Smart Activities: Smart resource into operation
Products(Cost Objects) Smart Products:
Using system:Enterprise Resource Planning (ERP)ERP data, including all standard costs
1. Using system: Smart ERP Smart ERP-data,including: smart data and theirstandard unit-price
2. A powerful platform: MES system3. Smart Data applications/data feedback
ABC/ABSC Application: product-mix decision modelMethod: various constraints and mathematical programmingUsing strategic system: Decision Support SystemResults: an optimal decision solution for maximizing profitABSC application in the Big Data of Industry 4.0:Recommendations:
1. Strategy: ABSC Product-mix decision support model as part of Big Data strategy2. Reference LINGO software system as part of a Big Data strategy system specification3. Plan: the optimal decision solution as budget target
Sustainability 2019, 11, 899 6 of 30Sustainability 2018, 10, x FOR PEER REVIEW 6 of 30
Figure 1. Smart ABSC operational roadmap.
Commented [m1]: Have replaced this Figure with a clearer
one.
Commented [u2R1]: OK.
Figure 1. Smart ABSC operational roadmap.
Indeedly, the MES system can solve ERP-related problems and easily collect massive amountsof data during the production process. Finally, in the data application area, the Business Intelligence(BI) system [2,10,15] can be horizontally integrate through an internal database in an ERP system, andall department managers can easily obtain their analysis information if they are authorized access tosuch related information [2,15,30]. It is entirely conceivable that MES can become the backbone ofproduction management; MES integrates a large number of digital products and systems to improveinformation processing capabilities, which allows it to become a powerful production managementsystem for achieving the goal of intelligent manufacturing [35–37].
Sustainability 2019, 11, 899 7 of 30
2.3. Automatic Data Acquisition in Real-Time in an MES System
Data acquisition is automatically collected via a variety of reading systems, including counters,scales, balances, and comparable devices [34,37,38]. For example: (1) the technology of an ergonomictouch screen is for conducting data acquisition [2,10,12,13]; (2) staff members log their work time usingPDA (production data acquisition) [13,28,39], and a cell phone is convenient for conducting immediatemobile data acquisition [2]; (3) RFID (radio frequency identification) [2,18,38] can conduct remote dataacquisition [2,9] in the harshest production environments; (4) counter pulse operating signals canautomatically and immediately collect the yield data [2]; lastly, (5) using barcodes or batch labels thatcan be scanned at their storage location is to collect data in real-time [2,13,15]. In other words, MEScan collect all kinds of data (such as the characteristic curves of quality data, labor time data, wagedata, and material data), and all data of the operational processes are stored in the MES database [2].
Remarkably, production process mapping [2] is embedded into the smart MES, which will connectwith all the data collection systems via a uniform interface, and all devices will automatically collectmessages and perform all data acquisition activities from the start to the final workstation [1,2,9]. Thus,all information will be supplied to managers, customers, and suppliers in a timely manner [9,34,37].
2.4. Background of Steel-Scrap for Green Steelmaking Manufacturing
The use of modern EAF technology instead of the traditional BF technology and adopting the rawmaterial of steel-scrap to reduce the natural energy excavation of iron ore and coal will save 35% of theoil manufacturing costs [22]. Furthermore, the modern production processes of EAF can significantlyreduce 75% of carbon emissions [22], as compared to the traditional BF, in order to promote andmaintain a healthy global environment.
In the future, the EAF production model will gradually replace the traditional BF manufacturingmethod in the global steelmaking industry, as steel-scrap raw materials will replace iron ores in largequantities. Every city has a large number of discarded old steel products, which are the source ofsteel-scrap, including motorcycles, automobiles, rails, furniture, appliances, building demolition,etc. [5]. Steel-scrap will become a secondary mineral due to the large number of recycled oldsteel products, rendering the steelmaking industry a recycling eco-industry [22]. Through the twoconcepts of automatic data acquisition and green steelmaking manufacturing, it provides an importantdevelopment for the ABSC literature in steelmaking manufacturing.
3. ABSC in ERP Applications and Linking MES
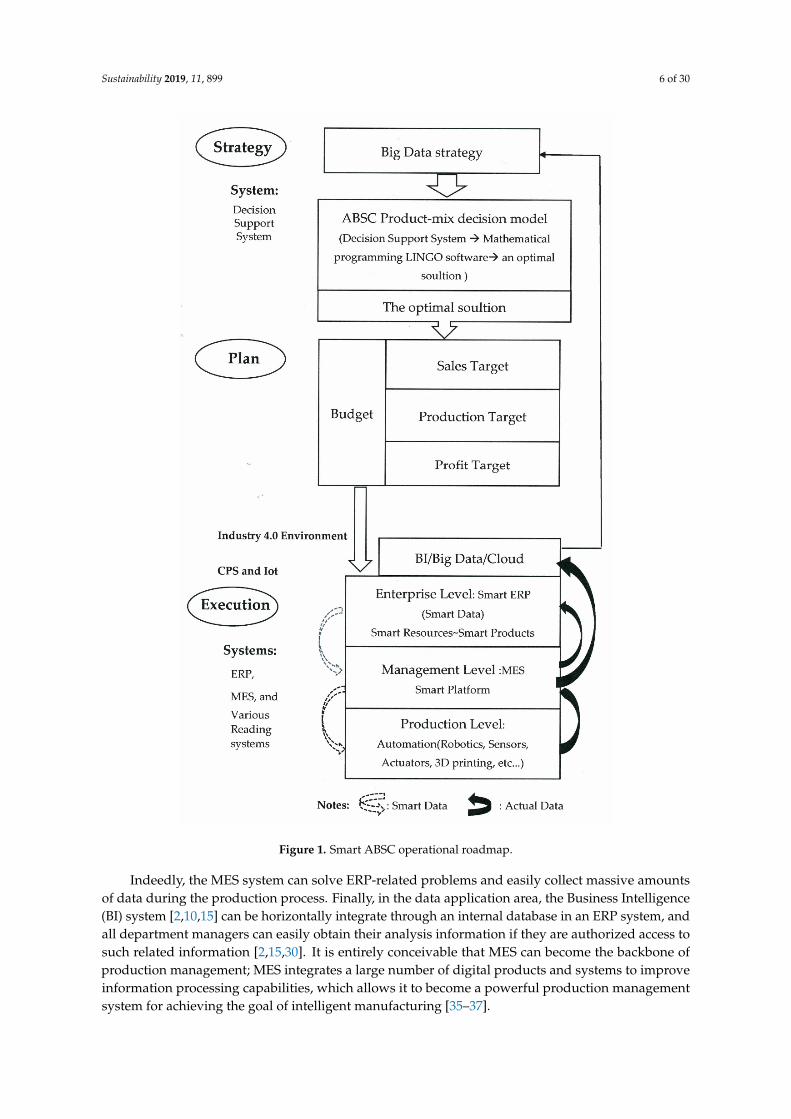
The ABC model uses a two-stage procedure to calculate product costs: resource drivers andactivity drivers. Resource costs are traced to activities using resource drivers, and then, activity costsare traced to cost objects using activity drivers as shown in Figure 2. In the first stage, various resourcedrivers are used to assign resource costs to the related activities. In the second stage, the activity costsare assigned to the products using the activity drivers. Each activity center usually consists of relatedactivities through a clustering process [27,30,39]. Additionally, all elements of each activity cost poolcome from different resource costs and can be traced to their related activity center [23,28,29].

Sustainability 2019, 11, 899 8 of 30
Sustainability 2018, 10, x FOR PEER REVIEW 8 of 30
It is assumed that ABSC (Activity-Based Standard Costing) is embedded in the ERP link with MES, which creates the data storage and information exchange and updates each other every 15 minutes [2,10,31]. From the business practice point-of-view, all industry-relevant objects, such as raw materials, products, machines, customers, and supply chain, can connect with each other for exchanging information and controlling actions independently or autonomously [2,9,15]. Various resources and activities in the ABSC are embedded in an intelligent ERP [10,15], which is also a subsystem of MES. MES is a powerful platform that automatically connects to all independent systems and immediately delivers accurate costs for each product due to its smart integrated data stream including data acquisition, data collection, data storage, data calculation, and data analysis [12,20,27]. Thus, MES’s data application can be applied to customers, channels, or markets in a timely manner to fulfill computerized production management [11,24] in the future digital era.
From the management accounting point-of-view, while the traditional ERP system seems to provide all the information of a company or group, the actual data of the manufacturing process can hardly provide all detailed records in real time, such as working hours; utilization of machines; or equipment, material loss, WIP quantity control, etc. [10,15]; therefore, real-time data acquisition will overcome the above problems [15,24,35]. The following describes the standards for the resources and activities in a digital factory.
Figure 2. The detailed ABC model
3.1. Resource Standards
Input manufacturing resources include raw materials, machines, tools, laborers, etc. The costs of all resources must be properly assigned to the related operating process using the standards of the Material Master and Master Data lists [9,27,37]. A Material Master list, such as the bill of materials information, includes drawings and required quantities [2,15,24]. Another Master Data list is for the work plan, including work instructions, work centers for planned production, set-up time, running time, and standard speed installed to each related machine; all of which are the standards for all production process mapping [2,15,20]. For example, the above various resource standards are installed in the related advanced robots or automatic machines, and they are embedded with a variety
Materials Labors Machines CO2 emission costs ...
. . . . Resource drivers
Cost Elements
Activitiy drivers
Product P#1 Product P#2 Product P#n Cost Objects
Resources
First Stage
Activities
Second Stage
...
Activity Centers
Figure 2. The detailed ABC model.
It is assumed that ABSC (Activity-Based Standard Costing) is embedded in the ERP link withMES, which creates the data storage and information exchange and updates each other every 15minutes [2,10,31]. From the business practice point-of-view, all industry-relevant objects, such asraw materials, products, machines, customers, and supply chain, can connect with each other forexchanging information and controlling actions independently or autonomously [2,9,15]. Variousresources and activities in the ABSC are embedded in an intelligent ERP [10,15], which is also asubsystem of MES. MES is a powerful platform that automatically connects to all independent systemsand immediately delivers accurate costs for each product due to its smart integrated data streamincluding data acquisition, data collection, data storage, data calculation, and data analysis [12,20,27].Thus, MES’s data application can be applied to customers, channels, or markets in a timely manner tofulfill computerized production management [11,24] in the future digital era.
From the management accounting point-of-view, while the traditional ERP system seems toprovide all the information of a company or group, the actual data of the manufacturing process canhardly provide all detailed records in real time, such as working hours; utilization of machines; orequipment, material loss, WIP quantity control, etc. [10,15]; therefore, real-time data acquisition willovercome the above problems [15,24,35]. The following describes the standards for the resources andactivities in a digital factory.
3.1. Resource Standards
Input manufacturing resources include raw materials, machines, tools, laborers, etc. The costs ofall resources must be properly assigned to the related operating process using the standards of theMaterial Master and Master Data lists [9,27,37]. A Material Master list, such as the bill of materialsinformation, includes drawings and required quantities [2,15,24]. Another Master Data list is for thework plan, including work instructions, work centers for planned production, set-up time, runningtime, and standard speed installed to each related machine; all of which are the standards for allproduction process mapping [2,15,20]. For example, the above various resource standards are installedin the related advanced robots or automatic machines, and they are embedded with a variety of sensorsto collect all the data from production operations in a timely manner. The process of collecting data iscalled the data layer for comprehensive perception [10].
Sustainability 2019, 11, 899 9 of 30
Additionally, different functional workers, including material controllers, production schedulers,production labors, and logisticians, use the online MES information platform to integrate variousindependent functional systems [2,15,39] to make preproduction plans. Furthermore, data acquisitionfrom all the input resources are via various reading systems [2,13,27], which automatically receives theinformation into the data acquisition station [2,19] while simultaneously transferring the informationinto the MES database [2]. After that, the MES database will feed the data back to all the relatedindependent systems [2,15,18]. Data feedback is the data layer of reliable transmission.
According to the above explanation, the various data acquisitions and data processes willfollow three steps. First, set the various standards of the Material Master and Master Data, whichare embedded in the advanced robots or automatic machines [2,11,27]. Second, the data layer ofcomprehensive perception by various sensors and multi-sensor systems automatically acquires data ina timely manner during the operational process [2,15,38]. Lastly, the data layer of reliable transmissioncollects feedback data and transfers them to the related systems in real-time [2,10–13,15,16,18,34,35].According to the above data acquisitions, they will automatically collect various Big Data and thus canachieve the submission goals of a smart factory [1,9,24].
3.2. Activity Standards in the Future Production Process
A powerful MES system automatically connects with various functional systems to successfullyconduct production management [1,2]. The following introduces the different operational activities.
3.2.1. The Simulation of Production Strategies
Smart design management can use 3-D printing to make a perfect design prototype before startingproduction [1,2]. Then, the smart software system will be used to simulate the manufacturing processbeforehand [2,24]. MES will make the best plan for production management [2,31,37] by consideringhow to arrange all the types of intelligent automatic machines within the factory and how to conductgood production operations. For example, it can calculate the consumption of various resources ineach production process, such as people, space, energy, materials, equipment, etc [2,19], which canhelp significantly reduce the operating time. An advanced planning and scheduling (APS) system [2]can be used to make detailed manufacturing plans, including listing all the allocated resources andintegrating them into this modern MES system. From the manufacturing process point-of-view, aproduction line using the MES system can be broken down into the individual machines in eachproduction process to collect the data, including the quantity of raw materials, machine time, tooltime, manpower time, etc. [1,2,19]. On the other hand, the quality data achieved from the productionprocesses using the visual mode can achieve the goals of quality management [2].
3.2.2. Tools
The technology of Augmented Reality (AR) [13] has made great breakthroughs in productionmanagement. For example, for job training, workpeople can wear smart glasses to scan their workingsites by creating a smart virtual screen that simulates the working conditions. In other words, StandardOperating Procedures (SOP) can be visualized in a timely manner by using the AR’s technology inproduction process simulations [13]. In this way, we can reduce the cost of training and avoid the lossof production.
3.2.3. Information Technology for Horizontal and Vertical Integration
The MES system creates an important internal and external integrated system by connectingvarious independent horizontal and vertical systems, meaning it can effectively enhance all functionsand support all related requests to achieve efficient digital factories [2,26,27].
Horizontal integration means that a company can integrate all of its internal functions and systems,such as engineering, production, and sales service. All data from all departments are automaticallyentered into their individual system, and the data can be shared with other related departments (each

Sustainability 2019, 11, 899 10 of 30
15 minutes) by the powerful MES platform [1,2,15]. For example, the data layer of reliable transmissionthrough the MES platform can integrate the data from all departments into the ERP system every15 minutes [2,9,15]. On the other hand, vertical integration is a thinking of an industry chain; itmeans that a smart company can develop a cooperative information platform for their suppliers andcustomers to facilitate their timely exchange of related information [26,34,35]. For example, if themachines are broken down, the suppliers can use the platform’s data to know when they shouldsupport the machines.
3.2.4. Machine-to-Machine Communication
The most significant change in the new manufacturing environment is that all auto-machines cansend their information to each other in a factory or different factories [10,27]. From a supply chain pointof view, the information of all machines is connected together through MES, and the MES data can belinked to a cloud system [18,26,34]. In other words, each industry chain data will be connected together,and they can know each other. For example, if our suppliers are out of stock, we can know it throughcloud system and MES and make a good decision to resolve our inventory problem. Furthermore, thetechnologies of cloud and IoT [18,26,34] can also store data for each industry chain and can collectmarketing information to make real-time decisions using Big Data and cloud computing [1,18,32].
3.3. ABSC Application in a Digital Manufacturing
ABC is widely used in a variety of industries to manage and control businesses [3,23,28], and ABSCcan be used to timely analyze the functional costs of its departments [26], such as production, sales,human resource, research and development, information systems, procurement, project management,product design, performance measurement, efficiency improvement, product-mix analysis, set-up timereduction, quality cost measurement, environmental quality management, budgeting, etc. [7,28,29].
In digital factories, all components can indeed be controlled at any time in a powerful MESsystem: Smart design, smart development, smart manufacturing, and smart selling in a perfectindustrial chain system that uses a reliable information technology of horizontal and verticalintegration [18,26,35]. All components have autonomous perception, independent forecasts, andself-configuration capabilities to make standard productions or service practices for achieving perfecthuman–machine interaction [1,2,27]. These technologies will rapidly improve productivity. On theother hand, setting the various standards of the Material Master and Master Data in all smart systemswill easily fulfill a variety of standard costs at the unit, batch, product, and facility levels to achieve theneeds of factories, businesses, products, and customers in a timely manner [1,2,18].
In the digital era, a smart infrastructure of data acquisition terminal equipment includes scaleinterfaces, data interface bus systems [2,24,33], counter pulses operating signal, process values,accompanying document labels and ID reader in the environment of a Cyber-Physical System (CPS),and the Internet of Things (IoT) technologies [1,9,37]. The first automatic data are from the datalayer of comprehensive perception, which creates the automatic huge-data from data acquisitionand data collection to data storage [2,10]. Then, these huge-data become a useful informationmedia that can share various information to related individual systems or devices, includingmachine-to-system, system-to-system, or machine-to-machine [1,2,27], which we call the second datalayer of reliable transmission. The huge-data can be stored in cloud systems for the needs of customersor suppliers [1,34,35]. The cloud systems [26] can also automatically calculate their huge-data andbecome a variety of smart information for different requesters, which we call the third data layer ofintelligent processing.
Specifically, MES plays a backbone role, integrating all the independent horizontal and verticalsystems [2,15,26]. Importantly, data acquisitions and data processes automatically collect large amountsof data during the production process from input resources and activities to finished products [2,15,24].

Sustainability 2019, 11, 899 11 of 30
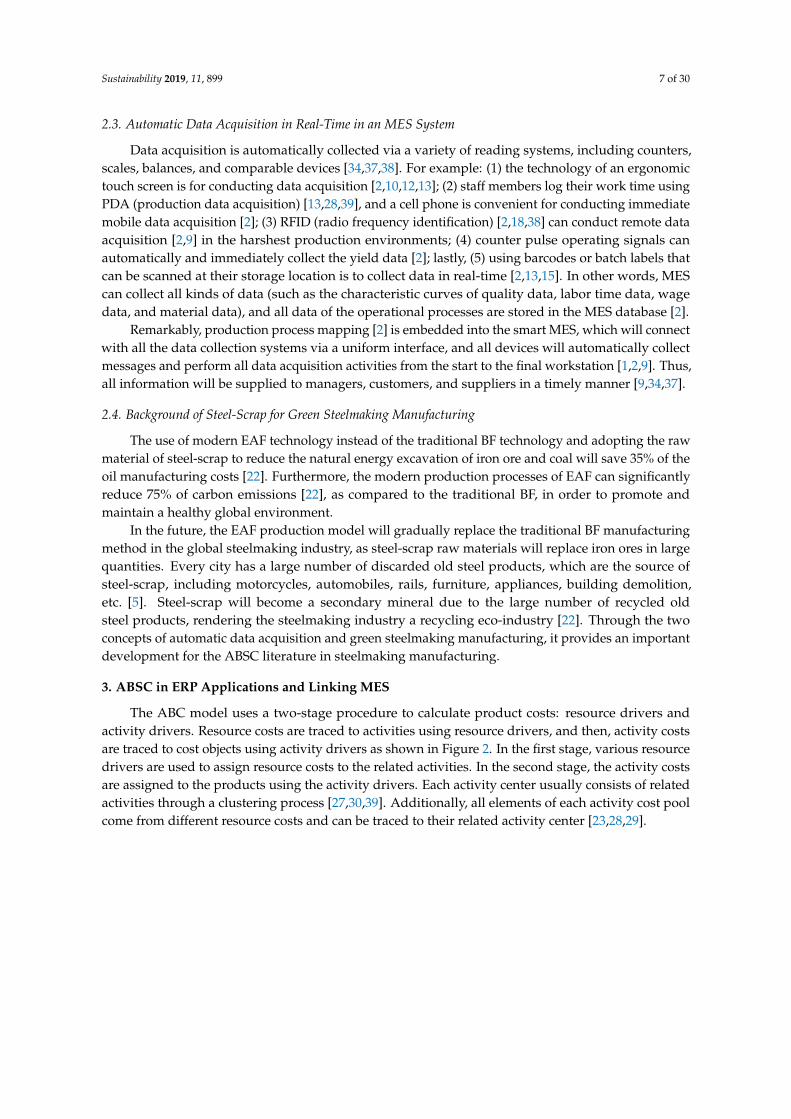
Figure 3 displays the relationship between ABSC and digital factories through smart MES andERP. Huge-data are entered into the MES data station through a variety of sensors, and then, the datafeedback are entered into the ERP database [1,2,18].Sustainability 2018, 10, x FOR PEER REVIEW 11 of 30
Figure 3. Achievement of ABSC goals through Smart MES and ERP systems
3.4. ABSC Definition and Various Cost Calculation
Cooper and Kaplan (1988) adapted ABC for improving the cost of products in an automated manufacturing environment; however, that is not enough for the individual objects required in the digital age. In an MES system, all resource smart objects [18,24,27] are installed with the related standards of the Material Master and Master Data [2,10] before those objects enter the production process, which we call Activity-Based Standard Costing (ABSC). Those operation-related detailed huge-data are collected by various sensors, and massive amounts of data will automatically be created during the production process, which will facilitate the implementation of ABSC in ERP and MES systems [1,2,15].
According to the previous discussion, ABSC can be embedded in a Smart ERP system and connected to the MES system in a digital factory [10,15,24]. The ABSC approach for a steel company can be successfully implemented by following four steps (see Figure 2):
• Step 1. Calculating Resource Costs: The various resources used in a factory may include direct materials, direct laborers, machine hours, and other resources [3,6,28]. Resource costs are calculated using the quantity standards of the Material Master and Master Data [2] in the production process, as well as the standard of each resource unit price [7,8,28]. All detailed quantity data throughout the whole operation process can automatically be summed up for each resource element and then be tracked to its processes. As a result, resource costs can be calculated immediately in a smart ERP system
• Step 2. Tracing Resource Costs to Activities: According to the various automatic data acquisitions in the data processes, some direct resource costs can automatically be traced to specific activities if a resource is consumed only by the specific activity [15,18,27]. Otherwise, the resource cost should be assigned to activities that consume the resource by an appropriate resource drive [2,10,27].
Commented [m3]: Have replaced this Figure with a clearer
one.
Commented [u4R3]: OK.
Figure 3. Achievement of ABSC goals through Smart MES and ERP systems.
3.4. ABSC Definition and Various Cost Calculation
Cooper and Kaplan (1988) adapted ABC for improving the cost of products in an automatedmanufacturing environment; however, that is not enough for the individual objects required in thedigital age. In an MES system, all resource smart objects [18,24,27] are installed with the relatedstandards of the Material Master and Master Data [2,10] before those objects enter the productionprocess, which we call Activity-Based Standard Costing (ABSC). Those operation-related detailedhuge-data are collected by various sensors, and massive amounts of data will automatically be createdduring the production process, which will facilitate the implementation of ABSC in ERP and MESsystems [1,2,15].
According to the previous discussion, ABSC can be embedded in a Smart ERP system andconnected to the MES system in a digital factory [10,15,24]. The ABSC approach for a steel companycan be successfully implemented by following four steps (see Figure 2):
• Step 1. Calculating Resource Costs: The various resources used in a factory may includedirect materials, direct laborers, machine hours, and other resources [3,6,28]. Resource costsare calculated using the quantity standards of the Material Master and Master Data [2] in theproduction process, as well as the standard of each resource unit price [7,8,28]. All detailedquantity data throughout the whole operation process can automatically be summed up for eachresource element and then be tracked to its processes. As a result, resource costs can be calculatedimmediately in a smart ERP system.
• Step 2. Tracing Resource Costs to Activities: According to the various automatic data acquisitionsin the data processes, some direct resource costs can automatically be traced to specific activities if

Sustainability 2019, 11, 899 12 of 30
a resource is consumed only by the specific activity [15,18,27]. Otherwise, the resource cost shouldbe assigned to activities that consume the resource by an appropriate resource drive [2,10,27].
• Step 3. Standardized Activity Costs: An activity may be related to more than one process; thus,its indirect costs will be distributed to the related processes in the MES system [2,15,23]: Forexample, inspecting incoming material, moving materials, and indirect labor costs; maintainingand repairing machines; and other costs that are beneficial to all the manufacturing processes [15].In other words, standardized activity costs can be traced to their related activities andprocesses [2,10,15], and the cost of each activity can be automatically calculated by adding the costsof the resource elements assigned to the activity [7,10,15]. In the new manufacturing era, masscustomization is the key focus of manufacturing processes. Traditional standard costing shouldbe changed to setting the detailed standards for elementary cost elements [2,15,18]. Thus, we willhave the standard cost rate for each activity executed in the productions system. The standardcost of a specific product unit will be calculated by adding the products with standard activity costrates and standard activity driver quantities consumed by this specific product unit [15,23,28].
• Step 4. Tracing Activity Costs to Products: The product cost for a specific product unit canbe automatically calculated by summing up the resource and activity costs traced to a specificproduct unit [15,23,28].
3.5. ABSC in ERP and linking MES in A Smart Factory
To sum up Section 3, the resource standards use the standards of the Material Master and MasterData [2,15,27], which are installed in the related smart objects prior to production. After that, all smartobjects will automatically operate their operational activities and acquire their data in a real-timemanner [2,10,15]. Regarding the software, this powerful MES system not only integrates all automaticand real-time data from all reading systems into the MES database [2,12,24] but also shares the relevantrequirement data through the platform [2,12,24]. Additionally, the MES system automatically connectsthe internal and external independent systems for horizontal and vertical integration to achieve thegoals of smart factories [2,10,24].
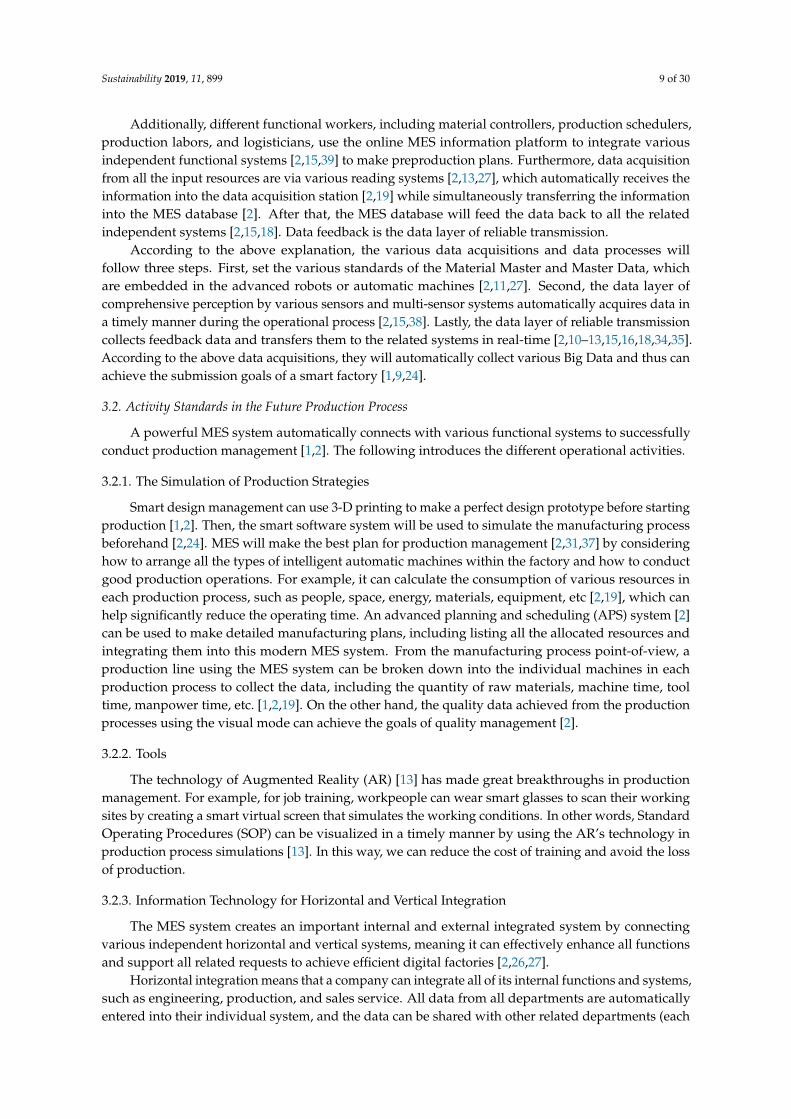
From a cost accounting point-of-view, one should understand a smart factory, including how toconnect the ERP and MES; the following steps can be followed. Firstly, the structure of a smart factoryhas four levels, Production Operation, Production Management, Business Operation, and Commerce,with multiple control systems: MES system, ERP system, and BI system. Secondly, Sections 2 and 3provide many different MES information, including operation processes, functions, and software, todesign a powerful MES integrated system for a smart factory. Finally, in particular, the SAP-ERP systemmainly includes the following seven modules in order to display ABSC in the CO module: SD (Salesand Distribution), PP (Production Planning), MM (Materials Management), QM (Quality Management),HCM (Human Capital Management), CO (Controlling), and FI (Financial Accounting) [40]. Figure 4shows a smart factory can use the MES integrated systems in the future Industry 4.0 era.

Sustainability 2019, 11, 899 13 of 30Sustainability 2018, 10, x FOR PEER REVIEW 13 of 30
Figure 4. A powerful MES integrated system.
Commented [m5]: Have replaced this Figure with a clearer
one.
Commented [u6R5]: OK.
Figure 4. A powerful MES integrated system.
4. Formulation of an ABSC Product-Mix Decision Model for a Steel Factory
Jadicke (1961) applied the Product-Mix model in management accounting to determine the optimalproduct-mix [23,29] that maximizes total profit under various constraints (e.g., sales, production, andcost elements) in a multiproduct company. Additionally, ABC uses various mathematical programmingapproaches and conducts a product-mix decision analysis [23,29]. The ABSC theory will be applied innew manufacturing.
4.1. Process Descriptions and Cost Categories for the ABSC Mixed Decision Model for a Steel Factory
Bottom line results (e.g., the income statement in the accounting field) are from sales and variouscosts to profit, which can be used to evaluate the competitiveness of a company [23,29], and suchresults are absolutely related to the performance of each functional department. All cost informationmust be shown, in order for business operators to make good assessments and accurate judgments.This study classifies six cost categories as follows:

Sustainability 2019, 11, 899 14 of 30
1. Material cost: The purchase of steel-scrap raw materials should be based on the needs of EAF toclean, cut, and fracture for finishing all kinds of different sizes. The available steel-scrap will bepoured into the hopper of EAF according to size in order for the EAF to be fully loaded and thenwill start the production of P#1 products.
2. Labor cost: Including personnel normal and overtime costs;3. Electrical power cost: Including the high electrical bills for EAF, etc.;4. CO2 emission cost: Environmental and social costs in the form of a carbon tax for
environmental protection;5. Machine cost: Machines and equipment are fixed costs in each process;6. Other indirect costs (overhead): With the exception of the above 1–5 costs in this subsection, other
indirect costs per product are calculated as a percentage of the total amount sold for each product.
The flowchart in Figure 5 describes the processes in steel manufacturing. This study includestwo main stages. On the one hand, we focus on incorporating the above costs (e.g., Material cost,Labor cost, Electrical power cost, CO2 emission cost, Machine cost, and other indirect costs) through amathematical programming approach and obtain the optimal decision using the LINGO software. Onthe other hand, we hypothesize and enhance the value of steel-scrap raw materials for P#1 products inthe process of steelmaking to achieve maximum profit. The flowchart of the steel factory is shown inFigure 5.
Sustainability 2018, 10, x FOR PEER REVIEW 14 of 30
4.1. Process Descriptions and Cost Categories for the ABSC Mixed Decision Model for a Steel Factory
Bottom line results (e.g., the income statement in the accounting field) are from sales and various costs to profit, which can be used to evaluate the competitiveness of a company [23,29], and such results are absolutely related to the performance of each functional department. All cost information must be shown, in order for business operators to make good assessments and accurate judgments. This study classifies six cost categories as follows:
1. Material cost: The purchase of steel-scrap raw materials should be based on the needs of EAF to clean, cut, and fracture for finishing all kinds of different sizes. The available steel-scrap will be poured into the hopper of EAF according to size in order for the EAF to be fully loaded and then will start the production of P#1 products.
2. Labor cost: Including personnel normal and overtime costs; 3. Electrical power cost: Including the high electrical bills for EAF, etc.; 4. CO2 emission cost: Environmental and social costs in the form of a carbon tax for environmental
protection; 5. Machine cost: Machines and equipment are fixed costs in each process; 6. Other indirect costs (overhead): With the exception of the above 1–5 costs in this subsection,
other indirect costs per product are calculated as a percentage of the total amount sold for each product.
The flowchart in Figure 5 describes the processes in steel manufacturing. This study includes two main stages. On the one hand, we focus on incorporating the above costs (e.g., Material cost, Labor cost, Electrical power cost, CO2 emission cost, Machine cost, and other indirect costs) through a mathematical programming approach and obtain the optimal decision using the LINGO software. On the other hand, we hypothesize and enhance the value of steel-scrap raw materials for P#1 products in the process of steelmaking to achieve maximum profit. The flowchart of the steel factory is shown in Figure 5.
Figure 5. The production process of the steel factory of the case company.
Figure 5. The production process of the steel factory of the case company.
4.2. Assumptions
Assuming that the ABSC product-mix decision in a steel factory considers all operating costsin this paper, there are several assumptions. The following assumptions will be incorporated into amathematical programming model:
1. The revenue includes steel products and slag byproducts;2. The direct raw material cost of steel-scrap with different purity levels and recycled materials for
byproducts are assumed;3. Direct labor is related to the time of the production machine;4. The model complies with government policies, including direct labor overtime and tax cost for
carbon dioxide emission;
Sustainability 2019, 11, 899 15 of 30
5. The direct costs include direct materials, machines, CO2 emission, labor, and electricalpower costs;
6. The machine cost of each process is fixed, regardless of any special overtime;7. The variable costs of other indirect costs are based on the total sales percentage for each product.
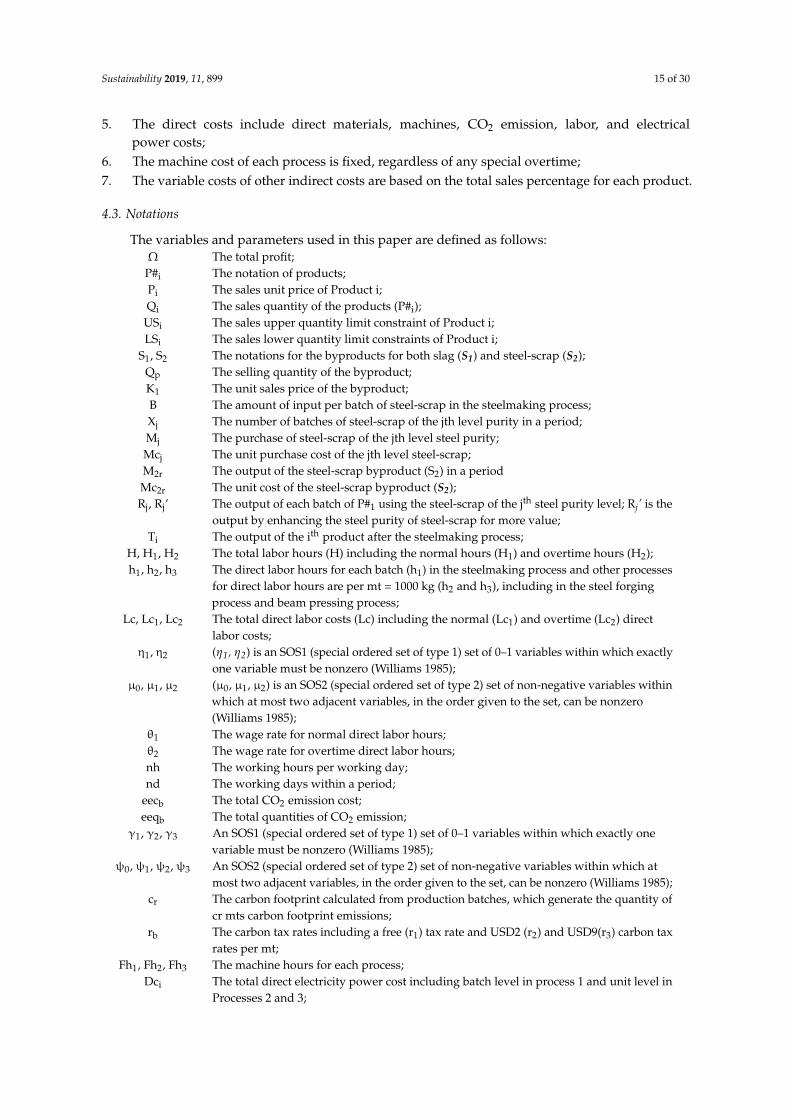
4.3. Notations
The variables and parameters used in this paper are defined as follows:Ω The total profit;
P#i The notation of products;Pi The sales unit price of Product i;Qi The sales quantity of the products (P#i);
USi The sales upper quantity limit constraint of Product i;LSi The sales lower quantity limit constraints of Product i;
S1, S2 The notations for the byproducts for both slag (S1) and steel-scrap (S2);Qp The selling quantity of the byproduct;K1 The unit sales price of the byproduct;B The amount of input per batch of steel-scrap in the steelmaking process;Xj The number of batches of steel-scrap of the jth level purity in a period;Mj The purchase of steel-scrap of the jth level steel purity;Mcj The unit purchase cost of the jth level steel-scrap;M2r The output of the steel-scrap byproduct (S2) in a periodMc2r The unit cost of the steel-scrap byproduct (S2);Rj, Rj’ The output of each batch of P#1 using the steel-scrap of the jth steel purity level; Rj’ is the
output by enhancing the steel purity of steel-scrap for more value;Ti The output of the ith product after the steelmaking process;
H, H1, H2 The total labor hours (H) including the normal hours (H1) and overtime hours (H2);h1, h2, h3 The direct labor hours for each batch (h1) in the steelmaking process and other processes
for direct labor hours are per mt = 1000 kg (h2 and h3), including in the steel forgingprocess and beam pressing process;
Lc, Lc1, Lc2 The total direct labor costs (Lc) including the normal (Lc1) and overtime (Lc2) directlabor costs;
η1, η2 (η1, η2) is an SOS1 (special ordered set of type 1) set of 0–1 variables within which exactlyone variable must be nonzero (Williams 1985);
µ0, µ1, µ2 (µ0, µ1, µ2) is an SOS2 (special ordered set of type 2) set of non-negative variables withinwhich at most two adjacent variables, in the order given to the set, can be nonzero(Williams 1985);
θ1 The wage rate for normal direct labor hours;θ2 The wage rate for overtime direct labor hours;nh The working hours per working day;nd The working days within a period;
eecb The total CO2 emission cost;eeqb The total quantities of CO2 emission;
γ1, γ2, γ3 An SOS1 (special ordered set of type 1) set of 0–1 variables within which exactly onevariable must be nonzero (Williams 1985);
ψ0, ψ1, ψ2, ψ3 An SOS2 (special ordered set of type 2) set of non-negative variables within which atmost two adjacent variables, in the order given to the set, can be nonzero (Williams 1985);
cr The carbon footprint calculated from production batches, which generate the quantity ofcr mts carbon footprint emissions;
rb The carbon tax rates including a free (r1) tax rate and USD2 (r2) and USD9(r3) carbon taxrates per mt;
Fh1, Fh2, Fh3 The machine hours for each process;Dci The total direct electricity power cost including batch level in process 1 and unit level in
Processes 2 and 3;

Sustainability 2019, 11, 899 16 of 30
Du The unit cost of 1 KW of electricity power;Dn1, Dn2, Dn3 The electrical power consumed by processes 1, 2, and 3 are Dn1, Dn2, and Dn3,
respectively;Fi All machine costs in each process are fixed;
Oci and pri Other indirect cost (Oci) for product i; allocating its cost based on the percentage ofrevenue of product i (pri).
4.4. Mathematical Programming Model
According to Section 4.1, assume that there are six cost categories in the case steel factory, includingmaterial cost, labor cost, electrical power cost, CO2 emission cost, machine cost, and other indirect costs.The following discusses the combination of related cost elements and the mathematical programmingmodel; then, we can use a LINGO software to obtain the results for determining an optimal decision. Inaddition, we conduct a scenario profit analysis by gradually increasing the purchase cost of steel-scrap,where steel purity is from the lowest, to middle, to highest level in order to enhance the yield of P#1
and maximize profit.
4.4.1. The Model
The objective is to maximize total profit, Ω:Maximize Ω = (A) Sales amount (A1. Steel products + A2. Slag byproduct)
(B) Direct material cost (B1. Steel-scrap − B2. Recycling the byproduct of steel-scrap)(C) Direct labor cost (C1. Normal cost + C2. Overtime cost)(D) Direct electrical power cost(E) Direct machine cost(F) CO2 emission (Environmental and social cost)(G) Other indirect cost
= ∑3i=1 PiQi+K1 ∗ [∑3
j=1 Xj(B− Rj)]−(B ∗∑3j=1 Xj∗Mcj)− [(∑3
i=1 Qi/Ti) ∗ (1− Ti)]∗Mc2r − (Lc1∗µ1 + Lc2∗µ2)− Du∗[Dn1 ∗ (∑3
j=1 Xj) + (Dn2∗Q2) + (Dn3∗Q3)]−∑3
i=1 Fi − (eec1∗ψ1 + eec2∗ψ2 + eec3∗ψ3)−∑3i=1 Oci
(1)
which is subject to
A. Product sales upper limit constraintsQi 5 USi (2)
Product sales lower limit constraintsQi = LSi (3)
B1. Direct material quantity constraints
B ∗3
∑j=1
Xj ∗ Rj=3
∑i=1
(Qi/Ti) (4)
C. Direct labor hour constraintsH = H1µ1 + H2µ2, (5)
(3
∑j=1
Xj) ∗ h1 + (Q2/T2) ∗ h2 + (Q3/T3) ∗ h3 = H1µ1 + H2µ2, (6)
µ0 − η1 5 0, (7)
µ1 − η1 − η2 5 0, (8)
µ2 − η2 5 0, (9)

Sustainability 2019, 11, 899 17 of 30
µ0 + µ1 + µ2 = 1, 0 5 µ0,µ1,µ2 5 1 (10)
η1 + η2 = 1, η1,η2 = 0,1, (11)
E. Machine hour constraints
Fh1 5 nh ∗ nd; Fh2 = Q2 ∗ h2; Fh3 = Q3 ∗ h3, (12)
F. CO2 emission constraints
(B ∗3
∑j=1
Xj) ∗ cr = eeq1 ∗ψ1 + eeq2 ∗ψ2 + eeq3 ∗ψ3, (13)
eeqb = eeq1*ψ1 + eeq2*ψ2 + eeq3*ψ3 (14)
ψ0 − γ1 ≤ 0, (15)
ψ1 − γ1 − γ2 ≤ 0, (16)
ψ2 − γ2 − γ3 ≤ 0 (17)
ψ3 − γ3 ≤ 0, (18)
ψ0 +ψ1 +ψ2 +ψ3 = 1, 0 ≤ ψ0,ψ1,ψ2,ψ3 ≤ 1, (19)
γ1 + γ2 + γ3 = 1, γ1,γ2,γ3 = 0, 1 (20)
4.4.2. Sales Amount
According to Figure 5, the sales amount comes from the following products: steel billets (P#1),steel reinforcing bars (P#2), and H beams (P#3), which are produced in the different processes. In theproduction of steel billets (P#1), slag byproduct (S1) can be produced and sold. In this paper, the weightof the input batch of raw material in process 1 must be equaled to 100 mts (B) regardless of the steelpurity (Mj) of every batch because of the capacity of the furnace. On the other hand, the total numberof batches in a period is Xj, which includes different j levels that will affect the number of output P#1
(Rj) and byproduct S1 (B – Rj) per batch. Assume also that Qi is the selling quantity of product P#i.The quantity of byproduct [Xj(B – Rj)] is the difference in the quantity between the input quantity ofthe steel-scrap and the output of the steel billet (P#1). In this case, the steel-scrap has j kinds of steelpurity levels and j equals 3. Therefore, the total sales amount in Equation (1), i.e.,∑3
i=1 PiQi and K1 ∗[Xj(B – Rj)] represent the total sales amount of products and byproducts, respectively. Furthermore, theproducts may have sales upper limit constraints (Qi 5 USi) due to market demand limits, as shownin Equation (2); the products may also have lower sales limit constraints (Qi = LSi), as shown inEquation (3), due to considering the economics of scale or satisfying the original customers’ needs.
4.4.3. Direct Material Cost
The second term in Equation (1), i.e., [B ∗ (∑3j=1 Xj∗Mcj)] − [(∑3
i=1 Qi/Ti) ∗ (1− Ti)] ∗Mc2r,stands for the total direct material cost by purchasing steel-scrap and saving the material cost dueto recycling steel-scrap byproducts. Firstly, Equation (4), i.e., (B∗∑3
j=1 Xj ∗ Rj) = (∑3i=1 Qi/Ti), is the
quantity of material associated with different steel purity levels in the steel-scrap that is equal to thetotal sales quantity of products 1–3 (P#1, P#2, and P#3). In this subsection, B, Xj, and Rj, as described inthe above Section 4.4.2. Sales Amount), and Mcj are the unit costs of steel-scrap at the jth purity level;thus, the total cost of the direct material for the purchase of steel-scrap is (B ∗∑3
j=1 Xj∗Mcj) Secondly,the byproduct of recycled steel-scrap is from Process 2 and Process 3. The Qi was also introduced in theabove Section 4.4.2. Sales Amount), and Ti is the output of P#i in the production process. Additionally,Mc2r is the byproduct of steel-scrap (S2) recycled from Processes 2 and 3, and the unit cost of S2 is fixed;

Sustainability 2019, 11, 899 18 of 30
thus, [∑3i=1 Qi/Ti ∗ (1− Ti) ∗Mc2r] is the cost of the direct material for the byproduct of steel-scrap
(S2). To sum up, the direct material cost is the second term in Equation (1), i.e., [B ∗∑3j=1 Xj ∗Mcj) −
[(∑3i=1 Qi/Ti) ∗ (1− Ti)] ∗Mc2r
4.4.4. Direct Labor Cost
Figure 6 shows a piecewise linear cost function, which represents that labor hours can be expandedto overtime; thus, the labor cost rate will also increase. In the normal working hour range, the highestlabor hour and cost are H1 and Lc1, respectively. In the overtime labor hour range, the highest overtimelabor hour and cost are Lc2 and H2, respectively. However, the total labor hour (normal + overtime) isrepresented in Equation (5): H = H1µ1 + H2µ2. On the other hand, the associated total direct labor costis shown in the third term in Equation (1), i.e., Lc1µ1 + Lc2µ2.
Sustainability 2018, 10, x FOR PEER REVIEW 18 of 30
constraints (Qi ≧ LSi), as shown in Equation (3), due to considering the economics of scale or satisfying the original customers’ needs.
4.4.3. Direct Material Cost
The second term in Equation (1), i.e., [B∗ (∑ X ∗ Mc )]—[(∑ Q /T ) ∗ (1 − T )] ∗Mc2r, stands for the total direct material cost by purchasing steel-scrap and saving the material cost due to recycling steel-scrap byproducts. Firstly, Equation (4), i.e., (B ∗ ∑ X ∗ R ) =(∑ Q /T ) , is the quantity of material associated with different steel purity levels in the steel-scrap that is equal to the total sales quantity of products 1–3 (P#1, P#2, and P#3). In this subsection, B, Xj, and Rj, as described in the above Section 4.4.2. Sales Amount), and Mcj are the unit costs of steel-scrap at the jth purity level; thus, the total cost of the direct material for the purchase of steel-scrap is (B∗ ∑ X ∗ Mc ) Secondly, the byproduct of recycled steel-scrap is from Process 2 and Process 3. The Qi was also introduced in the above Section 4.4.2. Sales Amount), and Ti is the output of P#i in the production process. Additionally, Mc2r is the byproduct of steel-scrap (S2) recycled from Processes 2 and 3, and the unit cost of S2 is fixed; thus, [∑ Q /T ∗ (1 − T ) ∗Mc2r] is the cost of the direct material for the byproduct of steel-scrap (S2). To sum up, the direct material cost is the second term in Equation (1), i.e., (B∗∑ X ∗ Mc )—[(∑ Q /T ) ∗ (1 − T )] ∗Mc2r.
4.4.4. Direct Labor Cost
Figure 6 shows a piecewise linear cost function, which represents that labor hours can be expanded to overtime; thus, the labor cost rate will also increase. In the normal working hour range, the highest labor hour and cost are H1 and Lc1, respectively. In the overtime labor hour range, the highest overtime labor hour and cost are Lc2 and H2, respectively. However, the total labor hour (normal + overtime) is represented in Equation (5): H = H1µ1 + H2µ2. On the other hand, the associated total direct labor cost is shown in the third term in Equation (1), i.e., Lc1µ1 + Lc2µ2.
Figure 6. A piecewise linear function for direct labor.
For direct labor hours, the associated constraints are shown in Equations (5)–(11). Particularly, the direct labor hours in each process (Processes 1–3 as in Figure 5) are shown in Equation (6), which is also equal to Equation (5).
(η1, η2) in Equation (11) is an SOS1 set of 0–1 variables, where only one variable will be one. η1 and η2 are indicator variables; if η1 = 1, it means that the data point will fall within the first segment of Figure 6, and if η2 = 1, it means that the data point will fall within the second segment of Figure 6. On the other hand, (µ0, µ1, µ2) in Equation (10) is an SOS2 set of non-negative variables, within which at the most two adjacent, in the order given to the set, can be nonzero (Williams 1985). In Equations (7)–(11), if η1 = 1, then η2 = 0 from Equation (11), µ2 = 0 from Equation (9), µ0,µ1 ≦ 1 from Equations (7) and (8), and µ0 + µ1 = 1 from Equation (10). It means that the data point will be the linear combination of points (0, 0) and (H1, Lc1); the labor hours used and the associated labor costs will be H1µ1 and Lc1µ1, respectively. Similarly, if η2 = 1, then η1 = 0 from Equation (11), µ0 = 0 from Equation (8), µ1,µ2
Figure 6. A piecewise linear function for direct labor.
For direct labor hours, the associated constraints are shown in Equations (5)–(11). Particularly, thedirect labor hours in each process (Processes 1–3 as in Figure 5) are shown in Equation (6), which isalso equal to Equation (5).
(η1, η2) in Equation (11) is an SOS1 set of 0–1 variables, where only one variable will be one. η1
and η2 are indicator variables; if η1 = 1, it means that the data point will fall within the first segment ofFigure 6, and if η2 = 1, it means that the data point will fall within the second segment of Figure 6. Onthe other hand, (µ0, µ1, µ2) in Equation (10) is an SOS2 set of non-negative variables, within whichat the most two adjacent, in the order given to the set, can be nonzero (Williams 1985). In Equations(7)–(11), if η1 = 1, then η2 = 0 from Equation (11), µ2 = 0 from Equation (9), µ0,µ1 5 1 from Equations (7)and (8), and µ0 + µ1 = 1 from Equation (10). It means that the data point will be the linear combinationof points (0, 0) and (H1, Lc1); the labor hours used and the associated labor costs will be H1µ1 andLc1µ1, respectively. Similarly, if η2 = 1, then η1 = 0 from Equation (11), µ0 = 0 from Equation (8),µ1,µ2 5 1 from Equations (8) and (9), and µ1 + µ2 = 1 from Equation (10). Thus, the data point willbe the linear combination of points (H1, Lc1) and (H2, Lc2); the labor hours used and the associatedlabor costs will be (H1µ1 + H2µ2) and (Lc1µ1 + Lc2µ2) as shown in Equation (5) and the third term ofEquation (1), respectively.
4.4.5. Direct Electricity Power Cost
In this subsection, the direct electricity power cost (Dci) is divided into two parts, one by batchin process 1 and another by the unit of mt in Processes 2 and 3. The fourth term in Equation (1), i.e.,Du∗[Dn1 ∗ (∑3
j=1 Xj)], and Du∗[(Dn2 ∗Q2) + (Dn3 ∗Q3)] represent the total direct electricity powercost of this case. Du is the unit cost of electricity power. Dn1 is the quantity of electricity power usedfor each batch in process 1, and Dn2 and Dn3 are the quantities of electricity power used in Processes 2and 3 per mt.

Sustainability 2019, 11, 899 19 of 30
4.4.6. Machine Costs
The total cost of the machines in each process is fixed, regardless of whether the machines areused during non-normal working hours. The fifth term in Equation (1), i.e.,∑3
i=1 Fi represents the totalcost of machines in all processes (Processes 1–3 as shown in Figure 3).
4.4.7. CO2 Emission Costs
In the literature of recent years, carbon tax cost has received considerable attention in variousindustries such as the construction industry [3,41], the electrical and electronic industry [42], thepharmaceutical industry [43], the tire industry [44–46], the textile industry [47], the knitted footwearindustry [48,49], the paper industry [50], the aluminum-alloy wheel industry [51], and so on. The sixthterm in Equation (1), eec1∗ψ1 + eec2∗ψ2 + eec3∗ψ3, represents the total CO2 emission cost (i.e., carbontax cost). The steelmaking process, studied in this paper, has successfully operated the manufacturingtechnology of EAF and adopts the recycling material of steel-scrap to produce the P#1 steel billets.The factory disclosed the carbon footprint information for each product to identify and implementthe philosophies of the energy-conserving design and low-carbon emissions [22], which have thepurpose of proactively and actively promoting CO2 emissions reduction. According to the concept ofthe Corporate Social Responsibility (CSR) of a public company and its carbon footprint as a strongtool, the quantity of CO2 emission from the steelmaking process is determined and estimated [22,23].The manufacturing technology of EAF supports lower CO2 emission quantities and a tax policy.
Regarding the quantities of CO2 emissions, the associated constraints are expressed in Equations(13)–(20). In Equation (13), the total amount of CO2 emissions is divided into three segments withdifferent constraint quantities, as shown in Equation (14), as well as different tax rates. It is a piecewiselinear cost function for the carbon tax cost function, as shown in Figure 6.
(γ1, γ2, γ3) in Equation (20) is an SOS1 set of 0–1 variables, where only one variable will be one.γ1, γ2, and γ3 are indicator variables; if γ1 = 1, it means that the data point will fall within the firstsegment of Figure 6; similarly, if γ2 = 1 or γ3 = 1, it means that the data point will fall within thesecond or third segment of Figure 6. On the other hand, (ψ0, ψ1, ψ2, ψ3,) in Equation (19) is an SOS2set of non-negative variables, within which at most two adjacent, in the order given to the set, can benonzero (Williams 1985).
If γ1 = 1, then γ2 = γ3 = 0 from Equation (20), ψ2 = ψ3 = 0 from Equations (17) and (18), ψ0 5 1and ψ1 5 1 from Equations (15) and (16), and ψ0 + ψ1 = 1 from Equation (19). It means that the datapoint will fall within the first segment of Figure 7. Then, the total quantity of CO2 emission is eeqb 5eeq1, and the carbon tax cost is 0, since eec1*ψ1 + eec2*ψ2 + eec3*ψ3 = 0*ψ1 + eec2*0 + eec3*0 = 0. Thismeans that the data point (eeq1ψ1, 0) in the first segment of Figure 7 is the linear combination of (0, 0)and (eeq1, 0).
Sustainability 2018, 10, x FOR PEER REVIEW 20 of 30
will fall within the second segment of Figure 7. Then, the total quantity of CO2 emissions is eeqb = eeq1*ψ1 + eeq2*ψ2 from Equation (14), and the carbon tax cost is eec1*ψ1 + eec2*ψ2 + eec3*ψ3 = 0*ψ1 + eec2*ψ2 + eec3*0 = eec2*ψ2 from Equation (1). This means that the data point (eeq1ψ1 + eeq2ψ2, eec2ψ2) in the second segment of Figure 7 is the linear combination of (eeq1, 0) and (eeq2, eec2).
If γ3 = 1, then γ1 = γ2 = 0 from Equation (20), ψ0 = ψ1 = 0 from Equations (15) and (16), ψ2 ≦ 1 and ψ3 ≦ 1 from Equations (17) and (18), and ψ2 + ψ3 = 1 from Equation (19). It means that the data point will fall within the third segment of Figure 7. Then, the total quantity of CO2 emissions is eeqb = eeq2*ψ2 + eeq3*ψ3 from Equation (14), and the carbon tax cost is eec1*ψ1 + eec2*ψ2 + eec3*ψ3 = 0*0 + eec2*ψ2
+ eec3*ψ3 = eec2*ψ2 + eec3*ψ3 from Equation (1). This means that the data point (eeq2*ψ2 + eeq3*ψ3, eec2*ψ2 + eec3*ψ3) in the third segment of Figure 7 is the linear combinations of (eeq2, eec2) and (eeq3, eec3). In brief, if the company emits more CO2, then the company will pay the higher carbon tax rate.
Figure 7. CO2 emission costs.
4.4.8. Other Indirect Cost
The seventh term in Equation (1), i.e., ∑ Oc , represents the total amount of other indirect costs by adopting the percentage of revenue per product (pr).
5. Illustrative Case Study and Discussion
This section presents a numerical example and illustrates the application of the model proposed in this paper. The illustrative example data are shown in Table 2. The case company is considering producing products 1, 2, and 3 (P#i including P#1, P#2, and P#3). We assume that they need three main activities, including one batch-level in Process 1 for P#1 and two unit-levels in Processes 2 and 3 for P#2 and P#3. In process 1, we can choose the purity level of Mj steel for steel-scrap, and Mj includes M1, M2, and M3. The following example displays the revenue and various costs.
5.1. Sales Amount
The first part is the revenue, including the three kinds of products of steel billets (P#1), steel reinforcing bars (P#2), and H beams (P#3), which have the unit prices (Pi) of USD450 (P1), USD580 (P2), and USD660 (P3), respectively. The second part is the revenue of the byproduct slag (S1), and the unit price is USD12 (K1). Additionally, in Process 1, the quantity of input raw material per batch of steel-scrap is limited to 100 (B) mts and the same steel purity level (Mj) for every batch, and each jth level of steel-scrap does not exceed the number of 65 (Xj) batches in a period, which is due to the capacity of the furnace. The output quantity of P#1 in each batch depends on the different steel purity levels (Mj) of the steel-scrap, and their output of Rj includes 88 (R1), 91(R2), and 94(R3) per batch. On the other hand, only the amount of byproduct [Xj∗(B – Rj)] in process 1 in a period is the difference between the input quantity of steel-scrap raw material (Xj∗B) and the output P#1 (Xj∗Rj). To sum up, the total revenue is expressed, as shown in Equation (1), as ∑ P Q + K ∗ ∑ X ∗ B − R . We also consider the quantity of sales constraints for each product in the operational policy; product P#1 can only sell the quantity of Q1 between 2000 (LS1) and 4000 (US1) due to market constraints and
Figure 7. CO2 emission costs.
If γ2 = 1, then γ1 = γ3 = 0 from Equation (20), ψ0 = ψ3 = 0 from Equations (15) and (18), ψ1 5 1and ψ2 5 1 from Equations (16) and (17), and ψ1 + ψ2 = 1 from Equation (19). It means that the datapoint will fall within the second segment of Figure 7. Then, the total quantity of CO2 emissions iseeqb = eeq1*ψ1 + eeq2*ψ2 from Equation (14), and the carbon tax cost is eec1*ψ1 + eec2*ψ2 + eec3*ψ3 =

Sustainability 2019, 11, 899 20 of 30
0*ψ1 + eec2*ψ2 + eec3*0 = eec2*ψ2 from Equation (1). This means that the data point (eeq1ψ1 + eeq2ψ2,eec2ψ2) in the second segment of Figure 7 is the linear combination of (eeq1, 0) and (eeq2, eec2).
If γ3 = 1, then γ1 = γ2 = 0 from Equation (20), ψ0 = ψ1 = 0 from Equations (15) and (16), ψ2 5 1and ψ3 5 1 from Equations (17) and (18), and ψ2 + ψ3 = 1 from Equation (19). It means that the datapoint will fall within the third segment of Figure 7. Then, the total quantity of CO2 emissions is eeqb =eeq2*ψ2 + eeq3*ψ3 from Equation (14), and the carbon tax cost is eec1*ψ1 + eec2*ψ2 + eec3*ψ3 = 0*0 +eec2*ψ2 + eec3*ψ3 = eec2*ψ2 + eec3*ψ3 from Equation (1). This means that the data point (eeq2*ψ2 +eeq3*ψ3, eec2*ψ2 + eec3*ψ3) in the third segment of Figure 7 is the linear combinations of (eeq2, eec2)and (eeq3, eec3). In brief, if the company emits more CO2, then the company will pay the higher carbontax rate.
4.4.8. Other Indirect Cost
The seventh term in Equation (1), i.e., ∑3i=1 Oci, represents the total amount of other indirect costs
which are allocated by the percentage of revenue of product i (pri).
5. Illustrative Case Study and Discussion
This section presents a numerical example and illustrates the application of the model proposedin this paper. The illustrative example data are shown in Table 2. The case company is consideringproducing products 1, 2, and 3 (P#i including P#1, P#2, and P#3). We assume that they need three mainactivities, including one batch-level in Process 1 for P#1 and two unit-levels in Processes 2 and 3 forP#2 and P#3. In process 1, we can choose the purity level of Mj steel for steel-scrap, and Mj includesM1, M2, and M3. The following example displays the revenue and various costs.
Table 2. Example data (Case 1).
Description Material (Mj) for P#1 Products (P#i/S1)
Sales P#1/S1 P#2 P#3Demand (Qi)/mts 2000 5 Q1 5 4000 Q2 ≥ 3500 Q3 ≥ 3500Products price (Pi)/USD $450 $580 $660Byproduct price (K1)/USD $12
Direct Material M1 M2 M3Unit price (Mcj)/mt/USD $300 $317 $330Total batches (Xj)/100mts X1 5 65 X2 5 65 X3 5 65Output P#1(Ri)/1 batch (B) R1 = 88 R2 = 91 R3 = 94Output S1(B-Ri)/1 batch (B) 12 9 6P#1 for selling Products (Ti)/mt 1 0.96 0.98Transfer P#1 (Qi/Ti)/ mts toothers process Q1/T1 Q2/T2 Q3/T3
Recycling the S2 byproduct(Qi/Ti) − Qi/ mts (Q2/T2)-Q2 (Q3/T3)-Q3
Unit S2 byproduct cost(Mc2r)/mt/USD $322 $322
Direct LaborCost/USD Lc1 = $66,000; Lc2 = $105,600Labor hours H1 = 10,000; H2 = 14,000Wage rate/USD θ1 = $6.6; θ2 = 9.9
Electrical powerEach batch level 0.75hours/KW 45
Unit level hours/mt 0.1 0.11 KW (Du) cost/USD 85 85 85
MachineMachine hours (Fhi) Fh1 5 176 Fh2 = Q2 Fh3 = Q3Machine cost (Fi)/USD F1 = $100,000 F2 = $50,000 F3 = $150,000
CO2 EmissionCarbon cost (eecb) eec1 = $0; eec2 = $2000; eec3 = $29,000Carbon Q’ty(eeqb) eeq1 = 3000; eeq2 = 4000; eeq3 = 7000Carbon rate (cr)/batch cr = 40Unit carbon (rb)/USD r1 = $0; r2 = $2; r3 = $9;
Other indirect costsOci 3%*Q1*P1 5%*Q2*P2 5%*Q3*P3

Sustainability 2019, 11, 899 21 of 30
5.1. Sales Amount
The first part is the revenue, including the three kinds of products of steel billets (P#1), steelreinforcing bars (P#2), and H beams (P#3), which have the unit prices (Pi) of USD450 (P1), USD580(P2), and USD660 (P3), respectively. The second part is the revenue of the byproduct slag (S1), andthe unit price is USD12 (K1). Additionally, in Process 1, the quantity of input raw material per batchof steel-scrap is limited to 100 (B) mts and the same steel purity level (Mj) for every batch, and eachjth level of steel-scrap does not exceed the number of 65 (Xj) batches in a period, which is due to thecapacity of the furnace. The output quantity of P#1 in each batch depends on the different steel puritylevels (Mj) of the steel-scrap, and their output of Rj includes 88 (R1), 91(R2), and 94(R3) per batch. Onthe other hand, only the amount of byproduct [Xj∗(B – Rj)] in process 1 in a period is the differencebetween the input quantity of steel-scrap raw material (Xj∗B) and the output P#1 (Xj∗Rj). To sum up,the total revenue is expressed, as shown in Equation (1), as ∑3
i=1 PiQi + K1 ∗ [∑3j=1 Xj ∗ (B− Rj)]. We
also consider the quantity of sales constraints for each product in the operational policy; product P#1
can only sell the quantity of Q1 between 2000 (LS1) and 4000 (US1) due to market constraints andcustomers’ needs, while the quantities of other products, Q2 and Q3, should be more than 3500 (LS2
and LS3) mts.
5.2. Direct Material
The direct material of steel-scrap is purchased from the steel recycling industry or obtained fromthe steel-scrap byproducts from Processes 2 and 3. The following introduces the sources of steel-scrapin two ways, external procurement and an internal production byproduct.
5.2.1. Purchasing the Recycling Materials of Steel-Scrap and Producing Products
EAF adopts the recycling material of steel-scrap to produce the P#1 product. The purchaseof steel-scrap not only conforms to the capacity of EAF but also considers the process of pouringsteel-scrap of different dimensions into the EAF. The scrap-steel of different dimensions may includelight, heavy, or small, and the various steel-scraps are poured into an EAF through its hopper and pipeto efficiently batch-produce product P#1.
Surprisingly, steel-scrap is recycled from garbage or completely irregular shapes of scrappedequipment. For example, the garbage of steel-scrap is usually supplied from household goods,including furniture, cans, utensils, etc. Another kind of steel-scrap comes from various wasteequipment, such as automobile, ships, tools, machines, buildings, and other scraped equipment.All raw steel-scraps are mixed with lots of soil, cement, sticky sand, clay, rubber, paint, etc. However,the usable steel-scraps for the EAF must be clean, cut, and crushed through different machines in asteel recycling industry. In addition, steel firms have to request that suppliers in the steel recyclingindustry classify their steel-scrap recycling materials as light, heavy, or small dimensions to meet thepouring process of their EAF.
In this case, the steel-scraps of different steel purity (Mj) can be used as raw material to producesteel products. The following numerals assume that the purchase of steel-scrap focuses only on steelpurity and will affect the yield of steel billets (P#1) and slag byproducts (S1) in the steelmaking process.Green steelmaking manufacturing must conduct a good analysis of procurement, have productionpolicies, and make decisions to maximize profit through a LINGO software.
1. Assume that producing P#1 can use three kinds of direct materials—steel-scrap Mj (M1, M2, andM3). The input material of product P#2 in Process 2 and P#3 in Process 3 come only from the P#1
(semi-manufactured goods called P#1). We also assume that the plant needs three main activitiesto produce these three products (P#1, P#2, and P#3), as shown in Figure 5 in Section 4.1.
2. In process 1, inputting the steel-scrap of Mj into the EAF is for the production of P#1 and S1. P#1,which not only can be sold but also can produce other products (P#2 and P#3). For other products,meaning the semi-manufactured goods, P#1 must be transferred to other processes; one into

Sustainability 2019, 11, 899 22 of 30
Process 2 for producing P#2, another into Process 3 for producing P#3. Additionally, byproductS2 will be produced in two Processes, namely, 2 and 3. The byproduct S2 will become a recycledmaterial of steel-scrap, just as the M2r, and assume that the unit cost of Mc2r is equal to USD322each mt.
3. For the production of P#1, the purchase of three kinds of steel-scrap recycled materials Mj (M1,M2, and M3) are divided into 3 steel purity levels of the M1 lowest, M2 middle, and M3 highestlevels, and the unit costs are USD300 (Mc1), USD317 (Mc2), and USD330 (Mc3), respectively.However, different levels of steel purity per batch (B = 100) will affect the yield of P#1 and S1 inProcess 1, which range from 88, 91, to 94 mts and from 12, 9, to 6 mts, respectively.
5.3. Direct Labor
In a period, in Process 1, we assume that 14 workers work only normal times, including 8 hourseach day and 22 working days. Each batch needs direct labor for h1 hours (17.5 hours), including 14workers and 1.25 hours of working together.
According to a report by the AISI (American Iron & Steel Institute), the labor productivity permt of finished steel is from 10.1 hours in the early 1980s to 1.9 hours in 2015 [20]. In future smartmanufacturing, the labor productivity per mt of finished steel will improve to one hour (h2 or h3) inProcesses 2 and 3.
In terms of normal direct labor hours, H1 is 10,000 labor hours with a wage rate of USD6.6 (θ1)per hour and expands the number of labor hours to H2 = 14,000 with an overtime wage rate of USD9.9(θ2) per hour. Thus, the total labor hours and cost are H = H1µ1 + H2µ2 and Lc = Lc1µ1 + Lc2µ2. Thisindicates that the completion of this case will require overtime labor.
5.4. Electrical Power Cost
According to a report by Taiwan’s Ministry of Economic Affairs (MOEA), the electrical powerper mt of finished steel is about 0.55 KW. In this case, assume that the use of electrical power includesthe batch level in Process 1 and the unit level in Processes 2 and 3 to calculate them. In Process 1, theraw material of steel-scrap in an EAF can contain 100 mts (B) per batch and an electricity consumptionand time of approximately 45 KW (Dn1) and 0.75 hours. In Processes 2 and 3, one metric ton (mt)of finished steel product for P#2 or P#3 takes an hour and about 0.1 KW (Dn2 or Dn3). The electricalpower cost of 1 KW is USD85 (Du). As shown in Equation (1), Du∗Dn1∗(∑3
j=1 Xj) and Du∗ [(Dn2∗Q2)+ (Dn3∗Q3)] represent the total direct electricity power costs at the batch level in Process 1 and twounit-levels in Processes 2 and 3, respectively, as soon as posible.
5.5. Machine Hours and Cost
This steel manufacturing produces three different products P#1, P#2, and P#3 by using differentmachines in different Processes, 1, 2, and 3, respectively. Firstly, in Process 1 for one batch, the normalworking time of the operating machine is 1.25 hours, including 0.5 hours of setting up time and 0.75hours of production time. Normally, the working days are 8 (nh) hours each day and 22 (nd) workingdays in a period, as shown in Equation (12), Fh1 5 176 (8∗22). The total direct machine cost will befixed at F1 = USD100,000 for a period.
In this case, product P#1 can be sold to customers or transferred to Processes 2 and 3 assemi-manufactured goods and be used to produce products P#2 or P#3. Both Processes 2 and 3have 10 separate production lines that can produce different products independently. We assume thateach unit of products P#2 or P#3 takes one hour of working process, but their machine costs in eachprocess are fixed to F2 = USD50,000 and F3 = USD150,000, respectively, for a period. According to theprevious Section 5.1., the Q2 and Q3 have to sell more than 3500 mts individually each period; thus,Fh2 and Fh3 also separately require more than 3500 hours in Processes 2 and 3 in a period.
The terms from Equation (12) Fh2 = 3500 and Fh3 = 3500 are the constraints associated with themachine hours and are equal to the direct labor hours in Processes 2 and 3. The terms in the fifth set of

Sustainability 2019, 11, 899 23 of 30
parentheses in Equation (1), i.e., ∑3i=1 Fi = F1 + F2 + F3 = 100,000 + 50,000 + 150,000 = 300,000, represent
the total direct machine cost.
5.6. CO2 Emission Quantity and Cost
In a period, the carbon footprint will be calculated based on the production batches in Process1 and the quantity of 40 (cr) mts carbon footprint emissions each batch will make. Assume that thecarbon tax rate is free (r1 = 0) when the total carbon emission quantity is less than 3000 mts (eeq1); thecarbon tax rate is r2 (USD2/ each mt) when the carbon emission quantity is between 3000 (eeq1) and4000 (eeq2) mts; and the carbon tax rate is r3 (USD9 /each mt) when the carbon emission quantity isbetween 4000 (eeq2) and 7000 (eeq3) mts. Thus, the total carbon footprint emission quantity and thecarbon tax costs are eeqb = eeq1*γ1 + eeq2*γ2 + eeq3*γ3 = 3000γ1 + 4000γ2 + 7000γ3 and eecb = eec1*γ1
+ eec2*γ2 + eec3*γ3 = 2000γ2 + 29,000γ3, respectively. The constraints associated with the carbon taxcost are shown in Equations (13)–(20).
5.7. Other Indirect Costs
The various direct costs in this case are described above. However, the total operating costs alsoinclude various indirect costs, such as indirect material cost, indirect labor cost, commission fee, etc.Assume that the other indirect costs are estimated by using the percentage of a product’s revenue(pri), i.e., 3%, 5%, and 5% for products P#1, P#2, and P#3, respectively. The seventh term in Equation(1), i.e., ∑3
i=1 Oci = ∑3i=1 PiQi∗pri= Q1∗P1∗3% + Q2∗P2∗5% + Q3∗P3∗5%, represents the total other
indirect costs.
5.8. The Optimal Solution
According to the model, Equations (1)–(20) and the descriptions of Sections 5.1–5.7, themathematical programming model for the illustrative example data, as shown in Table 2 (calledCase 1 in this paper), is presented in Table 3. The model of Case 1 is solved by the LINGO software,and its optimal solution is presented at the bottom of Table 3. The optimal product-mix in the salesquantity of the products (P#i) are (Q1, Q2, Q3) = (2002, 3504, 7105), and the optimal batch numbers ofthree kinds of steel-scrap recycled materials Mj (including: M1 lowest, M2 middle, and M3 highestlevels) are (X1, X2, X3) = (11, 64, 65). In addition, the company needs to use overtime direct labor hours(since η2 = 1), and the carbon tax cost falls within the second taxable range of the carbon emissionquantity (since γ3 = 1).
In addition, the detailed information under the optimal solution is shown in Table 4. For example,from the sales point-of-view, the optimal product-mix for the sales quantity of three products (includingQ1, Q2, Q3) = (2002, 3504, 7105) is subject to the following constraints: 2000 5 Q1 5 4000, Q2 ≥ 3500,and Q3 = 3500. Under this optimal solution, the quantity of the byproduct will be Qp = ∑3
j=1 Xj(B− Rj)
= X1(B-R1) + X2(B-R2) + X3(B-R3) = 11∗(100-88) + 64∗(100−91) + 65∗(100−94) = 1098, since X1 = 11,X2 = 64 and X3 = 65, B = 100, R1 = 88, R2 = 91, and R2 = 94. Additionally, the optimal input quantityof P#1 for salling P#1 and producing P#2-3 is Qi/Ti to obtain Q1 = 2002, Q2 = 3650, and Q3 = 7250, asshown in Table 4.

Sustainability 2019, 11, 899 24 of 30
Table 3. The mathematical programming model and optimal solution (Case1).
MAX Ω = (450∗Q1 + 580∗Q2 + 660∗Q3) + 12 [X1∗(100 − 88) + X2∗(100 − 91) + X3∗(100 − 94)] −[100∗(X1∗300 + X2∗317+ X3∗330)] − [(Q2/0.96∗(1 − 0.96) + (Q3/0.98∗(1 − 0.98)]∗322 − (66,000∗µ1 + 105,600∗µ2) − (85∗45∗(X1 + X2+ X3) + 85∗0.1*Q2 + 85∗0.1*Q3)-300000-(0∗γ1 + 2000∗γ2 + 29,000∗γ3)-(450∗Q1∗0.03 + 580∗Q2∗0.05 +660∗Q3∗0.05)Subject to salesQ1 = 2000Q1 5 4000Subject to direct materialX1 * 88 + X2 * 91 + X3 * 94 − Q1 − Q2/0.96 − Q3/0.98 = 0X1 5 65X2 5 65X3 5 65Subject to machine hours(X1 + X2 + X3) *(0.5 + 0.75) 5 176Q2 = 3500Q3 = 3500Subject to direct labor(X1 + X2 + X3)*17.5 + Q2∗1 + Q3∗1 5 10,000 ∗µ1 + 14,000∗µ2(X1 + X2 + X3)*17.5 5 14∗8∗22;µ0 − η1 5 0;µ1 − η1 − η2 5 0;µ2 − η2 5 0;µ0 + µ1 + µ2 = 1;η1 + η2 = 1;Subject to CO2 Emission(X1 + X2 + X3)∗100∗0.4 = 3000∗γ1 + 4000∗γ2 + 7000∗γ3ψ0 − γ1 ≤ 0,ψ1 − γ1 − γ2 ≤ 0,ψ2 − γ2 − γ3 ≤ 0,ψ3 − γ3 ≤ 0,ψ0 + ψ1 + ψ2 + ψ3 = 1, 0 ≤ψ0,ψ1,ψ2,ψ3 5 1,γ1 + γ2 + γ3 = 1 γ1,γ2,γ3 = 0, 1Optimal decision solution for Case 1Ω = 1,824,129, Q1 = 2002, Q2 = 3504, Q3 = 7105, X1 = 11, X2 = 64, X3 = 65, µ1 = 0.23525, µ2 = 0.76475, η2 = 1,ψ2 = 0.4666667, ψ3 = 0.5333333, γ3 = 1

Sustainability 2019, 11, 899 25 of 30
Table 4. The detailed data list of Case 1 (unit: mt/USD/hours).
Description Material (Mj) for P#1 Products (P#i)
Sales: P#1 P#2 P#3Maximum demand (Qi)/mt 2002 3504 7105Byproduct Q’ty (Qp)/mt 1 1098Selling unit price—product/USD $450 $580 $660Selling unit price—byproduct/USD $12Direct material constraint:Batch-level activity:
Direct material: M1 M2 M3Cost/unit price/mt $300 $317 $330Input total batches (100 mts/1 batch) 11 64 65Output product 1 (P#1): (mts/ 1 batch) 88 91 94P#1 for the P#i/mt 1 0.96 0.98Transfer P#1 (qi) to the ith process/mts 2 2002 3650 7250Recycling the byproduct (M2r) ofproducts 2 and 3/mt 3
Direct labor constraint 0 146 145Labor cost (P#1/P#2/P#3) 4
Labor hours (P#1/P#2/P#3) 5 $16,170 $26,539 $53,575.1Electrical power cost 2450 3504 7105
Batch-level cost 6 $535,500Unit-level cost 6 $29,784 $60,393Direct machine constraintMachine cost $100,000 $50,000 $150,000Machine hours (batch/unit) 175 3504 7105CO2 emission constraintBatch-level mts 7 5600Batch-level cost 8 $16,400Other indirect cost 9 $27,027 $101,616 $234,465
Note: 1 Byproduct Q’ty = 1098 (Qp =∑3j=1 Xj(B− Rj); 2 Transfer P#1(qi) = (Qi/Ti); 3 Recycling the byproduct (M2r)
= (qi-Qi); 4 Labor cost (P#1/P#2–3) (µ1 = 0.23525, µ2 = 0.76475) = $66000*0.23525 + $105600*0.76475 = $96284.1= P#1($16,170) + P#2($26,539) + P#3($53,575.1); 5 Labor hours (µ1 = 0.23525, µ2 = 0.76475) = 10000H*0.23525 +14000H*0.76475 = 13059H = P#1(2450H) + P#2(3504H) + P#3(7105H); 6 Electrical power cost = (85*45*(X1 + X2 + X3)+ 85*0.1*Q2 + 85*0.1*Q3) = P#1($535,500) + P#2($29,784) + P#3($60,393); 7 CO2 emission quantity (ψ2 = 0.4666667, ψ3= 0.5333333) = 3000*ψ1 + 4000*ψ2 + 7000*ψ3 = 5600; 8 CO2 emission cost (ψ2 = 0.4666667, ψ3 = 0.5333333) = 0*ψ1 +2000*ψ2 + 29,000*ψ3 = $16,400; 9 Other indirect cost = 450*Q1*0.03 + 580*Q2*0.05 + 660*Q3*0.05 = P#1($27,027) +P#2($101,616) + P#3($234,465).
6. Three Cases on Enhancing the Quality of Steel-Scrap
This section explores two topics: one is the purchase of high cost steel-scrap and the other isfor increasing the yield of P#1 in the steelmaking process. Assume that the company can producemore quantity of P#1 and reduce the quantity of byproducts in Process 1; if suppliers are requested toconduct more services, meaning to clean, cut, crush, or classify for improving the quality of steel-scrap,then, enhancing the quality of steel-scrap not only increases the productivity of P#1 but also increasesthe business profit.
We will discuss an additional 3 cases, from Case 2 to Case 4, which focus only on the purchase ofthree different levels of steel purity of steel-scrap, where the illustrative data in Case 1 is unchanged.According to Section 5.2.1, there are three levels of steel purity (Mj): M1 lowest (Mc1 = USD 300), M2
middle (Mc2 = USD 317), and M3 highest (Mc3 = USD 330). In Case 2 to Case 4, assume that the costof steel-scrap will gradually increase the purchase cost of USD 8 per mt to arrive at Mcj’ (includingMc1’ = USD 308, Mc2’ = USD 325, and Mc3’ = USD 338) in order to increase the P#1 yield of 2 mt perbatch. Table 5 shows the gradual change in the steel purity levels of steel-scraps from Case 1 to Case4. The purchasing costs from Mcj (including: Mc1, Mc2, Mc3) to Mcj’ (including: Mc1’, Mc2’, Mc3 ‘)are gradually higher, which will also increase the quantity of P#1 from Rj (including: R1, R2, R3) to Rj’

Sustainability 2019, 11, 899 26 of 30
(including: R1’, R2’, R3’). For example, from Case 1 to Case 2, due to the higher quality, the purchaseunit cost of steel-scrap increased from USD300 (Mc1) to USD308 (Mc1’), and the output quantity of P#1
increased from R1(88) to R1’(90) each batch.
Table 5. Cases 1–4 for changes in the unit costs of steel-scrap and the output of P#1 *.
Mcj Mcj’ = Mcj + USD 8
Mc1@300
Mc2@317
Mc3@330
Mc1’@308
Mc2’@325
Mc3’@338
P#1/Batch (100 mts)
Rj Rj’ = Rj + 2 mts
R1 R2 R3 R1’ R2’ R3’
88 91 94 90 93 96
Case 1 300 317 330Case 2 317 330 308Case 3 330 308 325Case 4 308 325 338
* Changes in the purchasing cost of steel-scrap from Mcj to Mcj’ and in the output of P#1 from Rj to Rj’ each batchfrom Case 1 to Case 4.
6.1. Optimal Solution for Cases 1–4
Cases 1–4 are solved by using the LINGO software, and the optimal solutions are shown in Table 6.The first column shows a gradual increase in Ω from Case 1 to Case 4. In comparing Case 1 with Case2, we find that the only difference in the Q3 column of Sales quantity are 7105 in Case 1 and 7056 inCase 2, but the profit of Case 2 (Ω = 1,874,986) is higher than that of Case 1 (Ω = 1,824,129). The reasonis that the input material in Case 2 is adapted at the lowest material cost of Mc1’ (USD308) and thenumber of batches arriving at 65 is more than the other Cases.
Table 6. The optimal solutions for Cases 1–4.
CaseProfit Sales quantity Batches Xj Direct Labor µw CO2 emission ψe
Ω Q1 Q2 Q3 X1 X2 X3 µ1 µ2 ψ2 ψ3 γ3 η2
1 1,824,129 2002 3504 7105 11 64 65 0.23525 0.76475 0.466667 0.533333 1 12 1,874,986 2002 3504 7056 65 16 59 0.24750 0.75250 0.466667 0.533333 1 13 1,885,635 2001 3504 7252 11 65 64 0.19850 0.80150 0.466667 0.533333 1 14 1,909,646 2002 3504 7350 21 54 65 0.17400 0.82600 0.466667 0.533333 1 1
6.2. Further Analysis
The detailed information of the optimal solutions of Cases 1–4 is shown in Table 7. Columns1–3 show the unit costs of the various purity levels of steel-scrap, including from Case 1 (Mc1 = 300,Mc2 = 317, and Mc3 = 330) to Case 4 (Mc1’ = 308, Mc2’ = 325, and Mc3’ = 338), as shown in Table 5.Column 4 shows M2r, the quantity of steel-scrap byproduct from Process 2 or Process 3 in Cases 1–4;column 5 shows the quantity of byproduct Qp = ∑3
j=1 Xj(B− Rj), for example, Qp of Case 1 = 1098,as shown in Table 4. Columns 6 (Pi*Qi) and 7 (K1*Qp) show the sales amounts of three products andthe byproducts, respectively, where P1 = $450, P2 = $580, and P3 = $660; Q1, Q2, and Q3 are as shownin Table 6; and K1 = USD12. Columns 8 (Mcj*Xj*B) and 9 (M2r*Mc2r) show the costs of purchasingmaterials and recycling the byproducts, where B = 100 as discussed in Section 5.1. and Mc2r = 322 asdiscussed in Section 5.2.1. Furthermore, Column 10 shows the labor cost (Lc); columns 11 and 12 showthe electrical power cost (Dci) and carbon emission cost (eecb), and column 13 shows the other indirectcosts (Oci). Table 8 shows the sales, various costs, and total profit for four cases based on the data ofTables 6 and 7.

Sustainability 2019, 11, 899 27 of 30
Table 7. More in-depth information for the optimal solutions (Unit: USD/mt).
Case
AssumptionsMcj→Mcj’ (USD)
Quantity(mt)
Sales Amount(USD) Material Cost (USD) Costs (USD)
(1)Mc1
(2)Mc2
(3)Mc3
(4)M2r
(5)Qp
(6)Pi*Qi
(7)K1*Qp
(8)Mcj*Xj*B
(9)M2r*Mc2r
(10)Lc
(11)Dci
(12)eecb
(13)Oci
1 300 317 330 291 1098 7,622,520 13,176 4,503,800 93,702 96,284 625,677 16,400 363,1082 308 317 330 290 1148 7,590,180 13,776 4,456,200 93,380 95,799 625,260 16,400 361,4913 308 325 330 294 949 7,719,090 11,388 4,563,300 94,668 97,739 626,926 16,400 367,9464 308 325 338 296 848 7,784,220 10,176 4,598,800 95,312 98,710 627,759 16,400 371,193
Table 8. Sales, costs, and total profit of Cases 1–4 (Unit: USD).
Description Case 1 Case 2 Case 3 Case 4
Total sales (A=A1+A2) 7,635,696 100.0% 7,603,956 100% 7,730,478 100% 7,794,396 100%Product sales (A1) 7,622,520 99.8% 7,590,180 99.8% 7,719,090 99.9% 7,784,220 99.9%Byproduct sales (A2) 13,176 0.2% 13,776 0.2% 11,388 0.1% 10,176 0.1%Direct material cost (B=B1-B2) 4,410,098 57.8% 4,362,820 57.4% 4,468,632 57.8% 4,503,488 57.8%Purchasing material (B1) 4,503,800 59.0% 4,456,200 58.6% 4,563,300 59.0% 4,598,800 59.0%Recycling material (B2) 93,702 1.2% 93,380 1.2% 94,668 1.2% 95,312 1.2%Direct labor cost (C) 96,284 1.3% 95,799 1.3% 97,739 1.2% 98,710 1.3%Electrical power cost (D) 625,677 8.2% 625,260 8.2% 626,926 8.1% 627,759 8.1%Machine cost (E) 300,000 3.9% 300,000 3.9% 300,000 3.9% 300,000 3.8%CO2 emission cost (F) 16,400 0.2% 16,400 0.2% 16,400 0.2% 16,400 0.2%Other indirect cost (G) 363,108 4.8% 361,491 4.8% 367,946 4.8% 371,193 4.8%
Total profit (H=A-B-C-D-E-F-G) 1,824,129 23.9% 1,842,186 24.2% 1,852,835 24.0% 1,876,846 24.1%
7. Summary and Conclusions
ABC (Activity-Based Costing) implementation can satisfy the cost information needs of companymanagers. However, ABSC (Activity-Based Standard Costing) may be a suitable costing tool toenhance the business operating abilities of quality, cost, delivery, service, resources, and productivity ina modern smart factory that uses high-tech unmanned vehicles, advanced robots, various sensors, etc.
In the analysis of Cases 1–4, we hypothesized that (1) three levels of steel purity steel-scrap canproduce product P#1 steel billets and byproduct slag S1 and (2) in the purchasing process, each levelof recycled steel-scrap can gradually enhance its steel purity quality, which not only increases theyield of P#1 products but also reduces the quantity of byproduct S1. With some limited resources,the optimal solution and optimal profit are obtained from the mathematical program decision modeland solved using the LINGO software, as shown in Tables 2–8. The final profit, as shown in the lastrow of Table 8, gradually increased from Case 1 to Case 4. Affirmatively, ABSC may be used soonin the digital era. The high-tech manufacturing of EAF adapts the recycled material of steel-scrapfor reproducing various new steel products, which will make great global contributions in terms ofpollution and nature mineral resources.
Finally, ABSC can be used to integrate internal and external systems in MES to connect all real-timeinformation regarding the relevant requirements that will help all industries in the digital age.
Author Contributions: W.-H.T. provided the research idea and the research purpose and designed the research;S.-H.L. provided the research method, collected and analyzed the data, and wrote the paper; C.-T.H. provided theresearch method and analyzed the data; W.-H.T. provided the research method and supervised, corrected, andrevised this paper. All authors read and approved the final manuscript.
Funding: This research was funded by the Ministry of Science and Technology of Taiwan under GrantNo. MOST106-2410-H-008-020-MY3.
Acknowledgments: The authors are extremely grateful to the sustainability journal editorial team and reviewerswho provided valuable comments for improving the quality of this article. The authors also would like tothank the Ministry of Science and Technology of Taiwan for the financial support of this research under GrantNo. MOST106-2410-H-008-020-MY3.
Conflicts of Interest: The authors declare no conflict of interest.

Sustainability 2019, 11, 899 28 of 30
References
1. Qin, J.; Liu, Y.; Grosvenor, R. A Categorical Framework of Manufacturing for Industry 4.0 and Beyond.Procedia CIRP 2016, 52, 173–178. [CrossRef]
2. Kletti, J. Manufacturing Execution System-MES; Springer: Berlin/Heidelberg, Germany; New York, NY, USA,2007; pp. 61–78.
3. Tsai, W.-H.; Yang, C.-H.; Chang, J.-C.; Lee, H.-L. An-Activity-Based Costing Decision Model for Life CycleAssessment in Green Building Projects. Eur. J. Oper. Res. 2014, 238, 607–619. [CrossRef]
4. Wikipedia. Steelmaking. Available online: https://en.m.wikipedia.org/wiki/Steelmaking (accessed on 23January 2019).
5. American Iron and Steel Institute. Steel Production, Recycling. Available online: http://www.steel.org/about-aisi/industry-profile.aspx (accessed on 23 January 2019).
6. Tsai, W.-H. Activity-Based Costing Model for Joint Products. Comput. Ind. Eng. 1996, 31, 725–729. [CrossRef]7. Tsai, W.-H. Project Management Accounting Using Activity-Based Costing Approach. In The Handbook
of Technology Management; Bidgoli, H., Ed.; John Wiley & Sons, Inc.: Hoboken, NJ, USA, 2010; Volume 1,pp. 469–488.
8. Tsai, W.-H. A technical note on using work sampling to estimate the effort on activities under activity-basedcosting. Int. J. Prod. Econ. 1996, 43, 11–16. [CrossRef]
9. Wagner, T.; Herrmann, C.; Thiede, S. Industry 4.0 impacts on lean production systems. Procedia CIRP 2017,63, 125–131. [CrossRef]
10. Bedolla, J.S.; D’Antonio, G.; Chiabert, P. A novel approach for teching IT tools with Lerning Factories.Procedia Manuf. 2017, 7, 175–181. [CrossRef]
11. Liu, C.; Xu, X. Cyber-Physical Machine Tool—The Era of Machine Tool 4.0. Procedia CIRP 2017, 63, 70–75.[CrossRef]
12. Pacaux-Lemoine, M.P.; Trentesaux, D.; Rey, G.Z.; Millot, P. Designing intelligent manufacturing systemsthrough Human-Machine Cooperation principles: A human-centered approach. Comput. Ind. Eng. 2017, 111,581–595. [CrossRef]
13. Gašová, M.; Gašo, M.; Štefánik, A. Advanced industrial tools of ergonomics based on Industry 4.0. ProcediaEng. 2017, 192, 219–224. [CrossRef]
14. Santos, M.Y.; e Sá, J.O.; Andrade, C.; Lima, F.V.; Costa, E.; Costa, C.; Martinho, B.; Galvão, J. A Big Datasystem supporting Bosch Braga Industry 4.0 strategy. Int. J. Inf. Manag. 2017, 36, 750–760. [CrossRef]
15. Moutaz, H.; Ahmed, E. The Readiness of ERP Systems for the Factory of the Future. Procedia Comput. Sci.2015, 64, 721–728.
16. Grundstein, S.; Freitag, M.; Scholz-Reiter, B. A new method for autonomous control of complex job shops-Integrating order release, sequencing and capacity control to meet due dates. J. Manuf. Syst. 2017, 42, 11–28.[CrossRef]
17. Kans, M.; Ingwald, A. Business Model Development towards Service Management 4.0. Procedia CIRP 2016,47, 489–494. [CrossRef]
18. Wang, S.; Wan, J.; Zhang, D.; Li, D.; Zhang, C. Towards smart factory for industry 4.0: A self-organizedmulti-agent system with big data based feedback and coordination. Comput. Netw. Volume 2016, 101, 158–168.[CrossRef]
19. Stock, T.; Seliger, G. Opportunities of Sustainable Manufacturing in Industry 4.0. Procedia CIRP 2016, 40,536–541. [CrossRef]
20. Becker, T.; Stern, H. Future trends in human work area design for cyber-physical production system. ProcediaCIRP 2016, 57, 404–409. [CrossRef]
21. Wikipedia. Paris Agreement. Available online: https://en.wikipedia.org/wiki/parisagreement (accessed on15 March 2018).
22. Tung Ho Steel Enterprise Corp. Profile, CSR, Products. Available online: http://www.tunghosteel.com/EN/HomeEg/about/intro (accessed on 23 January 2019).
23. Tsai, W.-H.; Lin, S.-J.; Liu, J.-Y.; Lin, W.-R.; Lee, K.-C. Incorporating life cycle assessments into buildingproject decision-making: An energy consumption and CO2 emission perspective. Energy 2011, 36, 3022–3029.[CrossRef]

Sustainability 2019, 11, 899 29 of 30
24. Bauerdick, C.J.; Helfert, M.; Menz, B.; Abele, E. A common sofrware Framework for Energy Data BasedMonitoring and Controlling for Machine power Peak Reduction and Workpiece Quality Improvements.Procedia CIRP 2017, 61, 359–364. [CrossRef]
25. Chen, J.-Y.; Tai, K.-C.; Chen, G.-C. Application of programmable Logic Controller to Build-up an IntelligentIndustry 4.0 Platform. Procedia CIRP 2017, 63, 150–155. [CrossRef]
26. Rudolph, J.P.; Emmelmann, C. A Cloud-Based Platform for Automted Order Processing in AdditiveManufacturing. Procedia CIRP 2017, 63, 412–417. [CrossRef]
27. Chen, K.-C.; Lien, S.-Y. Machine-to-machine communications: Technologies and challenges. Ad Hoc Netw.2014, 18, 3–23. [CrossRef]
28. Tsai, W.-H.; Lin, T.-W.; Chou, W.-C. Integrating Activity-Based Costing and Environmental Cost AccountingSystems: A Case Study. Int. J. Bus. Syst. Res. 2010, 4, 186–208. [CrossRef]
29. Tsai, W.-H.; Lin, T.W. A Mathematical Programming Approach to Analyze the Activity-Based CostingProduct-Mix Decision with Capacity Expansions. In Applicatios of Management Science; Lawrence, K.D., Ed.;JAI Press Inc.: Greenwich, CT, USA, 2004; Volume 11, pp. 161–176.
30. Chinnathai, M.K.; Günther, T.; Ahmad, M.; Stocker, C.; Richter, L.; Schreiner, D.; Vera, D.; Reinhart, G.;Harrison, R. An application of physical flexibility and software reconfigurability for the automation ofbattery module assembly. Procedia CIRP 2017, 63, 604–609. [CrossRef]
31. de Sampaio, R.J.; Wollmann, R.R.; Vieira, P.F. A flexible production planning for rolling-horizons. Int. J.Product. Econ. 2017, 190, 31–36. [CrossRef]
32. de Man, J.C.; Strandhagen, J.O. An Industry 4.0 research agenda for sustainable business models. ProcediaCIRP 2017, 63, 721–726. [CrossRef]
33. Poonpakdee, P.; Koiwanit, J.; Yuangyai, C. Decentralized Network Building Change in Large ManufacturingCompanyies towards Industry 4.0. Procendia Comput. Sci. 2017, 110, 46–53. [CrossRef]
34. Meissner, H.; Ilsen, R.; Aurich, J.C. Analysis of control architectures in the context of Industry 4.0. ProcediaCIRP 2017, 62, 165–169. [CrossRef]
35. Kolsch, P.; Herder, C.F.; Zimmermann, V.; Aurich, J.C. A novel concept for the development of availability-oriented business models. Procedial CIRP 2017, 64, 340–344. [CrossRef]
36. Schlegel, A.; Langer, T.; Putz, M. Developing and harnessing the potential of SMEs for eco-efficient flexibleproduction. Procedia Manuf. 2017, 9, 41–48. [CrossRef]
37. Majstorovic, V.; Stojadinovic, S.; Zivkovic, S.; Djurdjanovic, D.; Jakovljevic, Z.; Gligorijevic, N. Cyber-PhysicalManufacturing Metrology Model (CPM) for sculptured surfaces- Turbine Blade Application. Procedia CIRP2017, 63, 658–663. [CrossRef]
38. Lee, J.; Bagheri, B.; Kao, H.A. A Cyber-Physical Systems architecture for Industry 4.0-based manufacturingsystems. Manuf. Lett. 2015, 3, 18–23. [CrossRef]
39. Li, H.; Parlikad, A.K. Social Internet of Industrial Things for Industrial and Manufacturing Assets. IFAC2016, 49, 208–213.
40. Functional SAP ERP Modules. SAP ERP Modules: Complete List of SAP ERP Modules. Available online:https://solutiondots.com/blog/sap-erp-modules/ (accessed on 13 January 2019).
41. Tsai, W.-H.; Yang, C.-H.; Huang, C.-T.; Wu, Y.-Y. The Impact of the Carbon Tax Policy on Green BuildingStrategy. J. Environ. Plan. Manag. 2017, 60, 1412–1438. [CrossRef]
42. Tsai, W.-H.; Tsaur, T.-S.; Chou, Y.-W.; Liu, J.-Y.; Hsu, J.-L.; Hsieh, C.-L. Integrating the Activity-BasedCosting System and Life-Cycle Assessment into Green Decision Making. Int. J. Prod. Res. 2015, 53, 451–465.[CrossRef]
43. Tsai, W.-H.; Chang, J.-C.; Hsieh, C.-L.; Tsaur, T.-S.; Wang, C.-W. Sustainability Concept in Decision-Making:Carbon Tax Consideration for Joint Product Mix Decision. Sustainability 2016, 8, 1232. [CrossRef]
44. Tsai, W.-H. A Green Quality Management Decision Model with Carbon Tax and Capacity Expansion underActivity-Based Costing (ABC)—A Case Study in the Tire Manufacturing Industry. Energies 2018, 11, 1858.[CrossRef]
45. Tsai, W.-H. Carbon Taxes and Carbon Rights Cost Analysis for the Tire Industry. Energies 2018, 11, 2121.[CrossRef]
46. Tsai, W.-H.; Lu, Y.-H. A Framework of Production Planning and Control with Carbon Tax under Industry4.0. Sustainability 2018, 10, 3221. [CrossRef]

Sustainability 2019, 11, 899 30 of 30
47. Tsai, W.-H. Green Production Planning and Control for the Textile Industry by Using MathematicalProgramming and Industry 4.0 Techniques. Energies 2018, 11, 2072. [CrossRef]
48. Tsai, W.-H.; Jhong, S.-Y. Carbon Emission Cost Analysis with Activity-Based Costing. Sustainability 2018, 10,2872. [CrossRef]
49. Tsai, W.-H.; Jhong, S.-Y. Production Decision Model with Carbon Tax for the Knitted Footwear Industryunder Activity-Based Costing. J. Clean. Prod. 2019, 207, 1150–1162. [CrossRef]
50. Tsai, W.-H.; Lai, S.-Y. Green Production Planning and Control Model with ABC under Industry 4.0 for thePaper Industry. Sustainability 2018, 10, 2932. [CrossRef]
51. Tsai, W.-H.; Chu, P.-Y.; Lee, H.-L. Green Activity-Based Costing Production Planning and Scenario Analysisfor the Aluminum-Alloy Wheel Industry under Industry 4.0. Sustainability 2019, 11, 756. [CrossRef]
© 2019 by the authors. Licensee MDPI, Basel, Switzerland. This article is an open accessarticle distributed under the terms and conditions of the Creative Commons Attribution(CC BY) license (http://creativecommons.org/licenses/by/4.0/).