actuarial analysis and certification for the minnesota...
TRANSCRIPT

1
5/30/2017
Actuarial Analysis and Certification for the
Minnesota Section 1332 Waiver Application
Minnesota Department of Commerce
Division of Insurance
May 30, 2017

2
5/30/2017
Table of Contents
Introduction 3
Targets and Modeling Overview 3
Scenario Modeling Approach and Major Assumptions 4
Assumptions Used in Model 4
Distributions from Minnesota Premium Security Plan to Health Insurers 6
Calculation of Second-Lowest Silver Premiums Before and After the Waiver 7
10-Year Forecast: Mid-Scenario Results 9
Scenario Results / Various Second-Lowest Silver Rates 10
Effect on Minnesotans with Insurance 12
Discussion of Findings 13
Additional Details on Assumptions and Methods 13
2017 Average and Second-Lowest Silver Premiums 13
Differential between Premiums at Different Levels of Enrollment (Price Elasticity) 16
Basic Health Plan (BHP) Impact 17
Data Sources 18
Administrative Costs 18
Individual Market Enrollment 19
Premiums 20
Morbidity 22
Benefit Design and Covered Services 22
Economic Analysis to Supplement Actuarial Analysis 23
Combined Actuarial and Economic Analysis Results 35
Actuarial Certifications 36
Appendices 37
Appendix 1 - More Data On Reinsurance Program Distributions 37
Appendix 2 - More Data Sources on Claims and Morbidty 39
Appendix 3 - The Role of Enrollees’ Income in the Model 43
Appendix 4 - Reliance Statement 48
Appendix 5 - Additional Modeling Results and Information on Targets 49

3
5/30/2017
Introduction
This actuarial report supplements the related 1332 waiver application seeking federal funding for Minnesota’s
individual market. The report also illustrates the impact of this waiver on federal funding to Minnesota’s Basic
Health Plan (BHP) as neutral to the federal deficit. The report also demonstrates that over a range of reasonable
scenarios, projected federal spending net of federal revenues under the waiver will be equal to or lower than
projected federal spending net of federal revenues in the absence of the waiver.
This actuarial report is designed to be read in concert with the waiver application.
Targets and Modeling Overview
The main goals of Minnesota’s reinsurance program are to reduce premium rates from where they would be
without the program and to encourage healthy people to participate in the individual market. The state
legislation that created Minnesota’s reinsurance program, the Minnesota Premium Security Plan (MPSP),
establishes 2018 payment parameters that will provide health insurers with 80 percent coinsurance at an
attachment point of $50,000 and a reinsurance cap of $250,000 for plan year 2018.
The resulting lower premium rates will save the federal government money through lower individual market
premium tax credits (PTCs). These savings are modeled to be approximately $138 million to $167 million in
2018 under a wide range of scenarios (see Tables A-3 and A-5), reflecting reasonable ranges of premium levels,
enrollment, inflation, morbidity, and second-lowest silver premiums.
Decreases to federal revenues or increases to federal spending are also modeled. The most material factors are
reduction in individual shared responsibility payment revenue and reduction in health insurance providers’ fee
revenue. These losses are estimated to be approximately 4 to 7 percent of the federal premium tax credit
savings over the 10-year budget projection period.
Commerce evaluated extensive data sources in order to model how the MPSP will affect the premium tax
credits. Commerce also modeled the likely premium support delivered and the progression of the major funding
sources over the required 10-year budget forecast period at level state financing amounts and resulting
premium subsidy scenarios. Commerce modeled a range of reasonable enrollment and inflation scenarios. The
MPSP modeling shows that Minnesota will derive a portion of financial support from the new state funding
source and a portion from the federal government reflecting the difference in premium tax credits1 with and
without the MPSP.
1 Section 36B of the Internal Revenue Code (IRC) describes premium tax credits.

4
5/30/2017
In addition, Minnesota has a BHP, MinnesotaCare. The BHP funding formula is tied to the second-lowest silver
plan in the market, meaning that federal funding for the program would be directly affected by the existence of
the MPSP. However, as modeled in this report, the impact of this waiver to support the MPSP is neutral to both
state and federal budgets.
Values modeled in this report are illustrative only; the formula to be used is not publicly known and is not an
element that is possible to be requested as part of the waiver application.
The following analyses and actuarial certification demonstrate that the proposed waiver will comply with the
uninsured rate and the federal deficit requirements of Section 1332 of the Affordable Care Act (ACA). The results
section is broken into the following subjects:
A discussion of the major assumptions affecting the state’s strategy and federal savings.
Documentation for the selected distribution model for the subsidy, which is similar to the temporary
federal reinsurance program that was in place from 2014 through 2016.
Scenario modeling of the individual market subsidy appropriations, subsidy pool (including from state
and federal waiver sources), federal total savings for the individual market, and the final second-lowest
silver and average premiums with the subsidy applied. Multiple scenarios are modeled in order to
provide a 10-year budget outlook and summary and to ensure requirements are met over a range of
reasonably likely scenarios.
Major findings based on the modeled scenarios.
Scenario Modeling Approach and Major Assumptions
Calculating the difference between federal premium tax credits with and without the waiver requires estimates
of the number of enrollees receiving premium tax credits with and without the waiver and estimates of the
average second-lowest silver premium rate with and without the waiver.
These factors or inputs (such as age/rating area mix, medical trend, health of enrollees) are unknown for 2018
and beyond. For this reason, Commerce utilized a scenario modeling approach as an effective manner for
modeling federal savings over the required 10-year period because there are many reasonably likely scenarios
over such a period. A scenario modeling approach also aids in coupling assumptions that tend to correlate,
either positively or negatively, to one another. For example, a high premium level is correlated to lower
enrollment. The state modeled 18 reasonably likely scenarios based on a reasonable range of possibilities
regarding the most critical factors.
Assumptions Used in Model
Here is a description of the input factors that were modeled: (L – low but reasonable, M – mid estimate, and H –
high but reasonable):
5
5/30/2017
2018 second-lowest silver premium with/without any waiver or state legislation: Because enrollment
in 2017 decreased significantly, Commerce modeled the 2018 average premiums (across all metal levels,
ages, and rating areas) from the 2017 estimated value of $560 to a range of three values: $668.00 (L-
Prm), $688.00 (M-Prm), and $708.00 (H-Prm). The corresponding average second-lowest silver
premiums were modeled from the 2017 estimated value of $540.65 to a range of six values. These
values start with the 2017 relationship between average second-lowest silver premium and average
premium (97 percent). However with the new de minimis variation rules that will likely reduce the
relativity, the 2018 best estimate for this relationship is 94%. Three of the values modeled use a 94
percent relationship, and these values are: $628 (L-Prm), $647 (M-Prm), and $666 (H-Prm). The other
three values are based on a 98 percent relationship between average second-lowest silver premium and
average premium, which assumes greater acceleration of the marketwide shift from higher-value metal
level plans to bronze plans. For 2018, these values are: $655 (L-Prm), $674 (M-Prm), and $694 (H-Prm).
o The second-lowest silver premium before and after the waiver has a direct impact on the
premium tax credit savings. The basis for this relational assumption is discussed in detail in the
Data Sources section of this report.
Individual market premium inflation: The state modeled that premiums on the individual market after
2018 could take different paths of inflation. Assuming that the market would be stable after 2018,
Commerce assumed the following average inflation levels: 5 percent (L-inf), 6.5 percent (M-inf), and 10
percent (H-inf). The cost of the MPSP is assumed to increase at a rate 3.5 percent higher than market
premium inflation under each of the three inflation scenarios. The reinsurance program trend rate is
assumed to be higher than the premium inflation trend rate because the trend is more highly leveraged.
2018-2027 individual market enrollment with/without the waiver: The state modeled the following
scenarios for enrollment with/without the waiver: 160,000/140,000 (L-En), 170,000/150,000 (M-En),
and 190,000/160,000 (H-En). These levels are low in comparison to peak enrollment numbers in 2015.
These scenarios acknowledge that, even with the MPSP, some people may not return to the individual
market at the subsidized premium rates due to past experiences, newly-found insurance alternatives, or
the likelihood that premium rates will still rise from year to year even with the MPSP. If enrollment
returns to prior levels, federal savings would be greater than what is modeled in this report because
morbidity savings would be even larger than modeled. Because healthy enrollees are more likely than
sick enrollees to forego insurance and pay the individual shared responsibility payment, the L-En / H-
Prem scenario is modeled to reflect this negative correlation.
Premium tax credit-eligible enrollee count: Based on the respective eligibility scenario described above,
the following numbers of premium-tax-credit-eligible enrollees were modeled: 75,000 (L), 77,000 (M)
and 85,000 (H). Note that the range of members is relatively small because these enrollees are price

6
5/30/2017
insensitive, given that the federal government subsidizes the rate increases under the various
inflationary scenarios. The range is included because Minnesota has historically had an atypically low
level of both subsidized enrollees and proportional use of the exchange. The proportion of premium tax
credit eligible enrollees as compared to the entire individual enrollee count has a direct impact on the
premium tax credit savings.
Risk margin: Health insurers’ risk margin on MPSP impacts is estimated to be 10 percent. It is assumed
that only 90 percent of the aggregate subsidy will be passed on to policyholders due to carriers’
uncertainty related to acute claims in excess of $50,000.
Distributions from Minnesota Premium Security Plan to Health Insurers
The MPSP is very similar in design to the temporary federal reinsurance program that was in place from 2014
through 2016. The parameters for 2018, set in law, are:
Attachment Point: $50,000
Coinsurance Rate: 80%
Reinsurance Cap: $250,000
As an example of the payments to carriers, if a person has $60,000 of claims in 2018, the reimbursement to the
carrier would be:
$8,000 = [80% * (60,000 - 50,000)]
If a person has $600,000 of claims in 2018, the reimbursement to the carrier would be:
$160,000 = [80% * (250,000 – 50,000)]
The Minnesota Comprehensive Health Association (MCHA) will administer the MPSP, collect data to determine
reinsurance payments, and disburse reinsurance payments to each eligible health carrier. After plan year 2018,
the MCHA Board will determine the payment parameters each year, taking into account available funding, to
ensure stabilized premiums, increased market participation, improved access to providers, and mitigation of the
impact of high-risk individuals.2
The studies performed to verify the cost of aggregate subsidy provided by the MPSP are provided in the
Appendices.
2 MPSP program operations are discussed in greater detail in the 1332 waiver application.
7
5/30/2017
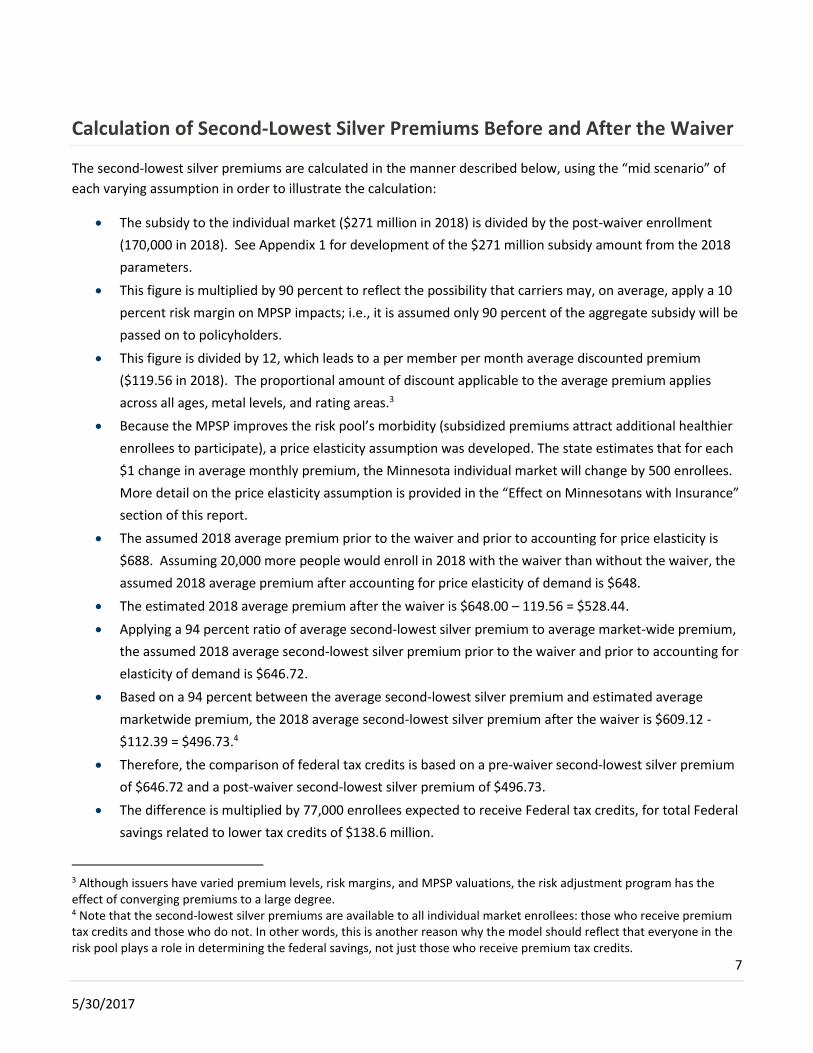
Calculation of Second-Lowest Silver Premiums Before and After the Waiver
The second-lowest silver premiums are calculated in the manner described below, using the “mid scenario” of
each varying assumption in order to illustrate the calculation:
The subsidy to the individual market ($271 million in 2018) is divided by the post-waiver enrollment
(170,000 in 2018). See Appendix 1 for development of the $271 million subsidy amount from the 2018
parameters.
This figure is multiplied by 90 percent to reflect the possibility that carriers may, on average, apply a 10
percent risk margin on MPSP impacts; i.e., it is assumed only 90 percent of the aggregate subsidy will be
passed on to policyholders.
This figure is divided by 12, which leads to a per member per month average discounted premium
($119.56 in 2018). The proportional amount of discount applicable to the average premium applies
across all ages, metal levels, and rating areas.3
Because the MPSP improves the risk pool’s morbidity (subsidized premiums attract additional healthier
enrollees to participate), a price elasticity assumption was developed. The state estimates that for each
$1 change in average monthly premium, the Minnesota individual market will change by 500 enrollees.
More detail on the price elasticity assumption is provided in the “Effect on Minnesotans with Insurance”
section of this report.
The assumed 2018 average premium prior to the waiver and prior to accounting for price elasticity is
$688. Assuming 20,000 more people would enroll in 2018 with the waiver than without the waiver, the
assumed 2018 average premium after accounting for price elasticity of demand is $648.
The estimated 2018 average premium after the waiver is $648.00 – 119.56 = $528.44.
Applying a 94 percent ratio of average second-lowest silver premium to average market-wide premium,
the assumed 2018 average second-lowest silver premium prior to the waiver and prior to accounting for
elasticity of demand is $646.72.
Based on a 94 percent between the average second-lowest silver premium and estimated average
marketwide premium, the 2018 average second-lowest silver premium after the waiver is $609.12 -
$112.39 = $496.73.4
Therefore, the comparison of federal tax credits is based on a pre-waiver second-lowest silver premium
of $646.72 and a post-waiver second-lowest silver premium of $496.73.
The difference is multiplied by 77,000 enrollees expected to receive Federal tax credits, for total Federal
savings related to lower tax credits of $138.6 million.
3 Although issuers have varied premium levels, risk margins, and MPSP valuations, the risk adjustment program has the effect of converging premiums to a large degree. 4 Note that the second-lowest silver premiums are available to all individual market enrollees: those who receive premium tax credits and those who do not. In other words, this is another reason why the model should reflect that everyone in the risk pool plays a role in determining the federal savings, not just those who receive premium tax credits.

8
5/30/2017
An affordability adjustment, “income factor”, of 0.2 percent is made to recognize that a portion of the
individual market population that will receive a full premium tax credit without the waiver will not
receive it with the waiver (see Appendix 3). The resulting total Federal savings related to lower tax
credits is $138.3 million.

9
5/30/2017
10-Year Forecast: Mid-Scenario Results
Focusing on the “mid” estimates for each modeled assumption, the following tables provide detail on how all of
the 18 scenario calculations shown later were developed.
Mid estimate assumptions:
Individual market premium inflation: 6.5%
Subsidy inflation: 10%
2018-2027 Enrollment with/without waiver: 170,000/150,000
Premium tax credit eligible enrollee count: 77,000
2018 Carrier Premium without waiver5: $688.00 (average)
2018 Carrier Premium without waiver: $646.72 (average second-lowest silver)
Income Factor6 0.2 percent
Table A-1
Consideration of BHP pass through with the waiver is described in a separate section of this report.
Considerations of economic factors increasing federal net costs, including reduction in shared responsibility
payments, reduction in health insurer providers’ fees, and administrative fees are described in the Economic
Analysis section near the end of this report.
5 Per Minnesota Statutes section 62E.22, health carriers must submit as part of their rate filings the premium amount the carrier would have charged without the MPSP. This data could be used by federal staff to verify savings. 6 A small portion of individual market enrollees who would otherwise be eligible for premium tax credits will not receive them due to post-waiver premiums falling below certain percentage of household income levels. See Appendix 3.
Year
Enrollment
without
Waiver
Enrollment
with
Waiver
Modeled Second
Lowest Silver
(without waiver)
Modeled Second Lowest
Silver (with waiver and
reflects waiver)
Federal Premium Tax
Credit Savings
Subsidy to Individual
Market Inflated with
leveraged trend
2016 267,000 267,000 90% 99.8% 10%
2017 170,000 170,000 issuer reinsurance risk margin Adjustment for Income Factor leveraged trend (reinsurance)
2018 150,000 170,000 646.72$ 496.73$ 138,309,239$ 271,000,000$
2019 150,000 170,000 688.76$ 525.09$ 150,926,611$ 298,100,000$
2020 150,000 170,000 733.53$ 554.89$ 164,726,839$ 327,910,000$
2021 150,000 170,000 781.21$ 586.20$ 179,823,082$ 360,701,000$
2022 150,000 170,000 831.98$ 619.07$ 196,339,480$ 396,771,100$
2023 150,000 170,000 886.06$ 653.55$ 214,412,234$ 436,448,210$
2024 150,000 170,000 943.66$ 689.70$ 234,190,786$ 480,093,031$
2025 150,000 170,000 1,004.99$ 727.56$ 255,839,120$ 528,102,334$
2026 150,000 170,000 1,070.32$ 767.18$ 279,537,188$ 580,912,568$
2027 150,000 170,000 1,139.89$ 808.62$ 305,482,484$ 639,003,824$
10
5/30/2017
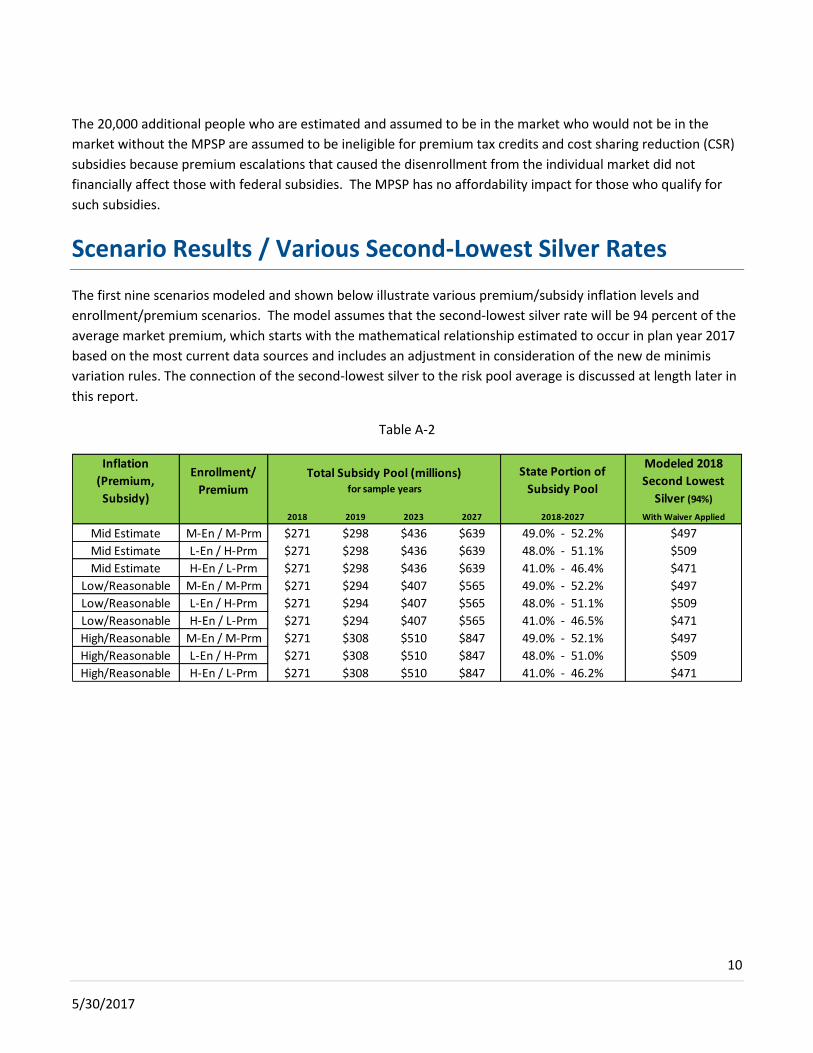
The 20,000 additional people who are estimated and assumed to be in the market who would not be in the
market without the MPSP are assumed to be ineligible for premium tax credits and cost sharing reduction (CSR)
subsidies because premium escalations that caused the disenrollment from the individual market did not
financially affect those with federal subsidies. The MPSP has no affordability impact for those who qualify for
such subsidies.
Scenario Results / Various Second-Lowest Silver Rates
The first nine scenarios modeled and shown below illustrate various premium/subsidy inflation levels and
enrollment/premium scenarios. The model assumes that the second-lowest silver rate will be 94 percent of the
average market premium, which starts with the mathematical relationship estimated to occur in plan year 2017
based on the most current data sources and includes an adjustment in consideration of the new de minimis
variation rules. The connection of the second-lowest silver to the risk pool average is discussed at length later in
this report.
Table A-2
Inflation
(Premium,
Subsidy)
Enrollment/
Premium
2018 2019 2023 2027
Mid Estimate M-En / M-Prm $271 $298 $436 $639 49.0% - 52.2%
Mid Estimate L-En / H-Prm $271 $298 $436 $639 48.0% - 51.1%
Mid Estimate H-En / L-Prm $271 $298 $436 $639 41.0% - 46.4%
Low/Reasonable M-En / M-Prm $271 $294 $407 $565 49.0% - 52.2%
Low/Reasonable L-En / H-Prm $271 $294 $407 $565 48.0% - 51.1%
Low/Reasonable H-En / L-Prm $271 $294 $407 $565 41.0% - 46.5%
High/Reasonable M-En / M-Prm $271 $308 $510 $847 49.0% - 52.1%
High/Reasonable L-En / H-Prm $271 $308 $510 $847 48.0% - 51.0%
High/Reasonable H-En / L-Prm $271 $308 $510 $847 41.0% - 46.2%
$509
$471
$497
$509
$471
$497
$509
$471
$497
Total Subsidy Pool (millions) for sample years
State Portion of
Subsidy Pool
Modeled 2018
Second Lowest
Silver (94%)
2018-2027 With Waiver Applied

11
5/30/2017
Table A-3
The next nine scenarios modeled and shown below illustrate various premium/subsidy inflation levels and
enrollment/premium scenarios. The model assumes that the second-lowest silver rate will be 98 percent of the
average market premium. This relationship reflects a scenario where a higher-than-expected number of
enrollees migrate from higher cost-sharing plans to bronze plans than expected in the scenarios shown above.
Table A-4
Inflation
(Premium,
Subsidy)
Enrollment/
Premium
2018 2019 2023 2027
Best Estimate M-En / M-Prm $138 $151 $214 $305
Best Estimate L-En / H-Prm $141 $154 $219 $312
Best Estimate H-En / L-Prm $160 $174 $244 $343
Low/Reasonable M-En / M-Prm $138 $149 $200 $270
Low/Reasonable L-En / H-Prm $141 $152 $204 $276
Low/Reasonable H-En / L-Prm $160 $171 $227 $302
High/Reasonable M-En / M-Prm $138 $156 $251 $406
High/Reasonable L-En / H-Prm $141 $159 $256 $415
High/Reasonable H-En / L-Prm $160 $179 $285 $455
IRC 36B Funding Section 1332 Waiver
Request = Federal Savings (millions)
(Individual Market)
Inflation
(Premium,
Subsidy)
Enrollment/
Premium
2018 2019 2023 2027
Mid Estimate M-En / M-Prm $271 $298 $436 $639 46.8% - 50.2%
Mid Estimate L-En / H-Prm $271 $298 $436 $639 45.7% - 49.0%
Mid Estimate H-En / L-Prm $271 $298 $436 $639 38.5% - 44.1%
Low/Reasonable M-En / M-Prm $271 $294 $407 $565 46.8% - 50.2%
Low/Reasonable L-En / H-Prm $271 $294 $407 $565 45.7% - 49.1%
Low/Reasonable H-En / L-Prm $271 $294 $407 $565 38.5% - 44.2%
High/Reasonable M-En / M-Prm $271 $308 $510 $847 46.8% - 50.1%
High/Reasonable L-En / H-Prm $271 $308 $510 $847 45.7% - 48.9%
High/Reasonable H-En / L-Prm $271 $308 $510 $847 38.5% - 44.0%
$518
$530
$491
$491
$518
$530
2018-2027 With Waiver Applied
$518
$530
$491
Total Subsidy Pool (millions) for sample years
State Portion of
Subsidy Pool
Modeled 2018
Second Lowest
Silver (98%)

12
5/30/2017
Table A-5
Additional considerations and background on these scenarios are provided in the “Assumptions and Methods
Section” and the “Data Sources” sections of this report.
Effect on Minnesotans with Insurance
One of the key requirements of a Section 1332 waiver is that the overall strategy must support and demonstrate
that more people will have health insurance due to the proposed waiver. Because the MPSP supports
significantly lower premiums, more Minnesotans will be able to afford insurance or be willing to purchase the
insurance as it will be more valuable (that is, the same comprehensive benefits will be available at a significantly
lower price). Enrollment scenarios presented in the scenario model support this conclusion. Additional
information on price elasticity assumptions is included in this section.
The level of overall enrollment shown in the scenarios recognizes that many people have left the individual
market in 2016 and 2017. The association between enrollment and premium is based on the price elasticity
estimated in the Minnesota individual marketplace. In order to model Minnesota’s price elasticity, Commerce
reviewed the 2015 premium and enrollment data from the issuers’ Uniform Rate Review Template (URRT) and
compared the data to the modeled average 2016 premiums as well as the enrollment level for 2016. Minnesota
estimates that for each $1 change in average monthly premium, the Minnesota individual market is expected to
change by 500 enrollees. The reasonableness of this relationship was verified by reviewing 2017 premiums and
estimated 2017 enrollment. The state assumed that after 2018, enrollment will hold level regardless of health
premium inflation in order to focus on the “with” versus “without” subsidy analysis. More detail regarding the
price elasticity assumption is provided in the “Assumptions and Methods” section of this report.
Inflation
(Premium,
Subsidy)
Enrollment/
Premium
2018 2019 2023 2027
Best Estimate M-En / M-Prm $144 $157 $224 $318
Best Estimate L-En / H-Prm $147 $160 $228 $326
Best Estimate H-En / L-Prm $167 $181 $254 $357
Low/Reasonable M-En / M-Prm $144 $155 $209 $281
Low/Reasonable L-En / H-Prm $147 $158 $213 $288
Low/Reasonable H-En / L-Prm $167 $179 $237 $315
High/Reasonable M-En / M-Prm $144 $162 $262 $423
High/Reasonable L-En / H-Prm $147 $166 $267 $433
High/Reasonable H-En / L-Prm $167 $187 $297 $475
IRC 36B Funding Section 1332 Waiver
Request = Federal Savings (millions)
(Individual Market)
13
5/30/2017
Discussion of Findings
Neutral federal deficit impact is a reliable outcome of the MPSP under all future
economic scenarios.
Overall, Commerce’s modeling projects that the federal deficit will not increase under any modeled scenario,
even after inclusion of funding to offset savings from the difference in premium tax credits before and after the
MPSP.
Additional Details on Assumptions and Methods
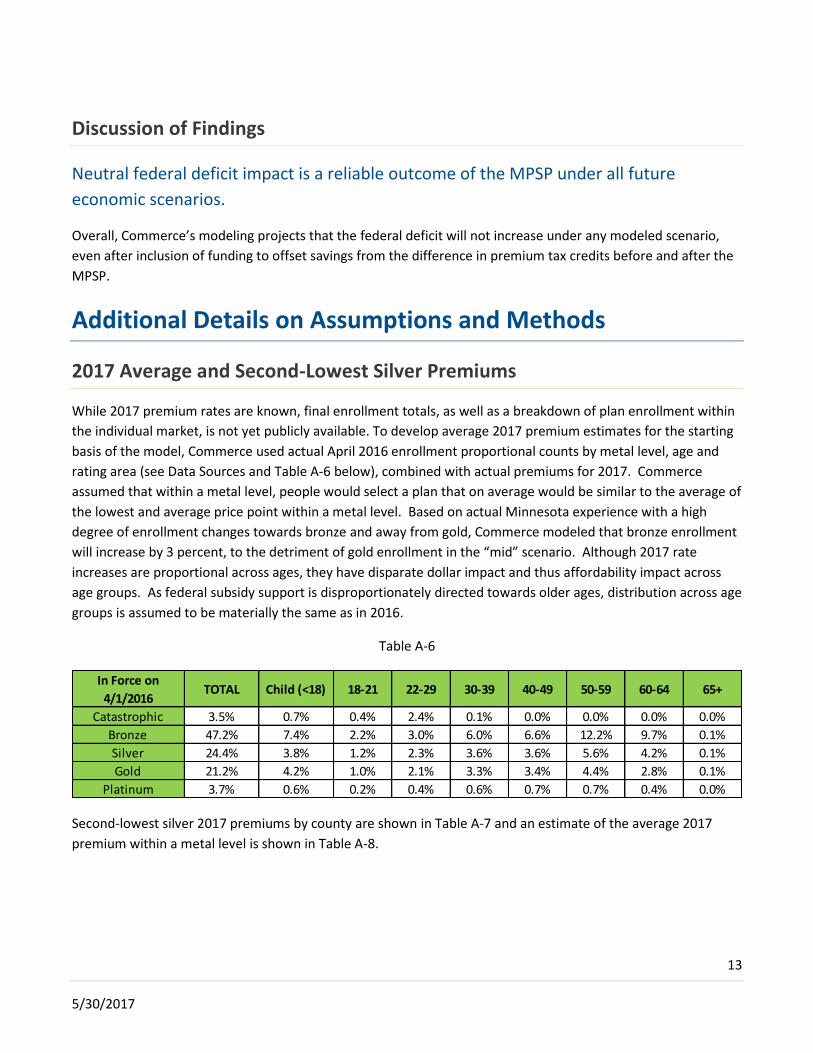
2017 Average and Second-Lowest Silver Premiums
While 2017 premium rates are known, final enrollment totals, as well as a breakdown of plan enrollment within
the individual market, is not yet publicly available. To develop average 2017 premium estimates for the starting
basis of the model, Commerce used actual April 2016 enrollment proportional counts by metal level, age and
rating area (see Data Sources and Table A-6 below), combined with actual premiums for 2017. Commerce
assumed that within a metal level, people would select a plan that on average would be similar to the average of
the lowest and average price point within a metal level. Based on actual Minnesota experience with a high
degree of enrollment changes towards bronze and away from gold, Commerce modeled that bronze enrollment
will increase by 3 percent, to the detriment of gold enrollment in the “mid” scenario. Although 2017 rate
increases are proportional across ages, they have disparate dollar impact and thus affordability impact across
age groups. As federal subsidy support is disproportionately directed towards older ages, distribution across age
groups is assumed to be materially the same as in 2016.
Table A-6
Second-lowest silver 2017 premiums by county are shown in Table A-7 and an estimate of the average 2017
premium within a metal level is shown in Table A-8.
In Force on
4/1/2016TOTAL Child (<18) 18-21 22-29 30-39 40-49 50-59 60-64 65+
Catastrophic 3.5% 0.7% 0.4% 2.4% 0.1% 0.0% 0.0% 0.0% 0.0%
Bronze 47.2% 7.4% 2.2% 3.0% 6.0% 6.6% 12.2% 9.7% 0.1%
Silver 24.4% 3.8% 1.2% 2.3% 3.6% 3.6% 5.6% 4.2% 0.1%
Gold 21.2% 4.2% 1.0% 2.1% 3.3% 3.4% 4.4% 2.8% 0.1%
Platinum 3.7% 0.6% 0.2% 0.4% 0.6% 0.7% 0.7% 0.4% 0.0%

14
5/30/2017
Table A-7
County
Actual 2016 Individual Market
Enrollment by County as a
Percentage of Total MN
Individual Market Enrollment
Actual 2017 Second Lowest
Silver Rate by County
Aitkin 0.31% $ 560.54 Anoka 5.01% $ 481.39 Becker 0.76% $ 612.40 Beltrami 0.62% $ 560.54 Benton 0.69% $ 491.02 Big Stone 0.26% $ 644.57 Blue Earth 1.10% $ 646.34 Brown 0.69% $ 730.46 Carlton 0.41% $ 584.36 Carver 2.33% $ 481.39 Cass 0.69% $ 560.54 Chippewa 0.31% $ 644.57 Chisago 0.95% $ 552.67 Clay 0.82% $ 612.40 Clearwater 0.16% $ 620.89 Cook 0.17% $ 584.36 Cottonwood 0.33% $ 730.46 Crow Wing 1.34% $ 560.54 Dakota 6.94% $ 481.39 Dodge 0.28% $ 730.52 Douglas 1.08% $ 612.40 Faribault 0.43% $ 646.34 Fillmore 0.44% $ 730.52 Freeborn 0.59% $ 730.52 Goodhue 0.79% $ 730.52 Grant 0.24% $ 612.40 Hennepin 23.71% $ 481.39 Houston 0.36% $ 730.52 Hubbard 0.44% $ 560.54 Isanti 0.59% $ 552.67 Itasca 0.62% $ 584.36 Jackson 0.30% $ 730.46 Kanabec 0.23% $ 557.39 Kandiyohi 0.94% $ 644.57 Kittson 0.19% $ 558.79 Koochiching 0.20% $ 584.36 Lac qui Parle 0.31% $ 644.57 Lake 0.17% $ 584.36 Lake of the Woods 0.16% $ 607.74 Le Sueur 0.42% $ 646.34 Lincoln 0.19% $ 730.46 Lyon 0.60% $ 644.57 Mahnomen 0.08% $ 620.89 Marshall 0.45% $ 558.79

15
5/30/2017
Table A-7 Continued
County
Actual 2016 Individual Market
Enrollment by County as a
Percentage of Total MN
Individual Market Enrollment
Actual 2017 Second Lowest
Silver Rate by County
Martin 0.52% $ 646.34 McLeod 0.72% $ 642.95 Meeker 0.56% $ 644.57 Mille Lacs 0.48% $ 560.54 Morrison 0.89% $ 560.54 Mower 0.35% $ 730.52 Murray 0.37% $ 730.46 Nicollet 0.49% $ 628.42 Nobles 0.50% $ 730.46 Norman 0.62% $ 620.89 Olmsted 1.17% $ 730.52 Otter Tail 1.30% $ 612.40 Pennington 0.23% $ 558.79 Pine 0.38% $ 560.54 Pipestone 0.34% $ 730.46 Polk 0.73% $ 558.79 Pope 0.57% $ 612.40 Ramsey 6.86% $ 481.39 Red Lake 0.11% $ 558.79 Redwood 0.56% $ 730.46 Renville 0.62% $ 644.57 Rice 0.85% $ 646.34 Rock 0.35% $ 730.46 Roseau 0.33% $ 518.91 Scott 2.93% $ 481.39 Sherburne 1.73% $ 481.39 Sibley 0.39% $ 642.95 St. Louis 2.31% $ 584.36 Stearns 3.01% $ 491.02 Steele 0.39% $ 730.52 Stevens 0.39% $ 612.40 Swift 0.30% $ 644.57 Todd 0.56% $ 560.54 Traverse 0.18% $ 612.40 Wabasha 0.39% $ 730.52 Wadena 0.43% $ 560.54 Waseca 0.38% $ 646.34 Washington 4.88% $ 481.39 Watonwan 0.39% $ 646.34 Wilkin 0.29% $ 612.40 Winona 0.50% $ 730.52 Wright 2.63% $ 491.02 Yellow Medicine 0.31% $ 644.57 Total 100% $ 540.65

16
5/30/2017
Table A-8
For premium increases after 2018, scenarios are modeled at 5 percent, 6.5 percent and 10 percent inflation,
with reinsurance inflation modeled at 3.5 percent higher in each scenario. The key considerations of the
modeled average premiums are the influence on enrollment and the post-waiver average premium that
addresses affordability.
The second-lowest silver price in each county plays an important role and more directly affects federal costs and
waiver savings. The second-lowest silver premium in each county is known for 2017. In consideration of the
trend toward bronze plans and away from gold and platinum plans, the ratio of the second-lowest silver
premium to average premium across all metal levels has steadily increased since 2014, and Minnesota expects
this trend to continue. The change in de minimis variation rules are reflected in the modeled ratios. To address
uncertainty in future relationships between second-level silver premiums and overall average premiums,
Commerce modeled two sets of scenarios: one assuming continuation of the estimated current relationship
between second-lowest silver premiums and average premiums experienced for 2017, adjusted for the change
in de minimis variation rules (a 94 percent ratio) and one assuming reasonable continuation of the trend
towards bronze plans, adjusted for the change in de minimis variation rules (a 98 percent ratio).
Differential between Premiums at Different Levels of Enrollment (Price
Elasticity)
In order to determine how enrollment and morbidity relate to one another, Commerce actuaries assessed price
elasticity. It is estimated that for each additional $1 increase in average monthly premium, the state’s individual
market is expected to lose 500 enrollees. The development and considerations regarding this assumption are
discussed in more detail below.
Because the size of Minnesota’s individual market is structurally smaller than those in nearly all other states
(due to the existence of the state’s BHP), Minnesota has higher relative price elasticity compared to other states.
The 20,000 people who are assumed to be in the market who would not be in the market without the MPSP are
assumed to be ineligible for premium tax credits and cost sharing reduction (CSR) subsidies because premium
escalations that caused the disenrollment from the individual market did not financially affect those with federal
Metal Level
Average 2017 Premium All
Ages Within Metal Level
Statewide
Catastrophic $239
Bronze $497
Silver $553
Gold $631
Platinum $755
Total $560

17
5/30/2017
subsidies. The MPSP has no affordability impact for those who qualify for such subsidies, whether they are
enrolled in the individual market or the BHP, MinnesotaCare.
The association between enrollment and premium is based on the price elasticity estimated directly from the
Minnesota individual marketplace. In order to model Minnesota’s price elasticity, Commerce reviewed the 2015
premium and enrollment data from the issuers’ Uniform Rate Review Template (URRT, aggregated) and
compared that data to the modeled average 2016 premium as well as the level of enrollment for 2016. This is
the most recent data available.
489 enrollees per $1 = 66,000 enrollees leaving market from 2015 to 2016
$135 PMPM increase in average premiums 2015 to 2016
To address uncertainty, this number is rounded to 500. Based on initial information, this function appears to be
appropriate for 2017, as well.
Commerce also reviewed this modeled price elasticity relationship against 2015 claims experience (see Data
Sources) and found that the price elasticity estimate is reasonable. In checking for reasonableness, Commerce
held the top 5,700 high-cost cases steady along with the estimate of federally-subsidized enrollees, since the
high-cost cases find value in health insurance even at high premiums while the federally-subsidized enrollees do
not bear the financial effect of premium increases. Commerce actuaries modeled the morbidity changes
assuming a proportional loss of all other 2015 members. The premium/enrollment scenarios from the price
elasticity estimate fell within a reasonable range using this alternative approach. The modeled results also were
reasonable in relation to expected 2018 values under a range of scenarios.
At lower levels of overall enrollment than modeled in this report, the price elasticity would decrease because
there are about 77,000 price-insensitive persons with federal premium support who would hold on to their
coverage regardless of non-subsidized premium levels. Thus, while price elasticity in the individual market is
actually not linear, a linear model is used, as it produced reasonable values under the range of scenarios
presented in this report.
Publicly available price elasticity studies are not helpful to this study, because they are generally outdated and
are reflective of the heavily subsidized employer group market demographic. Individual market premiums would
tend to be viewed as outliers in relation to generally available price elasticity studies. Further, even if recent
individual market price elasticity estimates were available, these studies would not reflect the unique Minnesota
situation (that is, the BHP’s effect on price elasticity that is unique to Minnesota and perhaps New York). We
assumed that after 2018, enrollment will hold level regardless of health premium inflation and its effect on price
elasticity in order to focus on the “with” versus the “without” subsidy analysis.
Basic Health Plan (BHP) Impact
The BHP funding formula under 42 C.F.R. part 600, Subpart G was used to estimate the impact of this 1332
waiver on federal funding for MinnesotaCare. The funding formula is based on the second-lowest silver and

18
5/30/2017
lowest bronze premium rate in each county for each specified age group broken out by tobacco and non-
tobacco rates as outlined in the BHP funding methodology.
The state does not assume any changes to the methodology for the federal BHP funding formula, as described
under 42 C.F.R. Part 600, Subpart G in determining the impact on federal BHP funding for MinnesotaCare.
As illustrated below, if approved, the impact of the MPSP 1332 waiver on the second-lowest silver together with
the pass through of federal BHP funds under 1332(a)(3), would be budget neutral to the federal government.
Table A-9
Notes:
1. Federal BHP funding amounts in the table include both the APTC and CSR funding.
2. Modeled scenario:
Medium premium level for overall average market premium
Second-lowest cost silver is 94 percent of overall average market premium
Medium trend in average market premiums is 6.5 percent
Based on Minnesota’s BHP funding model from the February 2017 State of Minnesota budget forecast.
Data Sources
Administrative Costs
Annual costs are estimated to be less than one percent of MPSP revenues. However, the state appropriation is
sufficient to cover administrative costs. The model confirmed that MPSP administrative costs have no material
impact.
Federal BHP Funds Federa l BHP Funds TOTAL TOTAL
(with waiver)
(pass through
amount with
waiver)
Federal BHP Funds Federal BHP Funds
(with waiver +
pass through)(without waiver)
2018 83,179 83,179 $496.73 $646.72 $493,034,730 $177,576,340 $670,611,070 $670,611,070
2019 82,068 82,068 $525.09 $688.76 $517,319,876 $191,187,671 $708,507,547 $708,507,547
2020 82,427 82,427 $554.89 $733.53 $552,234,945 $209,582,044 $761,816,989 $761,816,989
2021 83,092 83,092 $586.20 $781.21 $591,329,226 $230,634,813 $821,964,040 $821,964,040
2022 83,923 83,923 $619.07 $831.98 $636,504,448 $254,336,352 $890,840,800 $890,840,800
2023 84,762 84,762 $653.55 $886.06 $684,469,932 $280,525,107 $964,995,039 $964,995,039
2024 85,610 85,610 $689.70 $943.66 $735,360,374 $309,466,293 $1,044,826,667 $1,044,826,667
2025 86,466 86,466 $727.56 $1,004.99 $789,312,116 $341,453,740 $1,130,765,856 $1,130,765,856
2026 87,331 87,331 $767.18 $1,070.32 $846,462,315 $376,813,009 $1,223,275,325 $1,223,275,325
2027 88,204 88,204 $808.62 $1,139.89 $906,947,957 $415,904,848 $1,322,852,805 $1,322,852,805
Year
BHP
Enrol lment
(with
waiver)
BHP
Enrol lment
(without
waiver)
Modeled
Second Lowest
Si lver (with
waiver)
Modeled
Second Lowest
Si lver (without
waiver)

19
5/30/2017
Individual Market Enrollment
Data is available to place Minnesota individual market enrollees in groupings relevant to their decisions to buy
insurance and buy certain metal levels. The following tables provide detail on age, metal level selection, and
annual claims.
Minnesota’s uninsured rate shrunk following ACA implementation. The most recent survey estimates that the
Minnesota uninsured rate reached 4.3 percent in 2015, which is among the lowest in the country. Due to
increasing premiums, Minnesota’s uninsured rate may have increased since 2015.
Approximately 62,000 Minnesotans were eligible to receive federal tax premium credit support as of December
2016, but about 77,000 are eligible to receive credits as of January 2017.
For enrollment data, Commerce relied on past experience collected from individual market issuers in June 2016
including enrollment data through April 2016. Enrollment data shown on the following chart includes
grandfathered plan enrollment, most of which was Blue Cross and Blue Shield of Minnesota, which announced
that it would no longer sell individual market plans in 2017 (including grandfathered plans). Thus, Commerce
expects a small number of grandfathered enrollees in 2017. Minnesota does not have transitional
(“grandmothered”) plans.
Table A-10
Source: Aggregated from annual issuer survey of individual market experience (Minnesota Department of
Commerce).

20
5/30/2017
Because prices increased effective January 1, 2017, the state assumes that there will be fewer enrollees in 2017.
The drop in enrollment between 2015 and 2016 provides a point of reference used as the basis for the overall
reasonable range on enrollment, considering the observations of price elasticity between 2015 and 2016. As
prices in the individual market have escalated, there has also been a strong trend toward customers purchasing
silver and bronze plans, as shown on the following chart (Table A-11). Not shown below are catastrophic plan
enrollments, which were roughly 2 percent of 2015 enrollment and 3.5 percent of 2016 enrollment.
Catastrophic plans are very similar in actuarial value to bronze plans.
Table A-11
Source: Aggregated from annual issuer survey of individual market experience (Minnesota Department of
Commerce).
Premiums
The following chart (Table A-12) shows how rates have increased significantly in Minnesota’s most expensive
rating area between 2014 and 2017. Each issuer’s rates are represented by a column, with plan years grouped
together. Rates by metal level are shown through the use of different shapes. Age 40 rates are shown, but all
age rates are illustrated as well, since carrier and metal level positioning is consistent at all ages through the use
of a fixed Minnesota age curve.

21
5/30/2017
Table A-12
2017 rates and enrollment data were used as a starting point to model the reasonable range of average
premiums and the second-lowest silver price point for 2018. Table A-13 shows how those rates vary by metal
level and area. 7
Table A-13
7 Data Source: Issuer’s Rate Data Templates, available at: https://filingaccess.serff.com/sfa/home/MN

22
5/30/2017
Morbidity
It is difficult to determine exactly where the level of morbidity of the individual market will actually land or how
it would be predicted by issuers’ actuaries in advance of any given plan year. Therefore, Commerce did not
make any assertive presumption of any particular scenario. Commerce developed a “mid estimate scenario”
based on a scenario close to the median of reasonable ranges of likely future scenarios. This demonstrates that
there is no addition to the federal deficit under a wide range of reasonably likely scenarios.
Data sources describing and referencing on the morbidity of Minnesota’s individual market risk pool are
provided in Appendix 2.
Benefit Design and Covered Services
This waiver includes no change to the scope of services covered. There will be no change to the Essential Health
Benefit set due to this waiver. Thus, no changes in covered services were modeled. This waiver includes no
change to the cost sharing parameters. Minnesota uses the same standard Actuarial Value Calculator that the
rest of the nation uses to standardize the metal level targets of the designed plans. The mid estimate
inflationary assumptions align with the actuarial value calculator (an annual trend of 6.5 percent), such that
Commerce does not anticipate atypical deductible leveraging that would materially influence the premiums
modeled. However, the change to widen the di minimis range that occurred based on April 2017 federal
guidance and is applicable in Minnesota in plan years 2018 and beyond was considered.

23
5/30/2017
Economic Analysis to Supplement Actuarial Analysis
By far, the most significant impact on the federal deficit will be from premium tax credit savings and BHP
savings. Lesser impacts (4 to 7 percent of the savings) arise from lower individual shared responsibility
payments, lower health insurance providers’ fees, and higher administrative expenses. The analysis below
estimates the offset to savings that is included as an “economic impact” column on the 10-year federal impact
chart. This economic impact figure over the next 10 years is estimated in Table E-1:
Table E-1
Federal Reduction in Revenue from Minnesota
Individual Shared Responsibility Payment
With the implementation of a 1332 waiver, approximately 20,000 more individuals are anticipated to participate
in the individual market than would be the case without a reinsurance program. It is reasonable to assume that
the vast majority of the 20,000 additional people in the individual market would otherwise be uninsured, based
on current and modeled premium differences between large group, small group, and individual market
premiums. Those who have left the individual market for more affordable insurance alternatives (such as
employment-based coverage) will be very likely to remain with those new alternatives because the reinsurance-
supported individual market will still not compete with the affordability of employment-based coverage.
The 20,000 people who are assumed to be in the market because of the MPSP are assumed to be ineligible for
federal premium tax credits and cost sharing reduction (CSR) subsidies because premium escalations that caused
YearTotal Reduction in Federal
Revenue
2018 $8,900,000
2019 $9,300,000
2020 $10,000,000
2021 $11,600,000
2022 $12,400,000
2023 $13,300,000
2024 $14,100,000
2025 $15,200,000
2026 $17,300,000
2027* $18,600,000
Totals $130,700,000

24
5/30/2017
the disenrollment from the individual market (from its high point of more than 300,000 participants in April
2015) did not financially affect those with premium tax credits (nor the very small subset of this population who
are eligible for CSR subsidies8). The assumption that the new enrollees will come entirely from the uninsured
also provides the most conservative estimate of the impact that a decrease in individual shared responsibility
payments could have on the federal budget.
Because of the magnitude of premium rates expected in 2018 in Minnesota, many of the estimated 20,000
additional enrollees would not have been subject to the individual shared responsibility payments because the
ratio of premiums to income would exceed the affordability limit (an IRS form and process which compares the
lowest bronze premium to a threshold percentage of income slightly above 8 percent).9 Congressional Budget
Office (CBO) projections of national approximate penalty payments per uninsured individual were used. The
March 2016 CBO report regarding federal subsidies for health insurance coverage forecasts the number of
uninsured and the total responsibility payments projected for the years 2016 to 2026. From these numbers an
approximate average individual responsibility payment was calculated. 10 See Table E-2.
Table E-2
Congressional Budget Office Projections of Individual Shared Responsibility Payments
National Uninsured Total Individual Shared Responsibility Payments
Approximate Average Individual Shared Responsibility Payment (Per Uninsured)
2018 26,000,000 $3,000,000,000 $115
2019 27,000,000 $3,000,000,000 $111
2020 27,000,000 $3,000,000,000 $111
2021 27,000,000 $4,000,000,000 $148
2022 27,000,000 $4,000,000,000 $148
2023 27,000,000 $4,000,000,000 $148
2024 28,000,000 $4,000,000,000 $143
2025 28,000,000 $4,000,000,000 $143
2026 28,000,000 $5,000,000,000 $179
2027* 28,000,000 $5,000,000,000 $179
8 Because of MinnesotaCare (the state’s BHP), only a small proportion of Minnesota’s individual market has a CSR payment. Those who do qualify for CSR payments are only eligible for the 73 percent CSR variant. 9 https://www.irs.gov/affordable-care-act/affordable-care-act-tax-provisions-for-individuals 10 https://www.cbo.gov/sites/default/files/114th-congress-2015-2016/reports/51385-healthinsurancebaselineonecol.pdf

25
5/30/2017
Using the CBO approximation of the average individual shared responsibility payment per uninsured individual
and the projected increase in enrollment, an approximate impact on the federal budget if the waiver is
implemented is estimated. The difference in enrollment with and without waiver approval consists of 20,000
Minnesotans. The impact of this difference on the federal budget is modeled for all years when the waiver
would be effective. See Table E-3.
Table E-3
Minnesota Modeled Impact of Reduction in Individual Shared Responsibility Payments
Minnesota Projected Uninsured Migration to Individual Market
Approximate Average Individual Shared Responsibility Payment (Per Uninsured)
Approximate Impact to Federal Budget
2018 20,000 $115 $2,307,692
2019 20,000 $111 $2,222,222
2020 20,000 $111 $2,222,222
2021 20,000 $148 $2,962,963
2022 20,000 $148 $2,962,963
2023 20,000 $148 $2,962,963
2024 20,000 $143 $2,857,143
2025 20,000 $143 $2,857,143
2026 20,000 $179 $3,571,429
2027* 20,000 $179 $3,571,429
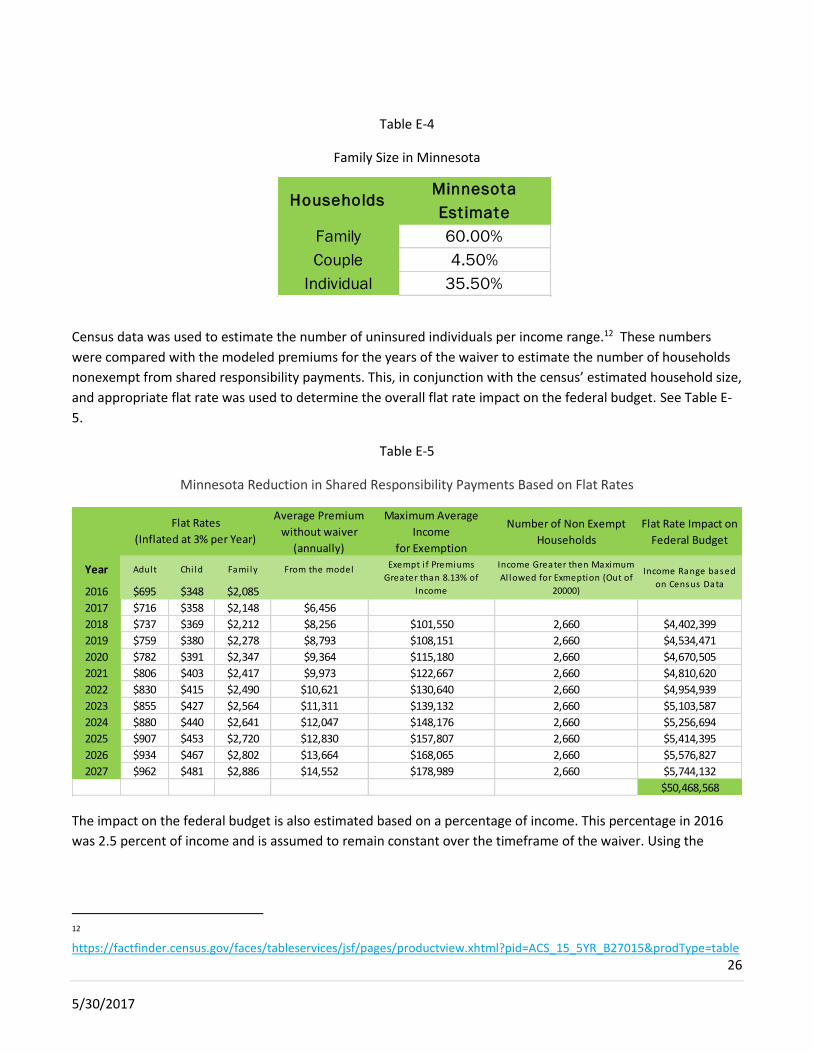
In addition to using this CBO projection, Commerce actuaries also modeled the financial effect of the individual
shared responsibility payments based on Minnesota census data and the individual shared responsibility
payment’s design. The flat rate for 2016 is $695, and this amount is projected to conservatively inflate at three
percent per year. Census data was used to determine approximate percentages of households composed of
individuals, couples only, and families with children.11 See Table E-4.
11 https://factfinder.census.gov/faces/tableservices/jsf/pages/productview.xhtml?pid=ACS_15_1YR_S0201&prodType=table
26
5/30/2017
Table E-4
Family Size in Minnesota
Census data was used to estimate the number of uninsured individuals per income range.12 These numbers
were compared with the modeled premiums for the years of the waiver to estimate the number of households
nonexempt from shared responsibility payments. This, in conjunction with the census’ estimated household size,
and appropriate flat rate was used to determine the overall flat rate impact on the federal budget. See Table E-
5.
Table E-5
Minnesota Reduction in Shared Responsibility Payments Based on Flat Rates
The impact on the federal budget is also estimated based on a percentage of income. This percentage in 2016
was 2.5 percent of income and is assumed to remain constant over the timeframe of the waiver. Using the
12 https://factfinder.census.gov/faces/tableservices/jsf/pages/productview.xhtml?pid=ACS_15_5YR_B27015&prodType=table
Average Premium
without waiver
(annually)
Maximum Average
Income
for Exemption
Number of Non Exempt
Households
Flat Rate Impact on
Federal Budget
Year Adult Chi ld Fami ly From the model
2016 $695 $348 $2,085
2017 $716 $358 $2,148 $6,456
2018 $737 $369 $2,212 $8,256 $101,550 2,660 $4,402,399
2019 $759 $380 $2,278 $8,793 $108,151 2,660 $4,534,471
2020 $782 $391 $2,347 $9,364 $115,180 2,660 $4,670,505
2021 $806 $403 $2,417 $9,973 $122,667 2,660 $4,810,620
2022 $830 $415 $2,490 $10,621 $130,640 2,660 $4,954,939
2023 $855 $427 $2,564 $11,311 $139,132 2,660 $5,103,587
2024 $880 $440 $2,641 $12,047 $148,176 2,660 $5,256,694
2025 $907 $453 $2,720 $12,830 $157,807 2,660 $5,414,395
2026 $934 $467 $2,802 $13,664 $168,065 2,660 $5,576,827
2027 $962 $481 $2,886 $14,552 $178,989 2,660 $5,744,132
$50,468,568
Income Range based
on Census Data
Flat Rates
(Inflated at 3% per Year)
Exempt i f Premiums
Greater than 8.13% of
Income
Income Greater then Maximum
Al lowed for Exmeption (Out of
20000)
HouseholdsMinnesota
Estimate
Family 60.00%
Couple 4.50%
Individual 35.50%

27
5/30/2017
income census data and the same number of nonexempt households, a fee by percentage of income was
estimated. See Tables E-6 and E-7.
Table E-6
Minnesota Population Income Breakdown
Table E-7
Minnesota Responsibility Payments Based on Income Breakdown
No Health
Insurance
Coverage (by
Income)
Minnesota
EstimatePercentage
Estimate Income
Used in Model
$74,999 or
less279,300 74.66% -
$75,000 to
$99,999:45,036 12.04% $87,500
$100,000
or more:49,745 13.30% $100,000
Year
Number of Non
Exempt
Households
Maximum Average
Income
for Exemption
Percentage Fee by
Estimated Income
2018 2,660 $101,550 $6,648,961
2019 2,660 $108,151 $6,648,961
2020 2,660 $115,180 $6,648,961
2021 2,660 $122,667 $6,648,961
2022 2,660 $130,640 $6,648,961
2023 2,660 $139,132 $6,648,961
2024 2,660 $148,176 $6,648,961
2025 2,660 $157,807 $6,648,961
2026 2,660 $168,065 $6,648,961
2027 2,660 $178,989 $6,648,961
$66,489,611

28
5/30/2017
Table E-8
Comparison of Modeled Impact to Federal Budget
Of the estimates provided above in Table E-8, the percentage of income model is more appropriate than the flat
rate model, since most people exposed to the flat rate payments are the same as those who are exempt from
the tax due to affordability. However, the CBO estimate is likely the most accurate model, given that the CBO
model takes into account the income and age demographics of the individual market purchasers, and more
accurately addresses hardship, religious, and other important exemptions available. Minnesota’s rates have
recently risen to be just above the national average, and thus the CBO estimates are likely appropriate for this
reason as well. However, for a conservative estimate, a 20 percent margin to the CBO model was added in part
due to the fact that Minnesota tends to have higher incomes than the national average. In the model,
Commerce actuaries also conservatively assumed that the January 20, 2017 executive order to allow for silent
tax returns would not affect the financial consequences of the individual shared responsibility payment.
Health Insurance Providers’ Fees
Section 9010 of the ACA imposes a fee on each covered entity engaged in the business of providing health
insurance for United States health risks. The federal deficit impact resulting from lower Minnesota premiums for
2018 would be minimal because the design of this tax for the federal government perspective is fixed so as to
receive a set amount nationally, as illustrated in Table E-9.
Congressional
Budget Office
Model
Flat Rate
Model
Percentage of
Income Model
Best estimate, with margin
added
2018 $2,307,692 $4,402,399 $6,648,961 $2,800,000
2019 $2,222,222 $4,534,471 $6,648,961 $2,700,000
2020 $2,222,222 $4,670,505 $6,648,961 $2,700,000
2021 $2,962,963 $4,810,620 $6,648,961 $3,600,000
2022 $2,962,963 $4,954,939 $6,648,961 $3,600,000
2023 $2,962,963 $5,103,587 $6,648,961 $3,600,000
2024 $2,857,143 $5,256,694 $6,648,961 $3,400,000
2025 $2,857,143 $5,414,395 $6,648,961 $3,400,000
2026 $3,571,429 $5,576,827 $6,648,961 $4,300,000
2027* $3,571,429 $5,744,132 $6,648,961 $4,300,000
Totals $28,498,168 $50,468,568 $66,489,611 $34,400,000

29
5/30/2017
Table E-9
Federal health insurance providers’ fee receipt, per IRS.gov
Fee Year Applicable Amount
2014 $8,000,000,000
2015 $11,300,000,000
2016 $11,300,000,000
2017 $13,900,000,000
2018 $14,300,000,000
In 2019 and thereafter, the applicable amount is calculated as the amount of the preceding year’s fee increased
by the rate of national premium growth. The national premium growth will be immaterially influenced by
Minnesota’s MPSP, likely less than a 0.1 percent effect of the final national inflation value each year.
For more background on this tax, the percentage of net premiums written taken into account for each taxed
entity per calendar year is shown in Table E-10.
Table E-10
Percentage of net premiums written taken into account, per IRS.gov
Covered entity’s net premiums written during the data year that are:
Percentage of net premiums that are taken into account
Not more than $25,000,000 0
More than $25,000,000 but not more than $50,000,000
50
More than $50,000,000 100
Issuers that are not-for-profit receive a lower tax rate than those that are for profit, and certain issuers that are
mainly in the Medicare and Medicaid markets have a full exemption from the tax.
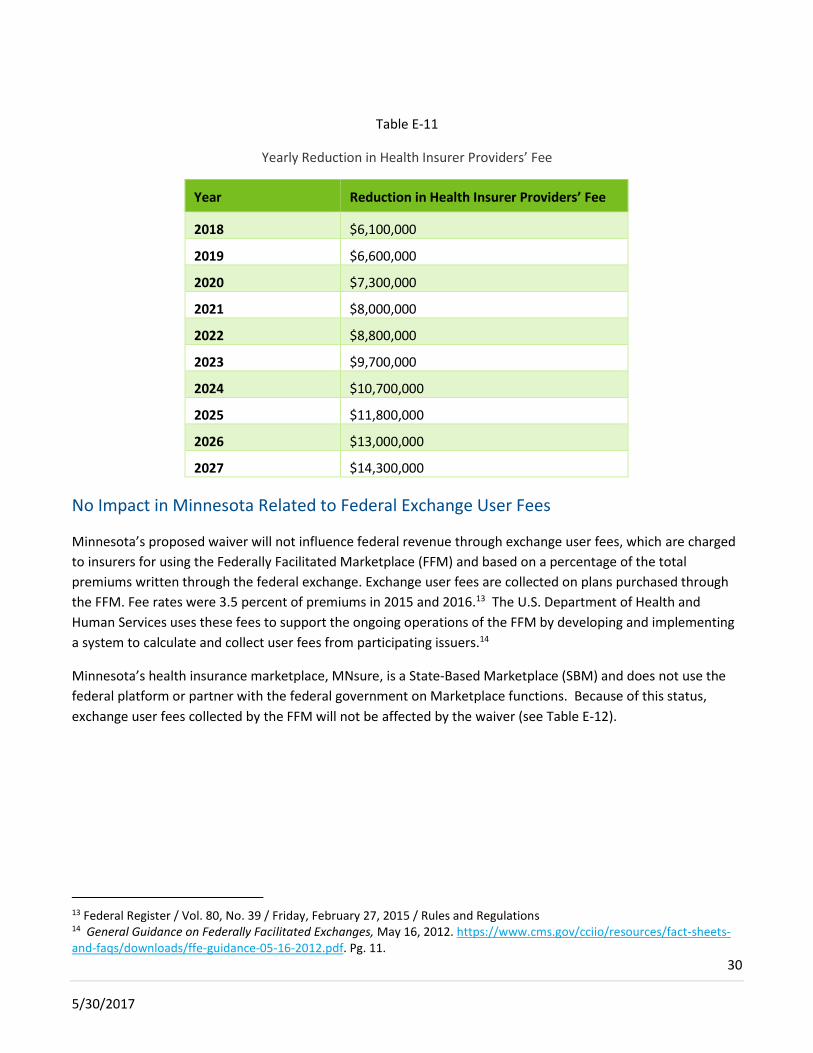
Based on a conservative average health insurance provider fee estimate of 1.8 percent, and taking into account
that approximately 20 percent of affected enrollees are with completely exempt entities in the individual market
and the BHP, the following federal budget loss of revenues from Minnesota issuers is estimated (see Table E-11).
Note that these losses may be partially recouped based on the national nature of this tax’s design and
benchmark, and Commerce actuaries have assumed that the tax would not be applied to the MPSP program
proceeds. Thus, this is a conservative estimate.
30
5/30/2017
Table E-11
Yearly Reduction in Health Insurer Providers’ Fee
Year Reduction in Health Insurer Providers’ Fee
2018 $6,100,000
2019 $6,600,000
2020 $7,300,000
2021 $8,000,000
2022 $8,800,000
2023 $9,700,000
2024 $10,700,000
2025 $11,800,000
2026 $13,000,000
2027 $14,300,000
No Impact in Minnesota Related to Federal Exchange User Fees
Minnesota’s proposed waiver will not influence federal revenue through exchange user fees, which are charged
to insurers for using the Federally Facilitated Marketplace (FFM) and based on a percentage of the total
premiums written through the federal exchange. Exchange user fees are collected on plans purchased through
the FFM. Fee rates were 3.5 percent of premiums in 2015 and 2016.13 The U.S. Department of Health and
Human Services uses these fees to support the ongoing operations of the FFM by developing and implementing
a system to calculate and collect user fees from participating issuers.14
Minnesota’s health insurance marketplace, MNsure, is a State-Based Marketplace (SBM) and does not use the
federal platform or partner with the federal government on Marketplace functions. Because of this status,
exchange user fees collected by the FFM will not be affected by the waiver (see Table E-12).
13 Federal Register / Vol. 80, No. 39 / Friday, February 27, 2015 / Rules and Regulations 14 General Guidance on Federally Facilitated Exchanges, May 16, 2012. https://www.cms.gov/cciio/resources/fact-sheets-and-faqs/downloads/ffe-guidance-05-16-2012.pdf. Pg. 11.

31
5/30/2017
Table E-12
Yearly Reduction in Federal Exchange User Fees
Year Reduction in Federal Exchange User Fees
2018 $0
2019 $0
2020 $0
2021 $0
2022 $0
2023 $0
2024 $0
2025 $0
2026 $0
2027 $0
Cost Sharing Reduction (CSR) Payments
All federal cost sharing reduction payments are unaffected by the MPSP, because the metal level designs (the
actuarial value requirements) are not affected by the MPSP. No waiver is requested related to CSRs or benefit
design.
In Minnesota, most CSR payments are provided to MinnesotaCare through the BHP funding formula, as provided
under 42 C.F.R. Part 600, Subpart G. Very few of Minnesota’s individual market participants enroll in plans
eligible for CSR support, and those who are enrolled qualify for the 73 percent CSR variant, since the BHP covers
all with 200 percent FPL or below and thus all who would have been eligible for the 87 and 94 percent CSR
variants. For example, as of April 2016, Minnesota had 7,681 CSR enrollees, all enrolled in a 73 percent CSR
variant (this is about 3.3% of the individual market enrollment).
The 20,000 people who are assumed to be in the market because of the MPSP are assumed to be ineligible for
federal premium tax credits and cost sharing reduction (CSR) subsidies because premium escalations that caused
the disenrollment from the individual market (from its high point of more than 300,000 participants in April
2015) did not financially affect those with premium tax credits (nor the very small subset of this population who
are eligible for CSR subsidies), whether they are enrolled in the individual market or the state’s basic health plan.
Risk Adjustment Payments
MPSP will not affect risk adjustment calculations, and thus not affect risk adjustment transfers between issuers.
Since the risk adjustment program always produces $0 financial effect to the federal government for each
32
5/30/2017
state’s individual marketplace, there will be no financial effect to the federal government resulting from the
MPSP. 15
Employer Shared Responsibility Payment
MPSP support is not offered to employers and thus Commerce actuaries do not expect any measurable effect on
the employer shared responsibility payment. Further, negative federal deficit impact due to employer shared
responsibility payments is not expected because employers are generally prohibited16 from making use of the
individual market in a tax-effective manner, outside of the new QSEHRA ability granted under the CURES Act.
Commerce actuaries monitor this issue, as does the IRS. The individual market’s rates, even with the MPSP in
place, will still be significantly higher than small and large group rates. Thus, there will be little interest by the
group market in the individual market. Those employers with low-income workers might seek the QSEHRA
opportunity, but must do so in a nondiscriminatory fashion and thus this would be a rare action. Employees with
lower incomes who are eligible for a federal premium tax credit may seek out the individual market on their
own, but the degree to which this occurs should be unaffected by the MPSP, since the ultimate premium they
pay is unaffected by the MPSP.
Employer “Cadillac Tax”
The proposed program will have no effect whatsoever on the excise tax on high-cost employer-sponsored plans,
also known as the “Cadillac tax.”
15 There is an important interplay between risk adjustment and the MPSP that effects issuers’ financial performance. The State of Minnesota released a feasibility study in October 2016 on whether Minnesota should operate its own risk adjustment program. This study incorporated an analysis of the interplay between a theoretical state reinsurance program and risk adjustment (see pages 45-48 and Appendices 4D-I: https://www.leg.state.mn.us/docs/2016/mandated/161217.pdf ). Based on this study’s results, the reinsurance and risk adjustment interplay is material enough to potentially harm financial fairness to certain issuers in favor of other issuers. The study did not reflect the final MPSP parameters, which exacerbates this interplay from that which the study suggests. However, the study also did not reflect mitigating factors, such as important changes to the federal risk adjustment program and significant enrollment shifts which have worked to more fairly spread the high-cost case burden among issuers and largely remove such bias. The study and concept may be revisited, though state-based risk adjustment is a major undertaking and thus could not be implemented until plan year 2020 at the earliest. It would only be implemented assuming that MPSP is legislated to continue in its current form. It would only be possible if state law allows for it, with appropriations. It would only be considered if the administrative burden and cost make sense in terms of the value it produces to Minnesota residents. Much like the federal government’s decision when faced with the same exact circumstances, Minnesota will not address refinements to risk adjustment or reinsurance in the near term, given the short-term nature of the situation. Because Minnesota has already studied this topic at length, Minnesota is in a unique position to be able to readily refine condition-specific factors if the federal risk adjustment administrative system allowed states to adopt their own custom risk scores. 16 https://www.cms.gov/CCIIO/Resources/Fact-Sheets-and-FAQs/Downloads/FAQs-Part-XXII-FINAL.pdf

33
5/30/2017
Small Business Tax Credit
The proposed program will have no effect whatsoever on the tax credit available to certain small employers sold
through the exchange.
Income Taxes
The proposed program will have no effect on income and payroll taxes. No employer tax exclusions or
deductions are affected. Personal health care expense deductions are not affected, since this program relates to
premiums (versus deductibles, coinsurance, co-pays).
Federal Administrative Costs
Commerce actuaries included an allotment for an allotment of existing staff time. See Table E-13.

34
5/30/2017
Total Reduction in Federal Revenue
The major components of reduced federal revenue are shown in Table E-13.
Table E-13
*The CBO amount is only available through 2026. An estimate is applied for 2027.
Year
Reduction in
Individual
Shared
Responsibility
Payment
Revenue (CBO +
20%)
Reduction in
Health
Insurance
Providers' Fee
Revenue
Reduction in
Federal
Exchange Use
Fee Revenue
Federal
Administration
Expenses
Total Reduction
in Federal
Revenue
2018 $2,800,000 $6,100,000 $0 $100,000 $9,000,000
2019 $2,700,000 $6,600,000 $0 $50,000 $9,350,000
2020 $2,700,000 $7,300,000 $0 $50,000 $10,050,000
2021 $3,600,000 $8,000,000 $0 $50,000 $11,650,000
2022 $3,600,000 $8,800,000 $0 $50,000 $12,450,000
2023 $3,600,000 $9,700,000 $0 $100,000 $13,400,000
2024 $3,400,000 $10,700,000 $0 $50,000 $14,150,000
2025 $3,400,000 $11,800,000 $0 $50,000 $15,250,000
2026 $4,300,000 $13,000,000 $0 $50,000 $17,350,000
2027* $4,300,000 $14,300,000 $0 $50,000 $18,650,000
Totals $34,400,000 $96,300,000 $0 $600,000 $131,300,000
Minnesota Modeled Impact of Reduction in Federal Revenue

35
5/30/2017
Combined Actuarial and Economic Analysis Results
The 10-year projection of the federal actuarial savings, federal economic losses, and basic health plan pass-
through amounts are shown in Table E-14:
Table E-14
Year
Enrollment
without
Waiver
Enrollment
with Waiver
Federal Premium
Tax Credit Savings
Federal BHP Funds
(pass through amount
with waiver)
Federal Total
Actuarial Savings &
BHP pass-through
amount
Federal Total
Economic Loss
Federal Total Savings
& BHP pass-through
amount minus
Economic Loss
2016 267,000 267,000
2017 170,000 170,000
2018 150,000 170,000 138,309,239$ 177,576,340$ 315,885,579$ 9,000,000$ 306,885,579$
2019 150,000 170,000 150,926,611$ 191,187,671$ 342,114,282$ 9,350,000$ 332,764,282$
2020 150,000 170,000 164,726,839$ 209,582,044$ 374,308,883$ 10,050,000$ 364,258,883$
2021 150,000 170,000 179,823,082$ 230,634,813$ 410,457,895$ 11,650,000$ 398,807,895$
2022 150,000 170,000 196,339,480$ 254,336,352$ 450,675,832$ 12,450,000$ 438,225,832$
2023 150,000 170,000 214,412,234$ 280,525,107$ 494,937,341$ 13,400,000$ 481,537,341$
2024 150,000 170,000 234,190,786$ 309,466,293$ 543,657,079$ 14,150,000$ 529,507,079$
2025 150,000 170,000 255,839,120$ 341,453,740$ 597,292,860$ 15,250,000$ 582,042,860$
2026 150,000 170,000 279,537,188$ 376,813,009$ 656,350,197$ 17,350,000$ 639,000,197$
2027 150,000 170,000 305,482,484$ 415,904,848$ 721,387,332$ 18,650,000$ 702,737,332$
Total: 4,775,767,281$

36
5/30/2017
Actuarial Certifications
Commerce actuarial staff certify that this waiver request meets the following federal requirements of the
Affordable Care Act:
The scope of coverage comparability requirements of Section 1332 (b)(1)(A)
The affordability requirements of Section 1332 (b)(1)(B)
The affected number of individuals requirements of Section 1332 (b)(1)(C)
The deficit neutrality requirement of Section 1332 (b)(1)(D)
The pass-through funding requirements of Section 1332(a)(3).
This waiver requires federal premium tax credit savings that would have otherwise been spent without the
waiver (and its related legislation) be instead passed through to the MPSP. There is a financially immaterial
effect on federal operations in terms of having existing IRS, HHS, CMS, and Office of the Actuary (OACT) staff
review and approve this waiver request.
In performing the certification, we relied upon analysis for BHP projections prepared by Shawn Welch, Director,
Reports and Forecasts Division, Minnesota Department of Human Services. We evaluated the analysis and
results for reasonableness and consistency. A reliance statement has been provided related to this analysis.
Commerce actuarial staff are members of the American Academy of Actuaries in good standing. Commerce
actuarial staff were requested to analyze this waiver request and document the results of our analysis in this
report by our employer, the State of Minnesota. The use of this report is for federal regulators to review analysis
in order to determine whether or not to support the requested waiver to which the report relates. The actuarial
study should not be read without a full review of the waiver application.
Commerce actuarial staff have no conflict of interests in relation to the outcome of this waiver or the individual
market affordability and sustainability to which this report and its related request.
Commerce actuarial staff have both met the education and experience necessary to perform this work. We have
developed the assumptions, methods and findings in accordance with Actuarial Standards of Practice and the
actuarial profession’s Code of Professional Conduct.
Fred Andersen, FSA, MAAA Kristi M. Bohn, FSA, EA, MAAA
Acting Deputy Commissioner and Chief Life Actuary Chief Health Actuary
Minnesota Department of Commerce Minnesota Department of Commerce
State of Minnesota State of Minnesota
37
5/30/2017
Appendices
Appendix 1 - More Data On Reinsurance Program Distributions
Because the 2018 attachment point and reinsurance cap are close to those used in the federal reinsurance
program in 2014 and 2015, the relative coinsurance rate differences can be interpolated to infer the leveraged
trend that various model results predict. An 8.75 percent reduction was made to take into account the
attachment point difference of $50,000 instead of $45,000.
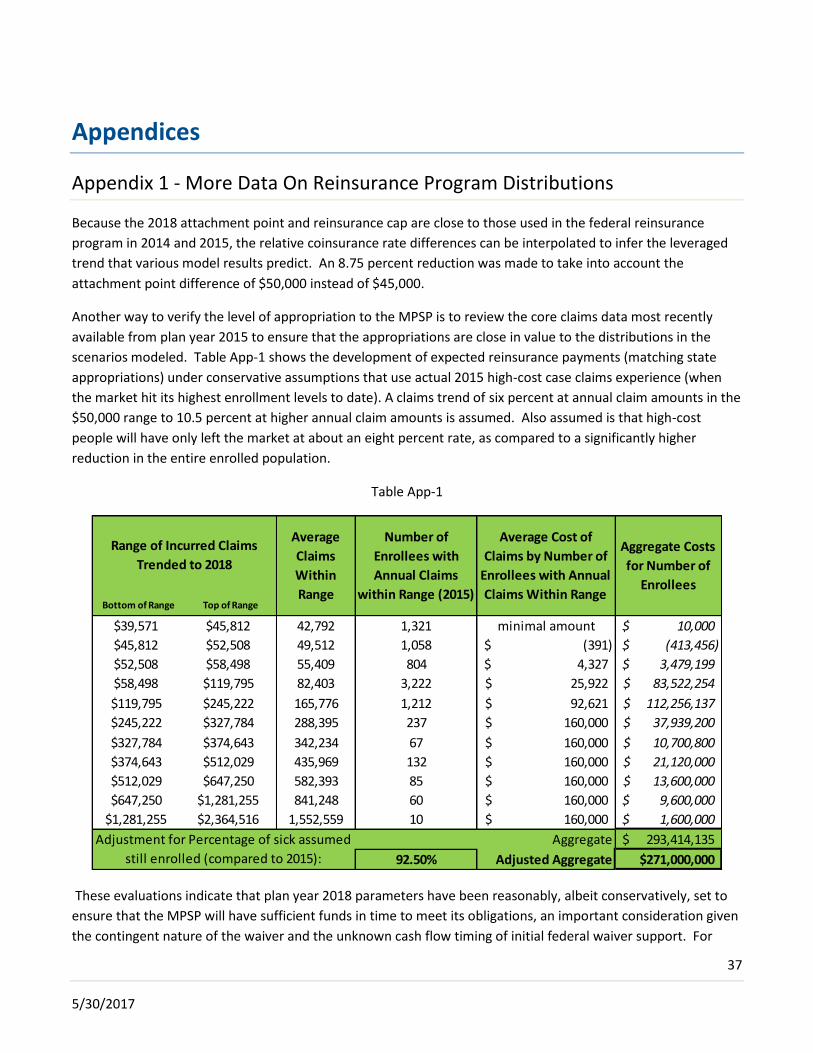
Another way to verify the level of appropriation to the MPSP is to review the core claims data most recently
available from plan year 2015 to ensure that the appropriations are close in value to the distributions in the
scenarios modeled. Table App-1 shows the development of expected reinsurance payments (matching state
appropriations) under conservative assumptions that use actual 2015 high-cost case claims experience (when
the market hit its highest enrollment levels to date). A claims trend of six percent at annual claim amounts in the
$50,000 range to 10.5 percent at higher annual claim amounts is assumed. Also assumed is that high-cost
people will have only left the market at about an eight percent rate, as compared to a significantly higher
reduction in the entire enrolled population.
Table App-1
These evaluations indicate that plan year 2018 parameters have been reasonably, albeit conservatively, set to
ensure that the MPSP will have sufficient funds in time to meet its obligations, an important consideration given
the contingent nature of the waiver and the unknown cash flow timing of initial federal waiver support. For
Bottom of Range Top of Range
$39,571 $45,812 42,792 1,321 minimal amount 10,000$
$45,812 $52,508 49,512 1,058 (391)$ (413,456)$
$52,508 $58,498 55,409 804 4,327$ 3,479,199$
$58,498 $119,795 82,403 3,222 25,922$ 83,522,254$
$119,795 $245,222 165,776 1,212 92,621$ 112,256,137$
$245,222 $327,784 288,395 237 160,000$ 37,939,200$
$327,784 $374,643 342,234 67 160,000$ 10,700,800$
$374,643 $512,029 435,969 132 160,000$ 21,120,000$
$512,029 $647,250 582,393 85 160,000$ 13,600,000$
$647,250 $1,281,255 841,248 60 160,000$ 9,600,000$
$1,281,255 $2,364,516 1,552,559 10 160,000$ 1,600,000$
Aggregate 293,414,135$
92.50% Adjusted Aggregate $271,000,000
Average Cost of
Claims by Number of
Enrollees with Annual
Claims Within Range
Aggregate Costs
for Number of
Enrollees
Adjustment for Percentage of sick assumed
still enrolled (compared to 2015):
Range of Incurred Claims
Trended to 2018
Average
Claims
Within
Range
Number of
Enrollees with
Annual Claims
within Range (2015)

38
5/30/2017
later plan years, the scenario model assumes various reasonable ranges for leveraged trend for the cost of the
MPSP (8.5 percent, 10 percent, and 13.5 percent). More background on the data used in this analysis is found in
the Morbidity subsection of the Data Sources section of this report.

39
5/30/2017
Appendix 2 - More Data Sources on Claims and Morbidty
Actuarial Value Calculator Continuance Tables
HHS provided issuers and the public with an actuarial value calculator in order to standardize plan design
parameters to appropriate metal levels. Backing each metal level is a claims continuance table that outlines how
claims distribution is assumed to develop. The actuarial value calculator tool is based on large group and self-
insured employer data. This data indicates that Minnesota’s 2015 individual market claims curve experience
was very similar to group experience. However, given the enrollment changes underway for plan year 2017,
Commerce actuaries do not expect that comparison of morbidity levels to hold for 2017 and beyond. This data
source helped support the reasonable range of modeled premium scenarios under different
morbidity/enrollment combinations.
The assumption underlying the actuarial value calculator tool has been that health care inflation (cost,
utilization, and case mix trends) would trend at 6.5 percent. Commerce adopted 6.5 percent as the mid
estimate assumption for claim and premium trend subsequent to 2018.
2016 Milliman Benchmarks
Commerce used the Milliman benchmarks, as this resource is a highly-cited basis for actuarial health insurance
claims expectations. Using these benchmarks, and through comparing the continuance tables to the data
Commerce has collected from issuers for 2015, Commerce found that 2015 individual market claims experience
is not unlike the large group health insurance market. However, given the enrollment changes underway for
plan year 2017, Commerce does not expect that comparison of morbidity levels to hold for 2017 and beyond.
This data source helped support the reasonable range of modeled premium scenarios under different
morbidity/enrollment combinations, and is very current.
2014 and 2015 Aggregate Individual Market Claims Experience
The 2017 Unified Rate Review Template (URRT) for each health insurer participating in the 2017 individual
market in Minnesota was considered in developing a reasonable range of premium scenarios. Worksheet 1 of
the URRT provides 2015 allowed and incurred claims and enrollment, along with morbidity and administrative
cost projections. Commerce used health insurers’ submitted URRT information to understand the claims,
premiums, and member months from 2015. Commerce estimates that the aggregate Minnesota individual
market simplified loss ratio (without adjustments such as quality assurance) would have been 138 percent for
plan year 2015 if it were not for the now-expired federal reinsurance program. The filing public access link17 can
be used to find any issuer’s actuarial memorandum, rate tables, and URRTs. This data was considered in the
development of reasonable premium scenarios.
17 https://filingaccess.serff.com/sfa/home/MN

40
5/30/2017
The following data (Table App-2) was collected from nearly all issuers18 and shows how allowed and incurred
claims developed in 2015 in the individual market. This data helped us understand the underlying issues of
rising premiums in the individual market, which has been driven by high-cost cases. This data is also key in
understanding and calibrating parameters of the MPSP.
Table App-2
18 Excludes Time and John Alden, which left the health insurance markets nationwide starting in 2016.
2015 Aggregate
Allowed Claims
2015 Aggregate
Incurred Claims
Number of
Members
Average Allowed Claim
Size per Member
$0 (65,861) (29,326) 27,118 (2)
$1 - $250 5,620,500 2,599,110 48,242 117
$251 - $500 12,924,186 6,738,790 34,461 375
$501 - $750 16,721,679 9,001,052 27,092 617
$751 - $1,000 17,677,591 9,205,224 19,896 888
$1,001 - $1,500 34,286,624 16,935,118 27,705 1,238
$1,501 - $2,000 30,417,248 14,347,661 17,198 1,769
$2,001 - $2,500 27,363,166 13,154,477 12,237 2,236
$2,501 - $3,000 25,351,047 12,656,877 9,257 2,739
$3,001 - $3,500 23,471,523 12,056,042 7,237 3,243
$3,501 - $4,000 22,526,847 12,000,058 6,022 3,741
$4,001 - $4,500 20,925,267 11,662,857 4,933 4,242
$4,501 - $5,000 19,476,186 11,013,874 4,107 4,742
$5,001 - $10,000 152,609,224 98,368,603 21,271 7,175
$10,001 - $15,000 119,089,116 88,389,114 9,692 12,287
$15,001 - $20,000 100,773,003 81,575,484 5,837 17,265
$20,001 - $25,000 77,109,597 64,514,650 3,458 22,299
$25,001 - $30,000 66,036,805 56,718,686 2,414 27,356
$30,001 - $35,000 57,020,025 50,323,019 1,758 32,435
$35,001 - $40,000 51,950,919 46,297,270 1,390 37,375
$40,001 - $45,000 47,957,590 43,356,080 1,130 42,440
$45,001 - $50,000 40,787,196 36,880,226 861 47,372
$50,001 - $100,000 234,156,257 215,824,720 3,403 68,809
$100,001 - $200,000 176,200,021 165,818,932 1,299 135,643
$200,001 - $300,000 79,537,756 75,461,108 330 241,024
$300,001 - $400,000 47,341,781 45,807,364 139 340,588
$400,001 - $500,000 39,562,553 38,594,584 88 449,574
$500,001 - $1,000,000 41,940,420 40,404,839 65 645,237
$1,000,000 - $2,000,000 13,503,392 11,972,495 10 1,350,339
> $2,000,000 4,312,977 4,229,635 2 2,156,489
Total 1,606,584,633 1,295,878,622 298,652 5,379

41
5/30/2017
Past Federal Reinsurance Outcomes
Federal reinsurance is very similar to the MPSP. This temporary program was put into place in order to reduce
individual market premiums during the first three years of the ACA from 2014 through 2016. The federal
reinsurance program was funded through an assessment paid by health insurance companies and self-insured
employer plans at a per person per year rate of $63 in 2014 and $44 in 2015. The initial funding projections for
the program were based on collecting an estimated $10 billion for 2014, $6 billion for 2015, and $4 billion for
2016 nationwide. Actual collections were then distributed to retrospectively reimburse individual market
insurance companies for actual high-cost case claims. Issuers used the anticipated reinsurance reimbursements
when they calculated their rates in 2014, 2015, and 2016.
In 2014 and 2015, actual reinsurance revenues exceeded expected payments, resulting in carriers receiving
significantly higher assistance then they had initially anticipated and the federal regulators had originally
designed. The following tables provide an overview of how the final parameters of the 2014 and 2015 federal
reinsurance program design provided actual financial support for Minnesota’s individual health insurance
market. For both years, the attachment point was $45,000 and the reinsurance cap was $250,000. For 2014,
the coinsurance rate was 100 percent, and for 2015 the coinsurance rate was 55.1 percent.
Table App-3
Carrier Assistance from federal reinsurance, PMPM
Average Count Total Paid, 2014
Blue Cross $ 87.12 112,183 $ 117,276,164
Group Health 49.24 4,562 2,695,283
HealthPartners Ins Co 55.66 15,381 10,273,154
HealthPartners Inc.* 379.99 Incl above 1,402,533
Medica of WI 81.66 2,725 2,670,519
Medica Ins Co 30.58 22,606 8,295,441
PreferredOne 58.48 73,156 51,337,472
UCare 52.62 494 311,887
All Minnesota $ 68.50 236,334 $ 194,262,452
*This issuer held a small closed block of conversion members who tended to be very unhealthy and have
been merged.

42
5/30/2017
Table App-4
Carrier Assistance from federal reinsurance, PMPM
Average Count
Total Paid, 2015
Blue Cross $ 58.38 179,410 $ 125,694,015
Group Health 33.11 11,756 4,670,696
HealthPartnersIns Co 20.52 37,706 9,283,260
Medica of WI 78.60 6,414 6,049,812
Medica Ins Co 33.11 11,527 4,412,954
PreferredOne 53.97 6,517 4,220,736
UCare 16.92 9,647 1,958,644
All Minnesota $ 49.17 270,444 $ 159,561,268
** Both tables exclude Time and John Alden, who left all health insurance markets in 2016 and beyond.

43
5/30/2017
Appendix 3 - The Role of Enrollees’ Income in the Model
Eligibility for public programs, MinnesotaCare (the basic health plan), and individual market subsidies is driven
by income in comparison to the Federal Poverty Level (FPL). The table below shows the current FPL, as issued by
the United States Department of Health and Human Services.
Table App-5
Minnesota is unique in that a high percentage of the people who qualify for federal subsidies enroll in
MinnesotaCare. These are people with incomes at or below 200 percent of FPL. MinnesotaCare enrollment has
been stable in comparison to enrollment in plans for people in other income bands, mainly due to longstanding
county and community outreach and because Minnesotans are very aware of the program’s value since the
program has existed for twenty years, well before its conversion to a basic health plan. The federal portion of
funding for MinnesotaCare is determined by the Office of the Actuary. Those who would normally be eligible for
87 and 94 percent Cost Sharing Reduction (CSR) plan variants19 participate in MinnesotaCare instead of the
individual market risk pool.
Data from individual market issuers over the last four plan years is used to understand the count for those
enrolled in the 73 percent CSR plan variant. This data provides a very good proxy of those with incomes between
200 and 250 percent FPL and who collect CSR subsidies. That plan variant’s enrollment is low20 compared to the
income class itself participating in the individual market because the 73 percent CSR plan variant does not
provide much cost sharing subsidy support; the actuarial value is only 1 to 5 percent better than typical silver
plans, making bronze plans attractive to many enrollees in terms of overall value.
The following table presents the income bands that reasonably represent the combined MinnesotaCare and
individual market enrollment for plan year 2018, both with and without a reinsurance program/waiver in place,
broken down by Premium Tax Credit (PTC) eligibility. The table demonstrates that there are individuals with
incomes in low enough ranges to normally qualify for Medicaid, MinnesotaCare, or PTC, though fail to meet
certain U.S. citizenship and immigration status requirements who instead use the individual market, although in
low amounts due to the affordability issues affecting this income bracket. The table shows that that the
additional enrollees in the individual market may likely come from those over 400 percent FPL. The individual
19 Cost sharing reductions are not affected by this waiver request. 20 7,681 as of April 2016.
Number of Persons in Household Assumed FPL
1 12,060$
2 16,240$
3 20,420$
4 24,600$
each 1 more add $4,180

44
5/30/2017
market hit an enrollment high point of 300,000 in 2015, and it is assumed that those who will return, or for the
first time join, the individual market due to the reinsurance program’s existence will be those who do not qualify
for PTC. This is assumed because those with PTC were not materially affected by the rate increases that drove
the enrollment declines. This assumption is supported by the fact that while there has been overall steep
enrollment declines since 2015, the number of people who receive PTC has increased over the same time
period.
Table App-6
The table below shows our estimated expected contribution percentages impacting plan year 2018 subsidy
levels.
Table App-7
One issue brought up during the public commentary period was whether or not Minnesota’s top-down modeling
approach missed that the reinsurance program financial effect always provides a full federal PTC savings in all
circumstances, particularly for young single persons in lower cost rating areas. The following two charts help
illustrate and answer the question posed. Table App-8 shows how premium as a percent of income for the least
expensive adult age group (21-24) and in the least expensive rating area (rating area 8, the Twin Cities metro
area) varies by income level both before and after the reinsurance program is reflected. For those that receive
PTC with incomes between 200 and approximately 285 percent FPL, the full premium difference provides full
savings to the federal budget because the federal support provides dollar-for-dollar assistance. However, for
those between approximately 285 and 365 percent FPL, federal savings is not fully achieved: only about half of
the difference should be applied overall for that income/age band. Between 365 percent FPL and 400 percent
FPL, while the persons age 21-24 benefit from the reinsurance program, there is no federal PTC savings. This
analysis can be compared to Table App-9, which shows that by age 45, full federal PTC savings can be credited
throughout all of the PTC- eligible income band levels.
Expected Enrollment Distribution - Non-group Enrollees
Plan Year 2018
Income Band PTC-eligible PTC-ineligible PTC-eligible PTC-ineligible Default Program
<100 FPL 0 27 0 27 Medicaid if eligible
100 FPL <= 138 FPL 0 12 0 12 Medicaid if eligible
138 FPL to 150 FPL 23,100 8 23,100 8 MinnesotaCare if eligible
150 FPL to 200 FPL 60,079 18 60,079 18 MinnesotaCare if eligible
200 FPL to 250 FPL 28,300 18 23,000 18 Individual Market
250 FPL to 300 FPL 20,900 18 25,000 18 Individual Market
300 FPL to 400 FPL 27,800 29 29,000 29 Individual Market
Over 400 FPL 0 92,870 0 72,870 Individual Market
SubTotal 160,179 93,000 160,179 73,000
Total 253,179 233,179
MinnesotaCare +
Individual Market
Assuming Reinsurance/Waiver Assuming No Reinsurance/Waiver
Income Band Estimated 2018 Federal Maximum (% of Annual Gross Income)
200 to 250 FPL 6.45 - 8.24 %
250 to 300 FPL 8.24 - 9.74 %
300 to 400 FPL 9.74%

45
5/30/2017
Table App-8

46
5/30/2017
Table App-9
In order to determine the aggregate effect of this issue for all ages, rating areas, and income levels in the model,
the table below helped demonstrate that this issue impacts the premium tax credits by only 0.2 percent in
aggregate because there are very few young, single persons who are expected to receive PTC. Other
assumptions play a major modeling role, such as the overall and specific issuer rate increases, the second lowest
silver rate, and the proportion of PTC-eligible enrollees versus overall enrollees in the individual market.

47
5/30/2017
Table App-10
Note that for evaluating this issue, the Geographic Cost Factors (GCFs) are based on the plan year 2016 interim
risk adjustment report issues by CMS on April 11, 2017; these factors represent an accurate estimate of the
average rating area factors. Age and rating area proportional data are based on MNsure (Minnesota’s exchange)
enrollment from April 2016, as provided by an annual survey of issuers. Family versus single contract share and
PTC-income band estimates between 200-400 percent FPL are based on information provided by MNsure staff in
May of 2017.
PTC-eligible Estimated Income Factor
Rating Area All 1 2 3 4 5 6 7 8 9
1.000 1.300 1.071 1.172 1.242 1.153 1.054 0.989 0.937 1.071
Geo Rating Area Enrollment Proportion (x) 100.00% 7.76% 6.45% 4.86% 2.95% 4.35% 4.55% 9.05% 58.69% 1.34%
PTC-eligible Income Band (% FPL) 200-300% 300-400% Income Band----------------------------------------------------------->
Income Band Enrollment Proportion of PTC 63.9% 36.1%
99.99% 99.99% 99.72% 99.93% 99.98% 99.91% 99.63% 99.14% 98.37% 99.72%
Average income factor - weight by area (x) 99.6% Weighted average Income Factor for single contracts
Age Proportion of Age Single contract Age Curve
Band PTC-eligible (z) Proportion (y) (w) Income Factors--------------------------------------------------------------------->
0-20 12.7% 0.002 0.890 0.848 0.310 0.584 0.746 0.527 0.262 0.139 0.062 0.310
21 1.0% 0.020 1.000 0.989 0.665 0.869 0.952 0.837 0.609 0.422 0.276 0.665
22 1.0% 0.020 1.000 0.989 0.665 0.869 0.952 0.837 0.609 0.422 0.276 0.665
23 1.0% 0.040 1.000 0.989 0.665 0.869 0.952 0.837 0.609 0.422 0.276 0.665
24 1.0% 0.040 1.000 0.989 0.665 0.869 0.952 0.837 0.609 0.422 0.276 0.665
25 1.1% 0.080 1.004 0.991 0.676 0.877 0.956 0.844 0.621 0.434 0.286 0.676
26 1.4% 0.080 1.024 0.998 0.728 0.907 0.974 0.880 0.679 0.497 0.339 0.728
27 1.4% 0.100 1.048 1.000 0.783 0.938 0.989 0.916 0.739 0.572 0.407 0.783
28 1.5% 0.100 1.087 1.000 0.858 0.975 1.000 0.959 0.822 0.681 0.521 0.858
29 1.5% 0.120 1.119 1.000 0.906 0.993 1.000 0.983 0.877 0.756 0.614 0.906
30 1.5% 0.120 1.135 1.000 0.926 0.997 1.000 0.991 0.899 0.788 0.656 0.926
31 1.5% 0.150 1.159 1.000 0.952 1.000 1.000 0.998 0.929 0.832 0.713 0.952
32 1.5% 0.150 1.183 1.000 0.971 1.000 1.000 1.000 0.954 0.871 0.764 0.971
33 1.5% 0.150 1.198 1.000 0.980 1.000 1.000 1.000 0.965 0.892 0.793 0.980
34 1.5% 0.200 1.214 1.000 0.988 1.000 1.000 1.000 0.977 0.912 0.822 0.988
35 1.5% 0.200 1.222 1.000 0.992 1.000 1.000 1.000 0.981 0.922 0.835 0.992
36 1.5% 0.250 1.230 1.000 0.994 1.000 1.000 1.000 0.985 0.930 0.847 0.994
37 1.5% 0.300 1.238 1.000 0.996 1.000 1.000 1.000 0.989 0.938 0.859 0.996
38 1.5% 0.350 1.246 1.000 0.998 1.000 1.000 1.000 0.992 0.945 0.871 0.998
39 1.5% 0.400 1.262 1.000 1.000 1.000 1.000 1.000 0.996 0.959 0.892 1.000
40 1.5% 0.450 1.278 1.000 1.000 1.000 1.000 1.000 1.000 0.970 0.911 1.000
41 1.5% 0.500 1.302 1.000 1.000 1.000 1.000 1.000 1.000 0.984 0.936 1.000
42 1.5% 0.550 1.325 1.000 1.000 1.000 1.000 1.000 1.000 0.993 0.956 1.000
43 1.5% 0.600 1.357 1.000 1.000 1.000 1.000 1.000 1.000 1.000 0.977 1.000
44 1.5% 0.650 1.444 1.000 1.000 1.000 1.000 1.000 1.000 1.000 0.993 1.000
45 and above 53.9% 0.681 2.091 1.000 1.000 1.000 1.000 1.000 1.000 1.000 1.000 1.000
45.1% Single Contract Proportion Income Factor (Single): 99.6%
54.9% Family Contract Proportion Income Factor (Family): 99.9%
100.0% ALL PTC-eligible Contracts Income Factor (All): 99.8%
Average age-weighted income factor per area
weighted by (z) (y) and (w)
Geographic Cost Factor

48
5/30/2017
Appendix 4 - Reliance Statement
As previously stated, Shawn Welch, Reports and Forecasts Director for the Minnesota Department of Human
Services (DHS), provided the necessary analysis and information for the “Basic Health Plan Impact” section. This
analysis is based on the formula that the state currently applies when determining the federal funding amounts
available for the basic health plan under 42 C.F.R. Part 600, Subpart G and in consultation with the CMS’
Office of the Actuary. DHS’ certifies that this analysis is based on the most accurate, reasonable and
complete data available to the state in determining the impact to the basic health plan with and without this
waiver. DHS relied on current assumptions made in its state’s budget forecast along with the Department of
Commerce’s premium data for the second lowest silver plan. Nothing in this analysis changed the federal
funding formula for the basic health plan.
Stacie Weeks, JD, MPH
Federal Relations & Health Policy Manager| Health Care Administration
Minnesota Department of Human Services
540 Cedar St, St. Paul, MN 55108
O: 651-431-2151
mn.gov/dhs

49
5/30/2017
Appendix 5 - Additional Modeling Results and Information on Targets
The impact of the waiver on the second-lowest silver rate for a representative consumer is used to validate the
reasonableness of the statewide scenario results stated in the analysis. A combination of 2016-2017 data and
2018 assumptions are applied to place the anticipated 77,000 premium tax credit recipients into 3,570
groupings based on their county of residence, single/family status, income level, and age group. With the
additional level of robustness, however, a shift from reliance on data to reliance on assumptions is necessary
due to a number of data factors being available on a statewide basis rather than a rating area- or county-by-
county basis, including single/family status, income levels, and age groups. A data-driven statewide analysis
with validation from an assumption-based county-by-county analysis provides additional comfort that the
results are reasonable if results consistent with the scenario results occur. The top-down approach (statewide
analysis) and bottom-up approach (county-by-county analysis) produced similar results. Due to a degree of
uncertainty in the county-by-county assumptions on age groupings, family status, and income levels, the county-
by-county results were calibrated to the statewide midpoint results. The county-level results for mid-level
scenario federal savings both with and without the waiver are displayed.
Table App-11
APTC with and without waiver, by county
County
2018 APTC With
Waiver
2018 APTC
Without
Waiver
Aitkin 1,100,000$ 1,600,000$
Anoka 13,400,000 20,400,000
Becker 2,900,000 4,300,000
Beltrami 2,100,000 3,100,000
Benton 1,900,000 2,900,000
Big Stone 1,100,000 1,600,000
Blue Earth 4,600,000 6,800,000
Brown 3,500,000 5,000,000
Carlton 1,500,000 2,200,000
Carver 6,200,000 9,500,000
Cass 2,400,000 3,500,000
Chippewa 1,300,000 1,900,000
Chisago 3,200,000 4,700,000
Clay 3,200,000 4,700,000
Clearwater 600,000 900,000
Cook 600,000 900,000

50
5/30/2017
Table App-11, continued
County
2018 APTC With
Waiver
2018 APTC
Without
Waiver
Cottonwood 1,600,000 2,300,000
Crow Wing 4,500,000 6,700,000
Dakota 18,600,000 28,200,000
Dodge 1,400,000 2,000,000
Douglas 4,200,000 6,100,000
Faribault 1,800,000 2,700,000
Fillmore 2,200,000 3,200,000
Freeborn 2,900,000 4,200,000
Goodhue 4,000,000 5,700,000
Grant 900,000 1,400,000
Hennepin 63,400,000 96,300,000
Houston 1,800,000 2,600,000
Hubbard 1,500,000 2,200,000
Isanti 2,000,000 2,900,000
Itasca 2,300,000 3,300,000
Jackson 1,500,000 2,100,000
Kanabec 800,000 1,100,000
Kandiyohi 3,900,000 5,700,000
Kittson 600,000 900,000
Koochiching 700,000 1,100,000
Lac qui Parle 1,300,000 1,900,000
Lake 600,000 900,000
Lake of the Woods 600,000 900,000
Le Sueur 1,800,000 2,600,000
Lincoln 1,000,000 1,400,000
Lyon 2,500,000 3,600,000
Mahnomen 300,000 500,000
Marshall 1,500,000 2,300,000
Martin 2,200,000 3,200,000
McLeod 3,000,000 4,400,000
Meeker 2,300,000 3,400,000
Mille Lacs 1,600,000 2,400,000
Morrison 3,000,000 4,500,000
Mower 1,800,000 2,500,000
Murray 1,900,000 2,700,000
Nicollet 2,000,000 2,900,000
Nobles 2,500,000 3,600,000
Norman 2,500,000 3,600,000
Olmsted 5,900,000 8,400,000
Otter Tail 5,100,000 7,400,000

51
5/30/2017
Table App-11, continued
County
2018 APTC With
Waiver
2018 APTC
Without
Waiver
Pennington 800,000 1,000,000
Pine 1,300,000 1,700,000
Pipestone 1,700,000 2,200,000
Polk 2,500,000 3,200,000
Pope 2,200,000 2,900,000
Ramsey 18,400,000 24,600,000
Red Lake 400,000 500,000
Redwood 2,800,000 3,500,000
Renville 2,600,000 3,400,000
Rice 3,600,000 4,600,000
Rock 1,800,000 2,200,000
Roseau 1,000,000 1,300,000
Scott 7,800,000 10,500,000
Sherburne 4,600,000 6,200,000
Sibley 1,600,000 2,100,000
St. Louis 8,400,000 10,900,000
Stearns 8,300,000 11,100,000
Steele 2,000,000 2,500,000
Stevens 1,500,000 2,000,000
Swift 1,300,000 1,600,000
Todd 1,900,000 2,500,000
Traverse 700,000 900,000
Wabasha 1,900,000 2,500,000
Wadena 1,500,000 1,900,000
Waseca 1,600,000 2,100,000
Washington 13,000,000 17,500,000
Watonwan 1,700,000 2,100,000
Wilkin 1,100,000 1,500,000
Winona 2,500,000 3,200,000
Wright 7,300,000 9,700,000
Yellow Medicine 1,300,000 1,700,000
Total 322,600,000$ 460,900,000$

52
5/30/2017
Table App-12
Table App-13
Table App-14
APTC with and without waiver, single/family
2018 APTC With
Waiver
2018 APTC Without
Waiver
Single 145,100,000$ 213,200,000$
Family 177,500,000 247,700,000
Total 322,600,000$ 460,900,000$
138,300,000
APTC with and without waiver, by income
% Federal
Poverty Level
Income
2018 APTC With
Waiver
2018 APTC
Without Waiver
200-250% 143,200,000$ 192,800,000$
250-300% 86,300,000 125,800,000
300-400% 93,100,000 142,300,000
Total 322,600,000$ 460,900,000$
APTC with and without waiver, by age grouping
Age
2018 APTC With
Waiver
2018 APTC
Without Waiver
0-21 3,700,000$ 6,300,000$
22-29 15,500,000 24,700,000
30-39 27,700,000 43,200,000
40-49 38,400,000 57,700,000
50-59 115,800,000 162,500,000
60-64 119,300,000 163,500,000
65+ 2,200,000 3,000,000
Total 322,600,000$ 460,900,000$

53
5/30/2017
Table App-15
Table App-16
Table App-17
APTC with and without waiver, by year
Statewide
2018 APTC With
Waiver
2018 APTC
Without Waiver Difference
2018 322,632,514$ 460,941,752$ 138,309,239$
2019 352,064,925 502,991,535 150,926,611
2020 384,256,573 548,983,411 164,726,839
2021 419,471,421 599,294,501 179,823,082
2022 457,999,051 654,338,529 196,339,480
2023 500,157,176 714,569,407 214,412,234
2024 546,294,397 780,485,180 234,190,786
2025 596,793,238 852,632,354 255,839,120
2026 652,073,474 931,610,658 279,537,188
2027 712,595,793 1,018,078,272 305,482,484
Affordability - Average Individual Market Premium Contribution Per Member, with waiver
Year Q1 Q2 Q3 Q4 Annual
Projected 2018 1,111$ 1,111$ 1,111$ 1,111$ 4,443$
Projected 2019 1,171 1,171 1,171 1,171 4,682
Projected 2020 1,233 1,233 1,233 1,233 4,932
Projected 2021 1,298 1,298 1,298 1,298 5,192
Projected 2022 1,366 1,366 1,366 1,366 5,464
Affordability - Average Individual Market Premium Contribution Per Member, without waiver
Year Q1 Q2 Q3 Q4 Annual
Projected 2018 1,386$ 1,386$ 1,386$ 1,386$ 5,545$
Projected 2019 1,458 1,458 1,458 1,458 5,834
Projected 2020 1,534 1,534 1,534 1,534 6,135
Projected 2021 1,612 1,612 1,612 1,612 6,448
Projected 2022 1,693 1,693 1,693 1,693 6,772

54
5/30/2017
Table App-18
Year
Total Individual
Market
Premiums, with
waiver
2018 1,078,020,000$
2019 1,139,554,800
2020 1,204,235,712
2021 1,272,181,868
2022 1,343,511,608
2023 1,418,341,573
2024 1,496,785,657
2025 1,578,953,794
2026 1,664,950,567
2027 1,754,873,608

55
5/30/2017
Table App-19
Year
Total Individual
Market
Premiums,
without waiver
2018 1,238,400,000$
2019 1,318,896,000$
2020 1,404,624,240$
2021 1,495,924,816$
2022 1,593,159,929$
2023 1,696,715,324$
2024 1,807,001,820$
2025 1,924,456,938$
2026 2,049,546,639$
2027 2,182,767,171$

56
5/30/2017
Table App-20
Assumed 2018 2nd Lowest Silver Premiums*, With Waiver, by Age
County 20 26 35 45 55 62 65
Aitkin 273$ 314$ 375$ 443$ 684$ 881$ 920$
Anoka 234$ 270$ 322$ 380$ 587$ 757$ 790$
Becker 298$ 343$ 409$ 484$ 747$ 963$ 1,005$
Beltrami 273$ 314$ 375$ 443$ 684$ 881$ 920$
Benton 239$ 275$ 328$ 388$ 599$ 772$ 806$
Big Stone 314$ 361$ 431$ 509$ 786$ 1,013$ 1,058$
Blue Earth 315$ 362$ 432$ 511$ 789$ 1,016$ 1,061$
Brown 356$ 409$ 488$ 577$ 891$ 1,148$ 1,199$
Carlton 285$ 327$ 391$ 462$ 713$ 919$ 959$
Carver 234$ 270$ 322$ 380$ 587$ 757$ 790$
Cass 273$ 314$ 375$ 443$ 684$ 881$ 920$
Chippewa 314$ 361$ 431$ 509$ 786$ 1,013$ 1,058$
Chisago 269$ 310$ 370$ 437$ 674$ 869$ 907$
Clay 298$ 343$ 409$ 484$ 747$ 963$ 1,005$
Clearwater 302$ 348$ 415$ 491$ 758$ 976$ 1,019$
Cook 285$ 327$ 391$ 462$ 713$ 919$ 959$
Cottonwood 356$ 409$ 488$ 577$ 891$ 1,148$ 1,199$
Crow Wing 273$ 314$ 375$ 443$ 684$ 881$ 920$
Dakota 234$ 270$ 322$ 380$ 587$ 757$ 790$
Dodge 356$ 409$ 488$ 577$ 891$ 1,148$ 1,199$
Douglas 298$ 343$ 409$ 484$ 747$ 963$ 1,005$
Faribault 315$ 362$ 432$ 511$ 789$ 1,016$ 1,061$
Fillmore 356$ 409$ 488$ 577$ 891$ 1,148$ 1,199$
Freeborn 356$ 409$ 488$ 577$ 891$ 1,148$ 1,199$
Goodhue 356$ 409$ 488$ 577$ 891$ 1,148$ 1,199$
Grant 298$ 343$ 409$ 484$ 747$ 963$ 1,005$
Hennepin 234$ 270$ 322$ 380$ 587$ 757$ 790$
Houston 356$ 409$ 488$ 577$ 891$ 1,148$ 1,199$
Hubbard 273$ 314$ 375$ 443$ 684$ 881$ 920$
Isanti 269$ 310$ 370$ 437$ 674$ 869$ 907$
Itasca 285$ 327$ 391$ 462$ 713$ 919$ 959$
Jackson 356$ 409$ 488$ 577$ 891$ 1,148$ 1,199$
Kanabec 271$ 312$ 373$ 440$ 680$ 876$ 915$
Kandiyohi 314$ 361$ 431$ 509$ 786$ 1,013$ 1,058$
Kittson 272$ 313$ 374$ 441$ 682$ 878$ 917$
Koochiching 285$ 327$ 391$ 462$ 713$ 919$ 959$
Lac qui Parle 314$ 361$ 431$ 509$ 786$ 1,013$ 1,058$

57
5/30/2017
Table App-20, continued
2018 2nd Lowest Silver Premiums*, With Waiver, by Age
County 20 26 35 45 55 62 65
Lake 285$ 327$ 391$ 462$ 713$ 919$ 959$
Lake of the Woods 296$ 341$ 406$ 480$ 742$ 955$ 998$
Le Sueur 315$ 362$ 432$ 511$ 789$ 1,016$ 1,061$
Lincoln 356$ 409$ 488$ 577$ 891$ 1,148$ 1,199$
Lyon 314$ 361$ 431$ 509$ 786$ 1,013$ 1,058$
Mahnomen 302$ 348$ 415$ 491$ 758$ 976$ 1,019$
Marshall 272$ 313$ 374$ 441$ 682$ 878$ 917$
Martin 315$ 362$ 432$ 511$ 789$ 1,016$ 1,061$
McLeod 313$ 360$ 430$ 508$ 784$ 1,011$ 1,055$
Meeker 314$ 361$ 431$ 509$ 786$ 1,013$ 1,058$
Mille Lacs 273$ 314$ 375$ 443$ 684$ 881$ 920$
Morrison 273$ 314$ 375$ 443$ 684$ 881$ 920$
Mower 356$ 409$ 488$ 577$ 891$ 1,148$ 1,199$
Murray 356$ 409$ 488$ 577$ 891$ 1,148$ 1,199$
Nicollet 306$ 352$ 420$ 497$ 767$ 988$ 1,032$
Nobles 356$ 409$ 488$ 577$ 891$ 1,148$ 1,199$
Norman 302$ 348$ 415$ 491$ 758$ 976$ 1,019$
Olmsted 356$ 409$ 488$ 577$ 891$ 1,148$ 1,199$
Otter Tail 298$ 343$ 409$ 484$ 747$ 963$ 1,005$
Pennington 272$ 313$ 374$ 441$ 682$ 878$ 917$
Pine 273$ 314$ 375$ 443$ 684$ 881$ 920$
Pipestone 356$ 409$ 488$ 577$ 891$ 1,148$ 1,199$
Polk 272$ 313$ 374$ 441$ 682$ 878$ 917$
Pope 298$ 343$ 409$ 484$ 747$ 963$ 1,005$
Ramsey 234$ 270$ 322$ 380$ 587$ 757$ 790$
Red Lake 272$ 313$ 374$ 441$ 682$ 878$ 917$
Redwood 356$ 409$ 488$ 577$ 891$ 1,148$ 1,199$
Renville 314$ 361$ 431$ 509$ 786$ 1,013$ 1,058$
Rice 315$ 362$ 432$ 511$ 789$ 1,016$ 1,061$
Rock 356$ 409$ 488$ 577$ 891$ 1,148$ 1,199$
Roseau 253$ 291$ 347$ 410$ 633$ 816$ 852$
Scott 234$ 270$ 322$ 380$ 587$ 757$ 790$
Sherburne 234$ 270$ 322$ 380$ 587$ 757$ 790$
Sibley 313$ 360$ 430$ 508$ 784$ 1,011$ 1,055$
St. Louis 285$ 327$ 391$ 462$ 713$ 919$ 959$
Stearns 239$ 275$ 328$ 388$ 599$ 772$ 806$
Steele 356$ 409$ 488$ 577$ 891$ 1,148$ 1,199$
Stevens 298$ 343$ 409$ 484$ 747$ 963$ 1,005$
Swift 314$ 361$ 431$ 509$ 786$ 1,013$ 1,058$
Todd 273$ 314$ 375$ 443$ 684$ 881$ 920$

58
5/30/2017
Table App-20, continued
Table App-21
2018 2nd Lowest Silver Premiums*, With Waiver, by Age
County 20 26 35 45 55 62 65
Traverse 298$ 343$ 409$ 484$ 747$ 963$ 1,005$
Wabasha 356$ 409$ 488$ 577$ 891$ 1,148$ 1,199$
Wadena 273$ 314$ 375$ 443$ 684$ 881$ 920$
Waseca 315$ 362$ 432$ 511$ 789$ 1,016$ 1,061$
Washington 234$ 270$ 322$ 380$ 587$ 757$ 790$
Watonwan 315$ 362$ 432$ 511$ 789$ 1,016$ 1,061$
Wilkin 298$ 343$ 409$ 484$ 747$ 963$ 1,005$
Winona 356$ 409$ 488$ 577$ 891$ 1,148$ 1,199$
Wright 239$ 275$ 328$ 388$ 599$ 772$ 806$
Yellow Medicine 314$ 361$ 431$ 509$ 786$ 1,013$ 1,058$
*Actual 2018 2nd Lowest Silver Premiums will be proposed by issuers and be subject to the rate
review process
Assumed 2018 2nd Lowest Silver Premiums*, With Waiver, by Rating Area and Age
Rating Area 20 26 35 45 55 62 65
1 356$ 409$ 488$ 577$ 891$ 1,148$ 1,199$
2 285$ 327$ 391$ 462$ 713$ 919$ 959$
3 315$ 362$ 432$ 511$ 789$ 1,016$ 1,061$
4 356$ 409$ 488$ 577$ 891$ 1,148$ 1,199$
5 314$ 361$ 431$ 509$ 786$ 1,013$ 1,058$
6 298$ 343$ 409$ 484$ 747$ 963$ 1,005$
7 269$ 310$ 370$ 437$ 674$ 869$ 907$
8 234$ 270$ 322$ 380$ 587$ 757$ 790$
9 272$ 313$ 374$ 441$ 682$ 878$ 917$
*Actual 2018 2nd Lowest Silver Premiums will be proposed by issuers and be subject to the
rate review process

59
5/30/2017
Table App-22
Assumed 2018 2nd Lowest Silver Premiums*, Without Waiver, by Age
County 20 26 35 45 55 62 65
Aitkin 355$ 409$ 488$ 577$ 890$ 1,147$ 1,198$
Anoka 305$ 351$ 419$ 495$ 765$ 985$ 1,029$
Becker 388$ 447$ 533$ 630$ 973$ 1,253$ 1,309$
Beltrami 355$ 409$ 488$ 577$ 890$ 1,147$ 1,198$
Benton 311$ 358$ 427$ 505$ 780$ 1,005$ 1,049$
Big Stone 409$ 470$ 561$ 663$ 1,024$ 1,319$ 1,377$
Blue Earth 410$ 471$ 563$ 665$ 1,027$ 1,323$ 1,381$
Brown 463$ 533$ 636$ 751$ 1,160$ 1,495$ 1,561$
Carlton 370$ 426$ 509$ 601$ 928$ 1,196$ 1,249$
Carver 305$ 351$ 419$ 495$ 765$ 985$ 1,029$
Cass 355$ 409$ 488$ 577$ 890$ 1,147$ 1,198$
Chippewa 409$ 470$ 561$ 663$ 1,024$ 1,319$ 1,377$
Chisago 350$ 403$ 481$ 568$ 878$ 1,131$ 1,181$
Clay 388$ 447$ 533$ 630$ 973$ 1,253$ 1,309$
Clearwater 394$ 453$ 540$ 639$ 986$ 1,271$ 1,327$
Cook 370$ 426$ 509$ 601$ 928$ 1,196$ 1,249$
Cottonwood 463$ 533$ 636$ 751$ 1,160$ 1,495$ 1,561$
Crow Wing 355$ 409$ 488$ 577$ 890$ 1,147$ 1,198$
Dakota 305$ 351$ 419$ 495$ 765$ 985$ 1,029$
Dodge 463$ 533$ 636$ 751$ 1,160$ 1,495$ 1,561$
Douglas 388$ 447$ 533$ 630$ 973$ 1,253$ 1,309$
Faribault 410$ 471$ 563$ 665$ 1,027$ 1,323$ 1,381$
Fillmore 463$ 533$ 636$ 751$ 1,160$ 1,495$ 1,561$
Freeborn 463$ 533$ 636$ 751$ 1,160$ 1,495$ 1,561$
Goodhue 463$ 533$ 636$ 751$ 1,160$ 1,495$ 1,561$
Grant 388$ 447$ 533$ 630$ 973$ 1,253$ 1,309$
Hennepin 305$ 351$ 419$ 495$ 765$ 985$ 1,029$
Houston 463$ 533$ 636$ 751$ 1,160$ 1,495$ 1,561$
Hubbard 355$ 409$ 488$ 577$ 890$ 1,147$ 1,198$
Isanti 350$ 403$ 481$ 568$ 878$ 1,131$ 1,181$
Itasca 370$ 426$ 509$ 601$ 928$ 1,196$ 1,249$
Jackson 463$ 533$ 636$ 751$ 1,160$ 1,495$ 1,561$
Kanabec 353$ 407$ 485$ 573$ 885$ 1,141$ 1,191$
Kandiyohi 409$ 470$ 561$ 663$ 1,024$ 1,319$ 1,377$
Kittson 354$ 408$ 486$ 575$ 888$ 1,143$ 1,194$
Koochiching 370$ 426$ 509$ 601$ 928$ 1,196$ 1,249$
Lac qui Parle 409$ 470$ 561$ 663$ 1,024$ 1,319$ 1,377$

60
5/30/2017
Table App-22, continued
2018 2nd Lowest Silver Premiums*, Without Waiver, by Age
County 20 26 35 45 55 62 65
Lake 370$ 426$ 509$ 601$ 928$ 1,196$ 1,249$
Lake of the Woods 385$ 443$ 529$ 625$ 965$ 1,244$ 1,299$
Le Sueur 410$ 471$ 563$ 665$ 1,027$ 1,323$ 1,381$
Lincoln 463$ 533$ 636$ 751$ 1,160$ 1,495$ 1,561$
Lyon 409$ 470$ 561$ 663$ 1,024$ 1,319$ 1,377$
Mahnomen 394$ 453$ 540$ 639$ 986$ 1,271$ 1,327$
Marshall 354$ 408$ 486$ 575$ 888$ 1,143$ 1,194$
Martin 410$ 471$ 563$ 665$ 1,027$ 1,323$ 1,381$
McLeod 408$ 469$ 560$ 661$ 1,021$ 1,316$ 1,374$
Meeker 409$ 470$ 561$ 663$ 1,024$ 1,319$ 1,377$
Mille Lacs 355$ 409$ 488$ 577$ 890$ 1,147$ 1,198$
Morrison 355$ 409$ 488$ 577$ 890$ 1,147$ 1,198$
Mower 463$ 533$ 636$ 751$ 1,160$ 1,495$ 1,561$
Murray 463$ 533$ 636$ 751$ 1,160$ 1,495$ 1,561$
Nicollet 398$ 458$ 547$ 646$ 998$ 1,286$ 1,343$
Nobles 463$ 533$ 636$ 751$ 1,160$ 1,495$ 1,561$
Norman 394$ 453$ 540$ 639$ 986$ 1,271$ 1,327$
Olmsted 463$ 533$ 636$ 751$ 1,160$ 1,495$ 1,561$
Otter Tail 388$ 447$ 533$ 630$ 973$ 1,253$ 1,309$
Pennington 354$ 408$ 486$ 575$ 888$ 1,143$ 1,194$
Pine 355$ 409$ 488$ 577$ 890$ 1,147$ 1,198$
Pipestone 463$ 533$ 636$ 751$ 1,160$ 1,495$ 1,561$
Polk 354$ 408$ 486$ 575$ 888$ 1,143$ 1,194$
Pope 388$ 447$ 533$ 630$ 973$ 1,253$ 1,309$
Ramsey 305$ 351$ 419$ 495$ 765$ 985$ 1,029$
Red Lake 354$ 408$ 486$ 575$ 888$ 1,143$ 1,194$
Redwood 463$ 533$ 636$ 751$ 1,160$ 1,495$ 1,561$
Renville 409$ 470$ 561$ 663$ 1,024$ 1,319$ 1,377$
Rice 410$ 471$ 563$ 665$ 1,027$ 1,323$ 1,381$
Rock 463$ 533$ 636$ 751$ 1,160$ 1,495$ 1,561$
Roseau 329$ 378$ 452$ 534$ 824$ 1,062$ 1,109$
Scott 305$ 351$ 419$ 495$ 765$ 985$ 1,029$
Sherburne 305$ 351$ 419$ 495$ 765$ 985$ 1,029$
Sibley 408$ 469$ 560$ 661$ 1,021$ 1,316$ 1,374$
St. Louis 370$ 426$ 509$ 601$ 928$ 1,196$ 1,249$
Stearns 311$ 358$ 427$ 505$ 780$ 1,005$ 1,049$
Steele 463$ 533$ 636$ 751$ 1,160$ 1,495$ 1,561$
Stevens 388$ 447$ 533$ 630$ 973$ 1,253$ 1,309$
Swift 409$ 470$ 561$ 663$ 1,024$ 1,319$ 1,377$
Todd 355$ 409$ 488$ 577$ 890$ 1,147$ 1,198$

61
5/30/2017
Table App-22, continued
Note that actual second lowest silver plan premiums under the waiver will be reported on an annual basis in
addition to estimates of the premiums assuming no waiver.
The table below provides information on 2016 Advanced Premium Tax Credits (APTC) as reported by MNsure.
Table App-23
2018 2nd Lowest Silver Premiums*, Without Waiver, by Age
County 20 26 35 45 55 62 65
Traverse 388$ 447$ 533$ 630$ 973$ 1,253$ 1,309$
Wabasha 463$ 533$ 636$ 751$ 1,160$ 1,495$ 1,561$
Wadena 355$ 409$ 488$ 577$ 890$ 1,147$ 1,198$
Waseca 410$ 471$ 563$ 665$ 1,027$ 1,323$ 1,381$
Washington 305$ 351$ 419$ 495$ 765$ 985$ 1,029$
Watonwan 410$ 471$ 563$ 665$ 1,027$ 1,323$ 1,381$
Wilkin 388$ 447$ 533$ 630$ 973$ 1,253$ 1,309$
Winona 463$ 533$ 636$ 751$ 1,160$ 1,495$ 1,561$
Wright 311$ 358$ 427$ 505$ 780$ 1,005$ 1,049$
Yellow Medicine 409$ 470$ 561$ 663$ 1,024$ 1,319$ 1,377$
*Actual 2018 2nd Lowest Silver Premiums without waiver will be submitted by issuers, per MN
Statutes section 62E.22
Assumed 2018 2nd Lowest Silver Premiums*, Without Waiver, by Rating Area and Age
Rating Area 20 26 35 45 55 62 65
1 463$ 533$ 636$ 751$ 1,160$ 1,495$ 1,561$
2 370$ 426$ 509$ 601$ 928$ 1,196$ 1,249$
3 410$ 471$ 563$ 665$ 1,027$ 1,323$ 1,381$
4 463$ 533$ 636$ 751$ 1,160$ 1,495$ 1,561$
5 409$ 470$ 561$ 663$ 1,024$ 1,319$ 1,377$
6 388$ 447$ 533$ 630$ 973$ 1,253$ 1,309$
7 350$ 403$ 481$ 568$ 878$ 1,131$ 1,181$
8 305$ 351$ 419$ 495$ 765$ 985$ 1,029$
9 354$ 408$ 486$ 575$ 888$ 1,143$ 1,194$
*Actual 2018 2nd Lowest Silver Premiums without waiver will be submitted by issuers, per
MN Statutes section 62E.22

62
5/30/2017
Table App-24
Table App-25
Note that 2017 rate increases ranged from an average of 50 percent to 66.8 percent. This increase is the
primary reason why projected premium tax credits are substantially higher than 2016 premium tax credits.
Rating Area
% of state individual
market enrollment,
2016
1 5.26%
2 4.04%
3 4.59%
4 3.63%
5 5.31%
6 5.63%
7 8.22%
8 60.73%
9 2.58%
Enrollment by Rating Area
Rating Area 2016 APTC
Area 1 $15,679,019
Area 2 $10,221,167
Area 3 $7,768,654
Area 4 $5,502,593
Area 5 $6,822,918
Area 6 $6,569,712
Area 7 $11,471,453
Area 8 $40,934,506
Area 9 $1,857,239
Total $106,827,261