ad-756 349 pressure measuring devices, … · review of observations from hydrostatic pressure...
TRANSCRIPT

"\
AD-756 349
REVIEW OF OBSERVATIONS FROM HYDROSTATIC PRESSURE MEASURING DEVICES, WAPPAPELLO DAM, WAPPAPELLO, MISSOURI
W. C. Sherman, et al
Army Engineer Waterways Experiment Station Vicksburg, Mississippi
June 1957
DISTRIBUTED BY:
Kfiri National Technical Information Service U. S. DEPARTMENT OF COMMERCE 5285 Port Roys! Road, Springfield Va. 22151

■
Et M*i D«t«
M?J-6
SBP3-17
isst
Sei* 195Ä
MPVtf Od IS52
MPt-37 1SS2
MP j-a 19S3
TMJ-JJM »54
TMi-m 0« ■5S
TM 3 "5 IM
TP. W» 0* JIB
TR WH MW
TÄS^iJ. Apr «57
TRMS8 hut 1B7
MatjSJS» RsrtBVs», L«ss*c«
Jtoniw o* &2i B*ÖSB «rfOölrn-"» rf fej*
Xari** a. Se& Beä*s «aj Caetrurj..: «I Wjflw* Ldfc» Pwiwiim Hat
Ctbm»J fWfitei.
RCT»» ai 5s3t !X«ijr, sac Fisia Or.js^E.
Rerww s^ 5*1* *id tsätsii^iR Dejya t1*s4wi? Cseoul Sfcactsre, LMicV&L
SbH»» «JSwk fieagR äs F«3&vöbv Y«M» Kins', M»»ii»3wB
Isiijijg« Strtgas* and fogi»;
Ja Raä ■ J Ejafenkawst,
atamma,
RUMJ !M«Bsi»in Dem, .ütaöMj
D»Ja, Bayse RsgekS* Fs,
Gfcttrotiea*, .^^a l-BHtwliwi,;Mi*jlä*,"'T«
Renew et J«3* Dtsijs. Css. ■*•" .ar&.t» 1Äc»»a& S*7M iaeof L«ek
■ . ■
'-

REVIEW OF OBSERVATIONS FROM HYDROSTATIC PRESSURE MEASURING DEVICES WAPPAPELLO DAM, WAPPAPELLO, MISSOURI
lie I
lints 101
TECHNICAL REPORT NO. 3-460
Jun« 1957
Reproduced by
NATIONAL TECHNICAL INFORMATION SERVICE
U S D*portmtn» of Ca«r>m«r« SprlngfltIdVA231.il
Prepared for
The President, Mississippi River Commission
U. S. Army Engineer Waterways Experiment Station
CORPS OF ENGINEERS
Vicksburg, Mississippi mmur M»C vir.-;mumo **-*j
6\
Ill
PREFACE
The study reported herein is one of a number of similar studies of
foundation and soil mechanics features of completed structures in the
Lover Mississippi Valley Division*. These studies are being made for
the Engineering Division, Mississippi River Commissicn, by the Waterways
Experiment Station.
Wappapello Dam was designed by and built under the supervision of
the Memphis District, CE. Construction was begun in September 1938 and
completed in May 19^1. Observations of piezometers and hydrostatic
pressure cells were made during construction and have been continued to
date. Measurements of seepage emerging from the toe drainage system **or
the dam were made in 19^1, 1?^2, and 19^5.
This report contains analyses of seepage and hydrostatic pressure
data obtained since 19^1 and an evaluation of the safety of the foun-
dation downstream of the dam with respect to uplift. Although seepage
and substratum pressures do not appear to be critical, some of the
piezometers in the embankment and foundation will continue to be ob-
served as a check on hydrostatic pressures and the effectiveness of the
drainage system.
Analyses of data in this report were made l»y Mr. W. M. Nichols
and Mrs. Marie M. Lassiter, both formerly with the Soils Division,
Waterways Experiment Station, and Mr. W. C. Sherman, under the direction
of Messrs. W. J. Turnbull, W. G. Shockley, and R. I. Kaufman, Soils
Division, Waterways Experiment Station. This report was prepared by
Messrs. Sherman ard Nichols.
* A list of associated reports is given on the inside of the front cover of this report.
Preceding page blank

CONTENTS
Page
PREFACE iii
SUMMARY vii
PART I: INTRODUCTION 1 Furpose of Study 1 Scope of Report 1 Description of Dam 1 Pertinent Reservoir Stages . 2
PART II: FOUNDATION CONDITIONS AND TOE DRAINAGE SYSTEM ... 6 Field Exploration 6 Foundation Soils 6 Drainage System and Fill in Channel 10
PART III: HYDROSTATIC PRESSURE MEASURING DEVICES 15 Description and Location 15
PART IV: OBSERVATIONS AND ANALYSIS OF DATA 2k Schedule for Readings 2k Piezometers at Downstream Toe 2k Piezometers at Sta 15+05B jk Hydrostatic Pressure Cells 37 Seepage Measurements ......... 39 Adequacy of Tee Drainage System kl
PART V: CONCLUSIONS AND RECOMMENDATIONS 1*3 Conclusions 1*3 Recommendations kk
J.f *_-)f Tahles
Table Title
1 Location of Piezometers Along Downstream Toe of Dam 17
2 Location of Piezometers at Sta 15+05B 18
3 Location of Hydrostatic Pressure Cells 19
Preceding page blank

•»^r^a-Kf,*,..
VI
List of Illustrations
Figure Title gage
1 Typical cross section of dam 3
2 Aerial view of dam after discbarge over spillway in 19*5 h
3 Backwater against downstream slope of dam in 1S&5 5
k Location of borings, test pits, trenches, and hydro- static pressure measuring devices 7
5 Logs of borings along center line of dam 8
6 Generalized soil profile alorg center line of dam 9
7 Soil profile, location of piezometers, and piezo- metric data, 1»80 ft downstream from center line or «lam 11
8 Details of toe drainage system 12
9 Construction of toe drain at downstream tee of dam 13
10 View of piezometers along downstream tee of dam 20
11 Cross section, location of piezometers, and piezo- metric data, sta 15+05B 21
12 Cross section and location of hydrostatic pressure cells, sta 9+C0B 22
13 Data from piezometers rear downstream tee of daa, 19lU_19U8 25
Ik Data from piezometers near downstream toe of dam, 191*9.1956 26
15 Readings of typical piezometers vs reservoir pool elevation 28
16 Hydrostatic pressure near downstream tee of dam vs depth, sta II+05B 30
17 upward hydraulic gradients through foundation alvng downstream tee of dam 32
18 Data from piezometers at sta 15+05B, piezometers A, B, C, and F 35
19 Data from piezometers at sta I5+O5B, piezometers G, I, L, and M 36
20 Data from hydrostatic pressure cells 36
21 hfeasured seepage from tee drain kO
y
vii
SUMMARY
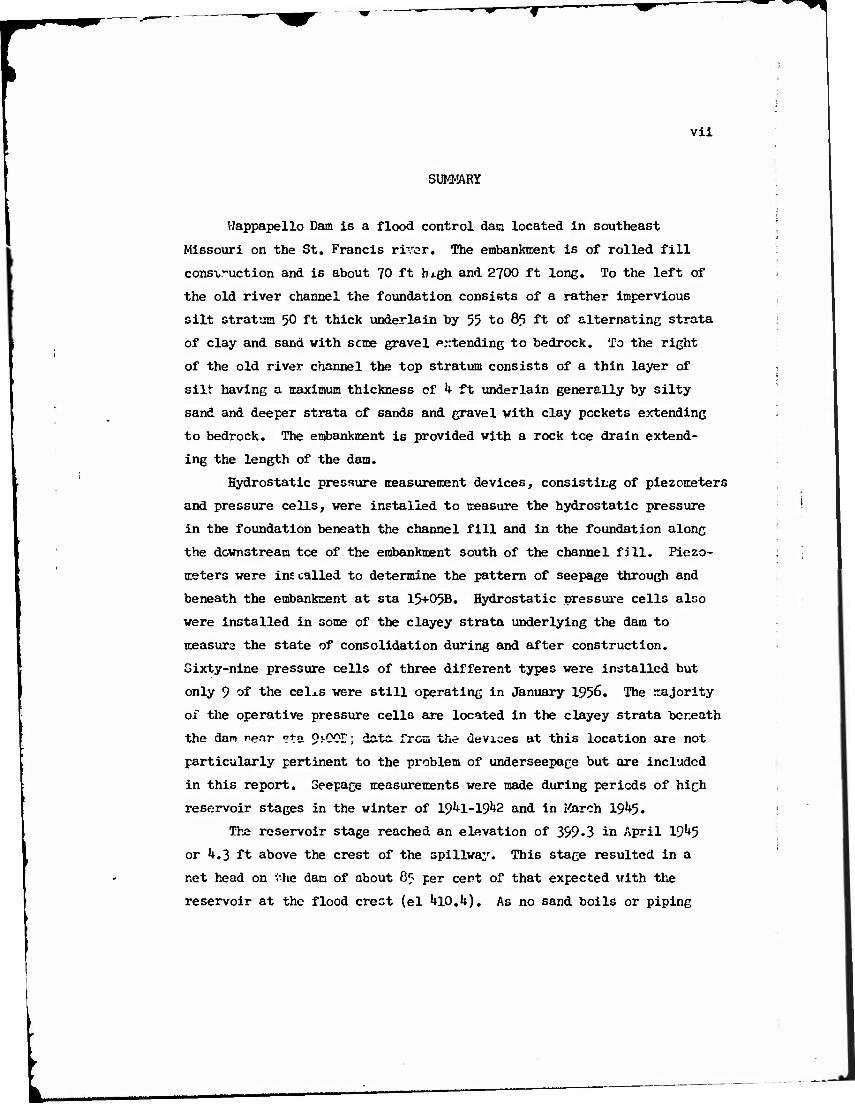
Wappapello Dam is a flood control dan located in southeast
Missouri on the St. Francis river. The embankment is of rolled fill
construction and is about 70 ft high and 2700 ft long. To the left of
the old river channel the foundation consists of a rather impervious
silt stratum 50 ft thick underlain by 55 to 85 ft of alternating strata
of clay and sand with seme gravel extending to bedrock. To the right
of the old river channel the top stratum consists of a thin layer of
silt having a maximum thickness of h ft underlain generally by silty
sand and deeper strata of sands and gravel with clay pockets extending
to bedrock. The embankment is provided with a rock tee drain extend-
ing the length of the dam.
Hydrostatic pressure measurement devices, consisting of piezometers
and pressure cells, were installed to measure the hydrostatic pressure
in the foundation beneath the channel fill and in the foundation along
the downstream tee of the embankment south of the channel fill. Piezo-
meters were ins called to determine the pattern of seepage through and
beneath the embankment at sta 15+05B. Hydrostatic pressure cells also
were installed in some of the clayey strata underlying the dam to
measure the state of consolidation during and after construction.
Sixty-nine pressure cells of three different types were installed but
only 9 of the celj.s were still operating in January 1956. The majority
of the operative pressure cells are located in the clayey strata beneath
the dam renr ?ta 9^0CF; data from the devices at this location are not
particularly pertinent to the problem of underseepage but are included
in this report. Seepage measurements were made during periods of high
reservoir stages in the winter of 19^1-191}2 and in March 19^5.
The reservoir stage reached an elevation of 399.3 in April 19^5
or 4.3 ft above the crest of the spillway. This stage resulted in a
net head on the dam of about 85 per cert of that expected with the
reservoir at the flood crest (el 410.4). As no sand boils or piping

I3>mvil**vt<t*li
Vlll
occurred in 19^5 as a result of seepage or uplift, it is considered
that the dam will be safe with respect to piping and uplift with the
reservoir pool at the flood crest.
Analysis of the data from the piezometers and pressure cells
indicates that the tee drain is effective in reducing excess hydro-
static pressures in the upper pervious foundation strata and in pro-
viding an outlet for the controlled emergence of seepage, and the
hydrostatic head in the deeper sand strata is not excessive for the
existing overburden. The data also indicate that the seepage through
the embankment a,->d foundation is not significant. However, it is
planned to continue observation of piezometers and seepage from the
tee drainage system to check on the future performance of the tee
drain.
/

——^
REVIEW OF OBSERVATIONS FROM
HYDROSTATIC PRESSURE MEASURING DEVICES
WAPPAFELLO DAM, WAPPAFELLO, MISSOURI
PART I: INTRODUCTION
Furpose of Study
1. The purpose of this report is to evaluate the safety of
Wappapello Dan with respect to piping and uplift at the downstream tee
and to evaluate the significance of seepage through the embankment and
foundation.
Scope of Report
2. This report presents an analysis of seepage through and hydro-
static pressures in the foundation and embankment treasured since com- '
pletion of the dam in 19^1 (up to 1956). The hydrostatic pressure
measuring devices are located principally along the downstream tee of
the dan and at sections through the dam at sta 9+COB and 15+OpB. The
only data included are from those devices which have continued to
function for the entire period of observation.
■■
Description cf Dam j
3. Wappapello Dam is located across the 3t. Francis river about
ono-quarter mile southwest of Wappapello, Missouri. The dam was con-
structed by the Memphis District, CE, to control floods on the 3t.
Francis river. It is a rolled-earth embankment about 70 ft high and
27C0 ft long and has a concrete spillway and an outlet structure, both
located in -he right abutment. Three dikes are located north of the dam. i
I

h. The dam was designed for a flood crest elevation of UlO.U ft
mGl*. The elevation of the conservation pool is 255.0 and the top of
the spillway is at el 395.0. The main embankment consists of relatively
impervious fill; the embankment has a crown width of 30 ft at el ^20 and
has symmetrical upstream and downstream composite slopes as shown on
fig. 1. The dam has ba maximum section between sta 19+00B and 19+50B
where the emh"-nkment crosses the bed of the St. Francis river. At this
point the r jbankment is 110 ft high. The stream bed was filled with
compacted ea^-th 500 ft upstream and downstream from the axis of the
dam. The upntream and downstream slopes of the dam are protected with
riprap. The riprap is underlain by a sand and gravel blanket except
for that portion on the downstream slope above el 385 which was placed
directly on the compacted earth embankment. The dam was constructed
between September 1938 and May 19^1. Reference The Wappapello Dan,
Analysis of Design, Appendix II, Report on Soil Investigations, Memphis
District, CE, 1938 and The Wappapello Dam, Plans for the Construction
of Dam and Appurtenant Structures, Memphis District, CE, March 1938,
for details not included in this report.
Pertinent Reservoir Stages
5. The water in the reservoir rose to el 382,7 in May 19^3 and
to el 399-3 in April 1£^5, the maximum stage observed to date. An
aerial view of the dam and spillway area, obtained in April 19H5 after
the flood-water had discharged over the spillway, is shewn on fig. 2; a
view of backwater against the downstream slope is shown on fig. 3. The
most recent significant high water occurred in February I9U9 when the
reservoir rose to el 379.
* All elevations refer to mean Gulf level.

Is Si*
u. «
o
§ ■P o 0) m m m 8 o
■3 o
I !
3 s
I 5
60 ■H
32*OB-I


6
PART II: FOUNDATION CONDITIONS AI© TOE DRAINAGE SYSTEM
Field Exploration
6. Preliminary exploration of the foundation and dam abutments
was accomplished by core and auger borings during the latter part of
1935. More extensive explorations were made by means of core borings,
undisturbed borings, test pits, aiij. exploration trenches as the design
progressed. The locations of subsurface explorations along the embank-
ment are shown on fig. h. Logs of undisturbed and core borings along
the center line of the dam are shown on fig. 5. ^he logs of auger
borings, test pits and trenches are contained in the Analysis of Design
previously referred to and are not shown in this report, as foundation
conditions are adequately represented by the undisturbed and core
borings.
7. AP very pervious deposits of sand and gravel were known to
exist deep in the foundation, an investigation was made to determine
whether these strata were inclined upward upstream from the dam and
outcropped in the reservoir area. Ten core borings (not shown) were
mads from 1000 to 2000 ft upstream of the dam center line but no out-
crops if sand or gravel were found except in the river bed.
Foundation Soils
8. A generalized profile along the center line of the dam is
shewn on fig. 6. The generalized soil profile is based on the auger
borings, test pits and trenches in addition to the borings shown on
fig. 5. From t^e left river bank (about sta 20+00B) to the left (north)
abutment (about sta 31+OOB) a stratum of rather impervious silt extends
50 ft below the ground surface. This stratum is underlain by about
55 to 85 ft of alternating strata of clay and sand with some gravel
extending to limestone bedrock. From the right ri/er bank to

»114.3 • I
Q Z u O
•) •> M
o * 2 u I Q O
_ M 2
Plot ,8a
N S c n u So ü 2 o w a a >■ «. 3 O I- I- < i
a
o
o a o
■H •P g 3
«0

^ w-
19H 13U Ml NUIJ.VA3-I3
OOOOOOOO C «MOOO«M04
» O O o o o o » • * «* O •» • • •» M M M - —
i I Mil I ! i : i 1V jj 1 i 1 I
Jtfr *- if W'P'PPFFH HflPi i*^- MM m
i ! x i
11 |j Ml , 1 ' «me rjwJ £).! ^Bfis JH-JtiHöä J
i ' i ' | 1 fi ' L -4 1 \i
j i
■'ll \ i—i—t : & [ ; : , 1 (SHKJB * SHU» * : j eHS I
o : ! : 1 1 1 i
! J Ml 4 I V • .1 k»: ; : I U Lt i
• III : i <Mf-*g«Jfflffl!C» S : i t ! i _J_ ■ __. K
Si -fcd3 <r»W' 1 BJj 1 1
I M !: t Jl JL^„ £? L "^ 5 l t! <^G ,^^wa ! ■;:{ rilS ̂ EaEDBHKEffi r-i- T^gj-birtj- - -f p 1 i (<-|~4| "4 inn Wm ■ i i , j n fi! r 1 ^T : I 1 1 U r t
■» n EX B hJi_L_
i MM J I j !&4=yr^*iH±r ■ Gpfil ! jTT T l F
! 11 ) , . 1 . _ L^ | t^li^OT
' !
i ■ ' i j Ti i si ;$-,#WHJIWB
i i »• ! ' / 1 J=L..Xt 11 ' TO" rj ^^ 1 ■"-"■""(
i i-iyp
i
! , * kJTT 1 fll"°"""■ An 1 j if) UV i
1 id)«— ^449 i >^ «awui ,ni ■■■ll in mil u
! A 1 1 III 01
0
0<
K-o
ITTIMJH o o o o o o o
I ! I
E3 3
J m 3
^
□
B* o
8
u v t o
! 4
a ■H h O .O
<H o
«0
•H
"W" 1114 Ml MOUVAlll
tf

19n-X33j Ml NOI1VA313
. T . ? . " - " ° s s s s N i i i i i ' i i i I i i i i ITi i i r
3
s o bO a o
I I M I I I I I I I I I I I I i i i i i i | | | 5 f | i ? s g 2 s i
O (0
8 H ß s V O
fa
TOn-UJj M H0UM111

10
approximately sta 11+COB the top stratum consists of a thin layer of
silt having a maximum thickness of about k ft. This top stratum is
generally underlain by silty sand which in turn is underlain by clean
sand and gravel extending to bedrock except for a 5-ft stratum of clay
at el 315 and a 10- to 15-ft stratum of clay at el 260. Frc~ sta
11+0OB to the right (south) abutment a relatively impervious blanket
of silt and clay 30 to 60 ft thick is underlain by a stratum of sand
and gravel extending to bedrock. The rock line rises steeply as it
approaches the abutments.
9. A soil profile near the downstream toe, 480 ft downstream
from the center line of the dam between sta 8+00B to 20+00B, is shown
on fig. 7. In this vicinity the top stratum of relatively impervious
silt ranges from 3 to 10 ft thick from the right bank o' the old river
channel (about sta 15+00B) to about sta 10+OOB. In this area the top
stratum is underlain by about 20 ft of silty sand, in turn underlain
by 10 ft of sand and gravel, 30 ft of clay, and 10 ft of sand and
gravel. Deeper exploration was not conducted in the downstream area,
but it is believed the top of bedrock is at about el 220 to 230.
Drainage System and Fill in Channel
10. A ''jrainage system extending the length of the main embankment
was placed at the downstream tee of the dam to intercept and. carry off
any underoeepa^c tending to emerge in thr'ö area. Jetails of the toe
drainage system are shown on fig. 8; a photograph of the tee drain
during construction is shown on fig. 9. The tee drain has a bottom
width of 50 ft and slopes of 1 on 1.5 and is located, imrediately up-
stream from the downstream toe of the dam. The tee drain consists of
dumped riprap placed over a sand and gravel filter. The elevation of
the bottom of the toe drainage system throughout its entire length is
about el 3^0 except in the river channel where the bottom is at el 336.

i h«i M 'i!?! =? ii * * ! M
It
Siliii *|
riiiiHi!l! J . :- i = »? ! i .M
1 PHiiSJi i !!!!!! il ! " * • - *
11 ! JlTTTTT* »is p AUU ;
at
g o 0)
O
fc H a> +> u
il O Ö N 4) 4* U •H Pig
o <M
7 +> J to
Q ö
4)
Pi-*
O a>
■H
3 2 I 3 8 ion UM M NOUVAJ-ll
§ 2
//

*? J?- < I *! 2 41 ^ 11 §
•St *• 3 I-s I
§ +-- to >» a
o +> <H o to H ■H <S
+> A
00
•H
1

e 1 O
8 p
p 01
o
3
0) o p
o ß o
■H p o
p (D a o o
* «0 •H
A3

14
11. Cofferdams were constructed across the river channel and the
river bed was unwater-?d and stripped of unsuitable materials prior to
construction of the closure section. A compacted fill of an essentially
impervious mixture of rock and sandy silty clay was placed in the river
channel to about el 3^5 from 500 ft upstream to 500 ft downstream from
the axis of the dam. Beyond these points for a distance of about 5C0 ft
the river channel was filled to el 3^5 with the same material but the
material was not compacted. The tee drain across the river channel
was similar to that described above for the main embankment except that
it was placed on the compacted fill. A filter blanket of 2-1/2 ft
coarse gravel and 2-1/2 ft of sand was placed on the upstream face of
the fill directly beneath the tee drain as shown in section D-D, fig. 8.
A French drain of select rock with bottom at el 3^0 was placed in the
center of the river fill perpendicular to the toe drain to serve as an
outlet for the discharge from the tee drainage system. The French drain
discharges into the old channel of the river downstream from the dam.
12. Relatively shallow surface drainage ditches were constructed
in 19^5 along the downstream tee as shown on fig. 8, to drain isolated
low areas adjacent to the downstream toe of the dam in a direction down-
stream toward the old channel of the river. This was considered necessary
to permit water which otherwise would tend to pond in these areas to drain
readily into the old river channel downstream from the dam without having
to flow through the toe drainage system. It was believed that frequent
flooding of the toe drain with muddy water mipht eventually cause the
drain to become clogged.

15
PART III: HYDROSTATIC PRESSURE MEASURING DEVICES
13. As the top stratum from the right bank of the river channel
to sta 11+COB is relatively thin and underlain by silty and clean sands,
it was believed that a potentially dangerous seepage condition might
exist in this area. As the toe drain does not penetrate into the deep
sand and gravel aquifer, there also was some concern regarding the
development of excess hydrostatic pressure in the deepage strata, which
could result in an insufficient factor of safety with respect to uplift
along the downstream tee of the dam, and possible piping of foundation
sands through the channel fill into the tee drain. Therefore, a system
of piezometers and hydrostatic pressure cells was installed in the
pervious strata beneath the downstream tee of the dam to check the
actual hydrostatic pressures and their relation with reservoir pool
stages. Hydrostatic pressure cells also were installed in some of the
clayey strata underlying the dam, to permit the determination of the
state of consolidation during and after construction, as reported in
T.M. 3-398, Analysis of Settlement Data, Uappapello Dam, Missouri,
Waterways Experiment Station, Vicksburg, Miss., February 1955. Piezo-
meters also were installed within the embankment and underlying foun-
dation at sta 15-f05B to determine the pattern of seepage through and
beneath the dam.
Description and Location
Piezometers
Ik. The original piezometer installation consisted of seven 2-in.
piezometers along the downstream tee of the dam in the vicinity of the
old river channel and eighteen 1-in. piezometers in the embankment and
foundation of the dam at sta 15+05B. Seven more 2-in. piezometers, T-8
through T-lU, were installed along the downstream tee of the dam between
the stream channel and the right abutment after the 19^5 high water
period. It was considered advisable to measure the pressure along this
reach because of the thinness of the top stratum. Piezometers T-5 and
T-7 had been leaking and were replaced in 19^5. The location of all
piezcrceiers near the downstream toe of the dam is shown in plan on
fig. k and in profile on fig. 7- Pertinent installation data for these
piezometers are given in table 1; a view of some of the piezometers is
shewn en fig. 10. All of the 2-in. piezometers and 15 of the 1-in.
piezometers are still operating. Pertinent installation data concerning
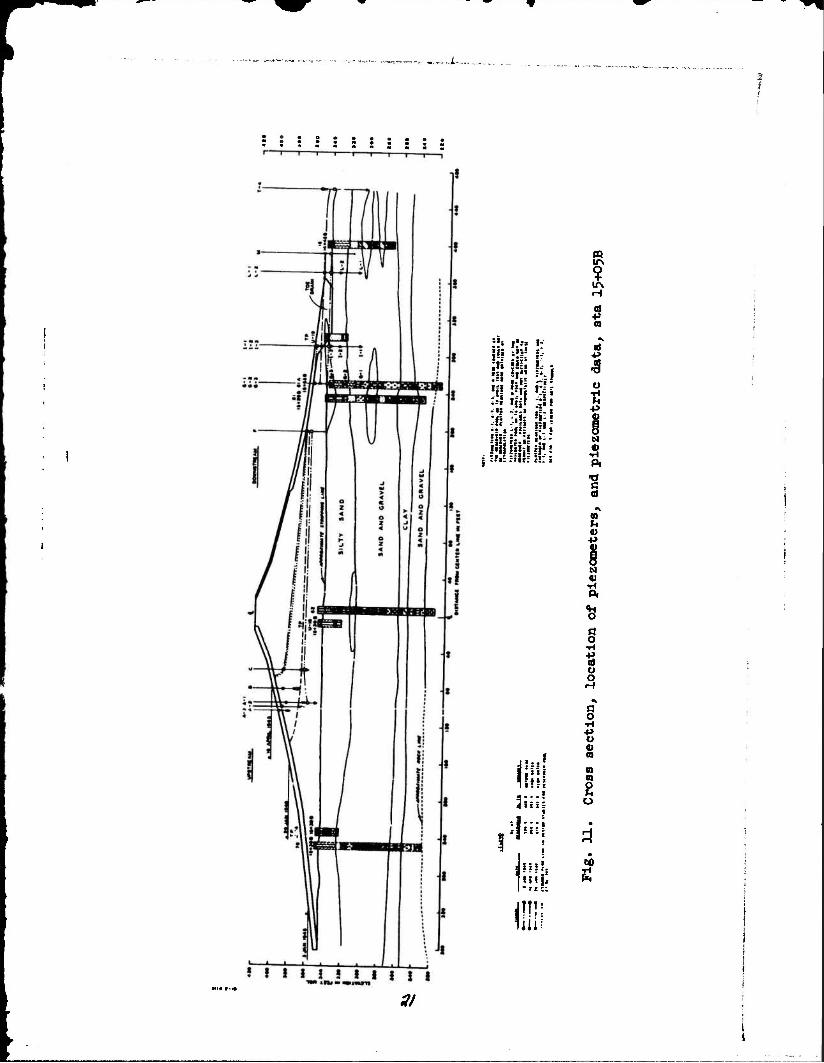
the 1-in. piezometers at sta 15+05B are given in table 2. A cross-
section of the darn at sta I5+O5B with the locations of these piezometers
is shewn on fig. 11.
Hydrostatic pressure cells
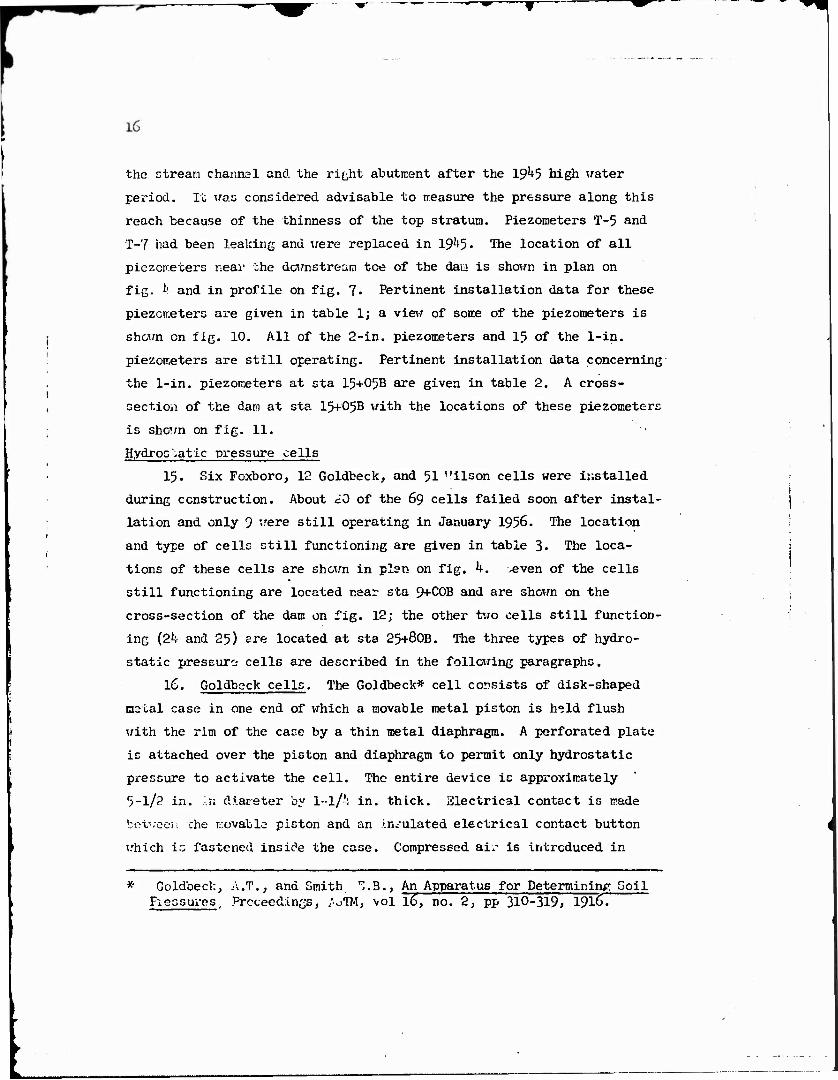
15. Six Foxboro, 12 Goldbeck, and 51 '.'ilson cells were installed
during construction. About c.0 of the 69 cells failed soon after instal-
lation and only 9 were still operating in January 1956. The location
and type of cells still functioning are given in table 3. The loca-
tions of these cells are shewn in plsn on fig. h. >even of the cells
still functioning are located near sta 9+COB and are shewn on the
cross-section of the dam on fig. 12; the other two cells still function-
ing (2k and 25) ere located at sta 25+80B. The three types of hydro-
static pressure- cells are described in the following paragraphs.
16. Goldbeck cells. The Goldbeck* cell consists of disk-shaped
nelal case in one end of which a movable metal piston is h«ld flush
with the rim of the case by a thin metal diaphragm. A perforated plate
is attached over the piston and diaphragm to permit only hydrostatic
pressure to activate the cell. The entire device is approximately
5-1/2 in. ..n diareter by l-l/1: in. thick. Electrical contact is made
between ehe movable piston and an insulated electrical contact button
which i^ fastened insie'e the case. Compressed air is introduced in
* Goldbeck, A.T., and Smith ^.3., An Apparatus for Determining Soil Pleasures, Proceedings, /-oTM, vol 16, no. 2, pp 310-319, 1916.

■»»»««»«(Ml»««?«-« to wMnmimi
Table 1
Location of Piezometers AIOHK Downstream Tc2 of Dam
Distance from Elevation Piezometer Station Center Line Center of Screen
ft rr.Gl
T-l 16+03B U83 303.7
T-2 17+03B 482 301.0
T-3 16+26B 521 273.9
T-U 15+03B 459 302.9
T-5 ih+OkB ^72 277.2
T-6 18+12B kl9 272.1
T-7 19+05B U8C 273.2'-
T-8 9+68B U75 325.7
T-9 11+05B U75 33C 9
T-10 13+05B ^75 330. ü
T-ll 9+68B 480 312.2
T-12 11+05B U85 3C9.5
T-13 13+05B 1*80 312.7
1-lk 11+05B U80 278.9
NOT": Piezometers consist of 2-in. riser pipe t/ith a
2-in. irellpoint screen at lever end. Length
and t\;e of wellpoint screen are not known.
11

Table 2
Location of Piezometers at Sta 15+05B
Distance from Elevation Piezometer Center Line Center of Screen Type
ft mGl
A-l 100 US 350.0 A
A-2 100 US 364.8 A
A-3 ICO US 379.9 A
B 80 US 369.9* E
C 60 US 360.9* B
F 2C0 DS 3^6.0* B
G-l 250 DS 307.2 A
G-2 250 DS 325.4 A
G-3 250 DS 339.8 A
1-1 290 DS 307.8 A
1-2 290 DS 329.9 A
1-3 290 DS 3^0.2 A
L-l 370 DS 310.1 A
L-2 370 DS 329-9 A
M 390 DS 320.0* B
* Indicates bottom of perforated section.
NOTE: Type A piezometers consist of 1-in. riser pipe
with a 6-in. long tip -:ade of No. 65 brass screen
with l/8-in, holes drilled in the screen on 1-in.
centers. The tip was placed in a 6-in. hole and
surrounded by soarse sand from the bottom of the
tip to 2 ft above the bottom of the tip.
Type B piezometers consist of 1-in. pipe perforated
throughout its length. The size and number of
perforations are not known.
1%

Table 3
Locat: ion of Hydrostatic Pressure Cells
Cell Station Distance 1'rom Center Line
ft Elevation Type Cell
3 8-r05B 250 upstream 3H.3 Goldbeck
7 10+50B center line 28k.9 Foxboro
8 10+50B center line 304.5 Foxboro
9 10+50B center line 327.9 Foxboro
10 9+COB 250 downstream 280.9 Foxboro
11 9+COB 250 downstream 305.0 Foxboro
12 9+00B 250 downstream 333.4 Foxboro
2k 25+80B 390 upstream 300.2 Goldbeck
25 25+80B 39O upstream 3'9.9 Goldbeck
n

Fig. 10. View of piezometers along downstream toe of dam
40
...a- .....
is? .71
S :n iu Hi:
tl:t
si ...» »4i
if»; f 5
ill!
3ii ilHE!
i!!?.
inn um
m irv
? IT» H
at
I +>
§ N 0 •H Pi
S 5
g •H
O o
§ ■rt
+> Ü 0> m
a «a
to
*y

o o o
L—-i I * I I -I I I I
19* iMw «iwlll
t!
!
!
I
III»
» • > -! 5 t - 3
u
f sit 1 ^ ***
<•«
! ««21151111«!
1 aS
■P
0) o
i m a s p.
15 01
I O
c o •H
IS o o H
§ G O ■H
4) a
a>
2
23
the cell to equal the external pressure acting on the piston and
pressure-sensitive diaphragm of the cell. Two pipes extend frcin the
cell to the surface, one conveying compressed air to the cell, the
other protecting an insulated wire connected to a milliammeter at the
surface. The diaphragm deflects and the electric circuit is broken
when the induced compressed air equals the external hydrostatic pressure.
When the open circuit is observed on the milliarcrceter, the air pressure
is noted and is assumed to be equal to the hydrostatic pressure at the
gauge (acting on the cell).
17. Wilson cells. The Wilson* cell is similar in appearance and
operation to the Goldbeck cell except that an air escape valve is substi-
tuted for the electric circuit breaker and an exhaust pipe is used in-
stead of the insulated wire of the Goldbeck cell. Compressed air is
introduced into the cell to equal the external hydrostatic pressure.
When the pressure inside the ceJl equals the hydrostatic pressure, it
opens the valve which permits the compressed air to enter the exhaust
pipe and leak under constant pressure into a bottle of water. A gauge
on the compressed air line is read when air bubbles are first detected
in the bottle.
18. Foxboro cells. The Foxboro** cell records directly the hydro-
static pressure acting on the cell. The device consists of a iretal box
approximately h-Z/k in. by 2 in., divided into two parts by a pressure-
sensitive diaphragm. The bottom portion of the box is perforated which
permits a hydrostatic head to act on the uiaphrarm and compress the
air in the upper protion of the box, rhich is connected by tubing to
a pressure gauge. The pressure inside the cell is read from the gauge
and is assumed equal to the external hydrostatic pressure actir.j en
the cell.
* Ccrps of Engineers, Memphis District, Instructions for Calibration and Use of Wilson Type la^th and Hydrostatic Pressure Cells, i:eraplii£ Term., 29 May 1939.
** The Foxboro Company, Liquid Level Instruments, Bulletin Ho. 352.

2k
PART IV: OBSERVATIONS AND ANALYSIS OF DATA
Schedule for Readings
19. The various hydrostatic pressure measuring devices were
observed according to the schedule given belcw. Observations were
made frequently until September 19^3 at which time the schedule was
changed to permit less frequent observations.
Dates
19^1
to
19^3
Device
Piezometers, downstream toe
Piezometers, sta 15+05B
Pressure cells
Frequency of Observations
semiweekly
weekly
weekly
Reservoir Stage Normal
Sept I9U3 Piezometers, downstream tee
to Piezometers, sta 15+05B
Jan 1957 Pressure cells
bimonthly
semiannually
semiannually
High
daily
daily
daily
The above schedule of observations generally has remained unchanged
since 19^3• However, between September 19^3 and July 19*A the high
reservoir stage at which daily observations were begun was taken as
el 368. In July 19^ this elevation was changed from el 368 to el 375.
Piezometers at Downstream Tee
20. The piezciTüters installed at the downstream tee at approxi-
mately the same elevation and in the same kind of material have been
grouped together for the purpose of plotting the piezometer readings
and the corresponding reservoir pool stages vs time. The average
readings of these piezometer groups are plotted vs time on figs. 13 and
lU. Locations of these piezometers are shown in profile on fi^. 7.

.:- %&~&*G.rV%l33Mt *,-*
* A«t AM m 3 A
^JSLL--4J i|
J, 1
1 ° 1 *
J f :•
1 8 -«C < .. «i
J '' f 'I J5 5 J ::
j i ~»
1 ^5? j!
(Ill
\ \ b I v^ i i 1 i_
'
L- -»•
/ > J . - J
( 4 . _ * ^, ) - <i
•
( • \ 1
4 * "-S 5
) i -.s S
a
r-
r
«* % /
"
i.Ir
_ * £ y j
1 ^^ **
-*
/ t j >J
^— J
Z > / )
3
ON H
ft
o -p
•p to
5 u a) § a
■p
o a> •H P.
<H
a) +>
60 ■H
■»<» uu m «"mm
a?

7 i ° \ f I °
> / m
( < / -»5
->5
<
1
s
si 4
a
1 t t
o 1 z 1 o
* •» / < 1 ;
-"•3 •
• / " J ' ^ ft
4 ^ ■•:,} a
^ 4 i ;
< * < o
z o
k' J 4
""•5 4
is i a 4
1 1» 4 a
> o
s I j X
t! / : « * > •
4 5 / i ~"*2
^^ J *» ■ a
4
a k
—■: !V ^ 1 ' o
-^ 1 /
e m
- 4
" -I •
/ -» • \ / m a
«^* >> '"> ) _ a
■c. =^ 'JKL t
S s
til!
vo IT» o\ I
o
s
■p (0
§
s -p
N 0> •H P.
1 as
60 •H
ion Uli Ni «oiinni
u

27
Cne group, T-3, -5, -6, -7, and -]A, lies in the deep sand at about
el 27U. Another group, T-l, -2, and -k, is in the sand and gravel
strata beneath the old channel at about el 304. The third group,
T-ll, -12, -13, lies in the shallower sand and gravel between the old
channel and the right abutment at about el 311. The fourth group,
T-8 through -10, lies in the silty sand beneath the top stratum
between the old channel and the right abutinent at about el 329, just
above the third group.
21. It may be seen from figs. 13 and 14 that the average readings
of piezometers in a given stratum reflect changes in the reservoir, the
piezometers in deep sand and gravel strata being more sensitive to the
rise and fall of the reservoir than the shallow piezometers. There is
close agreement between average readings of piezometers T-ll through
-13, located in the upper sand strata, and piezometers T-8 through
-10 located directly above the upper sand strata.
22. Readings for typical piezometers installed in the sand and
gravel strata at about el 272 and 303 and at el 330 in the silty sand
stratum are plotted vs reservoir pool stage on fig. 15 for years in
which the reservoir pool stage was relatively high. The sequency of
readings also is shewn on fig. 15 and it can be noted that at high
reservoir pool stages the readings at a given pool elevation gener-
ally are higher for a falling reservoir stage than for an increasing
stage. The relationship between piezometer readings and reservoir
pool stage is fairly consistent during Lhe periods for which data are
shown, indicating that the effective source of seepage entry was rela-
tively constant.
23. Piezometric profiles along the downstream tee of the dam are
shown on fig. 7 for pertinent maximum reservoir stages and for rising
and falling pool stages. This figure shews that the piezometers witii
tips at about the same elevation read approximately the same on a
given date. During the high reservoir stage in 19^5 the excess

o o
■»fc
1
p
4 • • <
s " u o
> o öS JO
4 ^ -* m • • .4 Ja
• S
I
4 a
• 4 ■ ^
— __
•
5:
4
v 5J "J » - s
I
*7f Bjvjuns ounotn jo 7»-"'
! •*is
-O-i-
33VJUIK OtmOUS JO 13
J I u /w*w joi HOJ jjimo JO irojj.09 y
a o
!
V
rH O o Pi
U ■H O
e (0 > m u -p
a E
i o 7 r- 4
jjrjuns t mom JO tf 9AV-.
1 1 »■ss
c " "
< *«•• s ■
-
i I
4)
L
O O
*/rva JOI «oty iSiino JO mux
1 1 i ~s
o ■ ••>■>. *n #| n
ION li Nl H TOOd blOAtfKM
N V
■H Oi
3 •H
s -p
Vi o ID
«J
to
it

29
hydrostatic head in the de«jp sand and gravel below el 280 was approxi-
mately 25 ft or about 50 per cent of the net head on the dam. The
excess hydrostatic head in the upper sand and .yavel stratum was
considerably lower, ranging from 1 to 3 ft. Piezometer-; installed
after the I9U5 high pool stages in the silty sand stratum underlying
the top stratum indicated that the hydrostatic head in the silty sand
stratum is essentially the same as that existing in the underlying
upper sand and gravel stratum. The bottom of the downstream tee
drainage system extends into the silty sand stratum between the river
channel and right abutment. Consequently it appears that significant
pressure relief is provided by the toe drainage system.
2k. The effectiveness of the tee drain is further illustrated
by the variation in hydrostatic head with depth, as shewn on fig. 16.
Readings of piezometers T-9, -12, and -lk for three reservoir stages
are plotted on fig. 16. These piezometers are at sta 11+05B but at
different elevations. It may be seen that there is a large drop in
pressure between T-lk, located in the deep sand and gravel, and T-12,
located in the upper sand and gravel stratum. There ie little |
difference in press 're between T-12 and T-9 which is located in the
silty sand stratum overlying the upper sand and gravel. Also sh- »*n I
on fig. 16 is the esti ated pressure in the foundation strata with
the reservoir pcol at el 410. The estimated pressure was based on
extrapolation of data shown on fig. 15 for piezometers in the caire
strata as those shewn on fig. 16. On the basis of data shown on
fig. 16, little excess hydrostatic head will exist in the upper pervious
strata for reservoir stages as hißh as el 4l0. Therefore, it is con-
sidered that the top stratum along the downstream tee is safe against
failure due to uplift for the maximum reservoir pool.
25. During an inspection trip in July 1955 it was noted that
piezometer T-3 was flowing. It was pointed out that this was un-
desirable, as the readings obviously would be affected and continuous

340 350 360 370
PIEZOMETER READINGS IN FEET MCL
360 300
Fig. l6. Hydrostatic pressure near downstream toe of dam vs depth, sta U+05B
JO

31
flow might also be conducive to more rapid corrosion of the piezometer.
It was also noted that piezometer T-5 had a leaking discharge valvo;
the discharge past the closed valve was almost the same as when it was
open. Leakage of this discharge valve probably accounts for the fact
that piezoreter T-5 shortly before 1955 read generally lower than other
piezometers installed in the same stratum. Questionable reading? of
piezometer T-5 were not used in pertinent analyses in this report. All
other piezometers appeared to be leakproof and operating satisfactorily.
26. Upward hydraulic gradients. Upward hydraulic gradients were
computed from the readings of piezometers along the downstream tee of
the dam made during 19^5 and 19^9. The computed gradients are plotted
vs reservoir pool elevation on tig. 17. Gradients were computed from
the bottom of the clay stratum at el 280 to ground surface using an
average excess hydrostatic head based on piezometers in the lower sand
and gravel stratum (T-3, -5> -6, and -7). Gradients also were computed
from the bottom of the river channel to ground surface, using average
excess hydrostatic pressures from piezometers T-l, -2, and -k. Gradi-
ents from the bottom of the clay stratum at el 280 to ground surface
during the 19'+5 high water pericd ranged from about 0.31 to O.38 as
shewn on fig. 17. These gradients will be about 0.U5 at the maximum
reservoir pool and indicate that the pressures probably are not high
enough to cause any uplift or blow-out. Gradients from the bottom of
the channel f>.ll to ground surface ranged from 0.02 to 0.06 in 19^5 and
probably will be about 0.07 at the maximum reservoir pool.
27. Piezometers T-l through T-7 were installed primarily to
observe the upward hydraulic gradient into the filled river channel.
The channel is underlain by fine sand. If the hydraulic gradient
through the fine sand should approach the critical gradient (-»oout 0.9)
it was originally thought the sand might pipe into voids in the channel
fill. Gradients immediately beneath the channel fill were computed
assuming that the excess hydrostatic head indicated by piezometers T-l,

<%

-,a—
33
-2, and -k was dissipated between the piezometer tips and the bottom of
the channel fill. The upward hydraulic gradients computed in th?.s
manner are shown for various reservoir pool stages on fig. 17. In 19^5
the gradients ranged from about 0.16 to 0.36. With the reservoir at
maximum pool tr .s gradient will be about 0.42, indicating the piping
into the channej. fill is unlikely. Furthermore, the channel fill
material is believed to be relatively impervious, consisting of rod;
and clay, which would lessen further the possibility of piping. That
the fill is relatively impervious is confirmed by the fact that pools
of rainwater l-l/2 ft above the level of the tailwater have been
observed standing in the old channel near the tee of the dam during
pericls of high water. Gradients were computed also from the bottom
of the clay stratum at el 280 to the bottom of the channel fill as
shown on fig. 17. The computed gradient for maximum reservoir pool
stage will be about 0.84. However, there is little livelihood of
dangerous piping under this gradient, because it is believed the clay
stratum is continuous between el 280 and about 300, The dam safely
withstood a hi.'.h water stage of el 399 (4 ft above spillway crest)
creating a gradient of 0.75.
28. The most critical area for piezometers installed after the
high reservoir period in 19^5 (T-8 through T-lk) would appear to be
at piezometer T-10 at sta 13+05B where there is only about 3 ft of top
stratum. Available data since the high pool stage in 19^5 are not
sufficient to permit an estimate of the reading of piezometer T-10 and
corresponding gradient for a reservoir stage of 4l0. However, as read-
ings of this piezometer vary little with reservoir pool and generally
are about 2 ft below the ground surface (fig. 15), it is probable that
little to no excess head will develop at this piezometer.

3h
Piezometers at Sta 15+0 5B
29. The locations of piezometers and seepage observation wells at
sta 15+O5B are shewn on fig. 11. Readings of piezotceters at sta 15+05B
are plotted chronologically with corresponding reservoir stages on
figs. 18 and 19. Available tailwater data are shown on fig. 18; suffi-
cient data are not available to permit plotting a continuous record of
ti-ilwater elevations on this figure. Generally, the readings of piezo-
meters A-l, -2, -3, B and C were higher than the reservoir pool and
therefore a continuous plot for these piezometers is not shewn on fig.
l8. The fact that the readings of these piezometers generally are
higher than the reservoir pool during low pool stages is attributed |
to the piezometers possibly being affected by capillary moisture, ;
rainfall, and other factors. The readings of piezometer F also cay i
be affected by surface runoff through the riprap on the downstream
slope of the dam as the screen of this piezometer extends up through
the riprap. Generally, the piezometer levels rose and fell with corre- !
sponding reservoir .stages when the reservoir pool was about the tip of
the piezometer; readings for the 19^5 and 19^9 high water periods and
for the low water period prior to the rise of 19^5 also are sham on
fig. 11. Available piezometric data are not sufficient to estimate
the distance to the effective source and exit of seepage. The A
and B piezometers on the upstream side of the dam generally were
submerged during the hirh water period and readings were not made.
However, seme readings of the A and B piezometers were obtained
at high pool stages in 19^5 before these piezometers became submerged.
Readings for piezometers in each of the G, I, and L groups were approxi-
mately the same for each piezometer in the group for any given date.
The line of seepage within the embankment for each of the above dates
as approximated from the piezometer readings is shown on fi{ 11.
These lines of seepage are considered only approximate because many

s s s o o e o o o »- • * f X M *• n •» #* M «•
1 |
Ü£ 9 i 1-;
J
^1 •
O
[ • J *
■• f i
I [ S i ' * >
1
:7 I * •
a
==* «=>^—l 1—i ■»
a U - ; 7 i • '
im i •. ■
"=1M'^-i "1 i ;—1—!—i1—
■f _4-5 g }|fS!| I»
i IJl l!M:...f
•0
o e o o e «
e < « » i
O • A
• •
•
\. to
•
• •
• •
•
•
i
• '
• •
• •
• »
• '"
i «y **
i
1
« 4
1
• •
1
|
i
—« —
2
3 f
— •—
——• 5 « *
s ■ •
«
• 2
—I—
0 *
•
• 2
— i—
0 *
*■
• 3
» I
• t
« 2
m
CO
u +>
0)
o + irv
at -P to
« CO
U 4> -P
§ M a>
■H p.
I *
60 -H
o e
19H UM Ni HOUWRJII
35-

i
1
ID u -p
I V •H Pi
R
H as
+> (0
a u
41 ■H P.
at
ON
■H

37
of the piezometers at sta 15+O5B appear to be affected somewhat by rain-
fall and other factors. Also shown for comparison is the uppermost flow
line (phreatic line) for the reservoir pool at el 395 assumed for design
purposes. The line of seepage through the embankment could not be
traced to the downstream toe beyond piezometer F; however, it appears tha
that the seepage may pass into the riprap on the lower face of the dam
and thence into the toe drain. As no emergence of seepage was observed
on the downstream face of the dam during the high water period of 19^5>
the dam is believed safe with respect to uncontrolled emergence of
seepage through the embankment. It is considered that continuation of
the observations of piezometers at sta I5+05B would not provide ad-
ditional data of consequence and that future observationj are not
warranted.
Hydrostatic Pressure Cells
30. Readings of those hydrostatic pressure cells still function-
ing are plotted chronologically with reservoir stages on fig. 20. Data
from cells 2h and 25, which appear to be giving consistent readings,
are not shewn on fig. 20, as they are located near the upstream toe of
the dam and are not pertinent to the problem of underseepage. It may
be noted from fig. 20 that the readings of cells 7 and 10 have decreased
with time to such extent that it is doubtful if the cells still are
functioning properly. Hydrostatic pressure cell readings for the I9U5
and I9U9 high water periods and for the low water prior to the rise of
19^5 are shewn on fig. 12. It may be noted that the majority of the
cells are located in relatively impervious soil strata and accordingly
would not be expected to reflect quickly the excess hydrostatic
pressures in the sand foundation due to high reservoir stages. As the
cells still functioning are mainly those installed to determine foun-
dation pore pressures caused by consolidation, they offer little

IrJI - 4*4 £ o)in "I S S8S 58?
hülll i *- m m m »- *■ t- Ita. UHU U. k. Ih
#> w w * <• * *
I »äs pip- • O O O • * '
2S»?g*£ S 888 882 J S M 1 M M X Q O O O O O O
| "A 0
3 ■ < 3 P •> •
3 O t N 1 n
o o
• 4
! i 1 1
•
• 4 i
i
1 1 ! ; |
|
• 4
| I ! *
Mil' •
•
4
4
1 1 ! • : M !• i ' !
• 4
i *
| 1 i •
• 4 1 ■
j ;
1
•
• 4
! j
jc ' t K i ia # 3
l c ] : a •
-•—
•
4
—4-
4
i £ i
: 1 |
i i 1 i
1 j
-i—
i
$
• 4
7 ' i
i i
—I—K ! 1
« :
f- B a -s f!
) ' i ! / j l
1 ^v ^. i j 1 i {
1 j
1 1 ! j i i '
i i 1 i
i i
19»« -L33J Nl NOI1VA3H3
1—1—r
H—h
^~\
B
fcj.r
(0
a» o
CO m 8 ft
-p •p CO o
Ä S o u
a)
O
60 •H
J?

39
pertinent data from the standpoint of underseepage. Foundation con-
ditions at sta 9+00B a**e complex and no attempt was made to evaluate
the significance of the observed hydrostatic heads as measured by the
pressure cells. As settlement observations indicate that the dam
foundation is completely consolidated as of this date (1957) there j
appears to be no need for further observations on the hydrostatic
pressure cells. ! !
Seepage Measurements ]
f
31. The amount of seepage intercepted by the toe drainage system j
was measured at the end of the French drain, which discharges down-
stream from the tee of the dam in the river channel. A sand bag dike
was constructed at the end of the drain, a pipe was placed in the dike
and the amount of water discharging through the pipe was measured.
Seepage measurements were made during the lajt part of 1941 and early
part of 19^2 when the reservoir pool varied from el 355 to 360. The
observed flows ranged from 36 to 227 6Pm. Seven seepage measurements
were made during the period 7-22 Karch 19^5 when the elevation of the
reservoir varied frcm 38h to 388 and was rising. The measured seepage
varied from about 230 to 390 gpm. The elevation of the water in the
area inclosed by the sand bag dike was not determined at the time of
the seepage measurements; however, it is estimated that this water
was at about R! 3^0.
32. A plot of seepage discharge vs reservoir pool elevation is
shown on fig. 21. The seepage measurements vary so much for such a
small range in reservoir elevation that they cc-n be related only
approximately to reservoir pool elevation. On the basis of fig. 21 it
appears that seepage beneath the dam is equivalent to approximately
6.5 gpm per foot of net head above tailA/ater (el 3^0 +). It is
believed that most of this seepage enters the tee drainage system along
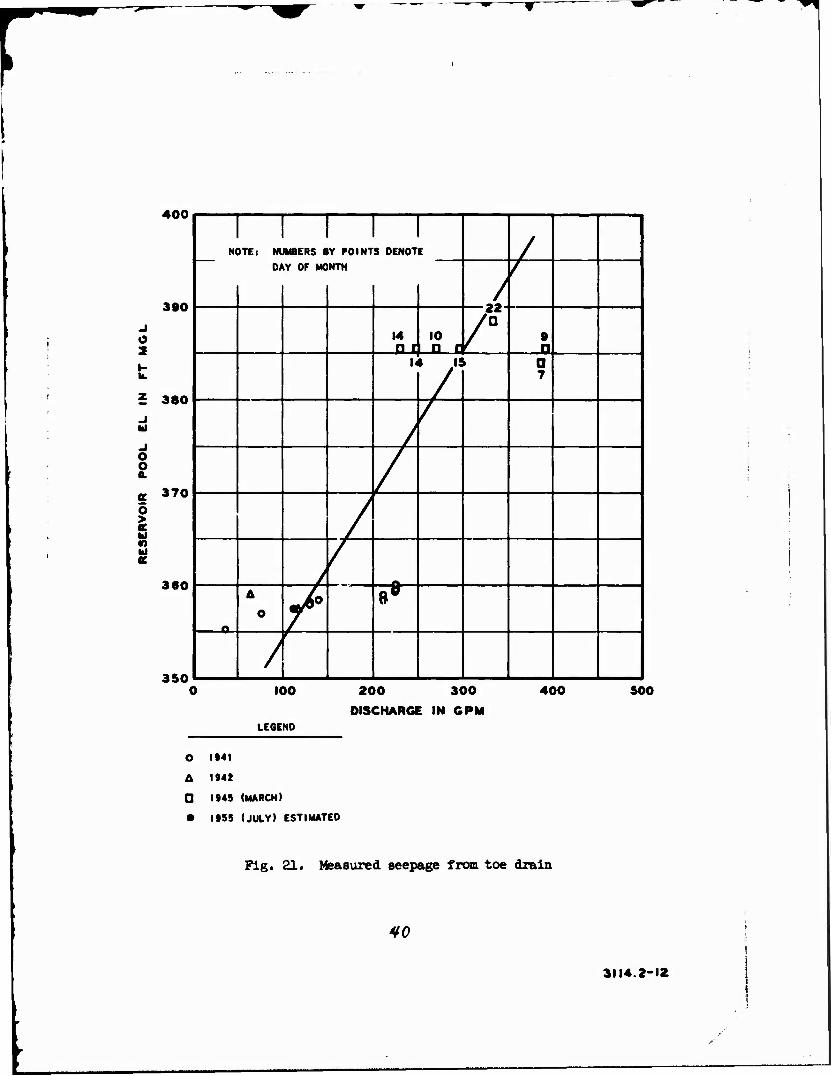
400
300
O 2
± 380 -l w
i o a.
370 O > K HI •) Id ae
300
350
1 1 1 1 1 NOTE: NUMBERS BY POINTS DENOTE /
DJ kY OF MO NTH
/ '
14 10 □ IOC /° •
a U 1 IS 1 a
7
n
A
O mA° »e
100
LEGEND
200 300
DISCHARGE IN GPM
O 1941
A 1941
0 IMS (MARCH)
• 1955 (JULY) ESTIMATED
400
Fig. 21. Measured seepage from toe drain
V0
500
3114.2-12

>■ •wwfut**mv*rr2W*i1tf'* 'H^*-T^
kl
the downstream toe of the dam between the right bank oi the river
channel (about sta 15-i-OOB) and the right abutment, as the tee drain
does not penetrate into pervious foundation strata left of the river
channel and the compacted fill in the river channel apparently is
relatively impervious. It is not possible to determine what percentage
of the total flow the observed seepage represents, in view of the
heterogeneity and complexity of the foundation conditions. The amount
of seepage is not considered excessive and, as it emerges in a con-
trolled manner, is not considered significant.
Adequacy of Toe Drainage System
33. In general, it appears that the tee drain is effective in
reducing excess hydrostatic pressures in the upper pervious foundation
scrata and in providing an outlet for controlled emergence of seepage
beneath the dam. It is believed therefore that the drain should re-
ceive whatever maintenance is necessary to insure its continued
effectiveness. In particular, every effort should be made to prevent
backflow of surface water into the toe drain which could cause clogging
and eventually reduce the efficiency of the drain. The durface drainage
ditches constructed for this purpose should continue to receive adequate
maintenance. However, even with the ditches in operating condition it
is possible for surface water to submerge the toe drainage system dur-
ing high river stages downstream from the dam. It is possible that
such water n»y in time have a deleterious effect on the performance of
the drain. This can be prevented by constructing a small impervious
dike having a crown at about el 350 and with a controlled outlet across
the old river channel downstream from the outlet of the French drain,
and by similar dikes across ditches "A" and "C," see fig. 8. As far
as can be ascertained from available data, the efficiency of the drain
has not changed since its construction. However, it is considered
k2
desirable to check the future performance of the drain to determine
whether submergence by tailwater will reduce the effectiveness of the
drain, and whether the above-mentioned dikes are necessary. There-
fore, it is considered that piezometric and seepage data should be
obtained in the future at periodic intervals.

^3
PART V: CCNCLUSIOMS AND RECOMMENDATIONS
Conclusions
3^. The conclusions listed below are believed warranted based on
the information obtained from this study.
35- The piezometers along the downstream toe of the dam appear to
be measuring accurately the hydrostatic pressures in the foundation at
the downstream toe of the dam. The computed average gradients frcm the
deep sands to ground surface and from the bottom of the fill in the old
rive- channel to ground surface have never exceeded O.38 and 0.C6,
respectively, although the reservoir has reached a stage of 399. It is
believed that these gradients will not exceed 0.^5 and 0.07, re-
spectively, with the reservoir at the maximum stage (el ^10). There
is no danger of the foundation sands piping into the fill in the old
river channel, because the average gradient from the tips of piezo-
meters immediately below the channel filling to the bottom of channel
filling has never exceeded about O.36, and probably will not exceed
0.1*2. Furthermore, the channel filling is relatively impervious. The
top stratum in the vicinity of sta 13+05B is very thin; however,
available piezometric data indicate that little to no excess head
will develop immediately beneath the top stratum with a reservoir rtage
of 410. The foundation downstream of the emoankment is considered safe
against uplift or blow-out. The fact that the dam has withstood
reservoir stages within 85 per cent of the maximum stage, with no
noticeable seepage or piping, it is believed to be cafe with respect
to piping with the reservoir pool at the maximum stage of el ^10.
36. leased on piezometric data at sta 15+05B it appears that
seepage through the dam passes into the riprap on the downstream face
of the dam and therxp into the tee drainage system. The piezometers
at sta 15+05B are not so located that the effective source of seepage
hk
entry or exit can be determined. Furthermore, readings of these piezo-
meters appear to be affected by rainfall and other factors and are con-
sidered to be of questionable value. Future reading of these piezo-
meters dees not appear warranted.
37. The Foxboro cells proved to be the most satisfactory of the
three types of hydrostatic pressure cells. All six Foxboro cells
originally installed are functioning, although it is believed that
cells 7 and 10 are no longer functioning properly. Three of the 12
Goldbeck cells are still operating, but none of the 51 Wilson cells is
operating. The cells still functioning are generally located in
relatively impervious materials and do not warrant continued observa-
tions.
Recommendations
38. It is recommended that:
a. Readings of all pressure cells and those piezometers in
the embankment and foundation at sta 15+O5B be discon-
tinued.
b. Readings be continued for all other piezometers along
the downstream toe of the dam to check on the continued
effectiveness of the tee drain. Piezometers should be
read at 10-ft intervals of rising reservoir stages above
conservation pool stage of 355; at the crest, and for
10-ft intervals of falling reservoir stage down to
conservation pool level.
c Valves on the piezometer riser pipes be checked periodi-
cally to insure that they do not leak.
d. Seepage frcm the French drain be measured when the reser-
voir crests appreciably above the conservation pool. The
elevation of the water in the area inclosed by the sand
bag dikes should be determined at the same time.

I 45
e. Maintenance of the surface drainage ditches along the
downstream tee of the dam be continued to prevent back-
flow of surface water into the toe drain.