adapting a mock circulatory loop for use in the study …
TRANSCRIPT
The Pennsylvania State University
The Graduate School
College of Engineering
ADAPTING A MOCK CIRCULATORY LOOP FOR USE IN
THE STUDY OF TISSUE ENGINEERED HEART VALVES
A Thesis in
Bioengineering
by
Marc C. Howell
2013 Marc C. Howell
Submitted in Partial Fulfillment
of the Requirements
for the Degree of
Master of Science
May 2013
The thesis of Marc C. Howell was reviewed and approved* by the following:
Keefe B. Manning
Associate Professor of Bioengineering
Thesis Advisor
William Hancock
Professor of Bioengineering
Cheng Dong
Distinguished Professor of Bioengineering
Head of the Department of Bioengineering
*Signatures are on file in the Graduate School
Margaret Slattery
Assistant Professor of Bioengineering

iii
ABSTRACT
A mock circulatory loop is a tool that has been used in research of many cardiac
therapies, such as ventricular assist devices and mechanical replacement valves. This equipment
mimics the conditions in the circulatory system and is used in conjunction with blood analogue
fluids that mimic the mechanical properties of blood, but allow for imaging and measurement of
the fluid flow in the system. Using mock circulatory loops in the development of tissue
engineering therapies is desirable, as it provides an environment very similar to the in vivo for
testing of tissue engineered heart valves, without requiring test animals and surgery.
The principle challenge in adapting a mock circulatory loop for tissue engineering use is
developing blood analogues to be used in the loop that allow for both imaging and valve construct
conditioning studies, while maintaining viability of the cells in the tissue engineered valve.
Traditional blood analogues, for example, an aqueous mixture of glycerol, xanthan gum, and
sodium iodide, do not support cell growth, so new fluids must be developed and tested.
Using cell culture media as a base, we have developed two new blood analogues for use
in mock circulatory loops. Both blood analogues have the viscous behavior of blood, but have
the optical and cell-enrichment properties required for short-term (up to 8 hours) imaging and
long-term (up to 4 weeks) conditioning of tissue engineered aortic valves. Coupled with our
specially-designed loop that allows for imaging of the aortic valve position, these fluids will
allow for fluid flow imaging around tissue-engineered valves and conditioning of these valves in
vitro.
Using these new blood analogues and the specially designed mock circulatory loop,
studies can be conducted to improve the design of tissue engineered aortic valves.
iv
TABLE OF CONTENTS
LIST OF FIGURES ................................................................................................................. v
LIST OF TABLES ................................................................................................................... viii
ACKNOWLEDGEMENTS ..................................................................................................... ix
Chapter 1 INTRODUCTION .................................................................................................. 1
1.1 Clinical Relevance ..................................................................................................... 1 1.2 Cardiovascular Anatomy ............................................................................................ 5
1.3 Tissue Engineered Heart Valves ................................................................................ 8
1.4 Mock Circulatory Loops ............................................................................................ 12
1.5 Mock Circulatory Loop Fluids ................................................................................... 16
1.6 Proposed Work ........................................................................................................... 17
1.6.1 TEHV/MCL Application 1: Fluid Flow Comparison ..................................... 17
1.6.2 TEHV/MCL Application 2: Bioreactor Construct Conditioning .................... 18
Chapter 2 MOCK CIRCULATORY LOOP DESIGN SPECIFICS ....................................... 20
Chapter 3 FLUID REQUIREMENTS .................................................................................... 25
Chapter 4 FLUID DEVELOPMENT ...................................................................................... 28
4.1 Initial Fluid Selection ................................................................................................. 28
4.2 Potential Additives ..................................................................................................... 29 4.3 Additive Effects ......................................................................................................... 32 4.4 Property Determination .............................................................................................. 34 4.5 Cell Toxicity Testing ................................................................................................. 36
Chapter 5 TEHV/MCL SYSTEM ........................................................................................... 57
5.1 Increasing Fluid Volume ............................................................................................ 57 5.2 Projected Studies ........................................................................................................ 58
5.2.1 Imaging Studies ............................................................................................... 58 5.2.2 Bioreactor Studies ........................................................................................... 61
Chapter 6 LIMITATIONS ...................................................................................................... 63
6.1 Temperature ............................................................................................................... 63
6.2 Gas Transfer ............................................................................................................... 64
Chapter 7 CONCLUSIONS .................................................................................................... 66
BIBLIOGRAPHY .................................................................................................................... 68

v
LIST OF FIGURES
Figure 1-1: Tricuspid (left) and Bicuspid (right) Aortic Valve. (source:
Surgery.ucla.edu).. ........................................................................................................... 2
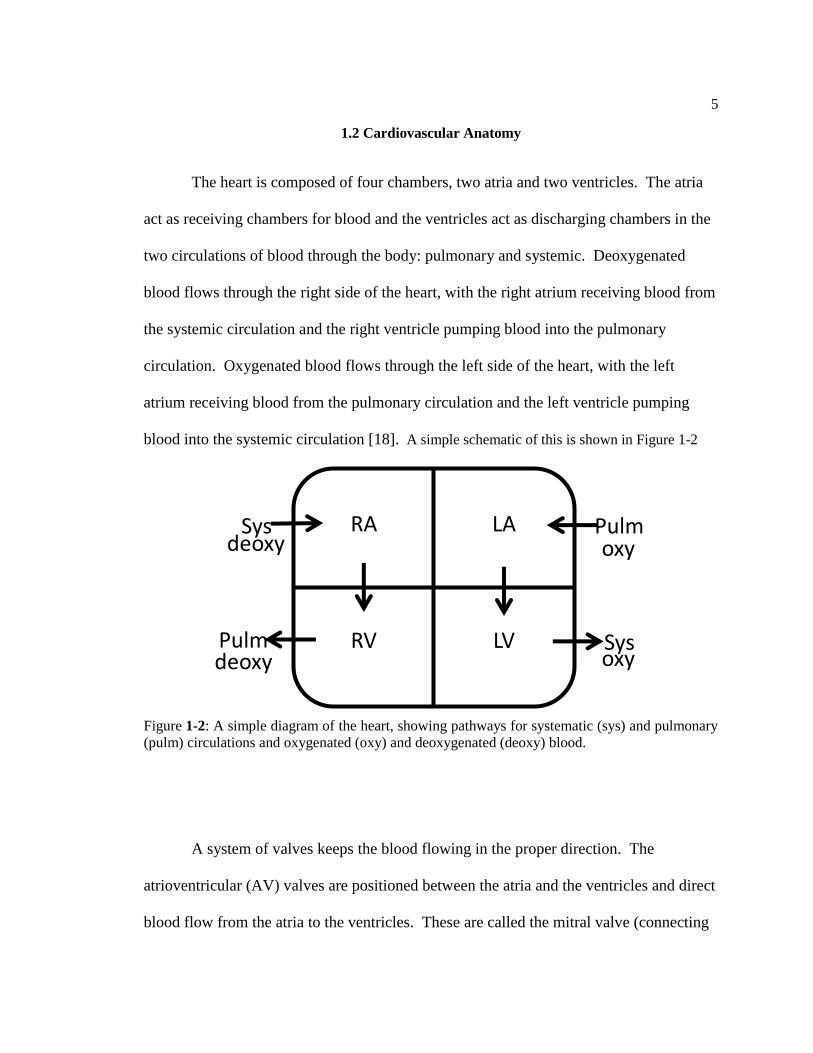
Figure 1-2: A simple diagram of the heart, showing pathways for systematic (sys) and
pulmonary (pulm) circulations and oxygenated (oxy) and deoxygenated (deoxy)
blood. ............................................................................................................................... 5
Figure 1-3: The heart with all valves and chambers labeled. The aortic valve is near the
middle (circled) (source: texasheartinstitute.org). ............................................................ 6
Figure 1-4: (A) The aortic valve. Note trileaflet structure. Misfield and Sievers, Phil.
Trans. R. Soc. B (2007) 362:1421-1436. (B) The aorta cut open showing three
leaflets (numbered).. ........................................................................................................ 7
Figure 1-5: (A)The Starr-Edwards valve, which is virtually unchanged since 1965. (B)
Hancock porcine valve. (C) Carpentier-Edwards pericardial valve. Source: Valvular
heart disease. In: Rahimtoola SH, ed. Atlas of Heart Disease. St Louis, Mo: CV
Mosby; 1997. ................................................................................................................... 8
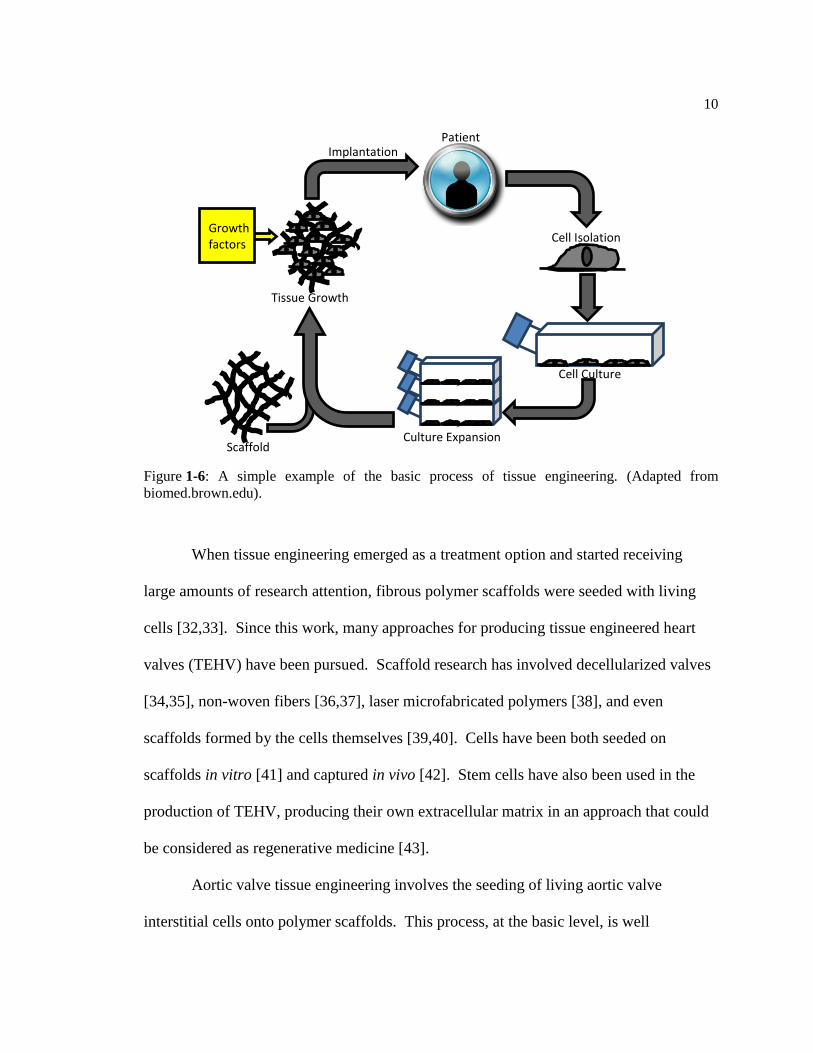
Figure 1-6: A simple example of the basic process of tissue engineering. (Adapted from
biomed.brown.edu)... ....................................................................................................... 10
Figure 1-7: Diamond-shaped PGS tissue engineering scaffold shown at 300x
magnification.. ................................................................................................................. 11
Figure 1-8: An example of a ventricular assist device often used as a pump in a mock
circulatory loop.. .............................................................................................................. 13
Figure 1-9: A standard compliance chamber. The cylinder has an inlet and an outlet for
fluid, and the compliance is controlled by the position of the metal bar.. ....................... 14
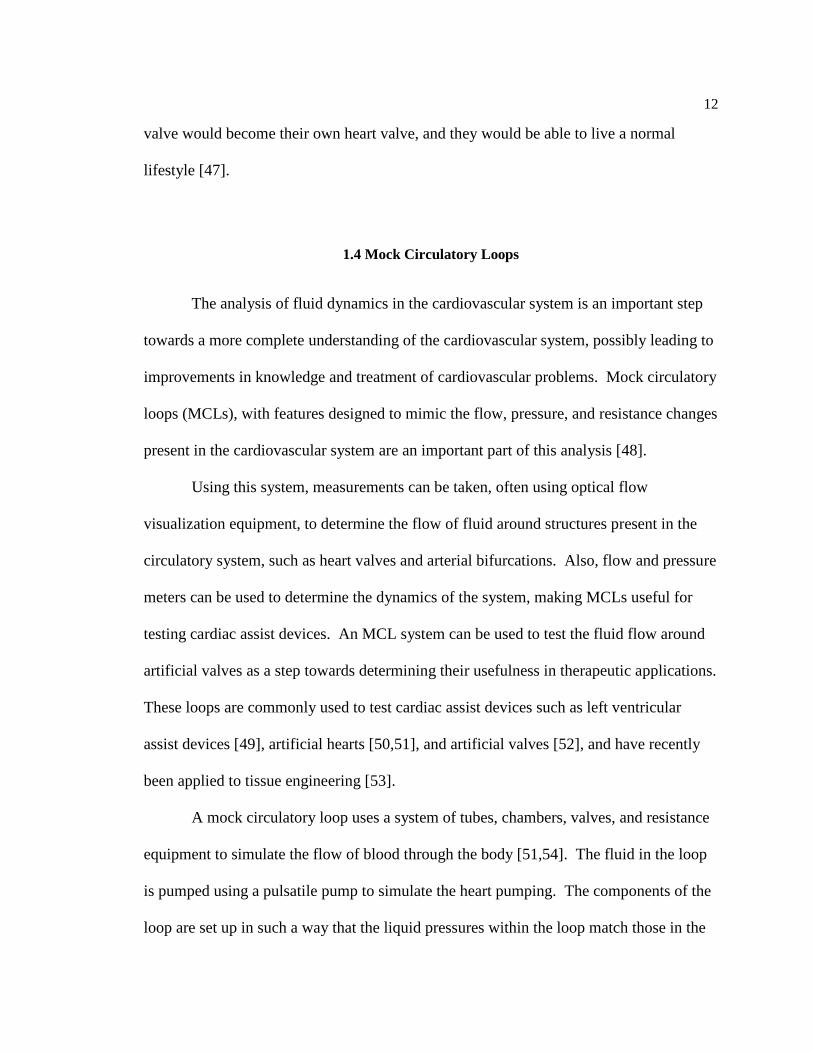
Figure 1-10: An example of a resistance plate for a mock circulatory loop. The plate
squeezes the tube that runs in on the left and out on the right, generating resistance
to flow.. ............................................................................................................................ 15
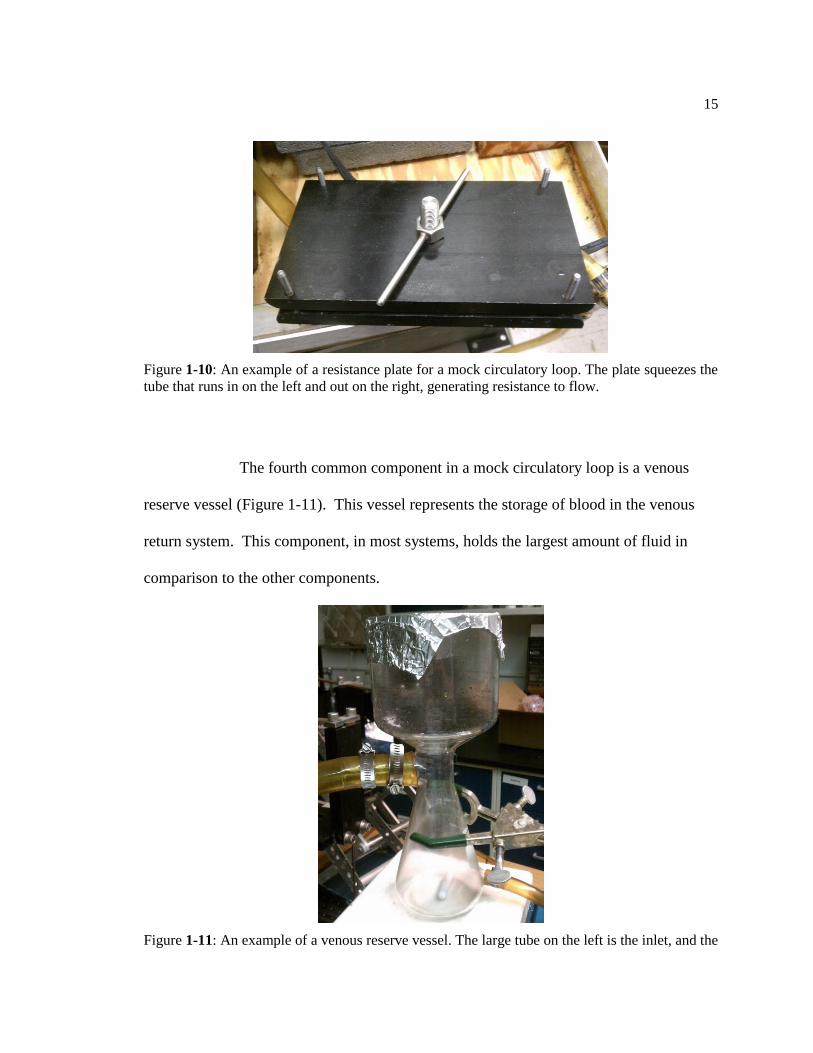
Figure 1-11: An example of a venous reserve vessel. The large tube on the left is the
inlet, and the small one on the right is the outlet.............................................................. 15
Figure 2-1: The loop setup, with tubes labeled. The chamber on the left is the aortic
compliance and the one on the right is venous compliance. (A) is the outlet from the
pump (after the valve chamber), (B) is the inlet to the pump, and (C) is the pressure
line to the compliance setup ............................................................................................. 20
vi
Figure 2-2: The atrial compliance setup. The air line from the compliance chamber (C in
Figure 2-1) runs into the flask at the point indicated. The pump holds pressure within
the flask while the clamp allows excess pressure to escape.. ........................................... 21
Figure 2-2: The atrial compliance setup. The air line from the compliance chamber (C in
Figure 2-1) runs into the flask at the point indicated. The pump holds pressure within
the flask while the clamp allows excess pressure to escape.. ........................................... 21
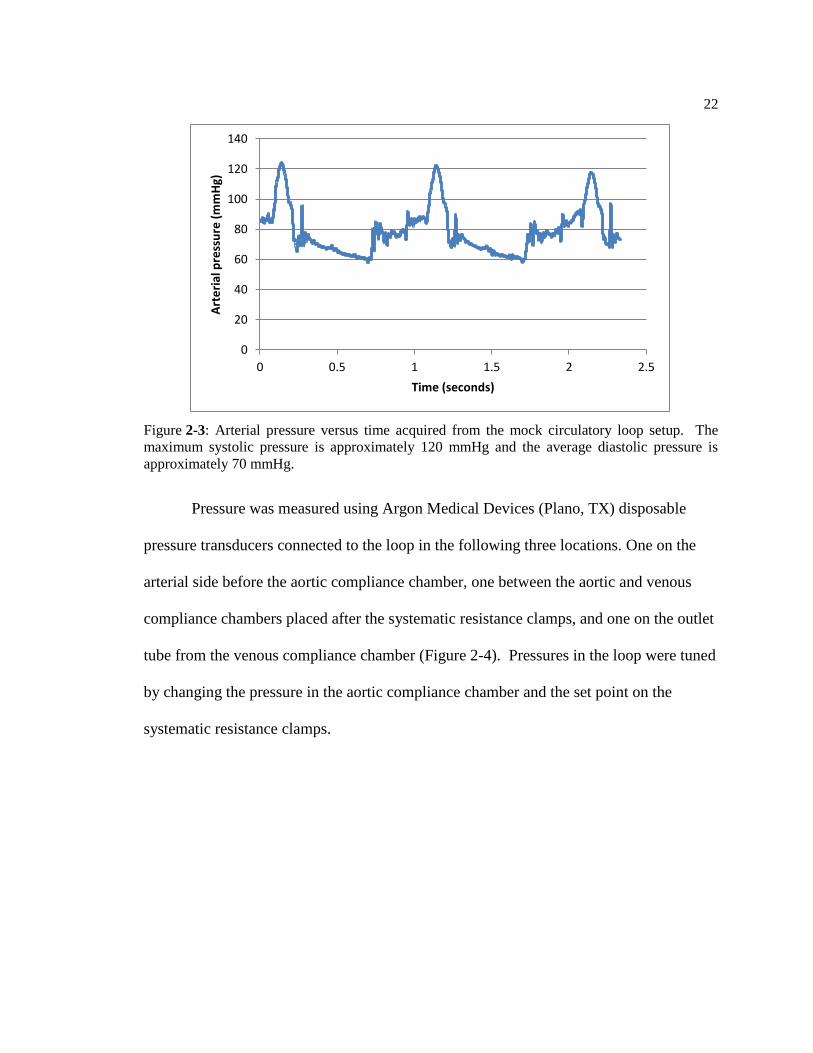
Figure 2-3: Pressure versus time acquired from the mock circulatory loop setup. The
maximum systolic pressure is approximately 120 mmHg and the average diastolic
pressure is approximately 70 mmHg. ............................................................................... 22
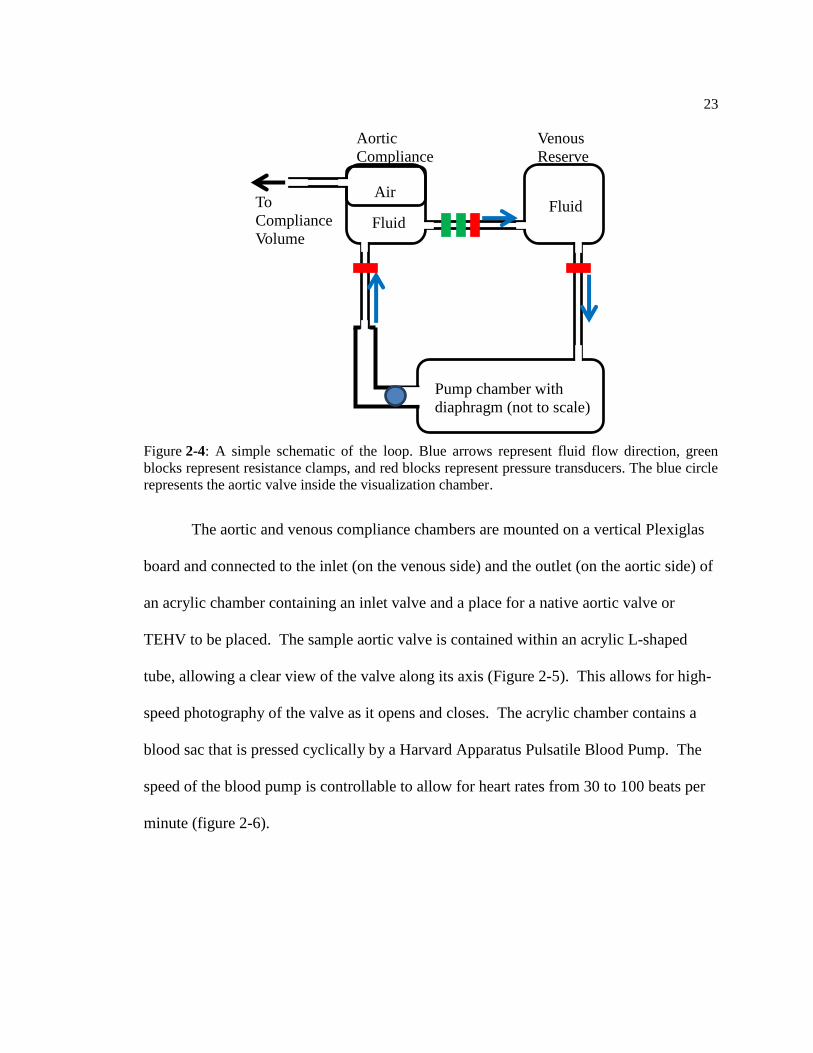
Figure 2-4: A simple schematic of the loop. Blue arrows represent fluid flow direction,
green blocks represent resistance clamps, and red blocks represent pressure
transducers. The blue circle represents the aortic valve inside the visualization
chamber. ........................................................................................................................... 23
Figure 2-5: Two views of the valve chamber and elbow. (A) the shape of the elbow with
the chamber on the left and an arrow indicating flow direction. (B) The view of the
valve from the end of the elbow for data collection. A caged ball valve is currently
installed for pressure testing............................................................................................. 24
Figure 2-6: The pump setup (without fluid). When full, the plate presses into the
diaphragm, forcing fluid out of the chamber.................................................................... 24
Figure 4-1: The viscometer setup. On the left is the temperature control, on the right is
the viscometer itself. Both are controlled by the computer. ............................................. 35
Figure 4-2: The refractometer setup. ....................................................................................... 35
Figure 4-3: A 24-well plate ready for cell toxicity testing. Cells in this plate were
isolated from the hearts of 3 different animals (labeled H1, H2, H3). For the test, the
top row will be control (medium 199, 10% FBS, 5% antibiotic-antimicotic) and each
lower row will be filled with one testing fluid. For each fluid and the control, there
are 6 wells, 2 from each heart. ......................................................................................... 37
Figure 4-4: (A) Dyanamic viscosity versus shear rate and (B) elasticity versus shear rate
curves for the bioreactor fluid referenced as BR F in Table 4-2. ..................................... 41
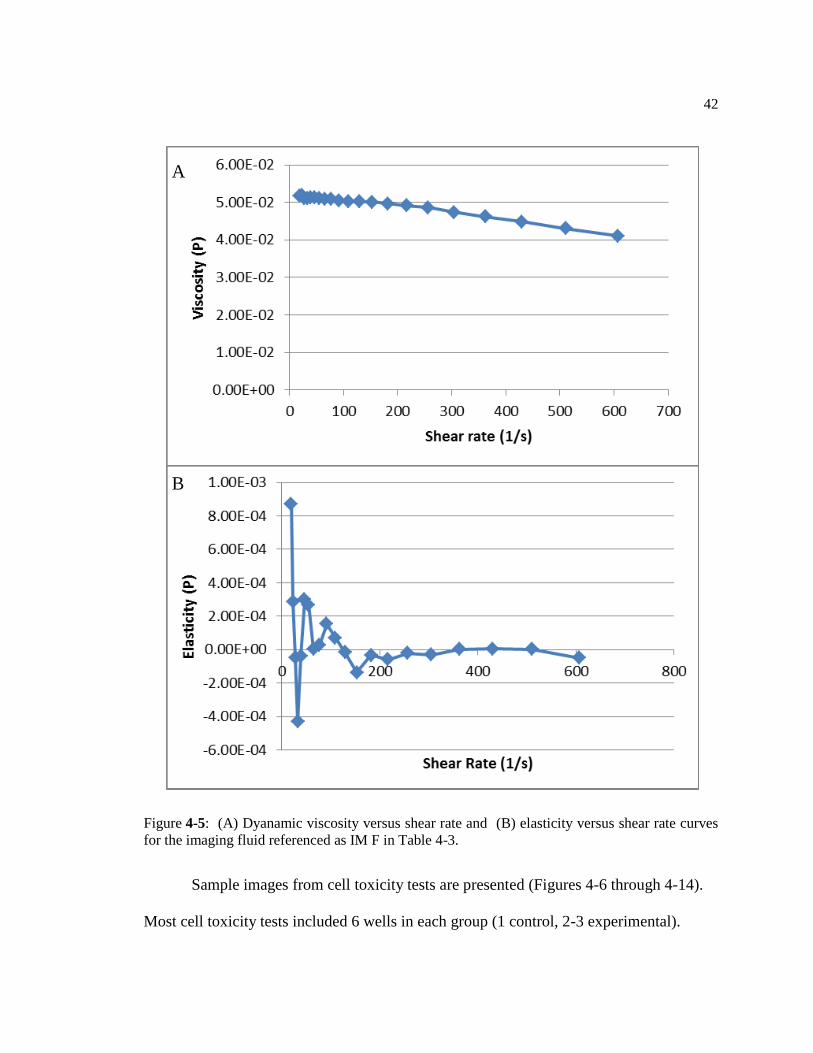
Figure 4-5: (A) Dyanamic viscosity versus shear rate and (B) elasticity versus shear rate
curves for the imaging fluid referenced as IM F in Table 4-3. ........................................ 42
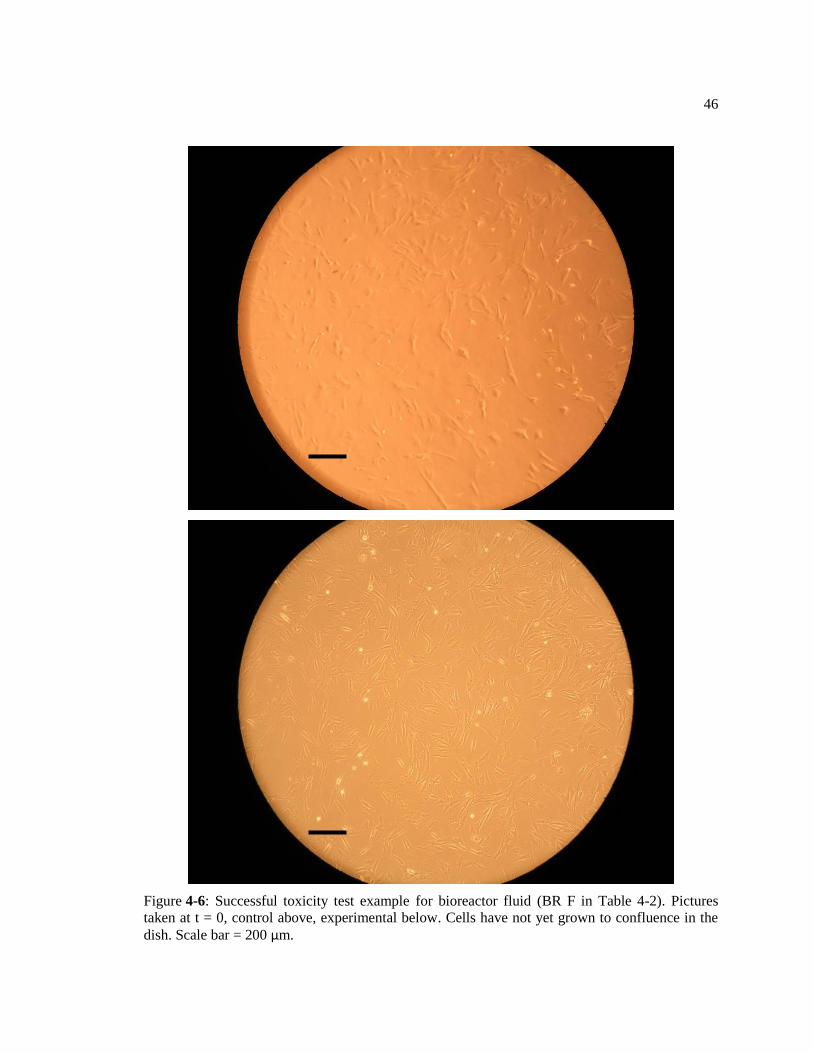
Figure 4-6: Successful toxicity test example for bioreactor fluid (BR F in Table 4-2).
Pictures taken at t = 0, control above, experimental below. Cells have not yet grown
to confluence in the dish. Scale bar = 200 μm. ................................................................ 46
Figure 4-7: Successful toxicity test example for bioreactor fluid (BR F in Table 4-2).
Pictures taken at t = 8 days, control above, experimental below. Notice cells are
confluent and elongated on the surface of the dish. Scale bar = 200 μm. ........................ 47
vii
Figure 4-8: Successful toxicity test example for bioreactor fluid (BR F in Table 4-2).
Pictures taken at t = 15 days, control above, experimental below. Notice cells are
confluent and elongated on the surface of the dish. Scale bar = 200 μm. ........................ 48
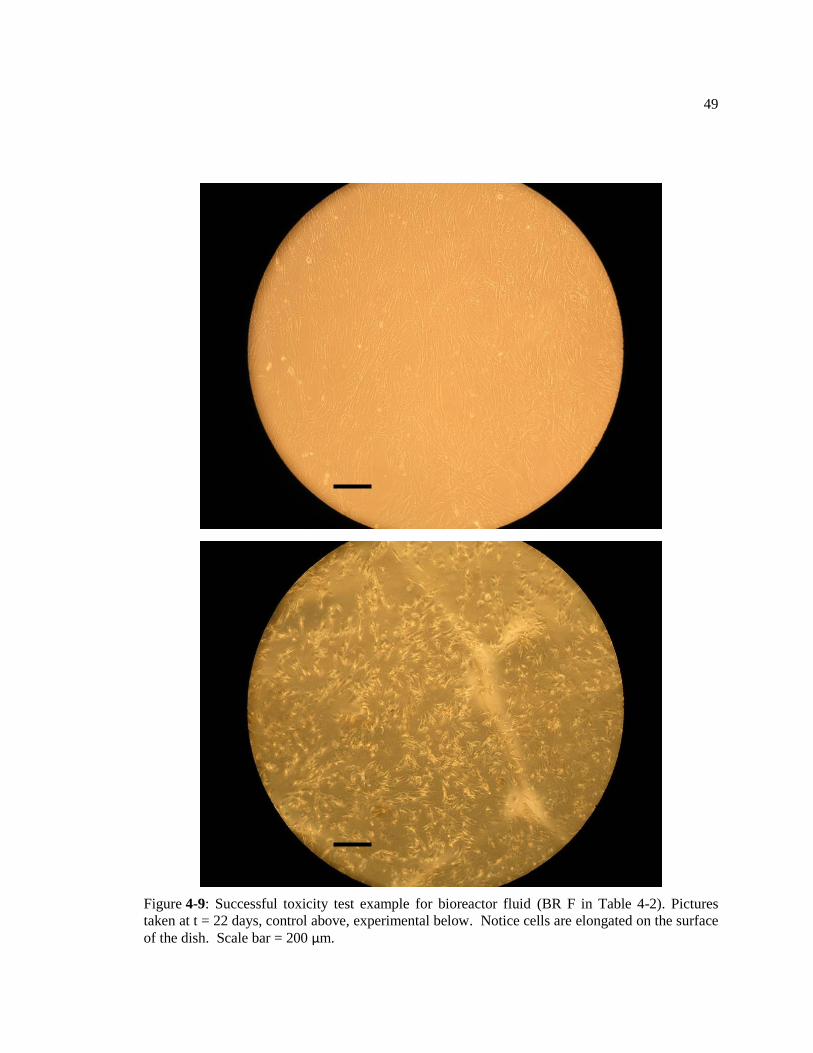
Figure 4-9: Successful toxicity test example for bioreactor fluid (BR F in Table 4-2).
Pictures taken at t = 22 days, control above, experimental below. Notice cells are
confluent and elongated on the surface of the dish. Scale bar = 200 μm. ........................ 49
Figure 4-10: Successful toxicity test example for bioreactor fluid ((BR F in Table 4-2).
Pictures taken at t = 30 days, control above, experimental below. Notice cells are
confluent and elongated on the surface of the dish. Scale bar = 200 μm. ........................ 50
Figure 4-11: Successful toxicity test example for imaging fluid (IM F in Table 4-3).
Pictures taken at t = 0, control above, experimental below. Scale bar = 200 μm. ........... 51
Figure 4-12: Successful toxicity test example for imaging fluid (IM F in Table 4-3).
Pictures taken at t = 8 hours, control above, experimental below. Notice cells are
confluent and elongated on the surface of the dish. Scale bar = 200 μm. ........................ 52
Figure 4-13: Failed toxicity test example for imaging fluid (IM 2 in Table 4-3). Pictures
taken at t = 0, control above, experimental below. Scale bar = 200 μm. ......................... 53
Figure 4-14: Failed toxicity test example for imaging fluid (IM 2 in Table 4-3). Pictures
taken at t = 8 hours, control above, experimental below. Notice cells in the
experimental image are rounded and no longer attached to the plate. Scale bar = 200
μm. ................................................................................................................................... 54
Figure 5-1: Six images, in order, of a porcine aortic valve working in the loop. The pump
rate in the loop was set to 60 beats per minute, and these images were taken over the
course of just under one second (27 frames at 30 frames per second). Valve opening
is indicated in red. ............................................................................................................ 60
viii
LIST OF TABLES
Table 4-1: Numerical information on the considered fluids. ................................................... 32
Table 4-2: A sample of tested imaging fluids, in order of media volume percent (IM 1-
IM 12). IM F represents the final mix. Fluids with a blank in the last column were
not toxicity tested due to poor properties. ........................................................................ 39
Table 4-3: A sample of tested bioreactor fluids, in order of media volume percent (BR 1-
BR 3). BR F represents the final mix. Fewer bioreactor fluids were tested, as the
single vital property was easier to tune in a binary mixture. Fluids with a blank in the
last column were not toxicity tested due to poor properties. ............................................ 40
ix
ACKNOWLEDGEMENTS
I would like to acknowledge several people for their help in my graduate school career at
Penn State. Their efforts and personal attention made this project possible.
First and foremost, I would like to thank my advisor, Dr. Keefe Manning. When my
original advisor at Penn State left after three semesters, Dr. Manning took me into his lab and set
me up with this project so I could finish my graduate education. For that I am extremely grateful.
I would also like to thank the undergraduate students who joined me in working on this
project, and will be continuing this project in the future. First, Katie Schmiech, who put a lot of
effort into this project over the summer. Her speedy learning of the parts of the project and aid in
the lab kept this project on track. Second, Joanna Kinney, who returned to the lab after a summer
internship and quickly picked up the important points of the project and took on a lot of
responsibility early on. I know the future directions of this project will be in good hands with
both of them working on it.
Lastly, I would like to thank my family and friends for supporting me in my time at Penn
State. Everyone I’ve met and gotten to know here has been important, not only to my graduate
school experience, but also to my life as a whole.

Chapter 1
INTRODUCTION
1.1 Clinical Relevance
The heart, in its place at the center of the circulatory system, is an extremely
important organ. Without blood pumping to the body’s organs, irreversible damage and
death will occur in a matter of minutes due to a lack of oxygen. Unfortunately, there are
many things that can go wrong with a heart including congenital abnormalities, blocked
arteries, and dysfunctional valves. If even one of these failures occurs, the damage to
nearly every system in the body is catastrophic. Thus, cardiac therapy is an area
receiving a lot of attention in the research community.
Heart disease is one of the leading causes of death in the United States and the
world, contributing to 1 in 6 deaths in the United States last year [1]. While heart disease
is often manifested in myocardial infarction, problematic heart valves also cause a large
number of heart disease-related deaths [2]. The valves in the heart control the flow of
blood. They ensure that the blood flows in only one direction through the circulatory
system. A poorly functioning heart valve can cause serious problems with the entire
circulatory system. Heart malformations are present in 6 of every 1000 live births [3],
with 30% of these being valve malformations [4]. The most common aortic valve
problem is a bicuspid valve, where the valve has two leaflets instead of the usual three,

2
occurring in 1-2% of births [5]. Aortic valves of this type can function for years before
becoming problematic.
There are currently two major types of therapies for pathologic heart valves.
These are replacement of the valve or surgical repair of the valve [6]. Each therapy has
its own positives and negatives, and is best suited to a particular type of patient.
Replacement of the valve can be done using a tissue or a mechanical valve.
Tissue valves, commonly called bioprosthetic valves, can be homografts (a valve donated
by a human patient recovered after he or she dies) or xenografts (usually porcine valves).
In the porcine case, the valve is often decellularized before implantation to prevent
immune rejection. Homografted valves and porcine valves usually have similar
durability. Another aortic valve replacement option is called the Ross procedure (also
called a pulmonary autograft), in which the patient’s own pulmonary valve is used as a
replacement for the aortic valve, with a pulmonary homograft (donated pulmonary valve
from a cadaver) used in the pulmonary position [7]. This procedure is primarily used in
children, as it allows the new aortic valve to grow with the child. Bioprosthetic valves
have a tendency to undergo calcification and structural degradation [8], leading to a
Figure 1-1: Natural tricuspid (left) and defective bicuspid (right) Aortic Valve. (source:
Surgery.ucla.edu).

3
product lifetime of about 10-15 years or less. Because of this, patients with bioprosthetic
valves require repeat surgery with greater frequency than those with mechanical valves
[9]. The incidence of valve related reoperation among patients with bioprothetic valves is
3.7 events/100 patient-years, while the incidence for mechanical valves is 0.5 events/100
patient-years, according to a 15-year study [10].
Mechanical valves are manufactured out of polymers and metals. These valves
are designed to last much longer than tissue valves, or even the lifetime of the patient.
Recently, a man was admitted to a hospital in Japan with heart failure, and his two
mechanical replacement valves where replaced after he had had them for 27 years. The
explanted mechanical valves showed no signs of degradation [11]. Mechanical valves
do, however, increase the probability of blood clots forming around the valve, so patients
with mechanical replacement valves are required to be on blood thinning medications,
making them more at risk of bleeding [6]. Bioprosthetic valves are usually used in
physically active patients, due to the lower dependence on blood thinners, but this
reduces their lifetime to less than 10 years in most cases. However, antibiotics,
vasodilators, and inotropic agents are often prescribed to patients with either type of
valve replacement.
Surgical repair of a valve is a process used when part of the valve is salvageable,
and thus total replacement is not required. Two major valve repair surgeries are
valvuloplasty [12] and valvulotomy [13]. Valvuloplasty is used to repair a stenotic valve,
or one with a narrowed opening due to stiffening of the valve from calcium buildup. In a
valvuloplasty procedure, a balloon is placed on the stenotic valve and is then inflated to
increase the opening area of the valve and improve blood flow. This procedure is not an

4
optimal one, and is typically used as an alternative to the preferred replacement therapy
when it is not available. Valvulotomy is a repair method in which one or more incisions
are made at the edges of the commissure formed between two or three valves with the
goal of reducing the constriction caused by stenosis. Like valvuloplasty, this therapy is
only used when the preferred therapy, valve replacement, is not available or not able to
be performed.
As mentioned above, both replacement and repair options have drawbacks. The
largest drawback of most of these therapies is that they are not intended for the long-term.
This problem is especially present in tissue valve replacements and surgical valve repair.
Valve replacements have finite lifetimes in the body and surgical repair of valves,
especially in the pediatric case, often requires multiple repeat surgeries [14]. While
mechanical replacement valves are designed to last longer than a patient could possibly
need them, the dependency on blood thinning medications has a major effect on the
lifestyle of the patient.
A relatively new therapy for the repair and replacement of problematic tissues and
organs is tissue engineering. Tissue engineering involves seeding naturally or
synthetically derived scaffolds with cells to form replacement tissues [15]. Tissue
engineered heart valves are still in development at many universities and research centers
[16,17]. The focus of this thesis is a new method to aid in the development of tissue
engineered heart valves.
5
1.2 Cardiovascular Anatomy
The heart is composed of four chambers, two atria and two ventricles. The atria
act as receiving chambers for blood and the ventricles act as discharging chambers in the
two circulations of blood through the body: pulmonary and systemic. Deoxygenated
blood flows through the right side of the heart, with the right atrium receiving blood from
the systemic circulation and the right ventricle pumping blood into the pulmonary
circulation. Oxygenated blood flows through the left side of the heart, with the left
atrium receiving blood from the pulmonary circulation and the left ventricle pumping
blood into the systemic circulation [18]. A simple schematic of this is shown in Figure 1-2
A system of valves keeps the blood flowing in the proper direction. The
atrioventricular (AV) valves are positioned between the atria and the ventricles and direct
blood flow from the atria to the ventricles. These are called the mitral valve (connecting
Figure 1-2: A simple diagram of the heart, showing pathways for systematic (sys) and pulmonary
(pulm) circulations and oxygenated (oxy) and deoxygenated (deoxy) blood.
RA
RV LV
LA Sys
Pulm
Pulm
Sys
deoxy
deoxy oxy
oxy
6
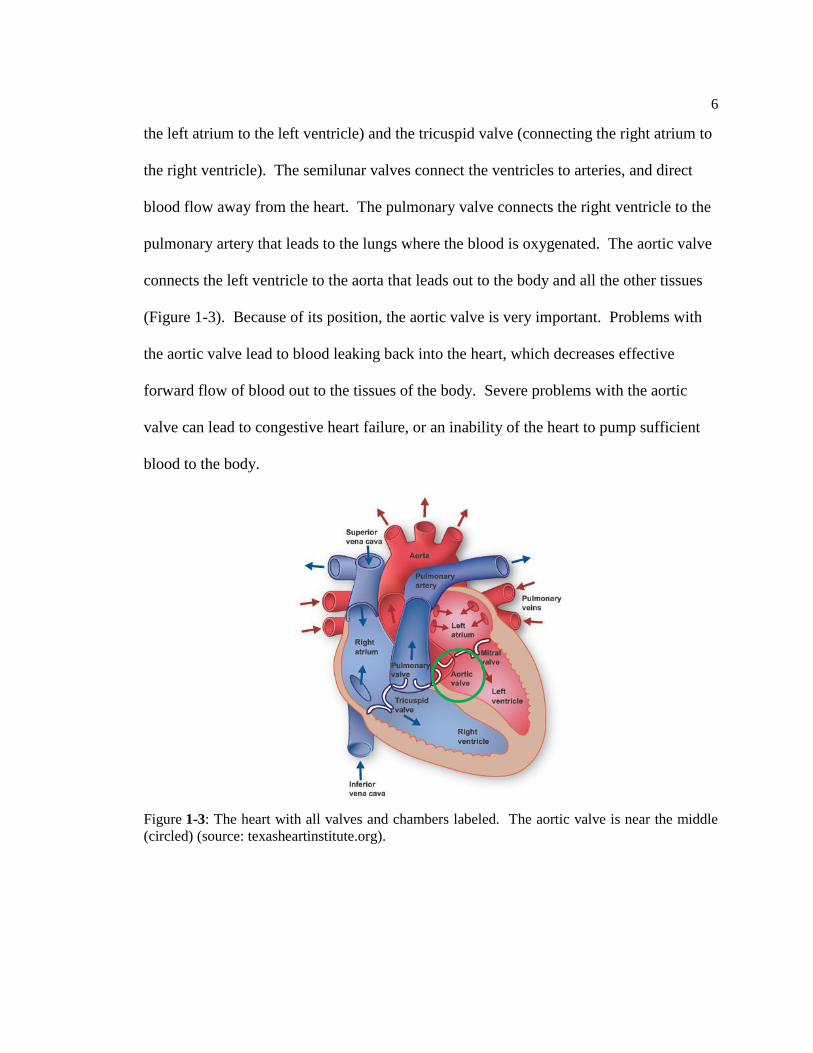
the left atrium to the left ventricle) and the tricuspid valve (connecting the right atrium to
the right ventricle). The semilunar valves connect the ventricles to arteries, and direct
blood flow away from the heart. The pulmonary valve connects the right ventricle to the
pulmonary artery that leads to the lungs where the blood is oxygenated. The aortic valve
connects the left ventricle to the aorta that leads out to the body and all the other tissues
(Figure 1-3). Because of its position, the aortic valve is very important. Problems with
the aortic valve lead to blood leaking back into the heart, which decreases effective
forward flow of blood out to the tissues of the body. Severe problems with the aortic
valve can lead to congestive heart failure, or an inability of the heart to pump sufficient
blood to the body.
Figure 1-3: The heart with all valves and chambers labeled. The aortic valve is near the middle
(circled) (source: texasheartinstitute.org).
7
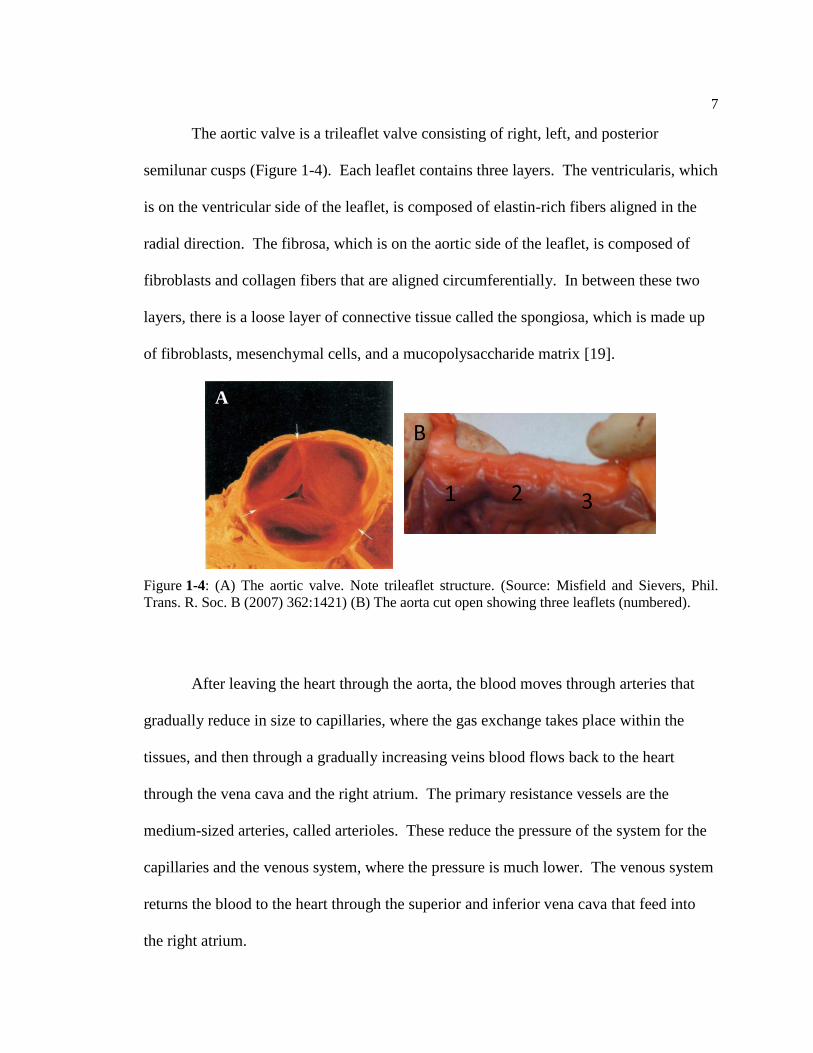
The aortic valve is a trileaflet valve consisting of right, left, and posterior
semilunar cusps (Figure 1-4). Each leaflet contains three layers. The ventricularis, which
is on the ventricular side of the leaflet, is composed of elastin-rich fibers aligned in the
radial direction. The fibrosa, which is on the aortic side of the leaflet, is composed of
fibroblasts and collagen fibers that are aligned circumferentially. In between these two
layers, there is a loose layer of connective tissue called the spongiosa, which is made up
of fibroblasts, mesenchymal cells, and a mucopolysaccharide matrix [19].
After leaving the heart through the aorta, the blood moves through arteries that
gradually reduce in size to capillaries, where the gas exchange takes place within the
tissues, and then through a gradually increasing veins blood flows back to the heart
through the vena cava and the right atrium. The primary resistance vessels are the
medium-sized arteries, called arterioles. These reduce the pressure of the system for the
capillaries and the venous system, where the pressure is much lower. The venous system
returns the blood to the heart through the superior and inferior vena cava that feed into
the right atrium.
Figure 1-4: (A) The aortic valve. Note trileaflet structure. (Source: Misfield and Sievers, Phil.
Trans. R. Soc. B (2007) 362:1421) (B) The aorta cut open showing three leaflets (numbered).
A
B
1 2 3
8
1.3 Tissue Engineered Heart Valves
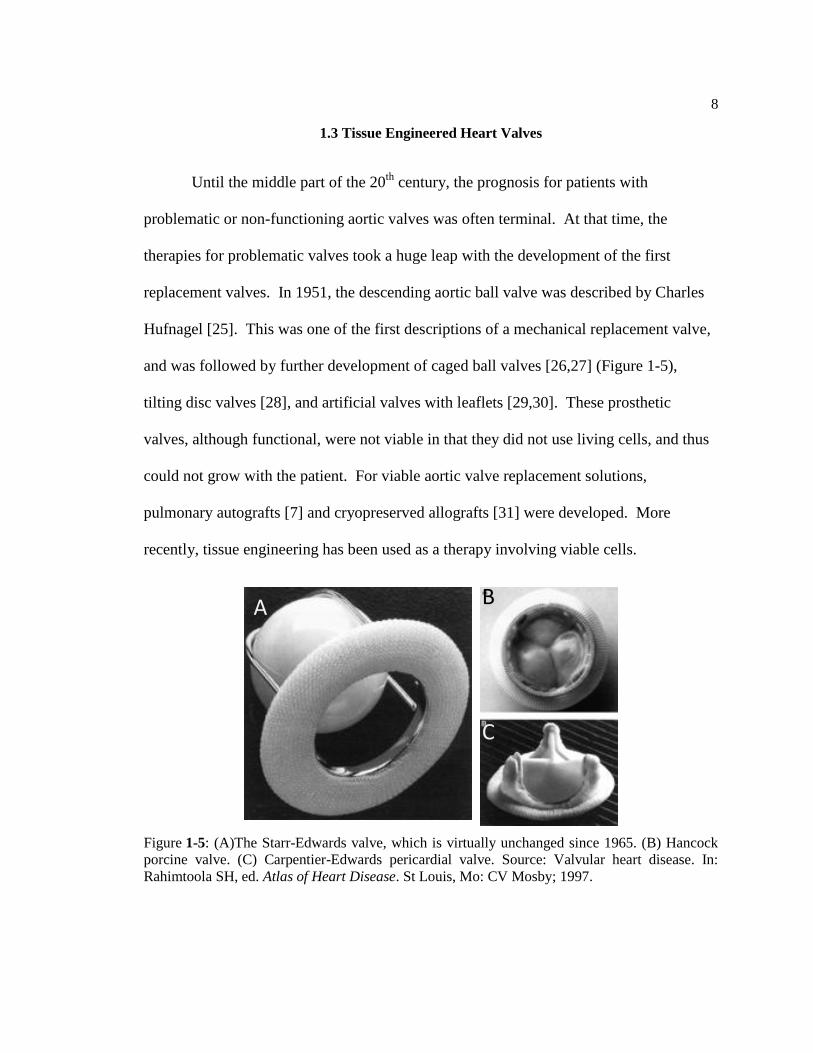
Until the middle part of the 20th
century, the prognosis for patients with
problematic or non-functioning aortic valves was often terminal. At that time, the
therapies for problematic valves took a huge leap with the development of the first
replacement valves. In 1951, the descending aortic ball valve was described by Charles
Hufnagel [25]. This was one of the first descriptions of a mechanical replacement valve,
and was followed by further development of caged ball valves [26,27] (Figure 1-5),
tilting disc valves [28], and artificial valves with leaflets [29,30]. These prosthetic
valves, although functional, were not viable in that they did not use living cells, and thus
could not grow with the patient. For viable aortic valve replacement solutions,
pulmonary autografts [7] and cryopreserved allografts [31] were developed. More
recently, tissue engineering has been used as a therapy involving viable cells.
Figure 1-5: (A)The Starr-Edwards valve, which is virtually unchanged since 1965. (B) Hancock
porcine valve. (C) Carpentier-Edwards pericardial valve. Source: Valvular heart disease. In:
Rahimtoola SH, ed. Atlas of Heart Disease. St Louis, Mo: CV Mosby; 1997.
A B
C
9
In an ideal tissue engineering system, the tissue engineered construct will
integrate with the native tissue around it, and will then grow with that tissue.
Additionally, an engineered tissue, being a natural part of the patient would allow the
patient to have a normal lifestyle. Because tissue engineering therapies allow for this
return to a normal lifestyle for patients, with lower possibility of a requirement for future
surgery, valve replacement is a good candidate for tissue engineering.
Tissue engineering is an emerging therapy in which synthetic or natural materials
are coupled with living cells to form an artificial tissue (Figure 1-5). The engineered
tissue can be implanted to replace problematic native tissue, with the idea that the
engineered tissue will integrate with existing native tissue and grow with it, requiring no
further therapeutic action [15]. In the optimal case, cells would be harvested from the
patient and used to seed the scaffold, so that the engineered tissue would be
immunologically equivalent to the patient’s own tissue. Tissue engineering has already
been successfully implemented in burn therapies [20], and is receiving research attention
in many major tissues such as liver [21], bone [22], bladder [23], and cartilage [24].
10
When tissue engineering emerged as a treatment option and started receiving
large amounts of research attention, fibrous polymer scaffolds were seeded with living
cells [32,33]. Since this work, many approaches for producing tissue engineered heart
valves (TEHV) have been pursued. Scaffold research has involved decellularized valves
[34,35], non-woven fibers [36,37], laser microfabricated polymers [38], and even
scaffolds formed by the cells themselves [39,40]. Cells have been both seeded on
scaffolds in vitro [41] and captured in vivo [42]. Stem cells have also been used in the
production of TEHV, producing their own extracellular matrix in an approach that could
be considered as regenerative medicine [43].
Aortic valve tissue engineering involves the seeding of living aortic valve
interstitial cells onto polymer scaffolds. This process, at the basic level, is well
Figure 1-6: A simple example of the basic process of tissue engineering. (Adapted from
biomed.brown.edu).
Growth factors
Tissue Growth
Cell Culture
Cell Isolation
Isolation
Patient
Scaffold Culture Expansion
Implantation

11
characterized [44,45], but new variations are being developed and tested constantly. Our
tissue engineered heart valves use a polymer called poly(glycerol sebacate), which is a
mixture of glycerol and sebacic acid, both of which are found naturally in the body [46].
Because of this, the polymer does not release toxic substances as it degrades. The
polymer is micromolded into sheets approximately 300 microns thick with a diamond
shaped mesh (Figure 1-7) that serve as the scaffolds. Aortic valve interstitial cells are
then seeded on the scaffold and allowed to proliferate and form a collagenous tissue
network.
The final goal of this work is to produce a tissue-engineered heart valve construct
that can be implanted in a patient, and will be able to integrate with the patient’s natural
tissue and grow, literally as their own heart valve. In this scenario, there would be no
need for any lifestyle change or repeat surgery. The patient’s new tissue engineered heart
Figure 1-7: Diamond-shaped PGS tissue engineering scaffold shown at 300x magnification.
12
valve would become their own heart valve, and they would be able to live a normal
lifestyle [47].
1.4 Mock Circulatory Loops
The analysis of fluid dynamics in the cardiovascular system is an important step
towards a more complete understanding of the cardiovascular system, possibly leading to
improvements in knowledge and treatment of cardiovascular problems. Mock circulatory
loops (MCLs), with features designed to mimic the flow, pressure, and resistance changes
present in the cardiovascular system are an important part of this analysis [48].
Using this system, measurements can be taken, often using optical flow
visualization equipment, to determine the flow of fluid around structures present in the
circulatory system, such as heart valves and arterial bifurcations. Also, flow and pressure
meters can be used to determine the dynamics of the system, making MCLs useful for
testing cardiac assist devices. An MCL system can be used to test the fluid flow around
artificial valves as a step towards determining their usefulness in therapeutic applications.
These loops are commonly used to test cardiac assist devices such as left ventricular
assist devices [49], artificial hearts [50,51], and artificial valves [52], and have recently
been applied to tissue engineering [53].
A mock circulatory loop uses a system of tubes, chambers, valves, and resistance
equipment to simulate the flow of blood through the body [51,54]. The fluid in the loop
is pumped using a pulsatile pump to simulate the heart pumping. The components of the
loop are set up in such a way that the liquid pressures within the loop match those in the

13
body in both systole and diastole. Loops vary in complexity, depending on what part of
the circulatory system is the focus of the study. Details of several key components that
are common to nearly all mock circulatory loops follow.
The first is the pumping chamber, representing the left ventricle of the heart.
There are a few variations of pumping chambers, but in both, the chamber is made of
acrylic and lined with a silicon bag that contains the fluid (Figure 1-8). The silicon bag
can be squeezed using air or a plate attached to a reciprocating motor. The plate pushing
on or air squeezing the silicon bag is meant to simulate the contraction of the heart.
Either form of pump can be run at a variety of speeds to simulate different heart rates.
The inlet and outlet to the chamber each have valves placed in them one allowing for
directed flow. Depending on the focus of the study, this chamber may be designed to
provide an unobstructed view of the inlet or outlet valve.
Figure 1-8: An example of a ventricular assist device often used as a pump in a mock circulatory
loop.

14
The next common loop component is one or more compliance chambers. These
chambers mimic the small compliance movement of the aorta, atria, or blood vessels
(depending on placement) as blood is pumped into them. These chambers can be large
metal constructs that use metal rods or springs to adjust compliance (Figure 1-9), or
chambers that use a pressurized air filled sac to do the same. Compliance is defined as
the ratio of the change in volume to the change in pressure of the system (i.e. compliance
= ΔV/ΔP). For an arterial compliance chamber to function properly, the compliance must
be approximately 1 x 10⁻⁸
m5/N [54].
The third common mock circulatory loop component is a resistance element. This
mimics the primary resistance in the vascular system, the arterioles. This feature is most
often some form of screw clamp squeezing a particular location on the tubing in the loop
(Figure 1-10). The clamp can be tightened or loosened to allow for different levels of
resistance.
Figure 1-9: A standard compliance chamber. The cylinder has an inlet and an outlet for fluid, and
the compliance is controlled by the position of the metal bar.
15
The fourth common component in a mock circulatory loop is a venous
reserve vessel (Figure 1-11). This vessel represents the storage of blood in the venous
return system. This component, in most systems, holds the largest amount of fluid in
comparison to the other components.
Figure 1-10: An example of a resistance plate for a mock circulatory loop. The plate squeezes the
tube that runs in on the left and out on the right, generating resistance to flow.
Figure 1-11: An example of a venous reserve vessel. The large tube on the left is the inlet, and the
16
To properly set up the loop, the pressures must be tuned to the average natural
pressures found within a person. For the arterial side of the loop, assuming a healthy
adult is being modeled, those pressures are 120 mmHg systolic and 80 mmHg diastolic
(traditionally expressed as 120/80). Many factors in the loop have effects on these
pressures, but, generally speaking, the resistance of the resistance element determines the
average pressure (desired in this case to be ~100 mmHg), while the compliance
determines the amplitude of the pressure waveform. Achieving a proper waveform
requires both of these factors to be adjusted together, as well as adjustments to the
amount of fluid in the loop and the positions of the loop elements.
1.5 Mock Circulatory Loop Fluids
Currently, the fluid used in MCLs is often either a complex aqueous solution of
glycerin, xanthan gum, and sodium iodide mixed such that its fluid properties (kinematic
viscosity and elasticity) match those of blood and its refractive index matches that of the
model material [55], or a simpler 40% glycerin solution in water [56] that matches the
kinematic viscosity of blood. The matching of blood properties allows for conclusions to
be drawn regarding the natural flow of blood over anatomical structures using the
artificial fluid instead of blood, which would present problems in a loop environment
such as clotting and separation. The refractive index matching allows little to no
alteration in the light path from refraction when using flow imaging techniques such as
particle image velocimetry [57].
small one on the right is the outlet.

17
However, these mixtures cannot be used with native tissue or cultured living cells
because of their incompatibility with living tissue. The xanthan gum and sodium iodide
in the more complex mixture are not cell-safe, and the simple glycerin-water mixture
lacks the proper compounds to support cell growth and proliferation. A cell-safe fluid
with the properties of blood would be useful in TEHV applications. It could be both used
to compare fluid flow over native valves to that over TEHV and to condition a TEHV
construct.
1.6 Proposed Work
The objective of this work is to develop and test blood analogs that are useful in a
cardiac flow loop and are not toxic to living cells or tissue. Along with the
biocompatibility goal, the fluid should have properties similar to blood (viscosity,
osmolality, and elasticity). The developed blood analogues will be used for two
applications relating to the production and study of tissue engineered heart valves.
1.6.1 TEHV/MCL Application 1: Fluid Flow Comparison
Flow visualization is a common method used in conjunction with MCLs. Particle
image velocimetry (PIV) uses a laser reflecting off particles in a flowing fluid to visualize
in detail the flow field, including any eddies or flow disturbances. This is useful for
determining the exact flow patterns, which can be used to better design a feature for
greater efficiency. For viewing how a moveable feature, such as a heart valve, reacts to
18
fluid flow, a high speed camera can be used. The high speed camera can record the
movements of the feature at a very small time scale, allowing for differences between
designs to be picked up more readily under fluid flow.
A large part of constructing tissue-engineered heart valves is ensuring that the
construct performs as similarly as possible to the native heart valve in a physiological
situation. Native aortic valve leaflets can be placed in the loop and the flow profiles over
them could be compared to that over tissue-engineered constructs. The data from this
sort of experiment could supplement mechanical property data acquired previously in an
effort to produce a tissue-engineered aortic valve construct that behaves as similarly as
possible to native aortic valve tissue. Currently, mechanical property data is useful in
determining the structure and composition of a scaffold used for aortic valve tissue
engineering. Fluid flow data would be useful in determining the proper size and shape of
the construct
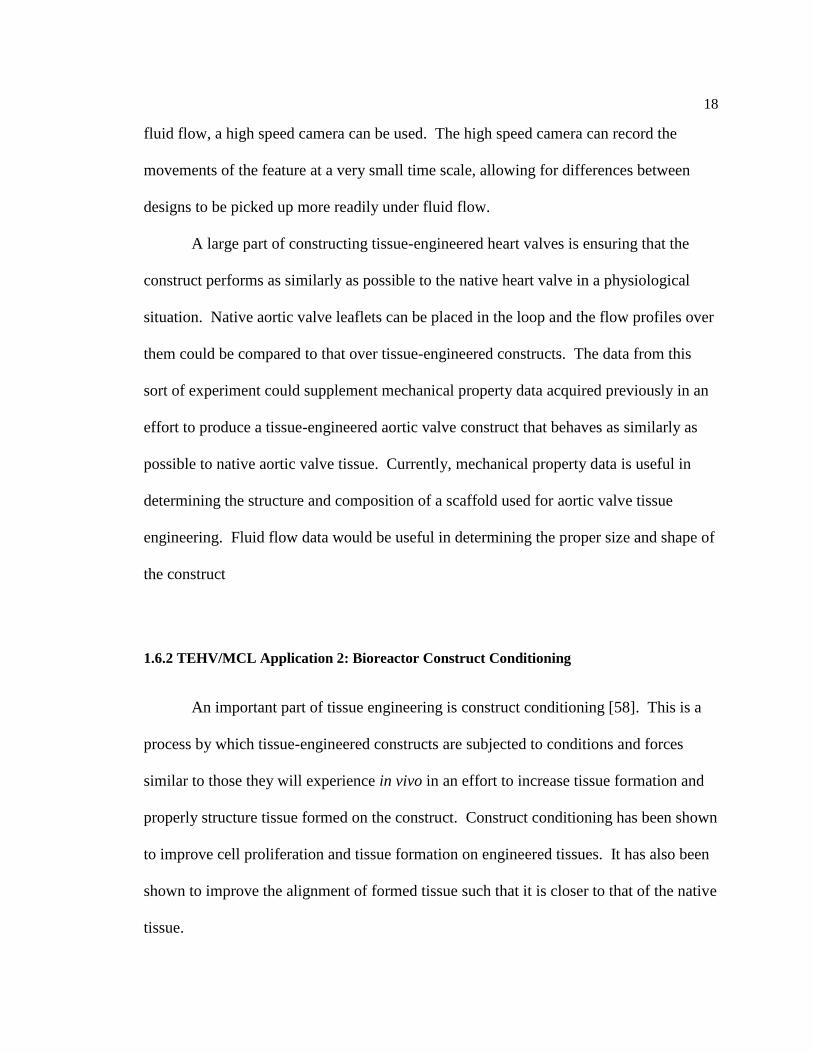
1.6.2 TEHV/MCL Application 2: Bioreactor Construct Conditioning
An important part of tissue engineering is construct conditioning [58]. This is a
process by which tissue-engineered constructs are subjected to conditions and forces
similar to those they will experience in vivo in an effort to increase tissue formation and
properly structure tissue formed on the construct. Construct conditioning has been shown
to improve cell proliferation and tissue formation on engineered tissues. It has also been
shown to improve the alignment of formed tissue such that it is closer to that of the native
tissue.
19
For a heart valve, the physiological forces are stretch (as valve closes against
pressure), flex (as valve opens to allow flow), and fluid shear (as fluid flows over valve)
[59]. Systems built for the purpose of construct conditioning are called bioreactors, and
come in many different forms. A common form of bioreactor for aortic valve constructs
is one that cyclically stretches the construct, simulating the cyclic stretch that the valve
will undergo in vivo [60]. However, this only addresses the cyclic stretch of native heart
valves, and not the flex or fluid flow. With a MCL used as a bioreactor, all three
physiological forces that heart valves are subject to could be mimicked, allowing for
better conditioning of the construct.

Chapter 2
MOCK CIRCULATORY LOOP DESIGN SPECIFICS
The loop assembled for this work is similar in terms of parts and functionality to
that developed by Lukic et al. [61]. In this loop design, an adult-size Pierce-Donachy
pneumatic pump without valves was used as an aortic compliance chamber and a venous
reservoir (Terumo Capiox 400 mL venous reservoir, Tokyo, Japan) was used as venous
compliance (Figure 2-1).
To provide adequate volume for the desired amount of aortic compliance, a 4-liter
glass filter flask was attached to the air side of the Pierce-Donachy pneumatic pump
(Figure 2-2). This chamber was connected to a pressure source (Barnant Company
Vacuum Pressure Station, Barrington, IL), which maintained constant pressure in the
Figure 2-1: The loop setup, with tubes labeled. The chamber on the left is the aortic compliance
and the one on the right is venous compliance. (A) is the outlet from the pump (after the valve
chamber), (B) is the inlet to the pump, and (C) is the pressure line to the compliance setup.
AB
C

21
aortic compliance chamber using an outlet-tube regulator. Two screw clamps were
positioned on the tube connecting the aortic and venous compliance chambers to act as
systematic resistance.
Average arterial pressure in the loop was maintained at approximately 95 mmHg
with systolic and diastolic pressures of approximately 120 and 70 mmHg respectively
(120/70). A trace of pressure versus time in the loop can be seen in Figure 2-3. This
pressure trace is not optimal, as the systolic and diastolic phases of the trace aren’t
constant pressure. The systolic peak and diastolic pressure are in the acceptable range.
Figure 2-2: The atrial compliance setup. The air line from the compliance chamber (C in Figure
2-1) runs into the flask at the point indicated. The pump holds pressure within the flask while the
clamp allows excess pressure to escape.
22
Pressure was measured using Argon Medical Devices (Plano, TX) disposable
pressure transducers connected to the loop in the following three locations. One on the
arterial side before the aortic compliance chamber, one between the aortic and venous
compliance chambers placed after the systematic resistance clamps, and one on the outlet
tube from the venous compliance chamber (Figure 2-4). Pressures in the loop were tuned
by changing the pressure in the aortic compliance chamber and the set point on the
systematic resistance clamps.
Figure 2-3: Arterial pressure versus time acquired from the mock circulatory loop setup. The
maximum systolic pressure is approximately 120 mmHg and the average diastolic pressure is
approximately 70 mmHg.
0
20
40
60
80
100
120
140
0 0.5 1 1.5 2 2.5
Art
eri
al p
ress
ure
(m
mH
g)
Time (seconds)
23
The aortic and venous compliance chambers are mounted on a vertical Plexiglas
board and connected to the inlet (on the venous side) and the outlet (on the aortic side) of
an acrylic chamber containing an inlet valve and a place for a native aortic valve or
TEHV to be placed. The sample aortic valve is contained within an acrylic L-shaped
tube, allowing a clear view of the valve along its axis (Figure 2-5). This allows for high-
speed photography of the valve as it opens and closes. The acrylic chamber contains a
blood sac that is pressed cyclically by a Harvard Apparatus Pulsatile Blood Pump. The
speed of the blood pump is controllable to allow for heart rates from 30 to 100 beats per
minute (figure 2-6).
Figure 2-4: A simple schematic of the loop. Blue arrows represent fluid flow direction, green
blocks represent resistance clamps, and red blocks represent pressure transducers. The blue circle
represents the aortic valve inside the visualization chamber.
Air
Fluid Fluid To
Compliance
Volume
Aortic
Compliance
Venous
Reserve
Pump chamber with
diaphragm (not to scale)

24
Figure 2-5: Two views of the valve chamber and elbow. (A) The shape of the elbow with the
chamber on the left and an arrow indicating flow direction. (B) The view of the valve (circled)
from the end of the elbow for data collection. A caged ball valve is currently installed for pressure
testing.
Figure 2-6: The pump setup (without fluid). When full, the plate (circled) presses into the
diaphragm, forcing fluid out of the chamber.
A B
Chapter 3
FLUID REQUIREMENTS
The main requirements for both fluids are that they mimic the fluid properties of
blood and support living tissue and cells. To properly represent the fluid flow paths that
blood would take over the valves, the fluid must have mechanical properties similar to
those of blood. To support living cells and tissue, the fluid must have a number of
specific properties.
The mechanical property focus is viscosity, specifically, the kinematic viscosity.
This is calculated by dividing the dynamic (or absolute) viscosity by the density of the
fluid. The kinematic viscosity of blood varies from about 3.5 to 4.5 mm2/s, depending on
hematocrit. The goal is to achieve a kinematic viscosity that is within this range.
Support of living cells and tissue requires precise tuning of several properties.
First, obviously, the fluid cannot contain toxic substances that would kill the cells
quickly. For this, material safety data sheets (MSDS) were consulted. Within the MSDS,
the National Fire Protection Association 704 (NFPA 704, commonly known as the fire
diamond) was checked for the health risk number. For possible fluid components, only
liquids with a health number of 0 (poses no health hazard) or 1 (exposure poses minor
health hazard) were considered.
Simply not killing cells, however, is not enough. The fluids must be able to
support cellular growth and division. For this, something to feed the cell is required. The
best source of cellular food is glucose, as it is used often in cell culture media [62]. Thus,
26
high glucose content was required for the fluid. Along with glucose, culture media
contains many molecules to aid in cellular growth and repair such as amino acids,
vitamins, and inorganic salts.
The biological properties of blood were also considered important in fluid
formulations. The biological properties of blood include pH and osmolality. The native
pH of blood is found within a very narrow range, from approximately 7.35 to 7.45 [18].
The osmolality of blood is important for osmotic balance with the cells. If the solute
concentration in the fluid is too high, water will be pulled out of the cells by osmotic
pressure and the cells with shrivel. If the solute concentration in the fluid is too low,
water will be pulled into the cells by osmotic pressure and the cells may burst. Native
blood has an osmolality of approximately 300 mOsmol/L, and, for the fluid, a goal was
set to be within 5% of this value. These properties were not specifically tested in the
development of the fluid, but were assumed to be within acceptable ranges for the cells in
fluids that passed cell toxicity tests. During cell toxicity test, cells were imaged to assess
osmotic content of fluid, as higher osmolality fluids lead to shrunken cells and lower
osmolality fluids lead to bursting cells due to water movement.
For the flow imaging fluid, optical properties are also important. To ensure
compatibility with laser imaging, the fluid must be clear and colorless. A slight yellow
color is allowable, as many previous loop fluids are this color due to the sodium iodide
present in them. Any red color, however, is not allowable, as this would absorb light
wavelengths used for laser imaging. And additional requirement is the refractive index of
the fluid. When light moves between media of different refractive index, it is refracted
and the light path changes. The acrylic used in construction of the loop has a refractive

27
index of approximately 1.48, so the fluid must have a refractive index as close to this as
possible. If there is some difference between the refractive index of the fluid and the
acrylic loop, calculations can be done to correct for the changing light path, but, to
simplify the imaging protocol, refractive index was limited to between 1.45 and 1.50. To
achieve this high refractive index, stronger chemicals were required, which reduced the
biological compatibility of the fluid.
The timescale of use is different for the two fluids. The flow imaging fluid will
need to be used for up to eight hours while the video or laser imaging takes place.
Because of the shorter time requirements of this fluid, long-term biocompatibility and
cell support are not as important. This makes up for the above-mentioned challenges
presented in the biocompatibility of high refractive index fluids. The bioreactor fluid,
however, will need to be in use for weeks as the cells divide and produce the tissue
surface of the TEHV. Most of the bioreactor studies we conduct using other bioreactors
run for two to four weeks [58], so bioreactor fluids were tested with cells for four weeks.
Without the high refractive index requirements, it should be easier to develop a fluid that
can support cell growth over this longer period.
Finally, we wanted fluids that were relatively simple to produce in any quantity,
whether it was small quantities for our testing purposes or large quantities for running in
the loop. The goal was to minimize the number of components in both fluids, not only to
keep production simple, but to avoid unforeseen consequences that could come out with
more complex mixtures.

Chapter 4
FLUID DEVELOPMENT
Developing these fluids involved first picking a liquid as a starting point, and then
adding other liquids to tune the properties of the mixture to match the desires properties.
The starting point liquid would have to be cell-safe, and provide the necessary
compounds for cell growth and division, while the additives would have to alter the
mechanical and/or optical properties of the mixture without compromising the cell-
sustaining properties of the original fluid.
4.1 Initial Fluid Selection
As a starting point, we decided to use culture media. For most cell culture in our
lab, including that of heart valve cells, we use a modified version of medium 199,
developed by Joseph Morgan in the 1950s [63]. Medium 199 was originally developed
for nutritional studies of chick embryo fibroblasts, but is used in wide variety of cell
culture applications, mainly in the culture of non-transformed mammalian cells. Gibco
medium 199 has added Earle’s salts (a salt-balancing mixture), L-glutamine (an amino
acid that supports cell growth), and 2.2 g/L sodium bicarbonate (a buffer used to stabilize
pH). In addition to these factory additives, we add fetal bovine serum (FBS, 10% by
volume) and Gibco antibiotic-antimycotic (5% by volume) to produce the media we use
for our cell culture work. This media, however, could not be used for this MCL fluid, as

29
it contains phenol red, a pH indicator that colors the media red under neutral pH
conditions. This red color would not be permissible in a fluid for the applications we
needed, as it would absorb the laser used for imaging. Fortunately, medium 199 is
available with the same factory additives listed above and without the phenol red. Our
usual media mix, the 10% FBS and 5% antibiotic-antimicotic mixture mentioned above,
using the medium 199 without phenol red was produced using the same sterile filtration
techniques that are used for regular culture media. This became the basis for both fluids,
as it already contains the sugars, amino acids, vitamins, and inorganic salts required to
sustain the valve cells.
4.2 Potential Additives
The next step was finding additives that would alter the mechanical or optical
properties of the fluid while maintaining the cell support of the culture media. For this,
we consulted the MSDS of a number of chemicals, looking for chemicals with a low
health hazard rating. We also looked at other chemicals we used in our lab as media
additives, knowing that these chemicals were cell safe, but not knowing their effect on
refractive index or viscosity.
Initially, tests were done using the fluids and additives available in our lab, as
they were used for cell culture so we knew that they would be safe. These additives
include fetal bovine serum (FBS), antibiotic-antimicotic agent, and L-ascorbic acid 2-
phosphate (AA2P). These fluid additives were tested for refractive index and viscosity.

30
Mixtures were then tested, and an effort was made to understand not only the effect of
individual additives on the mixture, but the effect of the interactions between additives.
It was found, however, that anything made from cell culture fluids would be too water-
like in its properties (refractive index close to 1.33, viscosity close to 1 cP), as all of the
fluids used for cell culture are water based.
Chemicals that are often used in blood analogues were also considered. These are
glycerin, xanthan gum, and sodium iodide. In most blood analogues, glycerin and
xanthan gum are used to increase the viscosity of the fluid, while sodium iodide is used to
increase the refractive index. However, both xanthan gum and sodium iodide have an
NFPA 704 health rating of 2 (intense exposure poses risk of injury), and were therefore
deemed not cell-safe. While glycerol does have a health rating of 1 (exposure poses
minimal risk), is not able to raise either refractive index or viscosity high enough to be
useful on its own.
More additives were needed. In consulting Materials Safety Data Sheets of many
chemicals, as well as work previously done on this project, the field of fluids was
narrowed down to two. These fluids met criteria in additives we felt we needed, those
being high refractive index, high viscosity, and cell safety.
One possible additive was mineral oil. Mineral oil is colorless and odorless, and
is an organic mixture of alkanes. Mineral oil is used in certain cell culture applications,
mainly involving embryos and oocytes for in vitro fertilization and other related
procedures, so is cell-safe. The mineral oils we tested were found to have a refractive
index in close to 1.47, which is comfortably within the desired range. However, the

31
challenges in properly mixing the oil with our water-based cell culture media would
make this fluid unusable as an additive.
Another possible additive was dimethyl sulfoxide (DMSO). This fluid is a polar
aprotic solvent, but is less toxic than other members of this class. DMSO is frequently
used as a solvent in chemical reactions such as nucleophilic substitutions, and is also used
extensively in biochemistry and cell biology. It has a variety of biological uses, including
use as an inhibitor of secondary structures in DNA primers in polymerase chain reaction
[64], as a cryoprotectant in cell freezing for storage [65], and as an agent to induce
differentiation in certain stem cell populations [66,67]. DMSO is also used in the medial
field in topical-application pharmaceuticals, as it increases absorption of some
compounds though the skin and other tissues. For our purposes, DMSO has a health
hazard rating of 1 (exposure poses minor health hazard), and a high refractive index. In
small quantities, we believed that DMSO would provide a large increase in refractive
index, and would still be non-toxic to the cells. Because of its high refractive index and
clear and colorless appearance, DMSO was used as a part of the imaging fluid.
Another possible additive was 3,4-dimethoxybenzyl alcohol (DMBA). This fluid
is a high-viscosity alcohol used in a variety of chemical processes. Like DMSO, DMBA
has a health hazard rating of 1 (exposure poses minor health hazard). That, coupled with
the fluid’s high viscosity and refractive index, was what made this a potential additive,
considering it might be a cell-safe way to increase the viscosity of our fluids.

32
Therefore, DMSO and DMBA could be used in conjunction with our culture
media to produce a fluid that was relatively simple to make, and would meet our
requirements for both the imaging and bioreactor fluids.
4.3 Additive Effects
As mentioned above, additive effects on both viscosity and refractive index were
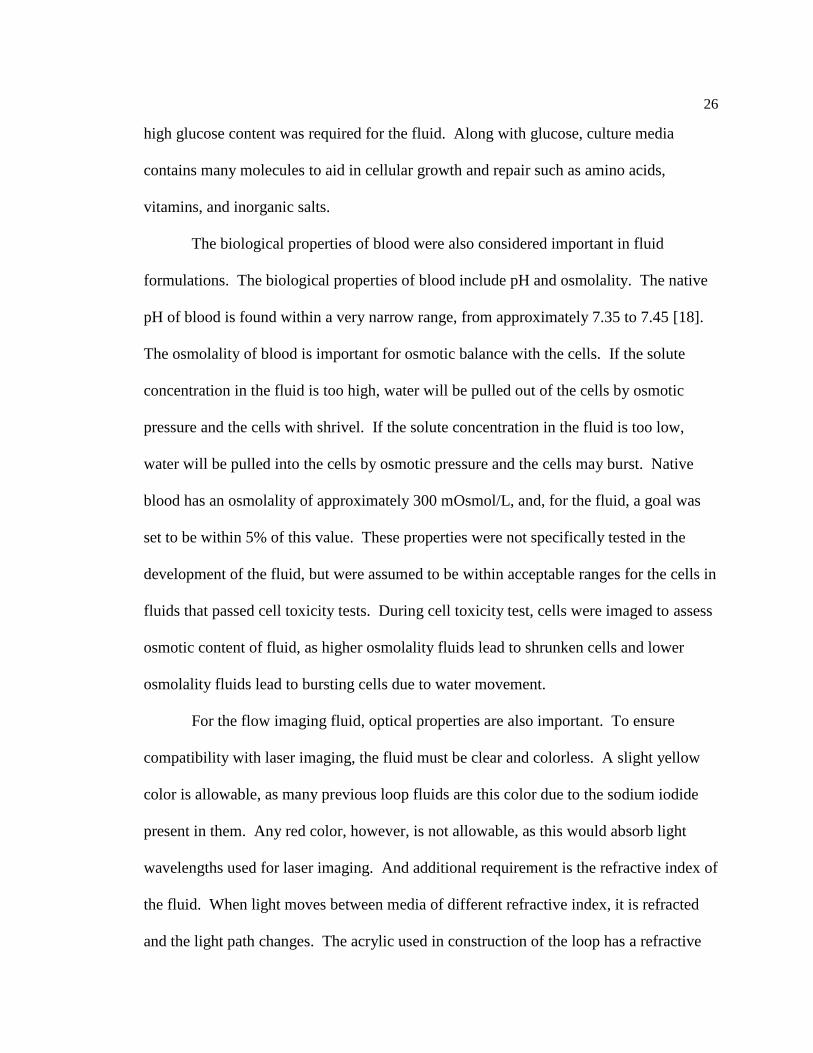
important in the development of these blood analogues. As is apparent in table 4-1,
DMBA has a higher viscosity than blood, and a high refractive index, while DMSO has a
slightly lower viscosity than blood and a high refractive index. The culture media has
properties very similar to water in terms of refractive index and viscosity (low refractive
index and lower viscosity than blood). At a basic level, we found that we could increase
both refractive index and viscosity of our mixtures by adding more DMBA and DMSO.
Table 4-1: Numerical information on the considered fluids.
Fluid Refractive
Index
Health
Rating
Density
(g/cm3)
Dynamic
Viscosity (cP)
Kinematic
Viscosity
(mm2/s)
Culture
Media
1.331 0 0.979 0.88 0.89
DMSO 1.473 1 1.096 2.20 2.01
DMBA 1.549 1 1.106 7.76 7.02
33
It has been shown in previous studies involving refractive index [68] that the
change in refractive index and viscosity is not linear with respect to the percent
composition of a certain fluid in a mixture. Adding DMBA to media alone would not
produce a fluid with a proper viscosity and refractive index, and thus would not be useful
for the imaging fluid. However, since the only concern in producing a testable bioreactor
fluid was viscosity, it was found that a mixture of DMBA and media would work for a
bioreactor fluid. However, to tune both the viscosity and the refractive index for the
imaging fluid, a binary mixture is not enough. The three fluids we decided to use for the
imaging blood analogue created a system of fluids that could raise or lower the properties
we were looking at based on the proportions of each of the individual additives.
For viscosity, media and DMSO both have lower viscosity than blood. Thus, if
the viscosity is too high, mixtures with higher media and DMSO content were
considered. DMBA has a higher viscosity than blood, and therefore was used to raise
viscosity.
For refractive index, DMBA and DMSO both have higher refractive indices than
was required for laser imaging, while media has a much lower refractive index. Thus,
DMBA and DMSO proportions were increased to raise the refractive index, and media
proportion was increased to lower it.
Glycerin 1.475 1 1.261 14.12 11.20
Xanthan
Gum
NA 2 NA NA NA

34
The final concern, cell safety, was a little harder to directly define by numbers
than the other two properties, mainly because so many factors, including pH, molecular
composition, and osmolality can have an effect. The metric used to evaluate additives,
the NFPA 704 health rating, is defined more for human exposure than individual cellular
exposure, so it was possible that this metric would be somewhat meaningless. Both of
the chosen additives, DMSO and DMBA, have a health rating of 1 (exposure poses
minimal risk), so it was assumed that they both presented approximately the same level
of danger to the living cells. However, it was also assumed that both of them would be
less cell-friendly than the culture media. Therefore, efforts were made to minimize the
proportion of both blood analogues that was made up of these two fluids.
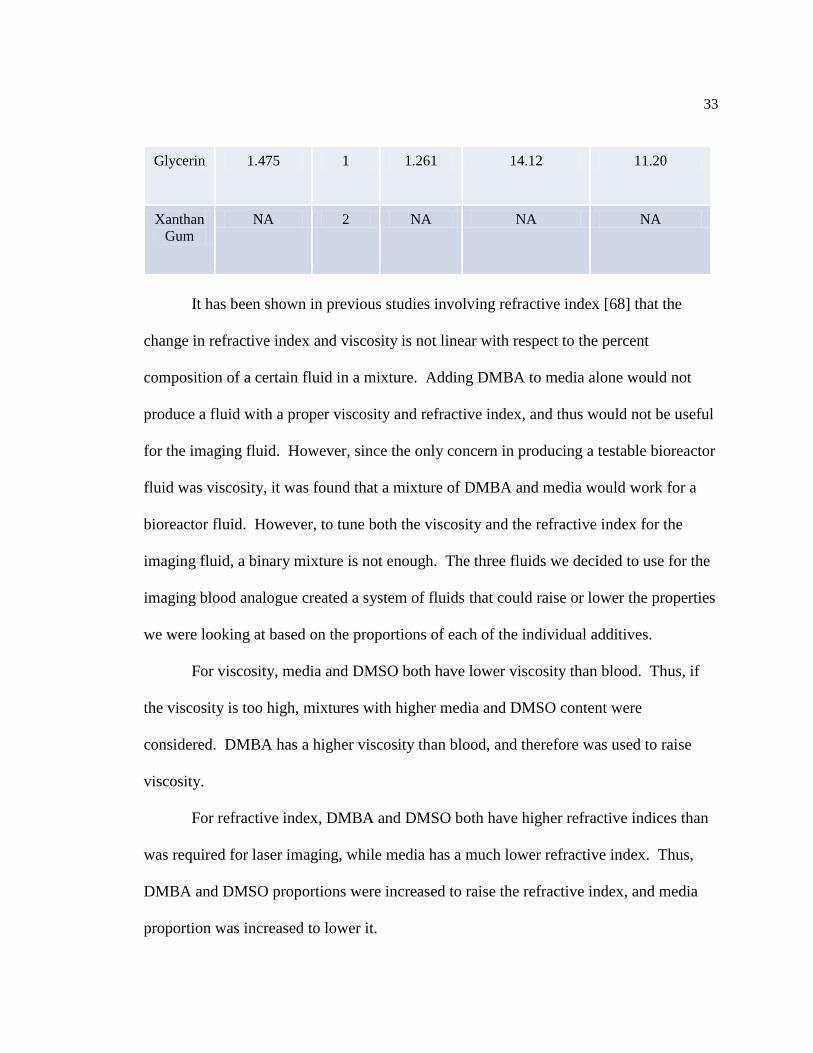
4.4 Property Determination
Viscosity for the fluids was determined using a Vilastic 3 viscoelasticity analyzer
(Vilastic Scientific, Austin, TX). This machine measures the viscoelastic behavior of the
fluids, and we used a laboratory balance (Mettler-Toledo, Columbus, OH) to measure
density of the fluids we produced, so we could determine the kinematic viscosity (Figure
4-1). The machine can measure liquid viscosities at a variety of temperatures, which is
adjustable using a Haake Thermo temperature control unit (Thermo Fisher Scientific,
Waltham, MA).

35
Refractive indices of liquids were measured using a Bausch & Lomb
refractometer (Figure 4-2). Individual fluids and possible blood analogues were both
tested using this equipment.
Figure 4-1: The viscometer setup. On the left is the temperature control, on the right is the
viscometer itself. Both are controlled by the computer.
Figure 4-2: The refractometer setup.
36
4.5 Cell Toxicity Testing
For cell toxicity testing, porcine aortic valve interstitial cells were used. Pig
hearts were acquired from Penn State University’s Meat Lab and transported back to the
lab. Using aseptic techniques in a cell culture hood, the aortic valve leaflets were cut
out of the heart and rinsed in phosphate buffered saline (PBS). Both the top and bottom
surface of the leaflets were then rubbed roughly with sterile surgical sponges to remove
any remnant red blood cells and the outer layer of endothelial cells on the valves. The
valves are then placed in TPP bioreactor tubes with specially formulated medium 199 for
cell isolation containing 10% type I collagenase [69]. If cells were being isolated from
multiple hearts, sets of valve leaflets are segregated into different tubes by the heart from
which they came.
After approximately 24 hours of incubation at 37º C in the isolation media, the
tubes are spun in a centrifuge for 10 minutes at approximately 900 rpm (120 g), which
pellets the cells at the bottom of the tube. The isolation media is then removed and
replaced with our standard culture media (medium 199, 10% FBS, 10% antibiotic-
antimicotic), and the pellet is resuspended and transferred to a T25 cell culture flask.
Cells from different hearts are kept separate, and culture flasks are labeled with the date,
passage number (0 after isolation) and the heart from which they came.
Cells are observed using an Olympus CKX41 inverted microscope (Olympus
Corporation, Tokyo, Japan) to confirm cell type by morphology [69] and passaged once
or twice before cell toxicity testing so that some cells could be left over for future tests.
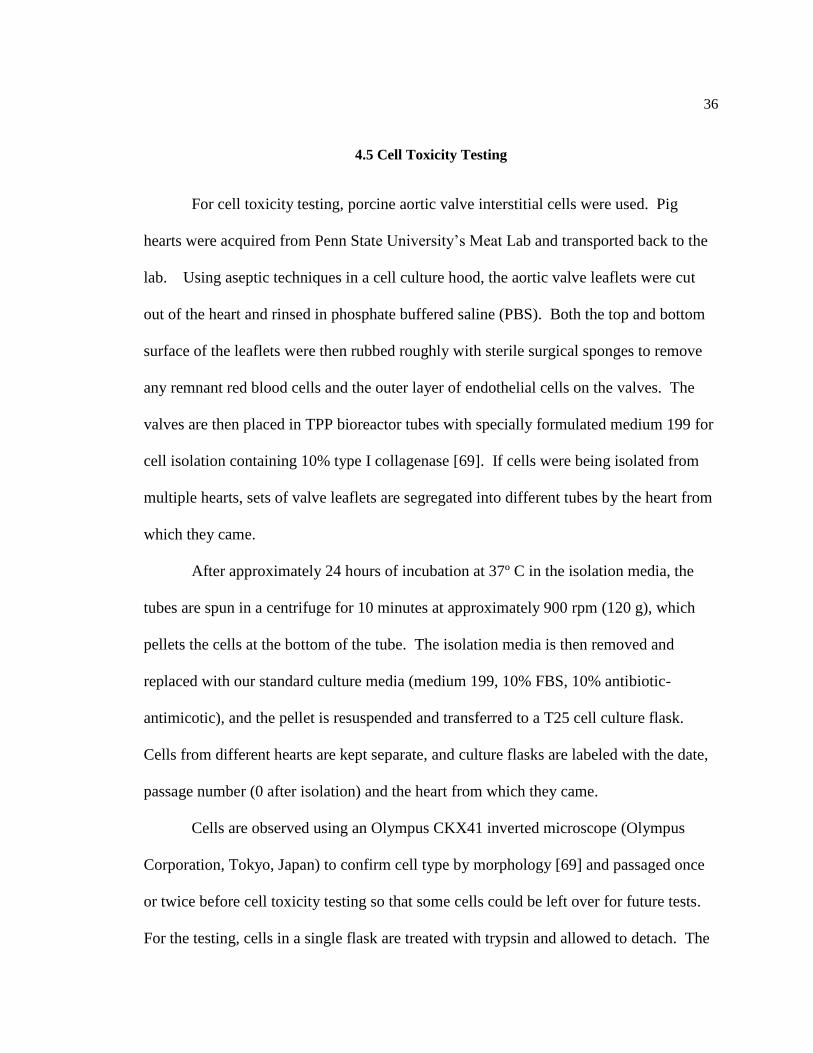
For the testing, cells in a single flask are treated with trypsin and allowed to detach. The

37
suspended cells are moved into new culture media in 8 or 12 wells of a Falcon 24-well
culture plate (Figure 4-3). The 24-well plates are filled with cells from either two or
three hearts, with cells from different hearts separated in different wells (either 8 wells
per heart for 3 hearts or 12 wells per heart for 2 hearts).
For the toxicity testing, cells are first imaged using light microscopy after
confluence has been achieved in the wells and while still in standard culture media. The
Figure 4-3: A 24-well plate ready for cell toxicity testing. Cells in this plate were isolated from
the hearts of 3 different animals (labeled H1, H2, H3). For the test, the top row will be control
(medium 199, 10% FBS, 5% antibiotic-antimicotic) and each lower row will be filled with one
testing fluid. For each fluid and the control, there are 6 wells, 2 from each heart.
38
media is then changed such that there is an entire row of wells with each test fluid in it,
and an entire row with standard culture media to serve as a control.
For the imaging fluid, the cells were imaged twice over the course of 8 hours (at
t=4 hrs and t=8 hrs) and compared to controls to determine their health and growth in the
fluid. For the bioreactor fluid, cells were imaged every two days over the course of 4
weeks, with media/fluid changes twice a week.
After the toxicity tests, cells were trypsinised and removed from the plate and
transferred either to another plate or to a T25 tissue culture flask and placed in our
standard culture media. The cells were observed the next day to make sure that they were
still growing and proliferating.
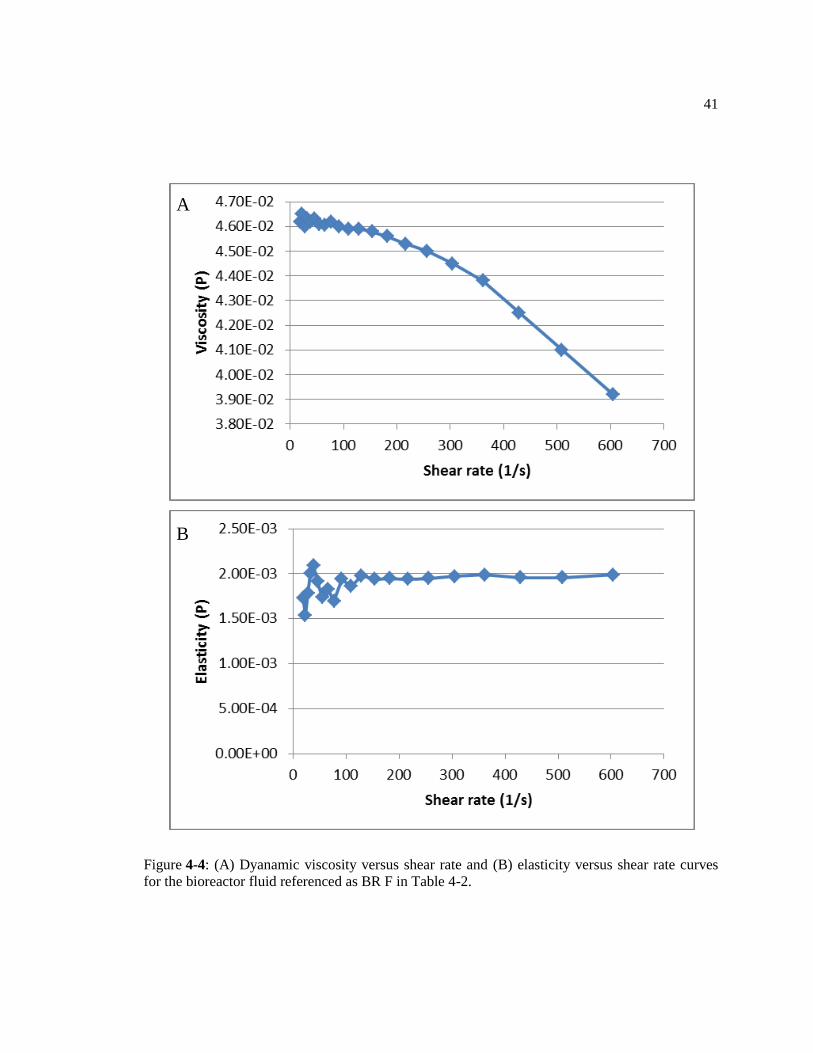
Tables 4-2 to 4-3 show results of a selection of tested fluids. Figures 4-4 and 4-5
display the dynamic viscosity and elasticity curves for the bioreactor and imaging fluids.
Both dynamic viscosity and elasticity are plotted versus shear rate for these graphs.
39
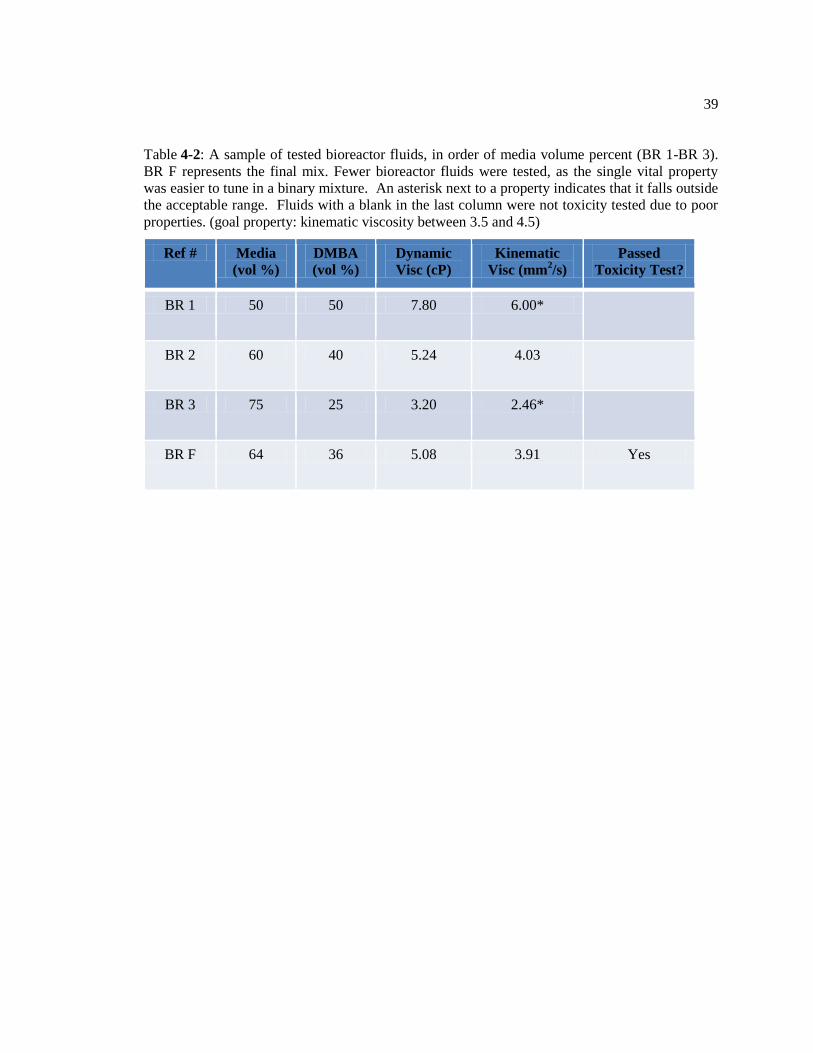
Table 4-2: A sample of tested bioreactor fluids, in order of media volume percent (BR 1-BR 3).
BR F represents the final mix. Fewer bioreactor fluids were tested, as the single vital property
was easier to tune in a binary mixture. An asterisk next to a property indicates that it falls outside
the acceptable range. Fluids with a blank in the last column were not toxicity tested due to poor
properties. (goal property: kinematic viscosity between 3.5 and 4.5)
Ref # Media
(vol %)
DMBA
(vol %)
Dynamic
Visc (cP)
Kinematic
Visc (mm2/s)
Passed
Toxicity Test?
BR 1 50 50 7.80 6.00*
BR 2 60 40 5.24 4.03
BR 3 75 25 3.20 2.46*
BR F 64 36 5.08 3.91 Yes
40
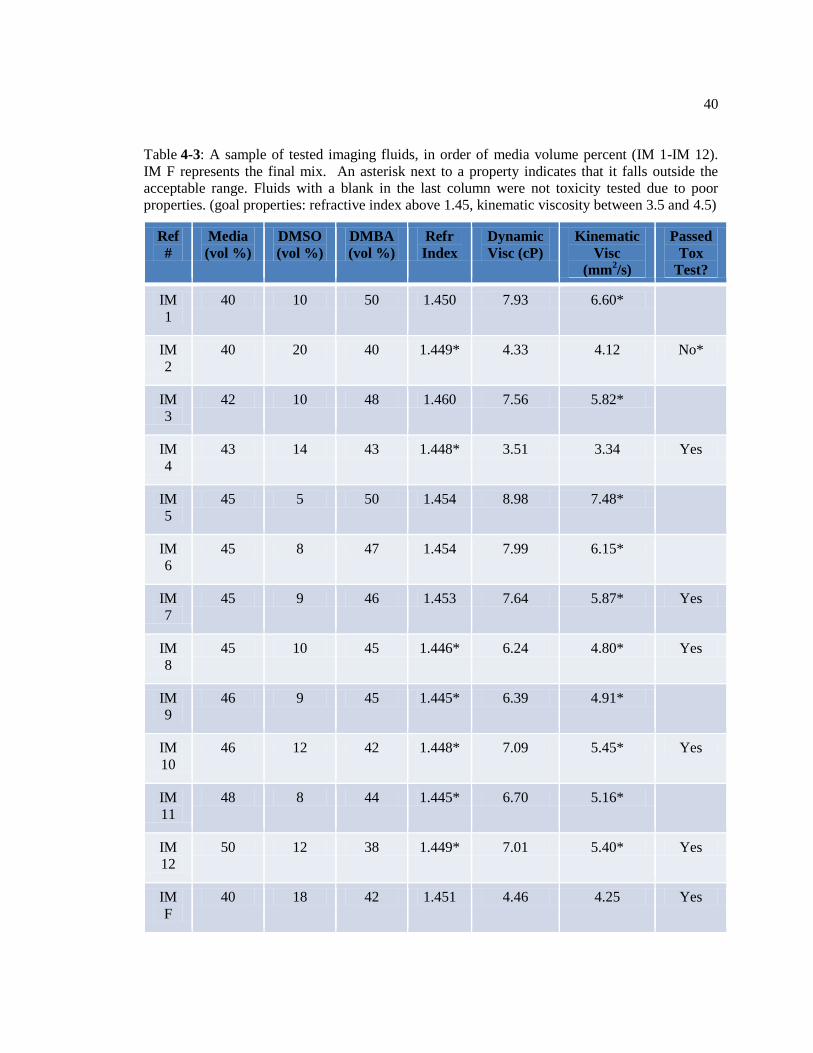
Table 4-3: A sample of tested imaging fluids, in order of media volume percent (IM 1-IM 12).
IM F represents the final mix. An asterisk next to a property indicates that it falls outside the
acceptable range. Fluids with a blank in the last column were not toxicity tested due to poor
properties. (goal properties: refractive index above 1.45, kinematic viscosity between 3.5 and 4.5)
Ref
#
Media
(vol %)
DMSO
(vol %)
DMBA
(vol %)
Refr
Index
Dynamic
Visc (cP)
Kinematic
Visc
(mm2/s)
Passed
Tox
Test?
IM
1
40 10 50 1.450 7.93 6.60*
IM
2
40 20 40 1.449* 4.33 4.12 No*
IM
3
42 10 48 1.460 7.56 5.82*
IM
4
43 14 43 1.448* 3.51 3.34 Yes
IM
5
45 5 50 1.454 8.98 7.48*
IM
6
45 8 47 1.454 7.99 6.15*
IM
7
45 9 46 1.453 7.64 5.87* Yes
IM
8
45 10 45 1.446* 6.24 4.80* Yes
IM
9
46 9 45 1.445* 6.39 4.91*
IM
10
46 12 42 1.448* 7.09 5.45* Yes
IM
11
48 8 44 1.445* 6.70 5.16*
IM
12
50 12 38 1.449* 7.01 5.40* Yes
IM
F
40 18 42 1.451 4.46 4.25 Yes
41
Figure 4-4: (A) Dyanamic viscosity versus shear rate and (B) elasticity versus shear rate curves
for the bioreactor fluid referenced as BR F in Table 4-2.
A
B
42
Sample images from cell toxicity tests are presented (Figures 4-6 through 4-14).
Most cell toxicity tests included 6 wells in each group (1 control, 2-3 experimental).
Figure 4-5: (A) Dyanamic viscosity versus shear rate and (B) elasticity versus shear rate curves
for the imaging fluid referenced as IM F in Table 4-3.
A
B
43
Three timepoints were taken for the imaging fluid toxicity tests (0 hours, 4 hours, and 8
hours), while 16 timepoints were taken for the bioreactor fluid (0 days, and every other
day to day 30). In all, 384 images were taken. In Figures 4-6 to 4-14, images of control
wells are above and images of experimental wells are below. The health of cells was
determined based on their morphology, taking into consideration several factors [71].
First, living cells are distinct from dead cells in that they are attached to the surface of the
well. Second, attached cells display a spindle-shaped, elongated morphology. At
confluence, elongated cells exhibit a swirling pattern, which is characteristic of
fibroblasts. All images are labeled with the test and the time point.
Figure 4-6 shows images from a bioreactor fluid toxicity test. The top image is
the control well containing standard culture media, and the bottom image is the
experimental well containing the tested fluid (a 64-36 volume % mixture of culture media
and DMBA, BR F in Table 4-2). The image is taken at time zero, so it just serves as an
illustration of the similarities between the control and experimental wells at the beginning
of the experiment. Both wells contain cells that are attached to the bottom of the well,
and are elongated.
Figure 4-7 is two images from the same toxicity test, 8 days later. There are more
cells in the field of view, as the cells have divided, but the morphology of cells in both
the control and experimental wells is still indicative of healthy cells. Cells in both the
control and experimental image are attached to the bottom of the well and elongated.
Figure 4-8 shows the same bioreactor fluid toxicity test, this time at the 15-day
time point. The cells in the control well have reached full confluence (the cells
44
completely cover the field of view with no gaps), while the cells in the experimental well
have not. This could be caused by the lower concentration of cell-necessary molecules in
the bioreactor fluid because of the addition of the DMBA. However, cells in both images
still display a health morphology, in that they are attached to the surface of the well and
have an elongated, spindle-like morphology.
Figure 4-9 is images from the bioreactor fluid test on the 22nd
day. The cells in
both the control and experimental groups are still attached to the surface of the well and
display an elongated morphology, indicating that the cells are healthy.
Figure 4-10 contains images from the bioreactor fluid test on the final day (day
30). Both wells contain attached cells which are elongated and spindle-shaped. This test
was a success because the cells in the experimental well displayed a healthy morphology
for the entire month that they were cultured in the bioreactor fluid.
Figure 4-11 contains images for a toxicity test of the imaging fluid (40% media,
18% DMSO, 42% DMBA, IM F in Table 4-3). These photos were taken at the start of
the experiment (t = 0). The cells in these wells were allowed to grow to confluence prior
to the experiment, unlike those used in the bioreactor fluid toxicity tests. Cells in both
wells display similar healthy morphologies based on their attachment to the bottom of the
well and elongated shape. Because of the confluence of the cells, a swirling pattern can
be observed, further indicating cell health.
Figure 4-12 contains images for the same test as the previous figure, but at the 8
hour (ending) time point. The cells in both the control and experimental wells are
attached to the surface and display an elongated, spindle-like morphology. They also

45
continue to display a swirling pattern indicating confluence of healthy cells. This test
was a success because the cells displayed the same healthy morphology in the control and
experimental wells for the duration of the test.
Figure 4-13 contains images for a failed toxicity test of the imaging fluid (40%
media, 20% DMSO, 40% DMBA, IM 2 in Table 4-3). These images are from the initial
time point (t = 0) and thus both contain healthy cells.
Figure 4-14 contains images from the same failed imaging fluid toxicity test as
the previous figure, at the final time point (t = 8 hours). The control well still contains
cells with a healthy morphology (attached to the bottom of the well and elongated).
However, the experimental well contains many unhealthy and dead cells. Cells in this
well appear more rounded because they have detached from the surface of the well.
Some also appear out of focus because they are floating at different heights in the fluid.
The cell death in the experimental group indicated failure in this cell toxicity test.
46
Figure 4-6: Successful toxicity test example for bioreactor fluid (BR F in Table 4-2). Pictures
taken at t = 0, control above, experimental below. Cells have not yet grown to confluence in the
dish. Scale bar = 200 μm.

47
Figure 4-7: Successful toxicity test example for bioreactor fluid (BR F in Table 4-2). Pictures
taken at t = 8 days, control above, experimental below. Notice cells are elongated on the surface
of the dish. Scale bar = 200 μm.

48
Figure 4-8: Successful toxicity test example for bioreactor fluid (BR F in Table 4-2). Pictures
taken at t = 15 days, control above, experimental below. Notice cells are elongated on the surface
of the dish. Scale bar = 200 μm.
49
Figure 4-9: Successful toxicity test example for bioreactor fluid (BR F in Table 4-2). Pictures
taken at t = 22 days, control above, experimental below. Notice cells are elongated on the surface
of the dish. Scale bar = 200 μm.

50
Figure 4-10: Successful toxicity test example for bioreactor fluid ((BR F in Table 4-2). Pictures
taken at t = 30 days, control above, experimental below. Notice cells are elongated on the surface
of the dish. Scale bar = 200 μm.

51
Figure 4-11: Successful toxicity test example for imaging fluid (IM F in Table 4-3). Pictures
taken at t = 0, control above, experimental below. Scale bar = 200 μm.
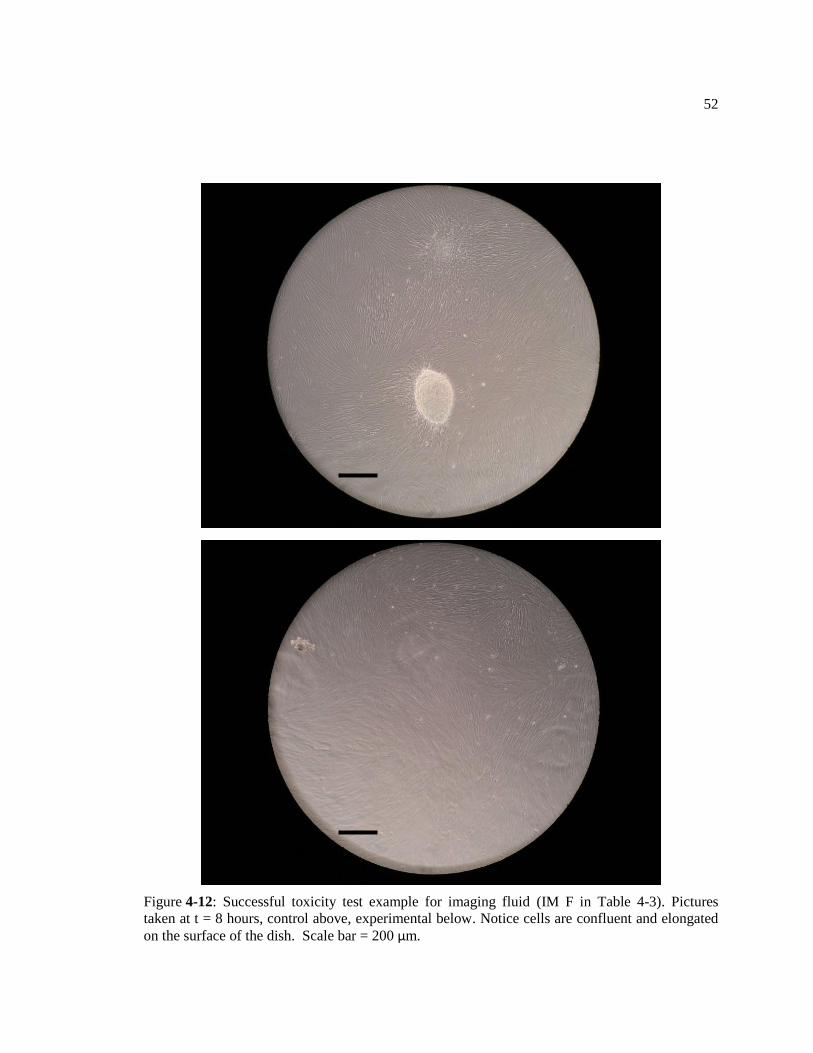
52
Figure 4-12: Successful toxicity test example for imaging fluid (IM F in Table 4-3). Pictures
taken at t = 8 hours, control above, experimental below. Notice cells are confluent and elongated
on the surface of the dish. Scale bar = 200 μm.
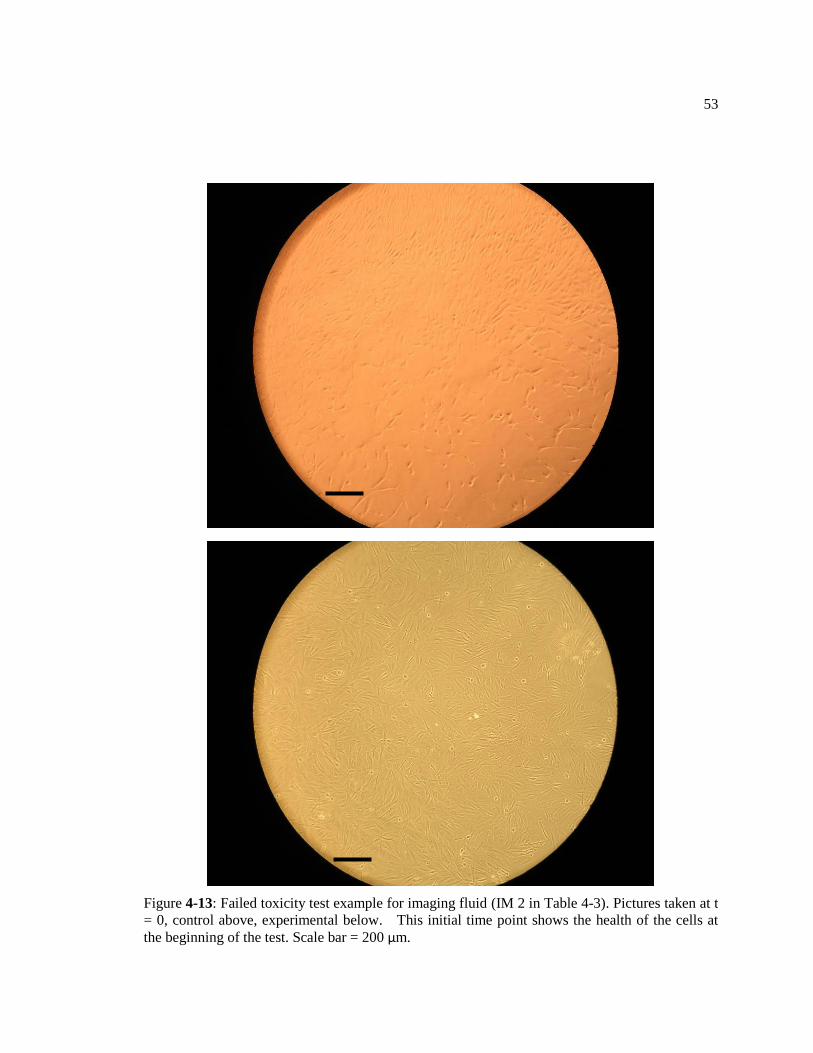
53
Figure 4-13: Failed toxicity test example for imaging fluid (IM 2 in Table 4-3). Pictures taken at t
= 0, control above, experimental below. This initial time point shows the health of the cells at
the beginning of the test. Scale bar = 200 μm.

54
Figure 4-14: Failed toxicity test example for imaging fluid (IM 2 in Table 4-3). Pictures taken at t
= 8 hours, control above, experimental below. Notice cells in the experimental image are rounded
and no longer attached to the plate. Scale bar = 200 μm.
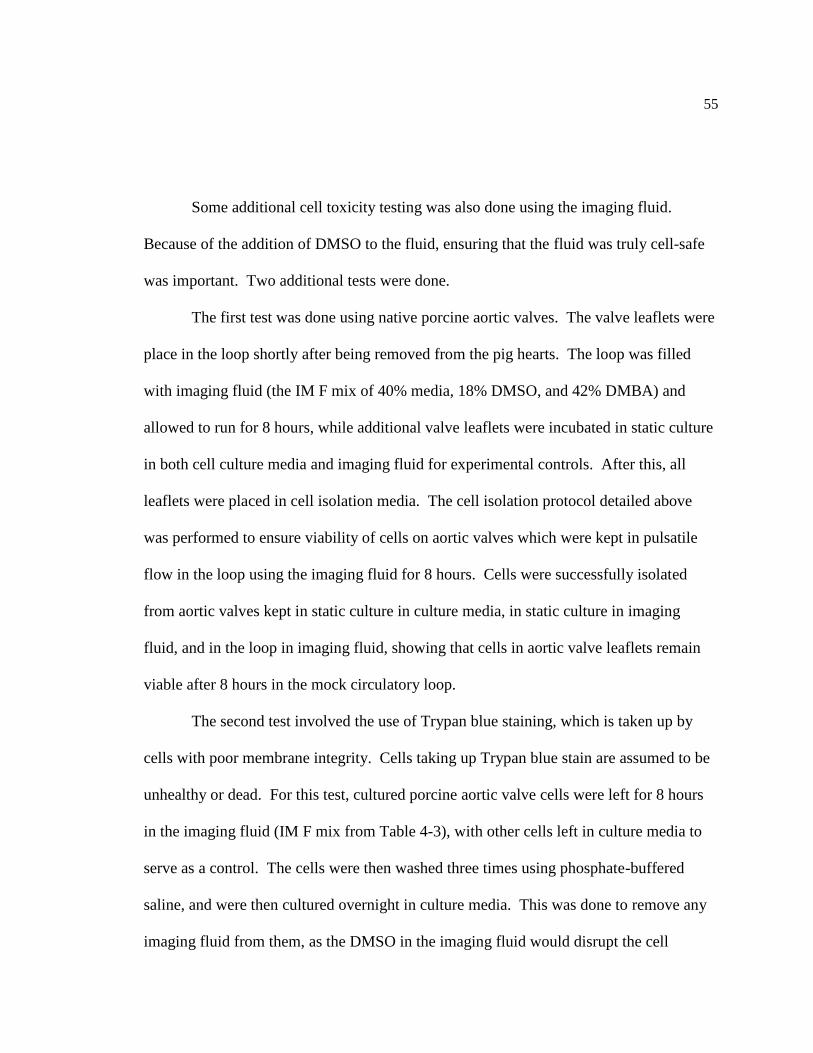
55
Some additional cell toxicity testing was also done using the imaging fluid.
Because of the addition of DMSO to the fluid, ensuring that the fluid was truly cell-safe
was important. Two additional tests were done.
The first test was done using native porcine aortic valves. The valve leaflets were
place in the loop shortly after being removed from the pig hearts. The loop was filled
with imaging fluid (the IM F mix of 40% media, 18% DMSO, and 42% DMBA) and
allowed to run for 8 hours, while additional valve leaflets were incubated in static culture
in both cell culture media and imaging fluid for experimental controls. After this, all
leaflets were placed in cell isolation media. The cell isolation protocol detailed above
was performed to ensure viability of cells on aortic valves which were kept in pulsatile
flow in the loop using the imaging fluid for 8 hours. Cells were successfully isolated
from aortic valves kept in static culture in culture media, in static culture in imaging
fluid, and in the loop in imaging fluid, showing that cells in aortic valve leaflets remain
viable after 8 hours in the mock circulatory loop.
The second test involved the use of Trypan blue staining, which is taken up by
cells with poor membrane integrity. Cells taking up Trypan blue stain are assumed to be
unhealthy or dead. For this test, cultured porcine aortic valve cells were left for 8 hours
in the imaging fluid (IM F mix from Table 4-3), with other cells left in culture media to
serve as a control. The cells were then washed three times using phosphate-buffered
saline, and were then cultured overnight in culture media. This was done to remove any
imaging fluid from them, as the DMSO in the imaging fluid would disrupt the cell
56
membrane, which could lead to false positives in the Trypan blue staining. The next day,
the cells were stained with Trypan blue and placed on a hemocytometer for counting.
Based on the hemocytometer count, it was determined that an average of 18.2% of cells
cultured in the bioreactor fluid absorbed Trypan blue, indicating that they were
unhealthy. In the control group, 12.6% of cells were determined to have absorbed
Trypan blue. According to the Trypan blue protocol, in a healthy log-phase culture, less
than 5% of cells should absorb Trypan blue. Since the cells used in this experiment were
beyond their log growth phase, this test was deemed a success, and the imaging fluid was
re-validated as cell-safe.
Chapter 5
TEHV/MCL SYSTEM.
5.1 Increasing Fluid Volume
A challenge of translating fluid testing into useable fluids for the mock circulatory
loop is the difference in the volumes we needed for testing and the volume required for
the loop. For testing, 1 milliliter volumes of fluids were usually produced, as this was
enough for viscosity and refractive index tests. There is a large difference between these
produced volumes, and the methods used to make and mix them, and the volume of the
mock circulatory loop, which is approximately 900 milliliters.
For the smaller volumes, high-accuracy measurements can be made using a
pipette, which measures fluid volumes usually less than 1 milliliter. However, when the
same proportions of liquids must be achieved on the order of hundreds of milliliters,
precise measurements require different equipment. At this larger scale, weighing fluids
with a known density using a laboratory balance is the best way to achieve very precise
measurments.
The idea here is that care must be taken to ensure that the 900 milliliters of fluid
for the loop is as similar as possible in terms of it properties (viscosity, refractive index,
and cell safety) to the original 1 milliliter of fluid produced for testing. However
measurement and mixing is done for the larger volume, small portions of the fluid for use

58
in the loop must be tested for refractive index and viscosity to ensure that it preserves the
properties of the original tested fluid.
5.2 Projected Studies
The TEHV/MCL system opens up a number of possibilities for future studies in tissue
engineering of heart valves. The fluids that we have designed serve two purposes: imaging
studies and bioreactor studies. Each of these studies has a different purpose in the development
of tissue engineered heart valves, and both are equally necessary for the production of a working
replacement valve for implantation in patients.
5.2.1 Imaging
There are two levels of imaging we expect to do with the TEHV/MCL system.
The data acquired from both of these imaging levels will be compared between native
heart valves and tissue engineered heart valves. With these comparisons, design of tissue
engineered heart valves can be improved to enhance the fluid mechanics related to them.
The first level of imaging is using a high-speed video camera. This is useful in
terms of the movement of the valves. From both the end of and above the valve chamber,
a high speed camera can be used to view the opening and closing of the valve. Video can
be taken for both the native and tissue engineered valves and then compared either
qualitatively or quantitatively. Using qualitative methods, the movement of the valves
can be compared frame by frame on video to improve the design of tissue engineered
heart valves so that their movement is as similar as possible. Using quantitative methods,
59
models of valve movement can be produced and related to metrics measuring their
movement. These metrics can then be used to compare the movement of tissue
engineered heart valves to that of native valves.
Images of a porcine aortic valve in the loop acquired using the high speed camera
(Kodak Motion Corder Analyzer, Series SR, Redlake MASD, San Diego, CA) are shown
in Figure 5-1. The six images show one opening and closing of the valve, starting just
before the valve opens and ending just after it closes. The images were taken over the
course of approximately one second. For these images, the Harvard apparatus pump was
set to 60 beats per minute and the camera was set to acquire images at 30 frames per
second.
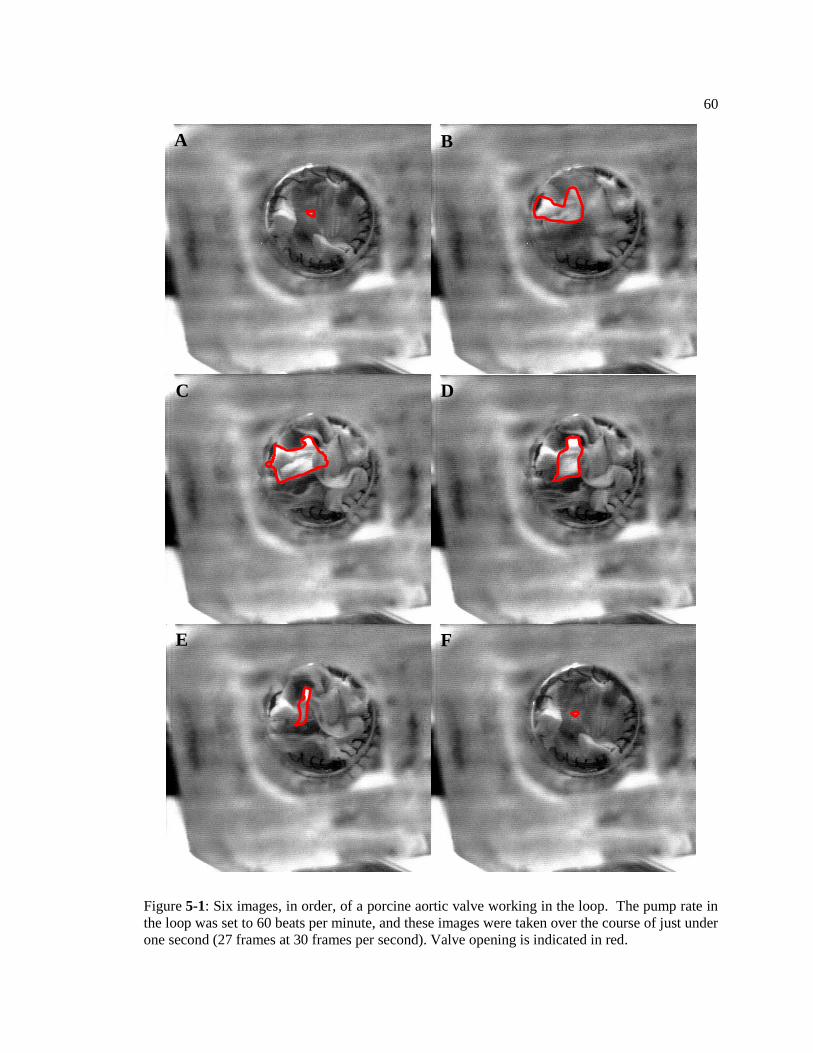
60
Figure 5-1: Six images, in order, of a porcine aortic valve working in the loop. The pump rate in
the loop was set to 60 beats per minute, and these images were taken over the course of just under
one second (27 frames at 30 frames per second). Valve opening is indicated in red.
A B
C
D
E
F
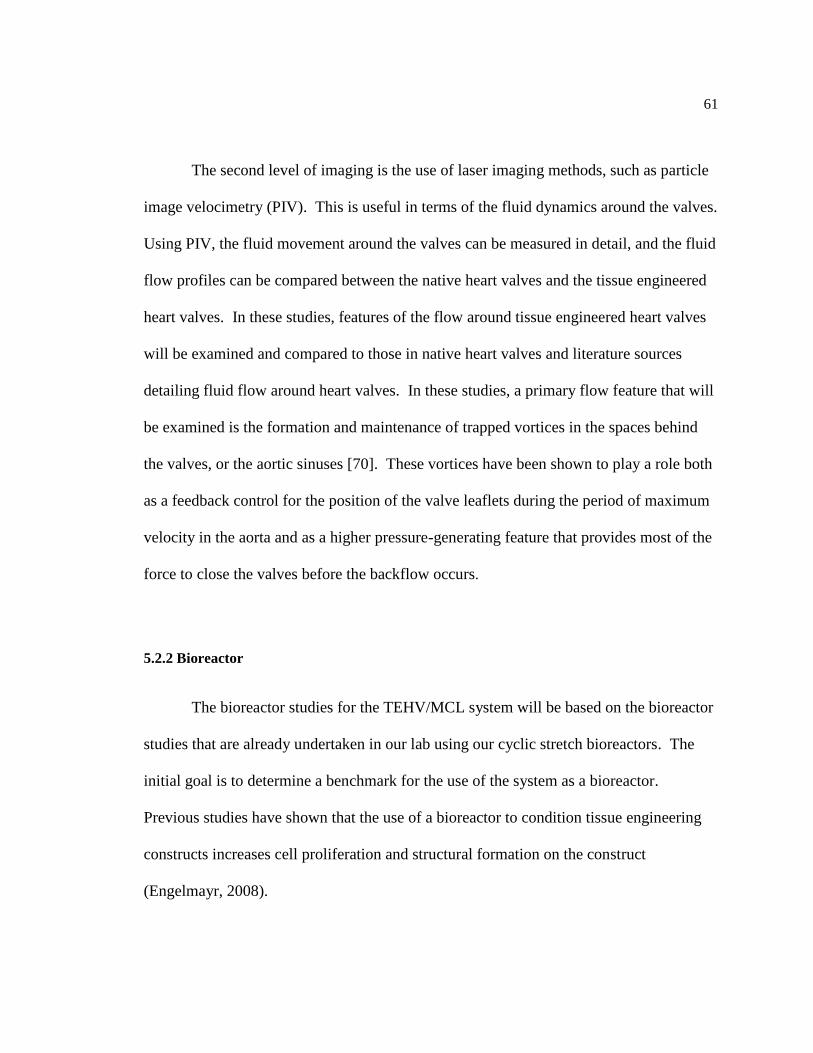
61
The second level of imaging is the use of laser imaging methods, such as particle
image velocimetry (PIV). This is useful in terms of the fluid dynamics around the valves.
Using PIV, the fluid movement around the valves can be measured in detail, and the fluid
flow profiles can be compared between the native heart valves and the tissue engineered
heart valves. In these studies, features of the flow around tissue engineered heart valves
will be examined and compared to those in native heart valves and literature sources
detailing fluid flow around heart valves. In these studies, a primary flow feature that will
be examined is the formation and maintenance of trapped vortices in the spaces behind
the valves, or the aortic sinuses [70]. These vortices have been shown to play a role both
as a feedback control for the position of the valve leaflets during the period of maximum
velocity in the aorta and as a higher pressure-generating feature that provides most of the
force to close the valves before the backflow occurs.
5.2.2 Bioreactor
The bioreactor studies for the TEHV/MCL system will be based on the bioreactor
studies that are already undertaken in our lab using our cyclic stretch bioreactors. The
initial goal is to determine a benchmark for the use of the system as a bioreactor.
Previous studies have shown that the use of a bioreactor to condition tissue engineering
constructs increases cell proliferation and structural formation on the construct
(Engelmayr, 2008).

62
To test this, similar constructs are placed in the bioreactor and in a static culture
state (in an ultra-low attachment plate) and are grown for 2 to 4 weeks. At the end of the
culture period, constructs are removed from their respective culture setups and tests are
performed. Some of the samples are fixed and stained using a nuclear stain (Vectashield
with dapi) and an f-actin stain and imaged using confocal microscopy to determine the
structure of the formed tissue. Samples are also imaged using an environmental scanning
electron microscope (ESEM) for further determination of the structures formed by the
cells on the construct. Samples are also quantified using a picogreen DNA assay (to
determine cell proliferation) and a Biocolor Sircol collagen assay (to determine collagen
production), both of which are normalized to the wet weight of the sample. The results of
all of these tests are compared between the bioreactor samples and the static culture
samples to determine the effect of the bioreactor on the tissue engineered construct.
The goal of the bioreactor is to alter the construct in a way that is conducive to its
final use. In this case, with the aortic valve, the bioreactor should increase cell
proliferation and collagen production, and also increase the alignment of cells and
collagen fibers closer to their alignment in native valves. This would require using native
valves as a benchmark and comparison point for the cellular and collagen alignment in
the construct. In the cyclic stretch bioreactor, constructs were small strips, whereas in a
TEHV/MCL system bioreactor, the constructs would need to be the size and shape of
native aortic valve leaflets. This will provide a much more concrete comparison for the
studies, as a full-sized native leaflet will be compared to full-sized tissue engineered
leaflets, both statically cultured and cultured in the bioreactor.
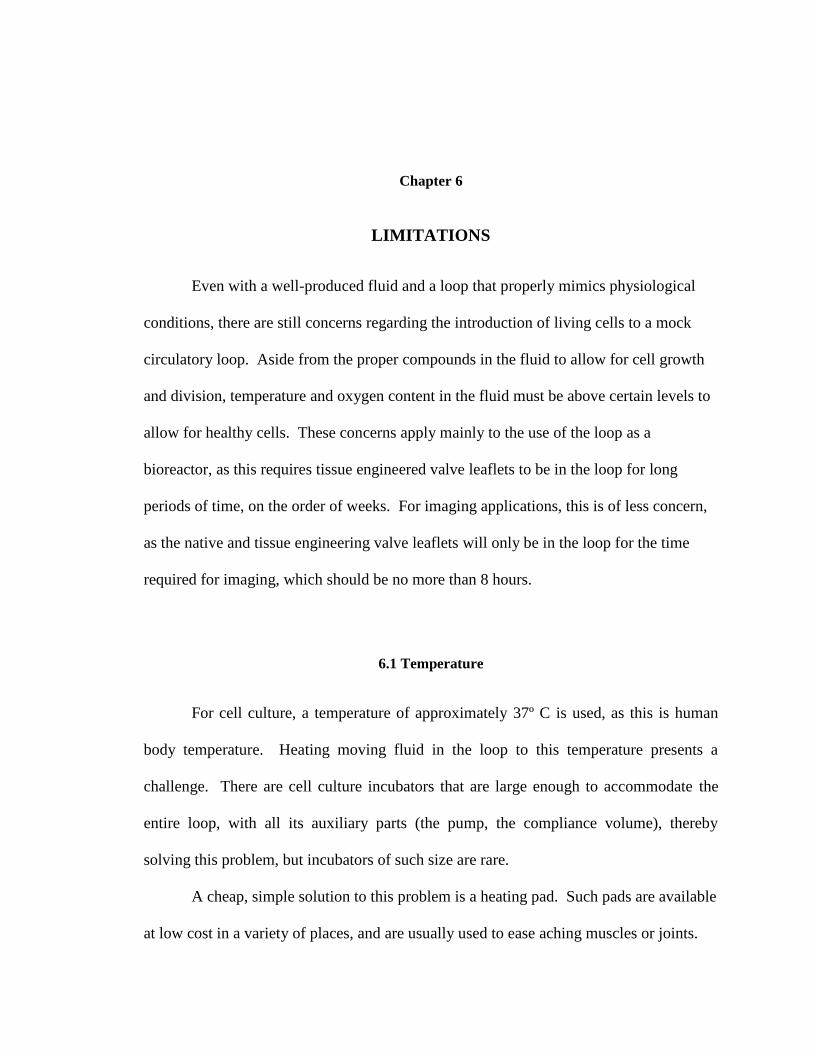
Chapter 6
LIMITATIONS
Even with a well-produced fluid and a loop that properly mimics physiological
conditions, there are still concerns regarding the introduction of living cells to a mock
circulatory loop. Aside from the proper compounds in the fluid to allow for cell growth
and division, temperature and oxygen content in the fluid must be above certain levels to
allow for healthy cells. These concerns apply mainly to the use of the loop as a
bioreactor, as this requires tissue engineered valve leaflets to be in the loop for long
periods of time, on the order of weeks. For imaging applications, this is of less concern,
as the native and tissue engineering valve leaflets will only be in the loop for the time
required for imaging, which should be no more than 8 hours.
6.1 Temperature
For cell culture, a temperature of approximately 37º C is used, as this is human
body temperature. Heating moving fluid in the loop to this temperature presents a
challenge. There are cell culture incubators that are large enough to accommodate the
entire loop, with all its auxiliary parts (the pump, the compliance volume), thereby
solving this problem, but incubators of such size are rare.
A cheap, simple solution to this problem is a heating pad. Such pads are available
at low cost in a variety of places, and are usually used to ease aching muscles or joints.
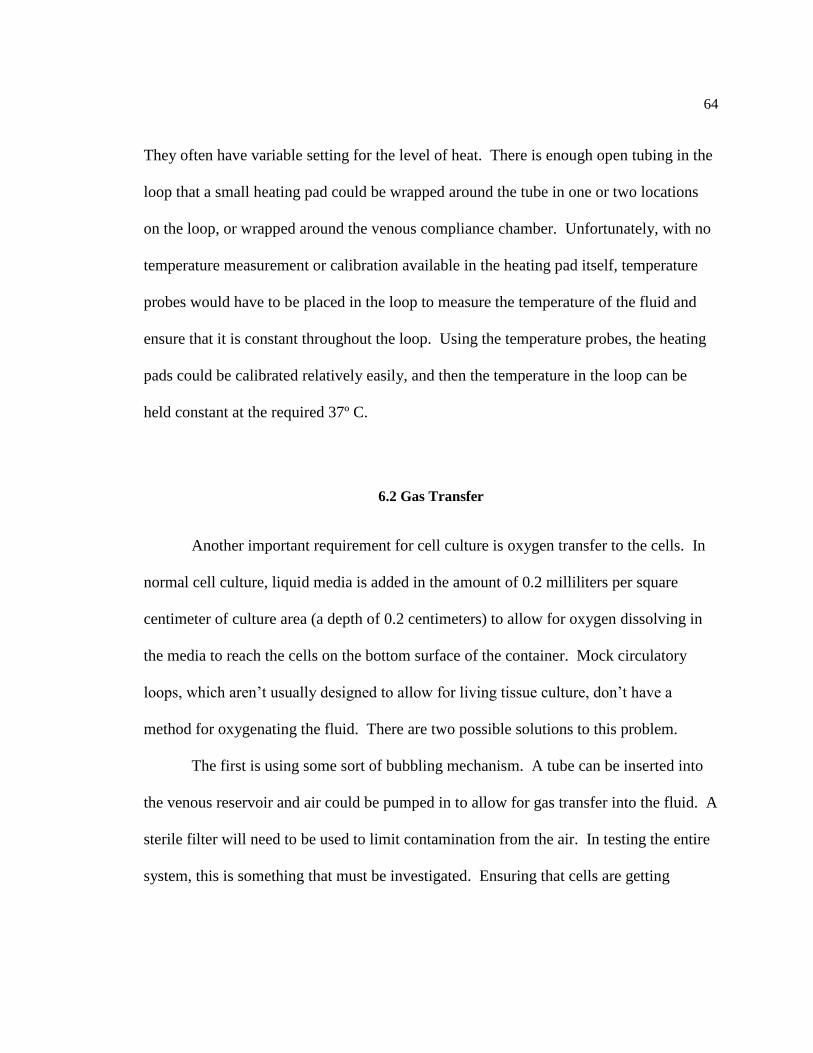
64
They often have variable setting for the level of heat. There is enough open tubing in the
loop that a small heating pad could be wrapped around the tube in one or two locations
on the loop, or wrapped around the venous compliance chamber. Unfortunately, with no
temperature measurement or calibration available in the heating pad itself, temperature
probes would have to be placed in the loop to measure the temperature of the fluid and
ensure that it is constant throughout the loop. Using the temperature probes, the heating
pads could be calibrated relatively easily, and then the temperature in the loop can be
held constant at the required 37º C.
6.2 Gas Transfer
Another important requirement for cell culture is oxygen transfer to the cells. In
normal cell culture, liquid media is added in the amount of 0.2 milliliters per square
centimeter of culture area (a depth of 0.2 centimeters) to allow for oxygen dissolving in
the media to reach the cells on the bottom surface of the container. Mock circulatory
loops, which aren’t usually designed to allow for living tissue culture, don’t have a
method for oxygenating the fluid. There are two possible solutions to this problem.
The first is using some sort of bubbling mechanism. A tube can be inserted into
the venous reservoir and air could be pumped in to allow for gas transfer into the fluid. A
sterile filter will need to be used to limit contamination from the air. In testing the entire
system, this is something that must be investigated. Ensuring that cells are getting

65
enough oxygen during bioreactor studies when they are in the loop for weeks at a time is
vital.
The second is using an oxygenator. Fluid oxygenators are being developed for
clinical use in patients with certain deficiencies that limit the amount of oxygen they can
carry in their blood. Something like this added to the system could be useful in
increasing oxygen content of the loop fluids and improving the health of the cells.
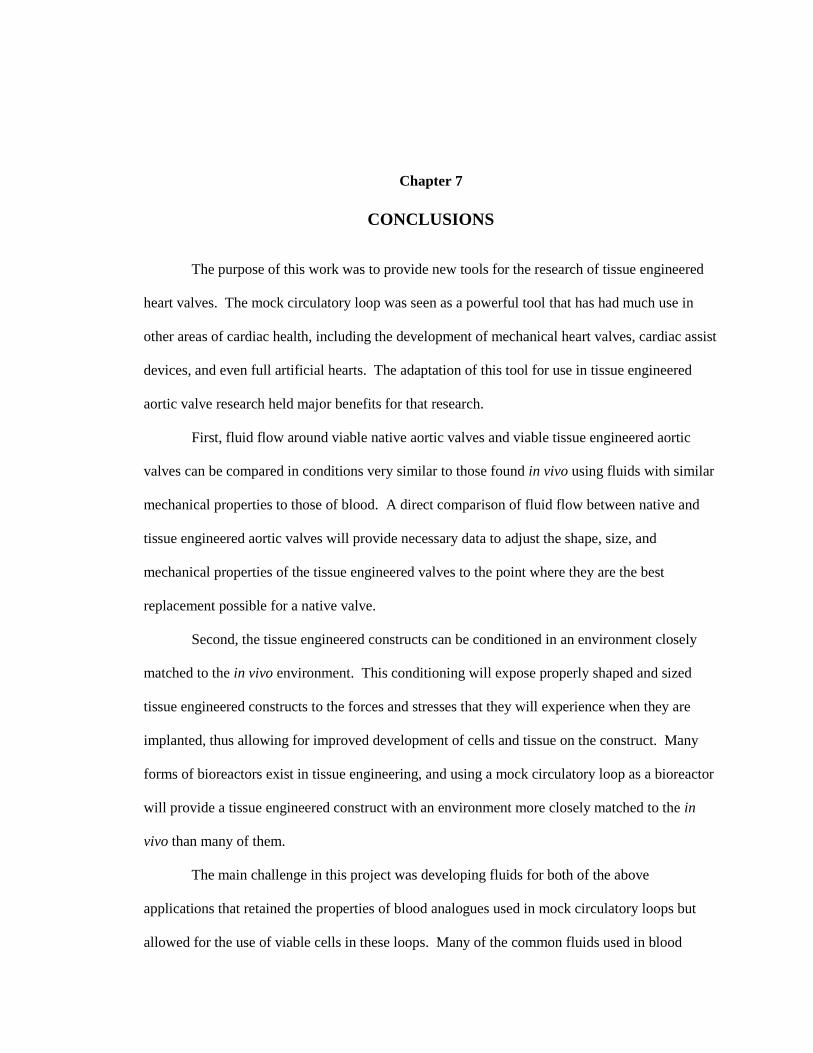
Chapter 7
CONCLUSIONS
The purpose of this work was to provide new tools for the research of tissue engineered
heart valves. The mock circulatory loop was seen as a powerful tool that has had much use in
other areas of cardiac health, including the development of mechanical heart valves, cardiac assist
devices, and even full artificial hearts. The adaptation of this tool for use in tissue engineered
aortic valve research held major benefits for that research.
First, fluid flow around viable native aortic valves and viable tissue engineered aortic
valves can be compared in conditions very similar to those found in vivo using fluids with similar
mechanical properties to those of blood. A direct comparison of fluid flow between native and
tissue engineered aortic valves will provide necessary data to adjust the shape, size, and
mechanical properties of the tissue engineered valves to the point where they are the best
replacement possible for a native valve.
Second, the tissue engineered constructs can be conditioned in an environment closely
matched to the in vivo environment. This conditioning will expose properly shaped and sized
tissue engineered constructs to the forces and stresses that they will experience when they are
implanted, thus allowing for improved development of cells and tissue on the construct. Many
forms of bioreactors exist in tissue engineering, and using a mock circulatory loop as a bioreactor
will provide a tissue engineered construct with an environment more closely matched to the in
vivo than many of them.
The main challenge in this project was developing fluids for both of the above
applications that retained the properties of blood analogues used in mock circulatory loops but
allowed for the use of viable cells in these loops. Many of the common fluids used in blood

67
analogues are not cell safe, or do not provide the necessary nutrients for long-term cell culture.
The development of new, cell safe blood analogues that can still be used in fluid flow imaging (a
standard use of a mock circulatory loop) and can also be applied to long term bioreactor cell
culture (a new use of a mock circulatory loop) has closed the gap between construct development
and clinical implantation.
BIBLIOGRAPHY
1. Veronique LR, et al. AHA Statistical Update: Heart Disease and Stroke Statistics—2012
Update. Circulation 2012;125: e2.
2. Smith CR, Leon MB, Mack MJ, Miller DC, Moses JW, Svensson LG, Tuzcu EM, Webb
JG, Fontana GP, Makkar RR, Williams M, Dewey T, Kapadia S, Babaliaros V, Thourani
VH, Corso P, Pichard AD, Bavaria JE, Herrmann HC, Akin JJ, Anderson WN, Wang D,
Pocock SJ. Transcatheter Versus Surgical Aortic-Valve Replacement in High-Risk
Patients. N Engl J Med 2011;364(23): 2187.
3. Ferencz C, Boughman JA. Congenital Heart Disease in Adolescents and Adults.
Teratology, Genetics, and Recurrence Risks. Cardiol Clin 1993;11(4): 557.
4. Loffredo CA. Epidemiology of Cardiovascular Malformations: Prevalence and Risk
Factors. Am J Med Genet 2000;97(4):319.
5. Tzemos N, Therrien J, Yip J, Thanassoulis G, Tremblay S, Jamorski MT, Webb GD, Siu
SC. Outcomes in Adults with Bicuspid Aortic Valves. JAMA. 2008;300(11): 1317.
6. Sundt TM. Aortic Valve. www.sts.org
7. Rabkin-Aikawa E, Aikawa M, Farber M, Kratz JR, Garcia-Cardena G, Kouchoukos NT,
et al. Clinical pulmonary autograft valves: pathologic evidence of adaptive remodeling in
the aortic site. JThoracCardiovascSurg. 2004;128:552.
8. Mendelson K, Schoen FJ. Heart Valve Tissue Engineering: Concepts, Approaches,
Progress, and Challenges. Ann Biomed Eng 2006;34(12): 1799.
9. Hammermeister K, Sethi GK, Henderson WG, Grover FL, Oprian C, Rahimtoola SH.
Outcomes 15 Years After Valve Replacement with a Mechanical Versus a Bioprosthetic
Valve: Final Report of the Veterans Affairs Randomized Trial. J Am Coll Cardiol
2000;36(4): 1152.
10. Jamieson WR, von Lipinski O, Miyagishima RT, Burr LH, Janusz MT, Ling H, Fradet
GJ, Chan F, Germann E. Performance of Bioprostheses and Mechanical Prostheses
Assessed by Composites of Valve-Related Complications to 15 Years After Mitral Valve
Replacement. J Thorac Cardiovasc Surg 2005;129(6): 1301.
11. Tochii M, Takagi Y, Kaneko K, Ishida M, Akita K, Higushi Y, Ando M. Excellent
Durability of Starr-Edwards Ball Valves Implanted in the Aortic and Mitral Positions for
27 Years: Report of Rare Surgical Case. Ann Thorac Cardiovasc Surg 2012. epub ahead
of print 15 Jun.
12. Petit CJ, Maskatia SA, Justino H, Mattamal RJ, Crystal MA, Ing FF. Repeat Balloon
Aortic Valvuloplasy Effectively Delays Surgical Intervention in Children with Recurrent
Aortic Stenosis. Catheter Cardiovasc Interv 2012. epub ahead of print 19 Jul.
13. Jindal RC, Saxena A, Juneja R, Kothari SS, Shrivastava S. Long-Term Results of Balloon
Aortic Valvulotomy for Congenital Aortic Stenosis in Children and Adolescents. J Heart
Valve Dis 2000;9(5): 623.
14. Schaff HV. Transcatheter Aortic-Valve Implantation—at what Price? N Engl J Med
2011;364(23):2256.
15. Langer R, Vancanti JP. Tissue Engineering. Science. 1993;260(5110): 920.
69
16. Martinez C, Rath S, Van Gulden S, Pelaez D, Alfonso A, Fernandez N, Kos L, Cheung
H, Ramaswamy S. Periodontal Ligament Cells Cultured Under Steady Flow
Environments Demonstrate Potential for Use in Heart Valve Tissue Engineering. Tissue
Eng Part A 2012. epub ahead of print 8 Sept.
17. Weymann A, Schmack B, Okada T, Soós P, Istók R, Radovits T, Straub B, Barnucz
E, Loganathan S, Pätzold I, Chaimow N, Schies C, Korkmaz S, Tochtermann U, Karck
M, Szabó G. Reendothelialization of Human Heart Valve Neoscaffolds Using Umbilical
Cord-Derived Endothelial Cells. Circ J 2012. epub ahead of print 21 Sept.
18. Silverthorn, DU. Human Physiology: An Integrated Approach 4th Edition. Copyright
2007 Pearson Education, Inc.
19. Mackie BD, Ali YS. Aortic Valve Anatomy. Medscape Reference
emedicin.medscape.com Updated Jun 27, 2011.
20. Pomahac B, Svensjo F, Yao F, Brown H, Eriksson E. Tissue Engineering of Skin.
CROBM. 1998;9:333.
21. Catapano G, Gerlach JC. Bioreactors for Liver Tissue Engineering. Topics in Tissue
Engineering, Vol. 3. 2007. Eds. N Ashammakhi, R Reis, E Chiellini.
22. Hutmacher DW. Scaffolds in Tissue Engineering Bone and Cartilage. Biomaterials.
2000;21:2529.
23. Oberpenning F, Meng J, Yoo JJ, Atala A. De Novo Reconstitution of a Functional
Mammalian Urinary Bladder by Tissue Engineering. Nature Biotechnology. 1998;17:
149.
24. Bryant SJ, Anseth KS. Controlling the Spatial Distribution of ECM Components in
Degradable PEG Hydrogels for Tissue Engineering Cartilage. J Biomed Mater Res A.
2002;64(1): 70.
25. Hufnagel CA. Aortic Plastic Valvular Prosthesis. Bull Georgetown Univ Med Center
1951;5: 128.
26. Starr A, Edwards ML. Mitral replacement: clinical experience with a ball-valve
prosthesis. Annals of Surgery 1961;154:726.
27. Harken DE, Taylor WJ, Lefemine AA, Lunzer S, Low HB, Cohen ML, et al. Aortic valve
replacement with a caged ball valve. The Am J of Cardio. 1962;9:292.
28. Bjork VO. A New Tilting-Disc Valve Prosthesis. Scand J Thorac Cardiovasc Surg.
1969;60:48.
29. Emery RW, Mettler E, Nicoloff DM. A New Cardiac Prosthesis: The St. Jude Medical
Cardiac Valve: In Vivo Results. Circulation 1979;60: 48.
30. Starr A. A Cherry Blossom Moment in the History of Heart Valve Replacement. J
Thorac Cardiovasc Surg 2010;140: 1226.
31. Mitchell RN, Jonas RA, Schoen FJ. Pathology of Explanted Cryopreserved Allograft
Heart Valves: Comparison with Aortic Valves from Orthopedic Heart Transplants. J
Thorac Carciovasc Surg 1998;115: 118.
32. Shinoka T, Breuer CK, Tanel RE, Zund G, Miura T, Ma PX, Langer R, Vacanti JP,
Mayer, Jr. JE. Tissue Engineering Heart Valves: Valve Leaflet Replacement Study in a
Lamb Model. Ann Throac Surg 1995;60(3): S513.

70
33. Breuer CK, Shinoka T, Tanel RE, Zund G, Mooney DJ, Ma PX, Miura T, Colan S,
Langer R, Mayer JE, Vacanti JP. Tissue Engineering Lamb Heart Valve Leaflets.
Biotechnol Bioeng 1996;50(5): 562.
34. Hopkins RA, Bert AA, Hilbert SL, Quinn RW, Brasky KM, Drake WB, Lofland GK.
Bioengineered Human and Allogeneic Pulmonary Valve Conduits Chronically Implanted
Orthotopically in Baboons: Hemodynamic Performance and Immunologic Consequences.
J Thorac Cardiovasc Surg 2012. epub ahead of print 25 Jul.
35. Dijkman PE, Driessen-Mol A, Frese L, Hoerstrup SP, Baaijens FP. Decellularized
Homologous Tissue-Engineered Heart Valves as Off-the-Shelf Alternatives to Xeno- and
Homografts. Biomaterials 2012;33: 4545.
36. Sant S, Hwang CM, Lee SH, Khademhosseini A. Hybrid PGS-PCL Microfibrous
Scaffolds with Improved Mechanical and Biological Properties. J Tissue Eng Regen Med
2011;5: 283.
37. Engelmayr, Jr. GC, Sacks MS. Prediction of Extracellular Matrix Stiffness in Engineered
Heart Valve Tissues Based on Nonwoven Scaffolds. Biomech Model Mechanobio
2008;7: 309.
38. Masoumi N, Jean A, Zugates JT, Johnson KL, Engelmayr, Jr. GC. Laser Microfabricated
Poly(Glycerol Sebacate) Scaffolds for Heart Valve Tissue Engineering. J Biomed Mater
Res 2012. epub ahead of print.
39. Ye Q, Zund G, Jockenhoevel S, Hoerstrup SP, Schoeberlein A, Grunenfelder J, Turina
M. Tissue Engineering in Cardiovascular Surgery: New Approach to Develop
Completely Human Autologous Tissue. Eur J Cardiothorac Surg 2000;17(4): 449.
40. McAllister TN, Dusserre N, Chronos N, L’Heureux N. A Completely Biological, Tissue
Engineered Valve Leaflet Suitable for TAVI. QScience Proceedings: Vol. 2012, Heart
Valve Biology and Tis Eng, 83.
41. Hoerstrup SP, Sodian R, Daebritz S, Wang J, Bacha EA, Martin DP, Moran AM,
Guleserian KJ, Sperling JS, Kaushal S, Vacanti JP, Schoen FJ, Mayer, Jr. JE. Functional
Living Trileaflet Heart Valves Grown in Vitro. Circulation 2000;102(19 Suppl 3): III44.
42. Jordan JE, Williams JK, Lee SJ, Raghavan D, Atala A, Yoo JJ. Bioengineered Self-
Seeding Heart Valves. J Thorac Cardiovasc Surg 2012;243: 201.
43. Colazzo F, Sarathchandra P, Smolenski RT, Chester AH, Tseng YT, Czernuszka JT,
Yacoub MH, Taylor PM. Extracellular Matrix Production by Adipose-Derived Stem
Cells: Implications of Heart Valve Tissue Engineering. Biomaterials 2011;32(1): 119.
44. Vacanti JP, Langer R. Tissue Engineering: The Design and Fabrication of Living
Replacement Devices for Surgical Reconstruction and Transplantation. Lancet
1999;354(Suppl 1): SI32.
45. Gandaglia A, Bagno A, Naso F, Spina M, Gerosa G. Cells, Scaffolds, and Bioreactors for
Tissue-Engineering Heart Valves: A Journey from Basic Concepts to Contemporary
Developmental Innovations. Eur J Carcio Thorac Surg 2011;39: 523
46. Wang Y, Ameer GA, Sheppard BJ, Langer R. A Tough Biodegradable Elastomer. Nature
Biotech 2002;20:602.
47. Khademhosseini A, Vacanti JP, Langer R. Progress in Tissue Engineering. Scientific
American 2009;May.
71
48. Eskin SG, Navarro LT, O’Bannon W, DeBakey ME. Behavior of Endothelial Cells
Cultured on Silastic and Dacron Velour Under Flow Conditions In Vitro: Implications for
Prelining Vascular Grafts with Cells. Arificial Organs 1983;7(1): 31.
49. Liu Y, Allaire P, Wood H, Olsen D. Design and Initial Testing of a Mock Human
Circulatory Loop for Left Ventricular Assist Device Performance Testing. Artificial
Organs 2005;29(4): 341.
50. Deutsch S, Tarbell JM, Manning KB, Rosenberg G, Fontaine AA. Experimental Fluid
Mechanics of Pulsatile Artificial Blood Pumps. Ann Rev Fluid Mech 2006;38: 65
51. Timms DL, Gregory SD, Greatrex NA, Pearcy MJ, Fraser JF, Steinseifer U. A Compact
Mock Circulation Loop for the In Vitro Testing of Cardiovascular Devices. Artificial
Organs 2010;35(4):384.
52. Walker AR. In Vitro Evaluation of Mechanical Heart Valve Performance Using a Novel
Test Chamber in an Automated Mock Circulatory Loop. Master’s Thesis, Virginia
Commonwealth University, 2010.
53. Yin W, Ngwe EC, Rubenstein DA. A Biocompatible Flow Chamber to Study the
Hemodynamic Performance of Prosthetic Heart Valves. ASAIO Journal 2012;58(5): 470
54. Rosenberg G, Phillips WM, Landis D, Pierce WS. Design and Evaluation of the
Pennsylvania State University Mock Circulatory System. ASAIO Journal 1981;4: 41.
55. Brookshier KA, Tarbell JM. Evaluation of a Transport Blood Analog Fluid: Aqueous
Xanthan Gum/Glycerin. Biorheology 1993;30(2): 107.
56. Hochareon P, Manning KB, Fontaine AA, Deutsch S, Tarbell JM. Diaphragm Motion
Affects Flow Patterns in an Artificial Heart. Artif Organs 2003;27(12): 1102.
57. Budwig R. Refractive Index Matching Methods for Liquid Flow Investigations.
Experiments in Fluids 1994;17: 350
58. Radisic M, Yang L, Boublik J, Cohen RJ, Langer R, Freed LE, Vunjak-Novakovic, G.
Medium Perfusion Enables Engineering of Compact and Contractile Cardiac Tissue. Am
J Physiol Heart Circ Physiol 2004;286(2): H507
59. Buskohl PR, Jenkins JT, Butcher JT. Computational Simulation of Hemodynamic-Driven
Growth and Remodeling of Embryonic Atrioventricular Valves. Biomech Model
Mechanobiol 2012. epub ahead of print 7 Aug.
60. Engelmayr, Jr. GC, Soletti L, Vigmostad SC, Budilarto SG, Federspiel WJ, Chandran
KB, Vorp DA, Sacks MS. A Novel Flex-Stretch-Flow Bioreactor for the Study of
Engineered Heart Valve Tissue Mechanobiology. Ann Biomed Eng 2008;36(5): 700.
61. Lukic B, Zapanta CM, Griffith KA, Weiss WJ. Effect of the Diastolic and Systolic
Duration on Valve Cavitation in a Pediatric Pulsatile Ventricular Assist Device. ASAIO J
2005;51(5): 546.
62. Altman PL, Dittmer DS. Respiration and Circulation. DTIC Document 1971. Accession
number: AD0718358.
63. Morgan JF, Campbell ME, Morton HJ. The nutrition of animal tissues cultivated in vitro.
I. A survey of natural materials as supplements to synthetic medium 199. J Natl Cancer
Inst 1955;16(2): 557.
64. Chakrabarti R, Schutt CE. The Enhancement of PCR Amplification by Low Molecular-
Weight Sulfones. Gene 2001;274(1-2): 293.
72
65. Pegg DE. Day JG, Stacey GN. ed. Principles of Cryopreservation 2nd
Edition. Copyright
2007 Humana Press.
66. Smagur A, Mitrus I, Giebel S, Sadus-Wojciechowska M, Najda J, Kruzel T, Czerw T,
Gliwinska J, Prokop M, Glowala-Kosinska M, Chwieduk A, Holowiecki J. Impact of
Different Dimethyl Sulphoxide Concentrations on Cell Recovery, Viability, and
Clonogenic Potential of Cryopreserved Peripheral Blood Hematopoietic Stem and
Progenitor Cells. Vox Sang 2012. epub ahead of print 9 Oct.
67. Li L, Gong H, Yu H, Liu X, Liu Q, Yan G, Zhang Y, Lu H, Zou Y, Yang P. Kockdown
of Nucleosome Assembly Protein 1-like 1 Promotes Dimethyl Sulfoxide-Induced
Differentiation of P19CL6 Cells into Cardiomyocytes. J Cell Biochem 2012;113(12):
3788.
68. Sun JZ, Erickson MC, Parr JW. Refractive Index Matching and Clear Emulsions. J
Cosmet Sci 2005;56(4): 253.
69. Johnson CM, Hanson MN, Helgeson SC. Porcine Cardiac Valvular Subendothelial Cells
in Culture: Cell Isolation and Growth Characteristics. J Molec Cell Cardio 1987;19(12):
1185.
70. Bellhouse BJ, Talbot L. The Fluid Mechanics of the Aortic Valve. J Fluid Mech
1969;35(4): 721.
71. Taylor PM, Batten P, Brand NJ, Thomas PS, Yacoub MH. The Cardiac Valve Interstitial
Cell. Int J Biochem Cell Bio 2003;35(2): 113.