adaptive information integration subbarao kambhampati thanks to zaiqing nie, ullas nambiar &...
Post on 21-Dec-2015
216 views
TRANSCRIPT

Adaptive Information Integration
Subbarao Kambhampati
http://rakaposhi.eas.asu.edu/i3
Thanks to Zaiqing Nie, Ullas Nambiar & Thomas Hernandez
Talk at USC/Information Sciences Institute; November 5th 2004.

Yochan Research Group
Plan-Yochan• Automated Planning
– Temporal planning• Multi-objective optimization• Partial satisfaction planning
– Conditional/Conformant/Stoch-astic planning• Heuristics using labeled planning
graphs
– OR approaches to planning– Applications to
• Autonomic computing, • Web service composition, • Workflows
Db-Yochan• Information Integration
– Adaptive Information Integration
• Learning source profiles• Learning user interests
– Applications to• Bio-informatics• Anthropological sources
– Service and Sensor Integration

Executor
Query plannerMulti-objective
AnytimeHandle services,Sensors (streams)
Source CatalogOntologies;
statistics
LearnedStatistics
AnnotatedPlan Replanning
Requests
Utility
Metr
icQuery
Answers
Probing Queries
Sour
ce C
alls
Monitor
Updating Statistics
Services
Webpages
Structureddata
Sensors(streamingData)Our focus:
Query Processing
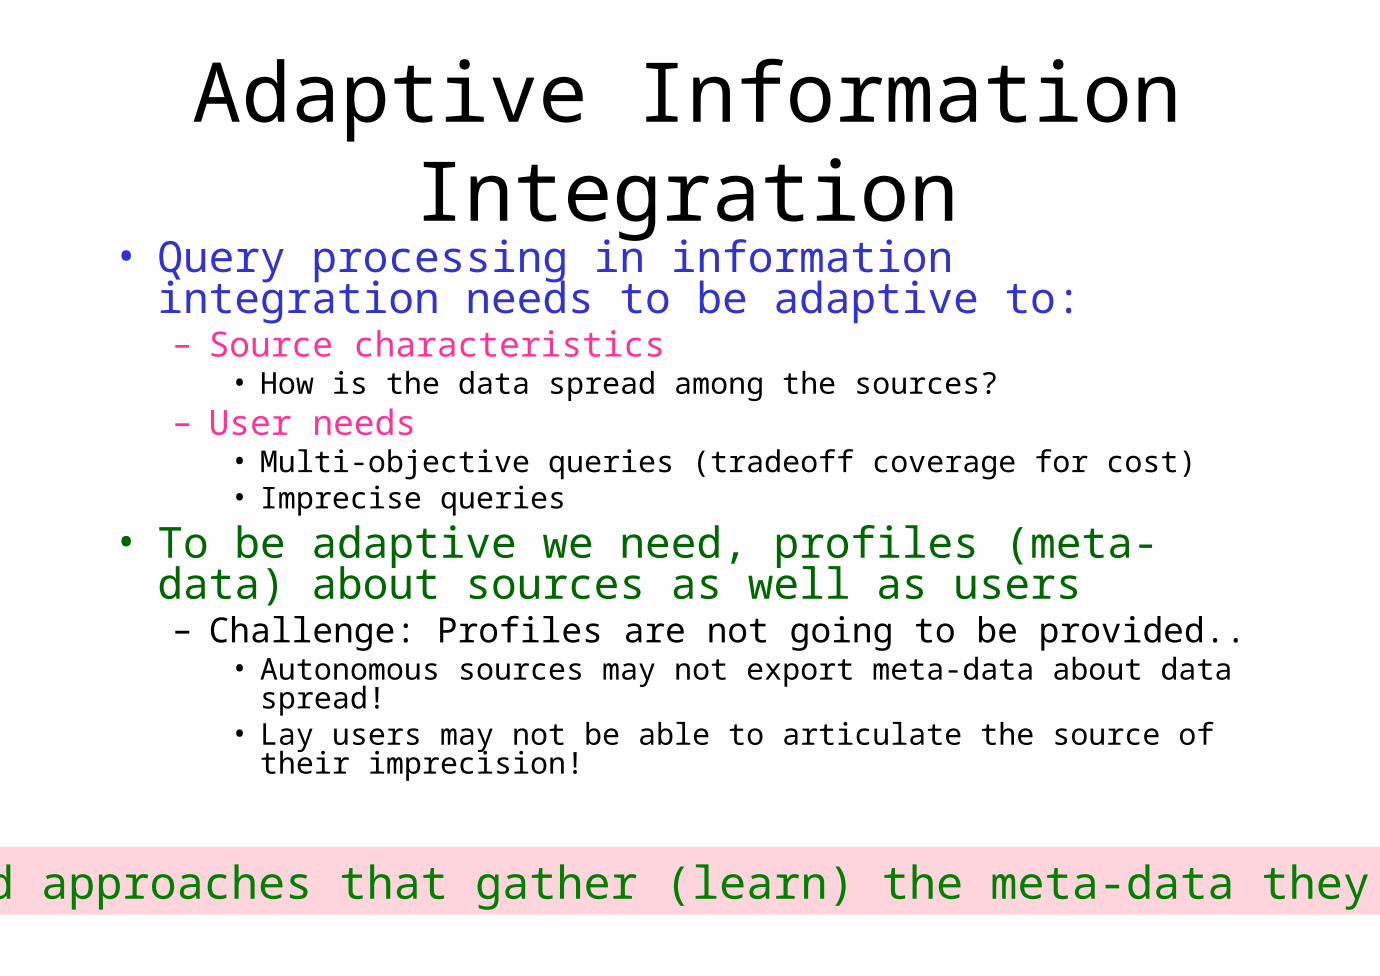
Adaptive Information Integration• Query processing in information integration needs to
be adaptive to:– Source characteristics
• How is the data spread among the sources?– User needs
• Multi-objective queries (tradeoff coverage for cost)• Imprecise queries
• To be adaptive we need, profiles (meta-data) about sources as well as users – Challenge: Profiles are not going to be provided..
• Autonomous sources may not export meta-data about data spread!• Lay users may not be able to articulate the source of their imprecision!
Need approaches that gather (learn) the meta-data they need

Three contributions to Adaptive Information Integration
• BibFinder /Statminer– Learns and uses source coverage and overlap statistics to
support multi-objective query processing• [VLDB 2003; ICDE 2004; TKDE 2005]
• COSCO– Adapts the Coverage/Overlap statistics to text collection
selection
• – Supports imprecise queries by automatically learning
approximate structural relations among data tuples• [WebDB 2004; WWW 2004]
Although we focus on avoiding retrieval of duplicates,Coverage/Overlap statistics can also be used to look for duplicates

Adaptive Integration of Heterogeneous Power Point Slides
A Frequency-Based Approach for Mining Coverage Statistics in Data Integration
Zaiqing Nie
SubbaraoKambhampati
ICDE 2004
Mining Approximate Functional Dependencies &
Concept Similarities to Answer Imprecise Queries
Ullas Nambiar Subbarao Kambhampati
Dept of CS & EnggArizona State University
http:/ / rakaposhi.eas.asu.edu/ i3/
WebDB, June 17-18 2004, Paris, France
Arizona State University
Improving Text Collection Selection using Coverage and Overlap Statistics
MS Thesis Defense10/21/2004
By Thomas Hernandez
Executor
Query plannerMulti-objective
AnytimeHandle services,Sensors (streams)
Source CatalogOntologies;
statistics
LearnedStatistics
AnnotatedPlan Replanning
Requests
Utility
Metr
icQuery
Answers
ProbingQueries
Sour
ce C
alls
Monitor
Updating Statistics
Different template “schemas”Different Font StylesNaïve “concatenation” approaches don’t work!

Part I: BibFinder
• BibFinder: A popular CS bibliographic mediator– Integrating 8 online sources: DBLP, ACM DL, ACM Guide, IEEE Xplore,
ScienceDirect, Network Bibliography, CSB, CiteSeer– More than 58000 real user queries collected
• Mediated schema relation in BibFinder: paper(title, author, conference/journal, year)
Primary key: title+author+year
• Focus on Selection queriesQ(title, author, year) :- paper(title, author, conference/journal, year), conference=SIGMOD


Background & Motivation• Sources are incomplete and partially overlapping
• Calling every possible source is inefficient and impolite
• Need coverage and overlap statistics to figure out what sources are most relevant for every possible query!
Coverage: probability that a random answertuple for query Q belongs to source S.Noted as P(S|Q).
Overlap: Degree to which sources containthe same answer tuples for query Q.Noted as P(S1 ̂S2 ̂… ̂Sk |Q).
DBLP
CSB
ACMDL
• We introduce a frequency-based approach for mining these statistics
)|(
)|(),|(
QDBLPCSBP
QDBLPPCSBQDBLPP
Challenges
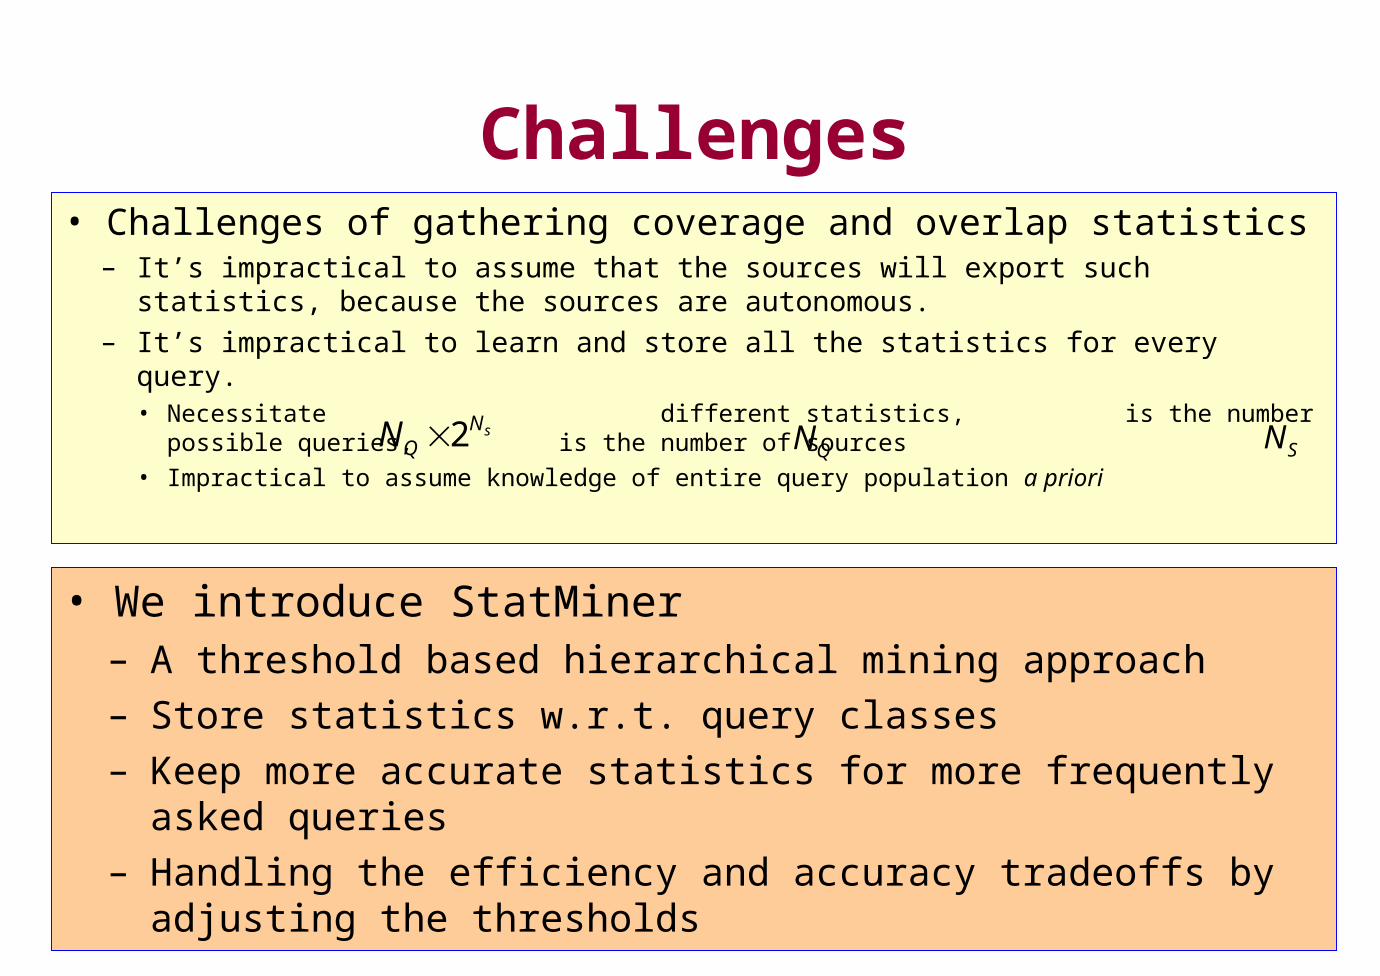
• We introduce StatMiner– A threshold based hierarchical mining approach
– Store statistics w.r.t. query classes
– Keep more accurate statistics for more frequently asked queries
– Handling the efficiency and accuracy tradeoffs by adjusting the thresholds
• Challenges of gathering coverage and overlap statistics– It’s impractical to assume that the sources will export such statistics, because
the sources are autonomous. – It’s impractical to learn and store all the statistics for every query.
• Necessitate different statistics, is the number possible queries, is the number of sources
• Impractical to assume knowledge of entire query population a priori
SNsNQN 2
QN

BibFinder/StatMiner
Citeseer
LearnAV
Hierarchies
CSB DBLPACMDL
Netbib
ScienceDirect
DiscoverFrequent
QueryClasses
LearnCoverage
and Overlap
Statistics
Query List
UserQuery
AnswerTuples

Query List & Raw StatisticsQuery Frequency Distinctive
Answers
Overlap (Coverage)
DBLP 35
CSB 23
CSB, DBLP 12
DBLP, Science 3
Science 3
CSB, DBLP, Science 1
Author=”andy king” 106 46
CSB, Science 1
CSB 16
DBLP 16
CSB, DBLP 7
ACMdl 5
ACMdl, CSB 3
ACMdl, DBLP 3
ACMdl, CSB, DBLP 2
Author=”fayyad”
Title=”data mining”
1 27
Science 1
Query List: the mediator maintains anXML log of all user queries, along withtheir access frequency, number oftotal distinct answers obtained, andnumber of answers from each sourceset which has answers for the query.
Given the query list, we can compute the raw statistics for each query: P(S1..Sk|q)

AV Hierarchies and Query Classes
RT
2001 2002
AV Hierarchy for the Year Attribute
AI
SIGMOD ICDE AAAI ECP
RT
DB
AV Hierarchy for the Conference Attribute
RT,02 AI,RT
SIGMOD,RT ICDE,RT DB,02 AAAI,RT AI,01 ECP,RT
RT,01
SIGMOD01 ICDE02ICDE01 AAAI01
DB,01
ECP01
RT,RT
DB,RT
Query Class Hierarchy
Query Class: queries are grouped intoclasses by computing cartesianproducts over the AV Hierarchies.A query class is a set of queries thatall share a set of assignments ofparticular attributes to specific values.
Attribute-Value Hierarchy:An AV Hierarchy is a classification ofthe values of a particular attribute ofthe mediator relation. Leaf nodes inthe hierarchy correspond to concretevalues bound in a query.

StatMiner
Attribute values are extracted from thequery list.
Clustering similar attribute values leadsto finding similar selection queries basedon the similarity of their answerdistributions over the sources.
The AV Hierarchies are generated usingan agglomerative hierarchical clusteringalgorithm.
They are then flattened according totheir tightness.
Learning AV Hierarchies
Candidate frequent queryclasses are identified using theanti-monotone property.
Classes which are infrequentlymapped are then removed.
Discovering FrequentQuery Classes
i
ii QSPQSPQQd 2)]2|ˆ()1|ˆ([)2,1(
C2
A2A1
C2
A3
C1 A3
A1 A2
D(C1,C2) <=1/tightness(C1)
Flattened AV Hierarchy
Coverage and overlap statisticsare computed for each frequentquery class using a modifiedApriori algorithm.
Learning Coverage and Overlap
),()(
)(1
)(CQd
CP
QPCtightness
CQ
)(
)()|ˆ()|ˆ(
CP
QPQSPCSP CQ
Raw Stats

Using Coverage and Overlap Statistics to Rank Sources
1. A new user query is mapped to a set of leastgeneral query classes.
2. The mediator estimates the statistics for thequery using a weighted sum of the statistics ofthe mapped classes.
3. Data sources are ranked and called in order ofrelevance using the estimated statistics.In particular:
- The most relevant source has highestcoverage
- The next best source has highest residualcoverage
As a result, the maximum number of tuples areobtained while the least number of sources arecalled.
DBLP
CSB
ACMDL
Example:Here, CSB has highest coverage,followed by DBLP. However, sinceACMDL has higher residual coveragethan DBLP, the top 2 sources thatwould be called are CSB and ACMDL.
)|(
)|(),|(
QDBLPCSBP
QDBLPPCSBQDBLPP

BibFinder/StatMiner Evaluation
Purpose of the experiments: Analysis of space consumption Estimation of the accuracy of the learned statistics Evaluation of the effectiveness of those statistics in
BibFinder.
Query planning algorithms used in the experiments:- Random Select (RS): without any stats.- Simple Greedy (SG): only coverage stats.- Greedy Select (GS): coverage and overlap stats.
Precision of a plan: fraction of sources in theestimated plan which are the actual top sources.
Experimental setup with BibFinder:
•Mediator relation: Paper(title,author,conference/journal,year)•25000 real user queries are used. Among them 4500 queries are randomly chosen as test queries. • AV Hierarchies for all of the four attributes are learned automatically. • 8000 distinct values in author, 1200 frequent asked keywords itemsets in title, 600 distinct values in conference/journal, and 95 distinct values in year.

Learned Conference Hierarchy

Plan Precision
• Here we observe the average precision of the top-2 source plans
• The plans using our learned statistics have high precision compared to random select, and it decreases very slowly as we change the minfreq and minoverlap threshold.
0.4
0.5
0.6
0.7
0.8
0.9
1
0.03 0.13 0.23 0.33 0.43 0.53 0.63 0.73minfreq(%)
prec
isio
n
RS
SG0
GS0
SG0.3
GS0.3
Fraction of true top-K sources called

Number of Distinct Results
• Here we observe the average number of distinct results of top-2 source plans.
• Our methods gets on average 50 distinct answers, while random search gets only about 30 answers.28
33
38
43
48
53
0.03 0.13 0.23 0.33 0.43 0.53 0.63 0.73minfreq(%)
Nu
mb
er o
f d
isti
nct
an
swer
s
RSSG0GS0SG0.3GS0.3

Plan Precision on Controlled Sources
0
0.1
0.2
0.3
0.4
0.5
0.6
0.7
0.8
0.9
1
0 0.25 0.5 0.75 1 1.25 1.5 1.75 2 2.25
Threshold(%)
Pre
cis
ion
Greedy Select Simple Greedy Random Select
We observer the plan precision of top-5 source plans (totally 25 simulated sources). Using greedy select do produce better plans. See Section 3.8 and Section 3.9 for detailed information
Towards Multi-Objective Query Optimization (Or What good is a high coverage source
that is off-line?)
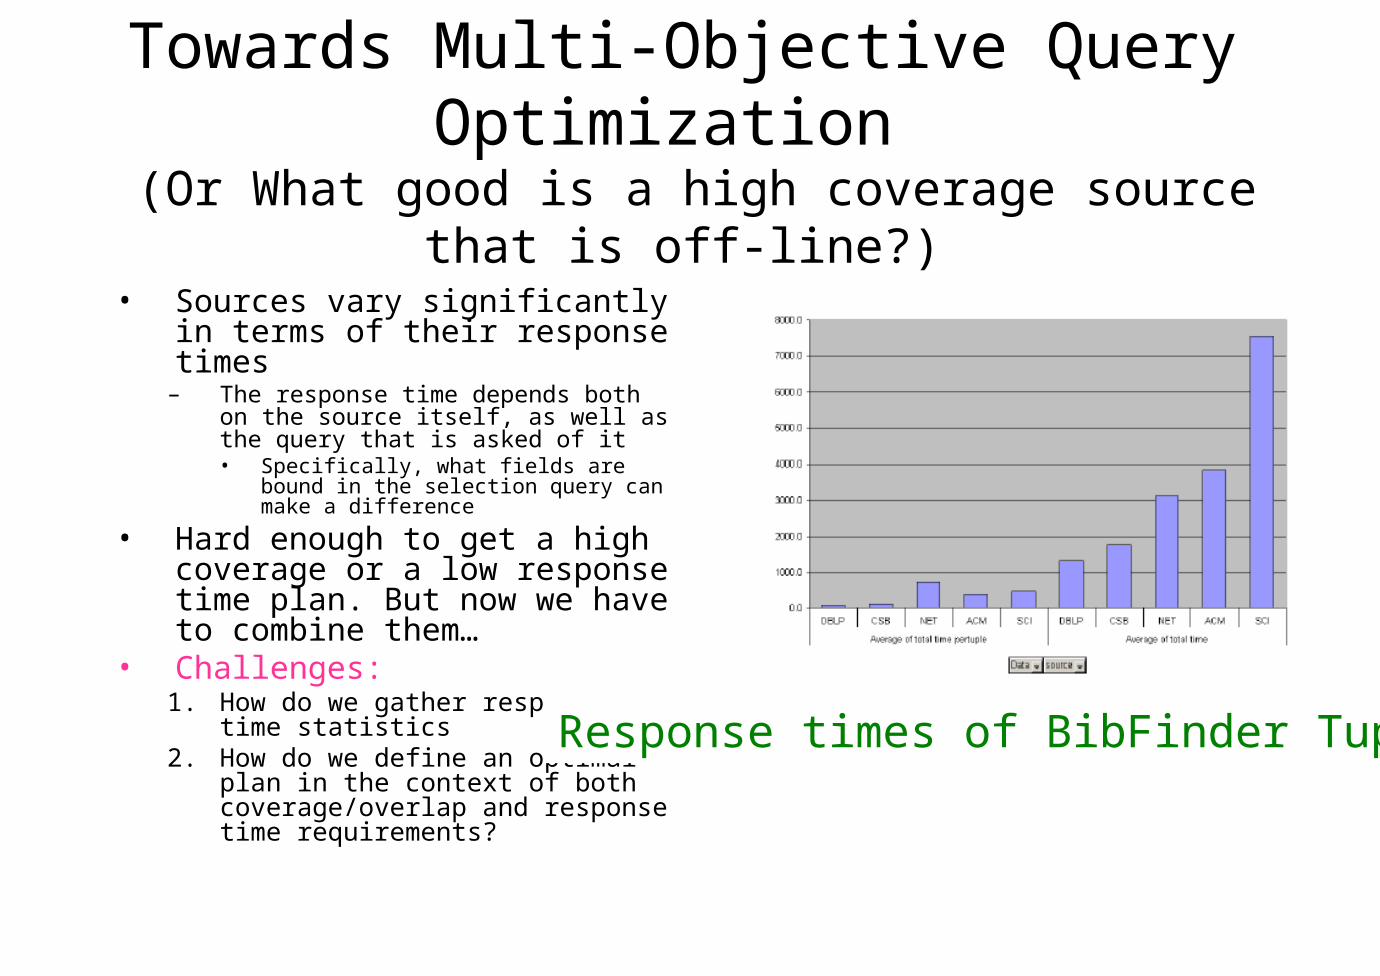
• Sources vary significantly in terms of their response times
– The response time depends both on the source itself, as well as the query that is asked of it• Specifically, what fields are bound in
the selection query can make a difference
• Hard enough to get a high coverage or a low response time plan. But now we have to combine them…
• Challenges:1. How do we gather response time
statistics 2. How do we define an optimal plan in
the context of both coverage/overlap and response time requirements?
Response times of BibFinder Tuples
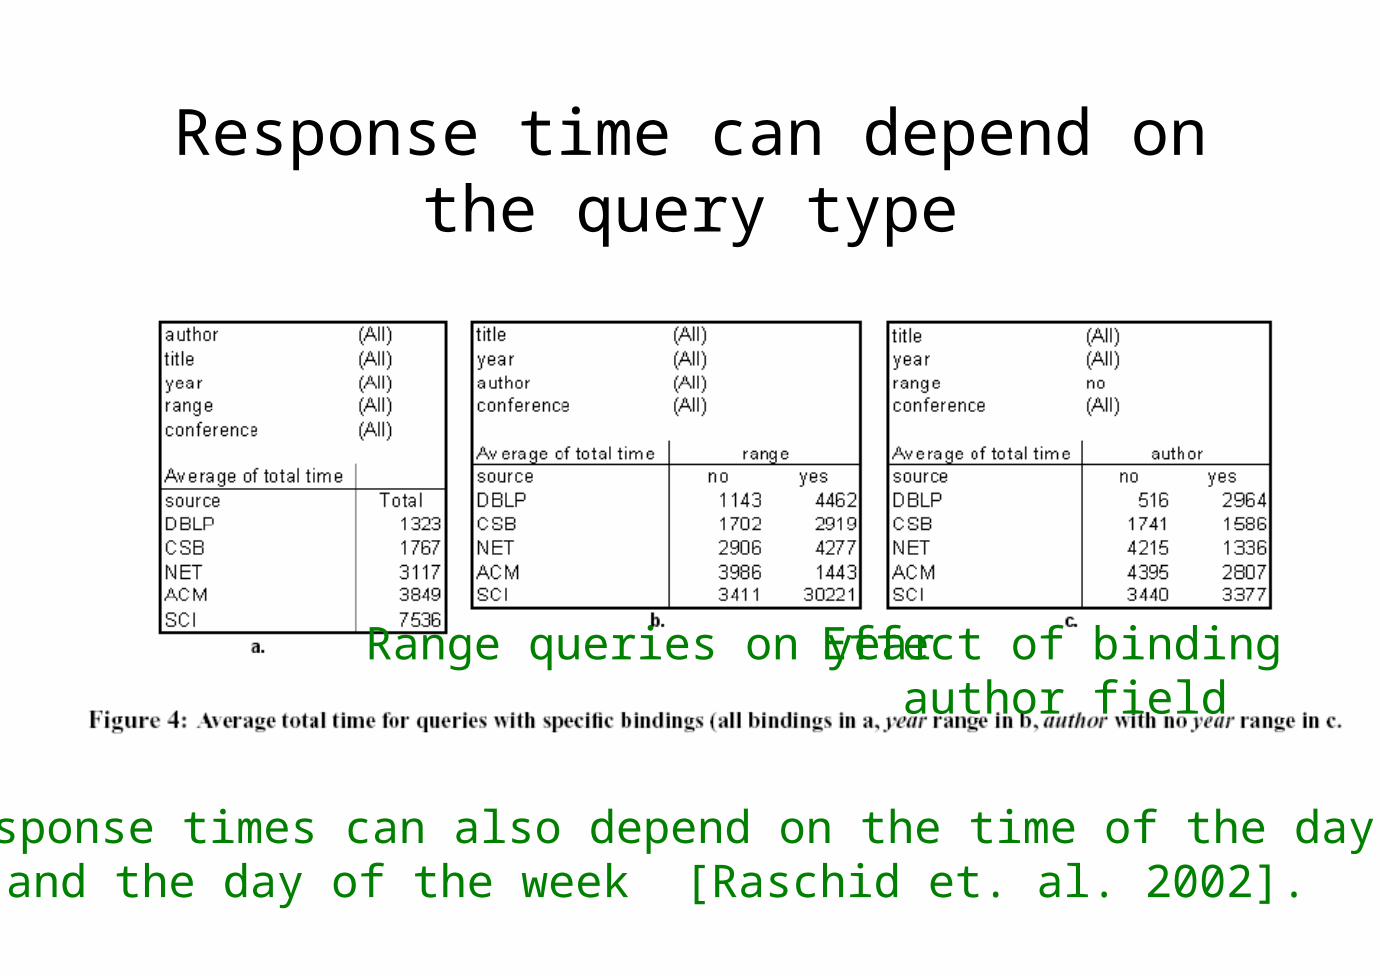
Response time can depend on the query type
Range queries on year Effect of binding author field
--Response times can also depend on the time of the day, and the day of the week [Raschid et. al. 2002].

Multi-objective Query optimization
• Need to optimize queries jointly for both high coverage and low response time– Staged optimization won’t quite work.
• An idea: Make the source selection be dependent on both (residual)coverage and response time
[CIKM, 2001]
Some possible utility functions we experimented with:

Results on BibFinder

Part II: Text Collection Selection with ,,,,,,,,,,

10/21/2004 Arizona State University
Results1. ……2. ……3. …… . .
NYTFT
CollectionSelection
QueryExecution
ResultsMerging
CNNWPWSJ
Collections:1. FT2. CNN
“bank mergers”
Overlap between collections News meta-searcher,
bibliography search engine, etc.
Objectives: Retrieve variety of
results Avoid collections
with irrelevant or redundant results
Selecting among overlapping collections
Existing work (e.g. CORI) assumes collections are disjoint!
10/21/2004 Arizona State University
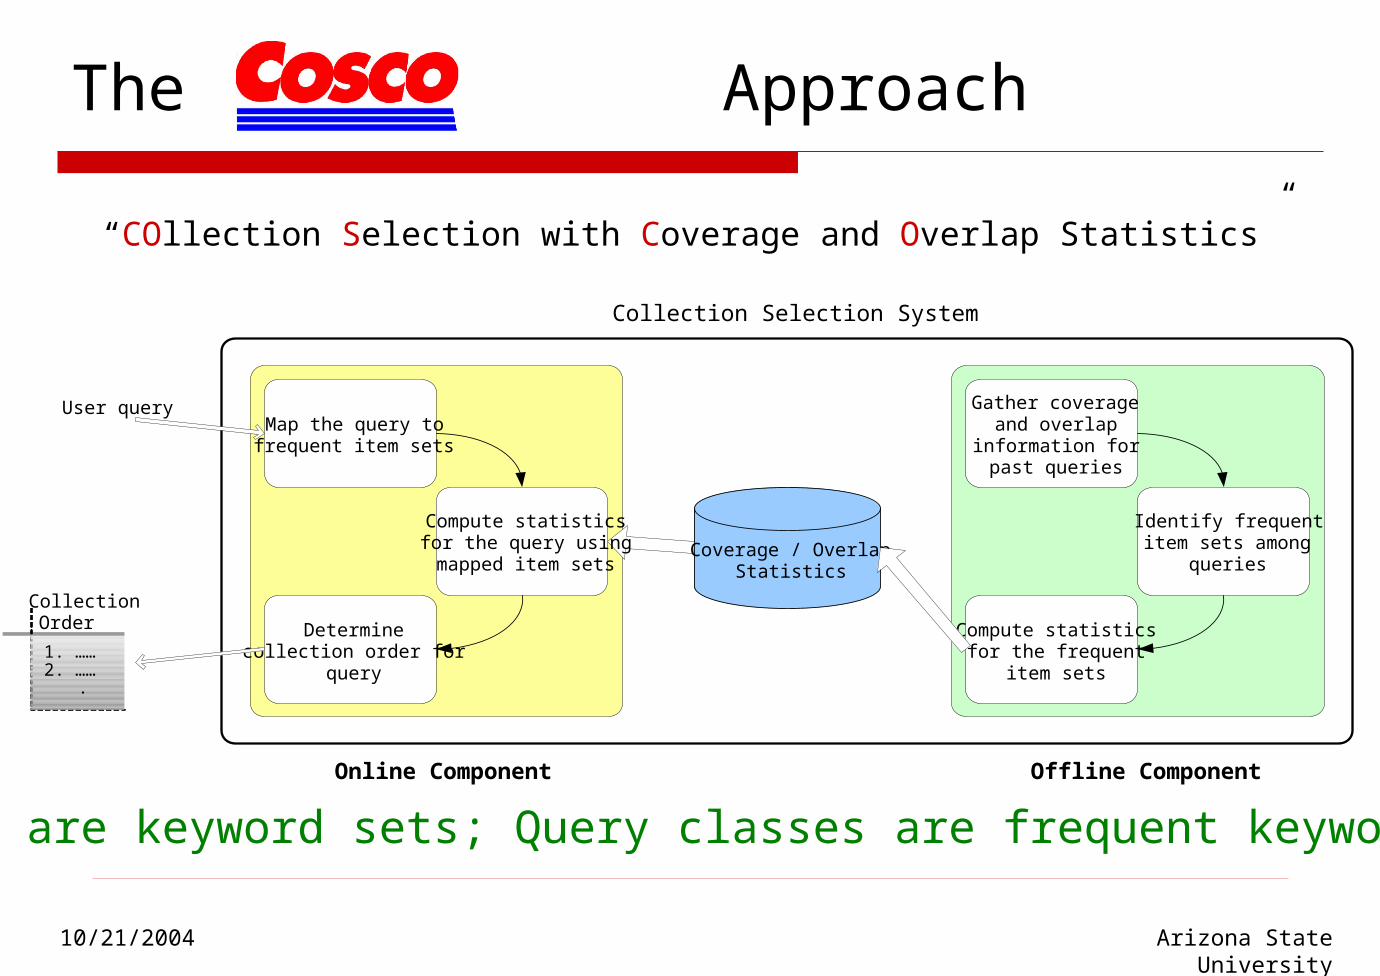
The Approach
“COllection Selection with Coverage and Overlap Statistics”
Online Component
Gather coverageand overlap
information forpast queries
Map the query tofrequent item sets
Determinecollection order for
query
Identify frequentitem sets among
queries
Compute statisticsfor the frequent
item sets
Coverage / OverlapStatistics
Compute statisticsfor the query usingmapped item sets
Offline Component
User query
CollectionOrder
1. ……2. …… .
Collection Selection System
Queries are keyword sets; Query classes are frequent keyword subsets

10/21/2004 Arizona State University
Challenge: Defining & Computing Overlap
Collection overlap may be non-symmetric, or “directional”. (A)
Document overlap may be non-transitive. (B)
A.
B.
Collection C1
1. Result A
2. Result B
3. Result C
4. Result D
5. Result E
6. Result F
7. Result G
Collection C2
1. Result V
2. Result W
3. Result X
4. Result Y
5. Result Z
Collection C1
1. Result A
2. Result B3. Result C
4. Result D5. Result E
6. Result F
7. Result G
Collection C2
1. Result V
2. Result W3. Result X
4. Result Y5. Result Z
Collection C3
1. Result I2. Result J
3. Result K4. Result L
5. Result M

10/21/2004 Arizona State University
Gathering Overlap Statistics
Solution: Consider query result set
of a particular collection as a single bag of words:
Approximate overlap as the intersection between the result set bags:
Approximate overlap between 3+ collections using only pairwise overlaps
10/21/2004 Arizona State University
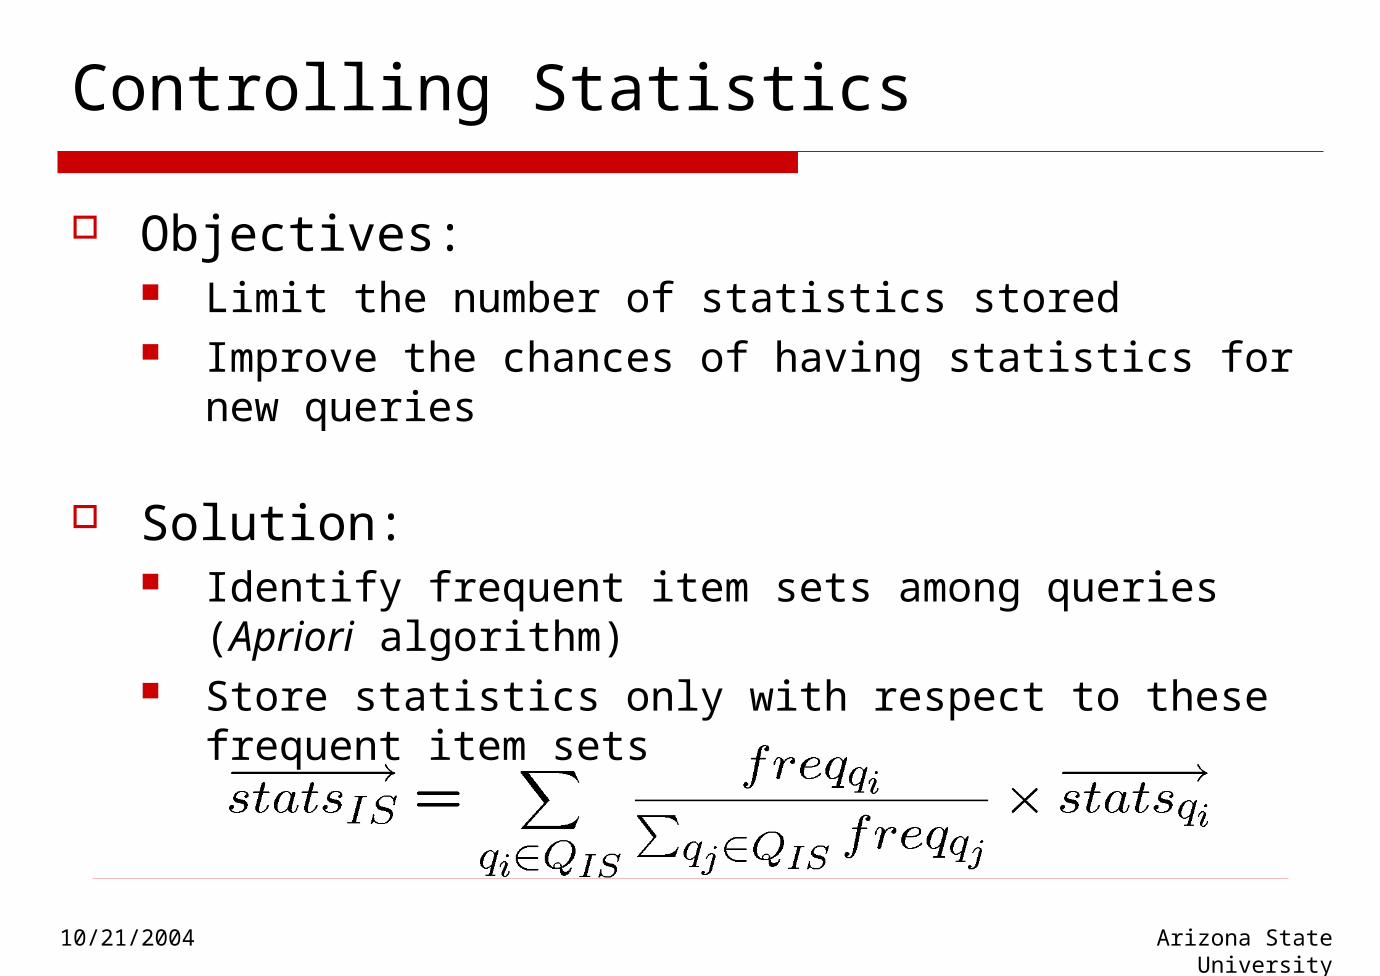
Controlling Statistics
Objectives: Limit the number of statistics stored Improve the chances of having statistics for new
queries
Solution: Identify frequent item sets among queries (Apriori
algorithm) Store statistics only with respect to these frequent item
sets

10/21/2004 Arizona State University
The Online Component
Map the query tofrequent item sets
Determinecollection order for
query
Compute statisticsfor the query usingmapped item sets
Purpose: determine collection order for user query 1. Map query to stored
item sets 2. Compute statistics for
query
3. Determine collection order
Online Component
Gather coverageand overlap
information forpast queries
Map the query tofrequent item sets
Determinecollection order for
query
Identify frequentitem sets among
queries
Compute statisticsfor the frequent
item sets
Coverage / OverlapStatistics
Compute statisticsfor the query usingmapped item sets
Offline Component
User query
CollectionOrder
1. ……2. …… .
Collection Selection System

10/21/2004 Arizona State University
Creating the Collection Test Bed
6 real collections were probed: ACM Digital Library,
Compendex, CSB, etc. Documents: authors +
title + year + conference + abstract
top-20 documents from each collection
9 artificial collections were created: 6 were proper subsets of
each of the 6 real collections
2 were unions of two subset collections from above
1 was the union of 15% of each real collection
15 overlapping, searchable collections

10/21/2004 Arizona State University
Training our System
Training set: 90% of the query list Gathering statistics for training queries:
Probing of the 15 collections Identifying frequent item sets:
Support threshold used: 0.05% (i.e. 9 queries) 681 frequent item sets found
Computing statistics for item sets: Statistics fit in a 1.28MB file Sample entry: network,neural
22 MIX15 0.11855 CI,SC 747AG 0.07742 AD 0.01893SC,MIX15 801.13636 …
10/21/2004 Arizona State University
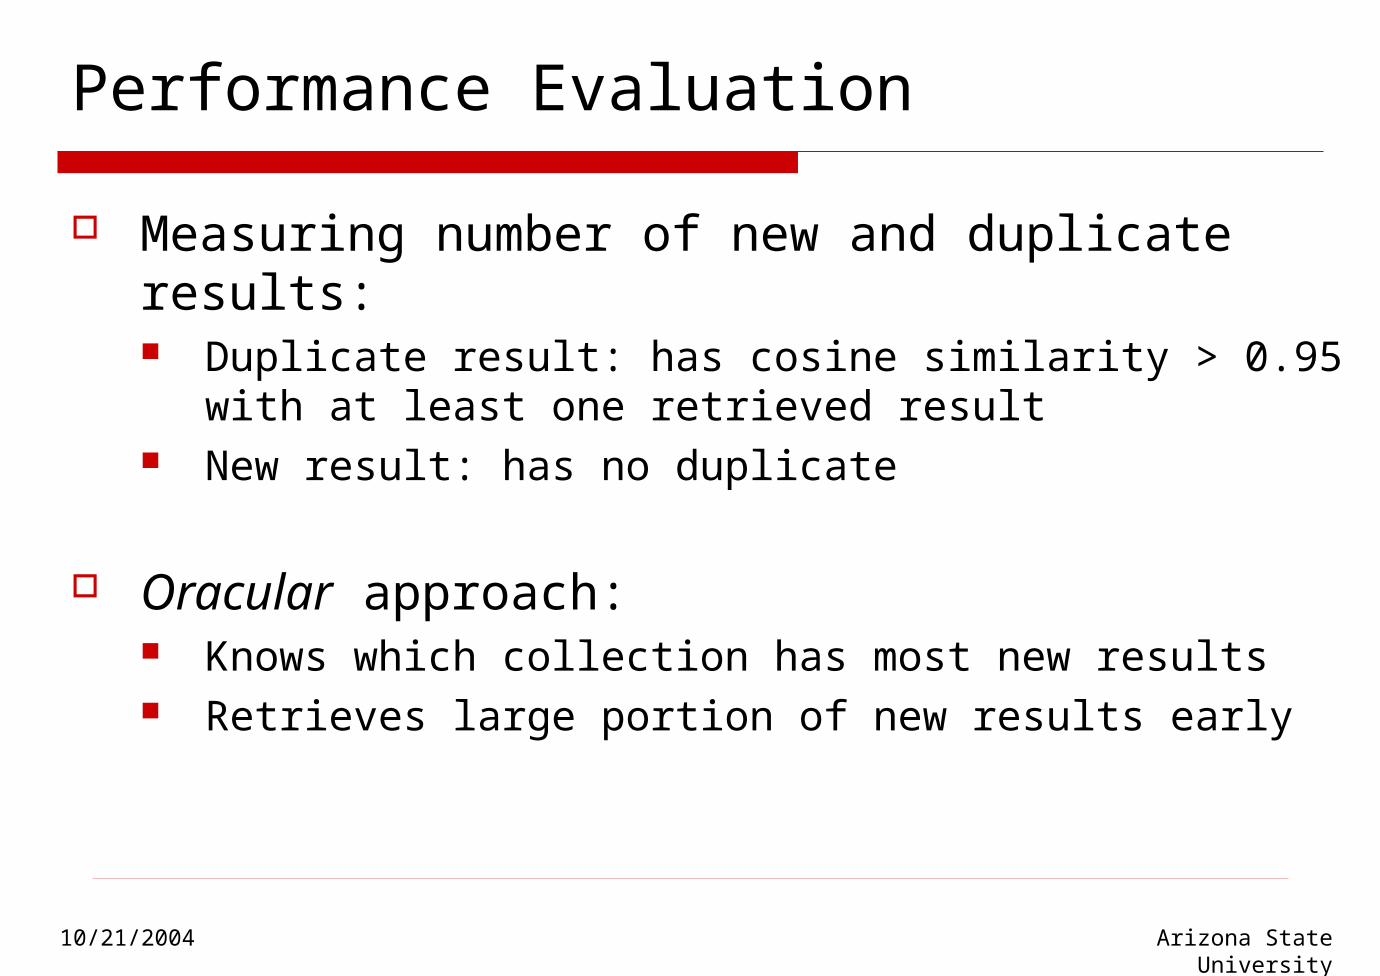
Performance Evaluation
Measuring number of new and duplicate results: Duplicate result: has cosine similarity > 0.95 with at
least one retrieved result New result: has no duplicate
Oracular approach: Knows which collection has most new results Retrieves large portion of new results early

10/21/2004 Arizona State University
Comparison with other approaches
0.00
20.00
40.00
60.00
80.00
100.00
120.00
140.00
160.00
1 2 3 4 5 6 7 8 9 10 11 12 13 14 15
Collection Rank
Cum
ulat
ive
num
ber
of n
ew r
esul
ts
ORACLE CORI COSCO COVERAGE-ONLY

10/21/2004 Arizona State University
Comparison of COSCO against CORIresults dup new cumulative
0.00
2.00
4.00
6.00
8.00
10.00
12.00
14.00
16.00
18.00
20.00
1 2 3 4 5 6 7 8 9 10 11 12 13 14 15Collection Rank using CORI
Nu
mb
er o
f re
sult
s, d
up
, n
ew
0.00
20.00
40.00
60.00
80.00
100.00
120.00
140.00
160.00
Cu
mu
lati
ve n
um
ber
of
new
res
ult
s
0.00
2.00
4.00
6.00
8.00
10.00
12.00
14.00
16.00
18.00
20.00
1 2 3 4 5 6 7 8 9 10 11 12 13 14 15Collection Rank using Coverage and Overlap
Nu
mb
er o
f re
sult
s, d
up
, n
ew
0.00
20.00
40.00
60.00
80.00
100.00
120.00
140.00
160.00
Cu
mu
lati
ve n
um
ber
of
new
res
ult
s
CORI: constant rate of change, as many new results as duplicates, more total results retrieved early
COSCO: globally descending trend of new results, sharp difference between # of new and duplicates, fewer total results first
CORI COSCO

10/21/2004 Arizona State University
Summary of Experimental Results
COSCO… displays Oracular-like behavior. consistently outperforms CORI. retrieves up to 30% more results than CORI when test
queries reflect training queries. can map at least 50% of queries to some item sets,
even in worst-case training queries. is a step towards Oracular-like performance, but still
some room for improvement
Part III: Answer Imprecise Queries with
[WebDB, 2004; WWW, 2004]
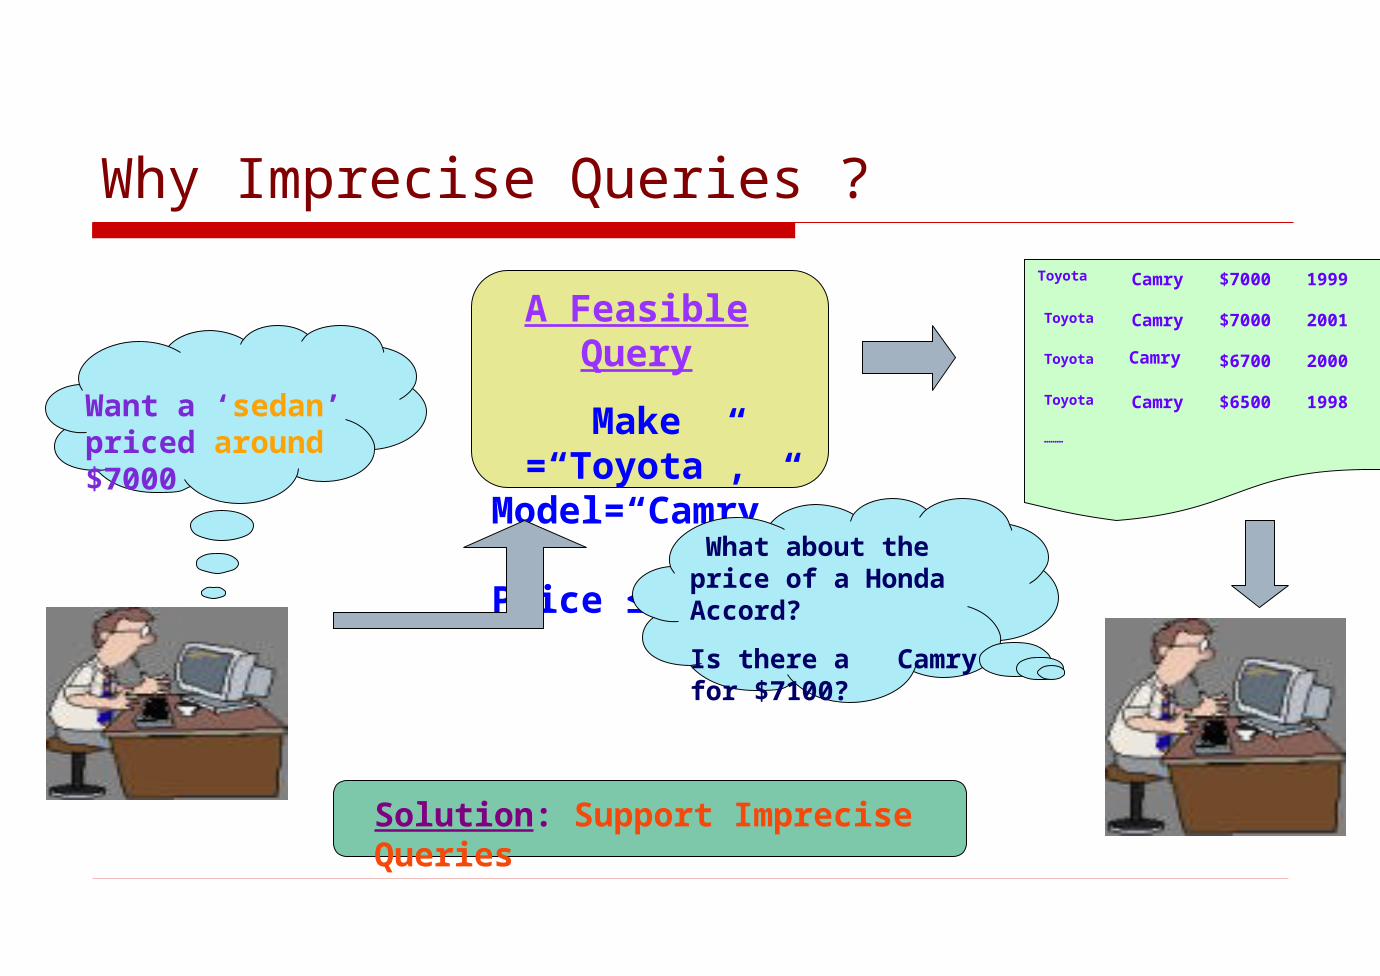
Why Imprecise Queries ?
Want a ‘sedan’ priced around $7000
A Feasible Query
Make =“Toyota”, Model=“Camry”, Price ≤ $7000
What about the price of a Honda Accord?
Is there a Camry for $7100?
Solution: Support Imprecise Queries
………
1998$6500CamryToyota
2000$6700CamryToyota
2001$7000CamryToyota
1999$7000CamryToyota
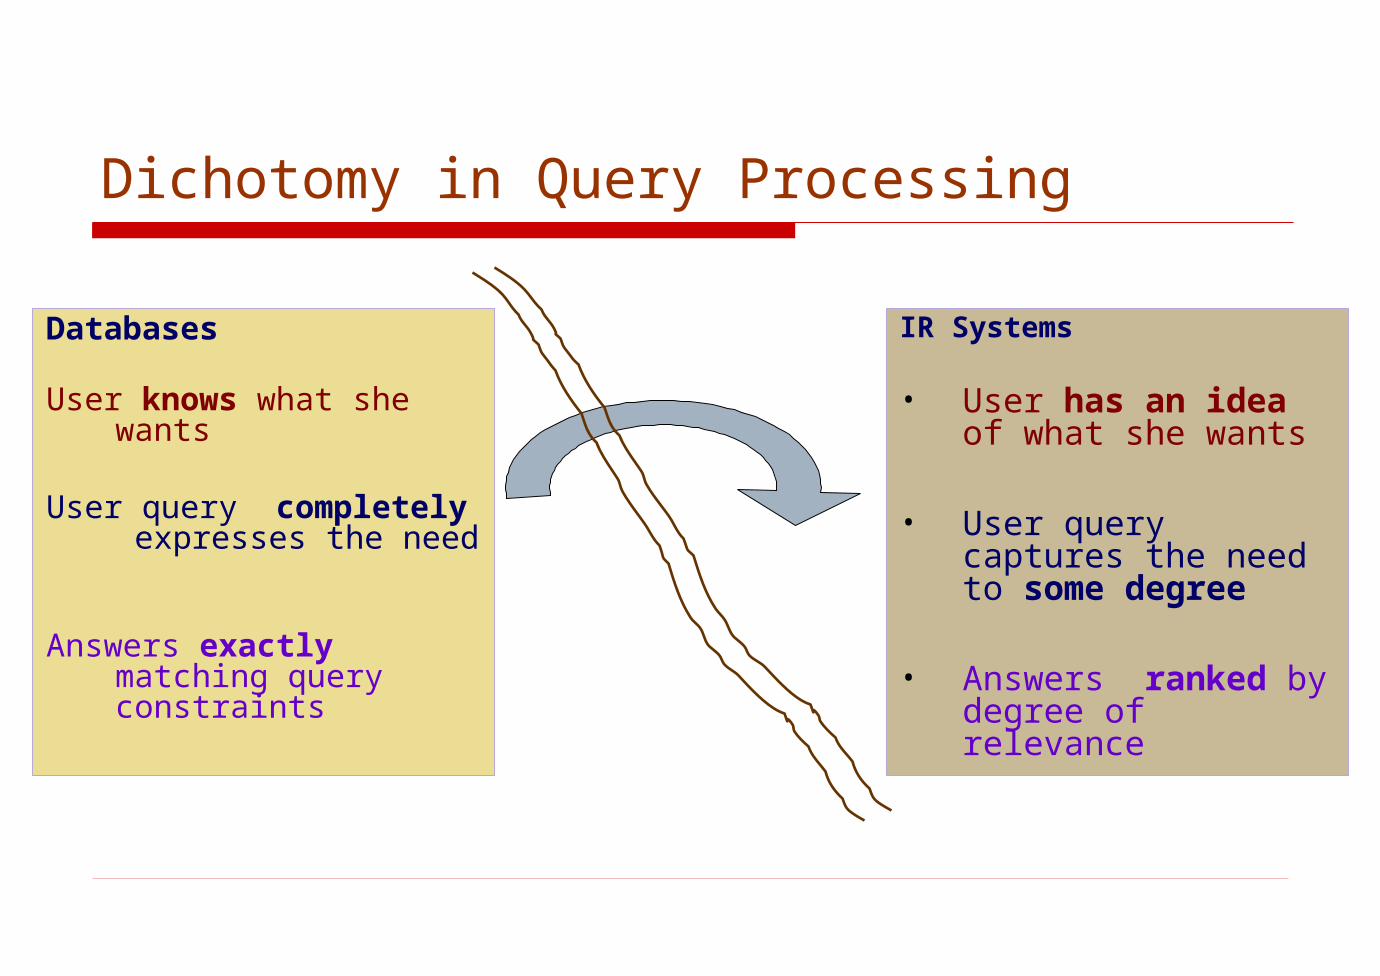
Dichotomy in Query Processing
Databases
User knows what she wants
User query completely expresses the need
Answers exactly matching query constraints
IR Systems
• User has an idea of what she wants
• User query captures the need to some degree
• Answers ranked by degree of relevance
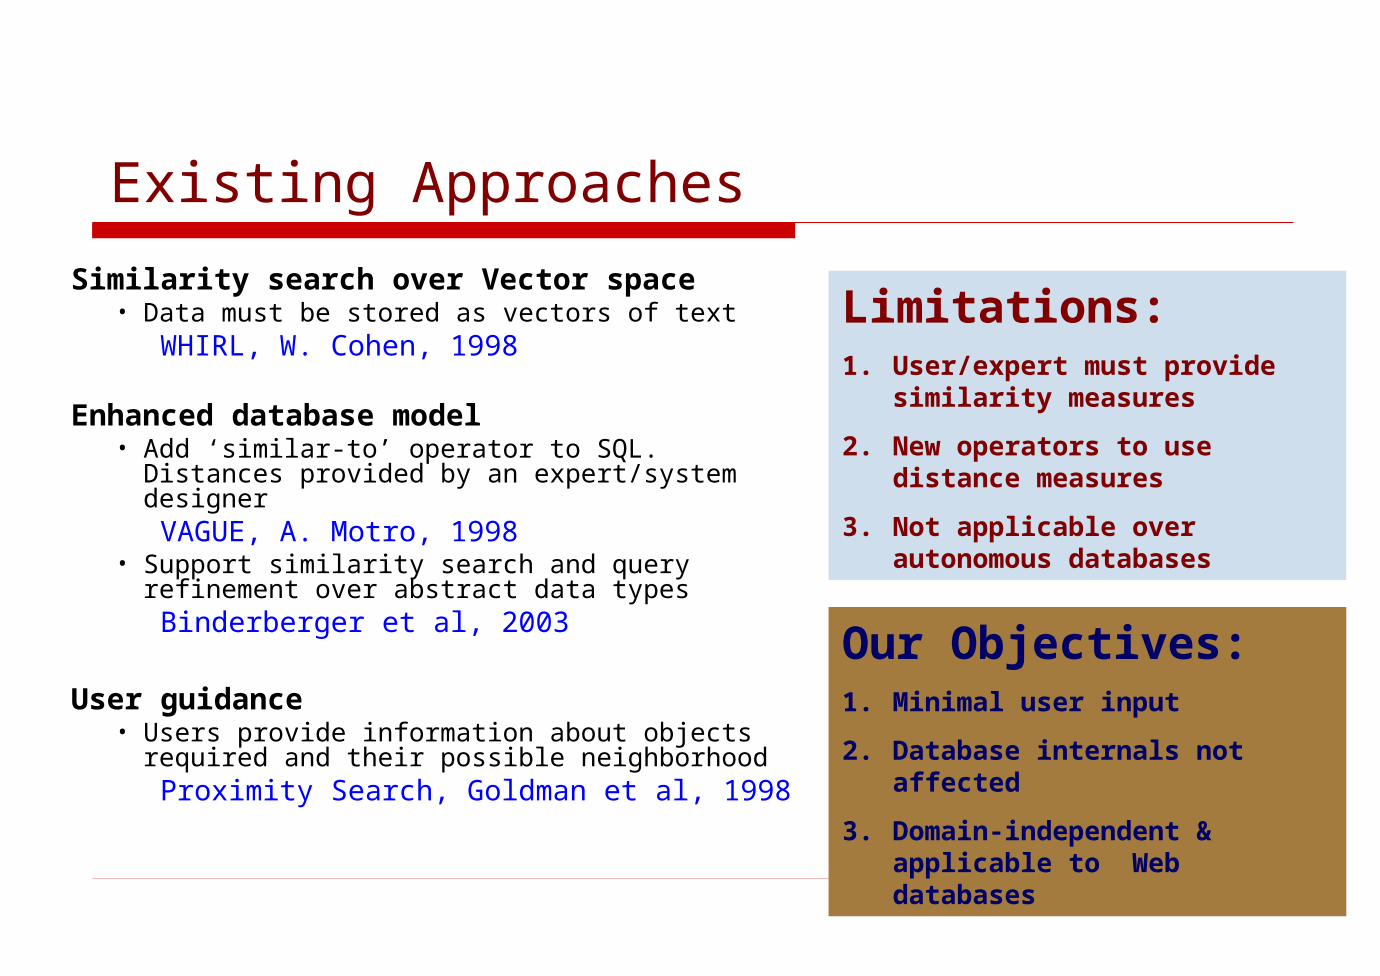
Existing Approaches
Similarity search over Vector space• Data must be stored as vectors of text
WHIRL, W. Cohen, 1998
Enhanced database model• Add ‘similar-to’ operator to SQL. Distances
provided by an expert/system designerVAGUE, A. Motro, 1998
• Support similarity search and query refinement over abstract data typesBinderberger et al, 2003
User guidance• Users provide information about objects
required and their possible neighborhoodProximity Search, Goldman et al, 1998
Limitations:1. User/expert must provide
similarity measures
2. New operators to use distance measures
3. Not applicable over autonomous databases
Our Objectives:1. Minimal user input
2. Database internals not affected
3. Domain-independent & applicable to Web databases
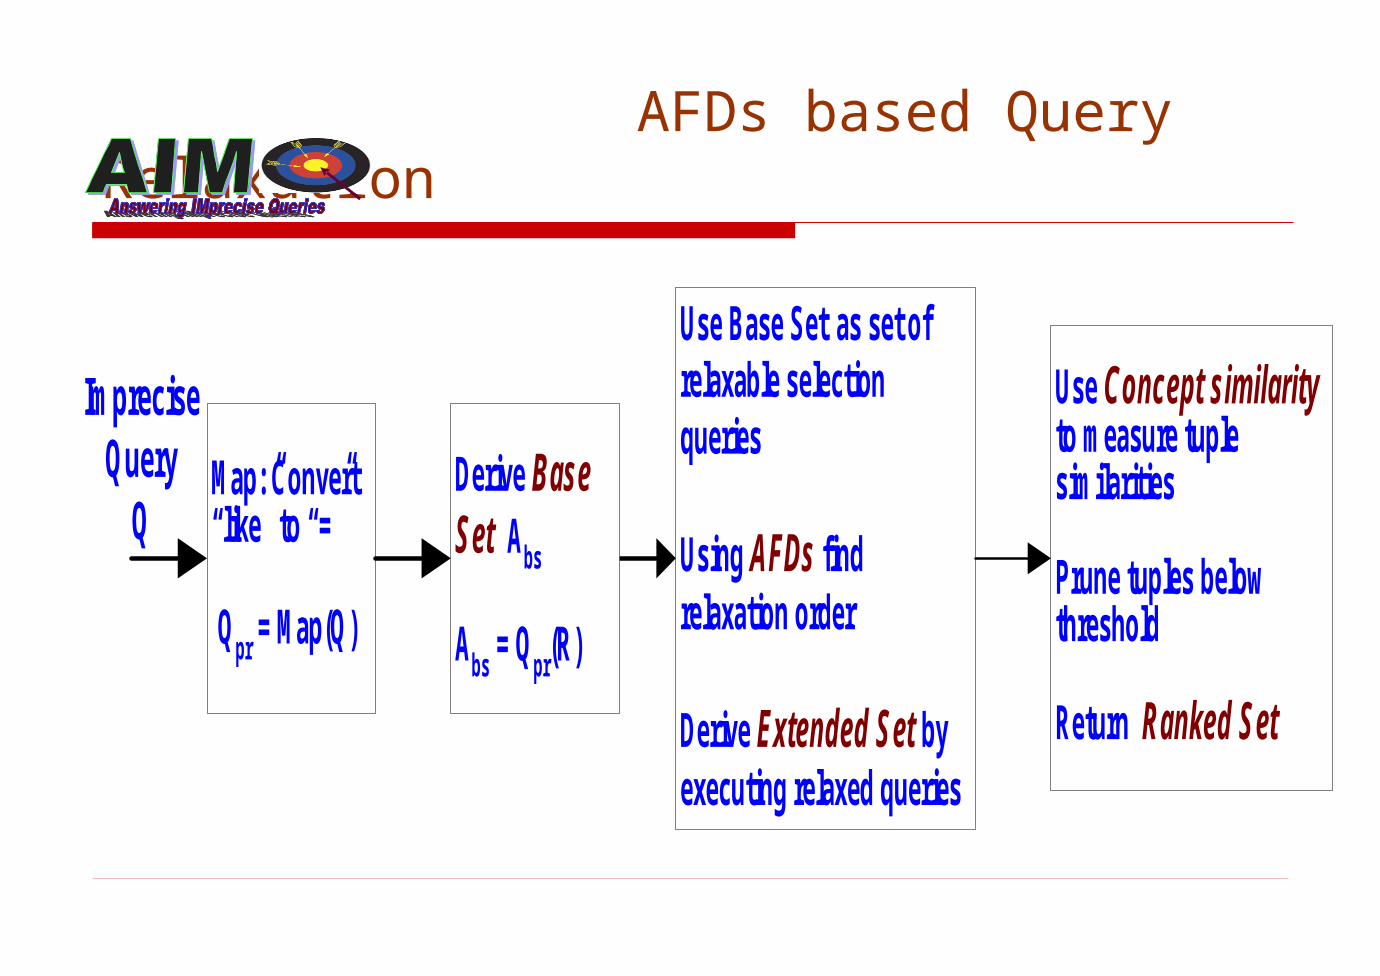
AFDs based Query Relaxation
ImpreciseQuery
QMap: Convert“like” to “=”
Qpr = Map(Q)
Use Base Set as set ofrelaxable selectionqueries
Using AFDs findrelaxation order
Derive Extended Set byexecuting relaxed queries
Use Concept similarityto measure tuplesimilarities
Prune tuples belowthreshold
Return Ranked Set
Derive BaseSet Abs
Abs = Qpr(R)

An Example
Relation:- CarDB(Make, Model, Price, Year) Imprecise query
Q :− CarDB(Model like “Camry”, Price like “10k”)
Base query
Qpr :− CarDB(Model = “Camry”, Price = “10k”)
Base set Abs
Make = “Toyota”, Model = “Camry”, Price = “10k”, Year = “2000”
Make = “Toyota”, Model = “Camry”, Price = “10k”, Year = “2001”
ImpreciseQuery
Q Map: Convert“like” to “=”
Qpr = Map(Q)
Use Base Set as set ofrelaxable selectionqueries
Using AFDs findrelaxation order
Derive Extended Set byexecuting relaxed queries
Use Concept similarityto measure tuplesimilarities
Prune tuples belowthreshold
Return Ranked Set
Derive BaseSet Abs
Abs = Qpr(R)

Obtaining Extended Set
Problem: Given base set, find tuples from database similar to tuples in base set.
Solution: • Consider each tuple in base set as a selection query.
e.g. Make = “Toyota”, Model = “Camry”, Price = “10k”, Year = “2000”
• Relax each such query to obtain “similar” precise queries.e.g. Make = “Toyota”, Model = “Camry”, Price = “”, Year =“2000”
• Execute and determine tuples having similarity above some threshold.
Challenge: Which attribute should be relaxed first ?• Make ? Model ? Price ? Year ?
Solution: Relax least important attribute first.
ImpreciseQuery
Q Map: Convert“like” to “=”
Qpr = Map(Q)
Use Base Set as set ofrelaxable selectionqueries
Using AFDs findrelaxation order
Derive Extended Set byexecuting relaxed queries
Use Concept similarityto measure tuplesimilarities
Prune tuples belowthreshold
Return Ranked Set
Derive BaseSet Abs
Abs = Qpr(R)

Least Important Attribute
Definition: An attribute whose binding value when changed has minimal effect on values binding other attributes.• Does not decide values of other attributes• Value may depend on other attributes
E.g. Changing/relaxing Price will usually not affect other attributes
but changing Model usually affects Price
Dependence between attributes useful to decide relative importance• Approximate Functional Dependencies & Approximate Keys
Approximate in the sense that they are obeyed by a large percentage (but not all) of tuples in the database• Can use TANE, an algorithm by Huhtala et al [1999]

Attribute Ordering
Given a relation R • Determine the AFDs and Approximate Keys• Pick key with highest support, say Kbest
• Partition attributes of R into key attributes i.e. belonging to Kbest
non-key attributes I.e. not belonging to Kbest
• Sort the subsets using influence weights
where Ai ∈ A’ ⊆ R, j ≠ i & j =1 to |Attributes(R)|
Attribute relaxation order is all non-keys first then keysMulti-attribute relaxation - independence assumption
Order: Price, Model, Year, Make
1- attribute: { Price, Model, Year, Make}
2-attribute: {(Price, Model), (Price, Year), (Price, Make)….. }
|'|
))'(1()(
A
AjAerrorAieightInfluenceW
CarDB(Make, Model, Year, Price)
Key attributes: Make, YearNon-key: Model, Price
ImpreciseQuery
Q Map: Convert“like” to “=”
Qpr = Map(Q)
Use Base Set as set ofrelaxable selectionqueries
Using AFDs findrelaxation order
Derive Extended Set byexecuting relaxed queries
Use Concept similarityto measure tuplesimilarities
Prune tuples belowthreshold
Return Ranked Set
Derive BaseSet Abs
Abs = Qpr(R)

Tuple Similarity
Tuples obtained after relaxation are ranked according to theirsimilarity to the corresponding tuples in base set
where Wi = normalized influence weights, ∑ Wi = 1 , i = 1 to |Attributes(R)|
Value Similarity• Euclidean for numerical attributes e.g. Price, Year• Concept Similarity for categorical e.g. Make, Model
WiAitvalueAitvalueilarityAttrSimttSimilarity ]))[2(]),[1(()2,1(
ImpreciseQuery
Q Map: Convert“like” to “=”
Qpr = Map(Q)
Use Base Set as set ofrelaxable selectionqueries
Using AFDs findrelaxation order
Derive Extended Set byexecuting relaxed queries
Use Concept similarityto measure tuplesimilarities
Prune tuples belowthreshold
Return Ranked Set
Derive BaseSet Abs
Abs = Qpr(R)

Concept (Value) Similarity
Concept: Any distinct attribute value pair. E.g. Make=Toyota• Visualized as a selection query binding
a single attribute• Represented as a supertuple
Concept Similarity: Estimated as the percentage of correlated values common to two given concepts
where v1,v2 Є Aj, i ≠ j and Ai, Aj Є R
• Measured as the Jaccard Similarity among supertuples representing the concepts
ST(QMake=Toyota)
Model Camry: 3, Corolla: 4,….
Year 2000:6,1999:5 2001:2,……
Price 5995:4, 6500:3, 4000:6
Supertuple for Concept Make=Toyota
ImpreciseQuery
Q Map: Convert“like” to “=”
Qpr = Map(Q)
Use Base Set as set ofrelaxable selectionqueries
Using AFDs findrelaxation order
Derive Extended Set byexecuting relaxed queries
Use Concept similarityto measure tuplesimilarities
Prune tuples belowthreshold
Return Ranked Set
Derive BaseSet Abs
Abs = Qpr(R)
)))(,2()),(,1(()2,1( AivaluesvCorrelatedAivaluesvCorrelatedyCommonalitvvSimilarity
JaccardSim(A,B) = BABA

Concept (Value) Similarity Graph
Ford
Chevrolet
Toyota
Honda
Dodge
Nissan
BMW
0.25
0.16
0.110.15
0.12
0.22

Empirical Evaluation of
Goal• Evaluate the effectiveness of the query relaxation and
concept learning
Setup• A database of used cars
CarDB( Make, Model, Year, Price, Mileage, Location, Color)
• Populated using 30k tuples from Yahoo Autos• Concept similarity estimated for Make, Model, Location,
Color • Two query relaxation algorithms
RandomRelax – randomly picks attribute to relax GuidedRelax – uses relaxation order determined using
approximate keys and AFDs
ImpreciseQuery
Q Map: Convert“like” to “=”
Qpr = Map(Q)
Use Base Set as set ofrelaxable selectionqueries
Using AFDs findrelaxation order
Derive Extended Set byexecuting relaxed queries
Use Concept similarityto measure tuplesimilarities
Prune tuples belowthreshold
Return Ranked Set
Derive BaseSet Abs
Abs = Qpr(R)

Evaluating the effectiveness of relaxation
Test Scenario• 10 randomly selected base queries from CarDB• 20 tuples showing similarity > Є
0.5 < Є < 1
• Weighted summation of attribute similarities Euclidean distance used for Year, Price, Mileage Concept Similarity used for Make, Model, Location, Color
• Limit 64 relaxed queries per base query 128 max possible – 7 attributes
• Efficiency measured using metric
|Re|
||Re/
actedlevantExtr
uplesExtractedTelevantTuplWork
ImpreciseQuery
Q Map: Convert“like” to “=”
Qpr = Map(Q)
Use Base Set as set ofrelaxable selectionqueries
Using AFDs findrelaxation order
Derive Extended Set byexecuting relaxed queries
Use Concept similarityto measure tuplesimilarities
Prune tuples belowthreshold
Return Ranked Set
Derive BaseSet Abs
Abs = Qpr(R)

Efficiency of Relaxation in
0
20
40
60
80
100
120
140
160
180
1 2 3 4 5 6 7 8 9 10Queries
Wo
rk/R
elev
ant
Tu
ple
Є = 0.7
Є = 0.6
Є = 0.5
•Average 4 tuples extracted per relevant tuple for Є=0.5. Goes up to 12 tuples for Є= 0.7.
•Resilient to change in Є
0
100
200
300
400
500
600
700
800
900
1 2 3 4 5 6 7 8 9 10
Queries
Wo
rk/R
ele
va
nt
Tu
ple
Є= 0.7
Є = 0.6
Є = 0.5
•Average 8 tuples extracted per relevant tuple for Є =0.5. Increases to 120 tuples for Є=0.7.
•Not resilient to change in Є
Guided Relaxation
Random Relaxation
Summary
An approach for answering imprecise queries over Web database• Mine and use AFDs to determine attribute importance • Domain-independent concept similarity estimation technique• Tuple similarity score as a weighted sum of attribute similarity
scores
Empirical evaluation shows • Reasonable concept similarity models estimated• Set of similar precise queries efficiently identified

Adaptive Information Integration• Query processing in information integration needs to
be adaptive to:– Source characteristics
• How is the data spread among the sources?– User needs
• Multi-objective queries (tradeoff coverage for cost)• Imprecise queries
• To be adaptive we need, profiles (meta-data) about sources as well as users – Challenge: Profiles are not going to be provided..
• Autonomous sources may not export meta-data about data spread!• Lay users may not be able to articulate the source of their imprecision!
Need approaches that gather (learn) the meta-data they need

Three contributions to Adaptive Information Integration
• BibFinder– Learns and uses source coverage and overlap statistics to
support multi-objective query processing• [VLDB 2003; ICDE 2004; TKDE 2005]
• COSCO– Adapts the Coverage/Overlap techniques to text collection
selection
• – Supports imprecise queries by automatically learning
approximate structural relations among data tuples• [WebDB 2004; WWW 2004]
Although we focus on avoiding retrieval of duplicates,Coverage/Overlap statistics can also be used to look for duplicates

Current Directions• Focusing on retrieving redundant records/documents to
improve information quality– Eg. Multiple view points on the same story, additional details
(e.g. bibtex entry) on a bibliography record– Our coverage/overlap statistics can be used for this purpose too!
• Learning and exploiting other types of source statistics– “Density”—the percentage of null values in a record– “Recency”/ “Freshness”—how recent the results from a source
or likely to be• These statistics also may vary based on the query type
– E.g. DBLP is more up-to-date for database papers than AI papers
– Such statistics can be used to increase the quality of answers returned by the mediator in accessing top-K sources.