add (previously not rated) riding the digital
TRANSCRIPT

Company Note Conglomerate │ Vietnam │ December 11, 2019 Shariah Compliant
IMPORTANT DISCLOSURES, INCLUDING ANY REQUIRED RESEARCH CERTIFICATIONS, ARE PROVIDED AT THE END OF THIS REPORT. IF THIS REPORT IS DISTRIBUTED IN THE UNITED STATES IT IS DISTRIBUTED BY CGS-CIMB SECURITIES (USA), INC. AND IS CONSIDERED THIRD-PARTY AFFILIATED RESEARCH.
Powered by the EFA Platform
Insert Insert
FPT Corporation Riding the digital transformation wave
■ FPT is Vietnam’s largest tech company and is involved in the IT services, telecom and education businesses.
■ We forecast an FY19-21F net profit CAGR of 12.1% on the back of an increasing Dx trend and higher proportion of patented software products.
■ Initiate coverage with an Add rating and target price of VND74,000.
FPT is moving up the value chain Initially, FPT was a pure service-based IT company with few patented software products.
This could partially explain why FPT’s P/E has been consistently lower than the Vietnam
Stock Index (VN-Index)’s P/E over the past 10 years, in our view. In late-2017, however,
the company embarked on a strategy to shift its focus to technology through the
divestment of the digital retail and distribution businesses. Additionally, FPT ramped up
R&D activity to strengthen its product line-up with patented software products. The
valuation gap between FPT and VN-Index has begun to narrow but we believe this local
tech giant deserves to trade at a premium over the index.
Digital transformation (Dx): the main driving force Global spending on Dx projects is expected to grow to US$1.25tr in FY19F (+16.8% yoy),
according to International Data Corporation (IDC). We believe FPT is well-equipped to
capture the opportunities arising from this evolution as the company is aggressively
acquiring several companies to expand its brand and customer base in foreign countries
and is seeking revenue from Dx consulting services. We forecast strong technology
revenue CAGR of 14.3% in FY19-23F.
Telecom will provide concrete base amid growing competition We expect the company’s telecommunication segment to generate stable revenue CAGR
of 9.3% in FY19-23F on the back of solid domestic demand. We also believe the GPM of
the telecom segment will reach 49-50% in FY19-23F, thanks to the company‘s improved
competitive positioning, while pay TV will ignite net profit growth over the longer term,
possibly breaking even and reporting profits from FY21F.
Initiate coverage with an Add rating and TP of VND74,000 Our TP is based on the sum-of-parts methodology, with P/E-based valuations for its three
main business segments. FPT’s share price experienced a drop of 10.7% in the past one
month due to strong profit-taking activity in the large-cap space and currently is trading at
a 27.5% discount to average regional peers’ FY19F P/E. We think this price weakness is
an opportunity to accumulate a good quality stock. Potential upside catalysts could come
from the expansionary government fiscal policy and the divestment of State Capital
Investment Corporation (SCIC). Downside risks include loss of market share due to
competition and higher labour costs.
SOURCES: VND RESEARCH, COMPANY REPORTS
Vietnam
ADD (previously NOT RATED)
Consensus ratings*: Buy 12 Hold 0 Sell 0
Current price: VND55,500
Target price: VND74,000
Up/downside: 33.3%
CGS-CIMB / Consensus: 0.2%
Reuters: FPT.HM
Bloomberg: FPT VN
Market cap: US$1,625m
VND37,644,336m
Average daily turnover: US$4.25m
VND97,815m
Current shares o/s: 613.636m
Free float: 78.9% *Source: Bloomberg
Key changes in this note
N/A
Source: Bloomberg
Price performance 1M 3M 12M Absolute (%) -6.9 2.8 38.1
Relative (%) -0.8 3.8 37.6
Major shareholders % held Truong Gia Binh 7.1
Vietnam SCIC 5.9
Red River Holding 4.5
Insert
Analyst(s)
Toan CHU
T (84) 94 519 9218 E [email protected]
Financial Summary Dec-17A Dec-18A Dec-19F Dec-20F Dec-21F
Revenue (VNDb) 42,659 23,214 27,757 32,452 37,570
Operating EBITDA (VNDb) 4,206 4,286 5,505 6,664 7,978
Net Profit (VNDb) 2,932 2,620 3,222 3,841 4,545
Core EPS (VND) 5,920 4,578 4,988 5,391 5,800
Core EPS Growth 27.4% (22.7%) 8.9% 8.1% 7.6%
FD Core P/E (x) 9.38 12.12 11.13 10.29 9.57
DPS (VND) 2,000 2,500 2,000 2,000 2,000
Dividend Yield 3.60% 4.50% 3.60% 3.60% 3.60%
EV/EBITDA (x) 5.78 6.84 6.08 5.42 4.82
P/FCFE (x) NA 14.94 23.61 15.89 12.91
Net Gearing (24.0%) (17.1%) (14.7%) (18.0%) (22.5%)
P/BV (x) 2.58 2.73 2.50 2.30 2.11
ROE 28.0% 21.9% 23.4% 23.2% 22.9%
% Change In Core EPS Estimates
CGS-CIMB/Consensus EPS (x) 1.07 0.98 0.94
92.0
112.0
132.0
152.0
34,000
44,000
54,000
64,000
Price Close Relative to VNINDEX (RHS)
2
4
6
8
Dec-18 Mar-19 Jun-19 Sep-19
Vo
l m
Conglomerate │ Vietnam
FPT Corporation │ December 11, 2019
2
Riding the digital transformation wave
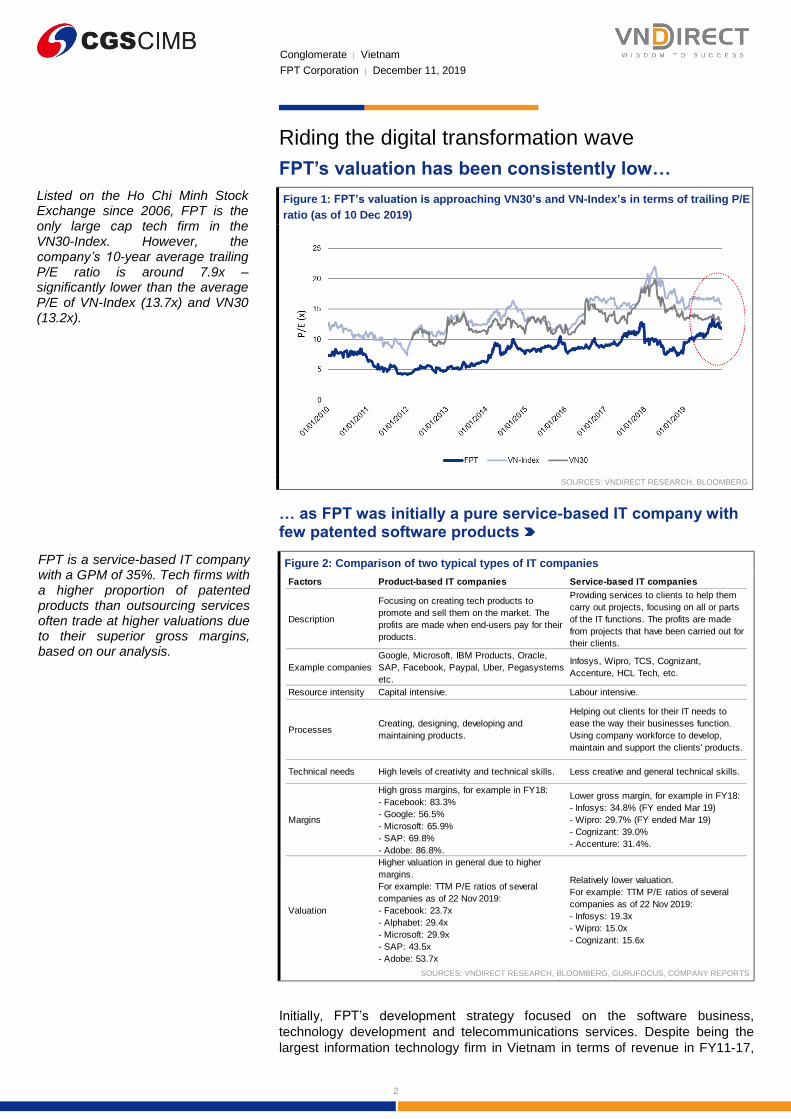
FPT’s valuation has been consistently low…
Figure 1: FPT’s valuation is approaching VN30’s and VN-Index’s in terms of trailing P/E
ratio (as of 10 Dec 2019)
SOURCES: VNDIRECT RESEARCH, BLOOMBERG
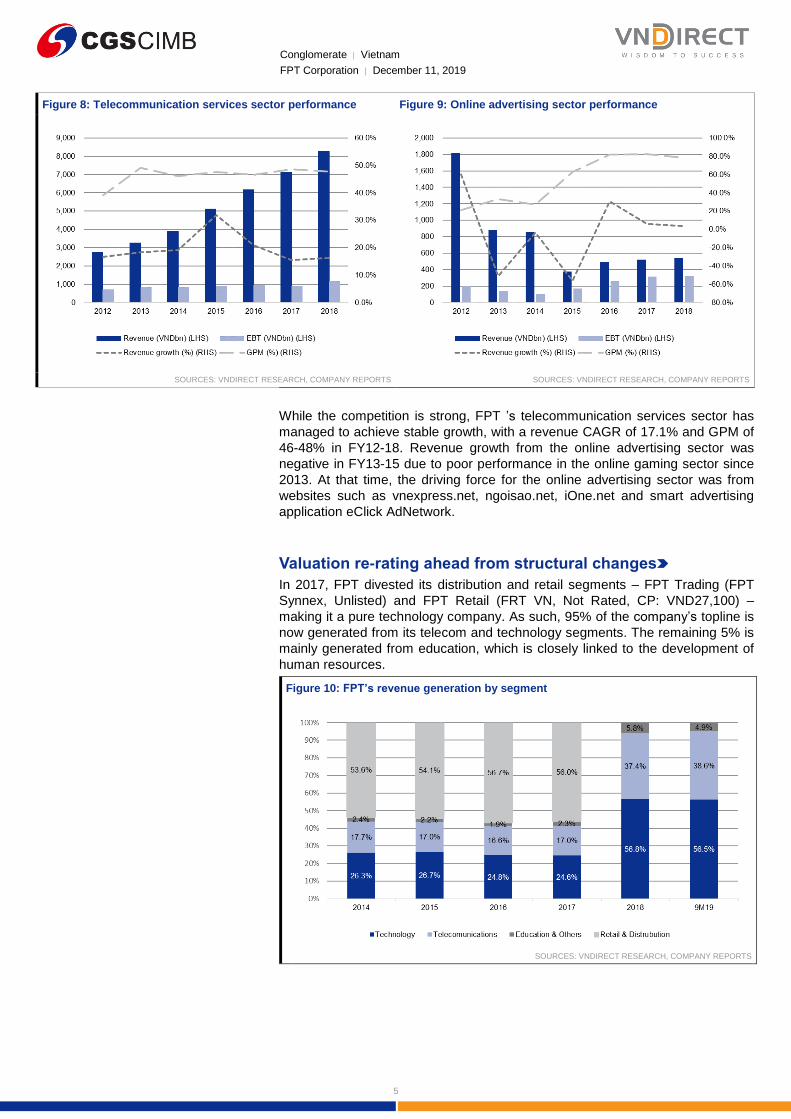
… as FPT was initially a pure service-based IT company with few patented software products
Figure 2: Comparison of two typical types of IT companies
SOURCES: VNDIRECT RESEARCH, BLOOMBERG, GURUFOCUS, COMPANY REPORTS
Initially, FPT’s development strategy focused on the software business,
technology development and telecommunications services. Despite being the
largest information technology firm in Vietnam in terms of revenue in FY11-17,
Factors Product-based IT companies Service-based IT companies
Description
Focusing on creating tech products to
promote and sell them on the market. The
profits are made when end-users pay for their
products.
Providing services to clients to help them
carry out projects, focusing on all or parts
of the IT functions. The profits are made
from projects that have been carried out for
their clients.
Example companies
Google, Microsoft, IBM Products, Oracle,
SAP, Facebook, Paypal, Uber, Pegasystems
etc.
Infosys, Wipro, TCS, Cognizant,
Accenture, HCL Tech, etc.
Resource intensity Capital intensive. Labour intensive.
ProcessesCreating, designing, developing and
maintaining products.
Helping out clients for their IT needs to
ease the way their businesses function.
Using company workforce to develop,
maintain and support the clients' products.
Technical needs High levels of creativity and technical skills. Less creative and general technical skills.
Margins
High gross margins, for example in FY18:
- Facebook: 83.3%
- Google: 56.5%
- Microsoft: 65.9%
- SAP: 69.8%
- Adobe: 86.8%.
Lower gross margin, for example in FY18:
- Infosys: 34.8% (FY ended Mar 19)
- Wipro: 29.7% (FY ended Mar 19)
- Cognizant: 39.0%
- Accenture: 31.4%.
Valuation
Higher valuation in general due to higher
margins.
For example: TTM P/E ratios of several
companies as of 22 Nov 2019:
- Facebook: 23.7x
- Alphabet: 29.4x
- Microsoft: 29.9x
- SAP: 43.5x
- Adobe: 53.7x
Relatively lower valuation.
For example: TTM P/E ratios of several
companies as of 22 Nov 2019:
- Infosys: 19.3x
- Wipro: 15.0x
- Cognizant: 15.6x
Listed on the Ho Chi Minh Stock Exchange since 2006, FPT is the only large cap tech firm in the VN30-Index. However, the company’s 10-year average trailing P/E ratio is around 7.9x – significantly lower than the average P/E of VN-Index (13.7x) and VN30 (13.2x).
FPT is a service-based IT company with a GPM of 35%. Tech firms with a higher proportion of patented products than outsourcing services often trade at higher valuations due to their superior gross margins, based on our analysis.

Conglomerate │ Vietnam
FPT Corporation │ December 11, 2019
3
over half of FPT’s total revenue came from the retail and distribution segment in
FY11-17, making it more of a digital wholesale and retail group, in our view.
According to Acer (2353 TT, Not Rated, CP: NT$17.8) founder Stan Shih’s
‘smiling curve’, the value added is the lowest at the bottom of the curve of a
product’s lifecycle, i.e. product assembly, manufacturing or outsourcing activities,
which are frequently offshored to emerging and developing economies. For
years, FPT's revenue came mainly from small or simple projects, such as
integration, coding, testing or maintenance for clients’ projects, rather than
developing software products. In other words, FPT was mainly used as an
external services provider to deliver IT-enabled business processes, application
services and infrastructure solutions.
Figure 3: IT firms’ smiling curve
SOURCES: STAN SHIH
Figure 4: High contribution of software outsourcing to FPT’s
technology revenue
Figure 5: Labour productivity - Increasing productivity is positive
for labour-intensive processes
SOURCES: VNDIRECT RESEARCH, COMPANY REPORTS SOURCES: VNDIRECT RESEARCH, COMPANY REPORTS
The outsourcing industry is labour-intensive. The number of direct employees
accounted for 46.5% of FPT's total personnel in FY18. Labour productivity
reached VND650m in revenue per employee in FY18, posting a CAGR of 5% in
FY14-18, below the average labour productivity growth of 6.2% in Vietnam’s
science and technology sectors. However, productivity improved in FY18 by 8%
yoy (from VND600m in FY17 to VND650m in revenue per individual in FY18).

Conglomerate │ Vietnam
FPT Corporation │ December 11, 2019
4
A subsidiary of FPT Corp - FPT Information System (FPT IS, Unlisted) remains
a provider of software solutions, IT services and system integration, such as
Enterprise Resource Planning (ERP) and Business Process Outsourcing (BPO).
Domestic customers account for most of the revenue as at Sep 2019; its three
main customer groups are: (1) the government, (2) banks, and (3) enterprises.
FPT IS also has clients in developing countries, such as Myanmar and
Bangladesh. In Vietnam, it has developed several government projects, such as
FPT.eGOV, e.Hospital, e-Ticket, and an intelligent transportation system for big
cities.
FPT's telecom segment faces fierce competition
The global broadband market is becoming increasingly mobile. According to
data from the International Telecommunication Union (ITU) in Jul 2019, active
mobile broadband subscriptions grew with CAGR of 22.7% in FY09-18. In
contrast, the number of global fixed line broadband subscribers increased with
CAGR of only 7.4% in FY09-18. According to Vietnam Telecommunications
Authority (VNTA), the number of mobile broadband subscribers in Vietnam is
also growing faster than the number of fixed line broadband subscribers, with
FY09-18 CAGR of 22.3% and 15.0%, respectively. We believe the trend is
inevitable given the continued increase in the use of smartphones and tablets,
the affordability of mobile broadband and advancements in 3G, 4G and soon-to-
be-launched 5G.
Figure 6: Number of wired and mobile broadband Internet
subscribers in Vietnam
Figure 7: Vietnam’s fixed line broadband Internet market share in
terms of subscribers
SOURCES: VNTA, VNDIRECT RESEARCH SOURCES: VNTA, VNDIRECT RESEARCH
This trend is one of the reasons that FPT has lost market share to Vietnam
Posts and Telecommunications Group (VNPT, Unlisted) and Army
Telecommunication Industry Corporation (Viettel, Unlisted), two other
Vietnamese telecom giants, since 2014. In particular, FPT's fixed line broadband
Internet market share decreased to roughly 15% in 2018 from 26.8% in 2012 in
terms of subscribers, based on our estimates. VNPT and Viettel provide both
fixed line and mobile telecommunications infrastructure while FPT only offers
wired broadband Internet. Therefore, the coverage of VNPT and Viettel is wider
than FPT’s. VNPT’s and Viettel’s telecom infrastructure covers roughly 97% and
70% of Vietnam geographically, respectively. While FPT’s wired Internet, with a
narrower product range, covers about 60% of Vietnam’s territory as at end-2017.
Conglomerate │ Vietnam
FPT Corporation │ December 11, 2019
5
Figure 8: Telecommunication services sector performance Figure 9: Online advertising sector performance
SOURCES: VNDIRECT RESEARCH, COMPANY REPORTS SOURCES: VNDIRECT RESEARCH, COMPANY REPORTS
While the competition is strong, FPT ’s telecommunication services sector has
managed to achieve stable growth, with a revenue CAGR of 17.1% and GPM of
46-48% in FY12-18. Revenue growth from the online advertising sector was
negative in FY13-15 due to poor performance in the online gaming sector since
2013. At that time, the driving force for the online advertising sector was from
websites such as vnexpress.net, ngoisao.net, iOne.net and smart advertising
application eClick AdNetwork.
Valuation re-rating ahead from structural changes
In 2017, FPT divested its distribution and retail segments – FPT Trading (FPT
Synnex, Unlisted) and FPT Retail (FRT VN, Not Rated, CP: VND27,100) –
making it a pure technology company. As such, 95% of the company’s topline is
now generated from its telecom and technology segments. The remaining 5% is
mainly generated from education, which is closely linked to the development of
human resources.
Figure 10: FPT’s revenue generation by segment
SOURCES: VNDIRECT RESEARCH, COMPANY REPORTS

Conglomerate │ Vietnam
FPT Corporation │ December 11, 2019
6
Figure 11: FPT’s net revenue, profit after tax (VNDbn) and margins (%)
SOURCES: VNDIRECT RESEARCH, COMPANY REPORTS
FPT’s software outsourcing and telecom services segments, the main topline
contributors, have achieved high revenue growth over the past five years. In
FY14-18, software outsourcing and telecom services segments saw revenue
CAGR of 23.6% and 16.4%, respectively. Although the system integration and IT
services segment contributed significantly to FPT’s revenue, its CAGR stood at
a modest 3.8% in FY14-18. Online advertising revenue had a negative CAGR (-
8.8%) in FY14-18 after it shut down its online gaming operations in 2015.
Figure 12: Software outsourcing and telecom services segments
are key contributors to FPT’s revenue after divestment (VNDbn)
Figure 13: EBT margins by sub-sector (%)
SOURCES: VNDIRECT RESEARCH, COMPANY REPORTS SOURCES: VNDIRECT RESEARCH, COMPANY REPORTS
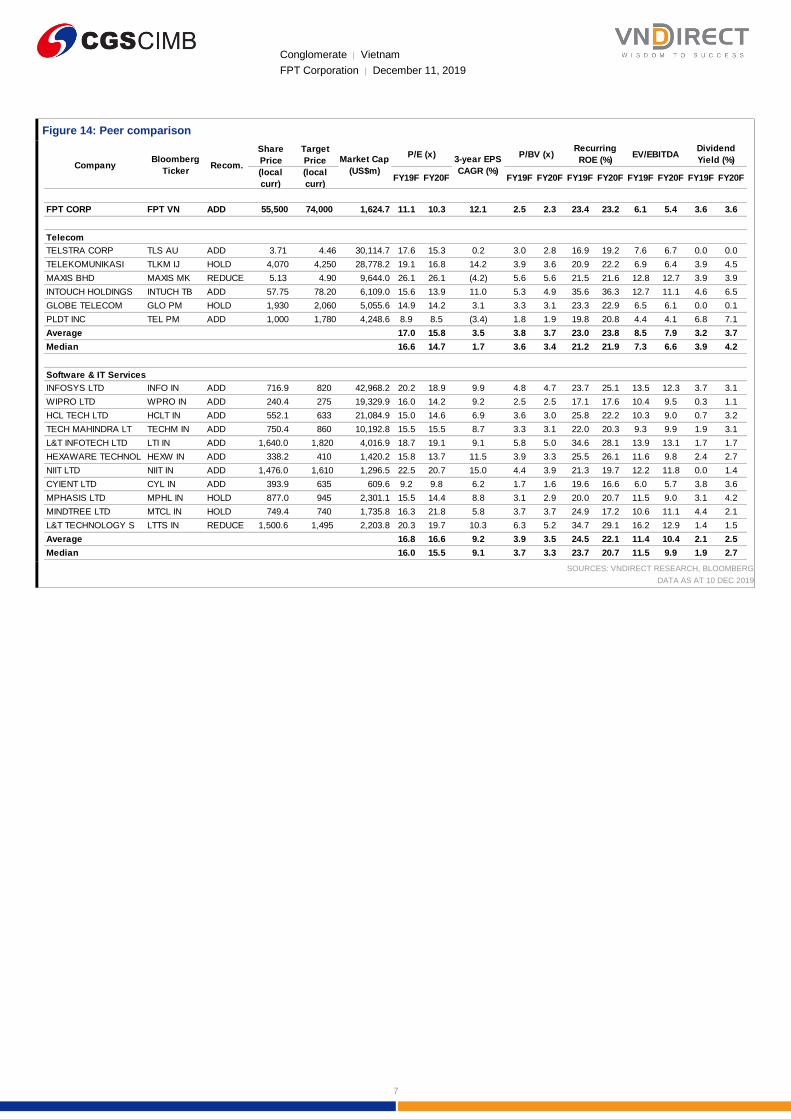
Currently, FPT trades at 11.3x FY19F P/E and 6.2x FY19F EV/EBITDA, a 27.5%
and 41.5% discount to regional peers’ averages, respectively. In fact, FPT's
products and business model are quite similar to several IT companies in India,
e.g. Infosys (INFO IN, Add, TP: Rs820), Wipro (WPRO IN, Add, TP: Rs275),
HCL Tech (HCLT IN, Add, TP: Rs1265) or NIIT (NIIT IN, Add, TP: Rs1610), etc.
Indian IT companies could be considered FPT’s competitors in the software
outsourcing business. We believe FPT could catch up with its regional peers in
terms of valuation following the divestment of its distribution and retail
businesses.
Margins have been rising since FY18 after the divestment of low-margin businesses – retail and distribution (average 13-14% GPM and 2-3% net profit margin).
Conglomerate │ Vietnam
FPT Corporation │ December 11, 2019
7
Figure 14: Peer comparison
SOURCES: VNDIRECT RESEARCH, BLOOMBERG
DATA AS AT 10 DEC 2019
Share
Price
Target
Price
(local
curr)
(local
curr)FY19F FY20F FY19F FY20F FY19F FY20F FY19F FY20F FY19F FY20F
FPT CORP FPT VN ADD 55,500 74,000 1,624.7 11.1 10.3 12.1 2.5 2.3 23.4 23.2 6.1 5.4 3.6 3.6
TELSTRA CORP TLS AU ADD 3.71 4.46 30,114.7 17.6 15.3 0.2 3.0 2.8 16.9 19.2 7.6 6.7 0.0 0.0
TELEKOMUNIKASI TLKM IJ HOLD 4,070 4,250 28,778.2 19.1 16.8 14.2 3.9 3.6 20.9 22.2 6.9 6.4 3.9 4.5
MAXIS BHD MAXIS MK REDUCE 5.13 4.90 9,644.0 26.1 26.1 (4.2) 5.6 5.6 21.5 21.6 12.8 12.7 3.9 3.9
INTOUCH HOLDINGS INTUCH TB ADD 57.75 78.20 6,109.0 15.6 13.9 11.0 5.3 4.9 35.6 36.3 12.7 11.1 4.6 6.5
GLOBE TELECOM GLO PM HOLD 1,930 2,060 5,055.6 14.9 14.2 3.1 3.3 3.1 23.3 22.9 6.5 6.1 0.0 0.1
PLDT INC TEL PM ADD 1,000 1,780 4,248.6 8.9 8.5 (3.4) 1.8 1.9 19.8 20.8 4.4 4.1 6.8 7.1
Average 17.0 15.8 3.5 3.8 3.7 23.0 23.8 8.5 7.9 3.2 3.7
Median 16.6 14.7 1.7 3.6 3.4 21.2 21.9 7.3 6.6 3.9 4.2
Software & IT Services
INFOSYS LTD INFO IN ADD 716.9 820 42,968.2 20.2 18.9 9.9 4.8 4.7 23.7 25.1 13.5 12.3 3.7 3.1
WIPRO LTD WPRO IN ADD 240.4 275 19,329.9 16.0 14.2 9.2 2.5 2.5 17.1 17.6 10.4 9.5 0.3 1.1
HCL TECH LTD HCLT IN ADD 552.1 633 21,084.9 15.0 14.6 6.9 3.6 3.0 25.8 22.2 10.3 9.0 0.7 3.2
TECH MAHINDRA LT TECHM IN ADD 750.4 860 10,192.8 15.5 15.5 8.7 3.3 3.1 22.0 20.3 9.3 9.9 1.9 3.1
L&T INFOTECH LTD LTI IN ADD 1,640.0 1,820 4,016.9 18.7 19.1 9.1 5.8 5.0 34.6 28.1 13.9 13.1 1.7 1.7
HEXAWARE TECHNOL HEXW IN ADD 338.2 410 1,420.2 15.8 13.7 11.5 3.9 3.3 25.5 26.1 11.6 9.8 2.4 2.7
NIIT LTD NIIT IN ADD 1,476.0 1,610 1,296.5 22.5 20.7 15.0 4.4 3.9 21.3 19.7 12.2 11.8 0.0 1.4
CYIENT LTD CYL IN ADD 393.9 635 609.6 9.2 9.8 6.2 1.7 1.6 19.6 16.6 6.0 5.7 3.8 3.6
MPHASIS LTD MPHL IN HOLD 877.0 945 2,301.1 15.5 14.4 8.8 3.1 2.9 20.0 20.7 11.5 9.0 3.1 4.2
MINDTREE LTD MTCL IN HOLD 749.4 740 1,735.8 16.3 21.8 5.8 3.7 3.7 24.9 17.2 10.6 11.1 4.4 2.1
L&T TECHNOLOGY S LTTS IN REDUCE 1,500.6 1,495 2,203.8 20.3 19.7 10.3 6.3 5.2 34.7 29.1 16.2 12.9 1.4 1.5
Average 16.8 16.6 9.2 3.9 3.5 24.5 22.1 11.4 10.4 2.1 2.5
Median 16.0 15.5 9.1 3.7 3.3 23.7 20.7 11.5 9.9 1.9 2.7
P/BV (x) Recurring
ROE (%)EV/EBITDA
Dividend
Yield (%)
Telecom
CompanyBloomberg
TickerRecom.
Market Cap
(US$m)
P/E (x)3-year EPS
CAGR (%)
Conglomerate │ Vietnam
FPT Corporation │ December 11, 2019
8
Technology: Digital transformation becomes the main driving force
Global demand tailwinds
Figure 15: Evolution of digital innovation
SOURCES: IDC
According to International Data Corporation (IDC), global spending on digital
transformation projects was US$1.07tr in 2018 and is expected to grow to
US$1.25tr in FY19F (+16.8% yoy) and US$1.97tr in FY22F, registering a CAGR
of 16.6%. IDC said 38% of all technology spending was on digital transformation
and that two-thirds of all firms have deployed IT initiatives in support of the
process. Whereas, according to Gartner, FY19F spending on traditional IT
services will rise 4.5% yoy to a record of US$1.03tr. Thus, the digital
transformation revenue growth rate is four times higher than that of traditional IT
services, suggesting vast potential opportunities in the market, in our view.
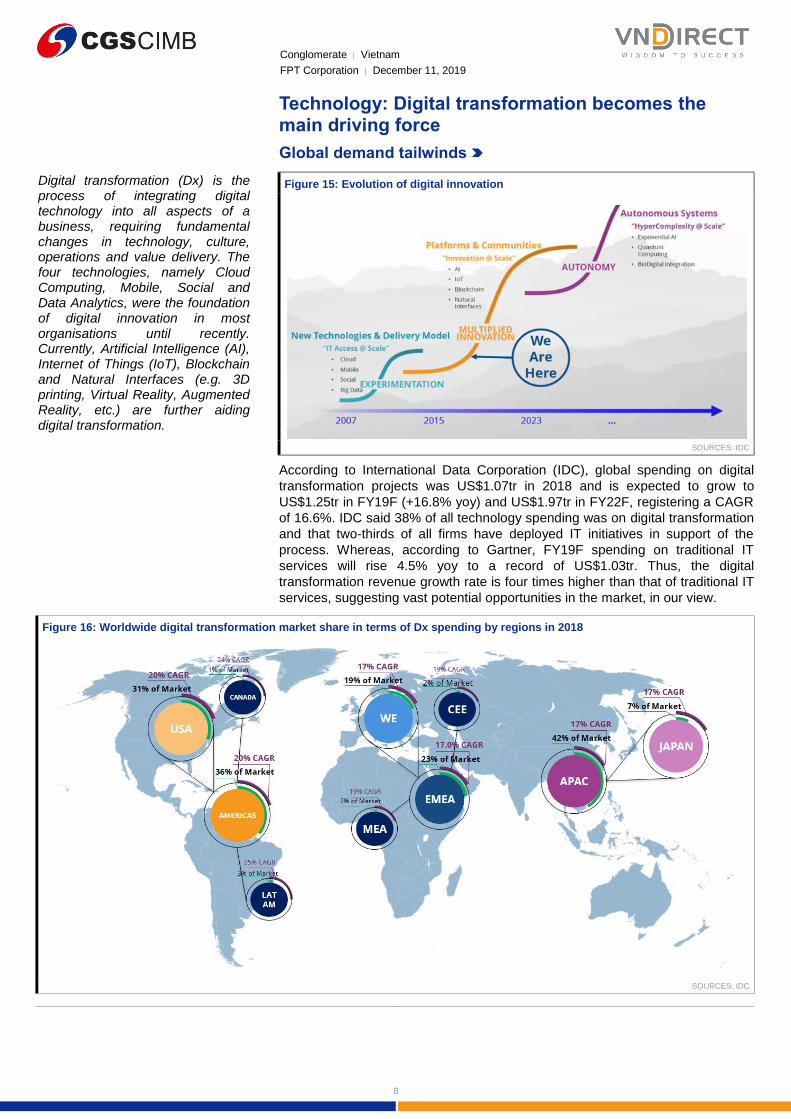
Figure 16: Worldwide digital transformation market share in terms of Dx spending by regions in 2018
SOURCES: IDC
Digital transformation (Dx) is the process of integrating digital technology into all aspects of a business, requiring fundamental changes in technology, culture, operations and value delivery. The four technologies, namely Cloud Computing, Mobile, Social and Data Analytics, were the foundation of digital innovation in most organisations until recently. Currently, Artificial Intelligence (AI), Internet of Things (IoT), Blockchain and Natural Interfaces (e.g. 3D printing, Virtual Reality, Augmented Reality, etc.) are further aiding digital transformation.
Conglomerate │ Vietnam
FPT Corporation │ December 11, 2019
9
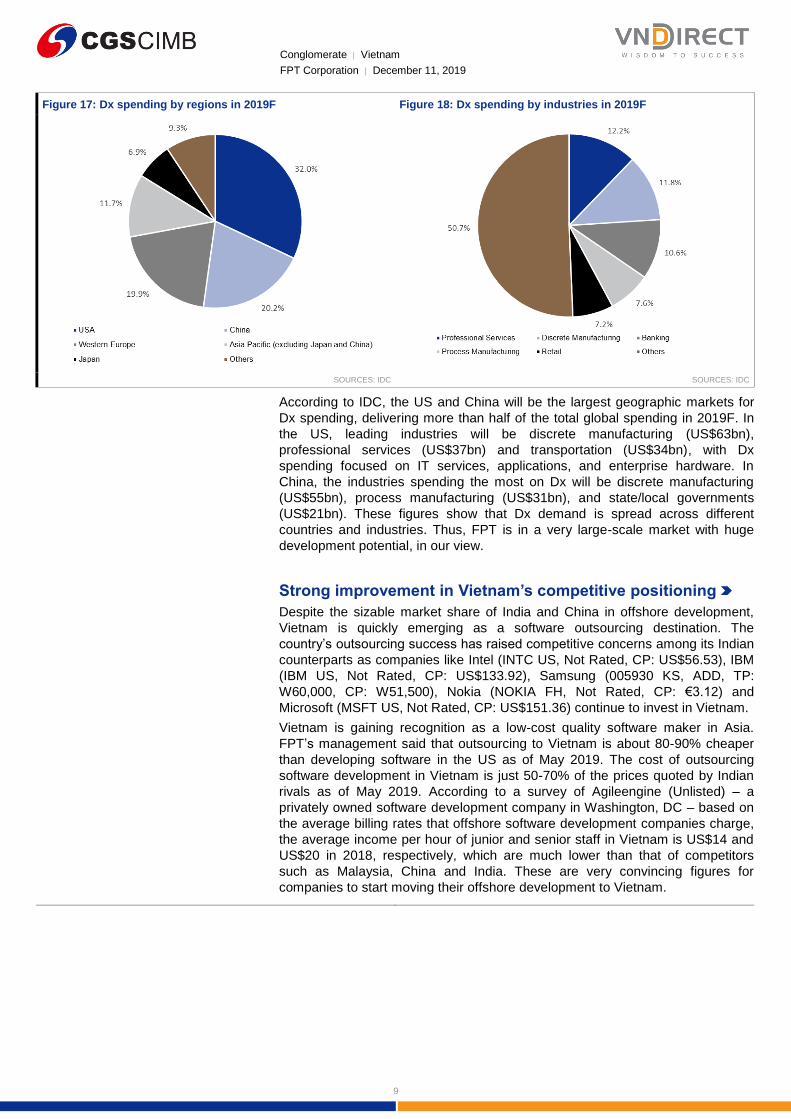
Figure 17: Dx spending by regions in 2019F Figure 18: Dx spending by industries in 2019F
SOURCES: IDC SOURCES: IDC
According to IDC, the US and China will be the largest geographic markets for
Dx spending, delivering more than half of the total global spending in 2019F. In
the US, leading industries will be discrete manufacturing (US$63bn),
professional services (US$37bn) and transportation (US$34bn), with Dx
spending focused on IT services, applications, and enterprise hardware. In
China, the industries spending the most on Dx will be discrete manufacturing
(US$55bn), process manufacturing (US$31bn), and state/local governments
(US$21bn). These figures show that Dx demand is spread across different
countries and industries. Thus, FPT is in a very large-scale market with huge
development potential, in our view.
Strong improvement in Vietnam’s competitive positioning
Despite the sizable market share of India and China in offshore development,
Vietnam is quickly emerging as a software outsourcing destination. The
country’s outsourcing success has raised competitive concerns among its Indian
counterparts as companies like Intel (INTC US, Not Rated, CP: US$56.53), IBM
(IBM US, Not Rated, CP: US$133.92), Samsung (005930 KS, ADD, TP:
W60,000, CP: W51,500), Nokia (NOKIA FH, Not Rated, CP: €3.12) and
Microsoft (MSFT US, Not Rated, CP: US$151.36) continue to invest in Vietnam.
Vietnam is gaining recognition as a low-cost quality software maker in Asia.
FPT’s management said that outsourcing to Vietnam is about 80-90% cheaper
than developing software in the US as of May 2019. The cost of outsourcing
software development in Vietnam is just 50-70% of the prices quoted by Indian
rivals as of May 2019. According to a survey of Agileengine (Unlisted) – a
privately owned software development company in Washington, DC – based on
the average billing rates that offshore software development companies charge,
the average income per hour of junior and senior staff in Vietnam is US$14 and
US$20 in 2018, respectively, which are much lower than that of competitors
such as Malaysia, China and India. These are very convincing figures for
companies to start moving their offshore development to Vietnam.

Conglomerate │ Vietnam
FPT Corporation │ December 11, 2019
10
Figure 19: Vietnam ranked 5/50 on Business Process
Outsourcing (BPO) in Jun, 2019 - 1 place higher than in 2017
Figure 20: Average billing rates (US$/hour) that offshore software
development companies charged in 2018 - Survey by Agileengine
SOURCES: A.T. KEARNEY GLOBAL LOCATION INDEX SOURCES: AGILEENGINE
Besides, Vietnam has a population of over 97.8m and the average age is 31
years old as at 08 Dec 2019. The young generation of skilled workers is highly
motivated and technologically advanced. This dynamic generation provides a
great pool of skilled software developers to meet the growing demand for
offshore development, in our view. Each year, more than 40,000 technical
engineers graduate from universities. With improved education, young
Vietnamese have overcome the English language barrier once considered a
weakness.
Vietnam is also convenient for several time zones. These include Australia,
Japan and other major economies, such as European nations and the UK. It is
easy to communicate during business hours and Vietnam is only a short flight
away from major cities. Even countries like the US and Canada are using
Vietnamese companies for IT outsourcing. The different time zones work in
everyone’s favour as the work is completed overnight.
These are a few of the reasons that we believe Vietnam is one of the best
locations in terms of global competitive positioning and technological
sophistication. In fact, FPT has succeeded by taking advantage of these factors
and becoming the country’s pioneer technology company, in our view.
Domestic modernisation momentum and government policy create opportunities
According to Fitch Solutions, IT spending in Vietnam will increase by 14% in
2019F to a total of VND134tr. Enterprise IT demand growth in Vietnam over
2019-2023F will be driven by both the adoption of basic informatisation and
more advanced solutions. There are large numbers of SMEs with none or very
low levels of informatisation, meaning there is huge potential for growth in
spending on hardware, software and services, in our view. Meanwhile, for larger
enterprises, the penetration rate of ERP, Supply Chain Management (SCM) and
Customers Relationship Management (CRM) software solutions is still far below
that of the developed markets.
Figure 21: Vietnam IT Industry – historical data and forecasts
SOURCES: FITCH SOLUTIONS ESTIMATES
Indicator 2017 2018 2019F 2020F 2021F 2022F 2023F
IT market value (VNDbn) 106,486 117,550 134,024 153,794 173,902 196,732 221,595
IT market value, % of GDP 2.1% 2.1% 2.2% 2.3% 2.3% 2.3% 2.4%
Computer hardware sales (VNDbn) 32,694 31,286 33,170 36,535 37,674 39,540 41,423
Personal computer sales (VNDbn) 19,457 18,439 19,472 21,548 22,046 23,015 24,117
Software sales (VNDbn) 13,201 15,574 18,804 22,763 26,865 31,779 37,676
Services sales (VNDbn) 60,591 70,691 82,050 94,496 109,363 125,413 142,496

Conglomerate │ Vietnam
FPT Corporation │ December 11, 2019
11
Fitch Solutions forecasts the computer hardware segment to return to growth in
2019F after a multi-year contraction but to continue to be an underperforming
category in the market because of the squeeze on retail PC demand due to
cannibalisation by smartphones. Fitch Solutions also forecasts the software and
services segments to continue to outperform in 2019F as the private and public
sectors continue to modernise, generating demand for application and system
software, system integration, consulting, training and data hosting services.
Figure 22: Vietnam enterprises’ IT spending by sector (% of Vietnam gross value
added)
SOURCES: NATIONAL STATISTICS, FITCH SOLUTIONS ESTIMATES
We expect the public sector to deliver solid momentum in IT services spending
over the medium term, including the further utilisation of outsourcing as well as
the adoption of e-government and cybersecurity solutions. Meanwhile, we
believe there will be significant opportunities for IT vendors as part of major
project spending, including green transport, flood risk management, hospitals,
utilities and the digitisation of the broadcast industry.
Vietnam has launched a ‘Made in Vietnam 4.0 Program’ as part of the country’s
efforts and preparation for the fourth industrial revolution, or Industry 4.0. The
programme aims to facilitate the development of new industries and encourage
new policies, mindsets and technology towards Industry 4.0 and its digital
economy ambitions, according to Prime Minister Nguyen Xuan Phuc during the
World Economic Forum (WEF) 2019 in Davos. In the context of strong Dx
development, the government, organisations and enterprises in Vietnam have
actively embraced and positively participated in activities to catch up with the
trend of the fourth Industrial Revolution. The government is promoting digital
economic development through a series of policy mechanisms and, in particular,
these policies have recently been reinforced by the Prime Minister's Directive No.
16/CT-TTg on increasing access to the fourth revolution.
The Vietnam Digital Transformation Alliance was launched by the Vietnam
Software & IT Services Association (VINASA) within the framework of the
Vietnam ICT Summit 2019. The alliance comprises leading technological firms in
Vietnam such as FPT, Viettel, CMC, VNG, and MobiFone. It aims to call on large
ICT enterprises, leading experts and institutes to co-operate with the
government, ministries, public organisations and enterprises to speed up Dx
progress in Vietnam. With the strong policy support, we believe FPT is well
poised to develop core Dx technologies.
We expect FPT IS to achieve a revenue of VND5,082bn in FY19F, an increase
of 2.5% yoy, mainly from ERP and system integration contracts with local banks.
We project a conservative revenue growth rate for FPT IS with a CAGR of FY19-
23F of 2% due to the low growth rate of domestic hardware services and system
integration.
FPT is moving up the value chain
FPT has started providing Dx solutions and consultancy services to move up the
software value chain. Moreover, FPT has launched a series of software products
Sector 2017 2018 2019F 2020F 2021F 2022F 2023F
Agricuture 17.05% 17.21% 17.37% 17.52% 17.65% 17.78% 17.89%
Mining 8.30% 8.20% 7.44% 6.74% 6.11% 5.54% 5.02%
Manufacturing 17.03% 16.73% 16.46% 16.19% 15.94% 15.72% 15.51%
Construction 6.37% 6.49% 6.68% 6.82% 6.96% 7.08% 7.19%
Finance 6.08% 6.29% 6.39% 6.49% 6.58% 6.66% 6.73%
Real estate 5.32% 5.66% 5.69% 5.71% 5.72% 5.74% 5.75%
Other services 4.63% 4.78% 4.85% 4.93% 5.00% 5.06% 5.11%
Utilities 5.40% 5.41% 5.41% 5.41% 5.42% 5.42% 5.42%
Trade & tourism 16.16% 15.93% 16.15% 16.37% 16.56% 16.73% 16.89%
Transport & communications 3.71% 3.87% 3.90% 3.93% 3.95% 3.98% 4.00%
Public sector 9.94% 9.42% 9.66% 9.90% 10.11% 10.30% 10.48%
Figure 26: Establishment of Vietnam’s
Dx alliance in Aug 2019
Sources: VIETNAM ICT SUMMIT 2019
Some industries in Vietnam are digitising rapidly, including e-commerce, tourism, construction, agriculture and finance. These industries show high potential for Vietnam’s digital economy in the coming years, in our view.

Conglomerate │ Vietnam
FPT Corporation │ December 11, 2019
12
to showcase its ability to develop patented products and reduce dependence on
outsourcing.
Figure 23: FPT provides comprehensive Dx platforms for businesses
SOURCES: VNDIRECT RESEARCH, COMPANY REPORTS
Figure 24: Technology products launched by FPT Software as of Sep 2019
SOURCES: FPT, VNDIRECT RESEARCH
FPT Software’s management said that it will invest strongly in developing AI
platforms during FY19-21F to make it the core function of new applications;
more importantly, AI might help to optimise the operations of businesses and
benefit end users. FPT expects to position itself as a world-class AI centre
capable of meeting 80% of the AI demand of the global business sector. Beyond
AI, FPT has also allocated financial resources to R&D for other core
technologies to improve its technological capabilities, generate more competitive
advantages as well as upgrade its solutions/services portfolio, such as big data,
cloud computing, blockchain, etc.
Products & Solutions Descriptions
FPT.AI Conversation
Is the foundation for creating AI Chatbot. Integrated into popular chat interfaces.
Chatbot FPT.AI allows business to interact directly with customers through natural
conversations, giving them effective experiences.
FPT.AI SpeechAllows users to convert speech into text (in Vietnamese) and vise verse, with
intonation and full selection of regional dialects and gender voices.
FPT.AI Vision
Helps enterprises to identity and digitise customer information based on personal
identification documents with an accuracy of up to 95%, helping businesses reduce
costs from manual data editing in CRM or in data management systems.
AkaTrans
Is a smart translation assisting system which leverages cutting edge technology to
significantly improve translator's productivity and reduce translation time. Accuracy
reaches up to 90% compared with human translations between Japanese and
Vietnamese languages.
AkaBotIs a comprehensive Robotic process automation solution, helping to automate
business processes for enterprises in various sectors.
AkaChain
Simplifies the development and managing a private blockchain system by providing
automatic deployment solution on different cloud infrastructure, development/
monitoring toolkits, ready-made business application templates, and professional
support services.
AkaDoc
Helps organisations use data in the most effective way by turning any type of
document (image, pdf…) into editable digital format while minimising errors, costs and
improving customer engagement.
Utop
Bridges loyalty point programs among merchants. Utop makes it easy and convenient
for users to garner and redeem loyalty points at retailers within the same network,
thereby enabling small businesses to grow faster.
Autonomous driving carManaged to acquire level 3 out of five levels of driving automation and hopefully by the
end of 2019 it would gain one more notch.
Based on well-researched technology development, investment over the years and a keen grasp on new technology trends, FPT has focused on building core technologies, improving its technological capabilities and competitiveness.

Conglomerate │ Vietnam
FPT Corporation │ December 11, 2019
13
Conquering the world market with M&A synergies
Compared to Japan, the US and EU markets are very different for Vietnamese
IT service companies. To penetrate and expand into these markets, FPT
pursues an M&A strategy to buy local companies. The most notable deals were
the acquisitions with Rheinisch-Westfälische Elektrizitätswerke (RWE) IT
Slovakia (Unlisted) in Europe (2014) and Intellinet Atlanta (Unlisted) in the
United States (2018). For the latest deal, FPT paid US$30m for a 90% stake in
Intellinet (Unlisted). With this new partnership, Intellinet enhances FPT’s
offerings with strategy and management consulting capabilities and becomes
part of a company with immense offshore capacity and which focuses on digital
transformation.
Figure 25: Share of globalisation technology revenue (VNDbn)
SOURCES: VNDIRECT RESEARCH, COMPANY REPORTS
Intellinet does not expect revenue to grow in FY19F but the benefits for FPT
Software from synergies are significant. In particular, the value of deals from
Intellinet customers in the US market to FPT may reach US$5m in FY19F. In
addition, with more advanced consulting skills, the average selling price of FPT's
Dx products and services sold through Intellinet is 30% higher than when sold by
FPT itself.
Figure 26: FPT technology revenue from foreign markets by services in 1H19 (VNDbn)
SOURCES: VNDIRECT RESEARCH, COMPANY REPORTS
Revenue from overseas markets continued to witness solid growth in 10M19. FPT’s global market revenue reached VND8,781bn in 10M19, up 31.4% yoy, accounting for 72.8% of technology revenue. The profit before tax margin increased slightly to 16.4% in 10M19 from 15.9% in 10M18. All markets achieved high growth in revenue, especially the US, where revenue soared 56.4% yoy to VND2,196bn in 10M19. In recent years, FPT’s strategic focus has been the global markets, with an average annual revenue growth of approximately 30%. Revenue from foreign markets is expected to account for nearly 70% of FPT's technology revenue in FY19F.
Dx consulting becomes a part of company technology revenue after the Intellinet M&A in 2018. In 1H19, Intellinet contributed 5% of FPT’s technology revenue.
Conglomerate │ Vietnam
FPT Corporation │ December 11, 2019
14
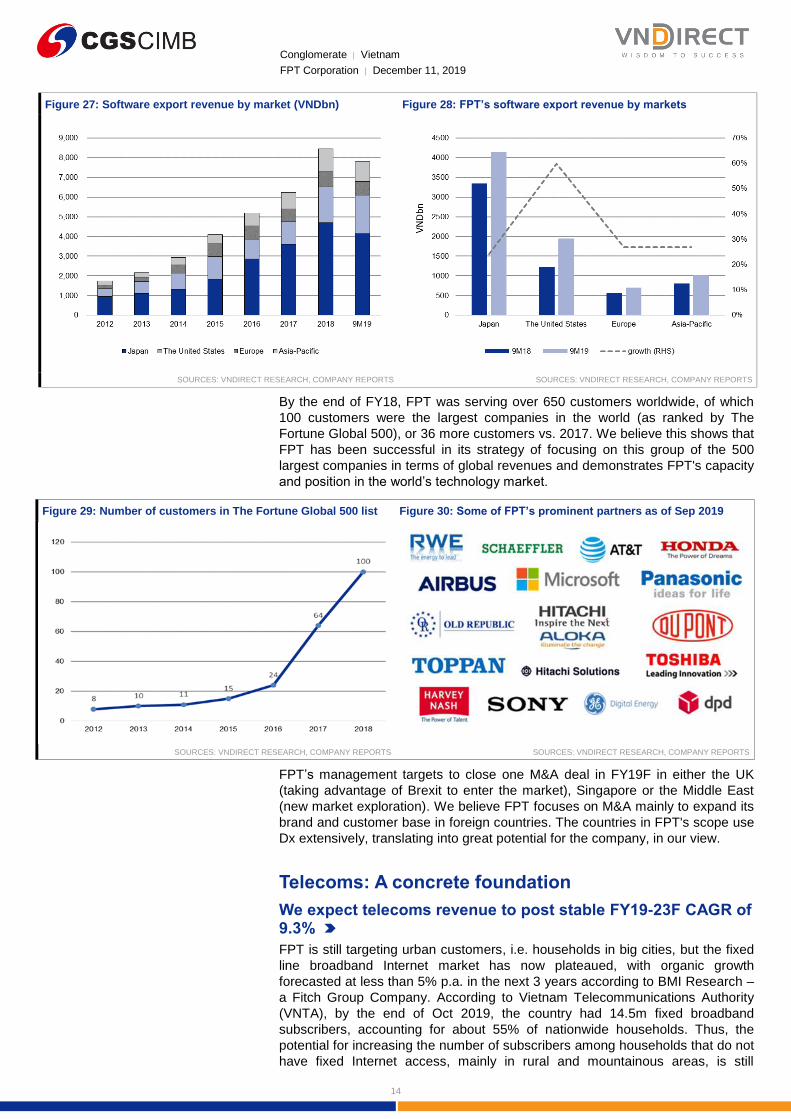
Figure 27: Software export revenue by market (VNDbn) Figure 28: FPT’s software export revenue by markets
SOURCES: VNDIRECT RESEARCH, COMPANY REPORTS SOURCES: VNDIRECT RESEARCH, COMPANY REPORTS
By the end of FY18, FPT was serving over 650 customers worldwide, of which
100 customers were the largest companies in the world (as ranked by The
Fortune Global 500), or 36 more customers vs. 2017. We believe this shows that
FPT has been successful in its strategy of focusing on this group of the 500
largest companies in terms of global revenues and demonstrates FPT's capacity
and position in the world’s technology market.
Figure 29: Number of customers in The Fortune Global 500 list Figure 30: Some of FPT’s prominent partners as of Sep 2019
SOURCES: VNDIRECT RESEARCH, COMPANY REPORTS SOURCES: VNDIRECT RESEARCH, COMPANY REPORTS
FPT’s management targets to close one M&A deal in FY19F in either the UK
(taking advantage of Brexit to enter the market), Singapore or the Middle East
(new market exploration). We believe FPT focuses on M&A mainly to expand its
brand and customer base in foreign countries. The countries in FPT's scope use
Dx extensively, translating into great potential for the company, in our view.
Telecoms: A concrete foundation
We expect telecoms revenue to post stable FY19-23F CAGR of 9.3%
FPT is still targeting urban customers, i.e. households in big cities, but the fixed
line broadband Internet market has now plateaued, with organic growth
forecasted at less than 5% p.a. in the next 3 years according to BMI Research –
a Fitch Group Company. According to Vietnam Telecommunications Authority
(VNTA), by the end of Oct 2019, the country had 14.5m fixed broadband
subscribers, accounting for about 55% of nationwide households. Thus, the
potential for increasing the number of subscribers among households that do not
have fixed Internet access, mainly in rural and mountainous areas, is still
Conglomerate │ Vietnam
FPT Corporation │ December 11, 2019
15
substantial and we think this will be the main driver for revenue growth for FPT
Telecom (FOX, Not Rated, CP: VND46,500) – a subsidiary which provides fixed-
line Internet services.
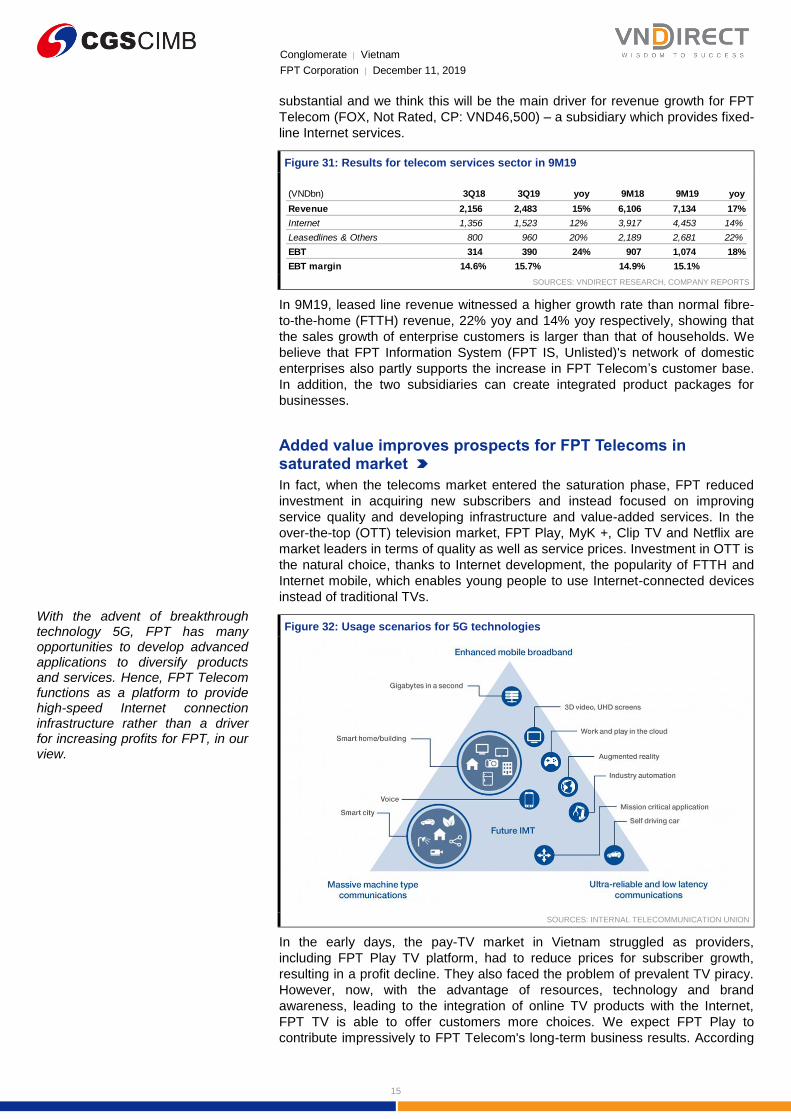
Figure 31: Results for telecom services sector in 9M19
SOURCES: VNDIRECT RESEARCH, COMPANY REPORTS
In 9M19, leased line revenue witnessed a higher growth rate than normal fibre-
to-the-home (FTTH) revenue, 22% yoy and 14% yoy respectively, showing that
the sales growth of enterprise customers is larger than that of households. We
believe that FPT Information System (FPT IS, Unlisted)'s network of domestic
enterprises also partly supports the increase in FPT Telecom’s customer base.
In addition, the two subsidiaries can create integrated product packages for
businesses.
Added value improves prospects for FPT Telecoms in saturated market
In fact, when the telecoms market entered the saturation phase, FPT reduced
investment in acquiring new subscribers and instead focused on improving
service quality and developing infrastructure and value-added services. In the
over-the-top (OTT) television market, FPT Play, MyK +, Clip TV and Netflix are
market leaders in terms of quality as well as service prices. Investment in OTT is
the natural choice, thanks to Internet development, the popularity of FTTH and
Internet mobile, which enables young people to use Internet-connected devices
instead of traditional TVs.
Figure 32: Usage scenarios for 5G technologies
SOURCES: INTERNAL TELECOMMUNICATION UNION
In the early days, the pay-TV market in Vietnam struggled as providers,
including FPT Play TV platform, had to reduce prices for subscriber growth,
resulting in a profit decline. They also faced the problem of prevalent TV piracy.
However, now, with the advantage of resources, technology and brand
awareness, leading to the integration of online TV products with the Internet,
FPT TV is able to offer customers more choices. We expect FPT Play to
contribute impressively to FPT Telecom's long-term business results. According
(VNDbn) 3Q18 3Q19 yoy 9M18 9M19 yoy
Revenue 2,156 2,483 15% 6,106 7,134 17%
Internet 1,356 1,523 12% 3,917 4,453 14%
Leasedlines & Others 800 960 20% 2,189 2,681 22%
EBT 314 390 24% 907 1,074 18%
EBT margin 14.6% 15.7% 14.9% 15.1%
With the advent of breakthrough technology 5G, FPT has many opportunities to develop advanced applications to diversify products and services. Hence, FPT Telecom functions as a platform to provide high-speed Internet connection infrastructure rather than a driver for increasing profits for FPT, in our view.

Conglomerate │ Vietnam
FPT Corporation │ December 11, 2019
16
to FPT’s management, pay-TV may break-even in FY21F and turn into profit
making from FY22F onwards.
We expect telecom revenue to increase 14.0% yoy to reach VND10,065bn in
FY19F and post a CAGR of 9.3% from FY19-23F. Of this projected revenue
figure, we estimate the telecom services sector will to contribute 94.3%, a rise of
14.5% yoy, representing a concrete foundation for FPT's ICT ecosystem. We
expect the online advertising sector to generate VND570bn of revenue in FY19F,
up 5.9% yoy. We do not see a breakthrough from this business in FY19-20F.
Figure 33: Telecoms’ contribution to FPT’s revenue is shrinking due to the expansion of technology segment
SOURCES: VNDIRECT RESEARCH, COMPANY REPORTS
FPT will have to build infrastructure and reduce selling prices to attract
customers in rural areas, in our view, which will in turn cut the gross profit
margin of the telecom segment in the long term. In the short term, however, the
we still expect the gross profit margin to remain high, thanks to government
support. Specifically, on 16 Jul 2018, the government approved Decision No.
868/QD-TTG to reduce the annual contribution to the Vietnam Public-Utility
Telecommunication Service Fund to 0.7% of broadband revenue from 1.5%. We
expect the telecom segment gross margin to be around 49-50% in FY19F.
Education: A strategic puzzle in FPT’s long-term ecosystem
According to the Ministry of Information and Communications (MIC), Vietnam’s
Information Technology (IT) industry will require about 1.2m staff by 2020F.
However, the supply is expected by MIC to fall short of some 500,000 people.
Human resources in the IT sector in 2020F can only meet 58% of the actual
demand. We believe that the demand for IT staff will continue to rise in the
coming years, making the prospects for FPT’s education segment especially
bright.
Currently, FPT is building Phase 2 of Can Tho FPT University, including the
Gama building, a high school, a park and dormitories. In addition, FPT has
received approval to expand the software campus in Quy Nhon city on an area
of up to 38ha. FPT has also bolstered student exchange activities, having signed
a memorandum of understanding with the Korean Academy of Science and
Technology on 17 Jul 2019 to exchange graduate students and transfer
technology from South Korea to Vietnam.
Furthermore, a new campus of FPT University in Ho Chi Minh City’s district 9,
capable of hosting about 10,000 students, was scheduled to start operations in
the 2019-20F school year. This campus has an 11-storey complex on a land
area of 22,540 sq m.

Conglomerate │ Vietnam
FPT Corporation │ December 11, 2019
17
We expect that the number of new students in FY19F will maintain a high growth
rate of over 40% yoy, driven by newly-opened training facilities in Hanoi, Da
Nang and Can Tho. In 9M19, FPT's enrollment at all educational levels grew
significantly by 19.8% yoy, with 2,360 new students. In 10M19, the total number
of students in the whole education system of FPT reached about 49,000, up
over 34% yoy. This also presents an abundant supply of future labour for FPT.
Figure 34: FPT’s educational segment delivered rapid enrolment
growth (yoy) in 9M19
Figure 35: Total number of students in FPT’s business increased
34% yoy to 49,000 students in 10M19
SOURCES: VNDIRECT RESEARCH, COMPANY REPORTS SOURCES: VNDIRECT RESEARCH, COMPANY REPORTS
We expect EPS CAGR of 12.1% over FY19-21F
Figure 36: VNDIRECT’s detailed forecasts of FPT performance for FY19-23F
SOURCES: VNDIRECT RESEARCH, COMPANY REPORTS
Overall, we hold a positive view on FPT’s outlook, with an expectation that
revenue growth in the technology segment will find a breakthrough to exceed
US$1bn by FY22F, thanks to the Dx business line while the telecom segment
stays on track. We project an EPS CAGR of 14.4% over FY19-23F.
VNDbn 2018 2019F 2020F 2021F 2022F 2023F
Net revenue 23,214 27,757 32,452 37,570 43,292 49,823
%yoy -45.6% 19.6% 16.9% 15.8% 15.2% 15.1%
Technology 13,401 15,942 19,010 22,433 26,441 31,080
%yoy 20.9% 19.0% 19.2% 18.0% 17.9% 17.5%
Telecom 8,831 10,065 11,368 12,728 14,129 15,684
%yoy 15.4% 14.0% 13.0% 12.0% 11.0% 11.0%
Education % others 1,376 1,750 2,073 2,408 2,722 3,059
%yoy 31.8% 27.2% 18.5% 16.2% 13.0% 12.4%
Gross profit 8,723 10,725 12,662 14,819 17,283 20,149
Blended GPM 37.6% 38.6% 39.0% 39.4% 39.9% 40.4%
SG&A 5,601 6,634 7,756 8,979 10,347 11,908
as % of revenue 24.1% 23.9% 23.9% 23.9% 23.9% 23.9%
Pre-tax profit 3,858 4,807 5,729 6,779 7,996 9,431
Profit after tax 3,234 4,007 4,775 5,651 6,665 7,862
Minority interest 614 784 935 1,106 1,305 1,539
Net profit 2,620 3,222 3,841 4,545 5,361 6,323
%yoy -10.6% 23.0% 19.2% 18.3% 18.0% 17.9%
Conglomerate │ Vietnam
FPT Corporation │ December 11, 2019
18
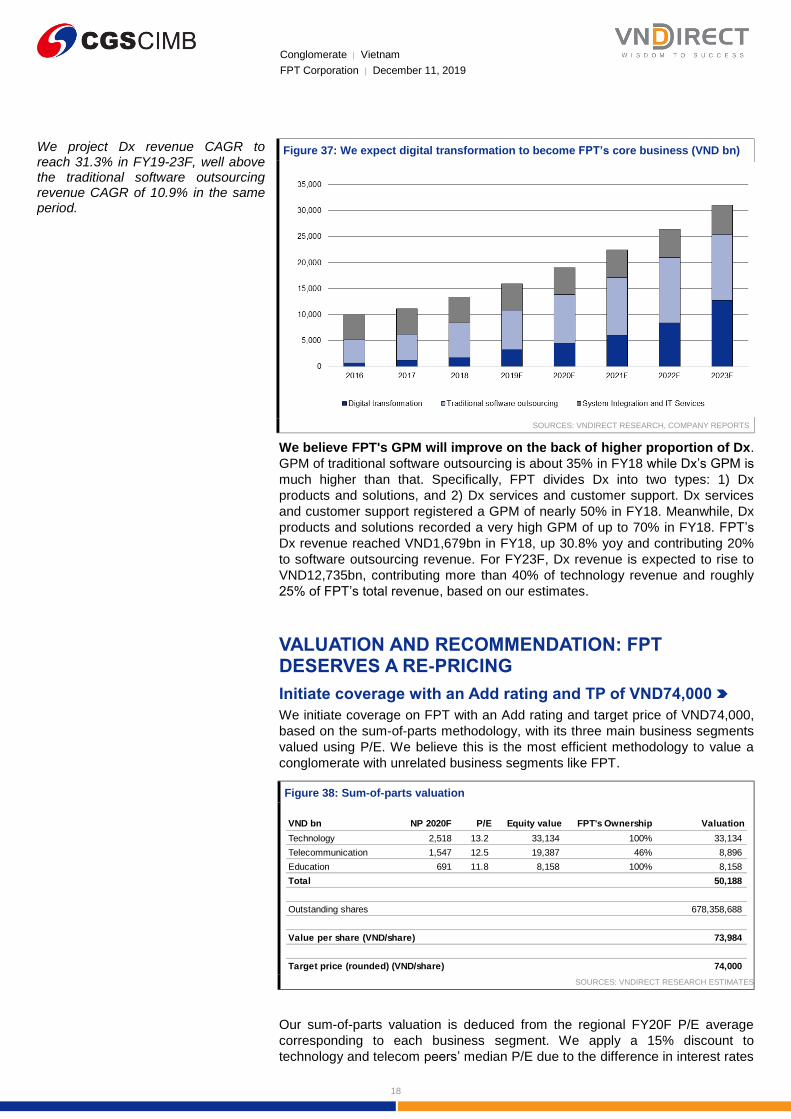
We project Dx revenue CAGR to reach 31.3% in FY19-23F, well above the traditional software outsourcing revenue CAGR of 10.9% in the same period.
Figure 37: We expect digital transformation to become FPT’s core business (VND bn)
SOURCES: VNDIRECT RESEARCH, COMPANY REPORTS
We believe FPT's GPM will improve on the back of higher proportion of Dx.
GPM of traditional software outsourcing is about 35% in FY18 while Dx’s GPM is
much higher than that. Specifically, FPT divides Dx into two types: 1) Dx
products and solutions, and 2) Dx services and customer support. Dx services
and customer support registered a GPM of nearly 50% in FY18. Meanwhile, Dx
products and solutions recorded a very high GPM of up to 70% in FY18. FPT’s
Dx revenue reached VND1,679bn in FY18, up 30.8% yoy and contributing 20%
to software outsourcing revenue. For FY23F, Dx revenue is expected to rise to
VND12,735bn, contributing more than 40% of technology revenue and roughly
25% of FPT’s total revenue, based on our estimates.
VALUATION AND RECOMMENDATION: FPT DESERVES A RE-PRICING
Initiate coverage with an Add rating and TP of VND74,000
We initiate coverage on FPT with an Add rating and target price of VND74,000,
based on the sum-of-parts methodology, with its three main business segments
valued using P/E. We believe this is the most efficient methodology to value a
conglomerate with unrelated business segments like FPT.
Figure 38: Sum-of-parts valuation
SOURCES: VNDIRECT RESEARCH ESTIMATES
Our sum-of-parts valuation is deduced from the regional FY20F P/E average
corresponding to each business segment. We apply a 15% discount to
technology and telecom peers’ median P/E due to the difference in interest rates
VND bn NP 2020F P/E Equity value FPT's Ownership Valuation
Technology 2,518 13.2 33,134 100% 33,134
Telecommunication 1,547 12.5 19,387 46% 8,896
Education 691 11.8 8,158 100% 8,158
Total 50,188
Outstanding shares 678,358,688
Value per share (VND/share) 73,984
Target price (rounded) (VND/share) 74,000

Conglomerate │ Vietnam
FPT Corporation │ December 11, 2019
19
between Vietnam and other observed countries. Education has a minor
contribution to FPT's profit so we believe the current FPT’s TTM P/E is
reasonable.
We arrive at a fair value of VND74,000/share for FPT. We believe FPT deserves
to be re-rated on the back of higher proportion of patented software products,
which should lead to higher gross margins.
FPT has seen its share price fall 10.7% from its peak price of VND61,000
(equivalent to a FY20F P/E of 10.7x) on 12 Nov 2019 due to the recent market
correction and we think this is an opportunity to accumulate a stock with quality
assets.
Figure 39: FPT’s stock price performance (as of 10 Dec 2019)
SOURCES: VNDIRECT RESEARCH, BLOOMBERG
SWOT ANALYSIS
Figure 40: SWOT Analysis
SOURCES: VNDIRECT RESEARCH
RISKS AND CATALYSTS
Downside risks
Fierce competition from Chinese and Indian peers in overseas markets and
from domestic Internet service providers in the telecom segment.
In the global market, India is generally the first IT outsourcing destination for
businesses to seek out service given it has a mature software industry with a
large number of skillful IT specialists. As such, we predict that India will
continue to be a favourite destination for IT outsourcing. In second place is
China with its strengths being low costs and productive labour, in our view.
Strengths Opportunities
1. As a leading IT enterprise in Vietnam, customers are
large corporations, government ministries, agencies
and public organizations.
1. Vietnam's IT market is growing rapidly with a FY19-
23F CAGR of about 13%, double GDP growth rate.
2. Occupying a large market share in Vietnam's ICT
industry.
2. Benefits from Government policy with strategic plans
to develop domestic IT industry.
3. One of the strongest broadband providers in Vietnam
with wide network, advanced technical infrastructure
and good quality service.
3. The wave of global digital transformation with a FY19-
22F CAGR of more than 16% could bring growth
opportunities for FPT.
Weaknesses Threats
1. Lower competitiveness in price compared to direct
competitors, especially in the field of
telecommunications.
1. Fierce competition with other suppliers.
2. The online advertising sector has not had a
breakthrough, Pay-TV still suffer losses.
Conglomerate │ Vietnam
FPT Corporation │ December 11, 2019
20
We believe that competition from these two countries is a big challenge for
FPT in terms of its ability to gain global market share.
Domestically, we believe fierce competition from two large state-owned
carriers – Viettel (Unlisted) and VNPT (Unlisted) is a concern for FPT in the
telecom segment. To compete, FPT needs to boost spending on upgrading
infrastructure to expand its penetration, which would lead to rising investment
costs.
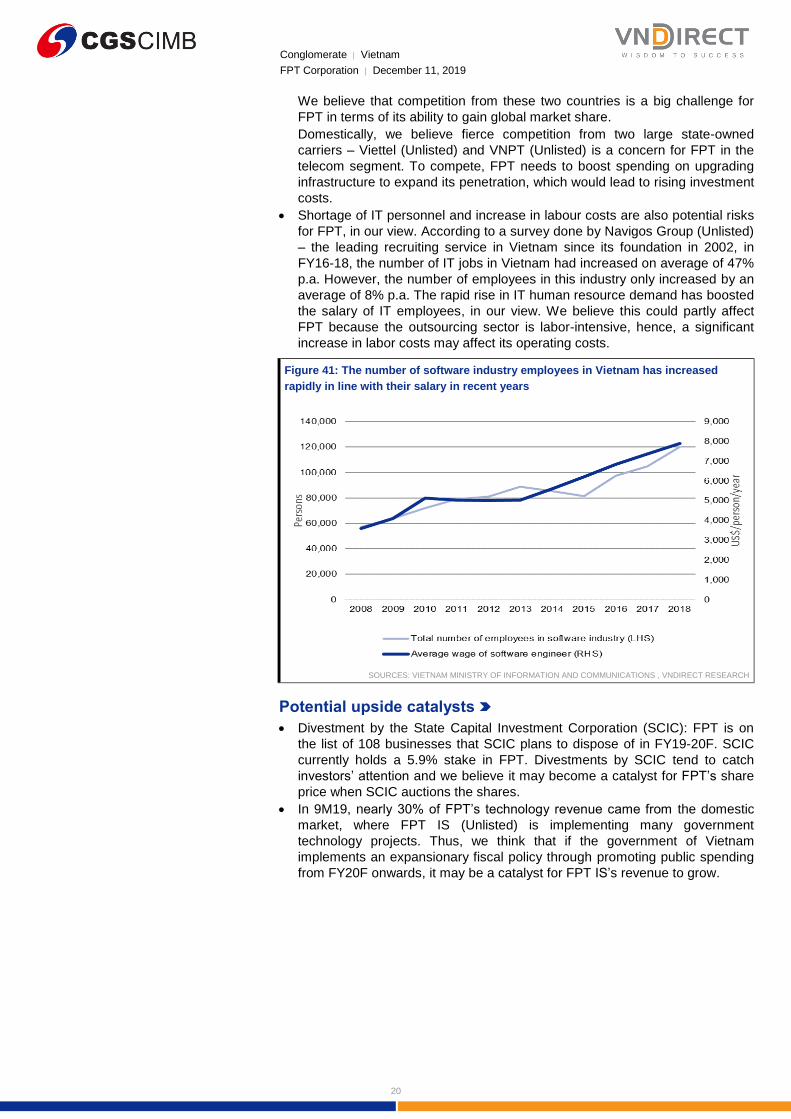
Shortage of IT personnel and increase in labour costs are also potential risks
for FPT, in our view. According to a survey done by Navigos Group (Unlisted)
– the leading recruiting service in Vietnam since its foundation in 2002, in
FY16-18, the number of IT jobs in Vietnam had increased on average of 47%
p.a. However, the number of employees in this industry only increased by an
average of 8% p.a. The rapid rise in IT human resource demand has boosted
the salary of IT employees, in our view. We believe this could partly affect
FPT because the outsourcing sector is labor-intensive, hence, a significant
increase in labor costs may affect its operating costs.
Figure 41: The number of software industry employees in Vietnam has increased
rapidly in line with their salary in recent years
SOURCES: VIETNAM MINISTRY OF INFORMATION AND COMMUNICATIONS , VNDIRECT RESEARCH
Potential upside catalysts
Divestment by the State Capital Investment Corporation (SCIC): FPT is on
the list of 108 businesses that SCIC plans to dispose of in FY19-20F. SCIC
currently holds a 5.9% stake in FPT. Divestments by SCIC tend to catch
investors’ attention and we believe it may become a catalyst for FPT’s share
price when SCIC auctions the shares.
In 9M19, nearly 30% of FPT’s technology revenue came from the domestic
market, where FPT IS (Unlisted) is implementing many government
technology projects. Thus, we think that if the government of Vietnam
implements an expansionary fiscal policy through promoting public spending
from FY20F onwards, it may be a catalyst for FPT IS’s revenue to grow.
Conglomerate │ Vietnam
FPT Corporation │ December 11, 2019
21
APPENDIX
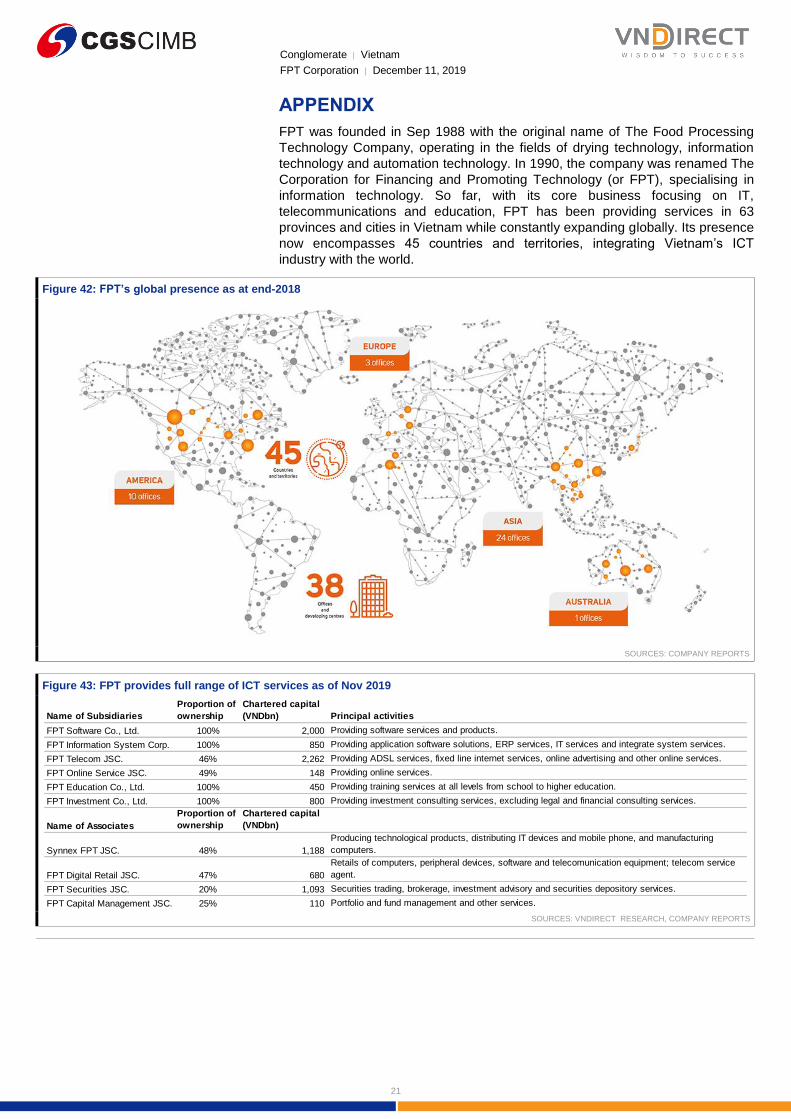
FPT was founded in Sep 1988 with the original name of The Food Processing
Technology Company, operating in the fields of drying technology, information
technology and automation technology. In 1990, the company was renamed The
Corporation for Financing and Promoting Technology (or FPT), specialising in
information technology. So far, with its core business focusing on IT,
telecommunications and education, FPT has been providing services in 63
provinces and cities in Vietnam while constantly expanding globally. Its presence
now encompasses 45 countries and territories, integrating Vietnam’s ICT
industry with the world.
Figure 42: FPT’s global presence as at end-2018
SOURCES: COMPANY REPORTS
Figure 43: FPT provides full range of ICT services as of Nov 2019
SOURCES: VNDIRECT RESEARCH, COMPANY REPORTS
Name of Subsidiaries
Proportion of
ownership
Chartered capital
(VNDbn) Principal activities
FPT Software Co., Ltd. 100% 2,000 Providing software services and products.
FPT Information System Corp. 100% 850 Providing application software solutions, ERP services, IT services and integrate system services.
FPT Telecom JSC. 46% 2,262 Providing ADSL services, fixed line internet services, online advertising and other online services.
FPT Online Service JSC. 49% 148 Providing online services.
FPT Education Co., Ltd. 100% 450 Providing training services at all levels from school to higher education.
FPT Investment Co., Ltd. 100% 800 Providing investment consulting services, excluding legal and financial consulting services.
Name of Associates
Proportion of
ownership
Chartered capital
(VNDbn)
Synnex FPT JSC. 48% 1,188
Producing technological products, distributing IT devices and mobile phone, and manufacturing
computers.
FPT Digital Retail JSC. 47% 680
Retails of computers, peripheral devices, software and telecomunication equipment; telecom service
agent.
FPT Securities JSC. 20% 1,093 Securities trading, brokerage, investment advisory and securities depository services.
FPT Capital Management JSC. 25% 110 Portfolio and fund management and other services.
Conglomerate │ Vietnam
FPT Corporation │ December 11, 2019
22
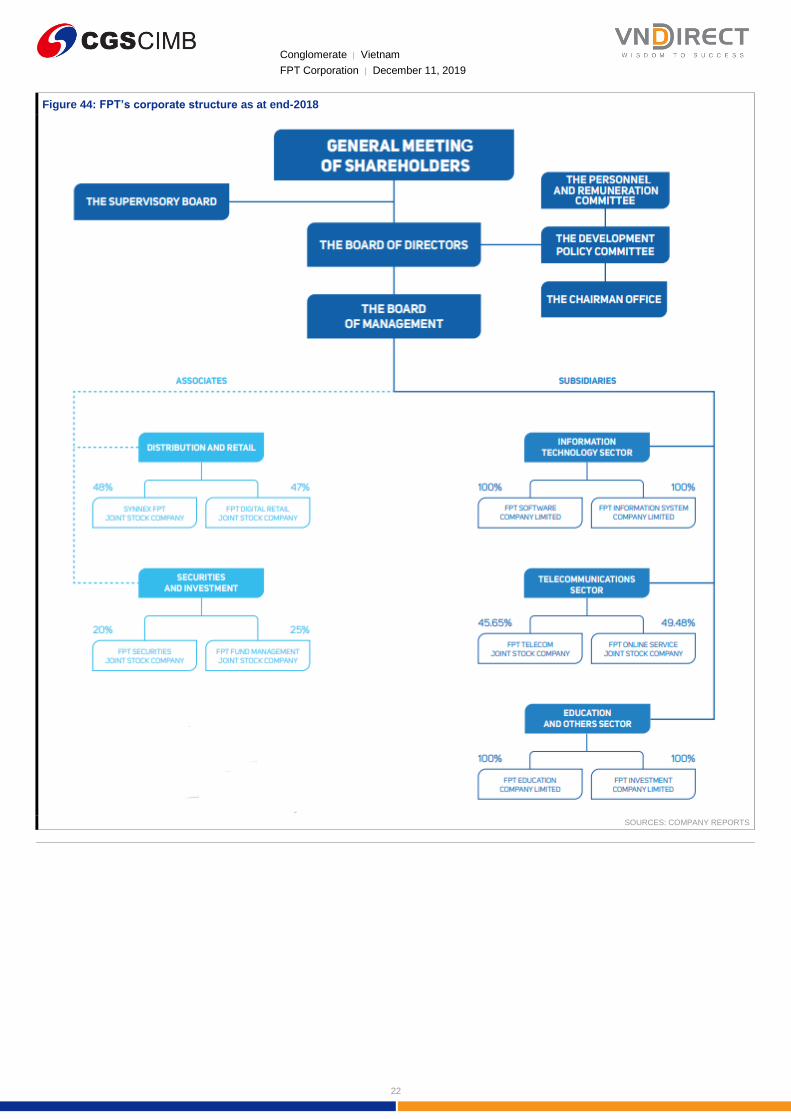
Figure 44: FPT’s corporate structure as at end-2018
SOURCES: COMPANY REPORTS
Conglomerate │ Vietnam
FPT Corporation │ December 11, 2019
23
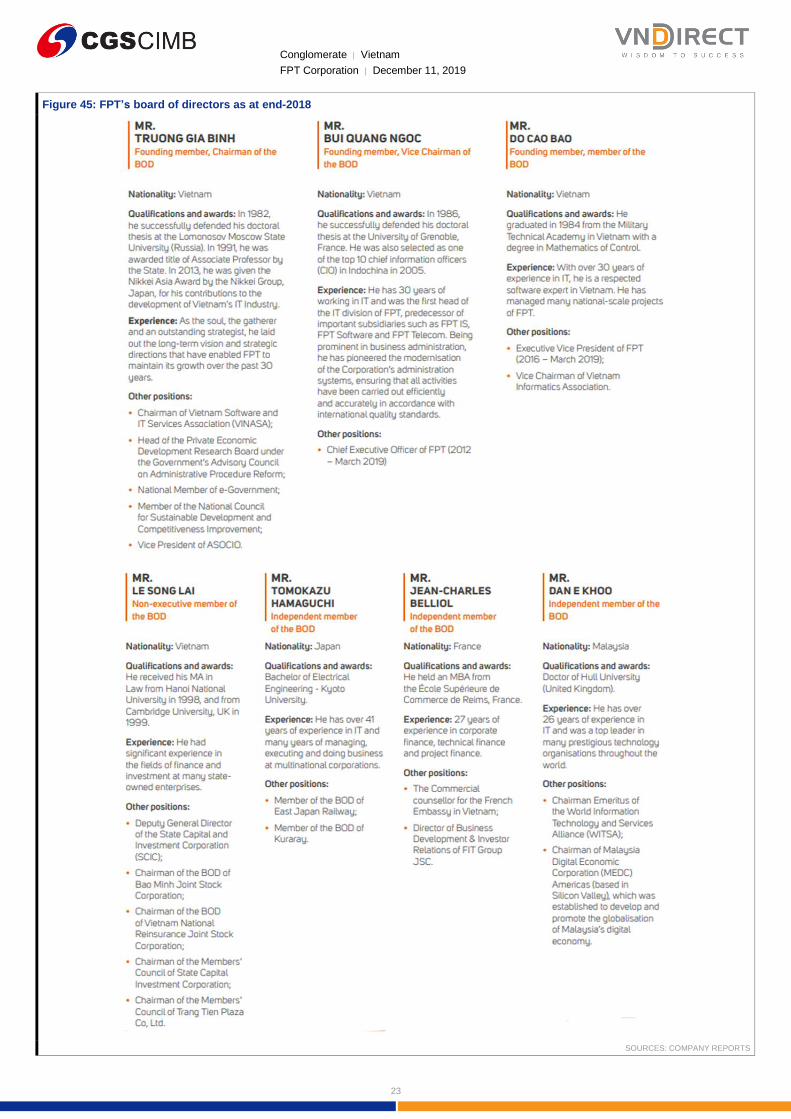
Figure 45: FPT’s board of directors as at end-2018
SOURCES: COMPANY REPORTS
Conglomerate │ Vietnam
FPT Corporation │ December 11, 2019
24
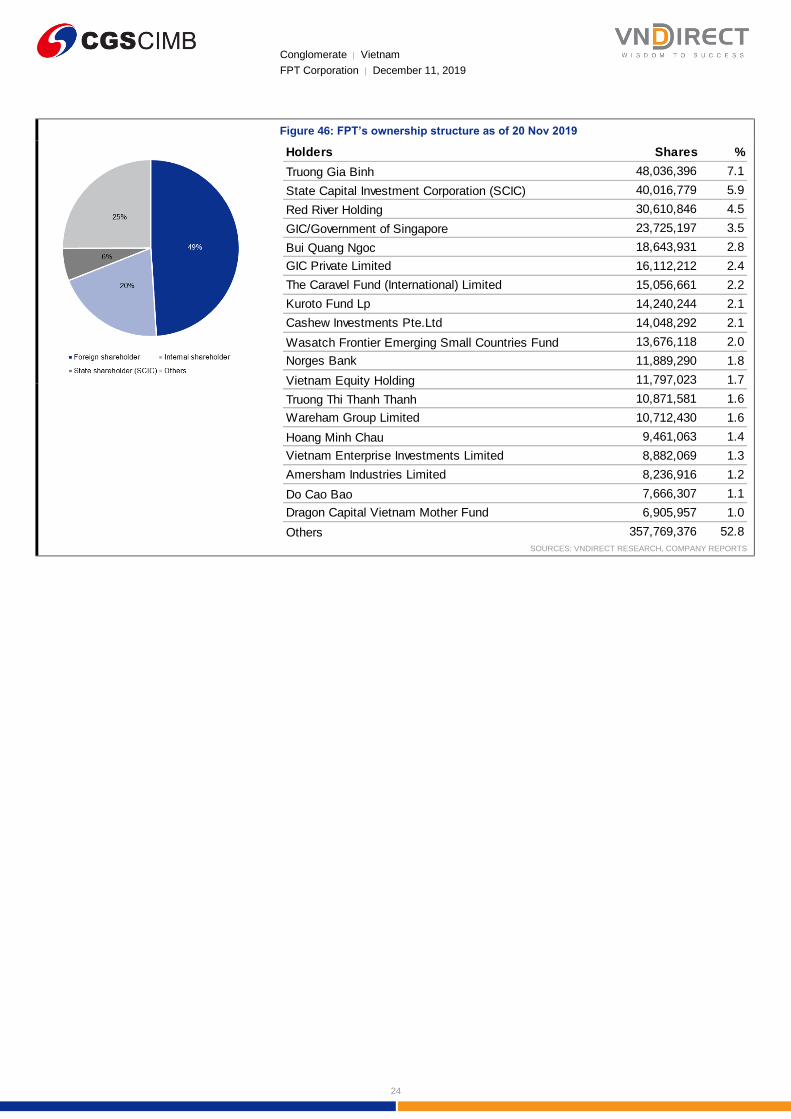
Figure 46: FPT’s ownership structure as of 20 Nov 2019
SOURCES: VNDIRECT RESEARCH, COMPANY REPORTS
Holders Shares %
Truong Gia Binh 48,036,396 7.1
State Capital Investment Corporation (SCIC) 40,016,779 5.9
Red River Holding 30,610,846 4.5
GIC/Government of Singapore 23,725,197 3.5
Bui Quang Ngoc 18,643,931 2.8
GIC Private Limited 16,112,212 2.4
The Caravel Fund (International) Limited 15,056,661 2.2
Kuroto Fund Lp 14,240,244 2.1
Cashew Investments Pte.Ltd 14,048,292 2.1
Wasatch Frontier Emerging Small Countries Fund 13,676,118 2.0
Norges Bank 11,889,290 1.8
Vietnam Equity Holding 11,797,023 1.7
Truong Thi Thanh Thanh 10,871,581 1.6
Wareham Group Limited 10,712,430 1.6
Hoang Minh Chau 9,461,063 1.4
Vietnam Enterprise Investments Limited 8,882,069 1.3
Amersham Industries Limited 8,236,916 1.2
Do Cao Bao 7,666,307 1.1
Dragon Capital Vietnam Mother Fund 6,905,957 1.0
Others 357,769,376 52.8
Conglomerate │ Vietnam
FPT Corporation │ December 11, 2019
25
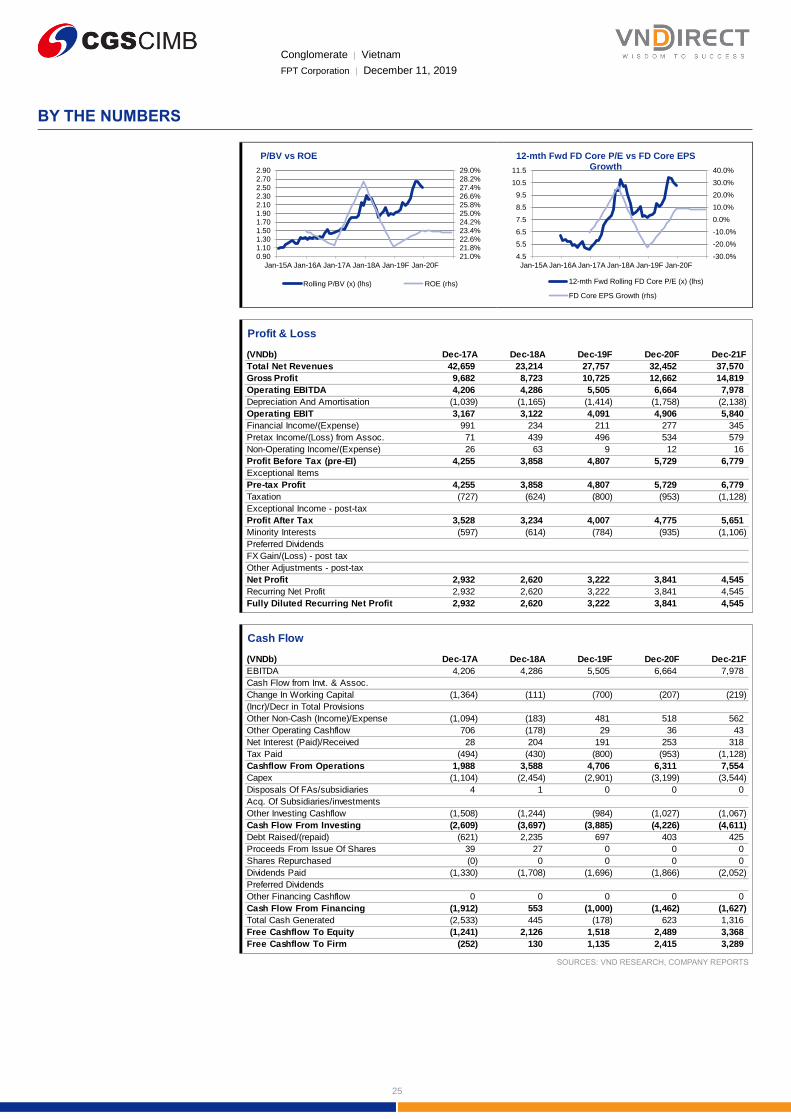
BY THE NUMBERS
SOURCES: VND RESEARCH, COMPANY REPORTS
21.0%21.8%22.6%23.4%24.2%25.0%25.8%26.6%27.4%28.2%29.0%
0.901.101.301.501.701.902.102.302.502.702.90
Jan-15A Jan-16A Jan-17A Jan-18A Jan-19F Jan-20F
P/BV vs ROE
Rolling P/BV (x) (lhs) ROE (rhs)
-30.0%
-20.0%
-10.0%
0.0%
10.0%
20.0%
30.0%
40.0%
4.5
5.5
6.5
7.5
8.5
9.5
10.5
11.5
Jan-15A Jan-16A Jan-17A Jan-18A Jan-19F Jan-20F
12-mth Fwd FD Core P/E vs FD Core EPS Growth
12-mth Fwd Rolling FD Core P/E (x) (lhs)
FD Core EPS Growth (rhs)
Profit & Loss
(VNDb) Dec-17A Dec-18A Dec-19F Dec-20F Dec-21F
Total Net Revenues 42,659 23,214 27,757 32,452 37,570
Gross Profit 9,682 8,723 10,725 12,662 14,819
Operating EBITDA 4,206 4,286 5,505 6,664 7,978
Depreciation And Amortisation (1,039) (1,165) (1,414) (1,758) (2,138)
Operating EBIT 3,167 3,122 4,091 4,906 5,840
Financial Income/(Expense) 991 234 211 277 345
Pretax Income/(Loss) from Assoc. 71 439 496 534 579
Non-Operating Income/(Expense) 26 63 9 12 16
Profit Before Tax (pre-EI) 4,255 3,858 4,807 5,729 6,779
Exceptional Items
Pre-tax Profit 4,255 3,858 4,807 5,729 6,779
Taxation (727) (624) (800) (953) (1,128)
Exceptional Income - post-tax
Profit After Tax 3,528 3,234 4,007 4,775 5,651
Minority Interests (597) (614) (784) (935) (1,106)
Preferred Dividends
FX Gain/(Loss) - post tax
Other Adjustments - post-tax
Net Profit 2,932 2,620 3,222 3,841 4,545
Recurring Net Profit 2,932 2,620 3,222 3,841 4,545
Fully Diluted Recurring Net Profit 2,932 2,620 3,222 3,841 4,545
Cash Flow
(VNDb) Dec-17A Dec-18A Dec-19F Dec-20F Dec-21F
EBITDA 4,206 4,286 5,505 6,664 7,978
Cash Flow from Invt. & Assoc.
Change In Working Capital (1,364) (111) (700) (207) (219)
(Incr)/Decr in Total Provisions
Other Non-Cash (Income)/Expense (1,094) (183) 481 518 562
Other Operating Cashflow 706 (178) 29 36 43
Net Interest (Paid)/Received 28 204 191 253 318
Tax Paid (494) (430) (800) (953) (1,128)
Cashflow From Operations 1,988 3,588 4,706 6,311 7,554
Capex (1,104) (2,454) (2,901) (3,199) (3,544)
Disposals Of FAs/subsidiaries 4 1 0 0 0
Acq. Of Subsidiaries/investments
Other Investing Cashflow (1,508) (1,244) (984) (1,027) (1,067)
Cash Flow From Investing (2,609) (3,697) (3,885) (4,226) (4,611)
Debt Raised/(repaid) (621) 2,235 697 403 425
Proceeds From Issue Of Shares 39 27 0 0 0
Shares Repurchased (0) 0 0 0 0
Dividends Paid (1,330) (1,708) (1,696) (1,866) (2,052)
Preferred Dividends
Other Financing Cashflow 0 0 0 0 0
Cash Flow From Financing (1,912) 553 (1,000) (1,462) (1,627)
Total Cash Generated (2,533) 445 (178) 623 1,316
Free Cashflow To Equity (1,241) 2,126 1,518 2,489 3,368
Free Cashflow To Firm (252) 130 1,135 2,415 3,289

Conglomerate │ Vietnam
FPT Corporation │ December 11, 2019
26
BY THE NUMBERS… cont’d
SOURCES: VND RESEARCH, COMPANY REPORTS
Balance Sheet
(VNDb) Dec-17A Dec-18A Dec-19F Dec-20F Dec-21F
Total Cash And Equivalents 7,860 9,494 10,300 11,950 14,333
Total Debtors 5,720 6,174 6,726 7,863 9,103
Inventories 1,020 1,341 1,484 1,734 1,994
Total Other Current Assets 1,459 1,397 2,070 2,300 2,549
Total Current Assets 16,060 18,406 20,580 23,848 27,979
Fixed Assets 4,589 5,210 6,356 7,451 8,487
Total Investments 1,783 2,202 2,636 3,111 3,625
Intangible Assets 658 1,630 1,450 1,590 1,724
Total Other Non-Current Assets 1,909 2,309 2,759 3,199 3,691
Total Non-current Assets 8,940 11,351 13,201 15,351 17,528
Short-term Debt 4,117 6,599 7,259 7,622 8,003
Current Portion of Long-Term Debt
Total Creditors 4,589 4,958 4,882 5,683 6,546
Other Current Liabilities 2,394 2,894 3,102 3,630 4,209
Total Current Liabilities 11,100 14,451 15,242 16,935 18,757
Total Long-term Debt 565 367 403 444 488
Hybrid Debt - Debt Component
Total Other Non-Current Liabilities 96 164 181 211 243
Total Non-current Liabilities 661 531 585 655 732
Total Provisions 0 0 0 0 0
Total Liabilities 11,761 14,982 15,827 17,590 19,489
Shareholders' Equity 11,429 12,473 15,079 18,039 21,612
Minority Interests 1,809 2,302 2,875 3,571 4,406
Total Equity 13,238 14,775 17,954 21,609 26,018
Key Ratios
Dec-17A Dec-18A Dec-19F Dec-20F Dec-21F
Revenue Growth 7.9% (45.6%) 19.6% 16.9% 15.8%
Operating EBITDA Growth 5.6% 1.9% 28.4% 21.1% 19.7%
Operating EBITDA Margin 9.9% 18.5% 19.8% 20.5% 21.2%
Net Cash Per Share (VND) 5,985 4,121 3,889 5,205 7,116
BVPS (VND) 21,525 20,327 22,226 24,171 26,327
Gross Interest Cover 8.59 13.10 13.08 14.90 16.85
Effective Tax Rate 17.1% 16.2% 16.6% 16.6% 16.6%
Net Dividend Payout Ratio 36.2% 58.5% 42.1% 38.9% 36.1%
Accounts Receivables Days 40.77 79.83 71.91 68.99 69.12
Inventory Days 30.85 29.73 30.27 29.76 29.91
Accounts Payables Days 33.41 60.32 53.39 49.43 49.54
ROIC (%) 28.0% 37.3% 40.1% 38.1% 39.4%
ROCE (%) 18.1% 18.0% 19.4% 19.9% 20.3%
Return On Average Assets 9.3% 11.0% 11.9% 12.3% 12.5%
Key Drivers
Dec-17A Dec-18A Dec-19F Dec-20F Dec-21F
Rev. growth (%, main biz.) 11.4% 20.9% 19.0% 19.2% 18.0%
EBITDA mgns (%, main biz.) N/A N/A N/A N/A N/A
Rev. as % of total (main biz.) 25.6% 57.6% 57.4% 58.6% 59.7%
EBITDA as % of total (main biz.) N/A N/A N/A N/A N/A
Rev. growth (%, 2ndary biz.) 14.8% 15.4% 14.0% 13.0% 12.0%
EBITDA mgns (%, 2ndary biz.) N/A N/A N/A N/A N/A
Rev. as % of total (2ndary biz.) 17.7% 38.0% 36.3% 35.0% 33.9%
EBITDA as % of total (2ndary biz.) N/A N/A N/A N/A N/A
Rev. growth (%, tertiary biz.) 39.4% 31.8% 27.2% 18.5% 16.2%
EBITDA mgns (%, tertiary biz.) N/A N/A N/A N/A N/A
Rev.as % of total (tertiary biz.) 2.4% 5.9% 6.3% 6.4% 6.4%
EBITDA as % of total (tertiary biz.) N/A N/A N/A N/A N/A
Conglomerate │ Vietnam
FPT Corporation │ December 11, 2019
27
DISCLAIMER
The content of this report (including the views and opinions expressed therein, and the information comprised therein) has been prepared by and belongs to VNDIRECT Securities Corporation, and is distributed by CGS-CIMB pursuant to an arrangement between VNDIRECT Securities Corporation and CGS-CIMB. VNDIRECT Securities Corporation is not an affiliate of CGS-CIMB.
This report is not directed to, or intended for distribution to or use by, any person or entity who is a citizen or resident of or located in any locality, state, country or other jurisdiction where such distribution, publication, availability or use would be contrary to law or regulation.
By accepting this report, the recipient hereof represents and warrants that he is entitled to receive such report in accordance with the restrictions set forth below and agrees to be bound by the limitations contained herein (including the “Restrictions on Distributions” set out below). Any failure to comply with these limitations may constitute a violation of law. This publication is being supplied to you strictly on the basis that it will remain confidential. No part of this report may be (i) copied, photocopied, duplicated, stored or reproduced in any form by any means or (ii) redistributed or passed on, directly or indirectly, to any other person in whole or in part, for any purpose without the prior written consent of CGS-CIMB.
The information contained in this research report is prepared from data believed to be correct and reliable at the time of issue of this report.
VNDIRECT Securities Corporation may or may not issue regular reports on the subject matter of this report at any frequency and may cease to do so or change the periodicity of reports at any time. Neither VNDIRECT Securities Corporation nor CGS-CIMB is under any obligation to update this report in the event of a material change to the information contained in this report. Neither VNDIRECT Securities Corporation nor CGS-CIMB has any and will accept any, obligation to (i) check or ensure that the contents of this report remain current, reliable or relevant, (ii) ensure that the content of this report constitutes all the information a prospective investor may require, (iii) ensure the adequacy, accuracy, completeness, reliability or fairness of any views, opinions and information, and accordingly, VNDIRECT Securities Corporation, CGS-CIMB and their respective affiliates and related persons including China Galaxy International Financial Holdings Limited (“CGIFHL”) and CIMB Group Sdn. Bhd. (“CIMBG”) and their respective related corporations (and their respective directors, associates, connected persons and/or employees) shall not be liable in any manner whatsoever for any consequences (including but not limited to any direct, indirect or consequential losses, loss of profits and damages) of any reliance thereon or usage thereof. In particular, VNDIRECT Securities Corporation and CGS-CIMB disclaim all responsibility and liability for the views and opinions set out in this report.
Unless otherwise specified, this report is based upon reasonable sources. Such sources will, unless otherwise specified, for market data, be market data and prices available from the main stock exchange or market where the relevant security is listed, or, where appropriate, any other market. Information on the accounts and business of company(ies) will generally be based on published statements of the company(ies), information disseminated by regulatory information services, other publicly available information and information resulting from our research. Whilst every effort is made to ensure that statements of facts made in this report are accurate, all estimates, projections, forecasts, expressions of opinion and other subjective judgments contained in this report are based on assumptions considered to be reasonable as of the date of the document in which they are contained and must not be construed as a representation that the matters referred to therein will occur. Past performance is not a reliable indicator of future performance. The value of investments may go down as well as up and those investing may, depending on the investments in question, lose more than the initial investment. No report shall constitute an offer or an invitation by or on behalf of CGS-CIMB or VNDIRECT Securities Corporation, or their respective affiliates (including CGIFHL, CIMBG and their respective related corporations) to any person to buy or sell any investments.
CGS-CIMB and/or VNDIRECT Securities Corporation and/or their respective affiliates and related corporations (including CGIFHL, CIMBG and their respective related corporations), their respective directors, associates, connected parties and/or employees may own or have positions in securities of the company(ies) covered in this research report or any securities related thereto and may from time to time add to or dispose of, or may be materially interested in, any such securities. Further, CGS-CIMB and/or VNDIRECT Securities Corporation, and/or their respective affiliates and their respective related corporations (including CGIFHL, CIMBG and their respective related corporations) do and seek to do business with the company(ies) covered in this research report and may from time to time act as market maker or have assumed an underwriting commitment in securities of such company(ies), may sell them to or buy them from customers on a principal basis and may also perform or seek to perform significant investment banking, advisory, underwriting or placement services for or relating to such company(ies) as well as solicit such investment, advisory or other services from any entity mentioned in this report.
CGS-CIMBand/or VNDIRECT Securities Corporation and/or their respective affiliates (including CGIFHL, CIMBG and their respective related corporations) may enter into an agreement with the company(ies) covered in this report relating to the production of research reports. CGS-CIMB and/or VNDIRECT Securities Corporation may disclose the contents of this report to the company(ies) covered by it and may have amended the contents of this report following such disclosure.
The analyst responsible for the production of this report hereby certifies that the views expressed herein accurately and exclusively reflect his or her personal views and opinions about any and all of the issuers or securities analysed in this report and were prepared independently and autonomously. No part of the compensation of the analyst(s) was, is, or will be directly or indirectly related to the inclusion of specific recommendations(s) or view(s) in this report. The analyst(s) who prepared this research report is prohibited from receiving any compensation, incentive or bonus based on specific investment banking transactions or for providing a specific recommendation for, or view of, a particular company. Information barriers and other arrangements may be established where necessary to prevent conflicts of interests arising. However, the analyst(s) may receive compensation that is based on his/their coverage of company(ies) in the performance of his/their duties or the performance of his/their recommendations and the research personnel involved in the preparation of this report may also participate in the solicitation of the businesses as described above. In reviewing this research report, an investor should be aware that any or all of the foregoing, among other things, may give rise to real or potential conflicts of interest. Additional information is, subject to the duties of confidentiality, available on request.
The term “VNDIRECT Securities Corporation” shall, unless the context otherwise requires, mean VNDIRECT Securities Corporation and its affiliates, subsidiaries and related companies. The term “CGS-CIMB” shall denote, where appropriate, the relevant entity distributing or disseminating the report in the particular jurisdiction referenced below, or, in every other case except as otherwise stated herein, CGS-CIMB Securities International Pte. Ltd. and its affiliates, subsidiaries and related corporations.
Conglomerate │ Vietnam
FPT Corporation │ December 11, 2019
28
CGS-CIMB
Country CGS-CIMB Entity Regulated by
Hong Kong CGS-CIMB Securities (Hong Kong) Limited Securities and Futures Commission Hong Kong
India CGS-CIMB Securities (India) Private Limited Securities and Exchange Board of India (SEBI)
Indonesia PT CGS-CIMB Sekuritas Indonesia Financial Services Authority of Indonesia
Malaysia CGS-CIMB Securities Sdn. Bhd. (formerly known as Jupiter Securities Sdn. Bhd.)
Securities Commission Malaysia
Singapore CGS-CIMB Research Pte. Ltd. Monetary Authority of Singapore
South Korea CGS-CIMB Securities (Hong Kong) Limited, Korea Branch
Financial Services Commission and Financial Supervisory Service
Thailand CGS-CIMB Securities (Thailand) Co. Ltd. Securities and Exchange Commission Thailand
(i) As of November 30, 2019 VNDIRECT Securities Corporation has a proprietary position in the securities (which may include but not limited to shares, warrants, call warrants and/or any other derivatives) in the following company or companies covered or recommended in this report:
(a) -
(ii) As of December 11, 2019, the analyst(s) who prepared this report, and the associate(s), has / have an interest in the securities (which may include but not limited to shares, warrants, call warrants and/or any other derivatives) in the following company or companies covered or recommended in this report:
(a) - This report does not purport to contain all the information that a prospective investor may require. CGS-CIMB, VNDIRECT Securities Corporation and their respective affiliates (including CGIFHL, CIMBG and their related corporations) do not make any guarantee, representation or warranty, express or implied, as to the adequacy, accuracy, completeness, reliability or fairness of any such information and opinion contained in this report. None of CGS-CIMB, VNDIRECT Securities Corporation and their respective affiliates and related persons (including CGIFHL, CIMBG and their related corporations) shall be liable in any manner whatsoever for any consequences (including but not limited to any direct, indirect or consequential losses, loss of profits and damages) of any reliance thereon or usage thereof.
This report is general in nature and has been prepared for information purposes only. It is intended for circulation amongst CGS-CIMB’s and its affiliates’ (including CGIFHL’s, CIMBG’s and their respective related corporations’) clients generally and does not have regard to the specific investment objectives, financial situation and the particular needs of any specific person who may receive this report. The information and opinions in this report are not and should not be construed or considered as an offer, recommendation or solicitation to buy or sell the subject securities, related investments or other financial instruments or any derivative instrument, or any rights pertaining thereto.
Investors are advised to make their own independent evaluation of the information contained in this research report, consider their own individual investment objectives, financial situation and particular needs and consult their own professional and financial advisers as to the legal, business, financial, tax and other aspects before participating in any transaction in respect of the securities of company(ies) covered in this research report. The securities of such company(ies) may not be eligible for sale in all jurisdictions or to all categories of investors.
Restrictions on Distributions
Australia: Despite anything in this report to the contrary, this research is issued by VNDIRECT Securities Corporation and provided in Australia by CGS-CIMB Securities (Singapore) Pte. Ltd. and CGS-CIMB Securities (Hong Kong) Limited. This research is only available in Australia to persons who are “wholesale clients” (within the meaning of the Corporations Act 2001 (Cth) and is supplied solely for the use of such wholesale clients and shall not be distributed or passed on to any other person. You represent and warrant that if you are in Australia, you are a “wholesale client”. This research is of a general nature only and has been prepared without taking into account the objectives, financial situation or needs of the individual recipient. CGS-CIMB Securities (Singapore) Pte. Ltd. and CGS-CIMB Securities (Hong Kong) Limited do not hold, and are not required to hold an Australian financial services license. CGS-CIMB Securities (Singapore) Pte. Ltd. and CGS-CIMB Securities (Hong Kong) Limited rely on “passporting” exemptions for entities appropriately licensed by the Monetary Authority of Singapore (under ASIC Class Order 03/1102) and the Securities and Futures Commission in Hong Kong (under ASIC Class Order 03/1103).
Canada: This research report has not been prepared in accordance with the disclosure requirements of Dealer Member Rule 3400 – Research Restrictions and Disclosure Requirements of the Investment Industry Regulatory Organization of Canada. For any research report distributed by CIBC, further disclosures related to CIBC conflicts of interest can be found at https://researchcentral.cibcwm.com.
China: For the purpose of this report, the People’s Republic of China (“PRC”) does not include the Hong Kong Special Administrative Region, the Macau Special Administrative Region or Taiwan. The distributor of this report has not been approved or licensed by the China Securities Regulatory Commission or any other relevant regulatory authority or governmental agency in the PRC. This report contains only marketing information. The distribution of this report is not an offer to buy or sell to any person within or outside PRC or a solicitation to any person within or outside of PRC to buy or sell any instruments described herein. This report is being issued outside the PRC to a limited number of institutional investors and may not be provided to any person other than the original recipient and may not be reproduced or used for any other purpose.
France: Only qualified investors within the meaning of French law shall have access to this report. This report shall not be considered as an offer to subscribe to, or used in connection with, any offer for subscription or sale or marketing or direct or indirect distribution of financial instruments and it is not intended as a solicitation for the purchase of any financial instrument.
Germany: This report is only directed at persons who are professional investors as defined in sec 31a(2) of the German Securities Trading Act

Conglomerate │ Vietnam
FPT Corporation │ December 11, 2019
29
(WpHG). This publication constitutes research of a non-binding nature on the market situation and the investment instruments cited here at the time of the publication of the information.
The current prices/yields in this issue are based upon closing prices from Bloomberg as of the day preceding publication. Please note that neither the German Federal Financial Supervisory Agency (BaFin), nor any other supervisory authority exercises any control over the content of this report.
Hong Kong: This report is issued by VNDIRECT Securities Corporation and distributed in Hong Kong by CGS-CIMB Securities (Hong Kong) Limited (“CHK”) which is licensed in Hong Kong by the Securities and Futures Commission for Type 1 (dealing in securities), Type 4 (advising on securities) and Type 6 (advising on corporate finance) activities. Any investors wishing to purchase or otherwise deal in the securities covered in this report should contact the Head of Sales at CGS-CIMB Securities (Hong Kong) Limited. The views and opinions in this research report are of VNDIRECT Securities Corporation as of the date hereof and are subject to change. If the Financial Services and Markets Act of the United Kingdom or the rules of the Financial Conduct Authority apply to a recipient, our obligations owed to such recipient therein are unaffected. CHK has no obligation to update the opinion or the information in this research report.
CHK does not make a market on other securities mentioned in the report.
India:
This report is issued by VNDIRECT Securities Corporation and distributed in India by CGS-CIMB Securities (India) Private Limited (“CGS-CIMB India”). CGS-CIMB India is a subsidiary of CGS-CIMB Securities International Pte. Ltd. which in turn is a 50:50 joint venture company of CGIFHL and CIMBG. The details of the members of the group of companies of CGS-CIMB can be found at www.cgs-cimb.com, CGIFHL at www.chinastock.com.hk/en/ACG/ContactUs/index.aspx and CIMBG at www.cimb.com/en/who-we-are.html. CGS-CIMB India is registered with the National Stock Exchange of India Limited and BSE Limited as a trading and clearing member (Merchant Banking Number: INM000012037) under the Securities and Exchange Board of India (Stock Brokers and Sub-Brokers) Regulations, 1992. In accordance with the provisions of Regulation 4(g) of the Securities and Exchange Board of India (Investment Advisers) Regulations, 2013, CGS-CIMB India is not required to seek registration with the Securities and Exchange Board of India (“SEBI”) as an Investment Adviser. CGS-CIMB India is registered with SEBI (SEBI Registration Number: INZ000157134) as a Research Analyst (INH000000669) pursuant to the SEBI (Research Analysts) Regulations, 2014 ("Regulations").
This report does not take into account the particular investment objectives, financial situations, or needs of the recipients. It is not intended for and does not deal with prohibitions on investment due to law/jurisdiction issues etc. which may exist for certain persons/entities. Recipients should rely on their own investigations and take their own professional advice before investment.
The report is not a “prospectus” as defined under Indian Law, including the Companies Act, 2013, and is not, and shall not be, approved by, or filed or registered with, any Indian regulator, including any Registrar of Companies in India, SEBI, any Indian stock exchange, or the Reserve Bank of India. No offer, or invitation to offer, or solicitation of subscription with respect to any such securities listed or proposed to be listed in India is being made, or intended to be made, to the public, or to any member or section of the public in India, through or pursuant to this report.
The research analysts, strategists or economists principally responsible for the preparation of this research report are segregated from the other activities of CGS-CIMB India and they have received compensation based upon various factors, including quality, accuracy and value of research, firm profitability or revenues, client feedback and competitive factors. Research analysts', strategists' or economists' compensation is not linked to investment banking or capital markets transactions performed or proposed to be performed by CGS-CIMB India or its affiliates.
CGS-CIMB India does not have actual / beneficial ownership of 1% or more securities of the subject company in this research report, at the end of the month immediately preceding the date of publication of this research report. However, since affiliates of CGS-CIMB India are engaged in the financial services business, they might have in their normal course of business financial interests or actual / beneficial ownership of one per cent or more in various companies including the subject company in this research report.
CGS-CIMB India or its associates, may: (a) from time to time, have long or short position in, and buy or sell the securities of the subject company in this research report; or (b) be engaged in any other transaction involving such securities and earn brokerage or other compensation or act as a market maker in the financial instruments of the subject company in this research report or act as an advisor or lender/borrower to such company or may have any other potential conflict of interests with respect to any recommendation and other related information and opinions.
CGS-CIMB India, its associates and the analyst engaged in preparation of this research report have not received any compensation for investment banking, merchant banking or brokerage services from the subject company mentioned in the research report in the past 12 months.
CGS-CIMB India, its associates and the analyst engaged in preparation of this research report have not managed or co-managed public offering of securities for the subject company mentioned in the research report in the past 12 months. The analyst from CGS-CIMB India engaged in preparation of this research report or his/her relative (a) do not have any financial interests in the subject company mentioned in this research report; (b) do not own 1% or more of the equity securities of the subject company mentioned in the research report as of the last day of the month preceding the publication of the research report; (c) do not have any material conflict of interest at the time of publication of the research report.
Indonesia: This report is issued by VNDIRECT Securities Corporation and distributed by PT CGS-CIMB Sekuritas Indonesia (“CGS-CIMB Indonesia”). The views and opinions in this research report are not our own but of VNDIRECT Securities Corporation as of the date hereof and are subject to change. CGS-CIMB Indonesia has no obligation to update the opinion or the information in this research report. This report is for private circulation only to clients of CGS-CIMB Indonesia. Neither this report nor any copy hereof may be distributed in Indonesia or to any Indonesian citizens wherever they are domiciled or to Indonesian residents except in compliance with applicable Indonesian capital market laws and regulations.
This research report is not an offer of securities in Indonesia. The securities referred to in this research report have not been registered with the Financial Services Authority (Otoritas Jasa Keuangan) pursuant to relevant capital market laws and regulations, and may not be offered or sold within the territory of the Republic of Indonesia or to Indonesian citizens through a public offering or in circumstances which constitute an offer within the meaning of the Indonesian capital market law and regulations.
Ireland: CGS-CIMB is not an investment firm authorised in the Republic of Ireland and no part of this document should be construed as CGS-CIMB acting as, or otherwise claiming or representing to be, an investment firm authorised in the Republic of Ireland.
Malaysia: This report is issued by VNDIRECT Securities Corporation and distributed in Malaysia by CGS-CIMB Securities Sdn. Bhd. (formerly

Conglomerate │ Vietnam
FPT Corporation │ December 11, 2019
30
known as Jupiter Securities Sdn. Bhd.) (“CGS-CIMB Malaysia”) solely for the benefit of and for the exclusive use of our clients. Recipients of this report are to contact CGS-CIMB Malaysia, at 29th Floor Menara CIMB No. 1 Jalan Stesen Sentral 2, Kuala Lumpur Sentral 50470 Kuala Lumpur, Malaysia, in respect of any matters arising from or in connection with this report. CGS-CIMB Malaysia has no obligation to update, revise or reaffirm the opinion or the information in this research report after the date of this report.
New Zealand: In New Zealand, this report is for distribution only to persons who are wholesale clients pursuant to section 5C of the Financial Advisers Act 2008.
Singapore: This report is issued by VNDIRECT Securities Corporation and distributed by CGS-CIMB Research Pte Ltd (“CGS-CIMBR”). CGS-CIMBR is a financial adviser licensed under the Financial Advisers Act, Cap 110 (“FAA”) for advising on investment products, by issuing or promulgating research analyses or research reports, whether in electronic, print or other form. Accordingly CGS-CIMBR is a subject to the applicable rules under the FAA unless it is able to avail itself to any prescribed exemptions.
Recipients of this report are to contact CGS-CIMB Research Pte Ltd, 50 Raffles Place, #16-02 Singapore Land Tower, Singapore in respect of any matters arising from, or in connection with this report. CGS-CIMBR has no obligation to update the opinion or the information in this research report. This publication is strictly confidential and is for private circulation only. If you have not been sent this report by CGS-CIMBR directly, you may not rely, use or disclose to anyone else this report or its contents.
If the recipient of this research report is not an accredited investor, expert investor or institutional investor, CGS-CIMBR accepts legal responsibility for the contents of the report without any disclaimer limiting or otherwise curtailing such legal responsibility. If the recipient is an accredited investor, expert investor or institutional investor, the recipient is deemed to acknowledge that CGS-CIMBR is exempt from certain requirements under the FAA and its attendant regulations, and as such, is exempt from complying with the following :
(a) Section 25 of the FAA (obligation to disclose product information);
(b) Section 27 (duty not to make recommendation with respect to any investment product without having a reasonable basis where you may be reasonably expected to rely on the recommendation) of the FAA;
(c) MAS Notice on Information to Clients and Product Information Disclosure [Notice No. FAA-N03];
(d) MAS Notice on Recommendation on Investment Products [Notice No. FAA-N16];
(e) Section 36 (obligation on disclosure of interest in securities), and
(f) any other laws, regulations, notices, directive, guidelines, circulars and practice notes which are relates to the above, to the extent permitted by applicable laws, as may be amended from time to time, and any other laws, regulations, notices, directive, guidelines, circulars, and practice notes as we may notify you from time to time. In addition, the recipient who is an accredited investor, expert investor or institutional investor acknowledges that a CGS-CIMBR is exempt from Section 27 of the FAA, the recipient will also not be able to file a civil claim against CGS-CIMBR for any loss or damage arising from the recipient’s reliance on any recommendation made by CGS-CIMBR which would otherwise be a right that is available to the recipient under Section 27 of the FAA, the recipient will also not be able to file a civil claim against CGS-CIMBR for any loss or damage arising from the recipient’s reliance on any recommendation made by CGS-CIMBR which would otherwise be a right that is available to the recipient under Section 27 of the FAA.
CGS-CIMBR, its affiliates and related corporations, their directors, associates, connected parties and/or employees may own or have positions in securities of the company(ies) covered in this research report or any securities related thereto and may from time to time add to or dispose of, or may be materially interested in, any such securities. Further, CGS-CIMBR, its affiliates and its related corporations do and seek to do business with the company(ies) covered in this research report and may from time to time act as market maker or have assumed an underwriting commitment in securities of such company(ies), may sell them to or buy them from customers on a principal basis and may also perform or seek to perform significant investment banking, advisory, underwriting or placement services for or relating to such company(ies) as well as solicit such investment, advisory or other services from any entity mentioned in this report.
As of December 11, 2019,, CGS-CIMBR does not have a proprietary position in the recommended securities in this report.
CGS-CIMBR does not make a market on the securities mentioned in the report.
South Korea: This report is issued by VNDIRECT Securities Corporation and distributed in South Korea by CGS-CIMB Securities (Hong Kong) Limited, Korea Branch (“CGS-CIMB Korea”) which is licensed as a cash equity broker, and regulated by the Financial Services Commission and Financial Supervisory Service of Korea. In South Korea, this report is for distribution only to professional investors under Article 9(5) of the Financial Investment Services and Capital Market Act of Korea (“FSCMA”).
Spain: This document is a research report and it is addressed to institutional investors only. The research report is of a general nature and not personalised and does not constitute investment advice so, as the case may be, the recipient must seek proper advice before adopting any investment decision. This document does not constitute a public offering of securities.
CGS-CIMB is not registered with the Spanish Comision Nacional del Mercado de Valores to provide investment services.
Sweden: This report contains only marketing information and has not been approved by the Swedish Financial Supervisory Authority. The distribution of this report is not an offer to sell to any person in Sweden or a solicitation to any person in Sweden to buy any instruments described herein and may not be forwarded to the public in Sweden.
Switzerland: This report has not been prepared in accordance with the recognized self-regulatory minimal standards for research reports of banks issued by the Swiss Bankers’ Association (Directives on the Independence of Financial Research).
Thailand: This report is issued by VNDIRECT Securities Corporation and distributed by CGS-CIMB Securities (Thailand) Co. Ltd. (“CGS-CIMB Thailand”) based upon sources believed to be reliable (but their accuracy, completeness or correctness is not guaranteed). The statements or expressions of opinion herein were arrived at after due and careful consideration for use as information for investment. Such opinions are subject to change without notice and CGS-CIMB Thailand has no obligation to update the opinion or the information in this research report.
CGS-CIMB Thailand may act or acts as Market Maker, and issuer and offerer of Derivative Warrants and Structured Note which may have the following securities as its underlying securities. Investors should carefully read and study the details of the derivative warrants in the prospectus before making investment decisions.
AAV, ADVANC, AEONTS, AMATA, ANAN, AOT, AP, BANPU, BBL, BCH, BCP, BCPG, BDMS, BEAUTY, BEC, BEM, BGRIM, BH, BJC, BLAND, BPP,

Conglomerate │ Vietnam
FPT Corporation │ December 11, 2019
31
BTS, CBG, CENTEL, CHG, CK, CKP, COM7, CPALL, CPF, CPN, DELTA, DTAC, EA, EGCO, EPG, ERW, ESSO, GFPT, GLOBAL, GPSC, GULF, GUNKUL, HANA, HMPRO, INTUCH, IRPC, IVL, JAS, JMT, KBANK, KCE, KKP, KTB, KTC, LH, MAJOR, MBK, MEGA, MINT, MTC, ORI, OSP, PLANB, PRM, PSH, PSL, PTG, PTT, PTTEP, PTTGC, QH, RATCH, ROBINS, RS, SAWAD, SCB, SCC, SGP, SIRI, SPALI, SPRC, STA, STEC, SUPER, TASCO, TCAP, THAI, THANI, TISCO, TKN, TMB, TOA, TOP, TPIPP, TRUE, TTW, TU, TVO, WHA.
Corporate Governance Report:
The disclosure of the survey result of the Thai Institute of Directors Association (“IOD”) regarding corporate governance is made pursuant to the policy of the Office of the Securities and Exchange Commission. The survey of the IOD is based on the information of a company listed on the Stock Exchange of Thailand and the Market for Alternative Investment disclosed to the public and able to be accessed by a general public investor. The result, therefore, is from the perspective of a third party. It is not an evaluation of operation and is not based on inside information.
The survey result is as of the date appearing in the Corporate Governance Report of Thai Listed Companies. As a result, the survey result may be changed after that date. CGS-CIMB Thailand does not confirm nor certify the accuracy of such survey result.
Score Range: 90 - 100 80 – 89 70 - 79 Below 70 or No Survey Result
Description: Excellent Very Good Good N/A
United Arab Emirates: The distributor of this report has not been approved or licensed by the UAE Central Bank or any other relevant licensing authorities or governmental agencies in the United Arab Emirates. This report is strictly private and confidential and has not been reviewed by, deposited or registered with UAE Central Bank or any other licensing authority or governmental agencies in the United Arab Emirates. This report is being issued outside the United Arab Emirates to a limited number of institutional investors and must not be provided to any person other than the original recipient and may not be reproduced or used for any other purpose. Further, the information contained in this report is not intended to lead to the sale of investments under any subscription agreement or the conclusion of any other contract of whatsoever nature within the territory of the United Arab Emirates.
United Kingdom and European Economic Area (EEA): In the United Kingdom and European Economic Area, this material is issued by VNDIRECT Securities Corporation and is being distributed by CGS-CIMB Securities (UK) Limited (“CGS-CIMB UK”). CGS-CIMB UK is authorized and regulated by the Financial Conduct Authority and its registered office is at 27 Knightsbridge, London, SW1X7YB. The material distributed by CGS-CIMB UK has been prepared in accordance with CGS-CIMB’s policies for managing conflicts of interest arising as a result of publication and distribution of this material. This material is for distribution only to, and is solely directed at, selected persons on the basis that those persons: (a) are eligible counterparties and professional clients of CGS-CIMB UK; (b) have professional experience in matters relating to investments falling within Article 19(5) of the Financial Services and Markets Act 2000 (Financial Promotion) Order 2005 (as amended, the “Order”), (c) fall within Article 49(2)(a) to (d) (“high net worth companies, unincorporated associations etc”) of the Order; (d) are outside the United Kingdom subject to relevant regulation in each jurisdiction, material(all such persons together being referred to as “relevant persons”). This material is directed only at relevant persons and must not be acted on or relied on by persons who are not relevant persons. Any investment or investment activity to which this material relates is available only to relevant persons and will be engaged in only with relevant persons.
Where this material is labelled as non-independent, it does not provide an impartial or objective assessment of the subject matter and does not constitute independent “research” (cannot remove research from here under the applicable rules of the Financial Conduct Authority in the UK. Consequently, any such non-independent material will not have been prepared in accordance with legal requirements designed to promote the independence of research (cannot remove research from here) and will not subject to any prohibition on dealing ahead of the dissemination of research. Any such non-independent material must be considered as a marketing communication.
United States: This research report is issued by VNDIRECT Securities Corporation and distributed in the United States of America by CGS-CIMB Securities (USA) Inc, a U.S. registered broker-dealer and a related company of CGS-CIMB Securities Sdn. Bhd. (formerly known as Jupiter Securities Sdn. Bhd.), CGS-CIMB Research Pte Ltd, PT CGS-CIMB Sekuritas Indonesia, CGS-CIMB Securities (Thailand) Co. Ltd, CGS-CIMB Securities (Hong Kong) Limited and CGS-CIMB Securities (India) Private Limited, and is distributed solely to persons who qualify as “U.S. Institutional Investors” as defined in Rule 15a-6 under the Securities and Exchange Act of 1934. This communication is only for Institutional Investors whose ordinary business activities involve investing in shares, bonds, and associated securities and/or derivative securities and who have professional experience in such investments. Any person who is not a U.S. Institutional Investor or Major Institutional Investor must not rely on this communication. The delivery of this research report to any person in the United States of America is not a recommendation to effect any transactions in the securities discussed herein, or an endorsement of any opinion expressed herein. CGS-CIMB Securities (USA) Inc, is a FINRA/SIPC member and takes responsibility for the content of this report. For further information or to place an order in any of the above-mentioned securities please contact a registered representative of CGS-CIMB Securities (USA) Inc.
CGS-CIMB Securities (USA) Inc. does not make a market on other securities mentioned in the report.
CGS-CIMB Securities (USA) Inc. has not managed or co-managed a public offering of any of the securities mentioned in the past 12 months.
CGS-CIMB Securities (USA) Inc. has not received compensation for investment banking services from any of the company mentioned in the past 12 months.
CGS-CIMB Securities (USA) Inc. neither expects to receive nor intends to seek compensation for investment banking services from any of the company mentioned within the next 3 months.
Other jurisdictions: In any other jurisdictions, except if otherwise restricted by laws or regulations, this report is only for distribution to professional, institutional or sophisticated investors as defined in the laws and regulations of such jurisdictions.

Conglomerate │ Vietnam
FPT Corporation │ December 11, 2019
32
Spitzer Chart for stock being researched ( 2 year data )
FPT Corporation (FPT VN)
Rating Distribution (%) Inv estment Banking clients (%)
Add 58.8% 0.9%
Hold 26.3% 0.0%
Reduce 14.9% 0.1%
Distribution of stock ratings and inv estment banking clients for quarter ended on 30 September 2019
777 companies under cov erage for quarter ended on 30 September 2019
25,000
30,000
35,000
40,000
45,000
50,000
55,000
60,000
65,000
Dec-16 Jun-17 Dec-17 Jun-18 Dec-18 Jun-19
Price Close
55,0
00
55,0
00
Recommendations & Target Price
Add Hold Reduce Not Rated
Conglomerate │ Vietnam
FPT Corporation │ December 11, 2019
33
Corporate Governance Report of Thai Listed Companies (CGR). CG Rating by the Thai Institute of Directors Association (Thai IOD) in 2018, Anti-Corruption 2018
ADVANC – Excellent, Certified, AEONTS – Good, n/a, AH – Very Good, n/a, AMATA – Excellent, Declared, ANAN – Excellent, Declared, AOT – Excellent, Declared, AP – Excellent, Certified, ASP – Very Good, Certified, BANPU – Excellent, Certified, BAY – Excellent, Certified, BBL – Very Good, Certified, BCH – Good, Certified, BCP - Excellent, Certified, BCPG – Excellent, Certified, BEM – Very Good, n/a, BDMS – Very Good, n/a, BEAUTY – Good, n/a, BEC – Very Good, n/a, , BGRIM – Very Good, Declared, BH - Good, n/a, BJC – Very Good, Declared, BJCHI – Very Good, Certified, BLA – Very Good, Certified, BPP – Very Good, Declared, BR - Good, Declared, BTS - Excellent, Certified, CBG – Very Good, n/a, CCET – Good, n/a, CENTEL – Very Good, Certified, CHG – Very Good, Declared, CK – Excellent, n/a, COL – Excellent, Declared, CPALL – Very Good, Certified, CPF – Excellent, Certified, CPN - Excellent, Certified, DELTA - Excellent, n/a, DEMCO – Excellent, Certified, DDD – Very Good, Declared, DIF – not available, n/a, DREIT – not available, n/a, DTAC – Excellent, Certified, EA – Excellent, n/a, ECL – Very Good, Certified, EGCO - Excellent, Certified, EPG – Very Good, n/a, ERW – Very Good, n/a, GFPT - Excellent, Certified, GGC – Excellent, Certified, GLOBAL – Very Good, n/a, GLOW – Very Good, Certified, GPSC – Excellent, Certified, GULF – Very Good, n/a, GUNKUL – Excellent, Certified, HANA - Excellent, Certified, HMPRO - Excellent, Certified, HREIT - Excellent, Certified ICHI – Excellent, Declared, HUMAN – not available, n/a, III – Good, n/a, INTUCH - Excellent, Certified, IRPC – Excellent, Certified, ITD* – Very Good, n/a, IVL - Excellent, Certified, JASIF – not available, n/a, JWD – Very Good, n/a, KBANK - Excellent, Certified, KCE - Excellent, Certified, KKP – Excellent, Certified, KSL – Excellent, Certified, KTB - Excellent, Certified, KTC – Excellent, Certified, LH - Very Good, n/a, LPN – Excellent, Certified, M – Very Good, Certified, MACO – Very Good, n/a, MAJOR – Very Good, n/a, MAKRO – Excellent, Declared, MALEE – Very Good, Certified, MC – Very Good, Certified, MCOT – Excellent, Certified, MEGA – Very Good, n/a, MINT - Excellent, Certified, MTC – Excellent, Declared, NETBAY – Good, n/a, OSP – not available, n/a,PLANB – Excellent, Declared, PLAT – Very Good, Certified, PR9 – not available, n/a, PSH – Excellent, Certified, PSTC – Good, Certified, PTT - Excellent, Certified, PTTEP - Excellent, Certified, PTTGC - Excellent, Certified, QH – Excellent, Certified, RATCH – Excellent, Certified, ROBINS – Excellent, Certified, RS – Very Good, n/a, RSP – not available, n/a, S – Very Good, n/a, SAMART - Excellent, n/a, SAPPE – Very Good, Declared, SAT – Excellent, Certified, SAWAD – Very Good, n/a, SC – Excellent, Declared, SCB - Excellent, Certified, SCC – Excellent, Certified, SCN – Very Good, Certified, SF – Good, n/a, SIRI – Very Good, Certified, SPA - Good, n/a, SPALI - Excellent, n/a, SPRC – Excellent, Certified, STA – Very Good, Certified, STEC – Excellent, n/a, SVI – Excellent, Certified, SYNEX – Very Good, Declared, TASCO – Excellent, Certified, TCAP – Excellent, Certified, THANI – Excellent, Certified, TIPCO – Very Good, Certified, TISCO - Excellent, Certified, TKN – Very Good, Declared, TMB - Excellent, Certified, TNR – Very Good, Declared, TOP - Excellent, Certified, TPCH – Good, n/a, TPIPP – Good, n/a, TRUE – Excellent, Certified, TU – Excellent, Certified, TVO – Very Good, Declared, UNIQ – Good, n/a, VGI – Excellent, Certified, WHA – Excellent, Certified, WHART – not available, n/a, WICE – Very Good, Certified, WORK – Good, n/a. Companies participating in Thailand’s Private Sector Collective Action Coalition Against Corruption programme (Thai CAC) under Thai Institute of Directors (as of August 31, 2018) are categorized into:
- Companies that have declared their intention to join CAC, and
- Companies certified by CAC
* The company, its director or management had been reportedly accused for breaching proper corporate governance such as violation of the SEC’s regulations or charged with corruption.
RECOMMENDATION FRAMEWORK
Stock Ratings Definition:
Add The stock’s total return is expected to reach 15% or higher over the next 12 months.
Hold The stock’s total return is expected to be between negative 10% and positive 15% over the next 12 months.
Reduce The stock’s total return is expected to fall below negative 10% over the next 12 months.
The total expected return of a stock is defined as the sum of the:(i) percentage difference between the target price and the current price and (ii) the forward net dividend yields of the stock. Stock price targets have an investment horizon of 12 months.
Sector Ratings Definition:
Overweight An Overweight rating means stocks in the sector have, on a market cap-weighted basis, a positive absolute recommendation.
Neutral A Neutral rating means stocks in the sector have, on a market cap-weighted basis, a neutral absolute recommendation.
Underweight An Underweight rating means stocks in the sector have, on a market cap-weighted basis, a negative absolute recommendation.
Country Ratings Definition:
Overweight An Overweight rating means investors should be positioned with an above-market weight in this country relative to benchmark.
Neutral A Neutral rating means investors should be positioned with a neutral weight in this country relative to benchmark.
Underweight An Underweight rating means investors should be positioned with a below-market weight in this country relative to benchmark.
Hien Tran Khanh – Deputy Head of Research Email: [email protected]

Conglomerate │ Vietnam
FPT Corporation │ December 11, 2019
34
Toan CHU – Analyst Email: [email protected]
– Email: – Email: – Email: – Email:
VNDIRECT Securities Corporation
1 Nguyen Thuong Hien Str – Hai Ba Trung Dist – Ha Noi │ Tel: +84 2439724568
Email: [email protected] │ Website: https://vndirect.com.vn
Insert Insert