additional theme: visual data mining
TRANSCRIPT
May 2, 2023 Data Mining: Concepts and Techniques
1
Data Mining: Concepts and
Techniques
— Chapter 11 — — Applications and Trends in Data
Mining— Additional Theme: Visual Data Mining
Jiawei Han and Micheline KamberDepartment of Computer Science
University of Illinois at Urbana-Champaignwww.cs.uiuc.edu/~hanj
©2006 Jiawei Han and Micheline Kamber. All rights reserved.
May 2, 2023 Data Mining: Concepts and Techniques
2
May 2, 2023 Data Mining: Concepts and Techniques
3
Visual Data Mining: An Overview
What is Visual Data Mining? Survey of techniques
Data Visualization Visualizing Data Mining Results Visual Data Mining
May 2, 2023 Data Mining: Concepts and Techniques
4
What Is Visual Data Mining?
Visual data mining “discovers implicit and useful knowledge from large data sets using data and/or knowledge visualization techniques”
Data visualization + Data mining techniques
May 2, 2023 Data Mining: Concepts and Techniques
5
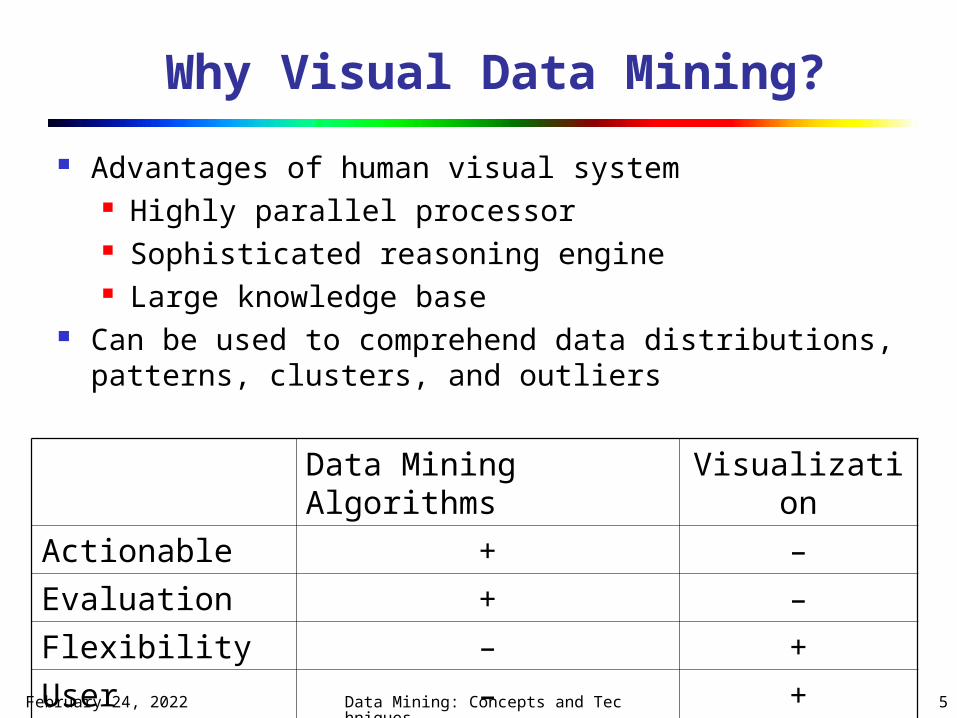
Why Visual Data Mining? Advantages of human visual system
Highly parallel processor Sophisticated reasoning engine Large knowledge base
Can be used to comprehend data distributions, patterns, clusters, and outliers
Data Mining Algorithms
Visualization
Actionable + –Evaluation + –Flexibility – +User Interaction
– +
May 2, 2023 Data Mining: Concepts and Techniques
6
Why Not Only Visual Data Mining?
Disadvantages of human visual system Needs training Not automated Intrinsic bias Limit of about 106 or 107 observations
(Wegman 1995) Power of integration with analytical
methods
May 2, 2023 Data Mining: Concepts and Techniques
7
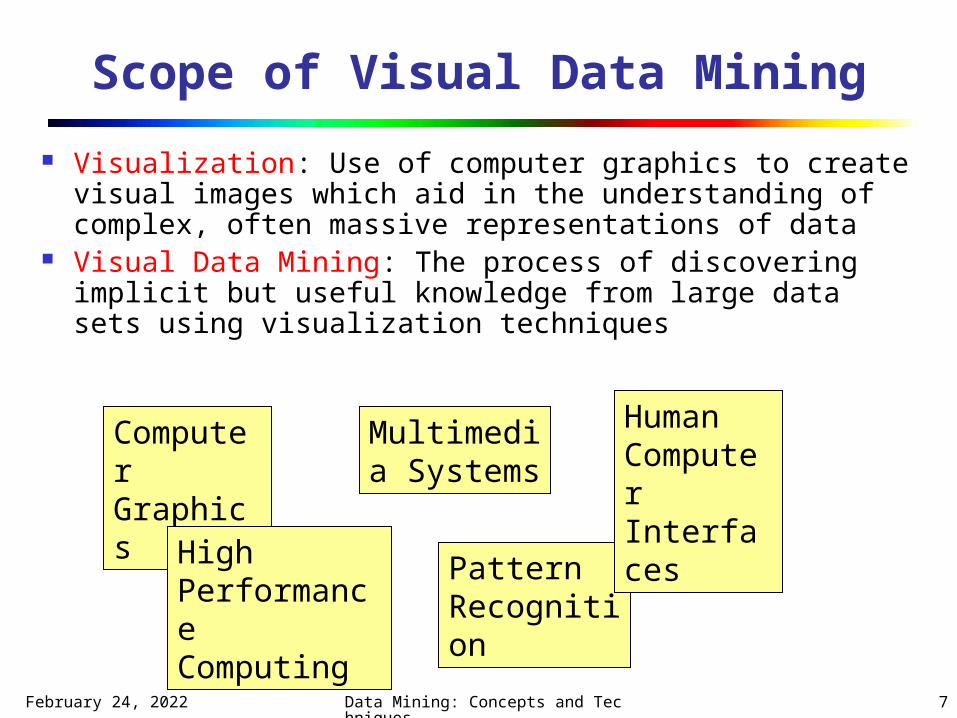
Scope of Visual Data Mining Visualization: Use of computer graphics to create
visual images which aid in the understanding of complex, often massive representations of data
Visual Data Mining: The process of discovering implicit but useful knowledge from large data sets using visualization techniques
Computer Graphics
High Performance Computing
Pattern Recognition
Human Computer Interfaces
Multimedia Systems
May 2, 2023 Data Mining: Concepts and Techniques
8
Purpose of Visualization Gain insight into an information space by
mapping data onto graphical primitives Provide qualitative overview of large data sets Search for patterns, trends, structure,
irregularities, relationships among data Help find interesting regions and suitable
parameters for further quantitative analysis Provide a visual proof of computer
representations derived
May 2, 2023 Data Mining: Concepts and Techniques
9
Visual Data Mining & Data Visualization
Integration of visualization and data mining data visualization data mining result visualization data mining process visualization interactive visual data mining
Data visualization Data in a database or data warehouse can be
viewed at different levels of abstraction as different combinations of attributes or
dimensions Data can be presented in various visual forms
May 2, 2023 Data Mining: Concepts and Techniques
10
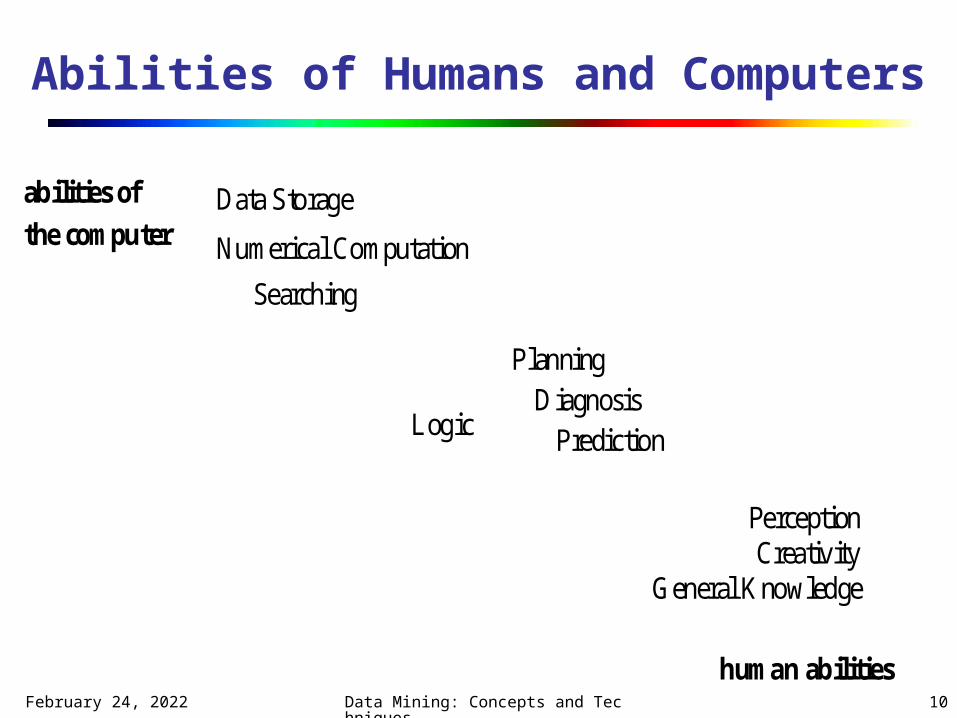
abilities of the computer
General KnowledgeCreativity
Logic
Data Storage
Numerical Computation
Planning
PredictionDiagnosis
Searching
Perception
human abilities
Abilities of Humans and Computers
May 2, 2023 Data Mining: Concepts and Techniques
11
Visual Mining vs. Scientific Vis. & Graphics
Scientific Visualization Often visualize physical model, low
dimensionality Graphics
More concerned with how to render (draw) rather than what to render

May 2, 2023 Data Mining: Concepts and Techniques
12
Data Visualization
View data in database or data warehouse User may control
Different levels of details Subset of attributes
Drawn using boxplots, histograms, polylines, etc.
May 2, 2023 Data Mining: Concepts and Techniques
13
Historical Overview of Exploratory Data Visualization Techniques (cf. [WB 95])
Pioneering works of Tufte [Tuf 83, Tuf 90] and Bertin [Ber 81] focus on Visualization of data with inherent 2D-/3D-semantics General rules for layout, color composition, attribute
mapping, etc. Development of visualization techniques for different
types of data with an underlying physical model Geographic data, CAD data, flow data, image data,
voxel data, etc. Development of visualization techniques for arbitrary
multidimensional data (w.o. an underlying physical model) Applicable to databases and other information
resources
May 2, 2023 Data Mining: Concepts and Techniques
14
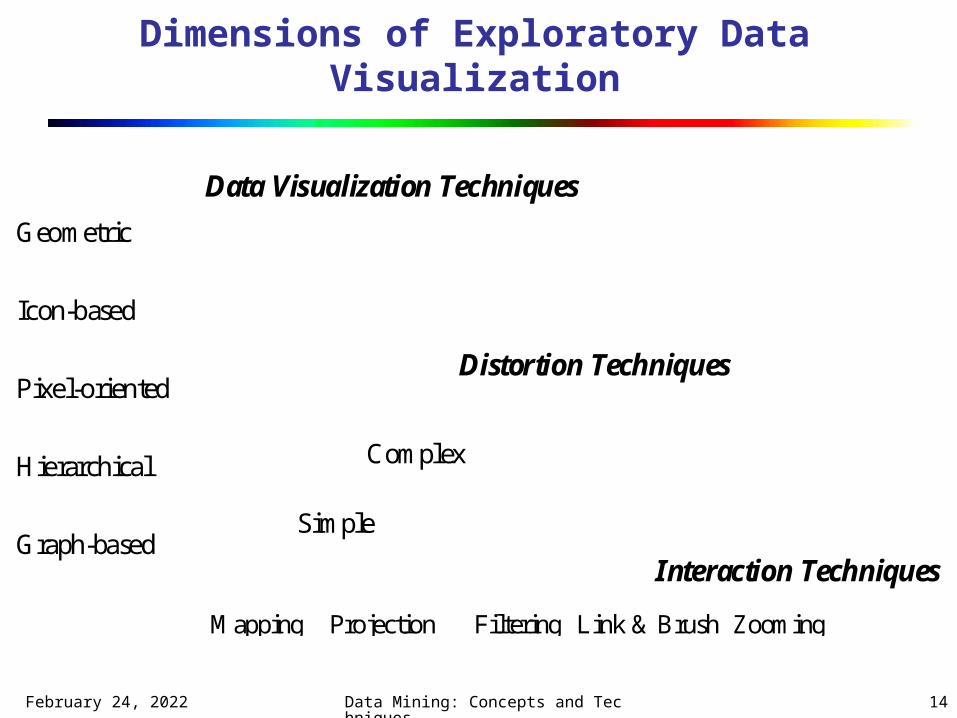
Geometric
Icon-based
Pixel-oriented
Hierarchical
Graph-based
Mapping Projection Filtering Link & Brush Zooming
Simple
Complex
Data Visualization Techniques
Distortion Techniques
Interaction Techniques
Dimensions of Exploratory Data Visualization
May 2, 2023 Data Mining: Concepts and Techniques
15
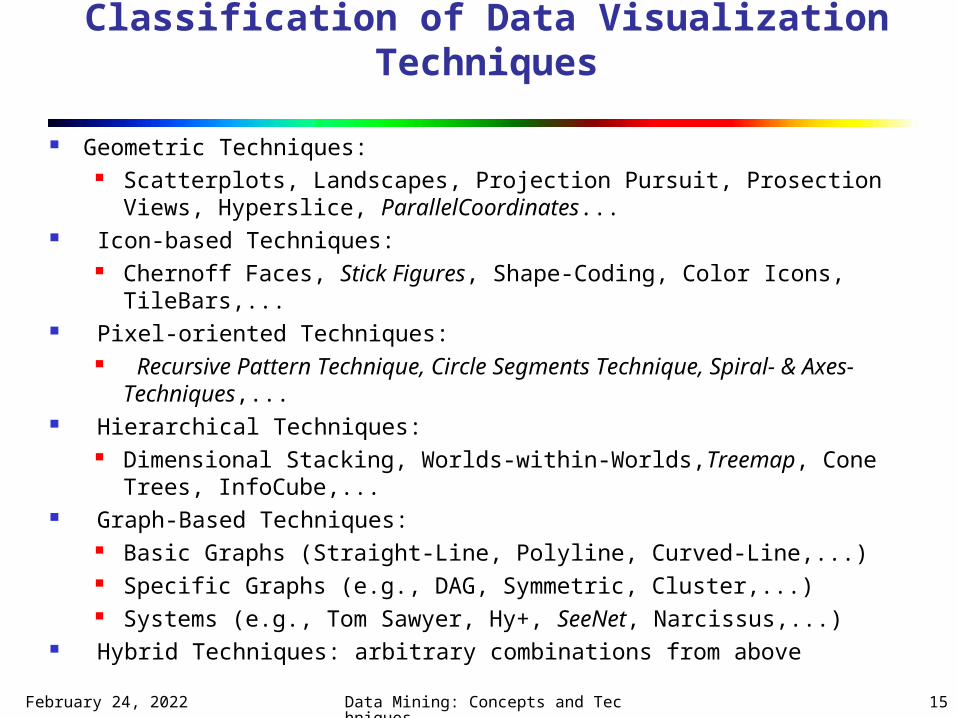
Classification of Data Visualization Techniques
Geometric Techniques: Scatterplots, Landscapes, Projection Pursuit, Prosection Views,
Hyperslice, ParallelCoordinates... Icon-based Techniques:
Chernoff Faces, Stick Figures, Shape-Coding, Color Icons, TileBars,...
Pixel-oriented Techniques: Recursive Pattern Technique, Circle Segments Technique, Spiral- &
Axes-Techniques,... Hierarchical Techniques:
Dimensional Stacking, Worlds-within-Worlds,Treemap, Cone Trees, InfoCube,...
Graph-Based Techniques: Basic Graphs (Straight-Line, Polyline, Curved-Line,...) Specific Graphs (e.g., DAG, Symmetric, Cluster,...) Systems (e.g., Tom Sawyer, Hy+, SeeNet, Narcissus,...)
Hybrid Techniques: arbitrary combinations from above
May 2, 2023 Data Mining: Concepts and Techniques
16
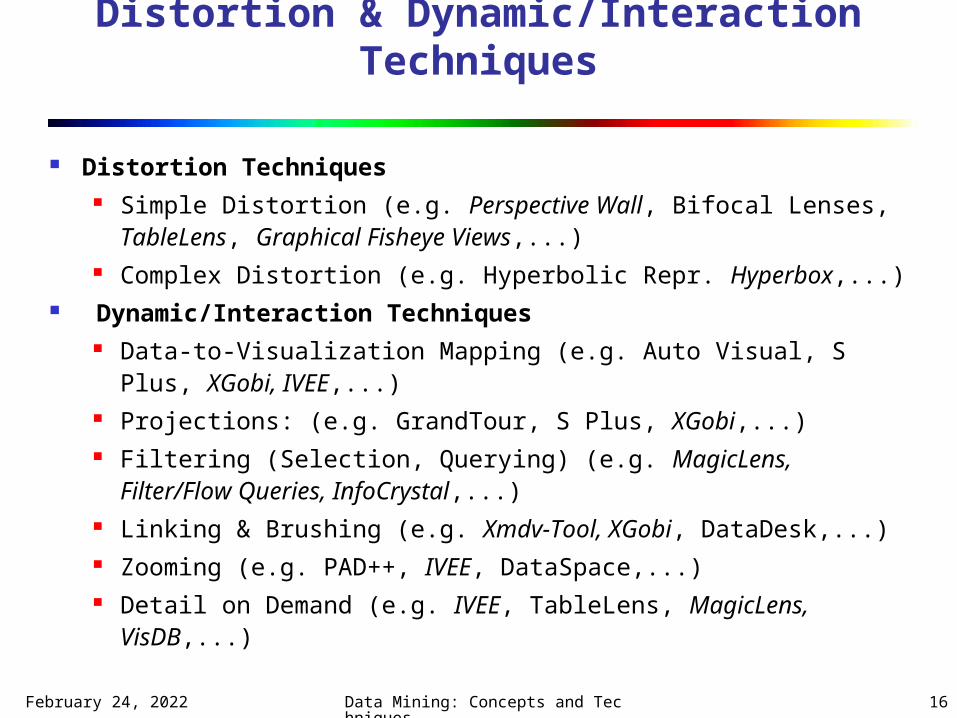
Distortion & Dynamic/Interaction Techniques
Distortion Techniques Simple Distortion (e.g. Perspective Wall, Bifocal Lenses,
TableLens, Graphical Fisheye Views,...) Complex Distortion (e.g. Hyperbolic Repr. Hyperbox,...)
Dynamic/Interaction Techniques Data-to-Visualization Mapping (e.g. Auto Visual, S Plus,
XGobi, IVEE,...) Projections: (e.g. GrandTour, S Plus, XGobi,...) Filtering (Selection, Querying) (e.g. MagicLens, Filter/Flow
Queries, InfoCrystal,...) Linking & Brushing (e.g. Xmdv-Tool, XGobi, DataDesk,...) Zooming (e.g. PAD++, IVEE, DataSpace,...) Detail on Demand (e.g. IVEE, TableLens, MagicLens,
VisDB,...)
May 2, 2023 Data Mining: Concepts and Techniques
17
Visual Survey
Data visualization techniques Scatterplot Matrices, Landscapes, Parallel
Coordinates Icon-based, Dimensional Stacking, Treemaps
May 2, 2023 Data Mining: Concepts and Techniques
18
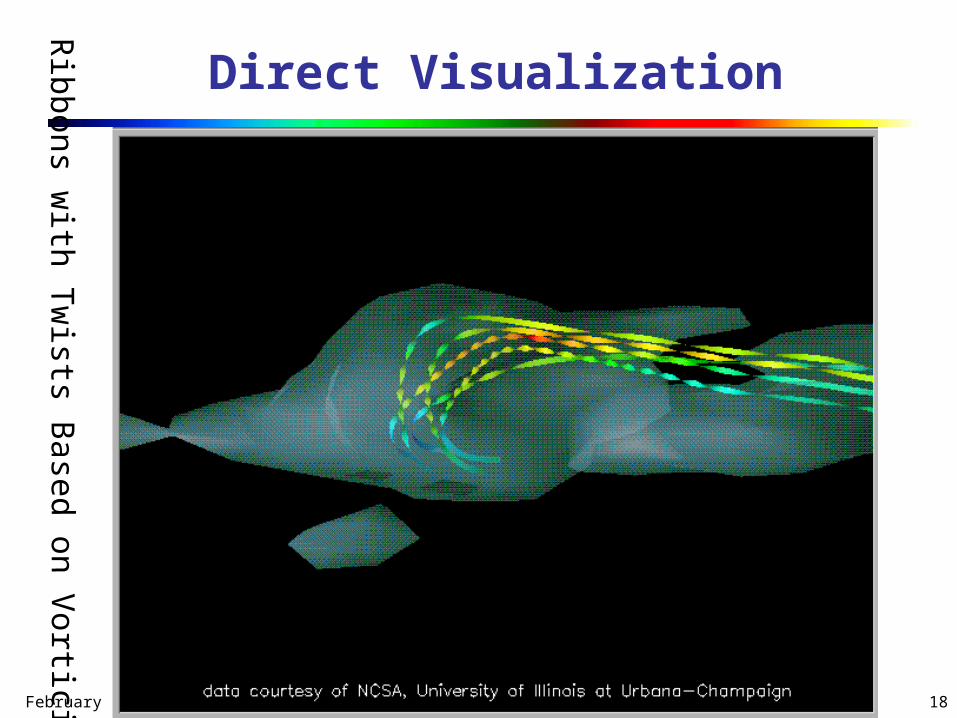
Direct Visualization
Ribbons w
ith Twists B
ased on Vorticity
May 2, 2023 Data Mining: Concepts and Techniques
19
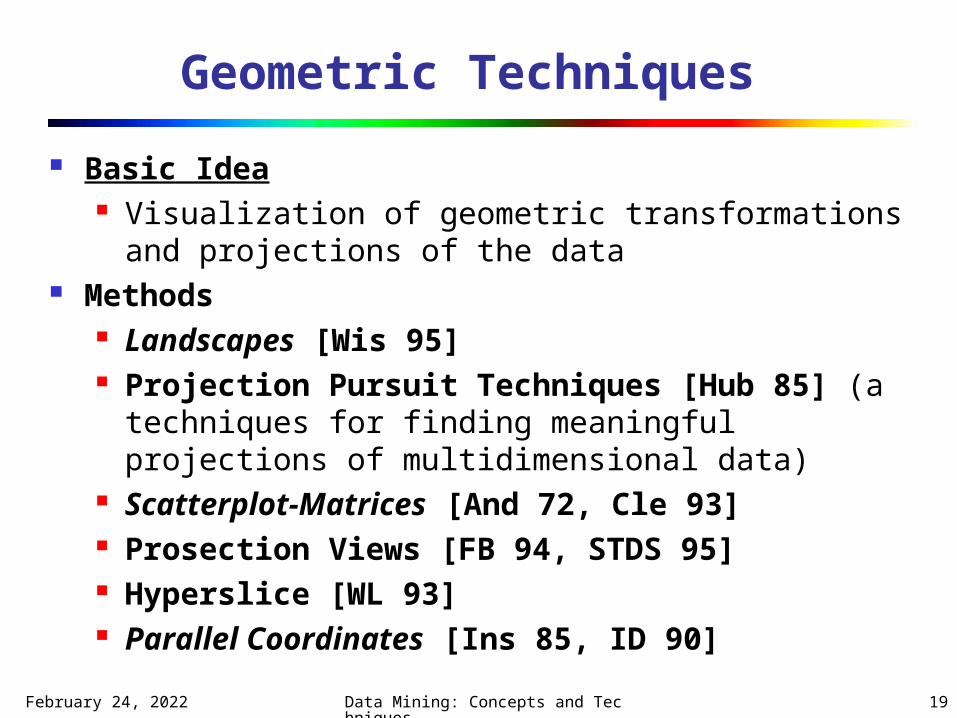
Geometric Techniques Basic Idea
Visualization of geometric transformations and projections of the data
Methods Landscapes [Wis 95] Projection Pursuit Techniques [Hub 85] (a
techniques for finding meaningful projections of multidimensional data)
Scatterplot-Matrices [And 72, Cle 93] Prosection Views [FB 94, STDS 95] Hyperslice [WL 93] Parallel Coordinates [Ins 85, ID 90]
May 2, 2023 Data Mining: Concepts and Techniques
20
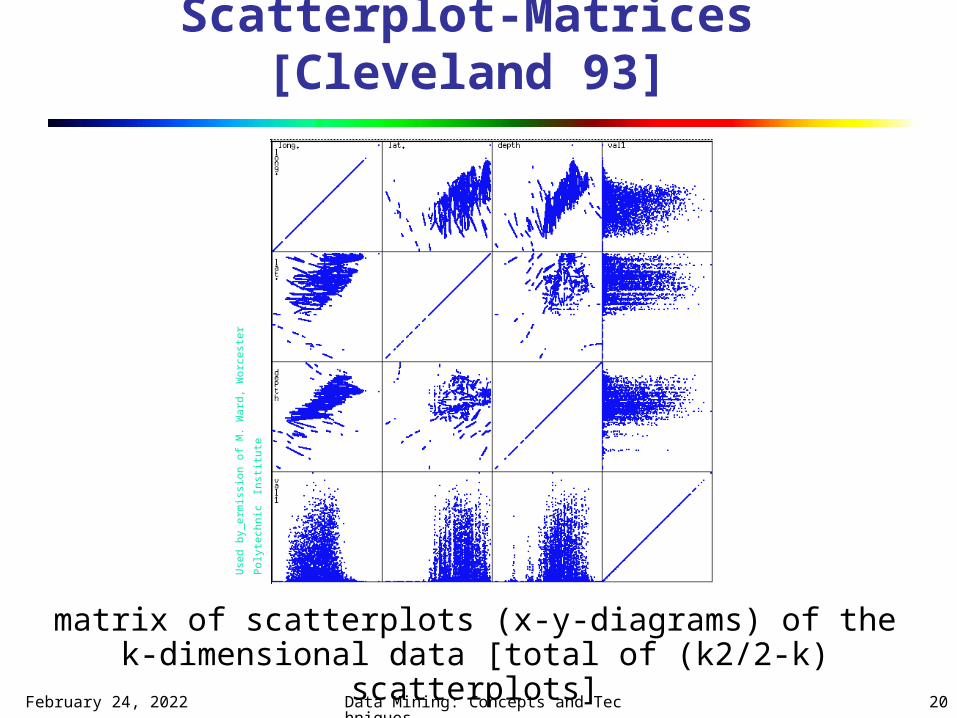
matrix of scatterplots (x-y-diagrams) of the k-dimensional data [total of (k2/2-k) scatterplots]
Use
d by
erm
issi
on o
f M. W
ard,
Wor
cest
er P
olyt
echn
ic In
stitu
te
Scatterplot-Matrices [Cleveland 93]
May 2, 2023 Data Mining: Concepts and Techniques
21
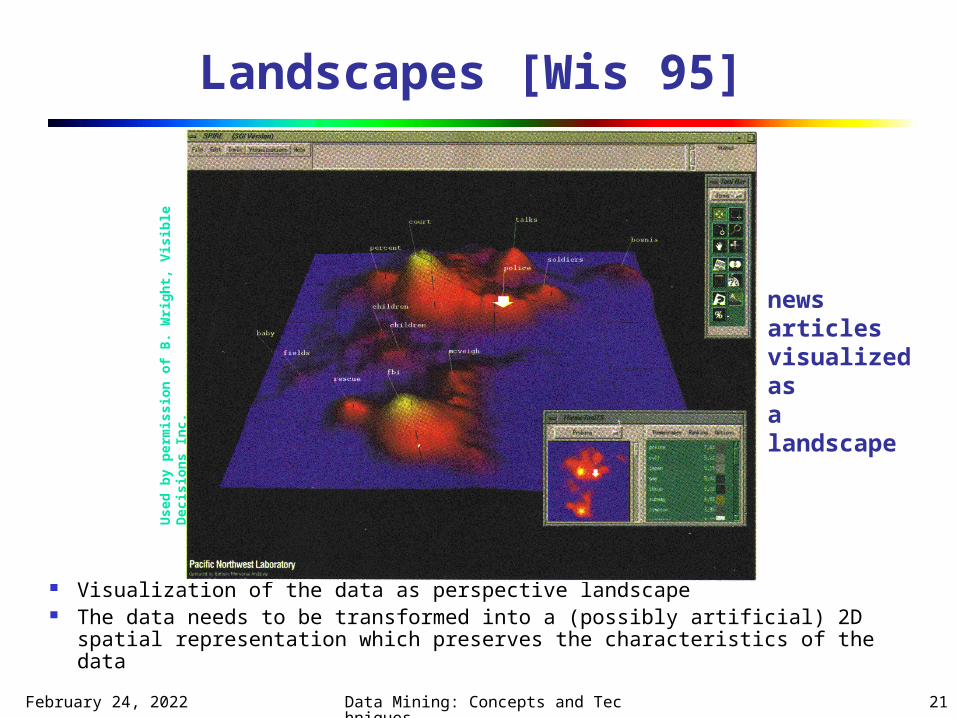
Landscapes [Wis 95]
Visualization of the data as perspective landscape The data needs to be transformed into a (possibly artificial) 2D spatial
representation which preserves the characteristics of the data
news articlesvisualized asa landscape
Use
d by
per
mis
sion
of B
. Wrig
ht, V
isib
le D
ecis
ions
Inc.
May 2, 2023 Data Mining: Concepts and Techniques
22
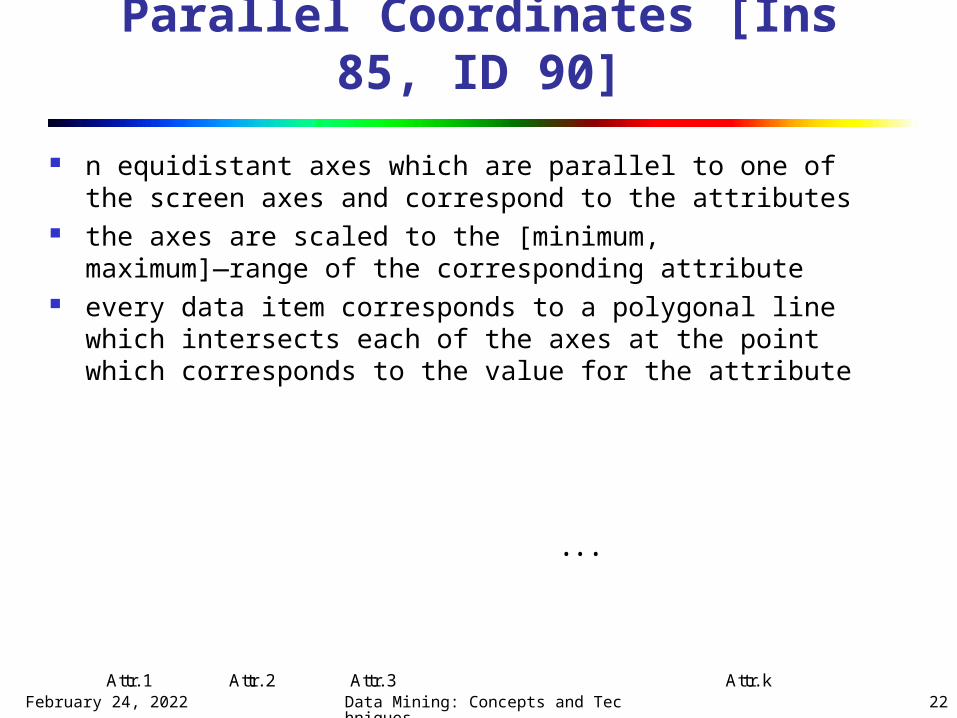
Parallel Coordinates [Ins 85, ID 90] n equidistant axes which are parallel to one of the screen
axes and correspond to the attributes the axes are scaled to the [minimum, maximum]―range of
the corresponding attribute every data item corresponds to a polygonal line which
intersects each of the axes at the point which corresponds to the value for the attribute
Attr. 1 Attr. 2 Attr. kAttr. 3
• • •
May 2, 2023 Data Mining: Concepts and Techniques
23
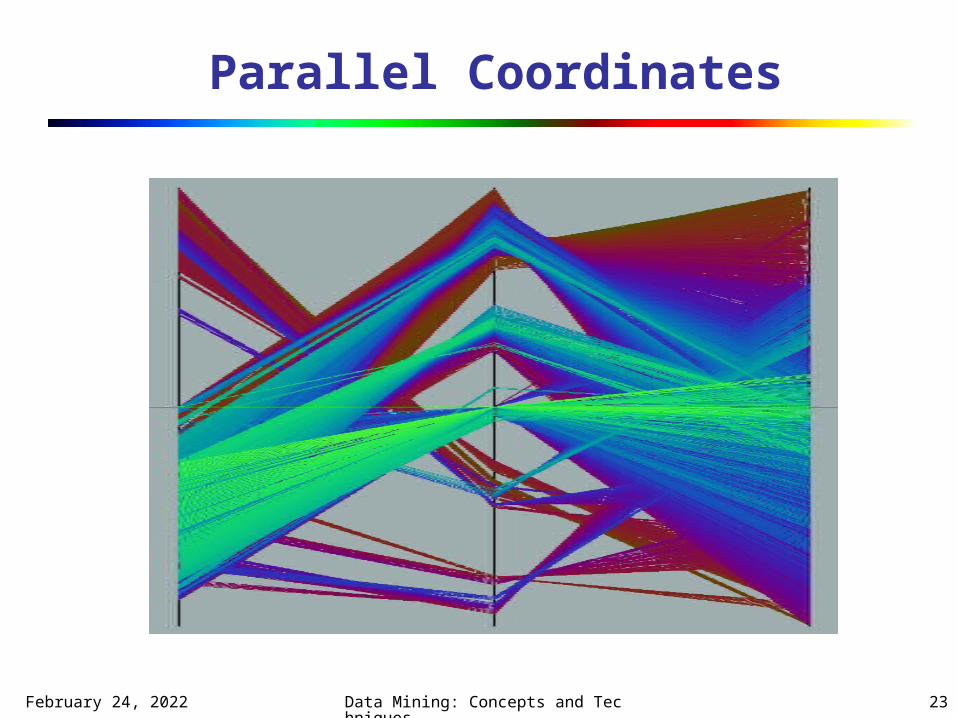
Parallel Coordinates
May 2, 2023 Data Mining: Concepts and Techniques
24
Icon-Based Techniques Basic Idea
Visualization of the data values as features of icons Overview
Chernoff-Faces [Che 73, Tuf 83] Stick Figures [Pic 70, PG 88] Shape Coding [Bed 90] Color Icons [Lev 91, KK 94] TileBars [Hea 95]
(use of small icons representing the relevance feature vectors in document retrieval)
May 2, 2023 Data Mining: Concepts and Techniques
25
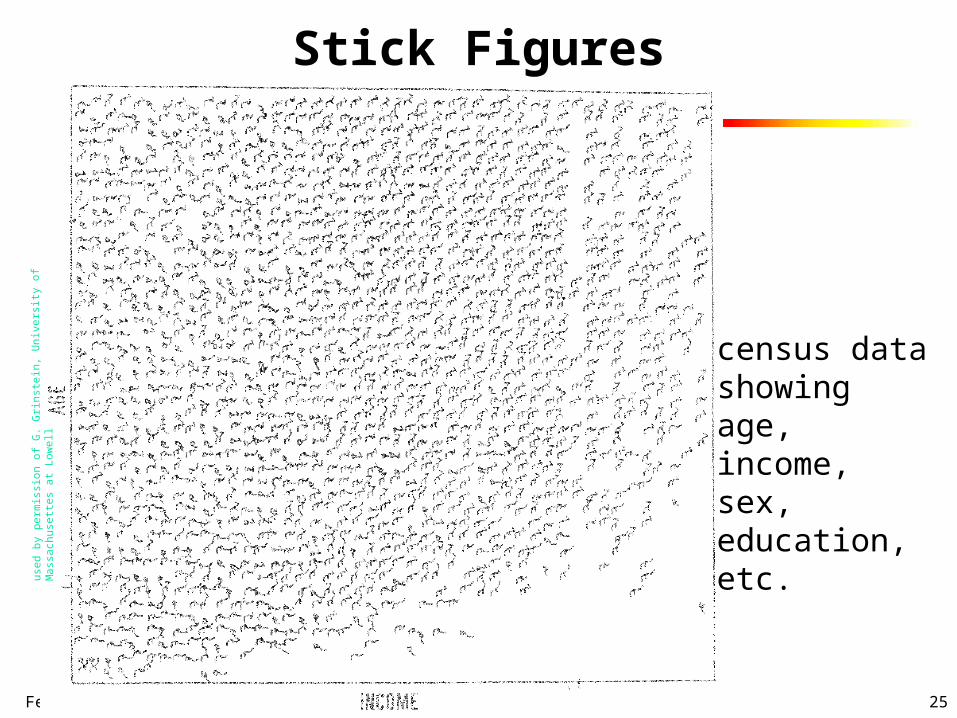
census data showing age, income, sex, education, etc.
used
by
perm
issi
on o
f G. G
rinst
ein,
Uni
vers
ity o
f Mas
sach
uset
tes
at L
owel
l
Stick Figures
May 2, 2023 Data Mining: Concepts and Techniques
26
Hierarchical Techniques
Basic Idea: Visualization of the data using a hierarchical partitioning into subspaces.
Overview Dimensional Stacking [LWW 90] Worlds-within-Worlds [FB 90a/b] Treemap [Shn 92, Joh 93] Cone Trees [RMC 91] InfoCube [RG 93]
May 2, 2023 Data Mining: Concepts and Techniques
27
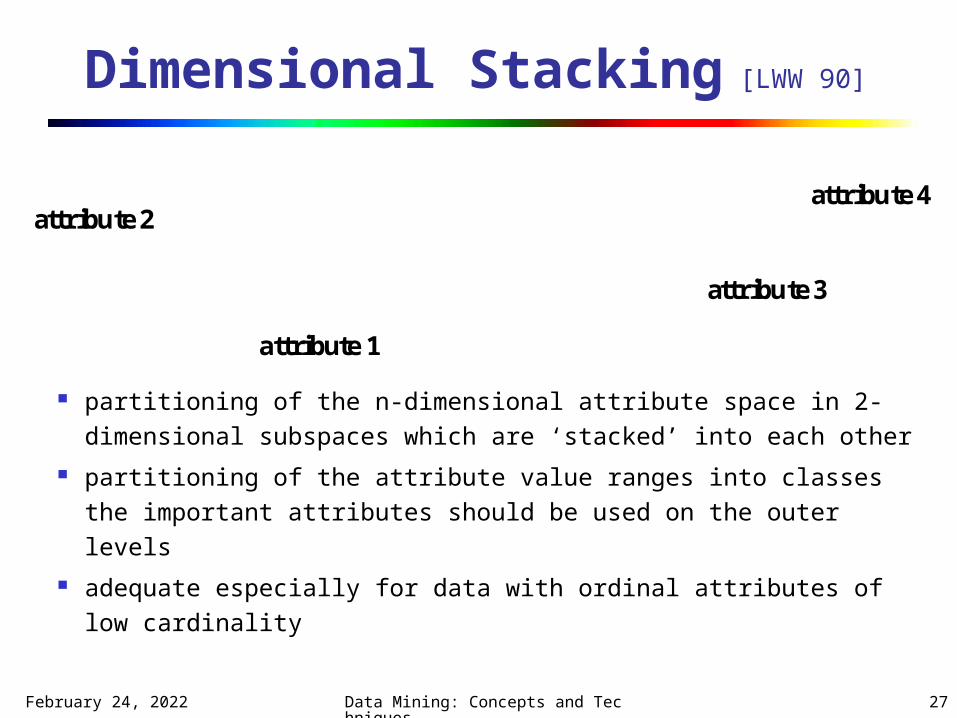
Dimensional Stacking [LWW 90]
partitioning of the n-dimensional attribute space in 2-dimensional subspaces which are ‘stacked’ into each other
partitioning of the attribute value ranges into classes the important attributes should be used on the outer levels
adequate especially for data with ordinal attributes of low cardinality
attribute 1
attribute 2
attribute 3
attribute 4
May 2, 2023 Data Mining: Concepts and Techniques
28
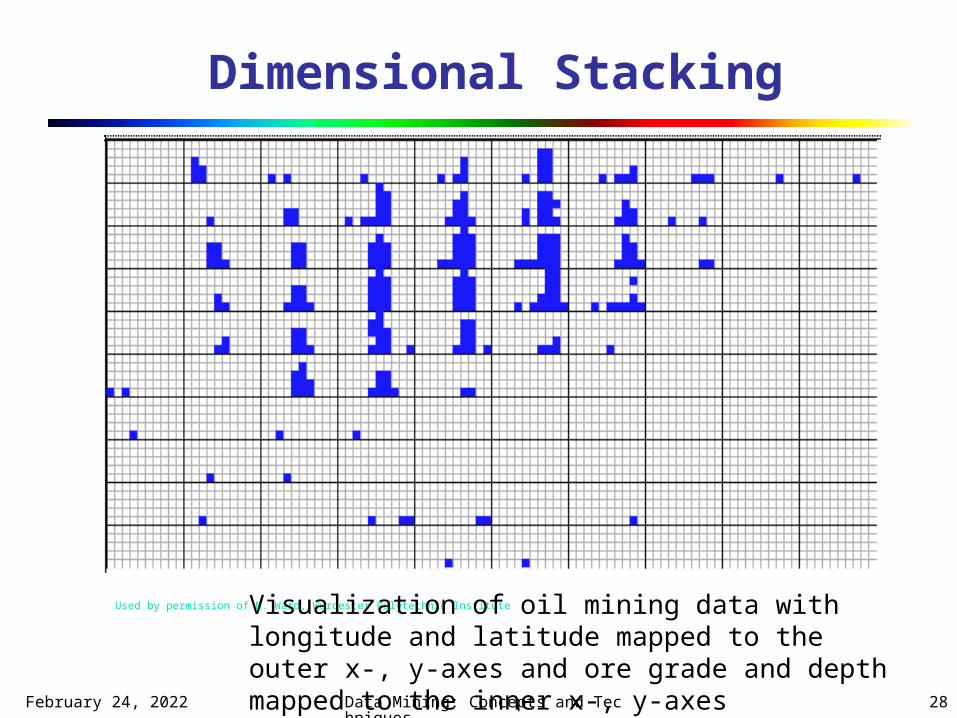
Used by permission of M. Ward, Worcester Polytechnic InstituteVisualization of oil mining data with longitude and latitude mapped to the outer x-, y-axes and ore grade and depth mapped to the inner x-, y-axes
Dimensional Stacking
May 2, 2023 Data Mining: Concepts and Techniques
29
Dimensional Stacking Disadvantages:
Difficult to display more than nine dimensions
Important to map dimensions appropriately
May be difficult to understand visualizations at first
May 2, 2023 Data Mining: Concepts and Techniques
30
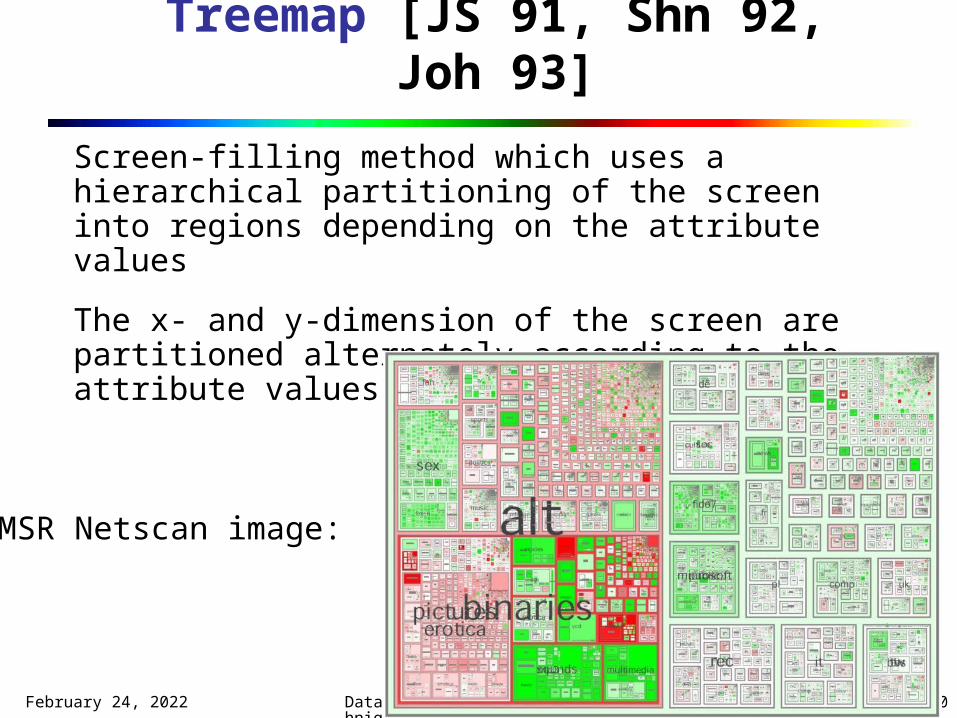
Screen-filling method which uses a hierarchical partitioning of the screen into regions depending on the attribute values
The x- and y-dimension of the screen are partitioned alternately according to the attribute values (classes)
Treemap [JS 91, Shn 92, Joh 93]
MSR Netscan image:
May 2, 2023 Data Mining: Concepts and Techniques
31
May 2, 2023 Data Mining: Concepts and Techniques
32
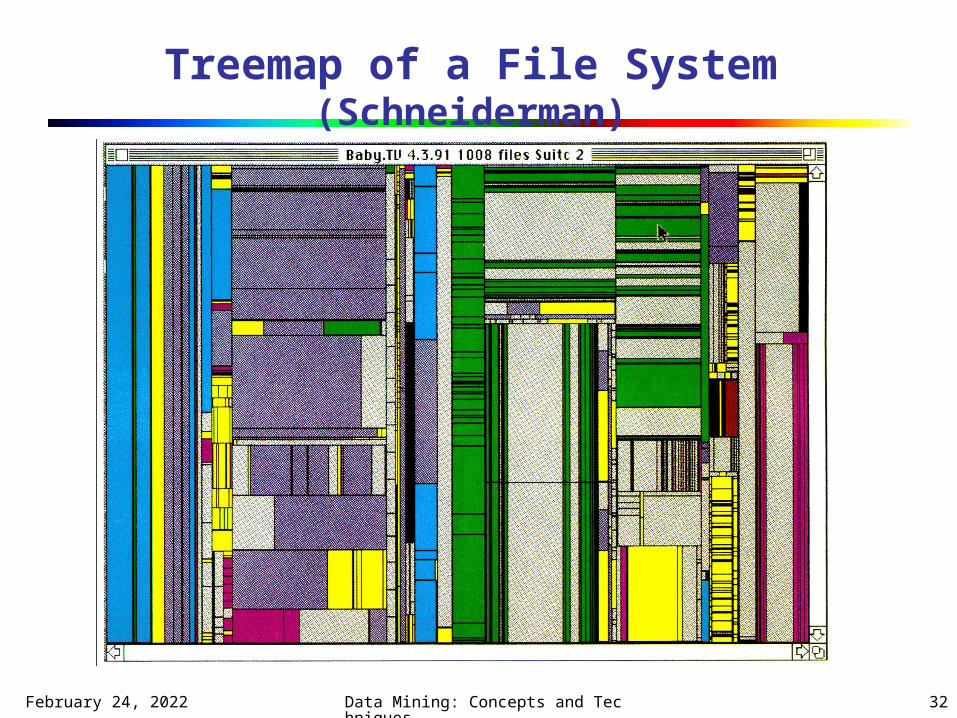
Treemap of a File System (Schneiderman)
May 2, 2023 Data Mining: Concepts and Techniques
33
Treemaps The attributes used for the partitioning and
their ordering are user-defined (the most important attributes should be used first)
The color of the regions may correspond to an additional attribute
Suitable to get an overview over large amounts of hierarchical data (e.g., file system) and for data with multiple ordinal attributes (e.g., census data)
May 2, 2023 Data Mining: Concepts and Techniques
34
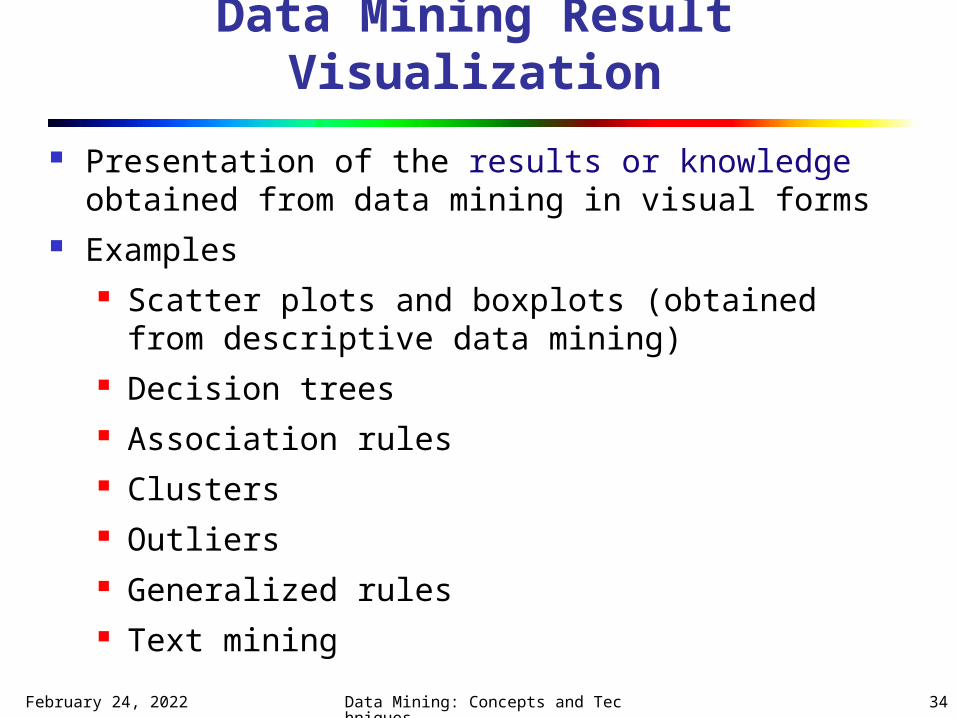
Data Mining Result Visualization
Presentation of the results or knowledge obtained from data mining in visual forms
Examples Scatter plots and boxplots (obtained from
descriptive data mining) Decision trees Association rules Clusters Outliers Generalized rules Text mining

May 2, 2023 Data Mining: Concepts and Techniques
35
Boxplots from Statsoft: Multiple Variable Combinations
May 2, 2023 Data Mining: Concepts and Techniques
36
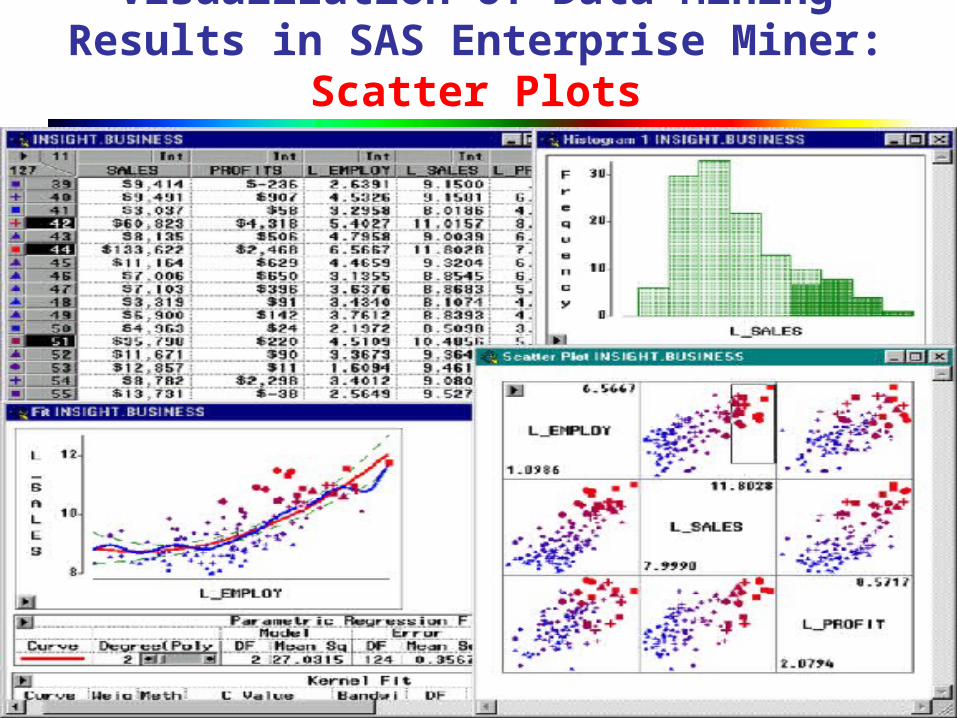
Visualization of Data Mining Results in SAS Enterprise Miner: Scatter
Plots
May 2, 2023 Data Mining: Concepts and Techniques
37
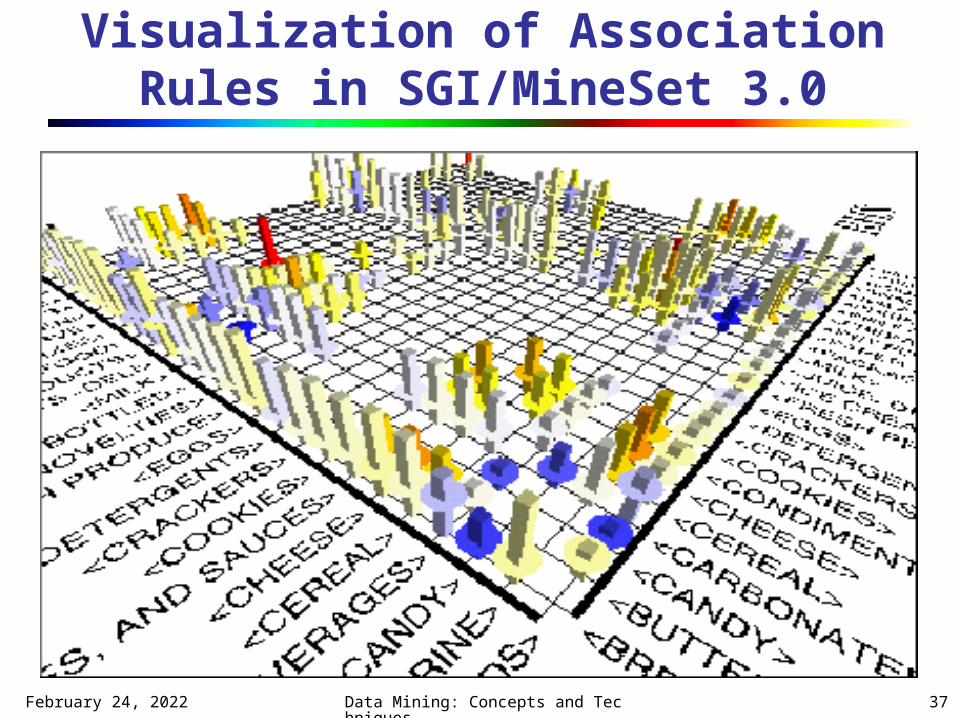
Visualization of Association Rules in SGI/MineSet 3.0
May 2, 2023 Data Mining: Concepts and Techniques
38
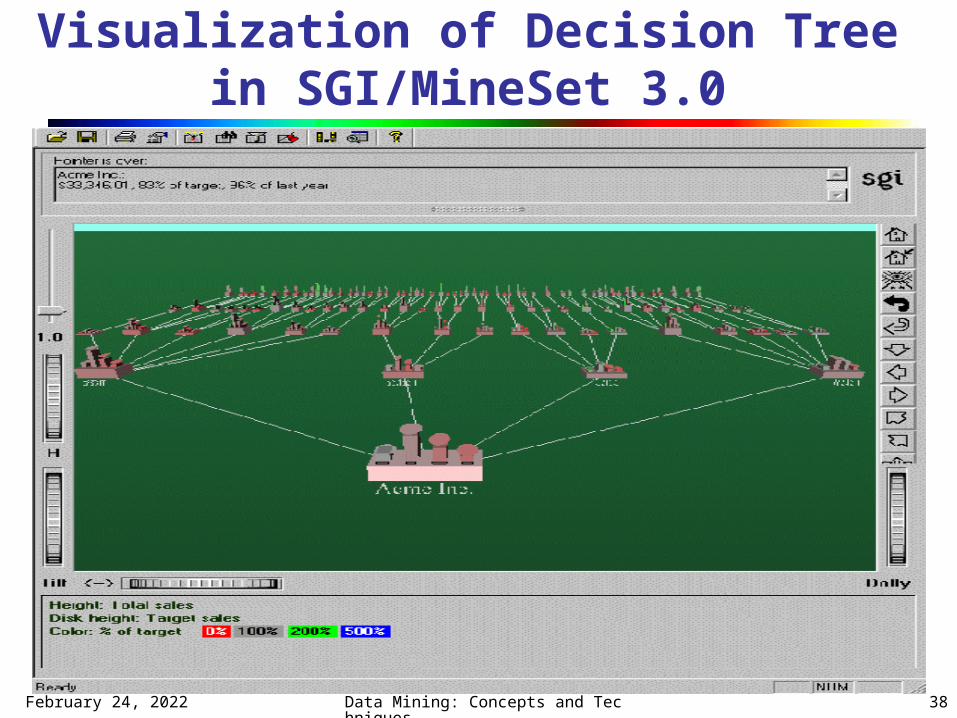
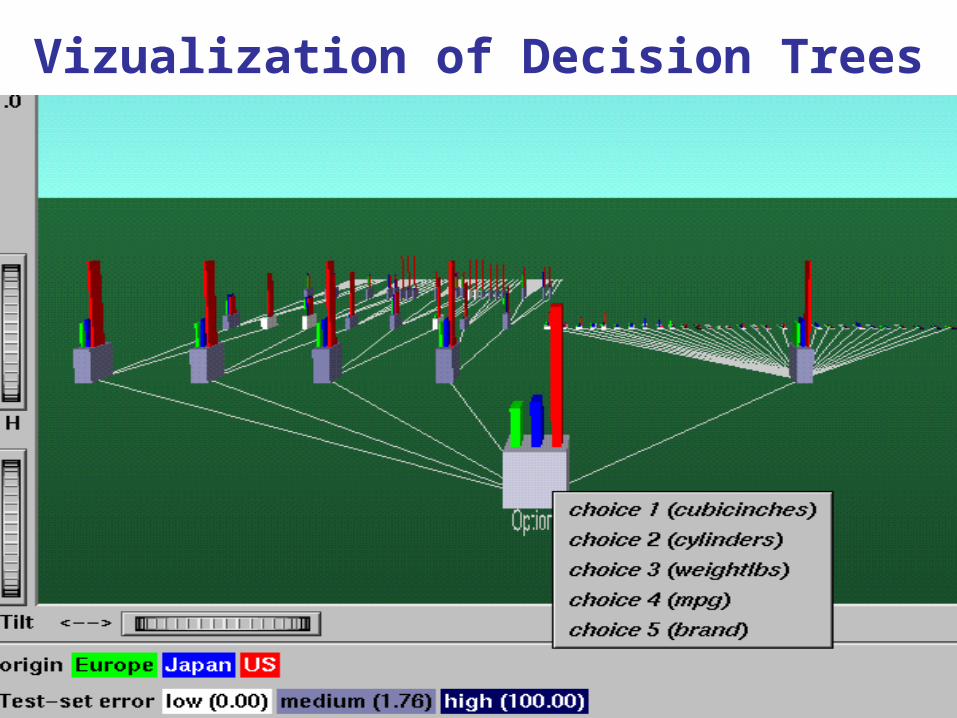
Visualization of Decision Tree in SGI/MineSet 3.0
May 2, 2023 Data Mining: Concepts and Techniques
39
Vizualization of Decision Trees
May 2, 2023 Data Mining: Concepts and Techniques
40
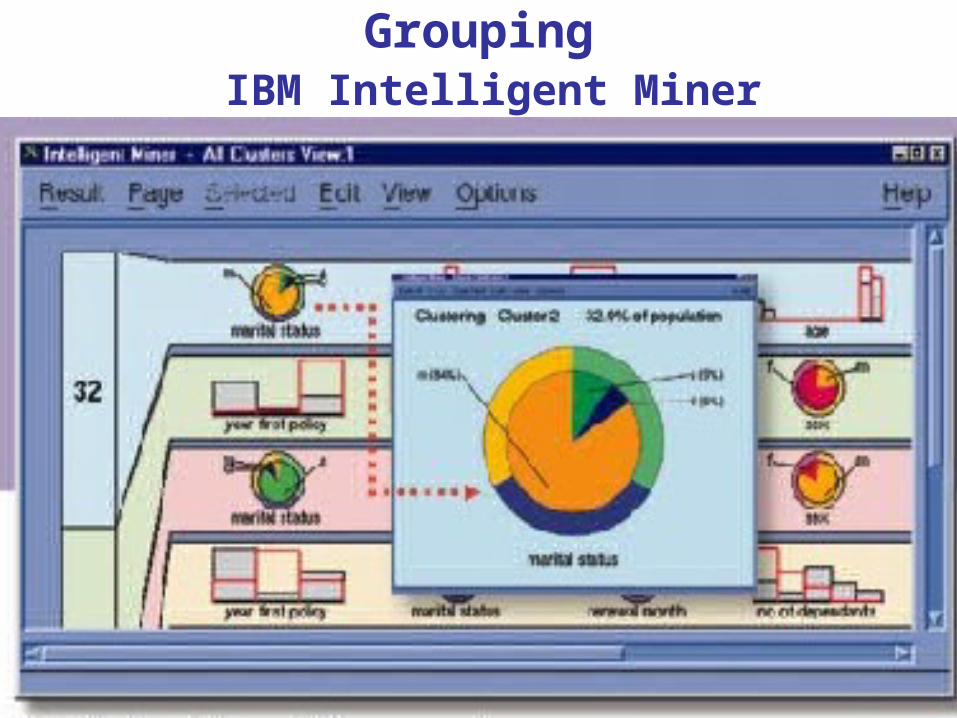
Visualization of Cluster Grouping IBM Intelligent Miner
May 2, 2023 Data Mining: Concepts and Techniques
41
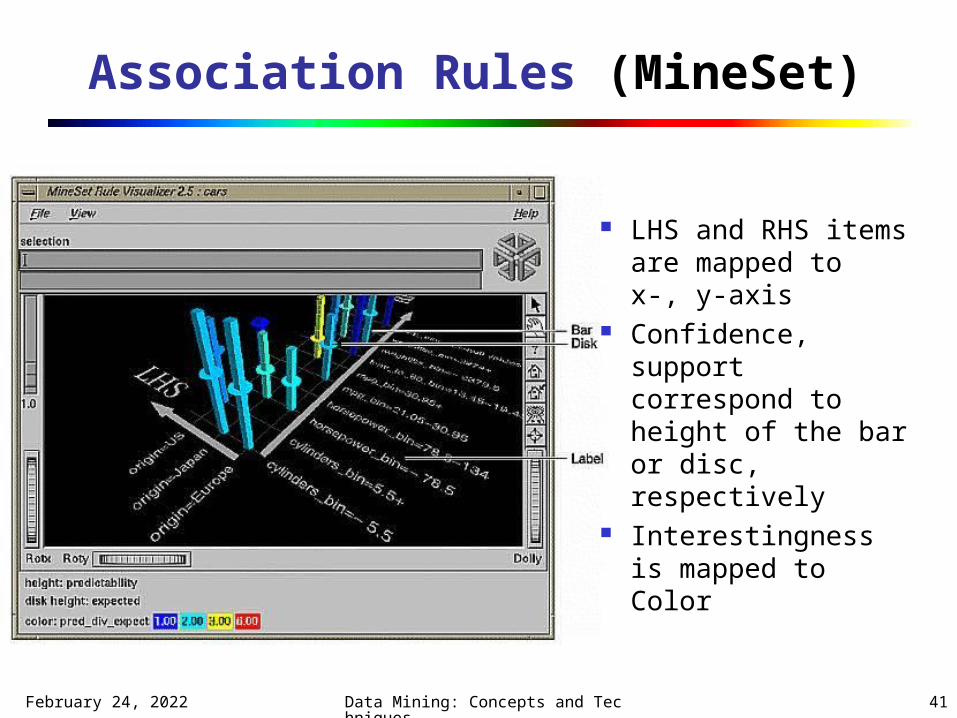
Association Rules (MineSet)
LHS and RHS items are mapped to x-, y-axis
Confidence, support correspond to height of the bar or disc, respectively
Interestingness is mapped to Color
May 2, 2023 Data Mining: Concepts and Techniques
42
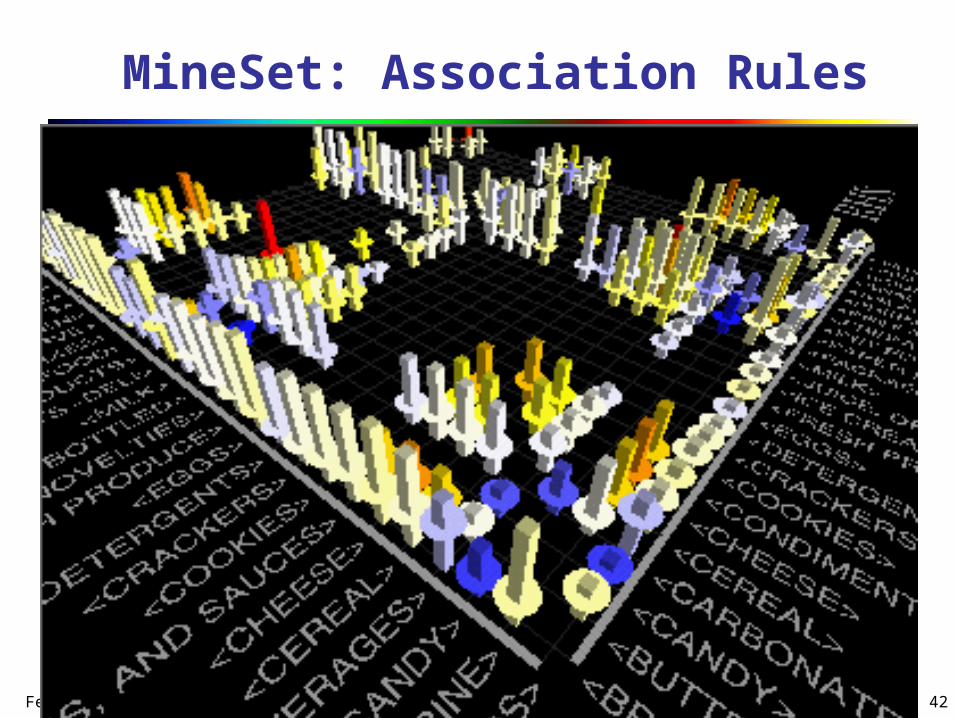
MineSet: Association Rules
May 2, 2023 Data Mining: Concepts and Techniques
43
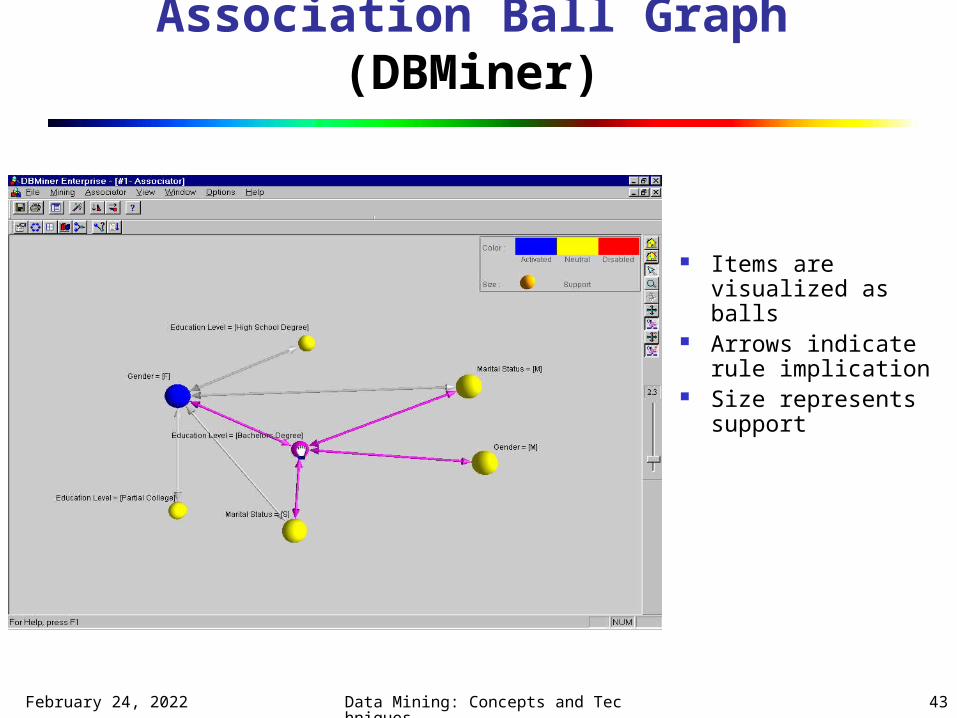
Association Ball Graph (DBMiner)
Items are visualized as balls
Arrows indicate rule implication
Size represents support

May 2, 2023 Data Mining: Concepts and Techniques
44
Classification (SAS EM [SAS 01])
Color corresponds to relative frequency of a class in a node
Branch line thickness is proportional to the square root of the objects
Tree Viewer
May 2, 2023 Data Mining: Concepts and Techniques
45
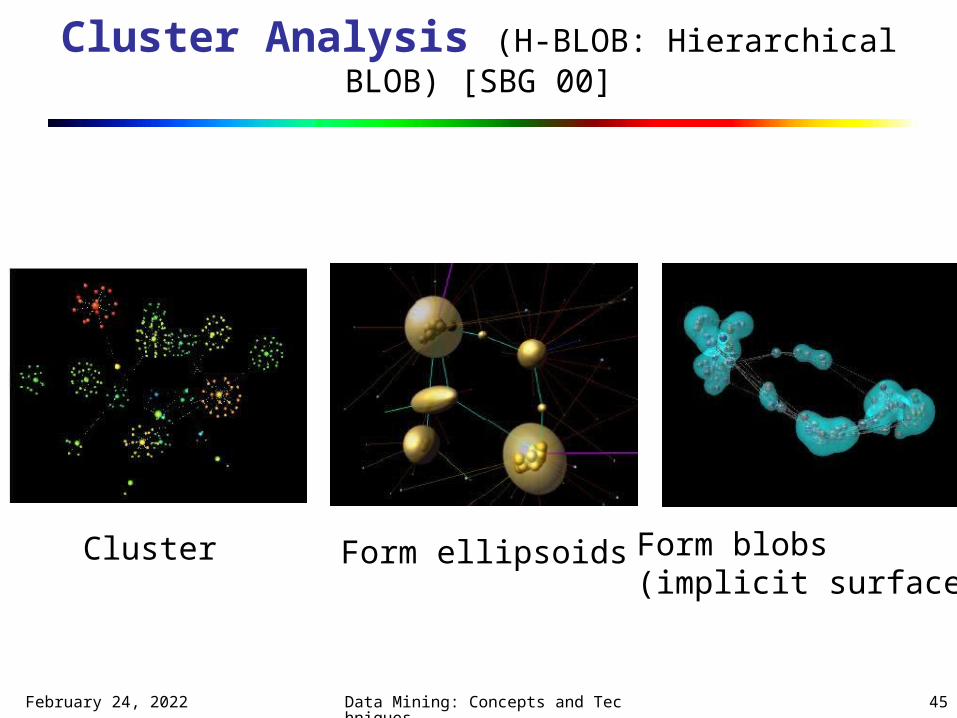
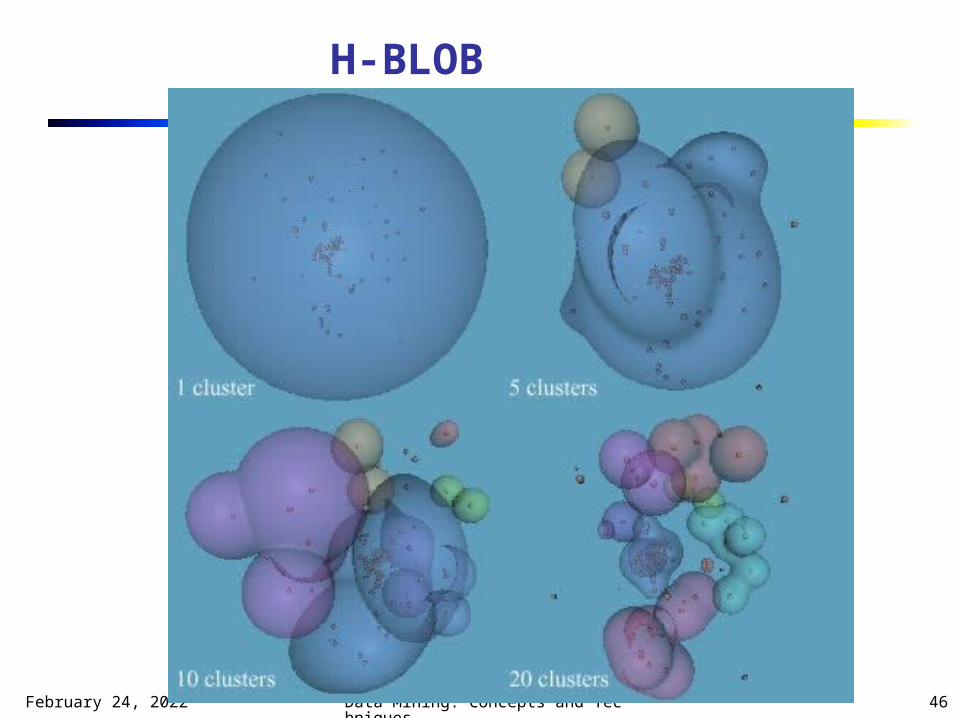
Cluster Analysis (H-BLOB: Hierarchical BLOB) [SBG 00]
Cluster Form ellipsoids Form blobs(implicit surfaces)
May 2, 2023 Data Mining: Concepts and Techniques
46
H-BLOB
May 2, 2023 Data Mining: Concepts and Techniques
47
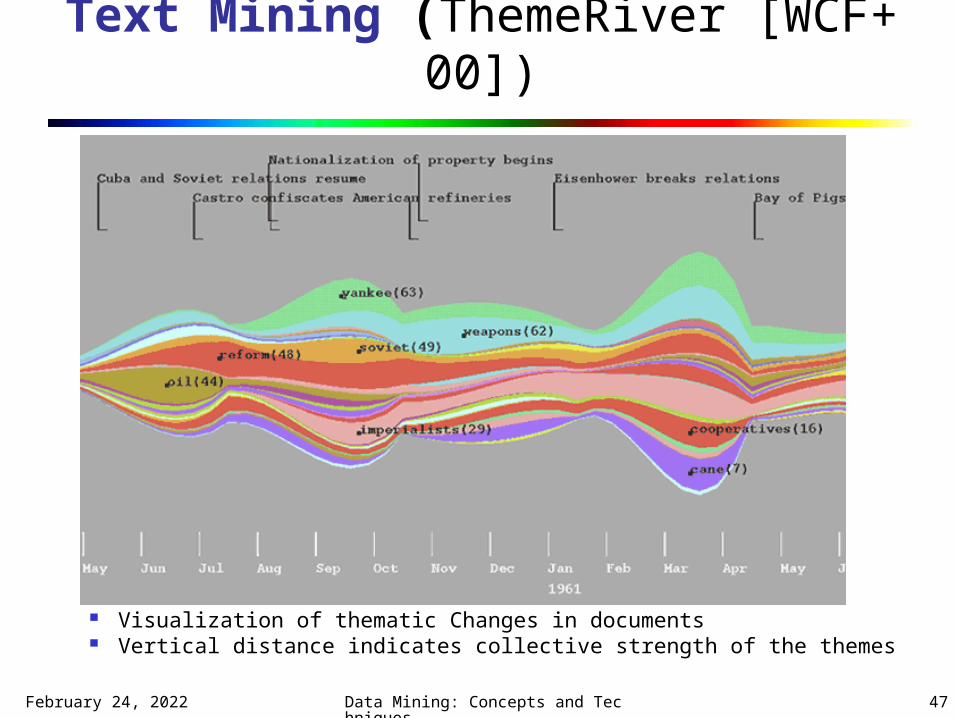
Text Mining (ThemeRiver [WCF+ 00])
Visualization of thematic Changes in documents Vertical distance indicates collective strength of the themes
May 2, 2023 Data Mining: Concepts and Techniques
48
Data Mining Process Visualization
Presentation of the various processes of data mining in visual forms so that users can see the flow of data cleaning, integration, preprocessing, mining Data extraction process Where the data is extracted How the data is cleaned, integrated,
preprocessed, and mined Method selected for data mining Where the results are stored How they may be viewed
May 2, 2023 Data Mining: Concepts and Techniques
49
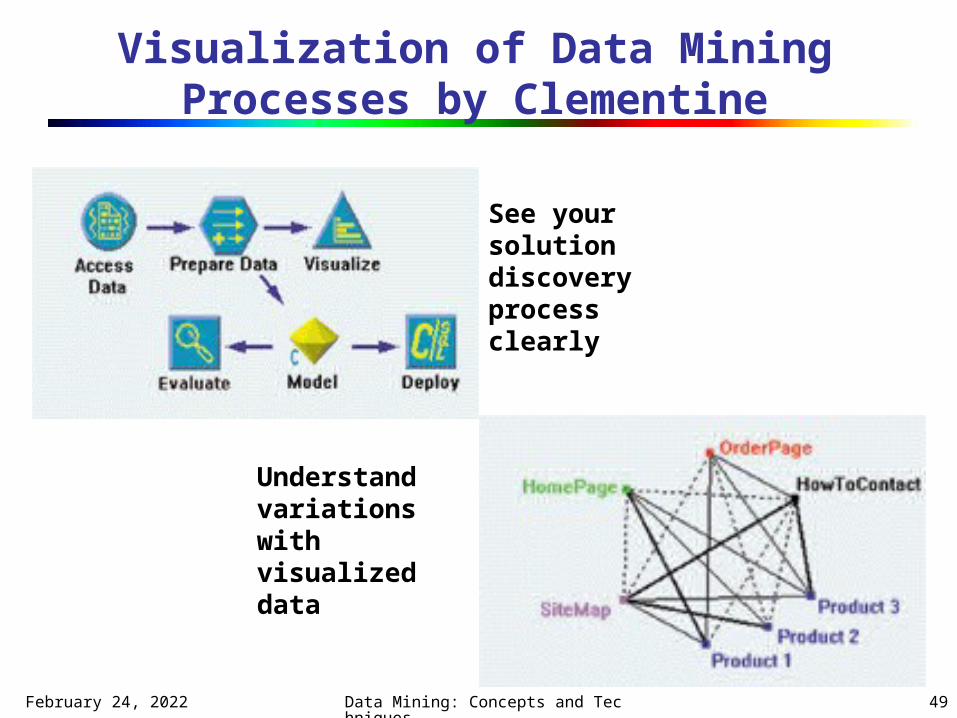
Visualization of Data Mining Processes by Clementine
Understand variations with visualized data
See your solution discovery process clearly
May 2, 2023 Data Mining: Concepts and Techniques
50
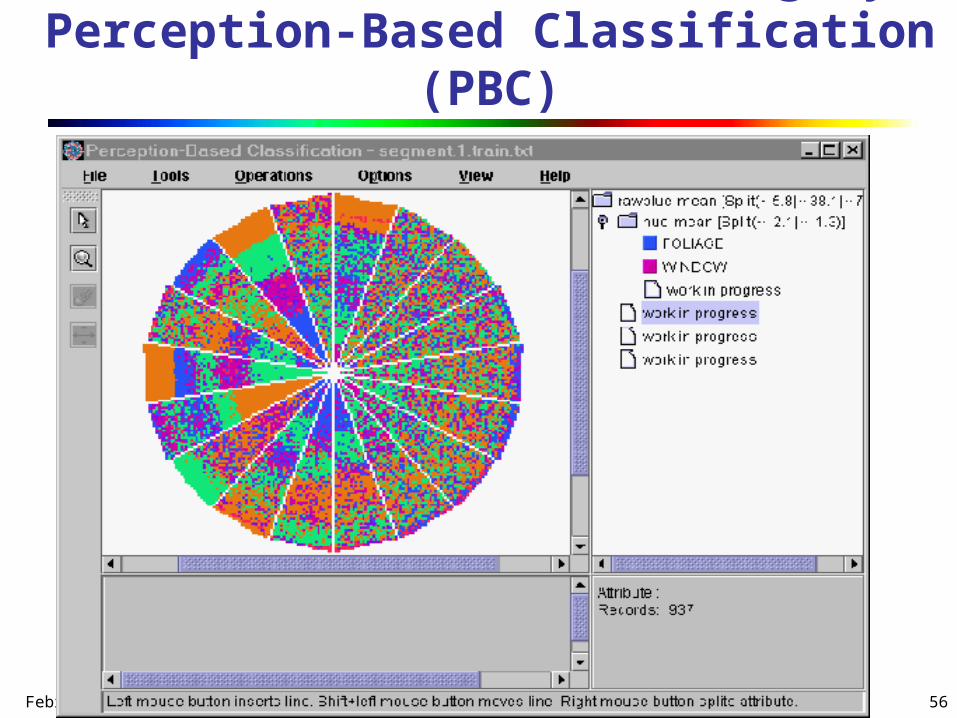
Interactive Visual Data Mining
Using visualization tools in the data mining process to help users make smart data mining decisions
Example Display the data distribution in a set of attributes
using colored sectors or columns (depending on whether the whole space is represented by either a circle or a set of columns)
Use the display to which sector should first be selected for classification and where a good split point for this sector may be
May 2, 2023 Data Mining: Concepts and Techniques
51
Visual data mining Projection Pursuits (Class) Tours [Dhillon et al. ’98] Visual Classification [Ankerst et al. KDD
’99]
May 2, 2023 Data Mining: Concepts and Techniques
52
Projection Pursuits Exploratory projection pursuit:
Goal: reduce dimensionality Define “interestingness” index to each
possible projection of a data set Maximize this index, project linearly Not always possible/useful
May 2, 2023 Data Mining: Concepts and Techniques
53
Class Tours “Visualizing Class Structure of
Multidimensional Data” by Dhillon et al. 1998
Problem: Visualize multidimensional data categorized into classes
Solution: Project data into 2D while preserving distances between class means
May 2, 2023 Data Mining: Concepts and Techniques
54
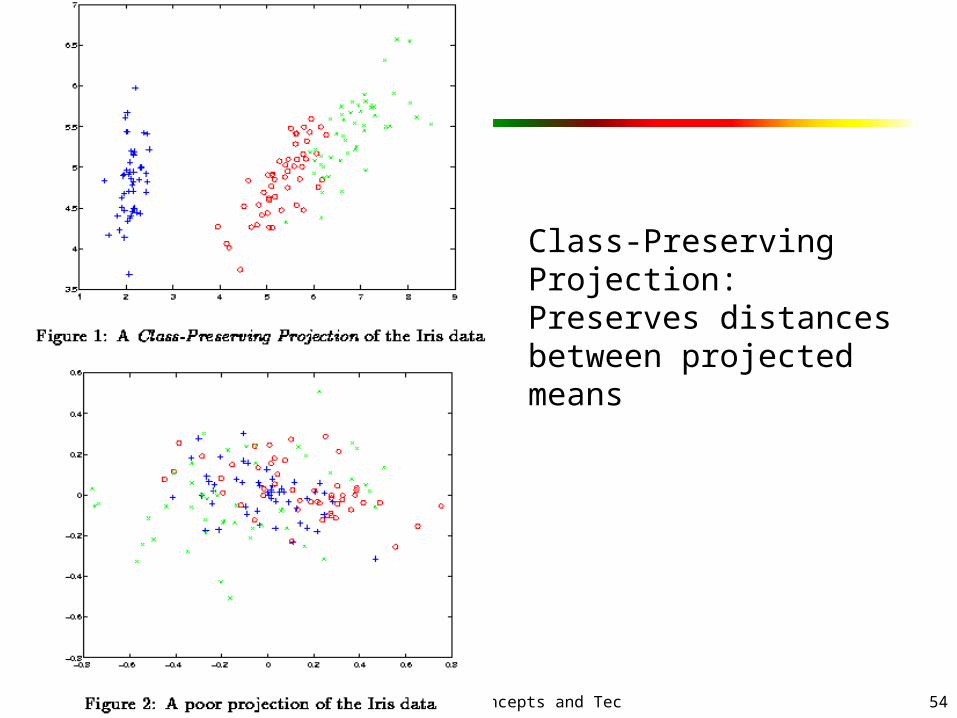
Class-Preserving Projection:Preserves distances between projected means
May 2, 2023 Data Mining: Concepts and Techniques
55
Tours Tours are animated and interpolated
sequences of 2D projections [Asimov 1985] Class tours: sequences of class-preserving
2-dimensional projections Captures “inter-class structure of complex,
multi-dimensional data”
May 2, 2023 Data Mining: Concepts and Techniques
56
Interactive Visual Mining by Perception-Based Classification
(PBC)
May 2, 2023 Data Mining: Concepts and Techniques
57
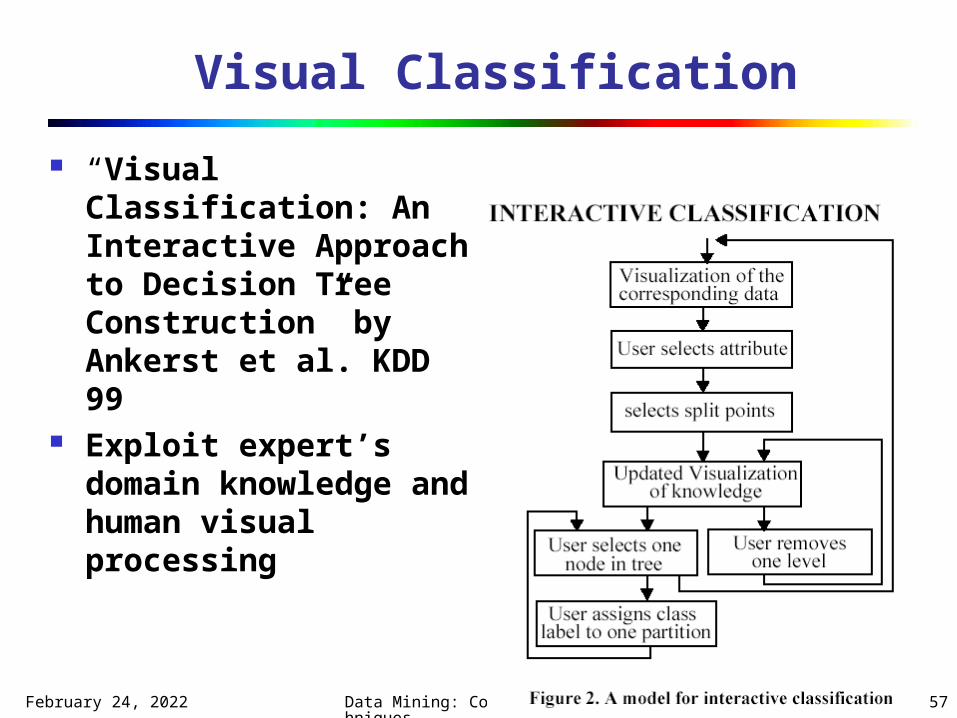
Visual Classification “Visual Classification:
An Interactive Approach to Decision Tree Construction” by Ankerst et al. KDD 99
Exploit expert’s domain knowledge and human visual processing
May 2, 2023 Data Mining: Concepts and Techniques
58
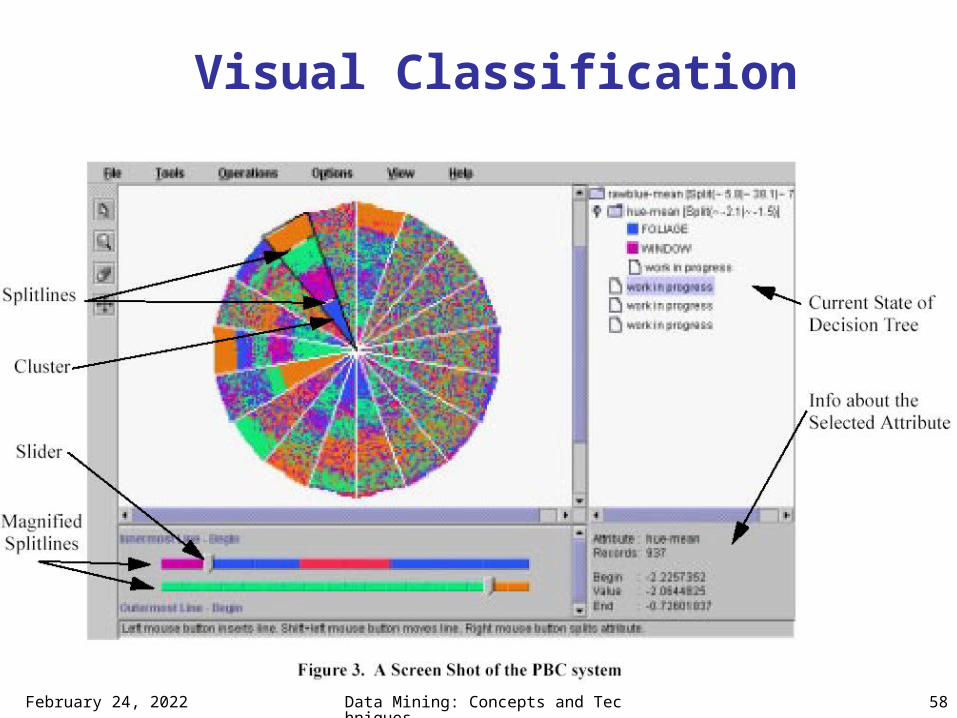
Visual Classification
May 2, 2023 Data Mining: Concepts and Techniques
59
Visual Classification Results Comparable classification accuracy Can produce more understandable decision
trees Expert domain knowledge can be exploited
May 2, 2023 Data Mining: Concepts and Techniques
60
Audio Data Mining Uses audio signals to indicate the patterns of data
or the features of data mining results An interesting alternative to visual mining An inverse task of mining audio (such as music)
databases which is to find patterns from audio data
Visual data mining may disclose interesting patterns using graphical displays, but requires users to concentrate on watching patterns
Instead, transform patterns into sound and music and listen to pitches, rhythms, tune, and melody in order to identify anything interesting or unusual
May 2, 2023 Data Mining: Concepts and Techniques
61
Summary Many visualization methods available How to evaluate and compare methods? Need for:
Integrated visualization/exploration systems
Studies of interaction techniques for mining
Practical case studies
May 2, 2023 Data Mining: Concepts and Techniques
62
Acknowledgments
Many slides and images from Mihael Ankerst, Boeing, Daniel A. Keim, AT&T, Tutorial at PKDD'2001
Some pictures from Information Visualization in Data Mining and Knowledge Discovery, edited by Usama Fayyad, Georges Grinstein and Andreas Wierse
A good set of slides were prepared by Andrew Wu (Spring 2004)

May 2, 2023 Data Mining: Concepts and Techniques
63