additive and interactive effects on response time distributions in visual word recognition
TRANSCRIPT
Additive and Interactive Effects on Response Time Distributions in VisualWord Recognition
Melvin J. Yap and David A. BalotaWashington University in St. Louis
Across 3 different word recognition tasks, distributional analyses were used to examine the joint effectsof stimulus quality and word frequency on underlying response time distributions. Consistent with theextant literature, stimulus quality and word frequency produced additive effects in lexical decision, notonly in the means but also in the shape of the response time distributions, supporting an earlynormalization process that is separate from processes influenced by word frequency. In contrast, speededpronunciation and semantic classification produced interactive influences of word frequency and stim-ulus quality, which is a fundamental prediction from interactive activation models of lexical processing.These findings suggest that stimulus normalization is specific to lexical decision and is driven by thetask’s emphasis on familiarity-based information.
Keywords: distributional analysis, task-specific effects, stimulus quality, word frequency, visual wordrecognition
Beginning with Donders (1868/1969), a central goal of under-standing human cognition has been to isolate constituent subpro-cesses through the use of mental chronometry. As there wereproblems with the insertion procedure Donders advocated, Stern-berg (1969a) developed additive-factors logic in which one canprovide leverage on the manner in which stages of informationprocessing are organized. Specifically, one can use response time(RT) data from factorial experiments to make inferences about themodules associated with a mental process. For example, Sternbergargued that in an experiment in which two variables are manipu-lated, additive effects of both variables (i.e., main effects for bothvariables and no interaction) suggest that the variables influenceseparately modifiable processing stages. In contrast, interactiveeffects are more consistent with the variables influencing at leastone stage in common.
In a classic application of additive-factors logic, stimulus quality(intact vs. degraded) and set size (number of items in memory)were manipulated in a memory search task, and these two factorswere found to be additive (Sternberg, 1967, 1969b). These additive
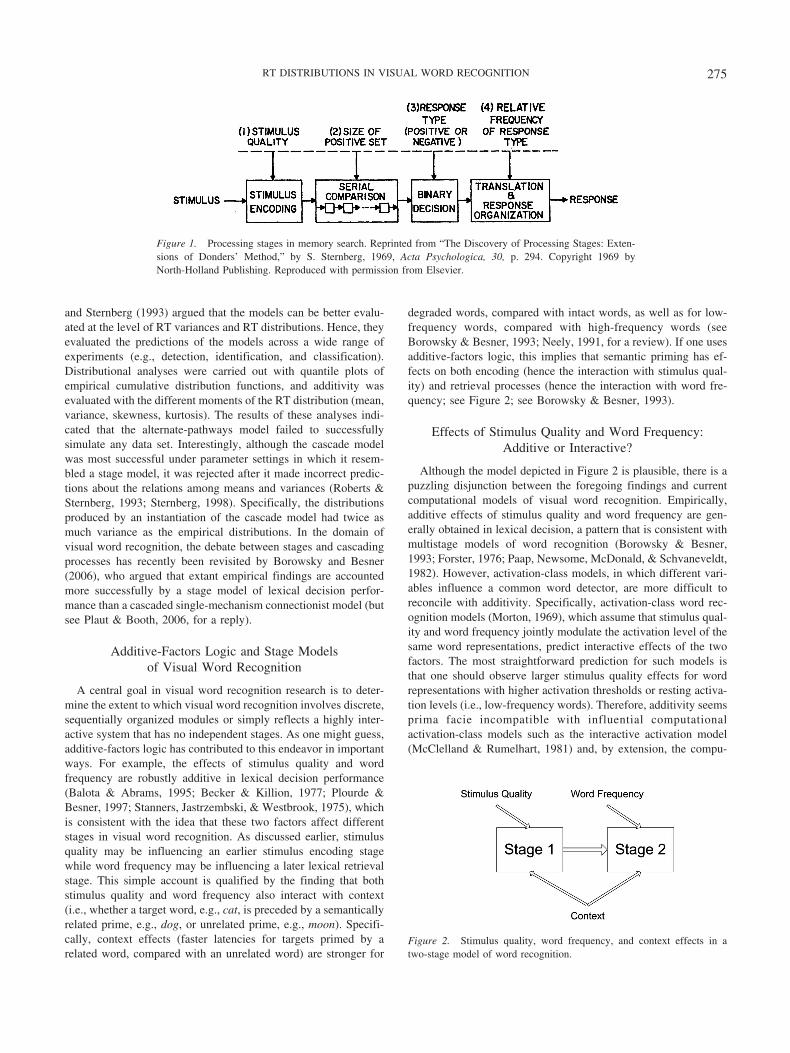
effects were interpreted as being consistent with a stage model ofmemory search, in which stimulus quality influences an earlyencoding stage, and set size influences a subsequent serial com-parison stage (see Figure 1). In contrast, factors that interact areassumed to influence a common processing locus. For example,Becker (1979) investigated the effects of word frequency (high vs.low frequency) and semantic context (related vs. unrelated con-text) on word recognition and reported that word frequency inter-acts with semantic context. This suggests that word frequency andsemantic context influence a common stage.
Following this early classic work, demonstrations of clear ad-ditivity have been observed across diverse studies (see Sternberg,1998, for an extensive review; see also Roberts, 1987; Sanders,1990), supporting the claim that additive effects reflect discretestages of processing and that different factors can selectivelyinfluence these stages. Given that the notion of discrete stagesseems simplistic and architecturally implausible, it is perhapsunsurprising that additive-factor logic has encountered some re-sistance and skepticism (e.g., Broadbent, 1984, pp. 56–58; Gard-ner, 1985, pp. 120–124; Luce, 1986, pp. 481–483; Townsend,1984; Townsend & Ashby, 1983). Although separate stages implyadditivity, additivity may not necessarily imply stages.
There are two competing architectures that have been proposedthat produce approximate or exact additive effects in mean RT andyet do not assume separate stages: the alternate-pathways model(Roberts & Sternberg, 1993) and the cascade model (Ashby, 1982;McClelland, 1979). In an alternate-pathways model with two path-ways, pathway a is engaged on a certain proportion of trials, andpathway b is engaged on the remaining trials; both pathways arenever used during the same trial. In a cascade model with multipleprocesses, all processes are operating continuously, with the cur-rent (partial) output of one process immediately available as aninput for the next process. Because the three competing models(i.e., stage, alternate pathways, and cascade) make predictions thatare virtually indistinguishable at the level of mean RTs, Roberts
Melvin J. Yap and David A. Balota, Department of Psychology, Wash-ington University in St. Louis.
This research was supported by National Institute of Aging GrantAG03991 and National Science Foundation Grant BCS 0001801 to DavidA. Balota.
Portions of this research were presented at the 45th (November 2004,Minneapolis, MN) and 46th (November, 2005, Toronto, Ontario, Canada)Annual Meetings of the Psychonomic Society.
We thank Derek Besner, Ken Forster, Dave Plaut, and Sachiko Ki-noshita for their insightful reviews, and Jeff Rouder and Roger Ratcliff forassistance with the distributional analyses. Finally, we also extend thanksto Tassy Hayden, Justin Horn, Anuj Shah, and Stephanie To for their helpwith data collection.
Correspondence concerning this article should be addressed to David A.Balota, Department of Psychology, Washington University, St. Louis, MO,63130.
Journal of Experimental Psychology: Copyright 2007 by the American Psychological AssociationLearning, Memory, and Cognition2007, Vol. 33, No. 2, 274–296
0278-7393/07/$12.00 DOI: 10.1037/0278-7393.33.2.274
274
and Sternberg (1993) argued that the models can be better evalu-ated at the level of RT variances and RT distributions. Hence, theyevaluated the predictions of the models across a wide range ofexperiments (e.g., detection, identification, and classification).Distributional analyses were carried out with quantile plots ofempirical cumulative distribution functions, and additivity wasevaluated with the different moments of the RT distribution (mean,variance, skewness, kurtosis). The results of these analyses indi-cated that the alternate-pathways model failed to successfullysimulate any data set. Interestingly, although the cascade modelwas most successful under parameter settings in which it resem-bled a stage model, it was rejected after it made incorrect predic-tions about the relations among means and variances (Roberts &Sternberg, 1993; Sternberg, 1998). Specifically, the distributionsproduced by an instantiation of the cascade model had twice asmuch variance as the empirical distributions. In the domain ofvisual word recognition, the debate between stages and cascadingprocesses has recently been revisited by Borowsky and Besner(2006), who argued that extant empirical findings are accountedmore successfully by a stage model of lexical decision perfor-mance than a cascaded single-mechanism connectionist model (butsee Plaut & Booth, 2006, for a reply).
Additive-Factors Logic and Stage Modelsof Visual Word Recognition
A central goal in visual word recognition research is to deter-mine the extent to which visual word recognition involves discrete,sequentially organized modules or simply reflects a highly inter-active system that has no independent stages. As one might guess,additive-factors logic has contributed to this endeavor in importantways. For example, the effects of stimulus quality and wordfrequency are robustly additive in lexical decision performance(Balota & Abrams, 1995; Becker & Killion, 1977; Plourde &Besner, 1997; Stanners, Jastrzembski, & Westbrook, 1975), whichis consistent with the idea that these two factors affect differentstages in visual word recognition. As discussed earlier, stimulusquality may be influencing an earlier stimulus encoding stagewhile word frequency may be influencing a later lexical retrievalstage. This simple account is qualified by the finding that bothstimulus quality and word frequency also interact with context(i.e., whether a target word, e.g., cat, is preceded by a semanticallyrelated prime, e.g., dog, or unrelated prime, e.g., moon). Specifi-cally, context effects (faster latencies for targets primed by arelated word, compared with an unrelated word) are stronger for
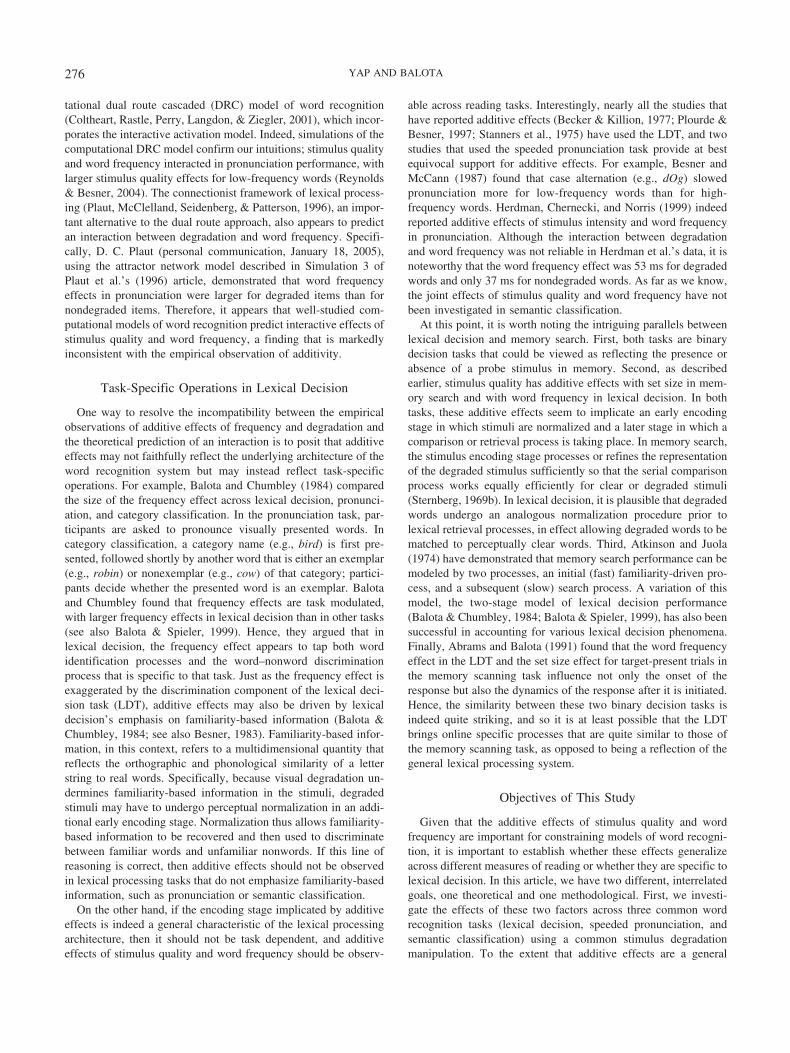
degraded words, compared with intact words, as well as for low-frequency words, compared with high-frequency words (seeBorowsky & Besner, 1993; Neely, 1991, for a review). If one usesadditive-factors logic, this implies that semantic priming has ef-fects on both encoding (hence the interaction with stimulus qual-ity) and retrieval processes (hence the interaction with word fre-quency; see Figure 2; see Borowsky & Besner, 1993).
Effects of Stimulus Quality and Word Frequency:Additive or Interactive?
Although the model depicted in Figure 2 is plausible, there is apuzzling disjunction between the foregoing findings and currentcomputational models of visual word recognition. Empirically,additive effects of stimulus quality and word frequency are gen-erally obtained in lexical decision, a pattern that is consistent withmultistage models of word recognition (Borowsky & Besner,1993; Forster, 1976; Paap, Newsome, McDonald, & Schvaneveldt,1982). However, activation-class models, in which different vari-ables influence a common word detector, are more difficult toreconcile with additivity. Specifically, activation-class word rec-ognition models (Morton, 1969), which assume that stimulus qual-ity and word frequency jointly modulate the activation level of thesame word representations, predict interactive effects of the twofactors. The most straightforward prediction for such models isthat one should observe larger stimulus quality effects for wordrepresentations with higher activation thresholds or resting activa-tion levels (i.e., low-frequency words). Therefore, additivity seemsprima facie incompatible with influential computationalactivation-class models such as the interactive activation model(McClelland & Rumelhart, 1981) and, by extension, the compu-
Figure 1. Processing stages in memory search. Reprinted from “The Discovery of Processing Stages: Exten-sions of Donders’ Method,” by S. Sternberg, 1969, Acta Psychologica, 30, p. 294. Copyright 1969 byNorth-Holland Publishing. Reproduced with permission from Elsevier.
Figure 2. Stimulus quality, word frequency, and context effects in atwo-stage model of word recognition.
275RT DISTRIBUTIONS IN VISUAL WORD RECOGNITION
tational dual route cascaded (DRC) model of word recognition(Coltheart, Rastle, Perry, Langdon, & Ziegler, 2001), which incor-porates the interactive activation model. Indeed, simulations of thecomputational DRC model confirm our intuitions; stimulus qualityand word frequency interacted in pronunciation performance, withlarger stimulus quality effects for low-frequency words (Reynolds& Besner, 2004). The connectionist framework of lexical process-ing (Plaut, McClelland, Seidenberg, & Patterson, 1996), an impor-tant alternative to the dual route approach, also appears to predictan interaction between degradation and word frequency. Specifi-cally, D. C. Plaut (personal communication, January 18, 2005),using the attractor network model described in Simulation 3 ofPlaut et al.’s (1996) article, demonstrated that word frequencyeffects in pronunciation were larger for degraded items than fornondegraded items. Therefore, it appears that well-studied com-putational models of word recognition predict interactive effects ofstimulus quality and word frequency, a finding that is markedlyinconsistent with the empirical observation of additivity.
Task-Specific Operations in Lexical Decision
One way to resolve the incompatibility between the empiricalobservations of additive effects of frequency and degradation andthe theoretical prediction of an interaction is to posit that additiveeffects may not faithfully reflect the underlying architecture of theword recognition system but may instead reflect task-specificoperations. For example, Balota and Chumbley (1984) comparedthe size of the frequency effect across lexical decision, pronunci-ation, and category classification. In the pronunciation task, par-ticipants are asked to pronounce visually presented words. Incategory classification, a category name (e.g., bird) is first pre-sented, followed shortly by another word that is either an exemplar(e.g., robin) or nonexemplar (e.g., cow) of that category; partici-pants decide whether the presented word is an exemplar. Balotaand Chumbley found that frequency effects are task modulated,with larger frequency effects in lexical decision than in other tasks(see also Balota & Spieler, 1999). Hence, they argued that inlexical decision, the frequency effect appears to tap both wordidentification processes and the word–nonword discriminationprocess that is specific to that task. Just as the frequency effect isexaggerated by the discrimination component of the lexical deci-sion task (LDT), additive effects may also be driven by lexicaldecision’s emphasis on familiarity-based information (Balota &Chumbley, 1984; see also Besner, 1983). Familiarity-based infor-mation, in this context, refers to a multidimensional quantity thatreflects the orthographic and phonological similarity of a letterstring to real words. Specifically, because visual degradation un-dermines familiarity-based information in the stimuli, degradedstimuli may have to undergo perceptual normalization in an addi-tional early encoding stage. Normalization thus allows familiarity-based information to be recovered and then used to discriminatebetween familiar words and unfamiliar nonwords. If this line ofreasoning is correct, then additive effects should not be observedin lexical processing tasks that do not emphasize familiarity-basedinformation, such as pronunciation or semantic classification.
On the other hand, if the encoding stage implicated by additiveeffects is indeed a general characteristic of the lexical processingarchitecture, then it should not be task dependent, and additiveeffects of stimulus quality and word frequency should be observ-
able across reading tasks. Interestingly, nearly all the studies thathave reported additive effects (Becker & Killion, 1977; Plourde &Besner, 1997; Stanners et al., 1975) have used the LDT, and twostudies that used the speeded pronunciation task provide at bestequivocal support for additive effects. For example, Besner andMcCann (1987) found that case alternation (e.g., dOg) slowedpronunciation more for low-frequency words than for high-frequency words. Herdman, Chernecki, and Norris (1999) indeedreported additive effects of stimulus intensity and word frequencyin pronunciation. Although the interaction between degradationand word frequency was not reliable in Herdman et al.’s data, it isnoteworthy that the word frequency effect was 53 ms for degradedwords and only 37 ms for nondegraded words. As far as we know,the joint effects of stimulus quality and word frequency have notbeen investigated in semantic classification.
At this point, it is worth noting the intriguing parallels betweenlexical decision and memory search. First, both tasks are binarydecision tasks that could be viewed as reflecting the presence orabsence of a probe stimulus in memory. Second, as describedearlier, stimulus quality has additive effects with set size in mem-ory search and with word frequency in lexical decision. In bothtasks, these additive effects seem to implicate an early encodingstage in which stimuli are normalized and a later stage in which acomparison or retrieval process is taking place. In memory search,the stimulus encoding stage processes or refines the representationof the degraded stimulus sufficiently so that the serial comparisonprocess works equally efficiently for clear or degraded stimuli(Sternberg, 1969b). In lexical decision, it is plausible that degradedwords undergo an analogous normalization procedure prior tolexical retrieval processes, in effect allowing degraded words to bematched to perceptually clear words. Third, Atkinson and Juola(1974) have demonstrated that memory search performance can bemodeled by two processes, an initial (fast) familiarity-driven pro-cess, and a subsequent (slow) search process. A variation of thismodel, the two-stage model of lexical decision performance(Balota & Chumbley, 1984; Balota & Spieler, 1999), has also beensuccessful in accounting for various lexical decision phenomena.Finally, Abrams and Balota (1991) found that the word frequencyeffect in the LDT and the set size effect for target-present trials inthe memory scanning task influence not only the onset of theresponse but also the dynamics of the response after it is initiated.Hence, the similarity between these two binary decision tasks isindeed quite striking, and so it is at least possible that the LDTbrings online specific processes that are quite similar to those ofthe memory scanning task, as opposed to being a reflection of thegeneral lexical processing system.
Objectives of This Study
Given that the additive effects of stimulus quality and wordfrequency are important for constraining models of word recogni-tion, it is important to establish whether these effects generalizeacross different measures of reading or whether they are specific tolexical decision. In this article, we have two different, interrelatedgoals, one theoretical and one methodological. First, we investi-gate the effects of these two factors across three common wordrecognition tasks (lexical decision, speeded pronunciation, andsemantic classification) using a common stimulus degradationmanipulation. To the extent that additive effects are a general
276 YAP AND BALOTA

lexical phenomenon, additivity should be observed across thetasks.
Second, the data are analyzed both at the level of mean RTs andat the level of distributional characteristics. There is an increasingconsensus in the literature that analyzing mean RTs alone can beinadequate and in some cases actually misleading (Andrews &Heathcote, 2001; Balota & Spieler, 1999; Heathcote, Popiel, &Mewhort, 1991; Plourde & Besner, 1997; Yap, Balota, Cortese, &Watson, 2006), because such an analysis does not consider theshape of the RT distribution. In their seminal article, Heathcote etal. (1991) investigated Stroop color-naming performance usingboth traditional mean and ex-Gaussian analyses. Ex-Gaussiananalyses characterize an RT distribution by assuming an explicitfunction for the shape of the distribution. A convolution of thenormal (Gaussian) and exponential distributions, the ex-Gaussianfunction contains three parameters: �, the mean of the normaldistribution; �2, the variance of the normal distribution; and �, areflection of the mean and standard deviation of the exponentialdistribution. Not only does the ex-Gaussian function provide goodfits to empirical RT distributions (Luce, 1986), but also the alge-braic sum of � and � is also approximately equal to the mean of theoverall distribution (� and � are exactly equal to the mean in thetheoretical ex-Gaussian model). This allows differences in meansto be partitioned into a component that is associated with distri-butional shifting (�) and a component that is associated withdistributional skewing (�; see Table 1 for an example).
Examining mean RTs, Heathcote et al. (1991) observed nodifference between the congruent (RED displayed in red) andbaseline (XXX displayed in red) conditions. Although this mightsuggest that congruency has no effect on color naming, the ex-Gaussian analyses revealed that naming RTs in the congruentcondition were facilitated (faster than baseline) in � but inhibited(slower than baseline) in �. In this case, congruency shifted the RTdistribution leftwards while increasing its skew. These counter-vailing effects cancelled each other out, spuriously producing nulleffects in means (see Spieler, Balota, & Faust, 1996, for a repli-cation of this pattern). In the analyses described in this article,more of the information available in an RT distribution is ex-ploited, allowing us to ascertain how a variable modulates theshape, rather than just the mean, of a distribution. In particular,distributional analyses are carried out with ex-Gaussian fitting anda convergent nonparametric technique called vincentizing (de-
scribed in the Results section of Experiment 1). As in the case ofthe Stroop facilitation effect, it is possible that the theoreticallyimportant additive effects of word frequency and degradationobtained in means may actually reflect a different pattern once oneexamines the underlying RT distributions.
Experiment 1
In Experiment 1, we manipulated stimulus quality and wordfrequency in lexical decision and used distributional analyses tobetter understand how these two factors influence the underlyingRT distributions. On the basis of the literature, we expectedadditive effects in mean RTs, but we were less certain whethersimilar patterns of additivity would be present in ex-Gaussianparameters (�, �, and �) and higher order distributional character-istics, such as the second (variance) and third (skewness) mo-ments. The latter point is particularly important when one is usingadditive-factors logic to make inferences about serially organized,independent stages. As noted, Sternberg (1969b) has pointed outthat additivity in means merely supports the existence of succes-sive functional stages. To more rigorously test whether the stagesare stochastically independent, additivity must also be demon-strated for the distribution’s second and third moments (Andrews& Heathcote, 2001). Interestingly, Plourde and Besner (1997) havein fact manipulated stimulus quality and word frequency in theLDT and also examined the distributional characteristics with anex-Gaussian analysis. These researchers found evidence of addi-tive effects of these two factors both in means and in the � and �parameters. They argued that this provides additional evidence foran early and independent normalization stage.
Plourde and Besner’s (1997) study is theoretically informativewith respect to models of lexical decision performance as well asmore general models of word recognition; however, a few issuesremain unresolved. First, although additive effects of stimulusquality and word frequency are typically observed in lexical de-cision, some researchers (e.g., Norris, 1984; Wilding, 1988) haveobtained interactions, with stronger stimulus quality effects forlow-frequency words. This empirical inconsistency, coupled withthe fact that Plourde and Besner’s (1997) study is the only pub-lished report exploring these effects with distributional analyses,makes it important to generalize their findings with a different setof stimuli and a different degradation manipulation. Establishing
Table 1Means of Participants’ Lexical Decision Response Time Means, Accuracy, and Ex-GaussianParameter Estimates as a Function of Stimulus Quality and Word Frequency (Experiment 1)
Stimulus quality/word frequency M % of errors � � �
Clear wordsHigh-frequency words 570 2.4 (2.1) 456 37 114Low-frequency words 620 8.0 (6.1) 493 47 127Frequency effect 50 5.6 (4.0) 37 10 13
Mask-degraded wordsHigh-frequency words 709 7.5 (3.7) 527 40 182Low-frequency words 765 12.2 (6.6) 561 55 203Frequency effect 56 4.7 (2.9) 34 15 21
Difference of difference (interaction) 6 �0.9 (�1.1) �3 5 8
Note. Means are given in milliseconds. Standard deviations are in parentheses.
277RT DISTRIBUTIONS IN VISUAL WORD RECOGNITION
clear additive effects in Experiment 1 also provides confidencethat the degradation manipulation used is not methodologicallydissimilar to the manipulations adopted in the other reportedstudies. Second, in Plourde and Besner’s study, stimulus qualitywas manipulated within participants, which may have encourageda normalization procedure. Specifically, the random intermixing ofclear and degraded stimuli should make stimulus quality acrosstrials unpredictable, and this might engage a strategy in whichdegraded stimuli were normalized to match perceptually clearstimuli. It is unclear whether this effect generalizes to a between-participants design. In this case, the normalization process maybecome optional, because degraded and clear stimuli are no longerpresented within the same context; that is, participants in thedegraded condition are not receiving clear words to which tonormalize. (We included both a between-participants, Experiment1, and a within-participants, Experiment 3, manipulation in thepresent study.) Finally, as pointed out earlier, we can garnerstronger evidence for independent stages if additivity can be dem-onstrated in the higher moments1 (i.e., variance and skewness);these analyses are also reported in the present experiment.
Method
Participants
A total of 79 young adults (mean age � 19.1 years, SD � 1.09)participated in this study for course credit. All participants hadnormal or corrected-to-normal vision and were recruited from theundergraduate student population of Washington University in St.Louis. The participants had an average of 13.1 years of education(SD � 0.91) and a mean vocabulary age of 18.4 (SD � 0.85) onthe Shipley (1940) vocabulary subtest. Using the following pro-cedure, we discarded data from 7 of the 79 participants because ofexcessively high error rates and/or slow latencies: Each partici-pant’s response latencies and error rates were quantified as avector of four scores (mean RTs for high- and low-frequencywords; error rates for high- and low-frequency words), and theMahalanobis D2 (Lattin, Carroll, & Green, 2003) was then com-puted for each participant’s vector. The Mahalanobis D2 reflects amultivariate Z score and indicates how discrepant a vector is fromthe centroid (multidimensional equivalent of the mean). Partici-pants who had D2 scores with unusually low probability values(i.e., p � .05) were discarded. This approach is advantageous inthat it identifies multivariate outliers and does not rely on arbitrarycriteria defined with respect to a single variable.2 In total, therewere 37 participants in the clear condition and 35 participants inthe degraded condition.
Apparatus
We used an IBM-compatible computer running E-prime soft-ware (Schneider, Eschman, & Zuccolotto, 2001) to control stim-ulus presentation and to collect data. The stimuli were displayed ona 17-in. Super VGA monitor, and participants’ responses weremade on a computer keyboard.
Stimuli
The stimuli for the LDT consisted of 200 words and 200length-matched pronounceable nonwords. Using the Lund and
Burgess (1996) frequency norms, we designated 100 words as highfrequency (mean counts per million � 1,227) and 100 words aslow frequency (mean counts per million � 44). We constructednonwords by changing one to three letters from each of the words.For high-frequency words, the mean length was 4.73 letters (SD �0.96), and on the basis of the values available from the EnglishLexicon Project (http://elexicon.wustl.edu; see Balota et al., inpress), the mean orthographic neighborhood size (Coltheart, Dav-elaar, Jonasson, & Besner, 1977) was 4.77, and the mean summedbigram frequency was 6,369.86. For low-frequency words, themean length was 4.78 letters (SD � 0.85), the mean orthographicneighborhood size was 4.82, and the mean summed bigram fre-quency was 6,149.13. Orthographic neighborhood size refers tothe number of words that can be obtained by changing one letterwhile preserving the identity and positions of the other letters (e.g.,neighbors of CAT include MAT, COT, and CAN). Summed bigramfrequency refers to the sum of frequencies for the successivebigrams in a word, where a bigram is defined as a sequence of twoletters (e.g., DO and OG for DOG). There was no significantdifference between high- and low-frequency words with respect tolength, t(198) � 0.39, p � .70; orthographic neighborhood size,t(198) � �0.08, p � .94; and summed bigram frequency, t(198) �0.42, p � .67. For the nonwords, the mean orthographic neigh-borhood size was 3.38, and the mean summed bigram frequencywas 5,984.70.
Procedure
Before the experimental trials began, participants completed acomputer-administered Shipley vocabulary subtest. Participantswere tested individually in sound-attenuated cubicles. They wereseated about 60 cm from the computer screen. Participants weretold that letter strings would be presented at the center of thescreen and that their task was to indicate as quickly and asaccurately as possible via a button press on the keyboard whetherthe letter string was a word or nonword. Participants were pre-sented with 20 practice trials, followed by five experimental blocksof 80 trials, with mandatory breaks occurring between blocks. Theorder in which stimuli were presented was randomized anew foreach participant. The presentation sequence was similar for bothclear and visually degraded stimuli. For both conditions, stimuliwere presented in 14-point Courier font. For the masked degrada-tion condition, letter strings were rapidly alternated with a ran-domly generated mask of the same length. For example, the mask&?# was presented for 10 ms, followed by DOG for 25 ms, and thetwo repeatedly alternated until the participant responded. Themask was generated from random permutations of the symbols@#$%&?*, with the proviso that the mask be the same length asthe string and that symbols not be repeated within a mask. Eachtrial consisted of the following order of events: (a) a fixation point(�) at the center of the monitor for 400 ms, (b) a blank screen for
1 Plourde and Besner (1997) examined additivity in variance but not inskewness.
2 To determine whether participant and RT screening procedures wereinfluencing the results, we reanalyzed the data from the four experiments,using all participants and less conservative screening criteria (i.e., remov-ing only latencies faster than 200 ms and slower than 3,000 ms). Thepattern of results did not change across the four experiments.
278 YAP AND BALOTA
200 ms, and (c) a stimulus centered at the fixation point’s location.The stimulus remained on the screen until a keyboard responsewas made. Participants pressed the apostrophe key for words andthe A key for nonwords. Correct responses were followed by a1,600-ms delay. If a response was incorrect, a 170-ms tone waspresented simultaneously with the onset of a 450-ms presentationof the word Incorrect (displayed slightly below the fixation point).In order to keep the response to stimulus interval constant acrosscorrect and incorrect trials, the incorrect responses were followedby a 1,150-ms delay.
Design
A 2 � 2 factorial design was used, with stimulus quality (clearvs. mask degradation) manipulated between participants and wordfrequency (high vs. low) manipulated within participants.
Results
Errors (7.2% across both the degraded and clear conditions) andresponse latencies faster than 200 ms or slower than 3,000 ms werefirst excluded, and the overall mean and standard deviation of eachparticipant’s word and nonword latencies were then computed onthe remaining latencies. Of the remaining latencies, any latencies2.5 standard deviations above or below each participant’s respec-tive mean (across all conditions) were removed. These criteriaeliminated a further 2.2% of the lexical decision responses. Anal-yses of variance (ANOVAs) were then carried out on the mean,accuracy, and ex-Gaussian parameters of the RT data. These dataare displayed in Table 1. For means and accuracy, ANOVAs byparticipants and items were conducted.
Stimulus Quality and Word Frequency
Mean response latencies and accuracy. The ANOVA on meanresponse latencies yielded significant main effects of stimulusquality, Fp(1, 70) � 30.65, p � .001, MSE � 23,693.58, 2 � .31;Fi(1, 198) � 1,266.26, p � .001, MSE � 1,721.56, 2 � .87, andword frequency, Fp(1, 70) � 201.77, p � .001, MSE � 493.94,2 � .74; Fi(1, 198) � 63.81, p � .001, MSE � 5,339.21, 2 �.24. The Stimulus Quality � Word Frequency interaction did notapproach significance (Fp and Fi � 1). Turning to accuracy, themain effects of stimulus quality, Fp(1, 70) � 22.96, p � .001,MSE � 0.0034, 2 � .25; Fi(1, 198) � 44.75, p � .001, MSE �0.0033, 2 � .18, and word frequency, Fp(1, 70) � 61.92, p �.001, MSE � 0.0015, 2 � .47; Fi(1, 198) � 26.35, p � .001,MSE � 0.013, 2 � .12, were again significant. The interactionbetween stimulus quality and word frequency was not significantby participants ( p � .46) but did reach significance by items, Fi(1,198) � 4.98, p � .027, MSE � 0.0033, 2 � .03. The simple maineffect of frequency (high-frequency words more accurate thanlow-frequency words) was slightly larger in the clear condition(d � .94) than in the degraded condition (d � .46). Hence, ifanything, this pattern runs counter to the expected greater wordfrequency effect in the degraded compared with the clear condi-tion. More crucially, the multiple potential sources of lexicaldecision error (see Balota & Spieler, 1999), and the fact that theinteraction was not reliable by participants, makes it difficult tointerpret this interaction in a principled manner.
Ex-Gaussian analyses. Ex-Gaussian parameters (�, �, �) wereobtained for each participant by use of continuous maximum-likelihood estimation in the R statistics software (R DevelopmentCore Team, 2004). Continuous maximum-likelihood estimationprovides efficient and unbiased parameter estimates (Van Zandt,2000) using all the available raw data (see Heathcote, Brown, &Mewhort, 2002, for an alternative approach). Through use ofNelder and Mead’s (1965) simplex algorithm, negative log-likelihood functions were minimized in the R statistics package(cf., Speckman & Rouder, 2004), with all fits successfully con-verging within 500 iterations.
Turning to the ex-Gaussian parameters, for �, the main effectsof stimulus quality, F(1, 70) � 31.79, p � .001, MSE � 5,576.03,2 � .31, and word frequency, F(1, 70) � 144.82, p � .001,MSE � 313.53, 2 � .67, were significant. The Stimulus Qual-ity � Word Frequency interaction was not reliable (F � 1).Turning to �, the main effects of stimulus quality, F(1, 70) � 4.24,p � .043, MSE � 330.50, 2 � .057, and word frequency, F(1,70) � 34.32, p � .001, MSE � 165.43, 2 � .33, were significant.The Stimulus Quality � Word Frequency interaction was notreliable ( p � .27). Turning to �, the main effects of stimulusquality, F(1, 70) � 17.36, p � .001, MSE � 10,623.69, 2 � .20,and word frequency, F(1, 70) � 16.26, p � .001, MSE � 625.02,2 � .19, were significant. The Stimulus Quality � Word Fre-quency interaction was not reliable (F � 1). Hence, the ex-Gaussian analysis is very clear; all parameters produced maineffects, but none of the parameters produced interactions.
Vincentile analyses. A converging procedure for investigatingthe effects of variables on response latencies is to plot the meanvincentiles for the data. Vincentizing is used to average RT dis-tributions across a number of participants (Andrews & Heathcote,2001; Rouder & Speckman, 2004; Vincent, 1912) to produce theRT distribution for a typical participant. This approach does notdepend on prior distributional assumptions and examines the rawdata directly. To carry out vincentizing, one first computes apredefined number of vincentiles for each participant, where avincentile is defined as the mean of observations between neigh-boring percentiles. For example, to obtain 10 vincentiles, the RTdata for a participant are first sorted (from fastest to slowestresponses), and the first 10% of the data is then averaged, followedby the second 10%, and so on. Individual vincentiles are thenaveraged across participants. Plots of mean vincentiles are usefulfor investigating how different variables influence different re-gions of the RT distribution and provide a complementary per-spective to ex-Gaussian analysis. For example, � effects are re-flected in additive changes in the vincentiles along the y-axis, and� effects are reflected in the slowest (rightmost) vincentiles.
The mean vincentiles for the raw data are plotted in the top twothirds of Figure 3, and in the bottom third, one can see more clearlythe word frequency effect for the clear and degraded conditionsacross the vincentiles. As shown in the bottom third of the figure,the frequency effect increases across vincentiles for both clear anddegraded conditions, with only a slight increase in the degradedcondition, which ultimately decreases at the last vincentile. Asdescribed below, this slight nonsignificant increase in the fre-quency effect for the degraded condition is dramatically differentfrom conditions in which there is clear evidence of interactiveeffects.
279RT DISTRIBUTIONS IN VISUAL WORD RECOGNITION

Higher moments (variance and skewness). As advocated byRoberts and Sternberg (1993), we also computed estimates ofvariance and skewness3 for each condition (see Table 2) as a morerigorous test of evidence for stochastically independent stages. Theresults from the ANOVA on the variance estimate indicated thatthere was a main effect of stimulus quality, F(1, 70) � 11.60, p �.001, MSE � 2,296,966,670, 2 � .14, and the main effect of word
frequency approached conventional levels of significance, F(1,70) � 3.01, p � .087, MSE � 90,030,849, 2 � .041. TheStimulus Quality � Word Frequency interaction again did notapproach significance (F � 1). Turning to skewness, the maineffect of stimulus quality was significant, F(1, 70) � 8.50, p �.005, MSE � 1.44 � 1015, 2 � .11, and the main effect of wordfrequency approached significance, F(1, 70) � 3.90, p � .052,MSE � 1.09 � 1014, 2 � .053. The interaction was not signifi-cant (F � 1). Hence, the higher moments analysis (see Table 2)converged with the earlier results, suggesting that stimulus qualityand word frequency are indeed additive across means, ex-Gaussianparameters, and the higher order moments. In addition to the aboveanalyses, we also investigated the Stimulus Quality � Lexicalityinteraction (see mean response latencies in Table 3).
Stimulus Quality and Lexicality
Mean response latencies and accuracy. For mean responselatencies, the main effects of stimulus quality, Fp(1, 70) � 36.80,p � .001, MSE � 33,820.29, 2 � .35; Fi(1, 398) � 3,218.05, p �.001, MSE � 2,224.54, 2 � .89, and lexicality, Fp(1, 70) �182.53, p � .001, MSE � 2,262.53, 2 � .72; Fi(1, 398) � 326.95,p � .001, MSE � 6,807.93, 2 � .45, were significant. In contrastto the additive effects of frequency and degradation, the StimulusQuality � Lexicality interaction was highly reliable, Fp(1, 70) �29.93, p � .001, MSE � 2,262.53, 2 � .30; Fi(1, 398) � 155.18,p � .001, MSE � 2,224.54, 2 � .28; the lexicality effect (wordRT � nonword RT) was larger when stimulus quality was de-graded. Turning to accuracy, the main effect of stimulus qualitywas significant, Fp(1, 70) � 28.15, p � .001, MSE � 0.0027, 2 �.29; Fi(1, 398) � 128.05, p � .001, MSE � 0.0035, 2 � .24. Themain effect of lexicality was not significant by participants ( p �.30) or by items (Fi � 1). The Stimulus Quality � Lexicalityinteraction was not significant by participants (Fp � 1) but wassignificant by items, Fi(1, 398) � 4.25, p � .040, MSE � 0.0035,2 � .011.
Ex-Gaussian analyses. Turning to the ex-Gaussian parame-ters, for �, the main effects of stimulus quality, F(1, 70) � 49.20,p � .001, MSE � 6,900.51, 2 � .41, and lexicality, F(1, 70) �273.72, p � .001, MSE � 930.08, 2 � .80, were significant. The
3 The third cumulant was estimated by 2�3 (Andrews & Heathcote,2001).
Figure 3. Experiment 1 vincentile means of participants’ lexical decisionresponse times as a function of stimulus quality and word frequency. RT �response time; HF � high frequency; LF � low frequency.
Table 2Means of Participants’ Lexical Decision Response TimeVariance and Skewness as a Function of Stimulus Quality andWord Frequency (Experiment 1)
Word frequency/stimulus quality Variance Skewness
Clear wordsHigh-frequency words 18,395 5.46E�06Low-frequency words 20,870 7.11E�06Frequency effect 2,475 1.65E�06
Mask-degraded wordsHigh-frequency words 45,335 2.21E�07Low-frequency words 48,351 2.73E�07Frequency effect 3,016 5.23E�06
280 YAP AND BALOTA

Stimulus Quality � Lexicality interaction was also significant,F(1, 70) � 27.29, p � .001, MSE � 930.08, 2 � .28; thelexicality effect was larger when stimulus quality was degraded.Turning to �, the main effects of stimulus quality, F(1, 70) �16.23, p � .001, MSE � 403.23, 2 � .19, and lexicality, F(1,74) � 49.53, p � .001, MSE � 170.80, 2 � .41, were significant.The Stimulus Quality � Lexicality interaction was again signifi-cant, F(1, 70) � 13.84, p � .001, MSE � 170.80, 2 � .17; thelexicality effect was larger when stimulus quality was degraded.Turning to �, the main effects of stimulus quality, F(1, 70) �17.23, p � .001, MSE � 16,482.71, 2 � .20, and lexicality,F(1,70) � 12.41, p � .001, MSE � 1,537.27, 2 � .15, weresignificant. The Stimulus Quality � Lexicality interaction was alsosignificant, F(1, 70) � 6.63, p � .012, MSE � 1,537.27, 2 �.087; the lexicality effect was significant only in the degradedcondition.
Vincentile analyses. The mean vincentiles for these data areplotted in the top two thirds of Figure 4, and the mean lexicalityeffects for the clear and degraded conditions as a function ofvincentile are displayed in the bottom third. As clearly shown inthe bottom third, the lexicality effect is substantially larger for thedegraded condition compared with the clear condition, and thiseffect increases quite dramatically across vincentiles. Comparingthe bottom thirds of Figures 3 and 4 clearly shows the differencebetween additive and interactive effects of variables.
It should also be noted here that because there is alreadyevidence from the analyses of the means of an interaction betweenstimulus quality and lexicality, there is no need to report theanalyses of the higher order moments.
Summary
Stimulus quality and lexicality showed clear interactive effectsin means and ex-Gaussian parameters, with larger lexicality effectsin the degraded condition across all the parameters (see Table 3).This result is consistent with the literature (see Borowsky &Besner, 1993; Stanners et al., 1975) and furthermore reveals thatthe lexicality effect in the clear condition was mediated primarilyby �, whereas in the degraded condition, it was mediated by amixture of � and �. “Nonword” lexical decision RTs were shiftedand skewed when visually degraded. The vincentile plot alsoconfirms that the lexicality effect for degraded items is larger than
for the clear items, and this trend increases across the entire RTdistribution.
Discussion
Experiment 1 replicates and extends Plourde and Besner’s(1997) results, demonstrating that the additive effects of stimulusquality and word frequency are robust, even when stimulus qualityis manipulated between participants. The general pattern of addi-tivity across means, ex-Gaussian parameters, and the higher ordermoments suggests that when words are processed in lexical deci-sion, stimulus quality and word frequency are indeed influencingseparate and independent stages. In particular, the pattern of ad-ditivity in the higher order moments is more consistent with a stagemodel than a cascade model (see Roberts & Sternberg, 1993). Themost straightforward interpretation of these results is that duringlexical decision, each degraded word undergoes a normalizationprocess before engaging the processes tied to the decision processin this task. This of course is quite similar to the account of theadditive effects of degradation and set size in memory scanning.Although the data do not directly address what happens duringnormalization, they suggest that models of lexical decision perfor-mance (e.g., Balota & Spieler, 1999; Coltheart et al., 2001;Grainger & Jacobs, 1996; Plaut, 1997; Ratcliff, Gomez, & Mc-Koon, 2004; Seidenberg & McClelland, 1989) may need to incor-porate a perceptual normalization procedure under degraded con-ditions that precedes the normal lexical decision process.
Interestingly, although such a normalization process might alsosuggest equivalent effects of degradation for words and nonwords,this does not appear to be the case since there is a reliablesignificant Stimulus Quality � Lexicality interaction (replicated inBorowsky & Besner, 1993, and Stanners et al., 1975). Becausewords and nonwords undergo a common normalization stage priorto lexical decision, it is unclear why the stimulus quality effectshould be larger for nonwords (see Table 3). One possible accountof this pattern is that participants are simply more conservativewhen they have to reject a degraded letter string as a nonword.Such a conservative nonword response bias may reflect a relativelylate decision-level influence. In particular, because all degradedletter strings, whether words or nonwords, initially look unfamil-iar, participants may become particularly cautious before making anonword response. Because half of these degraded letter strings
Table 3Means of Participants’ Lexical Decision Response Time Means, Accuracy, and Ex-GaussianParameter Estimates as a Function of Stimulus Quality and Lexicality (Experiment 1)
Stimulus quality/lexicality M % of errors � � �
ClearWords 594 5.2 (3.7) 468 42 126Nonwords 657 4.7 (3.7) 526 49 132Lexicality effect 63 �0.5 (0.0) 58 7 6
Mask degradedWords 736 9.9 (4.5) 539 47 198Nonwords 887 9.2 (5.3) 649 71 237Lexicality effect 151 �0.7 (0.8) 110 24 39
Difference of difference (interaction) 88 �0.2 (0.8) 52 17 33
Note. Means are given in milliseconds. Standard deviations are in parentheses.
281RT DISTRIBUTIONS IN VISUAL WORD RECOGNITION

form words and are eventually resolved because of the normaliza-tion process, participants may allocate more time for processingthe strange-looking letter strings to ensure that they are not actu-ally words—that is, that they are indeed nonwords.
Mechanistically, it is relatively straightforward to incorporatethis conservative bias within both the activation and search met-aphors of lexical access. For example, in activation-class models,
“nonword” responses are produced when lexical activity does notreach threshold after some temporal deadline (Coltheart et al.,2001). Degraded items might lengthen this nonword deadline,which will of course exaggerate lexicality effects for degradeditems. Alternatively, in search models of lexical access (e.g.,Murray & Forster, 2004), orthographic bins are searched exhaus-tively, with “word” responses produced when the target word islocated, and “nonword” responses produced when the search isunsuccessful. Presenting degraded nonwords may lead to multiple,perseverative searches of the bin before a search is terminated,leading to larger lexicality effects in the degraded condition (K. I.Forster, personal communication, January 12, 2004). In eithercase, this perspective suggests that participants become more con-servative about responding “nonword” when degraded letterstrings are presented. Of course, these accounts still demand em-pirical validation. However, the robust Stimulus Quality � Lexi-cality interaction, coupled with the robust additive effects of stim-ulus quality and word frequency in lexical decision performance,appear problematic for a simple model that attributes the effects ofword frequency and lexicality to a common mechanism in thistask.
Experiment 2
On the basis of the additive effects from Experiment 1 andPlourde and Besner’s (1997) study, there does seem to be com-pelling evidence for an early normalization stage that is insensitiveto word frequency. However, as argued in the introduction, it isunclear whether this normalization stage reflects the cognitivearchitecture of the word recognition system or is specific to thetask requirements of lexical decision. Again, because of the sim-ilarity with the additive effects observed in memory scanning (anonlexical task), one might be concerned that task-specific oper-ations are producing these effects. If normalization is a generalproperty of lexical processing, additive effects of stimulus qualityand word frequency should be observable in other word recogni-tion tasks. Hence, the goal of Experiment 2 was to essentiallyreplicate the design of Experiment 1 with the dependent measurebeing speeded pronunciation performance.
Method
Participants
A total of 88 young adults (mean age � 19.8 years, SD � 1.31)participated in this study for course credit. All participants hadnormal or corrected-to-normal vision and were recruited from theundergraduate student population of Washington University in St.Louis. The participants had an average of 13.3 years of education(SD � 1.14) and a mean vocabulary age of 18.6 (SD � 0.88) onthe Shipley vocabulary subtest. Data from 10 of the 88 participantswere discarded because of excessively high error rates or slowlatencies, using the same multivariate outlier procedure describedin Experiment 1. This left 39 participants in each of the twoconditions.
Apparatus and Stimuli
An IBM-compatible computer was used to control stimuluspresentation and to collect responses. The stimuli were displayed
Figure 4. Experiment 1 vincentile means of participants’ lexical decisionresponse times as a function of stimulus quality and lexicality. RT �response time; NWs � nonwords.
282 YAP AND BALOTA
on a 17-in. Super VGA monitor, and participants’ pronunciationresponses were detected by an Audio-Technica microphone(Audio-Technica, Stow, OH) connected to a PST serial responsebox (Psychology Software Tools, Inc., Pittsburgh, PA) with anintegrated voice key. The stimuli for the pronunciation task con-sisted of the 200 words used in Experiment 1.
Procedure
Participants were told that words would be presented in thecenter of the screen, and their task was to read aloud each word asquickly and as accurately as possible. This was followed by 20practice trials and four experimental blocks of 50 trials, withmandatory breaks occurring between blocks. The order in whichstimuli were presented was randomized anew for each participant.The presentation sequence was similar for both clear and visuallydegraded stimuli. Each trial consisted of the following order ofevents: (a) a fixation point (�) at the center of the monitor for 500ms, (b) a blank screen for 750 ms, and (c) the stimulus at thefixation point’s location. The stimulus word remained on thescreen until a pronunciation response was detected. Participantsthen coded their responses by pressing the left mouse button for acorrect response and the right mouse button for an incorrectresponse. Responses were followed by a 2,000-ms delay.
Design
A 2 � 2 factorial design was used: Stimulus quality wasmanipulated between participants, and word frequency was ma-nipulated within participants. The presentation format for themask-degradation condition was identical to the manipulation usedfor Experiment 1.
Results
Errors (1.6% across the two stimulus quality conditions) andextreme response latencies (faster than 200 ms or slower than3,000 ms) were first excluded from the analyses, and the overallmean and standard deviation of each participant’s word latencieswere computed on the remaining latencies. Response latencies 2.5standard deviations above or below each participant’s respectivemean latency were removed. These criteria eliminated a further2.4% of the pronunciation responses. ANOVAs were then carriedout on the mean, accuracy, and ex-Gaussian parameters of the RTdata (see Table 4).
Mean response latencies and accuracy. For means, the maineffects of stimulus quality, Fp(1, 76) � 13.91, p � .001, MSE �23,622.18, 2 � .16; Fi(1, 198) � 908.01, p � .001, MSE �943.79, 2 � .82, and word frequency, Fp(1, 76) � 68.53, p �.001, MSE � 440.37, 2 � .47; Fi(1, 198) � 23.10, p � .001,MSE � 3,589.42, 2 � .10, were significant. More important, theStimulus Quality � Word Frequency interaction was significant,4
Fp(1, 76) � 9.19, p � .003, MSE � 440.37, 2 � .11; Fi(1, 198) �11.40, p � .001, MSE � 943.79, 2 � .054, with a larger stimulusquality effect for low-frequency words than for high-frequencywords. Turning to accuracy, the main effects of stimulus quality,Fp(1, 76) � 3.43, p � .07, MSE � 0.00063, 2 � .043; Fi(1,198) � 10.42, p � .001, MSE � 0.0013, 2 � .050, and wordfrequency, Fp(1, 76) � 7.63, p � .007, MSE � 0.00018, 2 �
.091; Fi(1, 198) � 10.18, p � .002, MSE � 0.0028, 2 � .049,were significant. The interaction between stimulus quality andword frequency was not reliable by participants or items (Fs � 1).
Ex-Gaussian analyses. Turning to the ex-Gaussian parame-ters, for �, only the main effect of word frequency was significant,F(1, 76) � 13.51, p � .001, MSE � 392.16, 2 � .15. Neither themain effect of stimulus quality ( p � .13) nor the interaction (F �1) were significant. Likewise, for �, only the main effect of wordfrequency was significant, F(1, 76) � 5.62, p � .020, MSE �180.30, 2 � .069. The main effect of stimulus quality and theinteraction were not significant. For �, the main effects of stimulusquality, F(1, 76) � 18.01, p � .001, MSE � 9,248.72, 2 � .19,and word frequency, F(1, 76) � 12.20, p � .001, MSE � 835.24,2 � .14, were significant. The Stimulus Quality � Word Fre-quency interaction approached significance ( p � .07), reflecting alarger stimulus quality effect for low-frequency words than forhigh-frequency words.
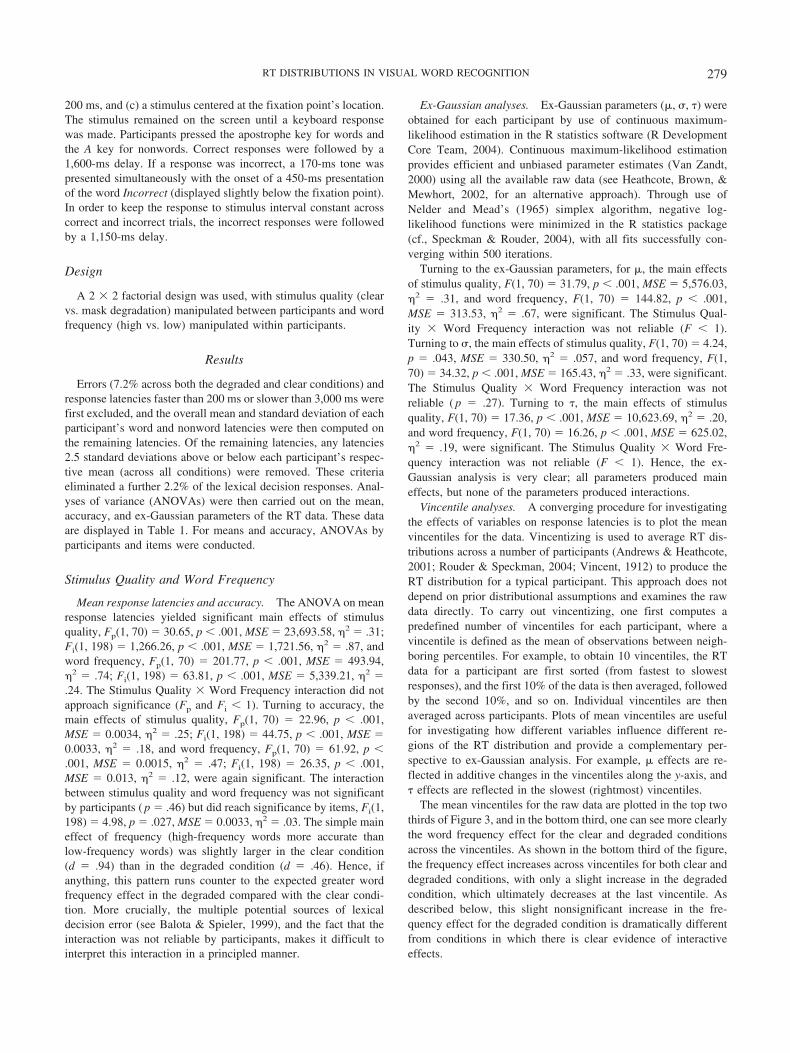
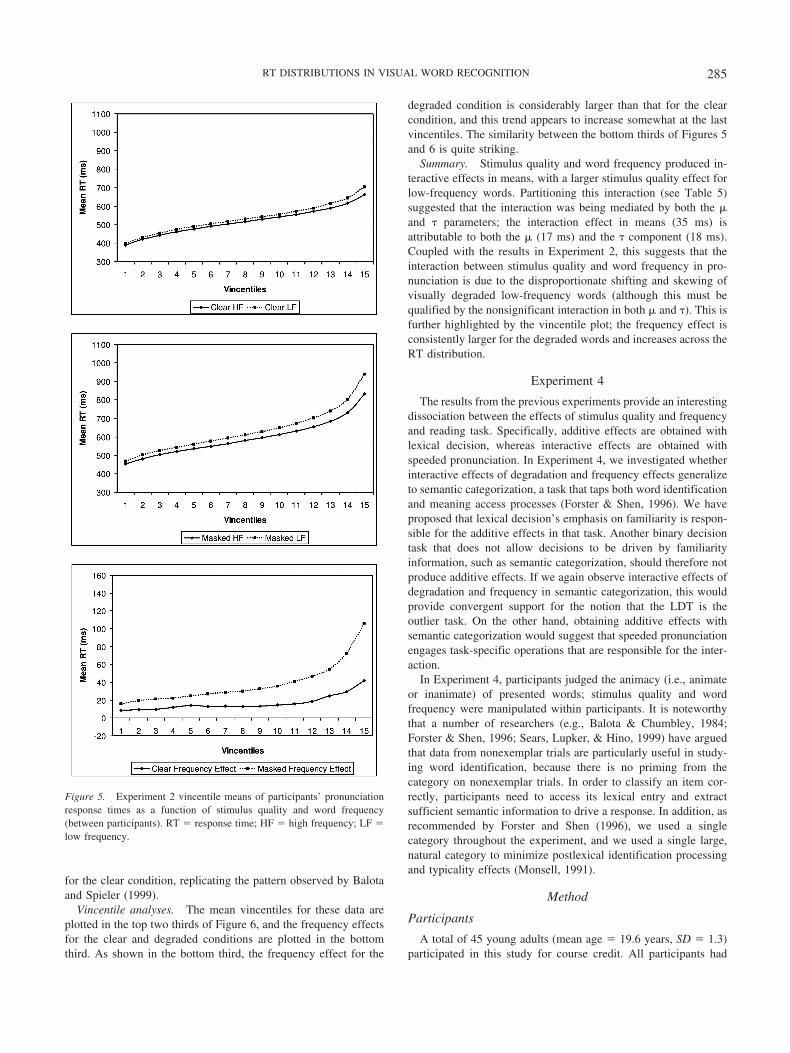
Vincentile analyses. The mean vincentiles for these data areplotted in the top two thirds of Figure 5, and the frequency effectfor the clear and degraded conditions are displayed in the bottomthird of the figure. As most clearly shown in the bottom third, therewas a larger frequency effect in the degraded condition, primarilyat the slower vincentiles, which converges with the results from theex-Gaussian analyses. Again, comparing Figure 5 and Figure 2,one can see a strong difference in the joint effects of stimulusquality and word frequency in pronunciation and lexical decisionperformance.
Discussion
In Experiment 1, using the LDT, we observed robust additiveeffects of stimulus quality and word frequency. In Experiment 2,through use of speeded pronunciation, the same stimuli and stim-ulus quality manipulation produced a clear interaction betweenstimulus quality and word frequency in mean RTs, with largerstimulus quality effects for low-frequency words. One obviousinterpretation of these findings is that the additive effects ofstimulus quality and word frequency may not be task independentbut may instead reflect task operations that are specific to the LDT.However, because of the importance of this interaction in pronun-ciation performance, it is necessary to replicate and extend thispattern.
Experiment 3
Although a significant interaction was obtained with mean RTs,none of the parameters produced an interaction. Basically, the
4 Because the same stimuli were used for lexical decision (Experiment 1)and speeded pronunciation (Experiments 2 and 3), the high- and low-frequency words were not matched in advance on phonological factorsknown to bias voice key RT measurement (see Kessler, Treiman, &Mullennix, 2002). It was assumed that this would not be a problem becausethe same items occur in both the clear and degraded conditions. However,to address a reviewer’s concern that voice key effects may influencesensitivity to interactions, we controlled for onset characteristics (using themethod described in Balota, Cortese, Sergent-Marshall, Spieler, & Yap,2004) in the speeded pronunciation experiments before carrying out theANOVAs. After we controlled for phonological onset characteristics, theStimulus Quality � Word Frequency interaction was still significant inboth Experiments 2 and 3.
283RT DISTRIBUTIONS IN VISUAL WORD RECOGNITION
interaction was exhibited to some extent in both � and �. Becauseof the theoretical importance of this interaction, it is necessary toboth replicate this pattern of results with an independent sampleand to increase the power of the design. Hence, Experiment 3 isessentially a replication of Experiment 2, with both stimulus qual-ity and word frequency manipulated within participants, whichshould increase power.
Method
Participants
A total of 48 young adults (mean age � 21.3 years, SD � 3.40)participated in this study for course credit. All participants hadnormal or corrected-to-normal vision and were recruited from theundergraduate student population of Washington University in St.Louis. The participants had an average of 14.3 years of education(SD � 1.19) and a mean vocabulary age of 18.6 (SD � 1.03) onthe Shipley vocabulary subtest. Data from 3 of the 48 participantswere discarded because of excessively high error rates or slowlatencies, using the same multivariate outlier procedure describedin Experiment 1, leaving 45 participants. The apparatus, stimuli,and procedure were the same as those used in Experiment 2.
Design
A 2 � 2 factorial design was used: Both stimulus quality andword frequency were manipulated within participants. The original200 stimuli were divided into two sets of 100 words (Set A and SetB), with each set containing 50 high- and 50 low-frequency words;the two sets were matched on length and word frequency.5
Results
Errors (1.8%) and extreme response latencies (faster than 200ms or slower than 3,000 ms) were first excluded from the analyses,and the overall mean and standard deviation of each participant’sword latencies were then computed on the remaining latencies.Response latencies 2.5 standard deviations above or below eachparticipant’s respective mean latency were removed. These criteriaeliminated a further 2.6% of the pronunciation responses.ANOVAs were then carried out on the mean, accuracy, and theex-Gaussian parameters of the RT data (see Table 5).
Mean response latencies and accuracy. For means, the maineffect of stimulus quality, Fp(1, 44) � 78.79, p � .001, MSE �3,910.68, 2 � .64; Fi(1, 198) � 185.86, p � .001, MSE �3,773.73, 2 � .48, and word frequency, Fp(1, 44) � 47.54, p �.001, MSE � 599.08, 2 �.52; Fi(1, 198) � 15.00, p � .001,MSE � 4,305.12, 2 � .07, were significant by participants anditems. More crucially, the Stimulus Quality � Word Frequencyinteraction was highly reliable by both participants and items,Fp(1, 44) � 24.04, p � .001, MSE � 547.05, 2 � .35; Fi(1,198) � 8.00, p � .005, MSE � 3,773.73, 2 � .039, with a largerstimulus quality effect for low-frequency words than for high-frequency words. Turning to accuracy, the main effect of stimulusquality was significant, Fp(1, 44) � 10.39, p � .002, MSE �0.00099, 2 � .19; Fi(1, 198) � 4.07, p � .045, MSE � 0.0029,2 � .02, whereas the main effect of word frequency was notsignificant by participants (Fp � 1) but was significant by items,Fi(1, 198) � 3.95, p � .048, MSE � 0.0030, 2 � .020. Theinteraction between stimulus quality and word frequency was notsignificant by participants or items.
Ex-Gaussian analyses. Turning to the ex-Gaussian parame-ters, for �, both the main effects of stimulus quality, F(1, 44) �56.26, p � .001, MSE � 1,043.86, 2 � .56, and word frequency,F(1, 44) � 11.87, p � .001, MSE � 1,180.91, 2 � .21, weresignificant. The interaction approached but did not reach signifi-cance ( p � .14). Likewise, for �, both the main effects of stimulusquality, F(1, 44) � 12.07, p � .001, MSE � 725.50, 2 � .22, andword frequency, F(1, 44) � 5.36, p � .025, MSE � 531.79, 2 �.11, were significant. The interaction was not significant (F � 1).Turning to �, the main effect of stimulus quality was significant,F(1, 44) � 19.66, p � .001, MSE � 4,982.45, 2 � .31. Neitherthe main effect of word frequency nor the Stimulus Quality �Word Frequency interaction was significant ( ps .10). It isnoteworthy that in the within-participants degradation manipula-tion, there is no influence of word frequency on the � component
5 For the original 48 participants, half the participants saw Set A wordsclearly and Set B words with degradation (Order 1), and the other half ofthe participants saw Set B words clearly and Set A words with degradation(Order 2). The elimination of 3 participants resulted in 22 participants forthe Order 1 condition and 23 participants for the Order 2 condition. Theorder variable did not interact with any of the experimental variables.
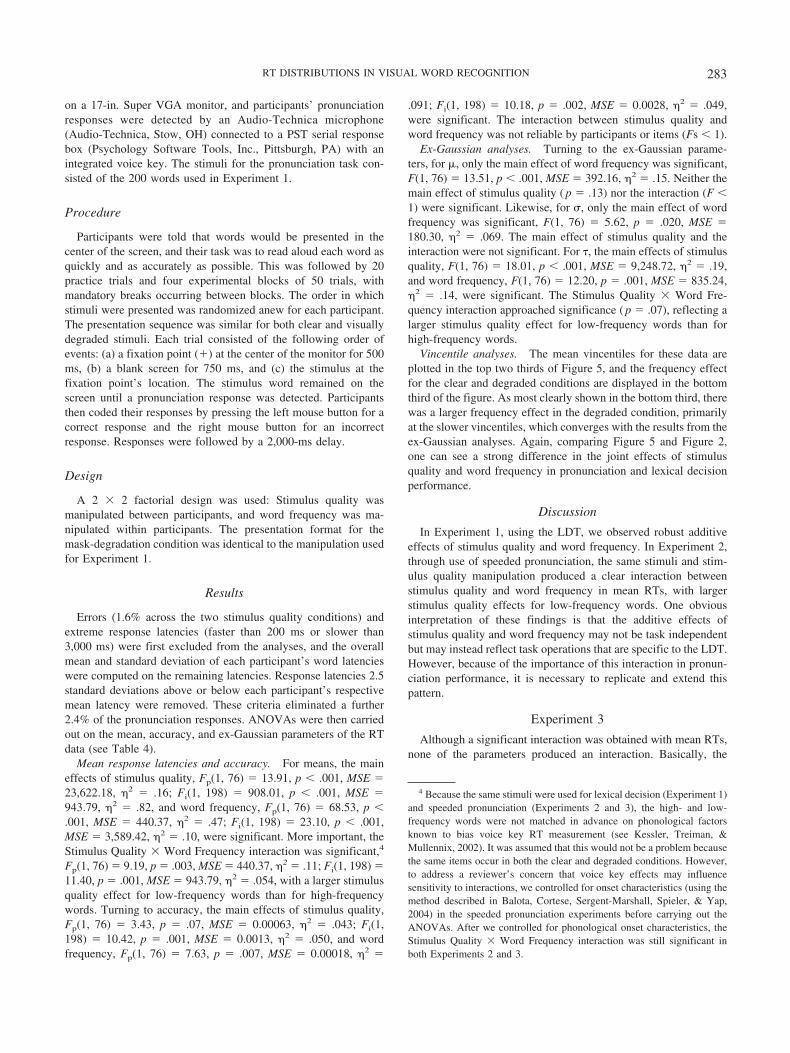
Table 4Means of Participants’ Speeded Pronunciation Response Time Means and Ex-GaussianParameter Estimates as a Function of Word Frequency and Stimulus Quality (Experiment 2—Between Participants)
Stimulus quality/word frequency M % of errors � � �
Clear wordsHigh-frequency words 516 0.8 (1.3) 468 74 48Low-frequency words 533 1.5 (1.5) 478 79 56Frequency effect 17 0.7 (0.2) 10 5 8
Mask-degraded wordsHigh-frequency words 597 1.7 (2.0) 493 69 105Low-frequency words 635 2.2 (2.8) 506 74 129Frequency effect 38 0.5 (0.8) 13 5 24
Difference of difference (interaction) 21 �0.2 (0.6) 3 0 16
Note. Means are given in milliseconds. Standard deviations are in parentheses.
284 YAP AND BALOTA
for the clear condition, replicating the pattern observed by Balotaand Spieler (1999).
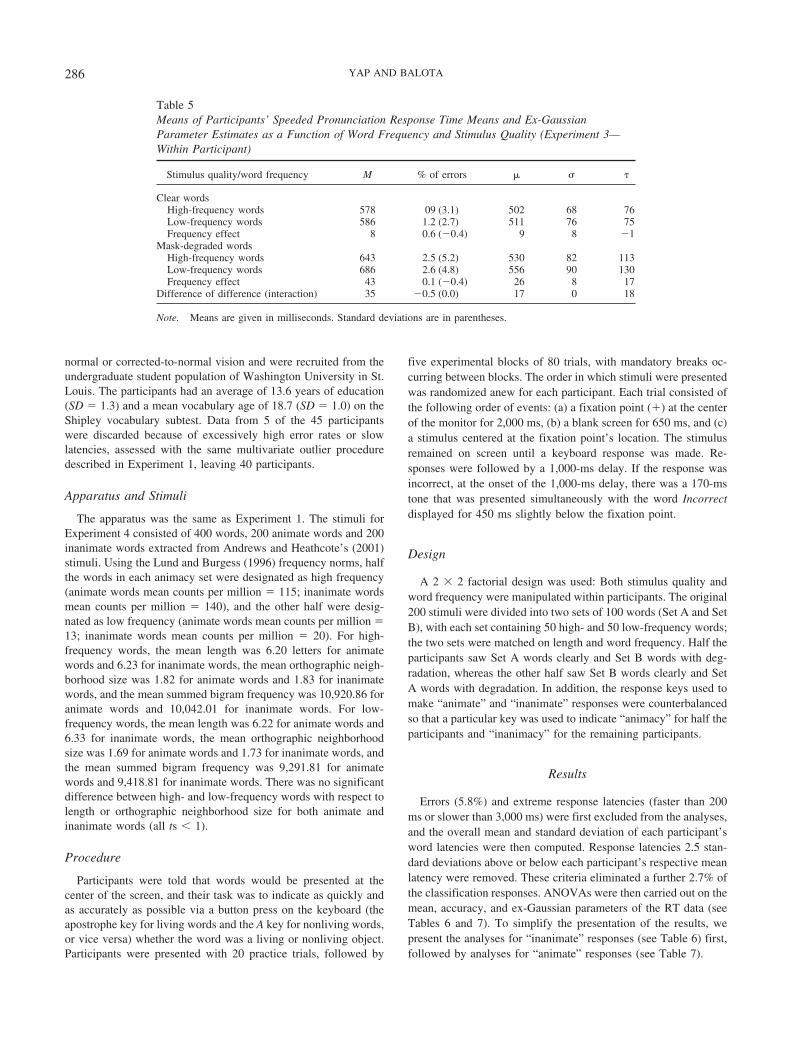
Vincentile analyses. The mean vincentiles for these data areplotted in the top two thirds of Figure 6, and the frequency effectsfor the clear and degraded conditions are plotted in the bottomthird. As shown in the bottom third, the frequency effect for the
degraded condition is considerably larger than that for the clearcondition, and this trend appears to increase somewhat at the lastvincentiles. The similarity between the bottom thirds of Figures 5and 6 is quite striking.
Summary. Stimulus quality and word frequency produced in-teractive effects in means, with a larger stimulus quality effect forlow-frequency words. Partitioning this interaction (see Table 5)suggested that the interaction was being mediated by both the �and � parameters; the interaction effect in means (35 ms) isattributable to both the � (17 ms) and the � component (18 ms).Coupled with the results in Experiment 2, this suggests that theinteraction between stimulus quality and word frequency in pro-nunciation is due to the disproportionate shifting and skewing ofvisually degraded low-frequency words (although this must bequalified by the nonsignificant interaction in both � and �). This isfurther highlighted by the vincentile plot; the frequency effect isconsistently larger for the degraded words and increases across theRT distribution.
Experiment 4
The results from the previous experiments provide an interestingdissociation between the effects of stimulus quality and frequencyand reading task. Specifically, additive effects are obtained withlexical decision, whereas interactive effects are obtained withspeeded pronunciation. In Experiment 4, we investigated whetherinteractive effects of degradation and frequency effects generalizeto semantic categorization, a task that taps both word identificationand meaning access processes (Forster & Shen, 1996). We haveproposed that lexical decision’s emphasis on familiarity is respon-sible for the additive effects in that task. Another binary decisiontask that does not allow decisions to be driven by familiarityinformation, such as semantic categorization, should therefore notproduce additive effects. If we again observe interactive effects ofdegradation and frequency in semantic categorization, this wouldprovide convergent support for the notion that the LDT is theoutlier task. On the other hand, obtaining additive effects withsemantic categorization would suggest that speeded pronunciationengages task-specific operations that are responsible for the inter-action.
In Experiment 4, participants judged the animacy (i.e., animateor inanimate) of presented words; stimulus quality and wordfrequency were manipulated within participants. It is noteworthythat a number of researchers (e.g., Balota & Chumbley, 1984;Forster & Shen, 1996; Sears, Lupker, & Hino, 1999) have arguedthat data from nonexemplar trials are particularly useful in study-ing word identification, because there is no priming from thecategory on nonexemplar trials. In order to classify an item cor-rectly, participants need to access its lexical entry and extractsufficient semantic information to drive a response. In addition, asrecommended by Forster and Shen (1996), we used a singlecategory throughout the experiment, and we used a single large,natural category to minimize postlexical identification processingand typicality effects (Monsell, 1991).
Method
Participants
A total of 45 young adults (mean age � 19.6 years, SD � 1.3)participated in this study for course credit. All participants had
Figure 5. Experiment 2 vincentile means of participants’ pronunciationresponse times as a function of stimulus quality and word frequency(between participants). RT � response time; HF � high frequency; LF �low frequency.
285RT DISTRIBUTIONS IN VISUAL WORD RECOGNITION
normal or corrected-to-normal vision and were recruited from theundergraduate student population of Washington University in St.Louis. The participants had an average of 13.6 years of education(SD � 1.3) and a mean vocabulary age of 18.7 (SD � 1.0) on theShipley vocabulary subtest. Data from 5 of the 45 participantswere discarded because of excessively high error rates or slowlatencies, assessed with the same multivariate outlier proceduredescribed in Experiment 1, leaving 40 participants.
Apparatus and Stimuli
The apparatus was the same as Experiment 1. The stimuli forExperiment 4 consisted of 400 words, 200 animate words and 200inanimate words extracted from Andrews and Heathcote’s (2001)stimuli. Using the Lund and Burgess (1996) frequency norms, halfthe words in each animacy set were designated as high frequency(animate words mean counts per million � 115; inanimate wordsmean counts per million � 140), and the other half were desig-nated as low frequency (animate words mean counts per million �13; inanimate words mean counts per million � 20). For high-frequency words, the mean length was 6.20 letters for animatewords and 6.23 for inanimate words, the mean orthographic neigh-borhood size was 1.82 for animate words and 1.83 for inanimatewords, and the mean summed bigram frequency was 10,920.86 foranimate words and 10,042.01 for inanimate words. For low-frequency words, the mean length was 6.22 for animate words and6.33 for inanimate words, the mean orthographic neighborhoodsize was 1.69 for animate words and 1.73 for inanimate words, andthe mean summed bigram frequency was 9,291.81 for animatewords and 9,418.81 for inanimate words. There was no significantdifference between high- and low-frequency words with respect tolength or orthographic neighborhood size for both animate andinanimate words (all ts � 1).
Procedure
Participants were told that words would be presented at thecenter of the screen, and their task was to indicate as quickly andas accurately as possible via a button press on the keyboard (theapostrophe key for living words and the A key for nonliving words,or vice versa) whether the word was a living or nonliving object.Participants were presented with 20 practice trials, followed by
five experimental blocks of 80 trials, with mandatory breaks oc-curring between blocks. The order in which stimuli were presentedwas randomized anew for each participant. Each trial consisted ofthe following order of events: (a) a fixation point (�) at the centerof the monitor for 2,000 ms, (b) a blank screen for 650 ms, and (c)a stimulus centered at the fixation point’s location. The stimulusremained on screen until a keyboard response was made. Re-sponses were followed by a 1,000-ms delay. If the response wasincorrect, at the onset of the 1,000-ms delay, there was a 170-mstone that was presented simultaneously with the word Incorrectdisplayed for 450 ms slightly below the fixation point.
Design
A 2 � 2 factorial design was used: Both stimulus quality andword frequency were manipulated within participants. The original200 stimuli were divided into two sets of 100 words (Set A and SetB), with each set containing 50 high- and 50 low-frequency words;the two sets were matched on length and word frequency. Half theparticipants saw Set A words clearly and Set B words with deg-radation, whereas the other half saw Set B words clearly and SetA words with degradation. In addition, the response keys used tomake “animate” and “inanimate” responses were counterbalancedso that a particular key was used to indicate “animacy” for half theparticipants and “inanimacy” for the remaining participants.
Results
Errors (5.8%) and extreme response latencies (faster than 200ms or slower than 3,000 ms) were first excluded from the analyses,and the overall mean and standard deviation of each participant’sword latencies were then computed. Response latencies 2.5 stan-dard deviations above or below each participant’s respective meanlatency were removed. These criteria eliminated a further 2.7% ofthe classification responses. ANOVAs were then carried out on themean, accuracy, and ex-Gaussian parameters of the RT data (seeTables 6 and 7). To simplify the presentation of the results, wepresent the analyses for “inanimate” responses (see Table 6) first,followed by analyses for “animate” responses (see Table 7).
Table 5Means of Participants’ Speeded Pronunciation Response Time Means and Ex-GaussianParameter Estimates as a Function of Word Frequency and Stimulus Quality (Experiment 3—Within Participant)
Stimulus quality/word frequency M % of errors � � �
Clear wordsHigh-frequency words 578 09 (3.1) 502 68 76Low-frequency words 586 1.2 (2.7) 511 76 75Frequency effect 8 0.6 (�0.4) 9 8 �1
Mask-degraded wordsHigh-frequency words 643 2.5 (5.2) 530 82 113Low-frequency words 686 2.6 (4.8) 556 90 130Frequency effect 43 0.1 (�0.4) 26 8 17
Difference of difference (interaction) 35 �0.5 (0.0) 17 0 18
Note. Means are given in milliseconds. Standard deviations are in parentheses.
286 YAP AND BALOTA
Stimulus Quality � Word Frequency (Inanimate)
Response latencies and accuracy. For means, the main effectof stimulus quality, Fp(1, 39) � 55.08, p � .001, MSE � 7,309.59,2 � .59; Fi(1, 198) � 231.81, p � .001, MSE � 4,390.51, 2 �.54 and word frequency, Fp(1, 39) � 67.07, p � .001, MSE �
1,267.87, 2 � .63; Fi(1, 198) � 22.81, p � .001, MSE �9,512.07, 2 � .10, were significant by participants and items.More crucially, the Stimulus Quality � Word Frequency interac-tion was reliable by participants and items, Fp(1, 39) � 6.15, p �.018, MSE � 858.08, 2 � .14; Fi(1, 198) � 4.10, p � .04, MSE �4,390.51, 2 � .02, with a larger stimulus quality effect forlow-frequency words than for high-frequency words. Turning toaccuracy, the main effect of word frequency, Fp(1, 39) � 5.57, p �.02, MSE � 0.0007, 2 � .13; Fi(1, 198) � 3.13, p � .08, MSE �0.013, 2 � .016, was significant. The main effect of stimulusquality was not significant by participants ( p � .32) but wassignificant by items, Fi(1, 198) � 5.32, p � .02, MSE � 0.003,2 � .03. The Stimulus Quality � Word Frequency interactionwas not significant by participants ( p � .18) or by items ( p � .39).
Ex-Gaussian parameters. Turning to the ex-Gaussian param-eters, for �, both the main effects of stimulus quality, F(1, 39) �41.03, p � .001, MSE � 2,091.84, 2 � .51, and word frequency,F(1, 39) � 10.85, p � .002, MSE � 3,413.46, 2 � .22, weresignificant. The interaction did not reach significance (F � 1). For�, none of the effects were significant. Turning to �, the maineffect of stimulus quality was significant, F(1, 39) � 12.87, p �.001, MSE � 9,240.65, 2 � .25. The main effect of wordfrequency approached significance ( p � .09), but the StimulusQuality � Word Frequency interaction was not significant ( p �.27).
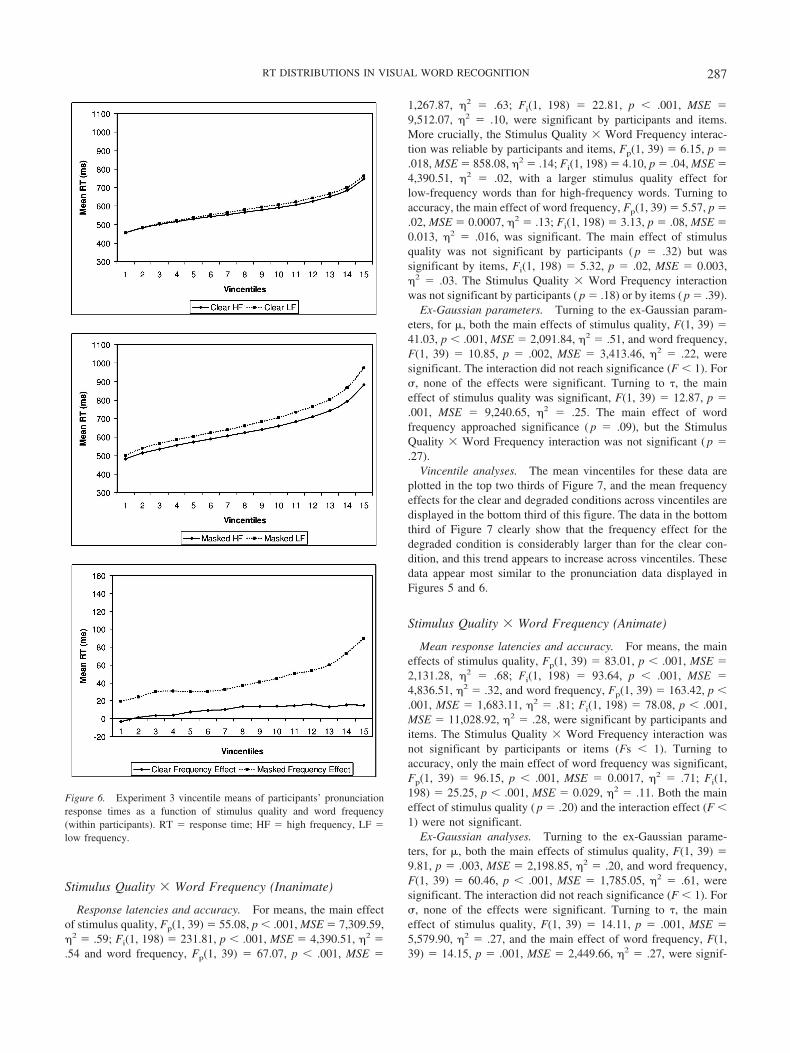
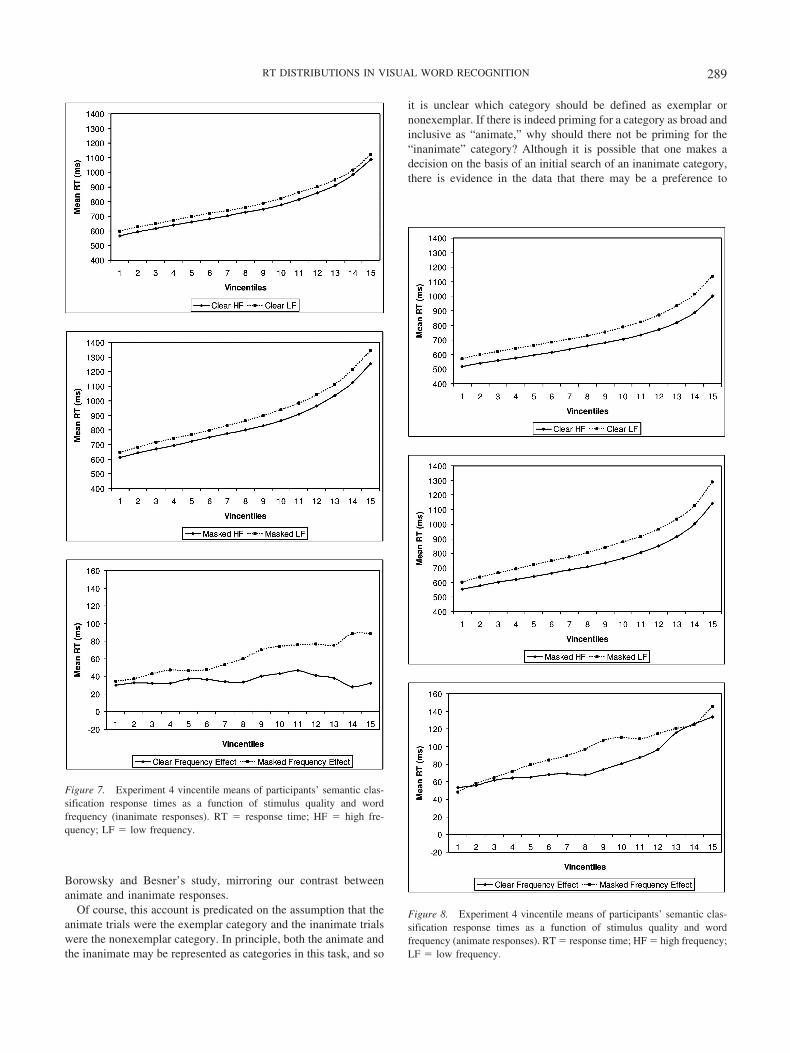
Vincentile analyses. The mean vincentiles for these data areplotted in the top two thirds of Figure 7, and the mean frequencyeffects for the clear and degraded conditions across vincentiles aredisplayed in the bottom third of this figure. The data in the bottomthird of Figure 7 clearly show that the frequency effect for thedegraded condition is considerably larger than for the clear con-dition, and this trend appears to increase across vincentiles. Thesedata appear most similar to the pronunciation data displayed inFigures 5 and 6.
Stimulus Quality � Word Frequency (Animate)
Mean response latencies and accuracy. For means, the maineffects of stimulus quality, Fp(1, 39) � 83.01, p � .001, MSE �2,131.28, 2 � .68; Fi(1, 198) � 93.64, p � .001, MSE �4,836.51, 2 � .32, and word frequency, Fp(1, 39) � 163.42, p �.001, MSE � 1,683.11, 2 � .81; Fi(1, 198) � 78.08, p � .001,MSE � 11,028.92, 2 � .28, were significant by participants anditems. The Stimulus Quality � Word Frequency interaction wasnot significant by participants or items (Fs � 1). Turning toaccuracy, only the main effect of word frequency was significant,Fp(1, 39) � 96.15, p � .001, MSE � 0.0017, 2 � .71; Fi(1,198) � 25.25, p � .001, MSE � 0.029, 2 � .11. Both the maineffect of stimulus quality ( p � .20) and the interaction effect (F �1) were not significant.
Ex-Gaussian analyses. Turning to the ex-Gaussian parame-ters, for �, both the main effects of stimulus quality, F(1, 39) �9.81, p � .003, MSE � 2,198.85, 2 � .20, and word frequency,F(1, 39) � 60.46, p � .001, MSE � 1,785.05, 2 � .61, weresignificant. The interaction did not reach significance (F � 1). For�, none of the effects were significant. Turning to �, the maineffect of stimulus quality, F(1, 39) � 14.11, p � .001, MSE �5,579.90, 2 � .27, and the main effect of word frequency, F(1,39) � 14.15, p � .001, MSE � 2,449.66, 2 � .27, were signif-
Figure 6. Experiment 3 vincentile means of participants’ pronunciationresponse times as a function of stimulus quality and word frequency(within participants). RT � response time; HF � high frequency, LF �low frequency.
287RT DISTRIBUTIONS IN VISUAL WORD RECOGNITION
icant, but the Stimulus Quality � Word Frequency interaction wasnot significant (F � 1).
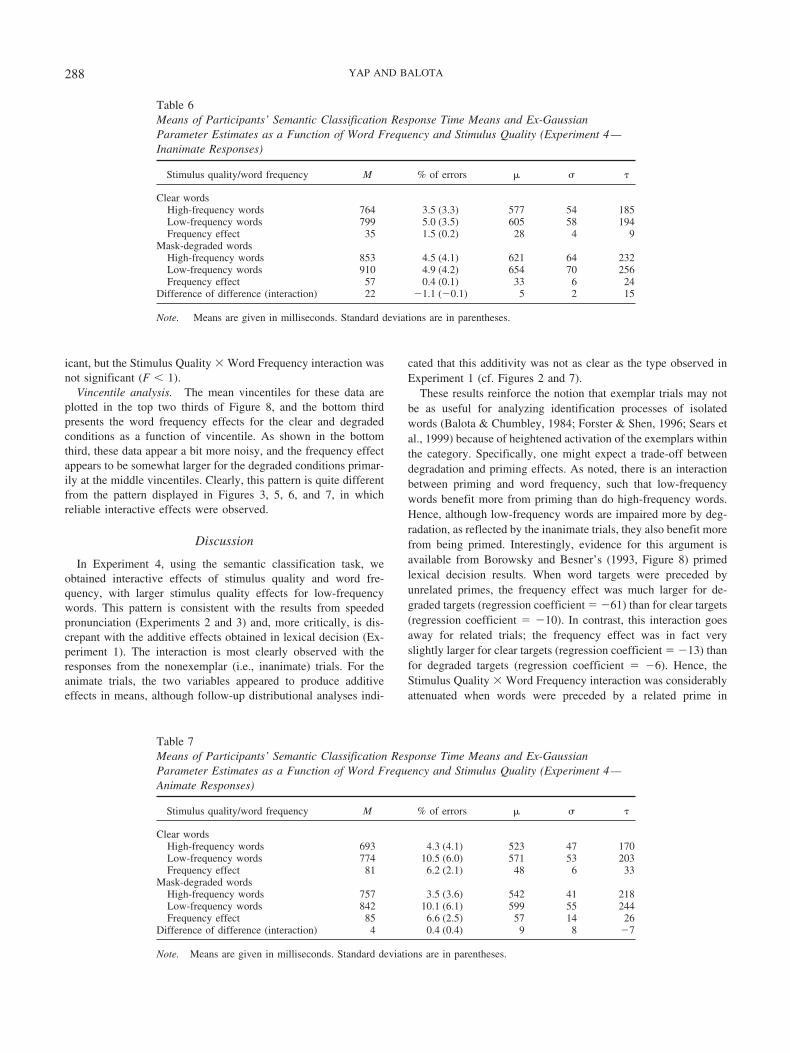
Vincentile analysis. The mean vincentiles for these data areplotted in the top two thirds of Figure 8, and the bottom thirdpresents the word frequency effects for the clear and degradedconditions as a function of vincentile. As shown in the bottomthird, these data appear a bit more noisy, and the frequency effectappears to be somewhat larger for the degraded conditions primar-ily at the middle vincentiles. Clearly, this pattern is quite differentfrom the pattern displayed in Figures 3, 5, 6, and 7, in whichreliable interactive effects were observed.
Discussion
In Experiment 4, using the semantic classification task, weobtained interactive effects of stimulus quality and word fre-quency, with larger stimulus quality effects for low-frequencywords. This pattern is consistent with the results from speededpronunciation (Experiments 2 and 3) and, more critically, is dis-crepant with the additive effects obtained in lexical decision (Ex-periment 1). The interaction is most clearly observed with theresponses from the nonexemplar (i.e., inanimate) trials. For theanimate trials, the two variables appeared to produce additiveeffects in means, although follow-up distributional analyses indi-
cated that this additivity was not as clear as the type observed inExperiment 1 (cf. Figures 2 and 7).
These results reinforce the notion that exemplar trials may notbe as useful for analyzing identification processes of isolatedwords (Balota & Chumbley, 1984; Forster & Shen, 1996; Sears etal., 1999) because of heightened activation of the exemplars withinthe category. Specifically, one might expect a trade-off betweendegradation and priming effects. As noted, there is an interactionbetween priming and word frequency, such that low-frequencywords benefit more from priming than do high-frequency words.Hence, although low-frequency words are impaired more by deg-radation, as reflected by the inanimate trials, they also benefit morefrom being primed. Interestingly, evidence for this argument isavailable from Borowsky and Besner’s (1993, Figure 8) primedlexical decision results. When word targets were preceded byunrelated primes, the frequency effect was much larger for de-graded targets (regression coefficient � �61) than for clear targets(regression coefficient � �10). In contrast, this interaction goesaway for related trials; the frequency effect was in fact veryslightly larger for clear targets (regression coefficient � �13) thanfor degraded targets (regression coefficient � �6). Hence, theStimulus Quality � Word Frequency interaction was considerablyattenuated when words were preceded by a related prime in
Table 6Means of Participants’ Semantic Classification Response Time Means and Ex-GaussianParameter Estimates as a Function of Word Frequency and Stimulus Quality (Experiment 4—Inanimate Responses)
Stimulus quality/word frequency M % of errors � � �
Clear wordsHigh-frequency words 764 3.5 (3.3) 577 54 185Low-frequency words 799 5.0 (3.5) 605 58 194Frequency effect 35 1.5 (0.2) 28 4 9
Mask-degraded wordsHigh-frequency words 853 4.5 (4.1) 621 64 232Low-frequency words 910 4.9 (4.2) 654 70 256Frequency effect 57 0.4 (0.1) 33 6 24
Difference of difference (interaction) 22 �1.1 (�0.1) 5 2 15
Note. Means are given in milliseconds. Standard deviations are in parentheses.
Table 7Means of Participants’ Semantic Classification Response Time Means and Ex-GaussianParameter Estimates as a Function of Word Frequency and Stimulus Quality (Experiment 4—Animate Responses)
Stimulus quality/word frequency M % of errors � � �
Clear wordsHigh-frequency words 693 4.3 (4.1) 523 47 170Low-frequency words 774 10.5 (6.0) 571 53 203Frequency effect 81 6.2 (2.1) 48 6 33
Mask-degraded wordsHigh-frequency words 757 3.5 (3.6) 542 41 218Low-frequency words 842 10.1 (6.1) 599 55 244Frequency effect 85 6.6 (2.5) 57 14 26
Difference of difference (interaction) 4 0.4 (0.4) 9 8 �7
Note. Means are given in milliseconds. Standard deviations are in parentheses.
288 YAP AND BALOTA
Borowsky and Besner’s study, mirroring our contrast betweenanimate and inanimate responses.
Of course, this account is predicated on the assumption that theanimate trials were the exemplar category and the inanimate trialswere the nonexemplar category. In principle, both the animate andthe inanimate may be represented as categories in this task, and so
it is unclear which category should be defined as exemplar ornonexemplar. If there is indeed priming for a category as broad andinclusive as “animate,” why should there not be priming for the“inanimate” category? Although it is possible that one makes adecision on the basis of an initial search of an inanimate category,there is evidence in the data that there may be a preference to
Figure 7. Experiment 4 vincentile means of participants’ semantic clas-sification response times as a function of stimulus quality and wordfrequency (inanimate responses). RT � response time; HF � high fre-quency; LF � low frequency.
Figure 8. Experiment 4 vincentile means of participants’ semantic clas-sification response times as a function of stimulus quality and wordfrequency (animate responses). RT � response time; HF � high frequency;LF � low frequency.
289RT DISTRIBUTIONS IN VISUAL WORD RECOGNITION
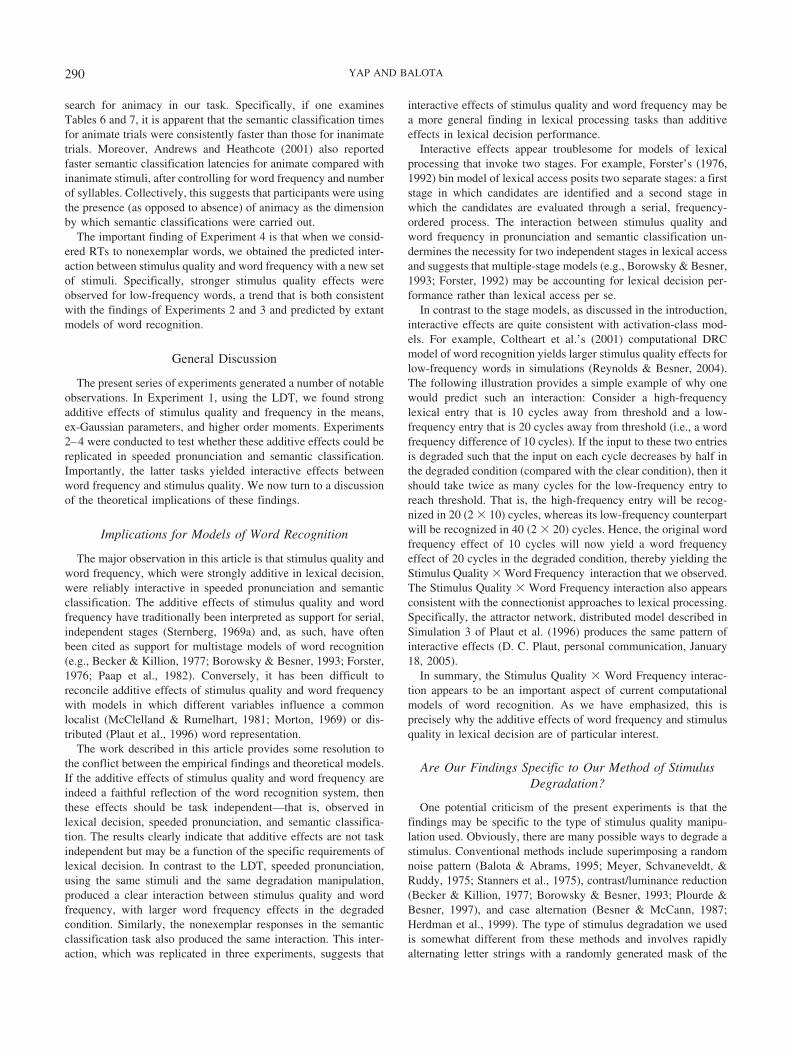
search for animacy in our task. Specifically, if one examinesTables 6 and 7, it is apparent that the semantic classification timesfor animate trials were consistently faster than those for inanimatetrials. Moreover, Andrews and Heathcote (2001) also reportedfaster semantic classification latencies for animate compared withinanimate stimuli, after controlling for word frequency and numberof syllables. Collectively, this suggests that participants were usingthe presence (as opposed to absence) of animacy as the dimensionby which semantic classifications were carried out.
The important finding of Experiment 4 is that when we consid-ered RTs to nonexemplar words, we obtained the predicted inter-action between stimulus quality and word frequency with a new setof stimuli. Specifically, stronger stimulus quality effects wereobserved for low-frequency words, a trend that is both consistentwith the findings of Experiments 2 and 3 and predicted by extantmodels of word recognition.
General Discussion
The present series of experiments generated a number of notableobservations. In Experiment 1, using the LDT, we found strongadditive effects of stimulus quality and frequency in the means,ex-Gaussian parameters, and higher order moments. Experiments2–4 were conducted to test whether these additive effects could bereplicated in speeded pronunciation and semantic classification.Importantly, the latter tasks yielded interactive effects betweenword frequency and stimulus quality. We now turn to a discussionof the theoretical implications of these findings.
Implications for Models of Word Recognition
The major observation in this article is that stimulus quality andword frequency, which were strongly additive in lexical decision,were reliably interactive in speeded pronunciation and semanticclassification. The additive effects of stimulus quality and wordfrequency have traditionally been interpreted as support for serial,independent stages (Sternberg, 1969a) and, as such, have oftenbeen cited as support for multistage models of word recognition(e.g., Becker & Killion, 1977; Borowsky & Besner, 1993; Forster,1976; Paap et al., 1982). Conversely, it has been difficult toreconcile additive effects of stimulus quality and word frequencywith models in which different variables influence a commonlocalist (McClelland & Rumelhart, 1981; Morton, 1969) or dis-tributed (Plaut et al., 1996) word representation.
The work described in this article provides some resolution tothe conflict between the empirical findings and theoretical models.If the additive effects of stimulus quality and word frequency areindeed a faithful reflection of the word recognition system, thenthese effects should be task independent—that is, observed inlexical decision, speeded pronunciation, and semantic classifica-tion. The results clearly indicate that additive effects are not taskindependent but may be a function of the specific requirements oflexical decision. In contrast to the LDT, speeded pronunciation,using the same stimuli and the same degradation manipulation,produced a clear interaction between stimulus quality and wordfrequency, with larger word frequency effects in the degradedcondition. Similarly, the nonexemplar responses in the semanticclassification task also produced the same interaction. This inter-action, which was replicated in three experiments, suggests that
interactive effects of stimulus quality and word frequency may bea more general finding in lexical processing tasks than additiveeffects in lexical decision performance.
Interactive effects appear troublesome for models of lexicalprocessing that invoke two stages. For example, Forster’s (1976,1992) bin model of lexical access posits two separate stages: a firststage in which candidates are identified and a second stage inwhich the candidates are evaluated through a serial, frequency-ordered process. The interaction between stimulus quality andword frequency in pronunciation and semantic classification un-dermines the necessity for two independent stages in lexical accessand suggests that multiple-stage models (e.g., Borowsky & Besner,1993; Forster, 1992) may be accounting for lexical decision per-formance rather than lexical access per se.
In contrast to the stage models, as discussed in the introduction,interactive effects are quite consistent with activation-class mod-els. For example, Coltheart et al.’s (2001) computational DRCmodel of word recognition yields larger stimulus quality effects forlow-frequency words in simulations (Reynolds & Besner, 2004).The following illustration provides a simple example of why onewould predict such an interaction: Consider a high-frequencylexical entry that is 10 cycles away from threshold and a low-frequency entry that is 20 cycles away from threshold (i.e., a wordfrequency difference of 10 cycles). If the input to these two entriesis degraded such that the input on each cycle decreases by half inthe degraded condition (compared with the clear condition), then itshould take twice as many cycles for the low-frequency entry toreach threshold. That is, the high-frequency entry will be recog-nized in 20 (2 � 10) cycles, whereas its low-frequency counterpartwill be recognized in 40 (2 � 20) cycles. Hence, the original wordfrequency effect of 10 cycles will now yield a word frequencyeffect of 20 cycles in the degraded condition, thereby yielding theStimulus Quality � Word Frequency interaction that we observed.The Stimulus Quality � Word Frequency interaction also appearsconsistent with the connectionist approaches to lexical processing.Specifically, the attractor network, distributed model described inSimulation 3 of Plaut et al. (1996) produces the same pattern ofinteractive effects (D. C. Plaut, personal communication, January18, 2005).
In summary, the Stimulus Quality � Word Frequency interac-tion appears to be an important aspect of current computationalmodels of word recognition. As we have emphasized, this isprecisely why the additive effects of word frequency and stimulusquality in lexical decision are of particular interest.
Are Our Findings Specific to Our Method of StimulusDegradation?
One potential criticism of the present experiments is that thefindings may be specific to the type of stimulus quality manipu-lation used. Obviously, there are many possible ways to degrade astimulus. Conventional methods include superimposing a randomnoise pattern (Balota & Abrams, 1995; Meyer, Schvaneveldt, &Ruddy, 1975; Stanners et al., 1975), contrast/luminance reduction(Becker & Killion, 1977; Borowsky & Besner, 1993; Plourde &Besner, 1997), and case alternation (Besner & McCann, 1987;Herdman et al., 1999). The type of stimulus degradation we usedis somewhat different from these methods and involves rapidlyalternating letter strings with a randomly generated mask of the
290 YAP AND BALOTA
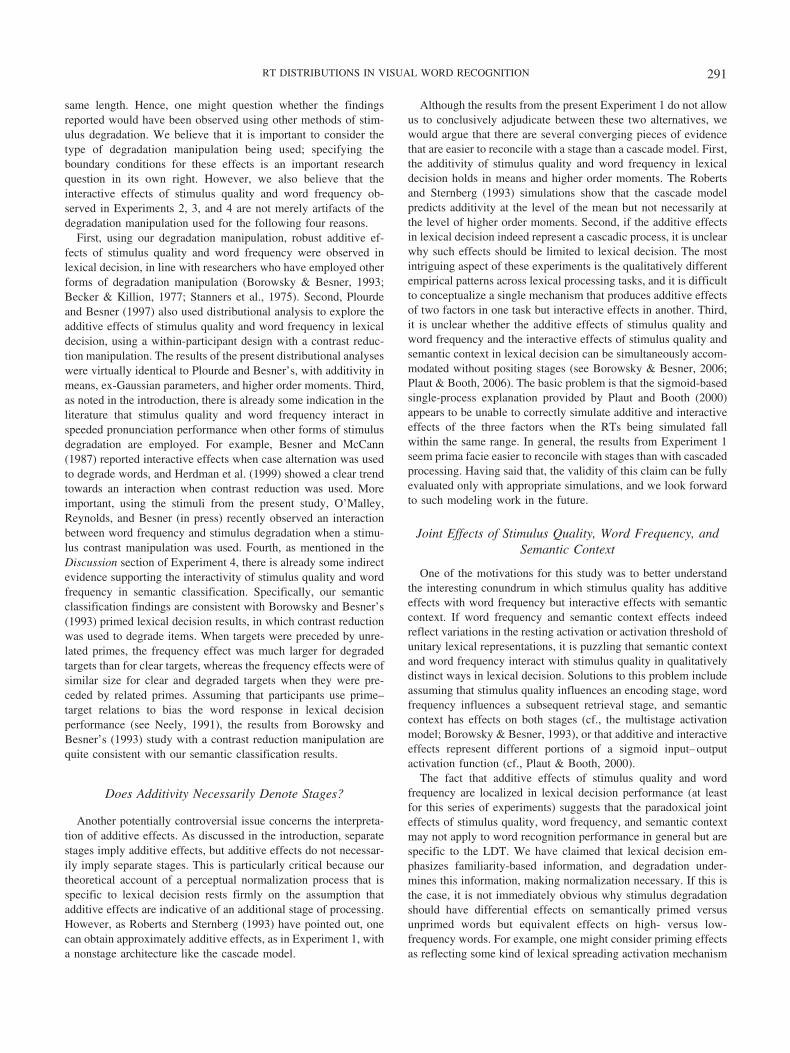
same length. Hence, one might question whether the findingsreported would have been observed using other methods of stim-ulus degradation. We believe that it is important to consider thetype of degradation manipulation being used; specifying theboundary conditions for these effects is an important researchquestion in its own right. However, we also believe that theinteractive effects of stimulus quality and word frequency ob-served in Experiments 2, 3, and 4 are not merely artifacts of thedegradation manipulation used for the following four reasons.
First, using our degradation manipulation, robust additive ef-fects of stimulus quality and word frequency were observed inlexical decision, in line with researchers who have employed otherforms of degradation manipulation (Borowsky & Besner, 1993;Becker & Killion, 1977; Stanners et al., 1975). Second, Plourdeand Besner (1997) also used distributional analysis to explore theadditive effects of stimulus quality and word frequency in lexicaldecision, using a within-participant design with a contrast reduc-tion manipulation. The results of the present distributional analyseswere virtually identical to Plourde and Besner’s, with additivity inmeans, ex-Gaussian parameters, and higher order moments. Third,as noted in the introduction, there is already some indication in theliterature that stimulus quality and word frequency interact inspeeded pronunciation performance when other forms of stimulusdegradation are employed. For example, Besner and McCann(1987) reported interactive effects when case alternation was usedto degrade words, and Herdman et al. (1999) showed a clear trendtowards an interaction when contrast reduction was used. Moreimportant, using the stimuli from the present study, O’Malley,Reynolds, and Besner (in press) recently observed an interactionbetween word frequency and stimulus degradation when a stimu-lus contrast manipulation was used. Fourth, as mentioned in theDiscussion section of Experiment 4, there is already some indirectevidence supporting the interactivity of stimulus quality and wordfrequency in semantic classification. Specifically, our semanticclassification findings are consistent with Borowsky and Besner’s(1993) primed lexical decision results, in which contrast reductionwas used to degrade items. When targets were preceded by unre-lated primes, the frequency effect was much larger for degradedtargets than for clear targets, whereas the frequency effects were ofsimilar size for clear and degraded targets when they were pre-ceded by related primes. Assuming that participants use prime–target relations to bias the word response in lexical decisionperformance (see Neely, 1991), the results from Borowsky andBesner’s (1993) study with a contrast reduction manipulation arequite consistent with our semantic classification results.
Does Additivity Necessarily Denote Stages?
Another potentially controversial issue concerns the interpreta-tion of additive effects. As discussed in the introduction, separatestages imply additive effects, but additive effects do not necessar-ily imply separate stages. This is particularly critical because ourtheoretical account of a perceptual normalization process that isspecific to lexical decision rests firmly on the assumption thatadditive effects are indicative of an additional stage of processing.However, as Roberts and Sternberg (1993) have pointed out, onecan obtain approximately additive effects, as in Experiment 1, witha nonstage architecture like the cascade model.
Although the results from the present Experiment 1 do not allowus to conclusively adjudicate between these two alternatives, wewould argue that there are several converging pieces of evidencethat are easier to reconcile with a stage than a cascade model. First,the additivity of stimulus quality and word frequency in lexicaldecision holds in means and higher order moments. The Robertsand Sternberg (1993) simulations show that the cascade modelpredicts additivity at the level of the mean but not necessarily atthe level of higher order moments. Second, if the additive effectsin lexical decision indeed represent a cascadic process, it is unclearwhy such effects should be limited to lexical decision. The mostintriguing aspect of these experiments is the qualitatively differentempirical patterns across lexical processing tasks, and it is difficultto conceptualize a single mechanism that produces additive effectsof two factors in one task but interactive effects in another. Third,it is unclear whether the additive effects of stimulus quality andword frequency and the interactive effects of stimulus quality andsemantic context in lexical decision can be simultaneously accom-modated without positing stages (see Borowsky & Besner, 2006;Plaut & Booth, 2006). The basic problem is that the sigmoid-basedsingle-process explanation provided by Plaut and Booth (2000)appears to be unable to correctly simulate additive and interactiveeffects of the three factors when the RTs being simulated fallwithin the same range. In general, the results from Experiment 1seem prima facie easier to reconcile with stages than with cascadedprocessing. Having said that, the validity of this claim can be fullyevaluated only with appropriate simulations, and we look forwardto such modeling work in the future.
Joint Effects of Stimulus Quality, Word Frequency, andSemantic Context
One of the motivations for this study was to better understandthe interesting conundrum in which stimulus quality has additiveeffects with word frequency but interactive effects with semanticcontext. If word frequency and semantic context effects indeedreflect variations in the resting activation or activation threshold ofunitary lexical representations, it is puzzling that semantic contextand word frequency interact with stimulus quality in qualitativelydistinct ways in lexical decision. Solutions to this problem includeassuming that stimulus quality influences an encoding stage, wordfrequency influences a subsequent retrieval stage, and semanticcontext has effects on both stages (cf., the multistage activationmodel; Borowsky & Besner, 1993), or that additive and interactiveeffects represent different portions of a sigmoid input–outputactivation function (cf., Plaut & Booth, 2000).
The fact that additive effects of stimulus quality and wordfrequency are localized in lexical decision performance (at leastfor this series of experiments) suggests that the paradoxical jointeffects of stimulus quality, word frequency, and semantic contextmay not apply to word recognition performance in general but arespecific to the LDT. We have claimed that lexical decision em-phasizes familiarity-based information, and degradation under-mines this information, making normalization necessary. If this isthe case, it is not immediately obvious why stimulus degradationshould have differential effects on semantically primed versusunprimed words but equivalent effects on high- versus low-frequency words. For example, one might consider priming effectsas reflecting some kind of lexical spreading activation mechanism
291RT DISTRIBUTIONS IN VISUAL WORD RECOGNITION
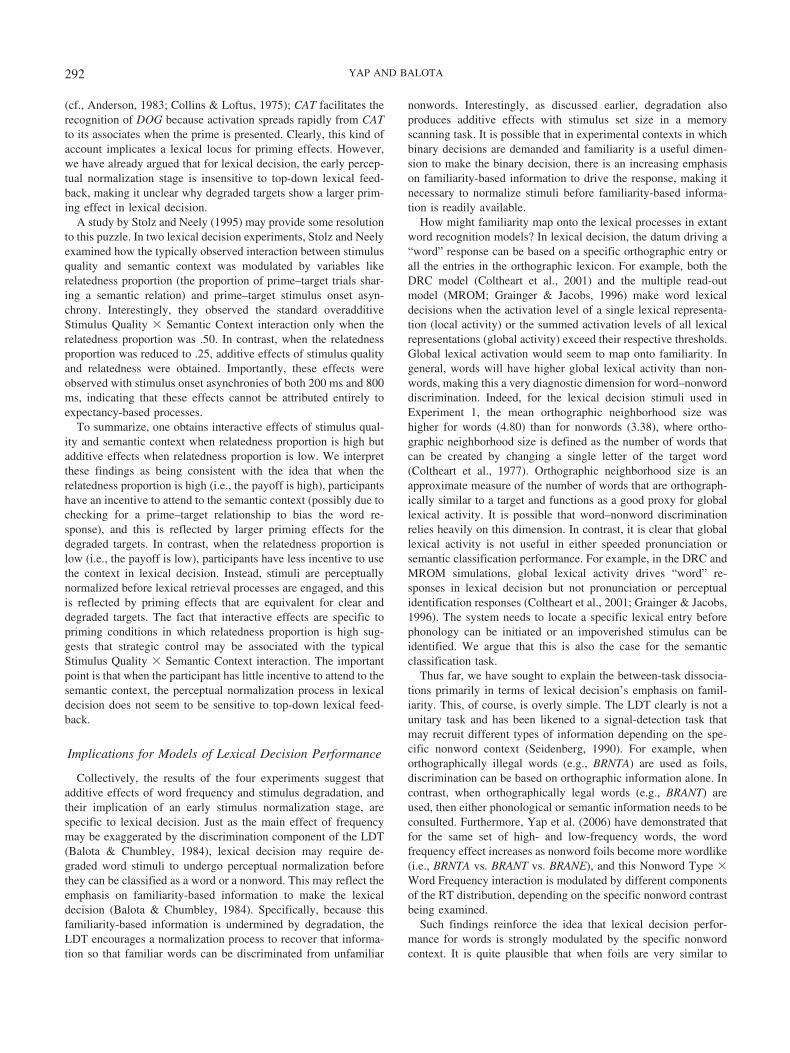
(cf., Anderson, 1983; Collins & Loftus, 1975); CAT facilitates therecognition of DOG because activation spreads rapidly from CATto its associates when the prime is presented. Clearly, this kind ofaccount implicates a lexical locus for priming effects. However,we have already argued that for lexical decision, the early percep-tual normalization stage is insensitive to top-down lexical feed-back, making it unclear why degraded targets show a larger prim-ing effect in lexical decision.
A study by Stolz and Neely (1995) may provide some resolutionto this puzzle. In two lexical decision experiments, Stolz and Neelyexamined how the typically observed interaction between stimulusquality and semantic context was modulated by variables likerelatedness proportion (the proportion of prime–target trials shar-ing a semantic relation) and prime–target stimulus onset asyn-chrony. Interestingly, they observed the standard overadditiveStimulus Quality � Semantic Context interaction only when therelatedness proportion was .50. In contrast, when the relatednessproportion was reduced to .25, additive effects of stimulus qualityand relatedness were obtained. Importantly, these effects wereobserved with stimulus onset asynchronies of both 200 ms and 800ms, indicating that these effects cannot be attributed entirely toexpectancy-based processes.
To summarize, one obtains interactive effects of stimulus qual-ity and semantic context when relatedness proportion is high butadditive effects when relatedness proportion is low. We interpretthese findings as being consistent with the idea that when therelatedness proportion is high (i.e., the payoff is high), participantshave an incentive to attend to the semantic context (possibly due tochecking for a prime–target relationship to bias the word re-sponse), and this is reflected by larger priming effects for thedegraded targets. In contrast, when the relatedness proportion islow (i.e., the payoff is low), participants have less incentive to usethe context in lexical decision. Instead, stimuli are perceptuallynormalized before lexical retrieval processes are engaged, and thisis reflected by priming effects that are equivalent for clear anddegraded targets. The fact that interactive effects are specific topriming conditions in which relatedness proportion is high sug-gests that strategic control may be associated with the typicalStimulus Quality � Semantic Context interaction. The importantpoint is that when the participant has little incentive to attend to thesemantic context, the perceptual normalization process in lexicaldecision does not seem to be sensitive to top-down lexical feed-back.
Implications for Models of Lexical Decision Performance
Collectively, the results of the four experiments suggest thatadditive effects of word frequency and stimulus degradation, andtheir implication of an early stimulus normalization stage, arespecific to lexical decision. Just as the main effect of frequencymay be exaggerated by the discrimination component of the LDT(Balota & Chumbley, 1984), lexical decision may require de-graded word stimuli to undergo perceptual normalization beforethey can be classified as a word or a nonword. This may reflect theemphasis on familiarity-based information to make the lexicaldecision (Balota & Chumbley, 1984). Specifically, because thisfamiliarity-based information is undermined by degradation, theLDT encourages a normalization process to recover that informa-tion so that familiar words can be discriminated from unfamiliar
nonwords. Interestingly, as discussed earlier, degradation alsoproduces additive effects with stimulus set size in a memoryscanning task. It is possible that in experimental contexts in whichbinary decisions are demanded and familiarity is a useful dimen-sion to make the binary decision, there is an increasing emphasison familiarity-based information to drive the response, making itnecessary to normalize stimuli before familiarity-based informa-tion is readily available.
How might familiarity map onto the lexical processes in extantword recognition models? In lexical decision, the datum driving a“word” response can be based on a specific orthographic entry orall the entries in the orthographic lexicon. For example, both theDRC model (Coltheart et al., 2001) and the multiple read-outmodel (MROM; Grainger & Jacobs, 1996) make word lexicaldecisions when the activation level of a single lexical representa-tion (local activity) or the summed activation levels of all lexicalrepresentations (global activity) exceed their respective thresholds.Global lexical activation would seem to map onto familiarity. Ingeneral, words will have higher global lexical activity than non-words, making this a very diagnostic dimension for word–nonworddiscrimination. Indeed, for the lexical decision stimuli used inExperiment 1, the mean orthographic neighborhood size washigher for words (4.80) than for nonwords (3.38), where ortho-graphic neighborhood size is defined as the number of words thatcan be created by changing a single letter of the target word(Coltheart et al., 1977). Orthographic neighborhood size is anapproximate measure of the number of words that are orthograph-ically similar to a target and functions as a good proxy for globallexical activity. It is possible that word–nonword discriminationrelies heavily on this dimension. In contrast, it is clear that globallexical activity is not useful in either speeded pronunciation orsemantic classification performance. For example, in the DRC andMROM simulations, global lexical activity drives “word” re-sponses in lexical decision but not pronunciation or perceptualidentification responses (Coltheart et al., 2001; Grainger & Jacobs,1996). The system needs to locate a specific lexical entry beforephonology can be initiated or an impoverished stimulus can beidentified. We argue that this is also the case for the semanticclassification task.
Thus far, we have sought to explain the between-task dissocia-tions primarily in terms of lexical decision’s emphasis on famil-iarity. This, of course, is overly simple. The LDT clearly is not aunitary task and has been likened to a signal-detection task thatmay recruit different types of information depending on the spe-cific nonword context (Seidenberg, 1990). For example, whenorthographically illegal words (e.g., BRNTA) are used as foils,discrimination can be based on orthographic information alone. Incontrast, when orthographically legal words (e.g., BRANT) areused, then either phonological or semantic information needs to beconsulted. Furthermore, Yap et al. (2006) have demonstrated thatfor the same set of high- and low-frequency words, the wordfrequency effect increases as nonword foils become more wordlike(i.e., BRNTA vs. BRANT vs. BRANE), and this Nonword Type �Word Frequency interaction is modulated by different componentsof the RT distribution, depending on the specific nonword contrastbeing examined.
Such findings reinforce the idea that lexical decision perfor-mance for words is strongly modulated by the specific nonwordcontext. It is quite plausible that when foils are very similar to
292 YAP AND BALOTA
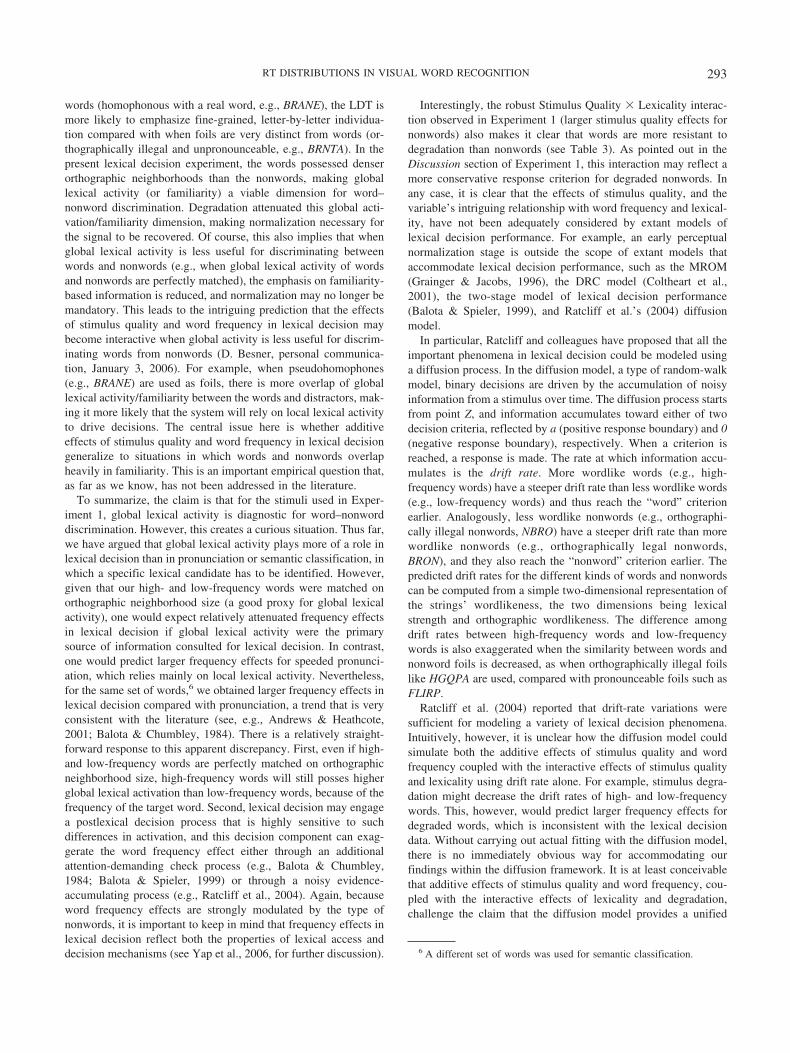
words (homophonous with a real word, e.g., BRANE), the LDT ismore likely to emphasize fine-grained, letter-by-letter individua-tion compared with when foils are very distinct from words (or-thographically illegal and unpronounceable, e.g., BRNTA). In thepresent lexical decision experiment, the words possessed denserorthographic neighborhoods than the nonwords, making globallexical activity (or familiarity) a viable dimension for word–nonword discrimination. Degradation attenuated this global acti-vation/familiarity dimension, making normalization necessary forthe signal to be recovered. Of course, this also implies that whenglobal lexical activity is less useful for discriminating betweenwords and nonwords (e.g., when global lexical activity of wordsand nonwords are perfectly matched), the emphasis on familiarity-based information is reduced, and normalization may no longer bemandatory. This leads to the intriguing prediction that the effectsof stimulus quality and word frequency in lexical decision maybecome interactive when global activity is less useful for discrim-inating words from nonwords (D. Besner, personal communica-tion, January 3, 2006). For example, when pseudohomophones(e.g., BRANE) are used as foils, there is more overlap of globallexical activity/familiarity between the words and distractors, mak-ing it more likely that the system will rely on local lexical activityto drive decisions. The central issue here is whether additiveeffects of stimulus quality and word frequency in lexical decisiongeneralize to situations in which words and nonwords overlapheavily in familiarity. This is an important empirical question that,as far as we know, has not been addressed in the literature.
To summarize, the claim is that for the stimuli used in Exper-iment 1, global lexical activity is diagnostic for word–nonworddiscrimination. However, this creates a curious situation. Thus far,we have argued that global lexical activity plays more of a role inlexical decision than in pronunciation or semantic classification, inwhich a specific lexical candidate has to be identified. However,given that our high- and low-frequency words were matched onorthographic neighborhood size (a good proxy for global lexicalactivity), one would expect relatively attenuated frequency effectsin lexical decision if global lexical activity were the primarysource of information consulted for lexical decision. In contrast,one would predict larger frequency effects for speeded pronunci-ation, which relies mainly on local lexical activity. Nevertheless,for the same set of words,6 we obtained larger frequency effects inlexical decision compared with pronunciation, a trend that is veryconsistent with the literature (see, e.g., Andrews & Heathcote,2001; Balota & Chumbley, 1984). There is a relatively straight-forward response to this apparent discrepancy. First, even if high-and low-frequency words are perfectly matched on orthographicneighborhood size, high-frequency words will still posses higherglobal lexical activation than low-frequency words, because of thefrequency of the target word. Second, lexical decision may engagea postlexical decision process that is highly sensitive to suchdifferences in activation, and this decision component can exag-gerate the word frequency effect either through an additionalattention-demanding check process (e.g., Balota & Chumbley,1984; Balota & Spieler, 1999) or through a noisy evidence-accumulating process (e.g., Ratcliff et al., 2004). Again, becauseword frequency effects are strongly modulated by the type ofnonwords, it is important to keep in mind that frequency effects inlexical decision reflect both the properties of lexical access anddecision mechanisms (see Yap et al., 2006, for further discussion).
Interestingly, the robust Stimulus Quality � Lexicality interac-tion observed in Experiment 1 (larger stimulus quality effects fornonwords) also makes it clear that words are more resistant todegradation than nonwords (see Table 3). As pointed out in theDiscussion section of Experiment 1, this interaction may reflect amore conservative response criterion for degraded nonwords. Inany case, it is clear that the effects of stimulus quality, and thevariable’s intriguing relationship with word frequency and lexical-ity, have not been adequately considered by extant models oflexical decision performance. For example, an early perceptualnormalization stage is outside the scope of extant models thataccommodate lexical decision performance, such as the MROM(Grainger & Jacobs, 1996), the DRC model (Coltheart et al.,2001), the two-stage model of lexical decision performance(Balota & Spieler, 1999), and Ratcliff et al.’s (2004) diffusionmodel.
In particular, Ratcliff and colleagues have proposed that all theimportant phenomena in lexical decision could be modeled usinga diffusion process. In the diffusion model, a type of random-walkmodel, binary decisions are driven by the accumulation of noisyinformation from a stimulus over time. The diffusion process startsfrom point Z, and information accumulates toward either of twodecision criteria, reflected by a (positive response boundary) and 0(negative response boundary), respectively. When a criterion isreached, a response is made. The rate at which information accu-mulates is the drift rate. More wordlike words (e.g., high-frequency words) have a steeper drift rate than less wordlike words(e.g., low-frequency words) and thus reach the “word” criterionearlier. Analogously, less wordlike nonwords (e.g., orthographi-cally illegal nonwords, NBRO) have a steeper drift rate than morewordlike nonwords (e.g., orthographically legal nonwords,BRON), and they also reach the “nonword” criterion earlier. Thepredicted drift rates for the different kinds of words and nonwordscan be computed from a simple two-dimensional representation ofthe strings’ wordlikeness, the two dimensions being lexicalstrength and orthographic wordlikeness. The difference amongdrift rates between high-frequency words and low-frequencywords is also exaggerated when the similarity between words andnonword foils is decreased, as when orthographically illegal foilslike HGQPA are used, compared with pronounceable foils such asFLIRP.
Ratcliff et al. (2004) reported that drift-rate variations weresufficient for modeling a variety of lexical decision phenomena.Intuitively, however, it is unclear how the diffusion model couldsimulate both the additive effects of stimulus quality and wordfrequency coupled with the interactive effects of stimulus qualityand lexicality using drift rate alone. For example, stimulus degra-dation might decrease the drift rates of high- and low-frequencywords. This, however, would predict larger frequency effects fordegraded words, which is inconsistent with the lexical decisiondata. Without carrying out actual fitting with the diffusion model,there is no immediately obvious way for accommodating ourfindings within the diffusion framework. It is at least conceivablethat additive effects of stimulus quality and word frequency, cou-pled with the interactive effects of lexicality and degradation,challenge the claim that the diffusion model provides a unified
6 A different set of words was used for semantic classification.
293RT DISTRIBUTIONS IN VISUAL WORD RECOGNITION
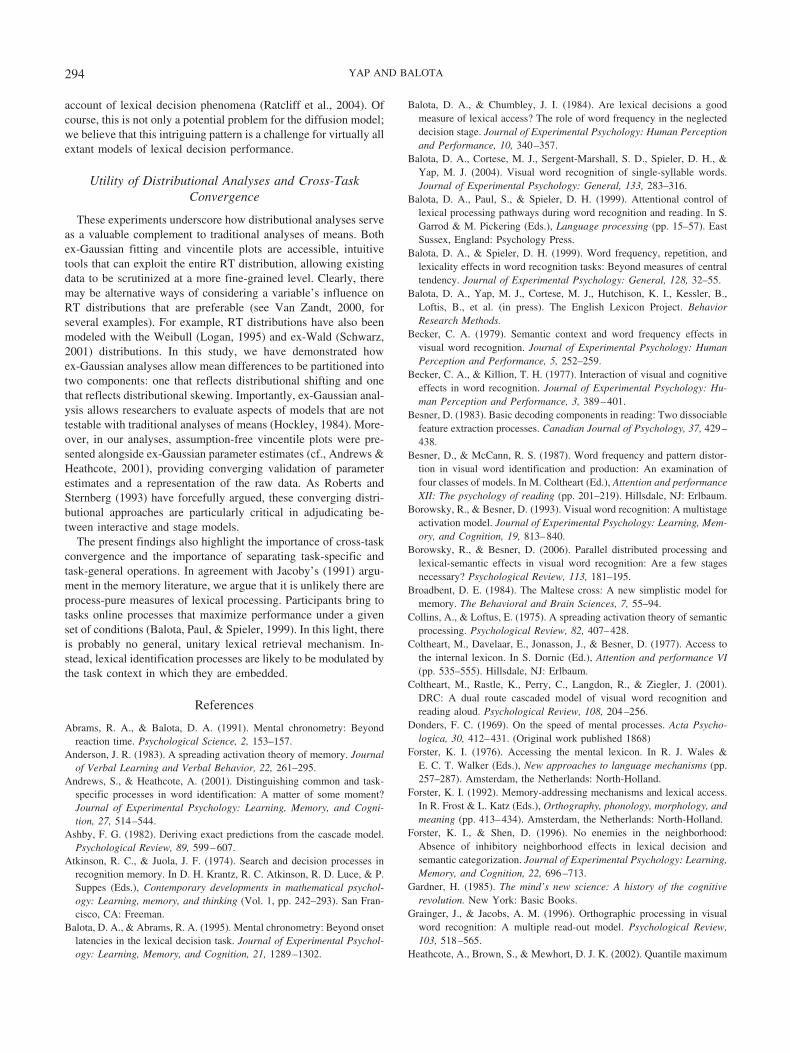
account of lexical decision phenomena (Ratcliff et al., 2004). Ofcourse, this is not only a potential problem for the diffusion model;we believe that this intriguing pattern is a challenge for virtually allextant models of lexical decision performance.
Utility of Distributional Analyses and Cross-TaskConvergence
These experiments underscore how distributional analyses serveas a valuable complement to traditional analyses of means. Bothex-Gaussian fitting and vincentile plots are accessible, intuitivetools that can exploit the entire RT distribution, allowing existingdata to be scrutinized at a more fine-grained level. Clearly, theremay be alternative ways of considering a variable’s influence onRT distributions that are preferable (see Van Zandt, 2000, forseveral examples). For example, RT distributions have also beenmodeled with the Weibull (Logan, 1995) and ex-Wald (Schwarz,2001) distributions. In this study, we have demonstrated howex-Gaussian analyses allow mean differences to be partitioned intotwo components: one that reflects distributional shifting and onethat reflects distributional skewing. Importantly, ex-Gaussian anal-ysis allows researchers to evaluate aspects of models that are nottestable with traditional analyses of means (Hockley, 1984). More-over, in our analyses, assumption-free vincentile plots were pre-sented alongside ex-Gaussian parameter estimates (cf., Andrews &Heathcote, 2001), providing converging validation of parameterestimates and a representation of the raw data. As Roberts andSternberg (1993) have forcefully argued, these converging distri-butional approaches are particularly critical in adjudicating be-tween interactive and stage models.
The present findings also highlight the importance of cross-taskconvergence and the importance of separating task-specific andtask-general operations. In agreement with Jacoby’s (1991) argu-ment in the memory literature, we argue that it is unlikely there areprocess-pure measures of lexical processing. Participants bring totasks online processes that maximize performance under a givenset of conditions (Balota, Paul, & Spieler, 1999). In this light, thereis probably no general, unitary lexical retrieval mechanism. In-stead, lexical identification processes are likely to be modulated bythe task context in which they are embedded.
References
Abrams, R. A., & Balota, D. A. (1991). Mental chronometry: Beyondreaction time. Psychological Science, 2, 153–157.
Anderson, J. R. (1983). A spreading activation theory of memory. Journalof Verbal Learning and Verbal Behavior, 22, 261–295.
Andrews, S., & Heathcote, A. (2001). Distinguishing common and task-specific processes in word identification: A matter of some moment?Journal of Experimental Psychology: Learning, Memory, and Cogni-tion, 27, 514–544.
Ashby, F. G. (1982). Deriving exact predictions from the cascade model.Psychological Review, 89, 599–607.
Atkinson, R. C., & Juola, J. F. (1974). Search and decision processes inrecognition memory. In D. H. Krantz, R. C. Atkinson, R. D. Luce, & P.Suppes (Eds.), Contemporary developments in mathematical psychol-ogy: Learning, memory, and thinking (Vol. 1, pp. 242–293). San Fran-cisco, CA: Freeman.
Balota, D. A., & Abrams, R. A. (1995). Mental chronometry: Beyond onsetlatencies in the lexical decision task. Journal of Experimental Psychol-ogy: Learning, Memory, and Cognition, 21, 1289–1302.
Balota, D. A., & Chumbley, J. I. (1984). Are lexical decisions a goodmeasure of lexical access? The role of word frequency in the neglecteddecision stage. Journal of Experimental Psychology: Human Perceptionand Performance, 10, 340–357.
Balota, D. A., Cortese, M. J., Sergent-Marshall, S. D., Spieler, D. H., &Yap, M. J. (2004). Visual word recognition of single-syllable words.Journal of Experimental Psychology: General, 133, 283–316.
Balota, D. A., Paul, S., & Spieler, D. H. (1999). Attentional control oflexical processing pathways during word recognition and reading. In S.Garrod & M. Pickering (Eds.), Language processing (pp. 15–57). EastSussex, England: Psychology Press.
Balota, D. A., & Spieler, D. H. (1999). Word frequency, repetition, andlexicality effects in word recognition tasks: Beyond measures of centraltendency. Journal of Experimental Psychology: General, 128, 32–55.
Balota, D. A., Yap, M. J., Cortese, M. J., Hutchison, K. I., Kessler, B.,Loftis, B., et al. (in press). The English Lexicon Project. BehaviorResearch Methods.
Becker, C. A. (1979). Semantic context and word frequency effects invisual word recognition. Journal of Experimental Psychology: HumanPerception and Performance, 5, 252–259.
Becker, C. A., & Killion, T. H. (1977). Interaction of visual and cognitiveeffects in word recognition. Journal of Experimental Psychology: Hu-man Perception and Performance, 3, 389–401.
Besner, D. (1983). Basic decoding components in reading: Two dissociablefeature extraction processes. Canadian Journal of Psychology, 37, 429–438.
Besner, D., & McCann, R. S. (1987). Word frequency and pattern distor-tion in visual word identification and production: An examination offour classes of models. In M. Coltheart (Ed.), Attention and performanceXII: The psychology of reading (pp. 201–219). Hillsdale, NJ: Erlbaum.
Borowsky, R., & Besner, D. (1993). Visual word recognition: A multistageactivation model. Journal of Experimental Psychology: Learning, Mem-ory, and Cognition, 19, 813–840.
Borowsky, R., & Besner, D. (2006). Parallel distributed processing andlexical-semantic effects in visual word recognition: Are a few stagesnecessary? Psychological Review, 113, 181–195.
Broadbent, D. E. (1984). The Maltese cross: A new simplistic model formemory. The Behavioral and Brain Sciences, 7, 55–94.
Collins, A., & Loftus, E. (1975). A spreading activation theory of semanticprocessing. Psychological Review, 82, 407–428.
Coltheart, M., Davelaar, E., Jonasson, J., & Besner, D. (1977). Access tothe internal lexicon. In S. Dornic (Ed.), Attention and performance VI(pp. 535–555). Hillsdale, NJ: Erlbaum.
Coltheart, M., Rastle, K., Perry, C., Langdon, R., & Ziegler, J. (2001).DRC: A dual route cascaded model of visual word recognition andreading aloud. Psychological Review, 108, 204–256.
Donders, F. C. (1969). On the speed of mental processes. Acta Psycho-logica, 30, 412–431. (Original work published 1868)
Forster, K. I. (1976). Accessing the mental lexicon. In R. J. Wales &E. C. T. Walker (Eds.), New approaches to language mechanisms (pp.257–287). Amsterdam, the Netherlands: North-Holland.
Forster, K. I. (1992). Memory-addressing mechanisms and lexical access.In R. Frost & L. Katz (Eds.), Orthography, phonology, morphology, andmeaning (pp. 413–434). Amsterdam, the Netherlands: North-Holland.
Forster, K. I., & Shen, D. (1996). No enemies in the neighborhood:Absence of inhibitory neighborhood effects in lexical decision andsemantic categorization. Journal of Experimental Psychology: Learning,Memory, and Cognition, 22, 696–713.
Gardner, H. (1985). The mind’s new science: A history of the cognitiverevolution. New York: Basic Books.
Grainger, J., & Jacobs, A. M. (1996). Orthographic processing in visualword recognition: A multiple read-out model. Psychological Review,103, 518–565.
Heathcote, A., Brown, S., & Mewhort, D. J. K. (2002). Quantile maximum
294 YAP AND BALOTA
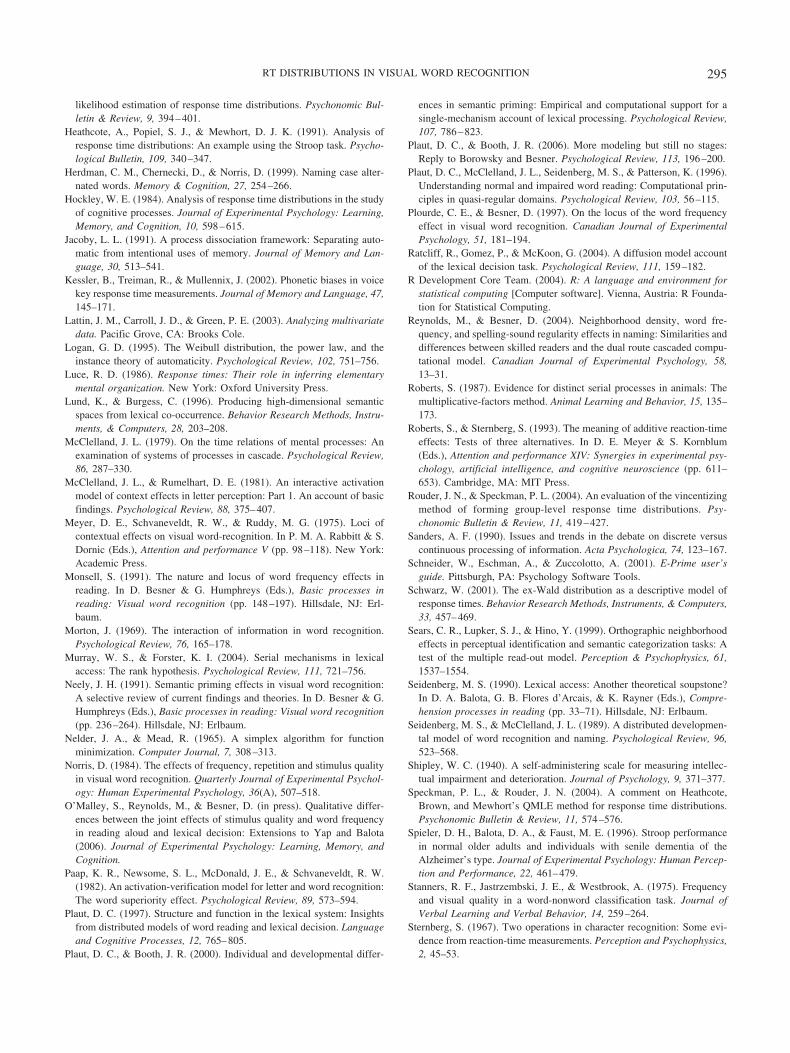
likelihood estimation of response time distributions. Psychonomic Bul-letin & Review, 9, 394–401.
Heathcote, A., Popiel, S. J., & Mewhort, D. J. K. (1991). Analysis ofresponse time distributions: An example using the Stroop task. Psycho-logical Bulletin, 109, 340–347.
Herdman, C. M., Chernecki, D., & Norris, D. (1999). Naming case alter-nated words. Memory & Cognition, 27, 254–266.
Hockley, W. E. (1984). Analysis of response time distributions in the studyof cognitive processes. Journal of Experimental Psychology: Learning,Memory, and Cognition, 10, 598–615.
Jacoby, L. L. (1991). A process dissociation framework: Separating auto-matic from intentional uses of memory. Journal of Memory and Lan-guage, 30, 513–541.
Kessler, B., Treiman, R., & Mullennix, J. (2002). Phonetic biases in voicekey response time measurements. Journal of Memory and Language, 47,145–171.
Lattin, J. M., Carroll, J. D., & Green, P. E. (2003). Analyzing multivariatedata. Pacific Grove, CA: Brooks Cole.
Logan, G. D. (1995). The Weibull distribution, the power law, and theinstance theory of automaticity. Psychological Review, 102, 751–756.
Luce, R. D. (1986). Response times: Their role in inferring elementarymental organization. New York: Oxford University Press.
Lund, K., & Burgess, C. (1996). Producing high-dimensional semanticspaces from lexical co-occurrence. Behavior Research Methods, Instru-ments, & Computers, 28, 203–208.
McClelland, J. L. (1979). On the time relations of mental processes: Anexamination of systems of processes in cascade. Psychological Review,86, 287–330.
McClelland, J. L., & Rumelhart, D. E. (1981). An interactive activationmodel of context effects in letter perception: Part 1. An account of basicfindings. Psychological Review, 88, 375–407.
Meyer, D. E., Schvaneveldt, R. W., & Ruddy, M. G. (1975). Loci ofcontextual effects on visual word-recognition. In P. M. A. Rabbitt & S.Dornic (Eds.), Attention and performance V (pp. 98–118). New York:Academic Press.
Monsell, S. (1991). The nature and locus of word frequency effects inreading. In D. Besner & G. Humphreys (Eds.), Basic processes inreading: Visual word recognition (pp. 148–197). Hillsdale, NJ: Erl-baum.
Morton, J. (1969). The interaction of information in word recognition.Psychological Review, 76, 165–178.
Murray, W. S., & Forster, K. I. (2004). Serial mechanisms in lexicalaccess: The rank hypothesis. Psychological Review, 111, 721–756.
Neely, J. H. (1991). Semantic priming effects in visual word recognition:A selective review of current findings and theories. In D. Besner & G.Humphreys (Eds.), Basic processes in reading: Visual word recognition(pp. 236–264). Hillsdale, NJ: Erlbaum.
Nelder, J. A., & Mead, R. (1965). A simplex algorithm for functionminimization. Computer Journal, 7, 308–313.
Norris, D. (1984). The effects of frequency, repetition and stimulus qualityin visual word recognition. Quarterly Journal of Experimental Psychol-ogy: Human Experimental Psychology, 36(A), 507–518.
O’Malley, S., Reynolds, M., & Besner, D. (in press). Qualitative differ-ences between the joint effects of stimulus quality and word frequencyin reading aloud and lexical decision: Extensions to Yap and Balota(2006). Journal of Experimental Psychology: Learning, Memory, andCognition.
Paap, K. R., Newsome, S. L., McDonald, J. E., & Schvaneveldt, R. W.(1982). An activation-verification model for letter and word recognition:The word superiority effect. Psychological Review, 89, 573–594.
Plaut, D. C. (1997). Structure and function in the lexical system: Insightsfrom distributed models of word reading and lexical decision. Languageand Cognitive Processes, 12, 765–805.
Plaut, D. C., & Booth, J. R. (2000). Individual and developmental differ-
ences in semantic priming: Empirical and computational support for asingle-mechanism account of lexical processing. Psychological Review,107, 786–823.
Plaut, D. C., & Booth, J. R. (2006). More modeling but still no stages:Reply to Borowsky and Besner. Psychological Review, 113, 196–200.
Plaut, D. C., McClelland, J. L., Seidenberg, M. S., & Patterson, K. (1996).Understanding normal and impaired word reading: Computational prin-ciples in quasi-regular domains. Psychological Review, 103, 56–115.
Plourde, C. E., & Besner, D. (1997). On the locus of the word frequencyeffect in visual word recognition. Canadian Journal of ExperimentalPsychology, 51, 181–194.
Ratcliff, R., Gomez, P., & McKoon, G. (2004). A diffusion model accountof the lexical decision task. Psychological Review, 111, 159–182.
R Development Core Team. (2004). R: A language and environment forstatistical computing [Computer software]. Vienna, Austria: R Founda-tion for Statistical Computing.
Reynolds, M., & Besner, D. (2004). Neighborhood density, word fre-quency, and spelling-sound regularity effects in naming: Similarities anddifferences between skilled readers and the dual route cascaded compu-tational model. Canadian Journal of Experimental Psychology, 58,13–31.
Roberts, S. (1987). Evidence for distinct serial processes in animals: Themultiplicative-factors method. Animal Learning and Behavior, 15, 135–173.
Roberts, S., & Sternberg, S. (1993). The meaning of additive reaction-timeeffects: Tests of three alternatives. In D. E. Meyer & S. Kornblum(Eds.), Attention and performance XIV: Synergies in experimental psy-chology, artificial intelligence, and cognitive neuroscience (pp. 611–653). Cambridge, MA: MIT Press.
Rouder, J. N., & Speckman, P. L. (2004). An evaluation of the vincentizingmethod of forming group-level response time distributions. Psy-chonomic Bulletin & Review, 11, 419–427.
Sanders, A. F. (1990). Issues and trends in the debate on discrete versuscontinuous processing of information. Acta Psychologica, 74, 123–167.
Schneider, W., Eschman, A., & Zuccolotto, A. (2001). E-Prime user’sguide. Pittsburgh, PA: Psychology Software Tools.
Schwarz, W. (2001). The ex-Wald distribution as a descriptive model ofresponse times. Behavior Research Methods, Instruments, & Computers,33, 457–469.
Sears, C. R., Lupker, S. J., & Hino, Y. (1999). Orthographic neighborhoodeffects in perceptual identification and semantic categorization tasks: Atest of the multiple read-out model. Perception & Psychophysics, 61,1537–1554.
Seidenberg, M. S. (1990). Lexical access: Another theoretical soupstone?In D. A. Balota, G. B. Flores d’Arcais, & K. Rayner (Eds.), Compre-hension processes in reading (pp. 33–71). Hillsdale, NJ: Erlbaum.
Seidenberg, M. S., & McClelland, J. L. (1989). A distributed developmen-tal model of word recognition and naming. Psychological Review, 96,523–568.
Shipley, W. C. (1940). A self-administering scale for measuring intellec-tual impairment and deterioration. Journal of Psychology, 9, 371–377.
Speckman, P. L., & Rouder, J. N. (2004). A comment on Heathcote,Brown, and Mewhort’s QMLE method for response time distributions.Psychonomic Bulletin & Review, 11, 574–576.
Spieler, D. H., Balota, D. A., & Faust, M. E. (1996). Stroop performancein normal older adults and individuals with senile dementia of theAlzheimer’s type. Journal of Experimental Psychology: Human Percep-tion and Performance, 22, 461–479.
Stanners, R. F., Jastrzembski, J. E., & Westbrook, A. (1975). Frequencyand visual quality in a word-nonword classification task. Journal ofVerbal Learning and Verbal Behavior, 14, 259–264.
Sternberg, S. (1967). Two operations in character recognition: Some evi-dence from reaction-time measurements. Perception and Psychophysics,2, 45–53.
295RT DISTRIBUTIONS IN VISUAL WORD RECOGNITION
Sternberg, S. (1969a). The discovery of processing stages: Extensions ofDonders’ method. Acta Psychologica, 30, 276–315.
Sternberg, S. (1969b). Memory-scanning: Mental processes revealed byreaction-time experiments. American Scientist, 57, 421–457.
Sternberg, S. (1998). Discovering mental processing stages: The method ofadditive factors. In D. Scarborough & S. Sternberg (Eds.), Methods,models, and conceptual issues: An invitation to cognitive science (pp.703–863). Cambridge, MA: MIT Press.
Stolz, J. A., & Neely, J. H. (1995). When target degradation does and doesnot enhance semantic context effects in word recognition. Journal ofExperimental Psychology: Learning, Memory, and Cognition, 21, 596–611.
Townsend, J. T. (1984). Uncovering mental processes with factorial ex-periments. Journal of Mathematical Psychology, 28, 363–400.
Townsend, J. T., & Ashby, F. G. (1983). The stochastic modeling ofelementary psychological processes. London: Cambridge UniversityPress.
Van Zandt, T. (2000). How to fit a response time distribution. PsychonomicBulletin & Review, 7, 424–465.
Vincent, S. B. (1912). The function of vibrissae in the behavior of the whiterat. Behavioral Monographs, 1(Whole No. 5).
Wilding, J. M. (1988). The interaction of word frequency and stimulusquality in the lexical decision task: Now you see it, now you don’t.Quarterly Journal of Experimental Psychology: Human ExperimentalPsychology, 40(A), 757–770.
Yap, M. J., Balota, D. A., Cortese, M. J., & Watson, J. M. (2006). Singleversus dual process models of lexical decision performance: Insightsfrom RT distributional analysis. Journal of Experimental Psychology:Human Perception and Performance, 32, 1324–1344.
Received March 6, 2006Revision received August 7, 2006
Accepted August 10, 2006 �
MAIL TO:Name
Address
City State Zip
APA Member #
Check enclosed (make payable to APA)
Charge my: VISA MasterCard AmericanExpress
Cardholder Name
etaD .pxE.oN draC
Signature (Required for Charge)
BILLING ADDRESS:Street
City State Zip
Daytime Phone
XLMA17
ORDER FORMStart my 2007 subscription to Journal of ExperimentalPsychology: Learning, Memory, and Cognition! ISSN: 0278-7393
___ $148.00, APA MEMBER/AFFILIATE __________ $316.00, INDIVIDUAL NONMEMBER __________ $825.00, INSTITUTION _______
In DC add 5.75% / In MD add 5% sales tax _______TOTAL AMOUNT ENCLOSED $ _______
Subscription orders must be prepaid. (Subscriptions are ona calendar year basis only.) Allow 4-6 weeks for delivery ofthe first issue. Call for international subscription rates.
SEND THIS ORDER FORM TO:American Psychological AssociationSubscriptions750 First Street, NEWashington, DC 20002-4242
Or call 800-374-2721, fax 202-336-5568.TDD/TTY 202-336-6123.For subscription information, e-mail:[email protected]
296 YAP AND BALOTA