admissions processes for dentistry … · nbde national board dental examination ... comments from...
TRANSCRIPT

1
ADMISSIONS PROCESSES FOR DENTISTRY PROGRAMS IN CANADA:
A REPORT FOR
THE CANADIAN DENTAL ASSOCIATION
AND
THE ASSOCIATION OF CANADIAN FACULTIES OF DENTISTRY
ON
CURRENT PRACTICES AND FUTURE DIRECTIONS
PAUL ALLISON, FACULTY OF DENTISTRY, MCGILL UNIVERSITY
BLAINE CLEGHORN, FACULTY OF DENTISTRY, DALHOUSIE UNIVERSITY
JOHN PERRY, FACULTY OF DENTISTRY, UNIVERSITY OF MANITOBA
MAY 2014

2
Acknowledgements
The CDA-ACFD DAT Review Working Group would like to acknowledge the following people and groups:
Marie-Douce Primeau, who performed the review of the literature and drafted the report of that review, which
makes up a very significant element of this report;
Monique Bouchard, who works with the Canadian Dental Association (CDA) and assisted the working group in
organising all interviews and being present during and transcribing and sending transcripts of each interview to
the working group;
The CDA for providing the funds and staff necessary to perform the work;
The Association of Canadian Faculties of Dentistry (ACFD) and CDA for sponsoring and mandating the work; and
All organisations, institutions and individuals involved in the interviews and other data collection.

3
Contents 1 GLOSSARY ........................................................................................................................................................................ 5
2 EXECUTIVE SUMMARY ..................................................................................................................................................... 6
2.1 Project aims .............................................................................................................................................................. 6
2.2 The literature review on validity of admissions processes ....................................................................................... 6
2.3 The results of interviews with stakeholders ............................................................................................................. 7
2.4 Recommendations .................................................................................................................................................... 8
3 WORKING GROUP MANDATE ........................................................................................................................................ 10
3.1 Objectives ............................................................................................................................................................... 10
3.2 Composition and Length of Term ........................................................................................................................... 10
3.3 Meetings ................................................................................................................................................................. 10
3.4 Reporting/Accountability ....................................................................................................................................... 10
3.5 Members................................................................................................................................................................. 10
4 INTRODUCTION ............................................................................................................................................................. 11
5 METHODOLOGY ............................................................................................................................................................. 13
5.1 Data collection ........................................................................................................................................................ 13
5.2 Data analyses .......................................................................................................................................................... 14
5.3 The literature review .............................................................................................................................................. 14
5.3.1 Search method ................................................................................................................................................. 14
5.3.2 Inclusion criteria .............................................................................................................................................. 14
5.3.3 Concept definition ........................................................................................................................................... 15
5.3.4 Validity ............................................................................................................................................................. 15
5.3.5 Reliability ......................................................................................................................................................... 16
5.3.6 Potential biases associated with the selection tools application processes ................................................... 17
5.3.7 Issues deriving from the selection tools admission processes ........................................................................ 17
6 Results ............................................................................................................................................................................ 18
6.1 Description of admission tools being currently used by Canadian dental schools ................................................ 18
6.2. Results of semi-structured interviews ................................................................................................................... 19
6.2.1 Dental Aptitude Test ........................................................................................................................................ 19
6.2.2 Grade Point Average ........................................................................................................................................ 22
6.2.3 Interviews ........................................................................................................................................................ 23
6.2.4 Letters of Reference ........................................................................................................................................ 26
6.2.5 Personal Statements/CVs ................................................................................................................................ 27

4
6.2.6 NEO-PI-R Personality Inventory Test ............................................................................................................... 27
6.3 Literature review results ......................................................................................................................................... 27
6.3.1 Academic and cognitive assessment tools ................................................................................................... 28
6.3.2 Non-cognitive assessment tools ...................................................................................................................... 42
6.3.2.2 Manual dexterity tests .................................................................................................................................. 47
6.3.3 Scalability potential and hypothetical biases that might impact student diversity ........................................ 55
6.3.4 Student diversity .............................................................................................................................................. 55
6.3.5 What can be learned from other disciplines ................................................................................................... 59
7 Discussion ...................................................................................................................................................................... 65
8 Recommendations ......................................................................................................................................................... 66
9 References ..................................................................................................................................................................... 68
10 Appendices .................................................................................................................................................................. 74
Appendix A .................................................................................................................................................................... 75
Appendix B .................................................................................................................................................................... 80
Appendix C .................................................................................................................................................................... 81
Appendix D ................................................................................................................................................................... 83

5
1 GLOSSARY ACFD Association of Canadian Faculties of Dentistry ADA American Dental Association AL Accuracy Left ASE Anatomical Self-Efficacy CAS Confirmation of Acceptance for Study CDA Canadian Dental Association CDS Computer-assisted Dental Simulation CEGEP Collège d'enseignement général et professionnel (General and Vocational College) CI Confidence Interval CMSENS Computer-based Multiple Sample Evaluation of Skills CRDTS Central Regional Dental Testing Service CVR Content Validity Ratio DAT Dental Aptitude Test (Canada) or Dental Admission Test (US) DAT-AA DAT-Academic Average DAT-BIO DAT-Biology DAT-CD DAT-Carving Dexterity DAT-DT DAT Dexterity Test DAT-OC DAT-Organic Chemistry DAT-PAT DAT-Perceptual Ability Test DAT-QR DAT-Quantitative Reasoning DAT-RC DAT-Reading Comprehension DAT-SNS DAT-Survey of Natural Sciences DEET Dental Education Eligibility Test DSM-III Diagnostic and Statistical Manual of Mental Disorders ECI Emotional Competence Inventory EI Emotional Intelligence GAMSAT Graduate Australian Medical School Admission Test GPA Grade Point Average HDS Hogan’s Development Survey IRT Item Response Theory MBTI Myer-Briggs Type Indicators MCAT Medical College Admission Test MIST-VR Minimally Invasive Surgical Trainer – Virtual Reality MMI Multiple Mini Interview NBDE National Board Dental Examination NBDHE National Board Dental Hygiene Examination NEO-PI-R NEO-Personality Inventory - Revised NS Non-significant OR Odds Ratio OSCE Objective Structured Clinical Examination SD Standard Deviation SJT Situational Judgement Test TL Time Left TXAD Treatment of Active Diseases (class) URM Underrepresented Minority USMLE United States Medical Licensing Examination

6
2 EXECUTIVE SUMMARY
2.1 Project aims
Given the mandate for the working group, we identified the following aims as a means to direct our work. We aimed
to:
Describe the admissions processes used for the dentistry programs in each dental school in Canada;
Describe the problems and potential solutions and issues people working in Canadian dental schools have
identified in relation to the current admissions processes for dentistry programs;
Describe the problems and other issues people in the broader dental profession identify in relation to admissions
to dentistry programs in Canada;
Describe the research literature concerning the validity and reliability of various instruments and processes used
in admissions to dentistry programs;
Where relevant, compare this literature with that from medicine and nursing and veterinary medicine;
Draw conclusions concerning the quality of the admissions instruments and processes currently used for dentistry
programs in Canada; and
Make recommendations concerning possible future means to ensure high quality admissions processes are used
for dentistry programs in Canada.
With these aims in mind, working group members decided to use a mixed methods approach to address them. The
approach included a review of the relevant literature and interviews with admissions personnel at all Canadian dental
schools, plus interviews with some national dental organizations in Canada and the USA.
2.2 The literature review on validity of admissions processes After reviewing the literature and evaluating potential assessment tools used during the dental school admission
process, we found that some DAT components (mainly DAT-AA [academic average], DAT-QR [quantitative reasoning]
and DAT-RC [reading comprehension]) and Pre-dental Overall GPA and Science GPA scores represent the best
predictors of academic performance of dental students. Also they have some correlation with clinical and board
examination performance, although the strength of these relationships is only weak to moderate. Some questions
remain concerning the concurrent validity of the DAT-PAT (perceptual ability test), since its results were not
compared with those of any other forms of perceptual ability assessment. Our results also suggest that combining
cognitive assessment tools together but also with non-cognitive assessment tools considerably increases their
predictive validity. The debate still remains regarding which non-cognitive tools to use.
Interviews remain a popular way to assess non-cognitive and personality traits. Our findings show that increasing the
structure of the interview, whether it is through a structured or MMI (Multiple Mini Interview) format, drastically
increases its reliability and validity. As for comparing MMI and structured interviews, our findings seem to indicate
that MMI have a slightly higher reliability, although more research is needed to be able to arrive at more definite
results.
Manual dexterity test were found to have null to weak predictive validity on student performance. That being said,
manual dexterity may be utilized as a screening tool in admissions and has been shown in the past to reduce attrition
rates in dental school.

7
With respect to the quality of the validity testing for admissions processes, many aspects have to be investigated. Yet,
most of the reviewed articles only focused on predictive and convergent/divergent validity, and to a lesser extent, on
concurrent validity. Face, construct and content validities of the selection tools were only assessed in the case of
MMI. Concerning the reliability, this aspect was only addressed by a few studies pertaining to manual dexterity tests
(tweezers, computer-assisted dental simulation) and structured interviews. Therefore, based on this review, there are
still many areas that need to be explored before any well-informed statement upon the validity and reliability of
selection tools can be made. As for other limits of the articles reviewed, most of the results were based on
correlations and/or descriptive statistical analyses, so inferences and conclusions can only be very limited.
When it came to achieving greater student diversity, our findings suggest that students of diverse backgrounds (e.g.
rural or racial minorities) are not disadvantaged by the selection tools currently used in the dental admission
processes. Therefore, other initiatives such as under-represented minorities recruitment and pipeline-type programs
must be implemented if universities want to achieve greater student diversity. Our literature review suggested
different possible avenues to achieve this goal.
2.3 The results of interviews with stakeholders
Most of the Canadian admissions officers agreed that there is value in having a battery of national, standardized
admissions tests to choose from to assess cognitive ability, non-cognitive attributes and psychomotor skills. Used in
conjunction with the GPA, a national standardized series of tests would address the concerns raised about GPA.
These included: i) grade inflation in some courses within an institution; ii) grade variation by different instructors in
the same course in a given institution; iii) variation in GPAs across institutions; and iv) grade variation across
programs (e.g. Engineering versus a General Science program)
On the other hand, the Admissions Officers commented that the current test components of the Canadian DAT have
some problems that need to be addressed:
The Survey of Natural Sciences does not appear to be at the appropriate level to assess the CEGEP (Collège
d'enseignement général et professionnel or General and Vocational College) students that apply to the three
Quebec dental schools. The standardized test battery that provides the benefits stated above are offset if all ten
dental schools cannot use them;
Another important problem is that the Reading Comprehension Test is only available in English. A national test
battery must be available and accessible for students applying at all ten dental schools in both English and
French;
The validity and reliability of the DAT test components are not being evaluated at all by the current CDA
Admissions Committee. The only current statistical data available is from the ADA Department of Testing
Services. Since the Canadian and US DAT test components are different, no analysis is being performed on the
Manual Dexterity Test (DAT-CD).
Concern was expressed regarding the limited mandate of the CDA Dental Aptitude Test Sub-Committee. The CDA
develops and makes available the DAT and CDA Structured Interview to the dental schools. It has a process to grade
the Manual Dexterity Test. However, assessment of the validity and reliability of these tests through the CDA does
not occur. Comments from the admissions officers indicated that they tended to attempt to assess various
admissions tools at a local level (Faculty Admissions Committee level). This is a direct result of the limitations in the
mandate and funding of the current CDA Dental Aptitude Test Sub-Committee. Assessment of non-cognitive
8
attributes in the admissions process was desired by all of the admissions officers. In the absence of a national
Committee with the mandate to assess new admissions tools to assess non-cognitive attributes among others,
individual schools tend to work in a vacuum. This is not cost-effective or efficient, and does not allow for the
collection of data to improve research on admission tool use.
2.4 Recommendations
Based on the findings of the literature review and interviews, the working group makes the following
recommendations:
1. The current CDA Dental Aptitude Test Sub-Committee should be replaced by a national Admissions Committee
jointly administered by the CDA and the ACFD. The membership of the new Admissions Committee should
include:
admissions officers from each of the 10 dental schools
individuals with expertise in admissions and relevant research
individuals with expertise in assessing the validity and reliability of admissions tools
individuals with expertise in generating items, scenarios and elements of non-cognitive tests (e.g. MMIs and
structured interviews)
administrative support
2. The mandate of the new national Admissions Committee needs to be broadened to include the following
functions:
Development of guidelines concerning overall student selection and admissions processes (i.e. beyond simply
oversight of the DAT);
Development of guidelines on the use of specific tools and processes to ensure they are used appropriately
e.g. cut-off scores, use for screening etc.;
Training on the use of admissions tools;
Development of elements of tests and processes (e.g. questions for structured interviews or scenarios for
MMI’s); and
Oversight of evaluating the validity of admissions tools and processes.
3. The new national Admissions Committee needs to be appropriately funded to enable the performance of the
expanded mandate outlined above.
4. All admissions tools that the new national Admissions Committee recommends to the schools for consideration in
their admissions processes:
must be available in both English and French
must be at an appropriate academic level to be able to be administered to all applicants to dental programs
in Canada, specifically to have a level playing field for University-based and CEGEP-based applicants
5. Efforts to investigate validation of tests should focus on those showing promise:
DAT-AA (Academic Average), DAT-QR (Quantitative Reasoning), DAT-RC (Reading Comprehension);
Overall predental GPA, Science GPA;
MMI, structured interviews; and
Combinations.
6. As the DAT-CD (Manual Dexterity Test) is currently being used by seven of the ten dental schools in Canada,
evaluation of the validity and reliability of this admission test component needs to be undertaken, including its
most appropriate use.

9
7. Efforts should be made by dental schools to focus their admissions processes on tools with the strongest
evidence to support them, while ceasing the use of approaches that have little evidence to support them and/or
with evidence that shows the tools are not effective in the admissions process.
8. Efforts should be focused on the recruitment of appropriate candidates as well as the processes used to select
them.
10
3 WORKING GROUP MANDATE To provide advice to the Canadian Dental Association (CDA) Board of Directors and Association of Canadian Faculties
of Dentistry (ACFD) on all aspects of the DAT program and broader admissions processes, and propose changes
required to enhance their value in the student selection process.
3.1 Objectives
1. To review the current DAT and evaluate the validity and reliability of its current components.
2. To identify other selection tools that could provide information for the admissions process at Canadian dental
schools.
3. To identify issues related to use of the DAT and other selection tools in the admissions process at Canadian Dental
Schools and propose potential solutions.
4. To identify opportunities for collaboration between dental schools, CDA and other stakeholders to enhance the
admissions process.
3.2 Composition and Length of Term The Working Group will be composed of up to three members recommended by ACFD. These members are expected
to serve for the duration of the mandate of the working group.
3.3 Meetings
The working group will meet as needed for the accomplishment of its mandate both in person and electronically.
Given the budgetary implications for CDA, in-person meetings will be approved in advance by CDA.
3.4 Reporting/Accountability
The Working Group will present its final report to the CDA Board of Directors and to ACFD no later than 24 months
after the appointment of its members.
3.5 Members
Paul Allison, Faculty of Dentistry, McGill University (Chair)
Blaine Cleghorn, Faculty of Dentistry, Dalhousie University
John Perry, Faculty of Dentistry, University of Manitoba

11
4 INTRODUCTION
In recent years, there have been increasing questions concerning the admissions process for dentistry programs
among Canadian dental schools and elsewhere in the world. This questioning has arisen as society and the health
professions have focused on issues of ethics and professionalism. With increasing media attention on ethics and
professional behavior in government, leadership roles and the professions, attention has begun to focus on how the
profession of dentistry can maintain the highest standards of ethics and professionalism. One of those means is to
focus on who becomes a dentist, how they are being chosen to become dentists and how we are training them.
As part of this questioning of the big picture, academics at Canadian dental schools are also making the observation
that they regularly have problems with a small proportion of trainees’ ethical and professional behavior. That is,
Canadian dental schools regularly have a small proportion of dental students behaving unethically or
unprofessionally, and while the vast majority of these behaviours are dealt with and not repeated, there is a very
small number of trainees whose behavior remains unchanged. These trainees present multiple problems in terms of
evaluation and remediation in dental school. However, it has also been observed in medical programs that those
individuals with multiple unethical or unprofessional behaviours are more likely to become those with disciplinary
problems with licensing bodies once they graduate (1). Given these observations, those involved in the selection and
admission of students for dentistry programs in Canada are keen to identify valid instruments and/or processes to
identify candidates with strong ethical and professional principles and characteristics likely to promote empathetic
and socially responsible behaviours. Thus, there is a strong desire to identify valid indicators of non-cognitive
attribute that are desired in a dentist, while at the same time identifying candidates whose behaviour and approach
suggests they would not make good health professionals.
On top of this, and for further information on the context in which this report is prepared, there is an increasing
recognition in the dental professions in Canada of the difficulties certain underprivileged groups in Canada have
accessing dental care. With this, there is a focus on how we can begin to deal with these issues of access in terms of
recruiting people into the profession who are more likely to be interested in caring for such groups, and training
students to work with people with underprivileged backgrounds and to provide dental care in non-conventional
settings (e.g. using mobile dental care units). In recent years, in the USA, the Dental Pipeline Program has been
running with the goal of recruiting and selecting more diverse and under-represented minority groups into dental
programs, as well as providing students with more diverse community experiences (2). The ultimate goal is to use
these recruitment and training strategies to begin to address the problems of access to dental care observed in the
USA, and which are mirrored in Canada.
Finally, and more specific to the admissions process for dentistry programs in Canada, there has been an increasing
questioning of the value of the Dental Aptitude Test (DAT) as a whole or parts of the test (e.g. the manual dexterity
test) as a means to help select candidates for dentistry programs. As will be documented in this report, and is widely
known, there is significant variety in the sections of the DAT used and the way in which the DAT scores are used in
the admissions process among Canadian dental schools.
In summary therefore, there are several core issues driving the need for a review of admissions procedures for
Canadian dentistry programs:

12
there are societal level questions concerning the ethics and professionalism of many people with leadership and
professional roles in society, including dentists;
there is a strong desire to find instruments and/or processes that can be used in the selection of students to
identify those with the non-cognitive attributes to make a good dentist, while at the same time identifying those
whose non-cognitive behaviours would mean they are unlikely to be good dentists;
there is an increasing recognition in the dental professions and certain sectors of society of the problems of
access to dental care for underprivileged groups in Canada, and that selecting students for dental programs from
more diverse and under-represented groups in the Canadian population may make a contribution to improving
access to dental care for marginalized groups;
there is a recognition within dental, and other health professional schools that there is a very small number of
dental students regularly behaving unethically or unprofessionally and evaluating and remediating these
individuals is problematic; and
there is questioning within dental schools in Canada of the value of the DAT and its parts in the dental student
selection process.
With these issues in mind, it is important to understand the framework into which the admissions process fits.
Canadian society desires dentists who are competent to provide high quality oral health care throughout their
careers. To achieve this, the process involves the recruitment, selection and admission of excellent trainees, their
training in the undergraduate dentistry program, their graduation and licensing, and their continuing professional
development during their careers. It is important to understand that the subject of this report (the tests and
processes used to select dentistry students) is just one part of the process in the creation of dentists who are
competent to provide high quality oral health care throughout their careers.
With this rationale in mind, in January 2012, the Canadian Dental Association (CDA), which runs the DAT, and the
Association of Canadian Faculties of Dentistry (ACFD) set up a working group to look into the issues described in the
mandate (see previous section), asking the working group members to prepare a report for the spring of 2014. This
report is the product of the work performed by the working group.

13
5 METHODOLOGY
Given the aforementioned mandate for the working group, we identified the following aims as a means to direct our
work. We aimed to:
Describe the admissions processes used for the dentistry programs in each dental school in Canada;
Describe the problems and potential solutions and issues people working in Canadian dental schools have
identified in relation to the current admissions processes for dentistry programs;
Describe the problems and other issues people in the broader dental profession identify in relation to admissions
to dentistry programs in Canada;
Describe the research literature concerning the validity and reliability of various instruments and processes used
in admissions to dentistry programs;
Where relevant, compare this literature with that from medicine, nursing and veterinary medicine;
Draw conclusions concerning the quality of the admissions instruments and processes currently used for dentistry
programs in Canada; and
Make recommendations concerning possible future means to ensure high quality admissions processes are used
for dentistry programs in Canada.
With these aims in mind, working group members decided to use a mixed methods approach to address them. The
approach included a review of the relevant literature and two data gathering and two data analytic phases. The
methods for each of these phases are described below.
5.1 Data collection
The questionnaire in Appendix A was sent by e-mail to the Chair/Director of Admissions for the dentistry program of
each dental school in Canada. They were asked to complete the questionnaire electronically and return it, again by e-
mail. This process occurred during April-June of 2012.
Following this, qualitative interviews were performed with two representatives of each dental school using the
questions in Appendix B as a basis for each interview. Invitations to participate in these interviews were sent to the
Dean of each dental school requesting the names of two participants of their choice to be interviewed. In addition,
invitations were sent to the following organizations to participate in similar qualitative interviews, the outlines of
which are shown in Appendix C:
American Dental Association (ADA)
American Dental Education Association (ADEA)
Association of Canadian Faculties of Dentistry (ACFD)
Canadian Dental Association (CDA)
Canadian Dental Regulatory Authorities Federation (CDRAF)
Commission on Dental Accreditation of Canada (CDAC)
National Dental Examining Board (NDEB)
All participants were provided with the respective interview outlines (Appendices B and C) ahead of time. All these
interviews were performed by telephone. Interviewers were always two or three members of the working group. At
the beginning of each interview, participants from the dental schools and organizations were told that the interviews
14
would be recorded, that data would be reported anonymously with respect to participating individuals and
organizations and that the only people with access to these data were the three members of the working group, plus
an assistant loaned for the project by the CDA. All interviews lasted approximately 30-60 minutes and were recorded
and transcribed by the assistant. Transcripts were returned to interviewees for verification and then kept by the
working group members for analyses.
Consent for these data collection processes was not explicitly gathered but was implicitly understood as the dental
schools and organizations’ leaders and the individual participants all agreed to participate knowing the process
described above.
5.2 Data analyses
The questionnaire data were used to generate a purely descriptive summary of the tests and processes used for
admission to the 10 dentistry programs across Canada. Results of that process are shown in Tables 2 and 3 and the
accompanying text (page 20).
Data gathered through the qualitative interviews were analyzed independently by two members of the working
group to generate themes. These themes were then cross-checked to identify common themes, which were then
used as a means to describe the data.
5.3 The literature review
This literature review focused on four main points:
a) It updates and compiles recent findings on the validity and reliability of the tests used in the admissions processes
of dentistry programs in Canada;
b) It identifies biases and issues associated with these tools;
c) It examines how these tools should be used to attain optimal results; and
d) It expands the review to related fields such as medical, veterinary and advanced nursing studies to identify
additional potential assessment tools that might be transferable to dental schools admissions processes.
5.3.1 Search method
To ensure rigour, our approach to this literature review is based on the “Five Stages of Integrative Research Review”
by Cooper (3). Based on their relevance, three databases were identified: Web of Science (January 2007 – June
2013), FRANCIS (2007 – 2013) and Medline (January 2007 – June 2013). The keywords, used in combination in the
English databases, were: “Dental” and “Admission”; “Medical” and “Admission,” “Dental school” and “Selection”, and
finally “Medical school” and “Selection”. The keywords used in the French database were “Médecine” and/or
“Dentaire”, “École” and “Admission”. Once the duplicates were rejected, the search resulted in 3,786 potential
references.
5.3.2 Inclusion criteria
Of the 3,786 references found through the databases search results, all documents whose title suggested that they
pertained to selection tools used in high stakes and schools’ admissions settings were selected. This resulted in 474
papers being identified for further analysis, and the elimination of 3,312 references. Then, a list of inclusion criteria
was developed to further screen the articles. These inclusion criteria were that the paper:
a) must be either a literature review, a meta-analysis or an empirical study; b) must be published in a peer-reviewed journal;

15
c) must be published in French, English or Spanish; and d) must be related to either Medical school, Dental school, Veterinary school, or Advanced Nursing school selection
tools or processes. This second screening stage reduced the number of articles to 181, the others having been rejected because the
selection tools or processes assessed by the authors were either not related or not transferable to dental schools
settings (n=290), or because of the language of the article (German n=2; Arabic=1). The literature relating to dental
schools’ admission selection tools and processes (n=34) were then extracted from the rest (n=143). The bibliography
of the documents selected was examined, and two additional articles relating to dental schools’ admissions processes
were consulted. Both of these articles were selected for this review. Out of the 183 articles, 36 related to dental
schools’ admissions procedures and tools: 24 were taken from Medline, 12 from Web of Science and none were
taken from FRANCIS. The rest of the articles were assessed either a) to provide an insight to the validity, reliability
and impact of the different non-cognitive ability assessment tools used in other fields during the admissions process,
especially when few to none of the articles relating to the dental field addressed this criteria in question, and b) to
broaden the search for new potential assessment tools that might be useful to dental schools’ admissions
committees. The results of this broadened search are presented in the last section of the review. Since none of the
articles selected pertained to the Dental Aptitude Test (DAT) manual dexterity test (DAT-DT), a complimentary search
was conducted using the same database, with the keywords “DAT”, “Carving test” and “Manual dexterity”, without
time limits. This search resulted in only one reference, a literature review (4). After examining the article’s
bibliography and “quoted by” list, four other articles were found to pertain to manual dexterity tests - two of them
pertaining to the DAT-DT, for a total of five articles. These articles will be reviewed in the section “non-cognitive
selection tools”, under “manual dexterity assessment”.
5.3.3 Concept definition
Of the articles reviewed, multiple criteria were used to evaluate the quality and value of the assessment tools used in
dental and medical schools admissions’ process. This is not only true for empirical articles, but also for the literature
reviews and meta-analyses that attempted to make sense of the different individual findings. In their systematic
review of the situational judgment test assessment of non-academic attributes in medical school students, Patterson
et al. (5) based their assessment on three criteria: reliability, predictive validity, and incremental validity of the
measurement’s instrument. Koenig et al. (6) used the following eight criteria in evaluating six judgment and non-
cognitive tools used in medical school students’ selection: validity, reliability, group differences, susceptibility to
faking and coaching, applicant reactions, user reactions, cost/resource utilization, and scalability for use in pre-
interview screening. After consideration, four evaluation criteria were chosen, as we believe they encompass all
others. Two of them (validity and reliability) pertain to the assessment of the selection tool itself, while the other two
derive from the selection tool evaluation - its possible biases - and the implementation process - the issues relating to
the admissions process. An instrument’s initial purpose must be taken into account in any measurement validity
assessment, especially when evaluating predictive validity. Therefore, a description of the different selection tools
and their purpose will be provided at the beginning of each sub-section. A definition of all four criteria follows.
5.3.4 Validity
An instrument’s validity relates to its ability to accurately measure what it is supposed to measure (7). Although
researchers agree on most terms, describing the different types of validity when it comes to measurement
instruments, their typologies of the different validities greatly differ. Drawing on the evaluation of field-specialized
literature, we opted for three types of validity of measure classification: content, criterion and construct validities
(see Table 1).

16
Content validity is “the extent to which a test or assessment matches the real requirements” in the opinion of a panel
of experts (8) such as the measure of content validity through Lawshe’s Content Validity Ratio (CVR).
Criterion validity can be defined as an instrument’s ability to predict or estimate the outcomes (9). There are two
kinds of criterion validity: predictive and concurrent validity. Predictive validity refers to an instrument’s ability to
predict a desired outcome, while concurrent validity is the instrument’s ability to distinguish the difference between
two groups that it should distinguish between (7).
Construct validity is an instrument’s ability to assess which constructs are responsible for the variation in test
performances (10). The main approaches to determine construct validity are either demonstrating face validity, or
establishing convergent validity (7). Face validity should be understood as the perception of the different parties
involved - in this case, raters and users - of the correspondence between what the instrument is supposed to
measure and what it actually measures (11). The introduction of an assessment tool perceived to be unfit is unlikely.
Therefore, face validity will have a strong influence on acceptance.
As for convergent validity, it can be established either through a trait validation approach (i.e. comparing the results
to those of another valid and reliable tool assessing the same construct), a multi-method multi-trait approach or a
nomologic approach (7).
Table 1 shows the main validity types that will be explored for each assessment instrument in this literature review.
Table 1: Measure Instrument’s Validity
1. Content validity 2. Criterion validity 2.1 Predictive validity
2.2 Concurrent validity 3. Construct validity 3.1 Face validity 3.1.1 Applicants
3.1.2 Examiners 3.2 Convergent validity 3.2.1 Trait validation approach
3.2.2 Multi-method multi-trait validation approach 3.2.3 Nomologic approach
In assessing validity, a common analytic technique is correlation. Correlation coefficients (r) reported in this literature
review were interpreted using the following guideline (12):
-1.0 to -0.7 strong negative association;
-0.7 to -0.3 negative association;
-0.3 to +0.3 little or no association;
+0.3 to +0.7 positive association; and
0.7 to 1.0 strong positive association.
5.3.5 Reliability
Reliability should be understood as the degree to which the results of a measurement tool or process can be
reproduced (8). There are three ways to assess reliability in the context of admission selection tools: through intra-

17
rater reliability (or test-retest reliability), which is the reproducibility of an evaluation result with the same person
evaluating the same thing more than once; through inter-rater reliability, which is the reproducibility of an evaluation
result with different people evaluating the same thing; and through internal consistency (i.e. Cronbach alpha or
Kappa coefficient) (13), which is the correlation of different elements of the same test. All together, these three
measures allow us to assess a selection tool’s reliability.
5.3.6 Potential biases associated with the selection tools application processes
Many variables may influence the validity of an evaluation process. Regarding selection tools, potential sources of
biases include, for internal validity, the testing effect, and the experimenter biases; and for external validity, the
subjects’ hypotheses, and the experimenter expectancies biases. The probability of the occurrence of these four
possible biases on the validity of dental admissions processes is explored through this literature review.
5.3.7 Issues deriving from the selection tools admission processes
Two main issues can potentially derive from the implementation of selection tools, namely: the scalability potential of
selection tools, and the impact of these tools on student diversity.
Scalability potential
Derived from a computer process, the term scalability refers to the ability of an assessment tool to vary its size,
performance and number of users without affecting its measurement abilities. Therefore, this criterion will
encompass all the considerations regarding financial and resources costs (human, temporal and material), as well as
other considerations that they might hinder.
Impact on student diversity
Recent studies have found that the presence of minority healthcare professionals and dentists helps increase access
to care (14). It is therefore not surprising that consideration on how to improve student diversity has been expressed
by Canadian dental schools. In this literature review, diversity was defined in many ways. While some studies
conceptualize diversity essentially in an ethnic perspective (12), others define it more broadly to include “not only
ethnic background, but also rural origin; gender; first generation; and other personal life experiences through work,
volunteer activities, leadership in extracurricular activities, etc.” (15). This analysis will concentrate on five levels of
student diversity, namely: age group diversity, gender diversity, ethnic/racial diversity, socio-economic diversity and
geographical diversity (rural/urban communities).

18
6 Results
6.1 Description of admission tools being currently used by Canadian dental schools
While there has been a great emphasis in the literature on the importance of non-cognitive abilities in dentistry, in practice, Canadian dental school admission decisions still rely mostly on academic and cognitive criteria. A student’s GPA/academic records are central criteria of all ten Canadian dental school selection processes and range from 33.3% to 100% of the dental school’s admission decisions (see Table 2). Nine of the Canadian universities also base their admission decisions on the Dental Aptitude Test (DAT) scores, which range from 10% to 45-50% of their decision, while another university uses the DAT as a screening tool. Five universities use the DAT-Academic Average (DAT-AA) scores, four use the DAT-Reading comprehension (DAT-RC) scores, one the DAT-Survey of Natural Science (DAT-SNS) scores, eight the DAT-Perceptual Ability Test (DAT-PAT) scores, and seven the DAT-Manual Dexterity (DAT-MD) scores in their admission decision processes.
*Weighting not made public **One school commented “if low, may reject”
The use of non-cognitive admission tools by Canadian universities is far less homogenous. The selection tools most
commonly used in the 2011-2012 dental school admission processes were: the Structured interview (seven
Table 2: Summary of Canadian dental schools’ admission criteria, 2011-2012
Academic performance and cognitive ability assessment Non-cognitive ability assessment
University GPA/
Academic
record
Dental
Dental Aptitude Test (DAT)
NEO-PI-R Ref.
letter
Personal
state-
ment
Un-
structured
interview
Structured
interview
PBL
eval’n
CV Personal
inventory
Used? DAT-AA DAT-RC DAT-NS DAT-PA DAT-CD
Dental School
1
Yes (50%) Yes
(25%)
- Yes - Yes Yes - - Yes (*) - Yes (25%) - - -
Dental School
2
Yes (*) Yes (*) Yes - - Yes Yes - Yes (*) Yes (*) - Yes (*) Yes (*) - -
Dental School
3
Yes
(45-50%)
Yes
(45-
50%)
- Yes Yes Yes Yes - - - - - - - Yes
(0-5%)
Dental School
4
Yes (80%) Yes (*) - - - Yes Yes - - - - Yes (20%) - - -
Dental School
5
Yes (33%) Yes (33
%)
Yes - - Yes Yes - - - - Yes
(33%)
- - -
Dental School
6
Yes (*) No - - - - - - Yes (*) Yes (*) Yes (*) - - Yes
(*)
-
Dental School
7
Yes (100%) Yes
(pass
or fail)
- - - Yes Yes - - Yes (pass
or fail)
- Perhaps - - -
Dental School
8
Yes (65%) Yes
(15%)
Yes Yes - Yes Yes - - - - Yes (20%) - - -
Dental School
9
Yes (60%) Yes
(10%)
Yes - - Yes - Yes (15%) - - - Yes (15%) - - -
Dental School
10
Yes (60%) Yes
(15%)
Yes Yes - - - - - - - Yes (25%) - - -
Schools
Using Tool
10 9 5 4 1 8 7 1 2 4 1 8 1 1 1
Schools
using
Percentage
Weight
8 6 5 4 1 8 6 1 2 3 1 8 1 1 1
Schools
using
Minimum
Cut Score
0 0 1 3 0 4 5 0 0 1 0 0 0 0 0
Cut Score 19 15-
18**
10-15 3-15

19
universities, accounting for 15% to 33.3% of the total decision score), the personal statement analysis (four
universities), and, to a lesser extent, the reference letter (two universities), the NEO-PI-R (one university), the
unstructured interview (one university), the personal inventory (one university), the curriculum vitae (one university),
and a problem-based learning evaluation (one university).
6.2. Results of semi-structured interviews
As described in section 5.1, using the interview guides in Appendices B and C, we performed a series of semi-
structured interviews with personnel from all Canadian dental schools, plus several national dental organisations in
Canada and the USA. All 10 Canadian dental schools and five of the seven organisations invited participated. The
observations were made from these interviews are described in sections below categorized by admissions test type.
6.2.1 Dental Aptitude Test
The DAT is second only to the GPA as the most commonly used admissions tool for Canadian Faculties of Dentistry.
One or more of the DAT test components is used by 9 of the 10 dental schools (see Table 2). One dental school does
not use any components of the DAT in their admissions process as they feel it is not a good predictor of performance
in dental school. Some of the Canadian dental schools also accept results of the US DAT in lieu of the Canadian DAT,
therefore the similarities and differences between the two test batteries need to be explained.
The Canadian DAT consists of a series of four tests. The English DAT includes:
Survey of the Natural Sciences (SNS) consisting of 40 Biology and 30 General Chemistry questions.
Perceptual Ability Test (PAT) consisting of 90 questions.
Reading Comprehension Test (RC) (English only) consisting of 50 questions.
Manual Dexterity Test (CAR).
There are a total of 210 written questions on the English DAT, plus the Manual Dexterity Test. The French DAT has a
total of 160 questions, plus the Manual Dexterity Test. The Reading Comprehension Test is not included in the French
DAT test battery. Scores for the Canadian DAT are reported on a 1-30 scale in each of the following categories.
Academic Average (AA) - average of Reading Comprehension, Biology and General Chemistry tests
Science Total - average of Biology and General Chemistry tests
Reading Comprehension
Perceptual Ability Test
Manual Dexterity Test
The US DAT differs slightly from the Canadian DAT. The Chalk Carving Test (or Manual Dexterity Test) was dropped in
1972 and replaced with the Perceptual Ability Test. The US DAT includes the following test components:
Survey of Natural Sciences (Biology, General Chemistry and Organic Chemistry)
Perceptual Ability Test
Reading Comprehension
Quantitative Reasoning
Scores for the US DAT are reported as:
Total Science (average of biology, general chemistry and organic chemistry)

20
Academic Average (average of quantitative reasoning, reading comprehension, biology, general chemistry, and
organic chemistry)
Based on feedback from our Admissions Survey and a review of the Survey of Canadian Dental Schools 2011-2012
(Table 2), the reported DAT scores are used by individual schools in a variety of ways. Each school has a different
admissions formula and each school uses different combinations of DAT components with a variety of weights. In
addition, some schools set minimum cut scores for some test components in order for the applicant to be considered
for admission. There is a wide variation in cut scores set by dental schools and the widest variation is in the Manual
Dexterity Test (Table 2). The range is from 3/30 to 15/30. Some schools use both percentage weights and cut scores
for some of the DAT components while some schools do not report how some of the tools are used.
6.2.1.1 Perceptual Ability Test
Eight of the ten dental schools include the Perceptual Ability Test (PAT) in their admissions formulae. This test was
introduced and replaced the Chalk Carving Test in the US in 1972 (16). The Chalk Carving Test was reintroduced in the
Canadian DAT in 1975 due concerns from Canadian dental about the validity of Perceptual Ability Test (17). Both the
PAT and the Manual Dexterity Test (now using soap instead of chalk) are components of the Canadian DAT.
Admissions officers include this paper-based PAT to assess special abilities.
6.2.1.2 Manual Dexterity Test
Seven of the ten dental schools currently utilize the Manual Dexterity Test in their admissions process. One
admissions officer indicated that this test component will be dropped in the 2014-2015 admissions cycle. There are
mixed opinions as to the value of this test. Some admissions officers feel that this is a very important test component
while others do not. Although there is a desire by most admissions officers to include an assessment of psychomotor
skills in the admissions process, the lack of a better test is one reason why this test continues to be used by some
schools. Some admissions officers indicated that a test of psychomotor skills as an admissions test is not necessary as
these skills can be learned during dental school. There was general agreement that there would be value in having a
valid and reliable test that assessed psychomotor skills.
6.2.1.3 Survey of Natural Sciences
This Survey of Natural Sciences (SNS) test component includes questions in biology and general chemistry. Six of the
10 dental schools utilize this test component either separately as the Science Total score (biology and chemistry
results only) or as the Academic Average (average of biology, chemistry and reading comprehension). This test
component is not used by any of the three dental schools in Quebec. All of the Quebec admissions officers felt that
the CEGEP applicants would be disadvantaged compared to university-based applicants. Admissions officers indicated
support for this test component because of its ability to predict performance in the didactic component of the dental
program.
6.2.1.4 Reading Comprehension
This test component is only offered in the English DAT and is utilized by 4 of the 10 dental schools. Two schools use
the Reading Comprehension (RC) test results as a percentage in their admissions formulae and also set a minimum
cut score. Two schools use the RC results only as a percentage weight in the admissions formulae. One admissions
officer commented that they “may reject an applicant if the score was low”. One admissions officer indicated that
this test component is an important indicator as to how well students do in the dental program.
21
6.2.1.5 Advantages and disadvantages of a DAT or DAT-like system
Most of the Canadian admissions officers agreed that there is value in having a battery of national, standardized
admissions tests to choose from to assess cognitive ability, non-cognitive attributes and psychomotor skills. Used in
conjunction with the GPA, a national standardized series of tests could address the concerns raised about GPA. These
included:
grade inflation and/or differences in difficulty obtaining good grades in some courses within an institution;
grade variation by different instructors in the same course in a given institution;
variation in GPAs across institutions; and
grade variation across programs (e.g. Engineering versus a General Science program).
On the other hand, Canadian Dental School Admissions Officers reported that the current test components of the
Canadian DAT have some problems that need to be addressed:
The Survey of Natural Sciences does not appear to be at the appropriate level to assess the CEGEP students that
apply to the three Quebec dental schools;
The standardized test battery that provides the benefits stated above are offset if all ten dental schools cannot
use them;
The Reading Comprehension Test is only available in English. A national test battery must be available and
accessible for students applying at all ten dental schools in both English and French;
The validity and reliability of the Canadian DAT test components are not being evaluated at all by the current CDA
Admissions Committee or any other group; and
The only current statistical data available is from the ADA Department of Testing Services. Since the Canadian and
US DAT test components are different, no analysis is being performed on the Manual Dexterity Test.
6.2.1.6 Possible Options/Solutions to address DAT limitations
In addition to highlighting advantages and disadvantages with the Canadian DAT, interviewees suggested some
solutions. The current CDA Dental Aptitude Sub-Committee meets once a year for a one-day meeting. The Committee
membership consists of Admissions officers or representatives from each dental faculty and CDA representatives.
This committee structure does not allow for any statistical analysis to assess the validity and reliability of current
admissions tools nor does it allow for assessment of new admissions tools, thus making it impossible to address the
problems outlined above. A new Admissions Committee needs to be struck that has a broader mandate, is
appropriately funded and has expertise to achieve the mandate.
Individual schools have indicated that they are attempting to evaluate new admissions tools on their own. This is
inefficient and not very cost-effective. A national admissions committee could undertake this function and benefit all
of Canadian dental schools.
Some admissions officers recommended that a new national admissions committee be a joint responsibility of ACFD
and the CDA.
There was moderate interest in finding a new tool to assess psychomotor skills. Confidence is lacking, however, in the
current Manual Dexterity Test. One criticism of this test is that is does not predict performance in dental school.
While this may be true, the test was never intended to predict performance. This test was originally introduced as a
part of the original ADA DAT to attempt to reduce the high attrition rates in US Faculties of Dentistry in the 1940’s
and it was effective in doing so. The Carving Dexterity Test was introduced as a screening tool to admit those

22
applicants that demonstrated some psychomotor skills in a Chalk Carving Test and screen out those applicants that
demonstrated poor psychomotor skills. A national admissions committee should provide guidance to dental schools
as to the value of each admissions tool and how best to use it.
A national admissions committee could also provide guidance to dental schools with respect to cut scores, especially
for tests such as the Manual Dexterity Test. Currently, cut scores for the Manual Dexterity Test across Canadian
dental schools range from as low as 3/30 to as high as 15/30. If Admissions officers have never been part of the
grading of the Manual Dexterity Test, it may be appropriate to encourage each Admissions officer to attend a grading
session. Alternatively, a visual representation of carvings at each mark in the grading system from 1 to 30, or a range
of marks (e.g. 0-5, 6-10 etc.) could be provided. This might assist the Admissions officers in choosing an appropriate
cut score for this test for those schools that value an assessment of psychomotor skills as a condition to admission..
The SNS component of the DAT must be re-evaluated to determine what needs to be altered for the test to be able to
be fairly administered to all applicants to the 10 dental programs.
The lack of a Reading Comprehension Test in French is a real deficiency and currently precludes this test component
as part of a national test battery. If the admissions officers agree that this is a valuable test component, reading
comprehension, like all other test components must be available in both English and French.
There was universal agreement and strong support for the identification of appropriate tests to assess non-cognitive
attributes. The DAT battery of tests does not address these important factors.
In summary, potential solutions highlighted were as follows:
A new national admissions committee run by ACFD and CDA with a new mandate covering the following issues:
Development of guidelines concerning overall student selection and admissions processes (i.e. beyond
oversight of the DAT);
Development of guidelines on the use of specific tools and processes to ensure they are used
appropriately e.g. cut-off scores, use for screening, percentage weight, etc.;
Training on the use of admissions tools;
Development of elements of tests and processes (e.g. questions for structured interviews or scenarios for
the MMI); and
Oversight of evaluating the validity of admissions tools and processes.
Further evaluation of the need and utility of a test of manual dexterity and/or space perception
Adaptation of tools and processes for French as well as English-speaking candidates
Adaptation of tools and processes for all levels of applying candidates, including those without a university
degree
6.2.2 Grade Point Average
Among all of the admissions tools used for selecting dental students in Canada, the Grade Point Average (GPA) is the
only tool used by all programs. It is currently being used as a percentage in the admissions formula (45-100%) in all 10
dental schools as of 2012. One school sets a minimum GPA as a cut-off for the granting of an interview. Once
applicants have achieved this minimum GPA and have been granted an interview, the GPA is no longer considered
and acceptance is determined by other selection tools. The three Quebec schools admit students from CEGEP, which
is a college system considered to be between secondary education and university. Students with 2 years of education
in CEGEP are eligible to apply. GPAs are converted into Cote R (cote de rendement au collégial).

23
6.2.2.1 Advantages and Disadvantages of the GPA
The primary advantages given by most of the admissions officers were that the GPA was a good indicator of academic
ability and that the GPA represented an indicator of whether the applicant could manage the rigours of the dental
program. The pre-dental courses also provide a necessary prerequisite knowledge base for the dental program. It was
felt that past academic success is a predictor of academic ability and future success in academic programs.
Interviewees were aware of studies by the ADA showing that the GPA is a good predictor of performance in the first
two years of the dental program.
Although most of the dental programs have some degree of latitude in assigning various weights to admissions tools,
some programs indicated that they have limited ability to adjust weights in their admissions formula and one school
indicated that the GPA percentage used in the admissions is dictated by their University. This school indicated that
they are required to weight the GPA as a minimum of 50% in their admissions formula.
There are widespread concerns about mark inflation in some universities and in some programs, although there was
no clear answer from interviewees as to how to adjust for this. Converting grades of courses with the same content
from different universities, particularly when different grading scales may be used by the different universities, was
an issue. There was also concern that applicants applying from more academically rigourous programs such as
Engineering and Biophysics are at a distinct disadvantage compared to those students applying from other less
rigourous programs. It was felt by some interviewees that good applicants were unfairly eliminated because of this
discrepancy in the various programs. This was a real concern because it was felt by interviewees that those rigourous
programs cited helped develop problem-solving skills in students that would be of value in candidates applying to
dentistry.
6.2.2.2 Possible Options/Solutions to address GPA limitations
One suggestion to adjust for mark inflation and variability was to consider the rank of the student in the various
programs to level the playing field to some extent. There was concern that the same courses at different universities
may be graded differently, and even within the same university, different instructors teaching the same course may
grade differently. Optional courses may be taken by students simply because they are known to be easy or have a
probability of generating a strong grade.
GPA is clearly an important tool in the admissions process. However, GPA in isolation has limitations. Consideration
should be given to:
Ranking of students in a program to adjust for academically rigourous programs;
Weighting the program or courses taken (i.e. consider a higher ranking for students in Biophysics programs versus
a less rigourous program);
Establishing a minimum GPA as a cut-off for further consideration in the admissions process instead of using GPA
as a percentage in the admissions process;
The GPAs of full students vs. part-time students;
Whether students voluntarily withdraw or fail courses and subsequently retake the courses;
The development of a truly national standardized series of tests to assess cognitive ability to offset and compare to the variability that is inherent in GPAs.
6.2.3 Interviews It was noted by a US organisation interviewed that one of the three most important criteria for admission into US
dental programs was a pre-admissions interview, the others being the science GPA and the overall GPA. All Canadian

24
dental programs recognized that an interview helps in assessing non-cognitive attributes of applicants. These
attributes include professionalism, communication, conscientiousness, integrity, judgment and analysis, management
of people, self-control, sensitivity to others, tact and diplomacy, ethical attitudes, organizational skills, community
service, management of stress, empathy, and willingness for life-long learning.
Nine of the 10 Canadian dental programs use an interview of some sort as a selection tool. Three types of interview
formats are used by Canadian dental programs when selecting applicants for admission: a structured interview; an
unstructured interview; or a multiple mini interview (MMI).
6.2.3.1 Structured Interview
A structured interview consists of interview questions with a scoring rubric to evaluate applicants’ responses. In 2000
the CDA provided interested Canadian dental schools with a structured interview (CDA structured interview)
composed of questions related to seven competencies that allow the option of using either a situational format or a
patterned behaviour description format. A situational interview question seeks a response related to a hypothetical
situation, often job-related (18). A patterned behaviour description question relates to a candidate’s past behaviour
in a given situation, the rationale being that past behaviour should predict future actions (19). The CDA structured
interview questions are based on the following seven competencies: communication, conscientiousness, integrity,
judgment and analysis, self-control, sensitivity to others, and tact and diplomacy. Four dental programs use the CDA
structured interview.
6.2.3.2 Unstructured Interview
An unstructured interview represents free-flowing exchange of information between the applicant and the
interviewer(s). One dental program uses an unstructured interview, however this program intends to use an MMI in
the upcoming year.
6.2.3.3 Multiple Mini Interview (MMI)
The multiple mini interview (MMI) is an interview format using a pre-determined number of stations – usually
between seven and ten – where short structured scenarios are conducted, each station assessed by a different
evaluator and sometimes more than one evaluator. In other words, an evaluator or evaluators assigned to a
particular scenario will evaluate all candidates performing that scenario but will not see or evaluate any other of the
6-9 scenarios. Three dental programs use an MMI.
The one dental school that currently does not use any form of interview plans on introducing either a computer-
based written interview or an MMI in the near future.
Weightings of the interviews in the selection processes by the Canadian dental programs vary from 15% to 33.3% of
an overall score, or, in the case of two programs, either 50% or 100% for final selection once applicants have attained
minimum scores in other criteria such as GPA and DAT.
6.2.3.4 Advantages and disadvantages of the various interview formats
According to the interviewees, the various interview format outlined above have several advantages and
disadvantages, which are summarized below. Nevertheless, as an overall observation all schools and organisations
recognised the importance of using means to identify non-cognitive skills and behaviours in dental school candidates
and that interviews in some form are necessary to do that. However, the resources and infrastructure necessary to
perform interviews of any sort is considerable. Furthermore, calibration of interviewers to ensure reliability of the

25
interview process was a concern expressed by most dental programs, regardless of the interview format. Advantages
and disadvantages identified by interviewers, specific to each interview format, are listed below:
Advantages of the CDA structured interview include
no-cost access by the dental programs to questions;
its ease of utilization;
transferability of scores across schools (i.e. a candidate could in theory perform the CDA structured
interview once and have that score provided to all schools he/she applied to and which use that as part
of their admissions process); and
the questions are directly related to non-cognitive attributes.
Disadvantages of the CDA structured interview include
lack of security of questions (there was a strong perception among many dental school admissions
personnel that candidates know of the questions and come already prepared with an answer);
no French version of the questions; and
currently no mechanism to develop and critique new questions.
Advantages of an unstructured interview include:
ease of organisation
Disadvantages of unstructured interviews include:
the difficulty in objectively comparing responses of interviewees across interview groups; and
It is recognised that this format has very little research to support its validity.
Advantages of the MMI include:
An advantage to two of the three dental programs that use an MMI is their having access to expertise in
developing this tool and the scenarios, mainly through other health care professional schools at their
universities. As a result, new self-developed scenarios and questions can be formulated each year.
The other program primarily uses purchased questions/scenarios which are supplemented by self-
developed ones.
Physical infrastructure in all three programs allows the use of the MMI format due to access to multiple
interview rooms that are situated in close proximity to each other.
Two of the three programs using the MMI format are committed to research involvement related to the MMI.
Disadvantages of the MMI include:
Although three dental programs use an MMI format, the inter-program use of the format is inconsistent.
Differences in question types (dentistry-related versus medicine-related, self-developed versus
purchased) and differences in the scoring and ranking of applicants exist.
lack of local expertise in the development of MMI questions/scenarios;
the high cost of purchasing already-developed MMI questions/scenarios;
the lack of physical infrastructure to support the format; and
a lack of strong research evidence indicating that an MMI format is superior to a traditional structured
interview format.

26
6.2.3.5 Potential Options/Solutions to address Interview limitations
No matter the interview format, programs recognized the value of this tool in assessing the non-cognitive attributes
of applicants. Potential best options/solutions related to the use of an interview as a selection tool include:
Establish a national group to oversee the development and implementation of one or more valid interview
processes;
Identify mechanisms to ensure continuing development of high quality interview questions/scenarios;
Ensure interview questions/scenarios are available in both English and French languages;
Identify mechanisms to ensure high level of calibration of interviewers;
Identify mechanisms to ensure security of interview questions/scenarios and scoring rubrics used;
Identify mechanisms to allow confidence in transferring candidates’ scores to other dental programs’ selection
processes;
Seek support by participating dental programs to provide physical and human resources to allow application of
the interview process at that institution; and
Conduct research into the interview process(es) to enable evaluation of validity and reliability of the tools over
time, and ultimately the identification of the best tools and processes.
6.2.4 Letters of Reference
At the time the initial questionnaire was sent out to the schools, three schools indicated that they used letters of
reference in their respective admissions processes. By the time the Admissions officers were interviewed via
teleconference, one of the three schools had dropped this tool. One school requests three letters of reference for
each applicant. In addition, there is a standard questionnaire that includes a referees’ ranking of the applicant from
poor to outstanding in eleven non-cognitive attributes. These data used to be read and assessed for all applicants to
the program but are now only assessed for those applicants who are granted interviews.
With respect to the advantages of reference letters, the Admissions officers indicated that very little discrimination
results from this process but on rare occasions letters have been useful to screen out an applicant. An example was
cited where one applicant with a GPA of 4.0 and who was currently in a PhD program was rejected because the
supervisor advised the Admissions Committee that the applicant did not have very good interpersonal skills and was
sometimes aggressive with his/her peers. The applicant was rejected on the basis of this reference letter. The same
Admissions Officer indicated however, that many letters were so brief to be of little value.
With respect to the disadvantages for reference letters, the school that recently dropped them from their admissions
process did so for the following reasons:
The letters did not discriminate amongst the applicants because they all basically had the same content i.e. the
referees indicated that they had known the applicant for a long time, that he/she was a great person and that
they would make a great dentist;
A lot of time was required to read the material with little or no value in return; and
Because of the similarity in content of some of the letters, there was concern that the material was available on
line.
Even the schools that continue to utilize letters of reference indicate they have some concerns. Very few poor letters
of reference are received. None of the schools using letters of reference had the resources to follow up on the
submissions to ensure statements made in the letters or in applicant CV’s were genuine. In summary, letters of

27
reference have limited value in being able to discriminate among applicants and require a significant amount of time
to evaluate the submissions.
6.2.5 Personal Statements/CVs
Three schools utilize personal statements in their admissions processes. They are used as screening tools and are
used to assess non-cognitive attributes of the applicants. One of the schools has a timed (1 hour) on-line exercise that
includes four questions. The questions were randomized and were drawn from a bank of questions so that applicants
would not be able to prepare for the exercise in advance.
In terms of the advantages of personal statements and CV’s, one school has used this admissions tool as a screening
mechanism to eliminate applicants based on their responses. A scoring system has been developed and the intent is
to use the scoring system for future admissions cycles.
With respect to the disadvantages, like the letters of reference, there was concern expressed regarding the time
required and the difficulty in assessing the personal statements. To address this, interviewees suggested that
personal statements could be made through a series of standardized questions and a scoring template currently in
development by one of the schools might be of value to other schools if this admissions tool could be shared
nationally.
6.2.6 NEO-PI-R Personality Inventory Test
The NEO-PI-R Personality Inventory Test is currently being used in one dental school to measure non-cognitive
attributes. This tool had been used as an admissions tool in the near past by one other dental school, but it was
dropped after a few years. The school currently using this tool does not have data indicating whether or not this is
effective either as an admissions tool or as an indicator of how the person performs after graduating.
One other admissions officer indicated that they are interested in considering the NEO-PI-R at some point in the
future. They have gone through significant changes to their admissions process recently and do not wish to make any
substantive changes at this time.
The rationale for inclusion of this test is that there are numerous data to support its reliability and validity and that it may be a better tool than other means to evaluate personality traits and characteristics of candidates. The disadvantage however, is that the value of the test in the context of admissions is not known. Tests such as this need a thorough evaluation by a national admissions committee. The advantages, limitations and how the test should be interpreted and used need to be explained to Admissions officers so they can make informed choices and use the test appropriately.
6.3 Literature review results
Some authors have been reluctant to embrace a cognitive and non-cognitive selection tool divide, notably because of
the moderate to weak correlation between the two sets of measurements (20). Yet, since we believe what
differentiates the selection tools are their purposes, we decided to keep this typology since it facilitates analysis. Also,
predictive validity of cognitive and non-cognitive selection tools has been shown to vary by year in dental school, so
the results will take the measurements temporality into account. The following section will describe the results of our
literature review; first for cognitive and academic performance assessment tools, and second for non-cognitive
selection tools.

28
6.3.1 Academic and cognitive assessment tools
6.3.1.1 Grade Point Average (GPA)
Grade Point Average (GPA1) is perceived as a long-term indicator of prior academic performance. The general
purpose of GPA scoring is to give insights into a candidate’s prior academic performance, either overall or in a specific
field, and to help identify which candidates should be high performers. The rationale behind the use of GPA as a
dental school performance predictor is that prior performance should be an indicator of future academic
performance. Therefore, GPA should be predictive of pre-clinical dental school (academic) performance. Yet, its
ability to discriminate between extremely competitive applicants, whose GPA variations are minimal, is dubious.
Because of this fact, some dental schools prefer to use GPA as a threshold in order to separate weak from strong
academic performers.
Eight out of the thirty-six studies pertain to the criterion validity or potential bias on ethnic/racial or gender diversity
of using grade point average (GPA) as part of dental school admission processes. None assessed nor reported on the
construct or content validity of the selection tool, nor its reliability or scalability (see Table 3 and Appendix D Table
D1). As there are many ways to calculate GPA, its exact definition varies widely (21). According to our review, the two
main methods for calculating GPA used in the dental school admission’s process consist of overall GPA and science-
specific GPA. Of the thirty-six studies reviewed, eight assessed the overall Pre-dental GPA’s validity, and five assessed
the Pre-dental Science GPA’s validity.
Overall Pre-Dental Grade Point Average
The American Dental Association (ADA) defines Overall Pre-dental GPA as the “average calculated for all courses
taken by the student during his/her undergraduate years” (22). As our results indicate, Overall Pre-dental GPA seems
to have moderate to weak predictive validity for all four years of dental school when taken separately, although the
results are equivocal for overall dental school GPA (see Table 3).
First-year performance: Overall Pre-dental GPA has a moderate positive correlation with first-year Biomedical grades
(22), and with Natural Science Examination (23). Overall GPA is also weakly positively correlated with first-year Pre-
clinical dental techniques grades (22), first dental examination (23) and first semester performance (24). Results
concerning Overall Pre-dental GPA’s predictive validity on overall first-year performance are less clear. On one hand,
the ADA found a moderate positive correlation between the two variables (22); on the other, Curtis, Lind, Plesh and
Finzen (25) found a weak positive correlation between Overall Pre-dental GPA and first-year dental school GPA, but
the relationship was significant only for underachieving students.
Table 3: Summary of the results on the predictive validity of overall pre-dental GPA
Authors (year) Study participants Predictive validity – Strength of association
Alzahrani, M. J., E. M.
Thomson, et al. (2007)
(21)
N=146 graduation;
N=130 NBDHE
Graduation within two years of admission – r= 0.4957, p=0.6625
NBDHE scores – r= -0.01884, p=0.9901
American Dental
Association (2012) (22)
2009, n=49; 2010,
n=47 dental schools
First-Year Biomedical- median r= 0.32, p<0.05 ***, R2 = 0.10
First-Year GPA – median r= 0.33, p<0.05 ***, R2 = 0.05
First-Year Pre-clinical Dental Techniques grades – median r= 0.23,
1 In the articles reviewed, GPA was also referred to as incoming college grade point average, grade point average, pre-dental
school grade point average and undergraduate grade point average.

29
p<0.05 ***, R2 = 0.11
Second-year Biomedical - median r= 0.35, p<0.05 ***, R2 = 0.12
Second-year GPA – median r= 0.37, p<0.05 ***, R2 = 0.08
Second-year Pre-clinical dental Techniques grades – median r=
0.29, p<0.05 ***, R2 = 0.12
Arnold, W. H., P.
Gonzalez, et al. (2011)
(23)
n=194 for first
dental exam, n=193
for national science
exam, n=163 for
state board exam
Natural science examination – r= 0.343, p<0.001*
First dental examination – r= 0.268, p<0.001*
State board examination scores – r= 0.269, p<0.001*
Curtis, D. A., S. L. Lind, et
al. (2007) (25)
2001-2005
graduating classes’
normally tracking
students (n=49) and
underachieving
students (n=45)
Correlation:
Normally tracking students:
First-year GPA – r= 0.21, p>0.05
Fourth-year GPA – r= 0.33, p<0.05***
Underachieving students:
First-year GPA – r= 0.26, p<0.05***
Fourth-year GPA – r= 0.23 p>0.05
Multivariate regression:
Normally tracking students:
First-year GPA – β= -0.25, p=0.56
Fourth-year GPA – β= 0.36, p=0.37
Underachieving students:
First-year GPA – β= 0.37, p=0.24
Fourth-year GPA – β= 0.36, p=0.19
Holmes, D. C., J. V.
Doering, et al. (2008)
(26)
2000-2007
graduate students
(n= 574)
Overall Dental School GPA – r= 0.529, p<0.05***
NBDE Part I – r= 0.497, p<0.05***
NBDE Part II – r= 0.433 p<0.05***
Final Clinical grade – r= 0.276, p<0.05***
Kim, M. and J. I. Lee
(2007) (24)
2005 admission
cycle matriculated
first semester
student (n=90)
First semester GPA – β= 0.242, p<0.01**
Kingsley, K., J. Sewell, et
al. (2007) (12)
2002-2004
admission cycle’s
matriculated
students (n=275)
NBDE- r= 0.286, p>0.05
Overall Dental school GPA - r= 0.224, p>0.05
*** = p<0.05; ** = p<0.01; * = p<0.001

30
Second-year performance: Overall Pre-dental GPA also seems moderately correlated with second-year Biomedical
grades (22) and second-year GPA (22), and weakly correlated with second-year pre-clinical dental techniques grades
(22).
Third and fourth-year performance: Overall Pre-dental GPA was found weakly correlated with third year final clinical
grades (26), while Curtis et al. (25) found that Overall Pre-dental GPA was moderately correlated with fourth-year
GPA, but only for normally tracking students, as the correlation was found not to be significant for underachieving
students.
NBDE Board examination performance: The results concerning the validity of Overall Pre-dental GPA to predict state
board examination scores also differ. Holmes et al. (26) found a moderate positive correlation between Overall Pre-
dental GPA and NBDE Part I and Part II, while Arnold, et al. (23) reported only a weak positive correlation between
state board examination and Overall Pre-dental GPA. As for Alzahrani et al. (21) and Kingsley et al. (12), both studies
found Overall Pre-dental GPA to be not significantly correlated with national board examination scores. Furthermore,
Holmes et al. (26) found Overall Pre-dental GPA only weakly able to distinguish between those who successfully
passed the Central Regional Dental Testing Service (CRDTS) exam2 (27) and those who failed, thus having weak
concurrent validity.
Convergent/Divergent Validity: As for convergent validity of Overall Pre-dental GPA with other selection tools, our
findings suggest a strong to moderate correlation with other cognitive tools, and a weak to non-significant correlation
with non-cognitive tools. Holmes et al. (26) reported a strong positive correlation with Pre-dental Science, and
moderate positive correlations in parts of the DAT (DAT-Academic Average, DAT-Perceptual Ability Test, and DAT-
Survey of the Natural Science3 scores). As for non-cognitive assessment tools, Arnold et al. (23) found a weak positive
correlation between Overall Pre-dental GPA and an unstructured interview, while Kim and Lee (24) found no
significant relationship between the latter, oral exam and interview scores, which could corroborate that they do in
fact assess different constructs.
Pre-dental Science GPA
The ADA defines Pre-dental Science GPA as the score “calculated for all science courses taken by the student during
his/her undergraduate years” (22). As these science courses are often prerequisites for dental school coursework, the
rationale in using Pre-dental Science GPA rather than Overall GPA is that student performance in science courses
should be better predictors of academic performance in dental school than, for example, courses in literature and
foreign languages. Yet, as for overall Pre-dental GPA, moderate to weak positive correlations were found between
Pre-dental Science GPA and most dental school academic indicators, but showed contradictory results for dental
school GPA and board examination scores (see Table 4 and Appendix D Table D1).
2 The Central Regional Dental Testing Service (CRDTS) regroups seventeen US State Boards of Dentistry that decided to join
forces to “develop and administer fair, valid and reliable examinations of competency to practice dentistry and dental hygiene”.
Success in passing the CRDTS exam is prerequisite in most member state board licensing processes. The examination consists of
five parts. The first part consists of Part I and II of the National Board Examination. Part II of the CRDTS exam consists of a 3
hours endodontic evaluation (100 points) performed on a manikin. Part III consists of a four hour fixed prosthodontics examination
(100 points) performed on a manikin. Part IV consists in a periodontal examination (100 points) and part V is a restorative
examination, both performed on a patient. For more information on the content of the different sections, see
http://www.crdts.org/Default.aspx?PageID=47 3 Holmes et al. 26. Holmes DC, Doering JV, Spector M. Associations among predental credentials and measures of dental
school achievement. Journal of Dental Education 2008;72(2):142-152.’s calculation refers to Survey of the Natural Sciences as
Total Science, whose score is a combination of Biology, General Chemistry, and Organic Chemistry.

31
First-year performance: In the first year of dental school, Pre-dental Science GPA was found to have a moderate
positive correlation with Biomedical grades (22), first year GPA (22), while being weakly correlated with the first Pre-
clinical Dental Techniques grades (22). A weak positive correlation was also found with first-year GPA, but only for
normally tracking students (25). Pre-dental Science GPA was also found to be strongly and positively correlated with
one of the two classes in pre-clinical portion of Harvard's dental school, although this correlation only reached the
p=0.10 level (28).
Table 4: Summary of the results on the predictive validity of Pre-dental Science GPA
Authors (year) Study participants Predictive validity – Strength of association
Alzahrani, M. J., E. M. Thomson, et al. (2007) (21)
n=146 graduation; n=130 NBDHE
Graduation within two years of admission – r= -0.6177, p=0.6784 NBDHE scores – r= 1.3257, p=0.5016
American Dental Association (2012) (22)
2009, n=49; 2010,n=47 dental schools
First-Year Biomedical-median r= 0.33, p<0.05***, R2 = 0.11 First-Year GPA – median r= 0.35, p<0.05***, R2 = 0.06 First-Year Pre-clinical Dental Techniques grades – median r= 0.24, p<0.05***, R2 = 0.12 Second-year Biomedical – median r= 0.32, p<0.05***, R2 = 0.09 Second-year GPA –median r= 0.37, p<0.05***, R2 = 0.08 Second-year Pre-clinical dental Techniques grades – median r= 0.28, p<0.05***, R2 = 0.13
Arnold, W. H., P. Gonzalez, et al. (2011) (23)
n=194 for first dental exam, n=193 for national science exam, n=163 for state board exam
Natural science examination: Biology scores– r= 0.276, p=0.008**, R2 = 0.07 Chemistry – r= 0.623, p=0.023***, R2 = 0.38 Physics score – r= 0.362, p=0.27, R2 = 0.12
Curtis, D. A., S. L. Lind, et al. (2007) (25)
Normally tracking students (n=49) and underachieving students (n=45)
Correlation:
Normally tracking students:
First-year GPA – r= 0.27, p<0.05***
Fourth-year GPA – r= 0.32, p<0.05***
Underachieving students:
First-year GPA – r= 0.21, p>0.05
Fourth-year GPA – r= 0.15, p>0.05
Multivariate regression:
Normally tracking students:
First-year GPA – β= 0.41, p=0.24
Fourth-year GPA – β= -0.02, p=0.94
Underachieving students:
First-year GPA – β= -0.19, p=0.50
Fourth-year GPA – β= -0.19, p=0.44 Holmes, D. C., J. V. Doering, et al. (2008) (26)
n= 574 Overall Dental School GPA – r= 0.537, p<0.05***
NBDE Part I – r= 0.527, p<0.05***
NBDE Part II– r= 0.460, p<0.05***

32
Final Clinical grade – r= 0.277, p<0.05***
Kingsley, K., J. Sewell, et al. (2007) (12)
n=275 Linear regression: NBDE Part I – β= 2.938, p=0.229
Park, S. E., J. D. Da Silva, et al. (2010) (28)
n=159 TXAD with Honours – OR=3.9, p=0.10
Alzahrani, M. J., E. M. Thomson, et al. (2007) (21)
n=146 graduation; n=130 NBDHE
GPA-Pathology: Graduation – β= 1.0967, p=0.0008** NBDHE scores – β= 2.9809, p≤0.0001* GPA-Microbiology: Graduation – β= -0.5773, p=0.2958 NBDHE scores – β= 0.25762, p=0.7420 GPA- Chemistry I: Graduation – β= -0.4975, p=0.4296 NBDHE scores – β=-0.4996, p=0.5307 GPA- Oral Anatomy: Graduation – β= 0.7684, p=0.1196 NBDHE scores – β= 3.3119, p≤0.0001* GPA- Anatomy: Graduation – β= -0.3987, p=0.5332 NBDHE scores – β= -0.66257, p=0.1260
Second-year performance: As for second-year performance, Pre-dental Science GPA is moderately correlated with
second-year Biomedical grades (22), second-year GPA (22), and weakly correlated with Pre-clinical Dental techniques
grades (22).
Third and fourth-year performance: Pre-dental Science GPA scores show a weak positive correlation with the Final
Clinical Grade (26), and with fourth-year GPA for normally tracking students (25), but was not found significantly
correlated with fourth-year GPA for underachieving students (25).
Overall Dental School GPA and graduation: While Holmes et al. (26) found Pre-dental Science GPA to be moderately
correlated to Dental School GPA, at the opposite no significant relationship between the two variables were observed
by Kingsley et al. (12). Overall Dental School GPA was also found not to be correlated with graduation on time at a
significant level (21).
NBDE Board Examination performance: Similar contradictory results were also observed when it came to predicting
licensing examinations scores. While Holmes et al. (26) found Pre-dental Science GPA to be moderately correlated to
the US NBDE Part I and II, Alzahrani et al. (21) and Kingsley et al. (12) found that the two variables were not
significantly correlated. As for Overall Pre-dental GPA, Pre-dental Science GPA score was unable to distinguish
between those who passed CRDTS exam and those who failed (26).
In an effort to determine the courses with the highest predictive value on dental hygiene student’s subsequent
performance, Alzahrani et al. (21) investigated each of the Pre-dental Science GPA subjects scores (Pathology,
Microbiology, Chemistry, Oral Anatomy and Anatomy GPA). The authors found that only Oral Anatomy GPA and

33
Pathology GPA were significantly related to NBDHE, while only Pathology had a significant relationship with
graduation on time. All other sub-scores didn’t reach significant value (p>0.05).
Convergent/Divergent Validity: As for convergent/divergent validity, Pre-dental Science GPA was found to be
strongly correlated with Overall Pre-dental GPA, and moderately correlated with DAT-Academic Average, DAT-
Perceptual Ability, and DAT-Total Science scores (26).
As our results exhibit, Pre-dental Science GPA shows similar trends in predictive validity as Overall Pre-dental GPA.
This is possibly explained by the high correlation between the two variables. Both Overall Pre-dental GPA and Pre-
dental Science GPA show weak to moderate correlation to dental students’ performance, although this relationship is
stronger for the first and the second year of dental school, and tends to get weaker for the third and fourth years.
Results are also ambiguous as for Overall Pre-dental GPA and Pre-dental Science GPA’s ability to predict performance
at the National Board examinations, as studies have reported contradictory results (either moderate or non-
significant correlations). GPA is also moderately correlated to sub-scores of another central cognitive tool used in the
dental school admission process: the Dental Admission Test.
6.3.1.2 Dental Admission Test (DAT)
In 1945, US dental schools were confronted with three major concerns. First, they were faced with high attrition
rates, sometimes reaching 20-25% over the four years of dental school. Second, grade inflation made it difficult to
compare academic records of different high schools and colleges. And third, there were concerns over comparing
recent and older academic records (due to the influx of World War II Veterans as applicants). These concerns
highlighted the need for a national standardized test to compare dental school applicants in an equitable manner,
and led to the creation of the Dental Admission Test (DAT) program. The purpose of the initial DAT was to assess
basic abilities in “mathematics, verbal reasoning, reading comprehension in the sciences, and academic achievement
in the natural sciences and manual dexterity through object visualization and a chalk carving test (22). The content of
the US DAT has remained relatively static since 1945, with some minor changes in 1972 (addition of the Organic
Chemistry subtest, and replacement of the Chalk Carving Test by the Perceptual Ability Test4), and elimination of the
Verbal Reasoning Test in 1981 because of its cost and lack of predictive validity. The standard score scale was also
changed in 1988 from 1-9 to a 1-30 log ability scale defined by the Rasch Model, which increased its reliability. No
other major changes have occurred since.
Differences between the Canadian and American versions of the DAT: The American Dental Association Test (ADA-
DAT) contains four different sections, each evaluating different subject matter. The first, the Survey of Natural
Sciences, is a 100 multiple-choice items test, where 40 items relate to biology, 30 to general chemistry, and 30 to
organic chemistry. The second section, the DAT-Quantitative Reasoning Test, contains 40 mathematics problems, 10
of which are applied problems. The third section, DAT-Reading Comprehension, contains three 1,500 word passages
followed by 16-17 questions assessing comprehension. Finally, the fourth section, the DAT-Perceptual Ability Test,
contains 90 two-dimensional or three-dimensional problems. Even if the CDA-DAT were modeled on the ADA-DAT,
some minor differences exist between the two tests. The CDA-DAT includes a manual dexterity test (soap carving
test), but not the Organic Chemistry and Quantitative Reasoning Tests (both present in the ADA-DAT version).
4 For more details on the DAT Dexterity Test, see “Manual test” in the non-cognitive section of this report.

34
Differences between the French Canadian DAT and the English Canadian DAT: Differences are also observed
between the French and the English versions of the Canadian DAT. Adopted for use in 1967, the French Canadian DAT
(F-CDA-DAT) includes three evaluations (Perceptual Ability, Survey of Natural Sciences, and Manual Dexterity), while
the English (E-CDA-DAT) version includes four (the first three plus Reading Comprehension).
Over the years, the DAT was found to be a reliable and valid instrument in predicting dental school performance and
in reducing attrition (29). Our results show similar findings. Nine out of the thirty-six studies pertain to the criterion
validity or potential bias on ethnic/racial or gender diversity of the DAT as part of the dental admission process (7 for
ADA-DAT, 1 for CDA-DAT, 1 for Dental Education Eligibility Exam (DEET)5). As for GPA scores, none of the studies
reviewed assessed nor reported on the reliability, scalability, construct or content validity of the DAT (see Appendix A
Table A2). Each of the different subsets of the DAT will be explored in the next section.
DAT-Survey of Natural Science (DAT-SNS)
The ADA defines the DAT Survey of Natural Science6, also known as Total Science (DAT-SNS), as the “average of the
standard scores on the Biology, General Chemistry, and Organic Chemistry tests” (22). Three of the thirty-six studies
assessed DAT-AA’s validity, all three using the ADA-DAT version. Four other studies assessed each subsection’s
predictive validity, all using the American version of the DAT (see Table 5 and Appendix D Table D2).
Table 5: Summary of the results on the predictive validity of DAT-Survey of Natural Science and its subtests
Authors (year) Study participants Predictive validity – Strength of association Allareddy, V., T. H. Howell, et al. (2012) (30)
N=66 Obtaining Honours in first comprehensive evaluation – OR 0.78, p=0.61 Obtaining Honours in second comprehensive evaluation – OR 14.17, p=0.01** Obtaining Honours in third comprehensive evaluation – OR 1.44 p=0.50
American Dental Association (2012) (22)
2009, n=49; 2010, n=47 dental schools
First-Year Biomedical-median r= 0.28, p<0.05*** First-Year GPA – median r= 0.26, p<0.05*** First-Year Pre-clinical Dental Techniques grades – median r= 0.16, p<0.05*** Second-year Biomedical – median r= 0.20, p<0.05*** Second-year GPA –median r= 0.21, p<0.05*** Second-year Pre-clinical dental Techniques grades – median r= 0.15, p<0.05***
Holmes, D. C., J. V. Doering, et al. (2008) (26)
N= 574 Overall Dental School GPA – r= 0.449, p<0.05*** NBDE Part I – r= 0.582, p<0.05*** NBDE Part II– r= 0.469, p<0.05***
5 The Dental Education Eligibility Test (DEET) is the Korean equivalent of the DAT. Before 2005, admission to dental school in
Korea was based only on the Scholastic Aptitude Test (SAT) and academic performance. Faced with the “lack of awareness of
social diversity and limited creativity in biomedical research in dentistry” 24. Kim M, Lee JI. Variables predicting students' first
semester achievement in a graduate-entry dental school in Korea. Journal of Dental Education 2007;71(4):550-556, 24. ibid.,
some universities drastically altered their program’s structure (to graduate-entry programs) and admission procedure. The DEET
was developed in this context, and includes similar subtests as the DAT: Reading Comprehension, Reasoning Part I (Biology) and
II (Chemistry and Physics), and Perceptual Ability. For more information, see Kim and Lee 24. ibid.. 6 As for the CDA-DAT-NS, it would be calculated as the average of the standard scores of Biology and General Chemistry, as the
CDA-DAT does not include the Organic Chemistry subtest.

35
Final Clinical grade – r= 0.152, p<0.05*** 1- Subsection:
Biology
American Dental Association (2012) (22)
2009, n=49; 2010, n=47 dental schools
First-Year Biomedical-median r= 0.19, p<0.05*** First-Year GPA – median r= 0.19, p<0.05*** First-Year Pre-clinical Dental Techniques grades – median r= 0.10, p<0.05*** Second-year Biomedical – median r= 0.14, p<0.05*** Second-year GPA –median r= 0.13, p<0.05*** Second-year Pre-clinical dental Techniques grades – median r= 0.11, p<0.05***
Behar-Horenstein, L. S., C. W. Garvan, et al. (2011) (31)
N=209 Correlation: NBDE Part I – r= 0.44, p<0.0001* NBDE Part II – r= 0.27, p<0.0001* Multivariate regression: NBDE Part I – β undisclosed, p=0.0182** NBDE Part II – β undisclosed, p=0.0092**
Kim, M. and J. I. Lee (2007) (24)
N=90 First-semester GPA – β 0.317, p<0.05***
Kingsley, K., J. Sewell, et al. (2007) (12)
N=275 Correlation: NBDE – r= 0.304, p<0.05*** Overall Dental school GPA – r= 0.148, p>0.05 *** Regression: NBDE-I – β = 0.585, p=0.001**
2- Subsection: General Chemistry
American Dental Association (2012) (22)
2009, n=49; 2010, n=47 dental schools
First-Year Biomedical-median r= 0.12, p<0.05*** First-Year GPA – median r= 0.15, p<0.05*** First-Year Pre-clinical Dental Techniques grades – median r= 0.10, p<0.05*** Second-year Biomedical – median r= 0.16, p<0.05*** Second-year GPA –median r= 0.18, p<0.05*** Second-year Pre-clinical dental Techniques grades – median r= 0.09, p<0.05***
Behar-Horenstein, L. S., C. W. Garvan, et al. (2011) (31)
N=209 NBDE Part I – r= 0.26, p=0.00025** NBDE Part II – r= 0.08, p=0.2459
3- Subsection Organic Chemistry
American Dental Association (2012) (22)
2009, n=49; 2010, n=47 dental schools
First-Year Biomedical-median r= 0.23, p<0.05*** First-Year GPA – median r= 0.23, p<0.05*** First-Year Pre-clinical Dental Techniques grades – median r= 0.09, p<0.05*** Second-year Biomedical – median r= 0.21, p<0.05*** Second-year GPA –median r= 0.24, p<0.05*** Second-year Pre-clinical dental Techniques grades – median r= 0.14, p<0.05***

36
Behar-Horenstein, L. S., C. W. Garvan, et al. (2011) (31)
N=209 NBDE Part I – r= 0.29, p<0.0001*** NBDE Part II – r= 0.09, p=0.2092**
Kim, M. and J. I. Lee (2007) (24)
N=90 First-semester GPA – β 0.229, p<0.05***
Kingsley, K., J. Sewell, et al. (2007) (12)
N=275 Correlation: NBDE- r= 0.152, p>0.05*** Overall Dental school GPA – r= 0.132, p>0.05*** Regression: NBDE-I – β 0.069, p=0.600
The DAT-SNS seems to have moderate to weak predictive validity for most academic performance outcomes (22, 26),
and moderate predictive validity for board examinations scores with the US NBDE Part I and II (26). Also, the DAT-SNS
showed weak concurrent validity, as it was unable to distinguish between those who passed CRDTS exam and those
who failed (26). As for convergent/divergent validity, Holmes et al. (26) observed a strong positive correlation with
DAT Academic Average and moderate positive correlation with DAT Perceptual Ability (DAT-PAT), but that was not
significantly correlated with GPA scores.
Similar results were found with individual subsections of the DAT-SNS. The ADA (22) found DAT-Biology to have a
weak positive correlation with first and second-year Biomedical grades, first and second-year GPA, and first and
second-year Pre-clinical techniques grades. Kim and Lee (24) also found DAT-Biology to have a positive relationship
with performance in the first semester of dental school. As for national board examination performance, DAT-Biology
was found to have a positive relationship with NBDE Part I (12, 31) and Part II (31).
DAT-Quantitative Reasoning (DAT-QR)
DAT-Quantitative Reasoning (DAT-QR) is one of the sections of ADA-DAT, which assesses problem-solving skills
through mathematical skills. Four of the thirty-six studies assessed DAT-PAT’s validity, all using the ADA-DAT version
(see Table 6 and Appendix A Table A2). Results show that DAT-QR has weak to moderate predictive validity on
student performance during the first and second year of dental school, although the strength of this association
decreases slightly in the second year of dental school (22) and was found not significant for global dental school GPA
(12). Also, Allareddy, Howell & Karimbux (30) found DAT-QR to be non-significantly correlated with obtaining Honours
mention in first and third comprehensive examination, but significantly correlated with obtaining Honours mention in
the second year examination. As for licensing exams, DAT-QR was found to be non-significantly correlated with the
US NBDE Part I (12, 31) and Part II (31).
Table 6: Summary of the results on the predictive validity of DAT-Quantitative Reasoning
Authors (year) Study participants Predictive validity – Strength of association Allareddy, V., T. H. Howell, et al. (2012) (30)
n=66 Obtaining Honours in first comprehensive evaluation – OR 0.99, p=0.95 Obtaining Honours in second comprehensive evaluation – OR 2.48, p=0.03*** Obtaining Honours in third comprehensive evaluation – OR 0.89, p=0.70
American Dental Association (2012) (22)
2009, n=49; 2010, n=47 dental schools
First-Year Biomedical - median r= 0.36, p<0.05*** First-Year GPA - median r= 0.34, p<0.05*** First-Year Pre-clinical Dental Techniques grades – median r= 0.20, p<0.05***
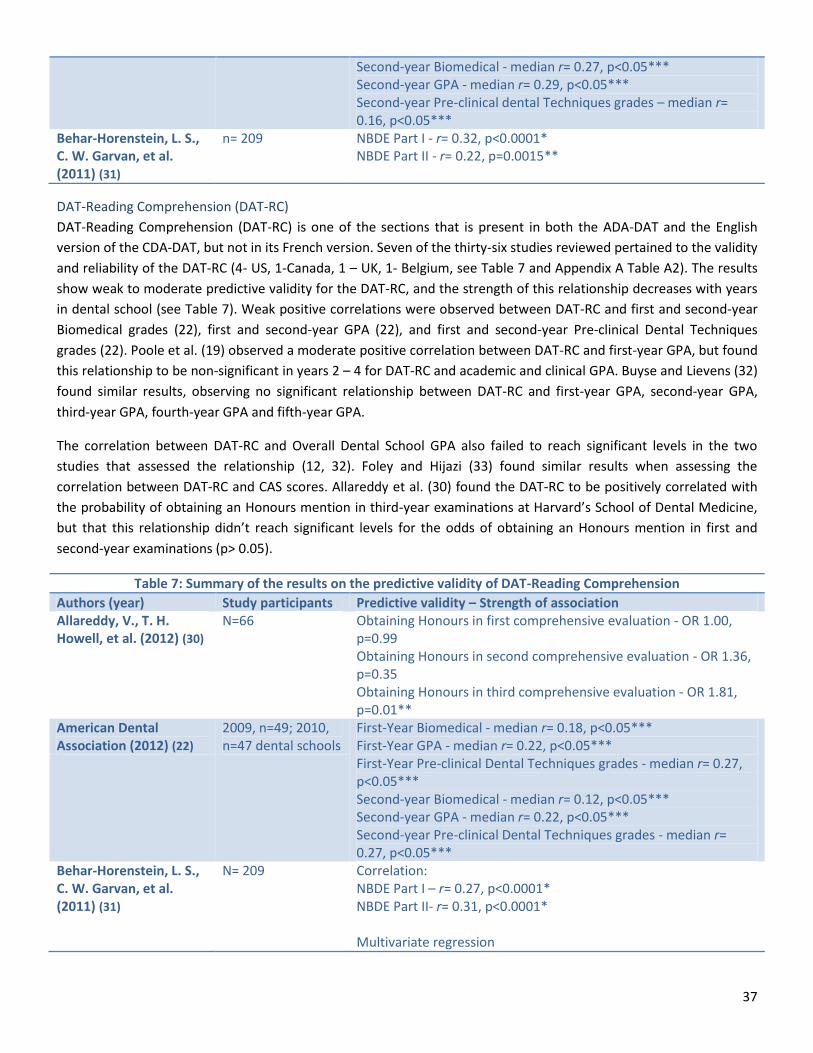
37
Second-year Biomedical - median r= 0.27, p<0.05*** Second-year GPA - median r= 0.29, p<0.05*** Second-year Pre-clinical dental Techniques grades – median r= 0.16, p<0.05***
Behar-Horenstein, L. S., C. W. Garvan, et al. (2011) (31)
n= 209 NBDE Part I - r= 0.32, p<0.0001* NBDE Part II - r= 0.22, p=0.0015**
DAT-Reading Comprehension (DAT-RC)
DAT-Reading Comprehension (DAT-RC) is one of the sections that is present in both the ADA-DAT and the English
version of the CDA-DAT, but not in its French version. Seven of the thirty-six studies reviewed pertained to the validity
and reliability of the DAT-RC (4- US, 1-Canada, 1 – UK, 1- Belgium, see Table 7 and Appendix A Table A2). The results
show weak to moderate predictive validity for the DAT-RC, and the strength of this relationship decreases with years
in dental school (see Table 7). Weak positive correlations were observed between DAT-RC and first and second-year
Biomedical grades (22), first and second-year GPA (22), and first and second-year Pre-clinical Dental Techniques
grades (22). Poole et al. (19) observed a moderate positive correlation between DAT-RC and first-year GPA, but found
this relationship to be non-significant in years 2 – 4 for DAT-RC and academic and clinical GPA. Buyse and Lievens (32)
found similar results, observing no significant relationship between DAT-RC and first-year GPA, second-year GPA,
third-year GPA, fourth-year GPA and fifth-year GPA.
The correlation between DAT-RC and Overall Dental School GPA also failed to reach significant levels in the two
studies that assessed the relationship (12, 32). Foley and Hijazi (33) found similar results when assessing the
correlation between DAT-RC and CAS scores. Allareddy et al. (30) found the DAT-RC to be positively correlated with
the probability of obtaining an Honours mention in third-year examinations at Harvard’s School of Dental Medicine,
but that this relationship didn’t reach significant levels for the odds of obtaining an Honours mention in first and
second-year examinations (p> 0.05).
Table 7: Summary of the results on the predictive validity of DAT-Reading Comprehension
Authors (year) Study participants Predictive validity – Strength of association Allareddy, V., T. H. Howell, et al. (2012) (30)
N=66 Obtaining Honours in first comprehensive evaluation - OR 1.00, p=0.99 Obtaining Honours in second comprehensive evaluation - OR 1.36, p=0.35 Obtaining Honours in third comprehensive evaluation - OR 1.81, p=0.01**
American Dental Association (2012) (22)
2009, n=49; 2010, n=47 dental schools
First-Year Biomedical - median r= 0.18, p<0.05*** First-Year GPA - median r= 0.22, p<0.05*** First-Year Pre-clinical Dental Techniques grades - median r= 0.27, p<0.05*** Second-year Biomedical - median r= 0.12, p<0.05*** Second-year GPA - median r= 0.22, p<0.05*** Second-year Pre-clinical Dental Techniques grades - median r= 0.27, p<0.05***
Behar-Horenstein, L. S., C. W. Garvan, et al. (2011) (31)
N= 209 Correlation: NBDE Part I – r= 0.27, p<0.0001* NBDE Part II- r= 0.31, p<0.0001* Multivariate regression

38
NBDE Part I - not included in the model NBDE Part II - p=0.0023 (range undisclosed)**
Buyse, T. and F. Lievens (2011) (32)
Y1 n=781, Y2 n=489, y3 n=343, Y4 n=274
First-year GPA - r= 0.18, p>0.05 Second-year GPA - r= 0.11, p>0.05 Third-year GPA - r= 0.10, p>0.05 Fourth-year GPA - r= 0.04, p>0.05 Fifth-year GPA - r= 0.20, p>0.05 Overall Dental School GPA - r= 0.14, p>0.05
Foley, J. I. and K. Hijazi (2013) (33)
N=75 CAS scores - r= 0.27, p=0.304
Kingsley, K., J. Sewell, et al. (2007) (12)
N=275 Correlation: NBDE - r= 0.318, p<0.05*** Overall Dental school GPA - r= 0.322, p<0.05*** Regression: NBDE-I - β 0.310, p=0.041***
Poole, A., V. M. Catano, et al. (2007) (19)
Y1 n=373, Y2 n=237, Y3 n=176, and Y4 n=161
First-year GPA - r= 0.25, p<0.05*** Second-year Clinical GPA - r= 0.02, p>0.05 Second-year Academic GPA - r= 0.13, p>0.05 Third-year Clinical GPA - r= 0.13, p>0.05 Third-year Academic GPA - r= 0.04, p>0.05 Fourth-year Clinical GPA - r= 0.11, p>0.05 Fourth-year academic GPA - r= 0.11, p>0.05
As for Board Examination performance, contradictory results were found. In one case, Kingsley et al. (12) found a
positive relationship between DAT-RC and NBDE Part I, while in another, Behar-Horenstein et al. (31) found no
significant relationship between the two variable (p>0.05), but observed a moderate positive correlation between
DAT-RC and NBDE Part II.
DAT-Perceptual Ability Test (DAT-PAT)
DAT-Perceptual Ability Test (DAT-PAT) is one of the sections of the DAT, which aims to assess the perceptual ability of
a candidate in angle discrimination, form development, cubes, orthographic projections and apertures (34). As stated
by the ADA (29), “those factors [...] constitute the major attributes of one's ability to perceive small differences [and
therefore] are valuable in selecting applicants who need fine manual dexterity”. Twelve of the thirty-six studies
assessed DAT-PAT’s validity (nine using the ADA-DAT version, one the CDA version). The results show weak to
moderate predictive validity for the DAT-PAT, although strength of the correlation seems to decrease with the years
(see Table 8 and Appendix A Table A2).
First-year performance: DAT-PAT scores were found weakly correlated to first-year GPA. DAT-PAT was also weakly
correlated to first-year individual courses grades, such as first-year biomedical grades (22), first-year Pre-clinical GPA
(22), and first-year laboratory and study skills grades (35).
Second-year performance: DAT-PAT were found to be weakly correlated with second-year pre-clinical GPA (19, 22),
but not significantly correlated with second-year academic GPA (19). The ADA (22) found a weak positive correlation
between DAT-PAT and second-year Biomedical and GPA. Victoroff and Boyatzis (36) even found DAT-PAT to be
negatively correlated with Preclinical GPA.

39
Table 8: Summary of the results on the predictive validity of DAT-Perceptual Ability Test
Authors (year) Study participants Predictive validity – Strength of association Allareddy, V., T. H. Howell, et al. (2012) (30)
n=66 Obtaining Honours in first comprehensive evaluation - OR 93, p=0.69 Obtaining Honours in second comprehensive evaluation - OR 89, p=0.60 Obtaining Honours in third comprehensive evaluation - OR 0.87, p=0.53
American Dental Association (2012) (22)
2009, n=49; 2010, n=47 dental schools
First-Year Biomedical - median r= 0.27, p<0.05*** First-Year GPA - median r= 0.24, p<0.05*** First-Year Pre-clinical Dental Techniques grades - median r= 0.12, p<0.05*** Second-year Biomedical - median r= 0.12, p<0.05*** Second-year GPA - median r= 0.19, p<0.05*** Second-year Pre-clinical dental Techniques grades - median r= 0.12, p<0.05***
Behar-Horenstein, L. S., C. W. Garvan, et al. (2011) (31)
n=209 Correlation: NBDE Part I - r= 0.06, p=0.3865 NBDE Part II - r= 0.13, p=0.0618 Multivariate regression NBDE Part I and Part II - not included in the model
Curtis, D. A., S. L. Lind, et al. (2007) (25)
Normally tracking students (n=49) and underachieving students (n=45)
Correlation: Normally tracking students: First-year GPA - r= 0.05, p>0.05 Fourth-year GPA - r= 0.03, p>0.05 Underachieving students: First-year GPA - r= 0.15, p>0.05 Fourth-year GPA - r= 0.14, p>0.05 Multivariate regression: Normally tracking students: First-year GPA - β = 0.00, p=0.08 Fourth-year GPA - β = 0.00, p=1.00 Underachieving students: First-year GPA - β = 0.01, p=0.74 Fourth-year GPA - β = 0.01, p=0.49
Holmes, D. C., J. V. Doering, et al. (2008) (26)
n= 574 Overall Dental School GPA - r= 0.370, p<0.05 NBDE Part I - r= 0.363, p<0.05NBDE Part II– r= 0.344, p<0.05 Final Clinical grade - r= 0.259, p<0.05
Kim, M. and J. I. Lee (2007) (24)
n=90 First-semester GPA - range undisclosed, p>0.05
Lundergan, W. P., E. J. Soderstrom, et al. (2007) (35)
n=51 First-year Laboratory and study skills - r= 0.271, p<0.05*** Operative Dentistry grades - r= 0.308, p<0.05*** Fixed Prosthodontics grades - r= 0.318, p<0.05*** Endodontics grades - range undisclosed, p>0.05*** Dental Anatomy grades - r= 0.447, p<0.05***

40
Clinical GPA - r= 0.423, p<0.05*** Class rank - range undisclosed, p>0.05
Park, S. E., J. D. Da Silva, et al. (2010) (28)
n=159 TXAD with Honours - OR 11, p=0.13
Poole, A., V. M. Catano, et al. (2007) (19)
Y1 n=373, Y2 n=237, Y3 m= 176, Y4 n=161
First-year GPA - r= 0.21, p<0.05*** Second-year clinical - r= 0.27, p<0.05*** Second-year academic - r= 0.16, p>0.05 Third-year clinical - r= -0.02, p>0.05 Third-year academic - r= 0.09, p>0.05 Fourth-year clinical - r= - 0.15, p>0.05 Fourth-year academic - r= -0.08, p>0.05
Victoroff, K. Z. and R. E. Boyatzis (2013) (36)
n=100 Didactic GPA - Model I: β= 0.038, p>0.05 Model II β= 0.041, p>0.05 Pre-clinical GPA - Model I: β= 0.388, p≤0.0001* Model II: β= 0.373, p≤0.0001*, Model III: β= 0.360, p≤0.0001* Clinical GPA - Model I: β= -0.028, p>0.05 Model II β= -0.163, p>0.05 Model III: β= -0.134, p>0.05
Third and fourth-year performance: DAT-PAT was found to be insignificantly correlated with third-year academic and
clinical GPA (19) and fourth-year academic and clinical GPA (19). Similarly, Victoroff and Boyatzis (36) found DAT-PAT
to be not significantly correlated to clinical and didactic GPA (p>0.05).
NBDE Board examination performance: As for predicting board examination results, DAT-PAT scores were found to
be insignificantly correlated to the US NBDE Part I (12, 31) and Part II (31).
Concurrent and Convergent/Divergent validity: Finally, the DAT-PAT shows not only weak concurrent validity but
also weak convergent validity, only being correlated with DAT Reading Comprehension (19), and DAT Academic
Average (19).
DAT-Academic Average (DAT-AA)
The ADA defines the DAT Academic Average (DAT-AA) as the “average of the standard scores on the Quantitative
Reasoning, Reading Comprehension, Biology and General and Organic Chemistry tests”(22). Eight of the thirty-six
studies assessed DAT-AA’s validity. The DAT seems to have weak to moderate predictive validity for most academic
performance outcomes, and debatable predictive validity for Board examinations scores (see Table 9 and Appendix A
Table A2).
First-year performance: Results show a moderate to weak correlation to first-year GPA7 (19, 22) as well as moderate
positive correlation with first-year Biomedical grades (22) and weak positive correlation with first Pre-clinical grades
(22). Furthermore, Allareddy et al. (30) found that the DAT-AA scores do not appear to be significantly correlated with
obtaining Honours mention in first-year comprehensive examination.
Second-year performance: In the second-year, a weak correlation is observed with second-year Biomedical grades
(22), second year GPA (22) and second year Pre-clinical Dental Techniques grades (22). Oddly, Allareddy et al. (30)
7 Curtis et al. 25. Curtis DA, Lind SL, Plesh O, Finzen FC. Correlation of admissions criteria with academic performance in dental
students. Journal of Dental Education 2007;71(10):1314-1321. observed a correlation between DAT-AA and first and fourth-year GPA, but only for normally tracking students, and this relationship was not found statistically significant in the multivariate regression model.

41
found the DAT-AA scores to be negatively associated with obtaining Honours mention in second-year examination
(OR 0.08, although this association didn’t reach significance levels (p=0.06). Victoroff and Boyatzis (36) also found
that DAT-AA positively correlated with Didactic GPA, but, surprisingly, was negatively correlated with Preclinical GPA.
Third and fourth-year performance: As for clinical performance, results suggest weak to null predictive validity. DAT-
AA scores were not significantly correlated with obtaining Honours mention in third-year comprehensive examination
(30) and clinical GPA (36), and Holmes et al. (26) only observed a weak correlation between DAT-AA and Final Clinical
Grade. Curtis et al. (25) also observed a weak positive correlation with fourth-year GPA for normally tracking
students, but DAT-AA was not significantly correlated with fourth-year GPA for underachieving students (p>0.05).
Table 9: Summary of the results on the predictive validity of DAT-Academic Average
Authors (year) Study participants
Predictive validity – Strength of association
Allareddy, V., T. H. Howell, et al. (2012) (30)
n=66 Obtaining Honours in first comprehensive evaluation - OR 2.68, p=0.20 Obtaining Honours in second comprehensive evaluation - OR 0.08, p=0.06 Obtaining Honours in third comprehensive evaluation - OR 2.49, p=0.34
American Dental Association (2012) (22)
2009, n=49; 2010, n=47 dental schools
First-Year Biomedical - median r= 0.32, p<0.05***, R2 = 0.13 First-Year GPA - median r= 0.30, p<0.05***, R2 = 0.12 First-Year Pre-clinical Dental Techniques grades - median r= 0.17, p<0.05***, R2 = 0.14 Second-year Biomedical - median r= 0.24, p<0.05***, R2 = 0.11 Second-year GPA - median r= 0.26, p<0.05***, R2 = 0.12 Second-year Pre-clinical dental Techniques grades - median r= 0.15, p<0.05***, R2 = 0.13
Behar-Horenstein, L. S., C. W. Garvan, et al. (2011) (31)
N=209 Correlation: NBDE part I - r= 0.45, p<0.0001* NBDE Part II - r= 0.27, p<0.0001* Multivariate regression: NBDE part I - scope undisclosed, p≤0.0001 NBDE Part II - not included
Curtis, D. A., S. L. Lind, et al. (2007) (25)
Normally tracking students (n=49) and underachieving students (n=45)
Correlation: Normally tracking students: First-year GPA - r= 0.36, p<0.05*** Fourth-year GPA - r= 0.28, p<0.05 *** Underachieving students: First-year GPA - r= 0.21, p>0.05 Fourth-year GPA - r= 0.08, p>0.05 Multivariate regression: Normally tracking students: First-year GPA - β = 0.04, p=0.11
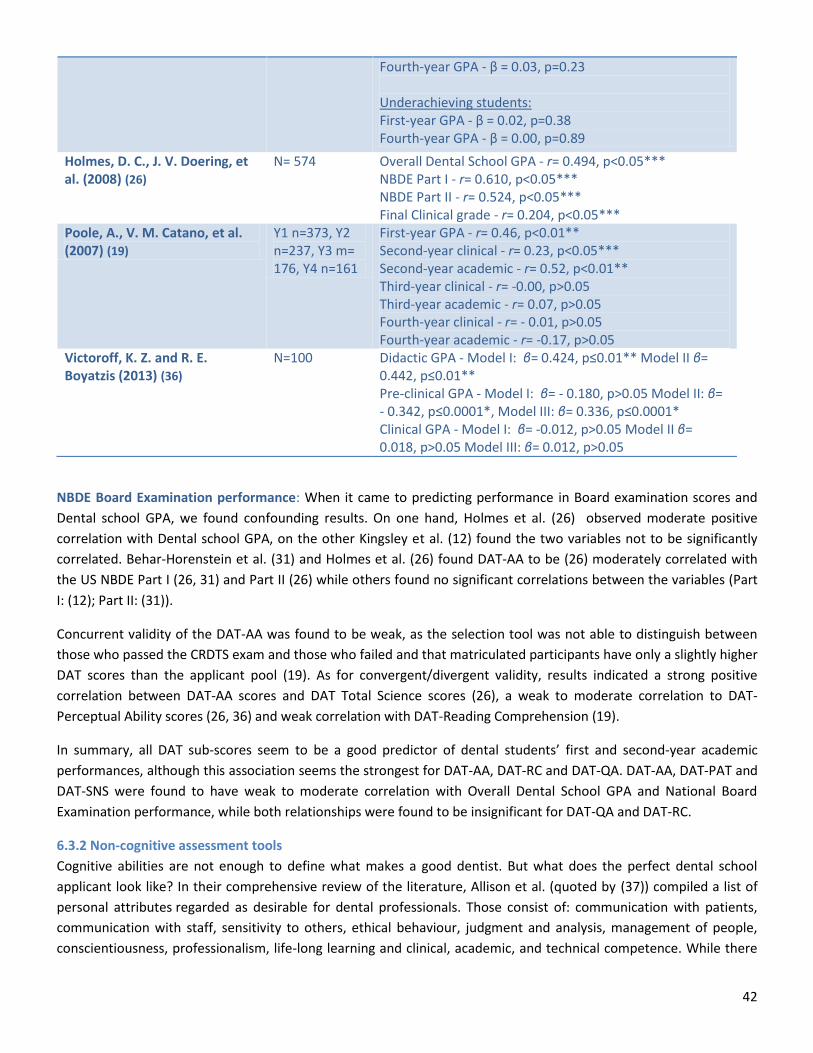
42
NBDE Board Examination performance: When it came to predicting performance in Board examination scores and
Dental school GPA, we found confounding results. On one hand, Holmes et al. (26) observed moderate positive
correlation with Dental school GPA, on the other Kingsley et al. (12) found the two variables not to be significantly
correlated. Behar-Horenstein et al. (31) and Holmes et al. (26) found DAT-AA to be (26) moderately correlated with
the US NBDE Part I (26, 31) and Part II (26) while others found no significant correlations between the variables (Part
I: (12); Part II: (31)).
Concurrent validity of the DAT-AA was found to be weak, as the selection tool was not able to distinguish between
those who passed the CRDTS exam and those who failed and that matriculated participants have only a slightly higher
DAT scores than the applicant pool (19). As for convergent/divergent validity, results indicated a strong positive
correlation between DAT-AA scores and DAT Total Science scores (26), a weak to moderate correlation to DAT-
Perceptual Ability scores (26, 36) and weak correlation with DAT-Reading Comprehension (19).
In summary, all DAT sub-scores seem to be a good predictor of dental students’ first and second-year academic
performances, although this association seems the strongest for DAT-AA, DAT-RC and DAT-QA. DAT-AA, DAT-PAT and
DAT-SNS were found to have weak to moderate correlation with Overall Dental School GPA and National Board
Examination performance, while both relationships were found to be insignificant for DAT-QA and DAT-RC.
6.3.2 Non-cognitive assessment tools
Cognitive abilities are not enough to define what makes a good dentist. But what does the perfect dental school
applicant look like? In their comprehensive review of the literature, Allison et al. (quoted by (37)) compiled a list of
personal attributes regarded as desirable for dental professionals. Those consist of: communication with patients,
communication with staff, sensitivity to others, ethical behaviour, judgment and analysis, management of people,
conscientiousness, professionalism, life-long learning and clinical, academic, and technical competence. While there
Fourth-year GPA - β = 0.03, p=0.23 Underachieving students: First-year GPA - β = 0.02, p=0.38 Fourth-year GPA - β = 0.00, p=0.89
Holmes, D. C., J. V. Doering, et al. (2008) (26)
N= 574 Overall Dental School GPA - r= 0.494, p<0.05*** NBDE Part I - r= 0.610, p<0.05*** NBDE Part II - r= 0.524, p<0.05*** Final Clinical grade - r= 0.204, p<0.05***
Poole, A., V. M. Catano, et al. (2007) (19)
Y1 n=373, Y2 n=237, Y3 m= 176, Y4 n=161
First-year GPA - r= 0.46, p<0.01** Second-year clinical - r= 0.23, p<0.05*** Second-year academic - r= 0.52, p<0.01** Third-year clinical - r= -0.00, p>0.05 Third-year academic - r= 0.07, p>0.05 Fourth-year clinical - r= - 0.01, p>0.05 Fourth-year academic - r= -0.17, p>0.05
Victoroff, K. Z. and R. E. Boyatzis (2013) (36)
N=100 Didactic GPA - Model I: β= 0.424, p≤0.01** Model II β= 0.442, p≤0.01** Pre-clinical GPA - Model I: β= - 0.180, p>0.05 Model II: β= - 0.342, p≤0.0001*, Model III: β= 0.336, p≤0.0001* Clinical GPA - Model I: β= -0.012, p>0.05 Model II β= 0.018, p>0.05 Model III: β= 0.012, p>0.05

43
seems to be a consensus on the importance of these abilities, the way they could be evaluated through the admission
process is still up for debate. As our results will show, there is a high degree of variability in the validity and reliability
of the different tools used in the dental school admission process. Our analysis will concentrate on four types of
selection tools: interview, manual dexterity evaluations, personality and values assessment tests, and situational
judgment tests.
6.3.2.1 Interviews
Nine out of the thirty-six articles explored the validity and reliability of a type of interview admission tool for the
dental admission process. The purpose of these tools is to assess non-cognitive abilities such as communication skills
and personality traits, and to validate the applicant’s interest in the dental profession. The review highlighted three
main types of interview formats currently being used: unstructured interviews, structured interviews, and multiple
mini-interviews (see Table 10 and Appendix D Table D3). All three formats will be explored in this section.
Table 10: Summary of the results on the predictive validity of Interview formats
Authors (year) Study participants
Predictive validity – Strength of association
Unstructured/semi-structured interview Kim, M. and J. I. Lee (2007) (24)
n=90 First-semester GPA – β=-0.272, p<0.01**
Structured interview Gardner, S. P. and K. F. Roberts-Thomson (2012) (38)
n=216 Achieving more three credits and more in first-year Excellent (1 – reference) Very good RR 0.88, p=0.545 Adequate/barely adequate RR 0.86, p=0.554 Achieving more three credits and more in second-year Excellent (1 – reference) Very good RR 0.93, p=0.731 Adequate/barely adequate RR 0.89, p=0.644 Achieving more three credits and more in third-year Excellent (1 – reference) Very good, RR 0.63, p=0.074 Adequate/barely adequate RR 0.57, p=0.123
Poole, A., V. M. Catano, et al. (2007) (19)
Y1 n=373, Y2 n=237, Y3 n=176, and Y4 n=161
First-year GPA – r= 0.11, p>0.05 Second-year clinical – r= -0.06, p>0.05 Second-year academic – r= 0.10, p>0.05 Third-year clinical – r= -0.31, p<0.05*** Third-year academic – r= 0.21, p>0.05 Fourth-year clinical – r= 0.44, p<0.001*** Fourth-year academic – r= 0.10, p>0.05
Rich, A. M., K. M. S. Ayers, et al. (2012) (39)
n= 411 Top half of the class – second-year – Total score 12 = n=93, p>0.05; Total score <12 = n= 17, p>0.05 Top-half of the class – fifth-year - Total score 12 = n=93, p>0.05; Total score <12 = n= 17, p>0.05 Graduation with credit or distinction - Total score 12 = n=19, p>0.05; Total score <12 = n= 24, p>0.05 Any subject prize - Total score 12 = n=4, p>0.05; Total score <12 = n= 9, p>0.05

44
Any subject distinction - Total score 12 = n=1, p>0.05; Total score <12 = n= 2, p>0.05 Remedial Examination Required – Total score 12 = n=3, p>0.05; Total score <12 = n= 7, p>0.05
Multiple Mini-Interview Foley, J. I. and K. Hijazi (2013) (33)
n=75 CAS scores – Teamwork - r= 0.097, p=0.024*** CAS scores – Communication skills - r= 0.31, p=0.035 CAS scores – Work experience - r= 0.189, p=0.001** CAS scores – Manual dexterity - r= 0.126, p=0.03*** CAS scores – Commitment to Aberdeen - r= 0.112, p=0.119 CAS scores – Core Qualities - r= 0.046, p=0.282 CAS scores – Article review - r= 0.051, p=0.304
Unstructured interviews
Also called non-directive interviews, unstructured interviews can be defined as a free-flowing exchange of
information between candidate and examiner, on a predetermined subject. In some cases, the questions are pre-
determined. These can be referred to as semi-structured interview, but are still considered to fall under the
unstructured format. Over the years, the validity and reliability of these interview-types have been widely
questioned, especially given the high stakes nature of the dental admission process. The only article in our review
that assessed the validity of a semi-structured interview seems to corroborate this view. In 2005, Seoul National
University started to use a semi-structured interview in their admission process, which covered three domains:
“aptitudes (interest, career knowledge, and motivation), professional attitude (ethics and service experiences) and
interpersonal skills (communication and personality)” (24). While exploring the factors that influence student
performance, Kim and Lee (24) found that unstructured interview scores were negatively correlated to achievement
in first semester. Thus, in that case, not only was the selection tool unable to predict performance, but relying on its
results may in fact be counter-productive.
Structured interviews
In the mid-1980s, researchers observed that the degree of structure of an interview influenced both its reliability and
validity. Therefore, a new format known as a “structured interview” was developed. There are two common types of
structured interviews: the situational interview and the patterned behaviour description interview (19). A situational
interview consists of asking a candidate how she or he would respond in a variety of hypothetical situations, often
job-related (18). On the other hand, in a patterned behaviour description interview, candidates are asked about past
behaviour in a given situation, the rational being that past behaviour should predict future actions (19). Both rely on a
high level of interview structure, which can be defined by “the use of a scoring rubric, question standardization, the
use of probing, and other factors” (40). Overall, structured interviews seem to have a slightly better predictive validity
than the unstructured format (see Table 10).
Poole et al. (19) found that CDA structured interview8 scores, once corrected for range restriction and measurement
error, were moderately correlated with third and fourth-year clinical GPA, but not with first-year GPA, second-year
8 Faced with concerns over the validity of the old (1980) CDA semi-structured interview, a new CDA structured interview was
developed by the DAT Committee and used in participating dental schools in the year 2000. This interview covers seven core
competencies that were identified by a previous study using job analysis techniques, which are: communication, conscientiousness,
integrity, judgment and analysis, self-control, sensitivity to others, and tact and diplomacy. To assess each of these competencies,
more than 500 critical incidents pertaining to these competencies were retained, and each incident was edited in both a situational

45
clinical and academic GPA, and third and fourth-year academic GPA. Yet, in other contexts, structured interviews
were non-significantly correlated with achieving three or more credits in years 1, 2, and 3 (38), nor with predicting
top half of the class in years 2 and 5, graduation with credit or distinction, any subject distinction, any subject prize or
remedial examination required (39). Results suggest that structured interviews’ convergent/divergent validity with
other cognitive and non-cognitive selection tools is weak (NS for DAT-AA, DAT-RC, and DAT-PAT but weak positive
correlation with NEO-PI-R extraversion and openness to experience factors r= 0.27- 0.21, p<0.01, n= 161 (19) to non-
existent (Graduate Australian Medical School Admission Test (GAMSAT)9, first-year progress scores (37). Content
validity was also found to be weak, as structured interview scores were unable to predict top half of the class in the
second and fifth-year, graduation with credit or distinction, any subject distinction, any subject prize, or remedial
examination required (39).
Multiple Mini-Interviews (MMI)
Pioneered at McMaster University in 2002, multiple mini-interviews is an interview format whereby applicants pass
through a pre-determined number of stations – usually between seven to ten – where short structured interviews are
then conducted, each time assessed by different evaluators. This multiple sampling approach to assessment, derived
from techniques used by the evaluation research discipline, aims to increase reliability of the interview as an
assessment tool by reducing context specificity of applicant’s responses. As Eva and al. (41) highlighted, MMI show
multiple potential strengths, notably:
Flexibility, in the sense that station’s design can be modelled around a blueprint of desired qualities or
competencies established locally by each university;
Multiple insights into applicant’s abilities of competencies;
Increased validity, notably by diluting the effect of examiner’s bias and chance;
Opportunities for candidates to recover from a bad performance on a station;
Lower resources utilization during the interview process – and by extension lower costs;
And finally, a structured format where all candidates respond to the same questions, more easily permitting
comparisons.
Although the potential of Multiple Mini Interview (MMI) in dental admission context has been widely discussed, only
three articles out of the thirty-six assessed MMI’s validity.
Foley and Hijazi (33) assessed the predictive validity of MMI as a selection tool in the 2008-2011 admission process at
the University of Aberdeen Dental School (UK). The MMI consisted on a series of seven seven-minute stations, each
assessed by one trained admission selector. The MMI assessed the following domains: Commitment to the University
of Aberdeen Experience of teamwork; Exploration of the core qualities of a dental practitioner; Communication skills;
Review and assessment of a research article; Previous work experience within dentistry; and Manual dexterity skills.
The results for these stations were then compared with the University’s Common Assessment Scale (CAS10) scores.
interview and a patterned behaviour description interview formats. All interviews were conducted by a panel of two trained
interviewers, who were free to choose either of the two questions designated for each competency. To reduce the potential for test-
retest bias, the question pool differed slightly between universities. Each question is scored on a five-point scale, for a maximum
total of 35 points per interviewer (70 points maximum in total). 9 The Graduate Australian Medical School Australian Admission Test (GAMSAT) is a test similar to the DAT used in the selection
of medical, dental, podiatric, pharmacy, and veterinary science students in Australia. 10
CAS is a score calculated by UK universities that represent the scores for all end-of-term and end-of-year examination
performance. The CAS is not a linear scale, and its range is from 1 to 20, where 9 normally represent the minimum score to be
awarded a pass 33. Foley JI, Hijazi K. The admissions process in a graduate-entry dental school: can we predict academic
performance? British Dental Journal 2013;214(2).

46
The authors found four of the stations weakly but significantly positively correlated to CAS scores, namely: the
communication skills station, the work experiences station, the manual dexterity station, and the teamwork station,
although in the teamwork station case, the limited magnitude of the correlation makes it unlikely that this association
will have a tangible influence on CAS performance.
McAndrew, R. and J. Ellis (42) questioned one hundred and ninety applicants and thirty-eight examiners who
participated in Cardiff University’s 2011 admission process to evaluate MMI’s acceptability by prospective
undergraduate students and interviewers as part of the admission procedure for dental school. The ten MMI stations
covered the following seven areas: “dentistry as a career, logic, reasoning, ethics and plagiarism, manual dexterity,
breaking bad news, research and data interpretation” (42). Both from the applicants’ and the examiners’ points of
view, the MMI format seemed to have high face validity. A total of 64.8% (n=114) of applicants and 89.4% (n=34) of
examiners considered the MMI to be better than unstructured interviews. Applicants’ main critiques of the MMI
were the lack of control/flexibility linked to the structured format, the feeling of anxiety and nervousness when
confronted with a bad performance; the impossibility of preparing for MMI in advance; and the difficulty in
understanding what is being assessed (42). As for examiners, the main critique expressed related to assessors' fatigue
throughout the day given the repetitive nature of asking multiple candidates the same question, especially when the
responses did not vary (one example was of a interview station where candidates were asked why they wanted to be
a dentist and most responses were similar).
Although the primary purpose is to assess non-cognitive constructs such as personality traits, motivation and
competencies, it seems that MMI could have predictive value in evaluating cognitive abilities. Using Item Response
Theory (IRT), Roberts, C., N. Zoanetti, et al. explored the validity of a structured 7 station - 39 question bank MMI on
what they call “level-entry reasoning skills in professionalism”, or basic cognitive reasoning skills (43). The authors
used data for the 2007 admission in a graduate-entry program at the Faculty of Medicine and Dentistry at the
University of Sydney. IRT assumes that the probability of getting a satisfactory score depends on: a) the candidate’s
general ability, b) the leniency/stringency of the evaluator, and c) the difficulty of the items. MMI’s standard
deviations (SDs) by facets were: stringency or leniency 0.52, candidate ability 0.75, and MMI question difficulty 0.27,
which indicates that half of the response’s variations are a reflection of the candidate’s abilities. Their results also
show that the questions are not only conceptually equivalent (overall infit11 mean = 1.03, SD=0.19, range 0.63-1.26;
overall outfit mean 1.03, SD = 0.12, range 0.67-1.26), but also that they could significantly separate the items
according to their level of difficulty, which indicates that the MMI questions fit the assumptions of the IRT model. Yet
further research is needed to definitively assess the validity of MMI as a selection tool, especially for non-cognitive
ability assessment.
In summary, the reliability and validity of interviews vary widely depending on their format. The less structured the
interview is, the lower the reliability and validity it seems to have. Structured interviews were found to be
insignificantly correlated with first and second-year GPA, while being moderately correlated with third and fourth-
year clinical GPA. Structured interviews were also found to be incapable of significantly predicting high or low
performers, as calculated by the probability of receiving distinction or credits, or needing remedial examinations.
MMIs were found to be slightly better predictors of student performance, as MMI scores were found weakly
correlated to CAS scores. Furthermore, MMI was found to have higher face validity than its unstructured counterpart.
11
In a Rasch context, Infit, also called information weighted sum, refers to the extent a model fits the predicted global pattern of
responses (inlying responses pattern). As for Outfit, also called outlier-sensitive fit, it refers to the extent a model fits the predicted
pattern of responses on extreme items (i.e. either extremely easy or very difficult items).

47
6.3.2.2 Manual dexterity tests
Dentistry requires high psychomotor abilities (35). Yet, “there is considerable variation in the speed and degree to
which students acquire the necessary manual dexterity to perform standard clinical procedures in consistent and
clinically acceptable manner.” (44). Hence the interest in adding a manual dexterity test to a dental admission process
that dates as far back as 1937 (45). The original purpose of the ADA Chalk Carving Test was to be used as a screening
tool, to try to isolate applicant with “five thumbs” (46), and to help reduce attrition rate, which as we previously
stated, was considerably high. The rationale behind this assumption is that when low scoring in manual dexterity test,
candidates might reflect on their career choice when faced with their limitations. With increasing comments on its
lack of predictive validity (47), and its debatable construct validity and high utilization costs (48) combined with the
innate-acquired debate around dexterity skills (48), the DAT-PAT was developed and replaced the Chalk Carving test
in 1972 for both Canada and the US. Still, in 1975, with new reports on manual dexterity ability to predict operative
and fixed prosthodontic grades (49, 50), Canada reinstated the CDA-DAT-Chalk carving test. Yet, the debate around
manual dexterity test, and their purpose in admission process, still rages on (51).
To date, there are no standardized methods of assessing dexterity skills (52). Out of the thirty-six studies selected for
this literature review, seven had results pertaining to manual dexterity tests, one being a literature review12. Only one
of the studies assessed manual dexterity tests’ concurrent validity (53), while none assessed their content validity.
Our results found that, although the reliability and predictive abilities of these tools are still debatable, there is
evidence to suggest that these tests are effective in identifying the least favourable candidates from the applicant
pool (see Table 11 and Appendix D Table D4).
Table 11: Summary of the results on manual dexterity tests
Authors (year) Study participants Predictive validity – Strength of association Dental laboratory test Al-Johany, S., M. AlShaafi, et al. (2011) (53)
N=71 Dental skills as assessed by a local performance assessment – descriptive
Handwriting test Al-Johany, S., M. AlShaafi, et al. (2011) (53)
N=71 Dental skills as assessed by a local performance assessment – descriptive
Drawing test Al-Johany, S., M. AlShaafi, et al. (2011) (53)
N=71 Dental skills as assessed by a local performance assessment – descriptive
Composite manual test – content non disclosed or components impossible to differentiate Beier, U.S., I. Kapferer, et al. (2010) (54)
N=97 Average grades after first clinical year – r= -0.373, p<0.01 (negative because of the reverse polarity of the Austrian grade system)** Graduation on time – Yes: Mean 200.04 (SD 35.02), No: 176.76 (SD 41.87), p<0.05***
Giuliani, M., C. Lajolo, et al. (2007) (55)
N= 433 Overall dental school performance (average of all five years’ exams) – β = -0.4428, p=0.672, R2= 0.0024
12
Six other studies were published prior to 1972, but only the citations were available through our university’s article database.
Yet, as these studies were quite extensively assessed by Oudshoorn 4. Oudshoorn WC. The utility of Canadian DAT Perceptual
Ability and Carving Dexterity scores as predictors of psychomotor performance in first-year operative dentistry. Journal of Dental
Education 2003;67(11):1201-1208., we will use this literature review as a baseline and complete it with recent articles.
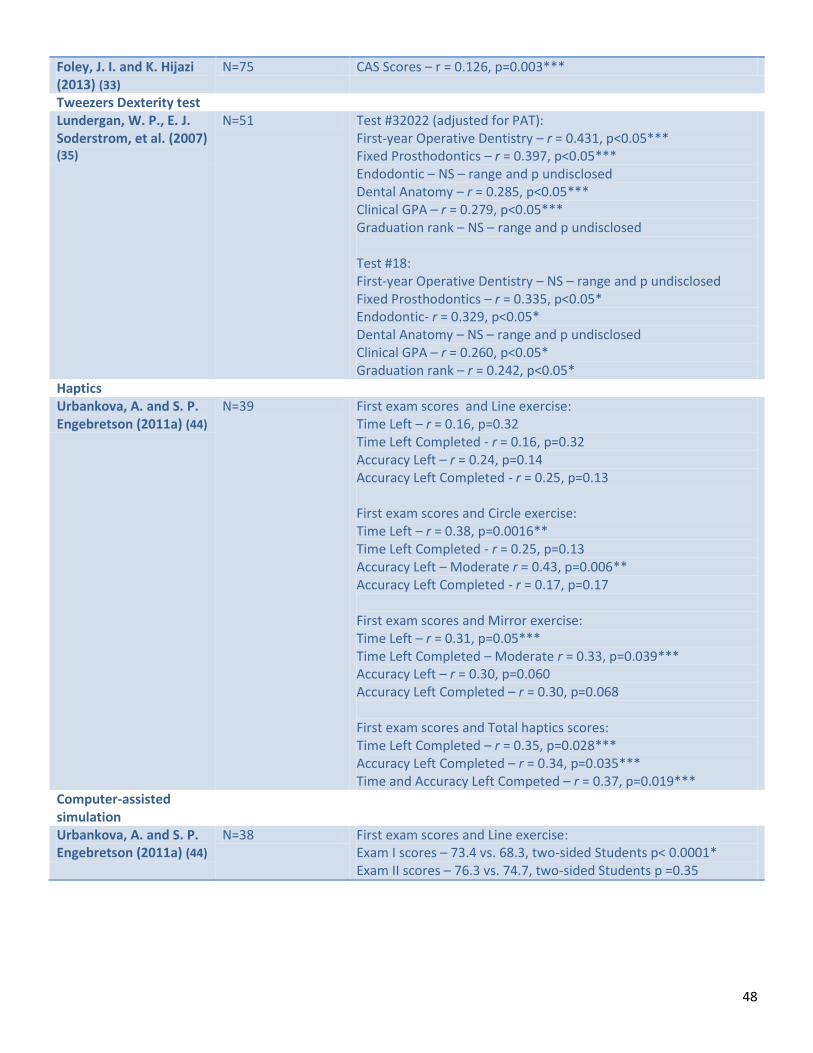
48
Foley, J. I. and K. Hijazi (2013) (33)
N=75 CAS Scores – r = 0.126, p=0.003***
Tweezers Dexterity test Lundergan, W. P., E. J. Soderstrom, et al. (2007) (35)
N=51 Test #32022 (adjusted for PAT): First-year Operative Dentistry – r = 0.431, p<0.05*** Fixed Prosthodontics – r = 0.397, p<0.05*** Endodontic – NS – range and p undisclosed Dental Anatomy – r = 0.285, p<0.05*** Clinical GPA – r = 0.279, p<0.05*** Graduation rank – NS – range and p undisclosed Test #18: First-year Operative Dentistry – NS – range and p undisclosed Fixed Prosthodontics – r = 0.335, p<0.05* Endodontic- r = 0.329, p<0.05* Dental Anatomy – NS – range and p undisclosed Clinical GPA – r = 0.260, p<0.05* Graduation rank – r = 0.242, p<0.05*
Haptics Urbankova, A. and S. P. Engebretson (2011a) (44)
N=39 First exam scores and Line exercise: Time Left – r = 0.16, p=0.32 Time Left Completed - r = 0.16, p=0.32 Accuracy Left – r = 0.24, p=0.14 Accuracy Left Completed - r = 0.25, p=0.13 First exam scores and Circle exercise: Time Left – r = 0.38, p=0.0016** Time Left Completed - r = 0.25, p=0.13 Accuracy Left – Moderate r = 0.43, p=0.006** Accuracy Left Completed - r = 0.17, p=0.17 First exam scores and Mirror exercise: Time Left – r = 0.31, p=0.05*** Time Left Completed – Moderate r = 0.33, p=0.039*** Accuracy Left – r = 0.30, p=0.060 Accuracy Left Completed – r = 0.30, p=0.068 First exam scores and Total haptics scores: Time Left Completed – r = 0.35, p=0.028*** Accuracy Left Completed – r = 0.34, p=0.035*** Time and Accuracy Left Competed – r = 0.37, p=0.019***
Computer-assisted simulation
Urbankova, A. and S. P. Engebretson (2011a) (44)
N=38 First exam scores and Line exercise: Exam I scores – 73.4 vs. 68.3, two-sided Students p< 0.0001* Exam II scores – 76.3 vs. 74.7, two-sided Students p =0.35

49
CDA DAT - Carving Dexterity (DAT-CD)
For Peterson (46), one of the reasons the DAT carving test lacks predictive validity was due to its scoring format. In
1999, CDA DAT-CD scores began to be reported as “ability-referenced standardized scores rather than normalized
scores (4)”, thus reducing the influence of confounding factors (such as year and location variations). Oudshoorn (4)
investigated the utility of the CDA DAT-PAT and Carving Dexterity (DAT-CD) scores as predictors of psychomotor
performance. The DAT-CD was found to be weakly correlated to overall first-year operative technical grades,
although it only accounted for 5.03% of the course’s grade variation. Yet, its ability to effectively discriminate
between students (concurrent validity) was not assessed. The authors also found that together, DAT-CD and DAT-PAT
accounted for 7 to 10% of the overall variation in operative techniques grades.
Handwriting, drawing and laboratory tests
Al-Johany et al. (53) explored the predictive value of three tests: a dental laboratory test consisting of "Class I
amalgam cavity preparation” on a lower right molar ivorine plastic tooth; the quality of handwriting criteria:
smoothness, beauty and continuousness of handwriting; and thirdly a drawing skills test that consisted of drawing
lines as straight as possible. The authors concluded that although the dental laboratory test had no significant
predictive value, 69.6% of students (n = 16) who had excellent drawing skills also had excellent dental skills, as
assessed on a scale of 1 to 10 by two trained evaluators in laboratory settings (8 to 10/10; p <0.01). Only one student
with excellent drawing skills was considered to have poor dental skills (0 to 2/10). As for writing skills, all students
with excellent or good writing skills had good (20%) to excellent (80%) dental skills (6 to 10/10). It has to be noted
that the students used Arabic handwriting format, and that these results may not be transferable to an occidental
context. Also, the small sample size (n= 71) and the fact that no statistical testing methods other than descriptive
analysis were used makes drawing any inference impossible.
Haptics and computer-assisted dental simulation tests
Urbankova and Engebretson (44) assessed the predictive validity of a computer-assisted dental simulation (CDS),
consisting of one four-hour cavity preparation simulation. The goal was to achieve the closest approximation of a
completed cavity preparation during this period. The last two cavity preparations were submitted for evaluation, and
assessed on the quality of the preparation. Exam I and II were preclinical operative dentistry exams on cavity
preparations, where students were asked to complete two cavity preparations for amalgam – (MO on Tooth 4.6 FDI,
#30 Universal, and MO on Tooth 4.5 FDI, #29 Universal), and one occlusal cavity preparation (Tooth 1.5 FDI, #4
Universal) and one amalgam restoration (Tooth 4.6 FDI, #30 Universal). The authors found that students who passed
the CDS not only had significantly higher mean Exam I scores (73.4 vs. 68.3, two sided Students p< 0.0001, n=38) and
mean Exam II scores (but NS) than the one that failed, but also that students who passed CDS test were 30.9 times
more likely to pass Exam I. The only downside is the high cost of CDS, which hinders the scalability potential.
As an alternative to CDS, Urbankova and Engebretson (52) used a haptic device simulating multi-paths carving to try
to predict preclinical operative performance and perceptual ability in dental students. Haptics "relies on computer
force feedback to produce tactile sensation for the user" (p. 1549). Three haptic tests of different difficulty levels
were assessed: the line, the circle and the mirror. The authors observed that the more complex the exercise (circle,
mirror), the more strongly they were correlated to preclinical performance (as assessed by performance in Exam I and
II – see above for description). While none of the assessment criteria of the line exercise was significantly correlated
with preclinical performance, two of the circle tests were correlated with Exam I scores (Time left (TL) and Accuracy
left (AL)), and one with DAT-PAT scores (TL completed). All four of the mirror test assessment criteria were
significantly correlated with Exam I (TL, AL, Time left completed, Accuracy left completed), while only one was weakly
correlated with DAT-PAT scores (AL).

50
Tweezer dexterity tests
Lundergan et al. (35) explored the predictive validity of two tweezers dexterity tests developed for aptitude for
working with small tools, one measuring speed and accuracy (Test #32022), while the other one is a pure speed
assessment (Test #18). The mean score for the first year dental students on the Tweezers dexterity test #18 was only
slightly higher than the national norm (40.42 vs. 39.91), which could suggest that dental students’ tweezers dexterity
skills do not differ from the general population. These tests had limited predictive validity for assessing performance
(grades and rankings) in dental school, and they did not add predictive validity when used in concert with the DAT–
PAT. This was also the case for composite dexterity tests, which all show weak to null ability to predict students’
performance throughout dental school (23, 33, 55).
Composite dexterity tests
Three studies explored the predictive validity of a composite dexterity test (33, 54, 55). Beier et al. (54)found the
composite dexterity test to be moderately and negatively correlated with average grades after first clinical year
(negative correlation because of the reverse polarity of the Austrian grade system) and associated with graduation on
time. Giuliani el al. (55) found no correlation between the composite dexterity test assessed and Overall Dental
School performance, while Foley and Hijazi (33) found a weak positive correlation between a composite dexterity test
and CAS scores, although at r=0.12 this relationship is unlikely to have an actual influence on dental school
performance. Yet, since the content of these tests are either undisclosed, or the influence of their components
impossible to isolate, it is difficult to draw any inference from these studies.
Furthermore, there is great debate on whether dexterity skills can be developed through dental school clinical
training and, in that case, if they should be required from dental school applicants. For some, “basic manual dexterity
is affected by the cognitive and logic abilities acquired during high school, rather than from actually exercising such
skills” (55). However, others believe these skills can be learned and improved through dental school clinical training.
Using ten dexterity exercises (eight Montessori-type material, one used in the Frostig perception test and one in the
Vayer psycho-motor profile), Giuliani et al. (55) found that initial dexterity could improve with training and clinical
practice. Furthermore, they found not only that the dexterity test evaluated was not able to predict academic
achievement (average score of all five years dental school exams), but that students admitted only on the basis of
scientific knowledge still had the highest manual dexterity test scores of the applicant pool. Therefore, these authors
postulate that dexterity tests should not be a part of the selection of dental students. Urbankova and Engerbreton
(52) partially agreed with this point of view, suggesting instead that dexterity assessing should be used as a screening
tool to determine which students could benefit from additional assistance, and to implement strategies to improve
their learning experience. Behar-Horenstein et al. (31) also add that dexterity tests might be beneficial as a
pedagogical tool, “so [students] can acquire insight about their own learning, modify their study habits as needed,
and enhance their knowledge of faculty teaching methodologies”. These views seem to indicate that manual
selection tests, when used as screening tools (which is in fact their original purpose), could be beneficial for students’
educational and academic experience.
6.3.2.3 Situational Judgement Tests
Situational Judgement Tests (SJT) are a “measurement method designed to assess individuals' judgement regarding
situations encountered in the workplace” (5). The first SJT was recorded in 1958, and since then, the assessment
method has been widely used in industrial-organizational psychology. Yet, its use in an applied setting as a selection
tool is fairly recent. In 2010, in his thesis, Grim (56) designed an adaptability situational judgement test (ASJT)

51
designed to be used a valid and reliable selection tool. One of the thirty-six studies pertained to Situational Judgment
Test (SJT – see Table 12 and Appendix D Table D5).
Table 12: Summary of the results on the predictive validity of Situational Judgment tests
Authors (year) Study participants Predictive validity – Strength of association Buyse, T. and F. Lievens (2011) (32)
Y1 n=781, Y2 n=489, Y3 411, Y4 n=343, Y5 n=274
Individualism dimension: First-year GPA – β=0.18, p>0.05 Second-year GPA – β=0.11, p>0.05 Third-year GPA – β=0.10, p>0.05 Fourth-year GPA - β=0.04, p>0.05 Fifth-year GPA - β=0.20, p>0.05 Overall Dental School GPA – β=0.13, p>0.05
*** = p<0.05; ** = p<0.01; * = p<0.001
Using video-based SJT about interactions with patients, Buyse and Lievens (32) assessed SJT’s predictive validity as a
selection tool on students' performance throughout their five years of dental school (n=781, dropping to 274 the last
year). The authors found no relationship between SJT and GPAs for each year (Y1 to Y5), nor with total GPA, and
observed incremental value over cognitive tests only for fifth year (β=.16, R2 = 0.03 for SJT vs. β =0.04 R2 = 0.00 for
cognitive tests). Also, SJT showed weak convergent validity, as it was not significantly correlated with any other
selection tools (cognitive or non-cognitive).
6.3.2.4 Personality and values assessment
Four studies out of thirty-six report findings on either personality or value assessment tools, each assessing a
different selection tool: Hosftede cultural values test, Myer-Briggs Type Test, the NEO-PI-R and the Emotional
Competence Inventory (see Table 13 and Appendix A Table A6).
Table 13: Summary of the results on the predictive validity of Personality and value tests
Authors (year) Study participants Predictive validity – Strength of association Hosftede’s Cultural Dimensions
Itaya, L. E., D. W. Chambers, et al. (2008) (57)
n=144 Second-year GPA: Individualism dimension: β = -0.20, p=0.05*** Power distance dimension: β = -0.05, p=0.68 Long-term orientation dimension: β = 0.02, p=0.88 Masculinity/ Femininity dimension: not included Tolerance to uncertainty dimension: not included
Myer-Briggs Type Test Behar-Horenstein, L. S., C. W. Garvan, et al. (2011) (31)
n=209 NBDE Part II Extraversion/Introversion, range undisclosed, p=0.1098 Intuition/Sensing: not included Feeling/Thinking: range undisclosed, p=0.0133*** Judging/Perceiving: not included
Emotional Competence Inventory – University Version Victoroff, K. Z. and R. E. Boyatzis (2013) (36)
n=100 EI- Self-Awareness Didactic GPA – β=0.186,p>0.05 Preclinical GPA- β= -0.204, p>0.05 Third and Fourth-year Clinical GPA –β= 0.133, p>0.05

52
EI- Self-Management Didactic GPA- β= 0.133, Preclinical GPA – β= -0.398, p≤0.05*** Third and Fourth-year Clinical GPA – β= 0.490, p≤0.05*** EI-Social Awareness Didactic GPA - β= -0.123, p>0.05 Preclinical GPA - β= - 0.045, p>0.05 Third and Fourth-year Clinical GPA - β= -0.313, p>0.05 EI-Relationship Management Didactic GPA – β= 0.507, p≤0.01* Preclinical GPA - β= 0.002, p>0.05 Third and Fourth-year Clinical GPA – β= 0.027, p>0.05
NEO-PI-R Poole, A., V. M. Catano, et al. (2007) (19)
n= 373 Conscientiousness: First-year GPA – r= 0.24, p <0.05*** Second-year clinical GPA – r=0.47, p<0.001* Second-year academic GPA – r=0.32, p<0.05*** Third-year clinical GPA – r = 0.08, p>0.05 Third-year academic GPA – r=0.40, p<0.05*** Fourth-year clinical GPA – r=39, p<0.001** Fourth-year academic GPA – r=0.09, p>0.05 Agreeableness / Extraversion / Neuroticism First-year GPA – r=0.06, p>0.05 Second-year clinical GPA – r=0.12, p>0.05 Second-year academic GPA – r=-0.01, p>0.05 Third-year clinical GPA – r= -0.07, p>0.05 Third-year academic GPA – r=0.12, p>0.05 Fourth-year clinical GPA – r=0.04, p>0.05 Fourth-year academic GPA – r=-0,01, p>0.05 Extraversion First-year GPA – r=-0.03, p>0.05 Second-year clinical GPA – r= -0.09, p>0.05 Second-year academic GPA – r=-0.05, p>0.05 Third-year clinical GPA – r= -0.01, p>0.05 Third-year academic GPA – r=0.08, p>0.05 Fourth-year clinical GPA – r=0.12, p>0.05 Fourth-year academic GPA – r=-0.01, p>0.05 Openness First-year GPA – r=0.01, p>0.05 Second-year clinical GPA – r=-0.13, p>0.05 Second-year academic GPA – r=-0.01, p>0.05 Third-year clinical GPA – r=0.09, p>0.05 Third-year academic GPA – r=0.24, p<0.05*** Fourth-year clinical GPA – r=0.11, p>0.05

53
Fourth-year academic GPA – r=-0.05, p>0.05 Neurotism First-year GPA – r=-0.10, p>0.05 Second-year clinical GPA – r= -0.11, p>0.05 Second-year academic GPA – r=-0.01, p>0.05 Third-year clinical GPA – r=0.02, p>0.05 Third-year academic GPA – r=-0.08, p>0.05 Fourth-year clinical GPA – r= -0.18, p>0.05 Fourth-year academic GPA – r= -0.01, p>0.05
Hofstede’s Cultural Values
Hosftede’s Cultural value index is a validated tool used to assess national cultural values that impact organizational
climate. The five sets of values are: power distance, individualism/collectivism, uncertainty/avoidance,
masculinity/femininity, and long-term orientation. All of the items are scored 1 to 5. The power distance dimension is
the extent to which power (i.e. hierarchical ranking in an organization) is linked to performance.
Individualism/collectivism refers to the prioritization of individual vs. collective needs in an organizational context.
Uncertainty/avoidance refers to the extent emphasis is placed on rules and regulations vs. informal guidelines. The
masculinity/femininity dimension refers to the extent status, roles and power are determined by gender in an
organizational context. Finally, long-term orientation refers to an organizational tendency toward short or long-term
planning. Itaya et al., Chambers and King (57) tried to determine if cultural norms predicted students’ performance
through dental school. Using data from the 1994 to 2004 admissions cycles and determining the students’ cultural
value score through their country of birth, the authors found that Individualism scores have a weak negative
correlation with second-year combined GPA, but all other variables were not significantly correlated for all first and
second year clinical and academic scores and/or dropped for multicolinearity. We suggest caution with these results,
since Hosftede’s index was not meant to be used at an individual level, and that taking mean national score of
country of birth as an individual personal score negates the influence of personality and of the integration process.
Myer-Briggs Type Indicator (MBTI)
The MBTI is based on Jung’s four psychological types (Introversion or Extraversion; Intuition or Sensing; Judging or
Perceiving; Thinking or Feeling). These psychological types may have an influence not only on academic performance,
since they should influence the way information is processed, but even more so on clinical performance – in dental
school and beyond. Behar-Horenstein et al. (31) explored the degree to which MBTI predicts student passage at the
NBDE Part I. The authors found no significant relationship among the four psychological types and NBDE Part I,
although Thinking or Feeling related to NBDE Part II (p=0.0133, range score undisclosed).
Emotional Competence Inventory
Emotional intelligence refers to the “ability to recognize and regulate emotions in ourselves and in others” (58). This
competence is particularly important in the dentist-patient relationship (36), notably in diagnostic and treatment
planning and in effective communication with the patient and other collaborators to attain optimal care (59).
Victoroff and Boyatzis (36) examined the role of emotional intelligence (EI), assessed by the Emotional Competence
Inventory (ECI), on dental student clinical performance. ECI is a 360-degree tool13 that assesses emotional
13
By “360 degree assessment tool”, the authors mean a whole-life assessment tool of emotional intelligence through multiraters
point of view.

54
competence, which is considered a “learned capacity based on emotional intelligence” (60). The ECI 2.0 assesses
eighteen competencies, which are regrouped into four clusters: self-awareness, self-management, social awareness,
and relationship management. The self-awareness contains three competencies: emotional awareness, accurate self-
assessment, and self-confidence. The self-management cluster contains six competencies: emotional self-control,
transparency, adaptability, achievement, initiative, and optimism. The social awareness cluster contains three
competencies: empathy, organizational awareness, and service orientation. Finally, the relationship management
cluster contains six competencies: developing others, inspirational leadership, change catalyst, influence, conflict
management, and teamwork and collaboration. The results show that two of the constructs (EI self-awareness and
social awareness) were not correlated with any of the performance indicators (didactic GPA, preclinical GPA, and
clinical GPA Y3-Y4), while another (EI relationship management) was only positively correlated to didactic GPA. The
last of the four constructs, EI self-management, was found to be negatively related to didactic GPA, but positively
related with preclinical GPA and clinical GPA. Furthermore, EI contributed 12.1% to variation on didactic GPA (Y1-Y2),
6.1% to preclinical GPA, and 14.6% on clinical GPA, which suggest that EI could be an interesting addition to cognitive
tools in dental admission process, even if more research is needed.
NEO Personality Inventory Revised (NEO-PI-R)
The NEO-PI-R is a 240 items measure of the Big Five Personality Traits: agreeableness, conscientiousness,
extraversion, openness to experience, and neuroticism. The NEO-PI-R (UK version, 2013) manual refers to
neuroticism as the extent to which individuals might be prone to psychological distress, such as depression, anxiety or
vulnerability. Agreeableness refers to the preferred type of interactions preferred by the individual, from
altruism/compassion to tough-mindedness. Extraversion refers to the quantity and intensity of energy directed
outwards to the social world. Openness to experience refers to the degree to which individuals appreciate and search
for new experiences. Finally, conscientiousness refers to the degree of
organisation, persistence, control and motivation in goal-motivated
behaviour. Our results show that NEO-PI-R seems to have moderate
concurrent validity, and moderate to weak predictive validity for two
of the indicators (conscientiousness and openness) – see Table 13 and
Appendix A Table A6.
Poole et al. (19) used NEO-PI-R to compare candidates that were
offered and accepted entry to dental school to others that either were
not offered or declined admission. The authors found that dental
schools’ matriculated applicants have higher personality scores for all
factors than non-matriculated applicants. As for predictive validity,
three of the traits (agreeableness, extraversion and neuroticism) had
no significant relationship with all the performance indicators. On the
other hand, conscientiousness correlated with first-year GPA, second-
year clinical grades, second-year academic grades, third-year academic
grades, and fourth-year clinical grades. Last, openness was weakly correlated with third-year academic grades. All
other relationships were found to be not significant (p>0.05). NEO-PI-R also shows potential for incremental
predictive validity (19), although this needs further assessment.

55
6.3.3 Scalability potential and hypothetical biases that might impact student diversity
As our results show, little was found regarding the scalability potential of the different tools assessed, even if cost
considerations (human, material and financial) remain central in the decision of implementing new selection tools.
Moderate to considerable costs associated with the elaboration of the scenarios of two of the newest additions of
the admission “toolbox”, MMI and SJT, have been cited as potential barriers for their implementation14, but none of
the articles tried to assess these costs, nor their potential cost/efficiency gains of these selection tools versus more
traditional measures.
Scalability issues of MMI in a medical context were assessed by Rosenfeld, Reiter, Trinh and Eva (61). The authors
found that MMI required greater infrastructure (interview rooms) and preparation than traditional panel-based
interviews, but fewer person-hours investment (67 hours per applicant, and 16% as much time). As a result, the MMI
interview process was completed in one weekend in 2004, versus two weekends in 2003 when panel-based
interviews were used. Still, the costs of implementing MMI can be off-putting. Another study in the medical
admission setting (62) offered a low-cost method for enhancing structured interviews’ reliability that might be
considered a good alternative to MMI. The authors concluded that “replicating a number of brief interviews, each
with one rater, is likely to be superior to the often recommended [structured] panel interview approach”, and could
be a cost-effective choice without sacrificing validity and reliability (62). Still, further research is needed to see if
these changes would be sufficient.
6.3.4 Student diversity
As for potential biases deriving from the selection tools’ utilization that might impact student diversity, our results
show that cognitive and non-cognitive tools do not seem to disadvantage significantly gender, ethnic/racial or age
groups – or when they do, it is only marginally.
6.3.4.1 Gender
Results show that gender seems to be either not significantly or only marginally correlated with selection tool results.
Gender was not found to be significantly correlated to Overall Pre-dental GPA and Pre-dental Science GPA (12). Males
were found to have slightly higher DAT-AA scores (12, 36), DAT-PA scores (31), DAT-BIO scores (12), DAT-OC (12) and
DAT -average weighted scores (15), but gender was found not significantly correlated with all other DAT sub-scores.
As for non-cognitive assessment tools, gender was not significantly correlated with semi-structured, MMI and
structured interviews performance (33, 37, 42), nor was any relationship found between applicant-interviewer
gender concordance and applicant’s decision to enrol (63). As for personality and values assessment tools, females
tend to have higher scores in agreeableness (r= .1715, p <0.05 n= 359, (19) and neuroticism for the NEO-PI-R test
(r=.28, p <0.001, n=359, (19), while for the MBTI, females are more likely to have a feeling (56% vs. 26%, p< 0.001,
n=209, (31) or judging orientation (82% vs. 68%, p=.0236, n= 209 (31)). For all other items, as EI test, the relationship
between gender and selection tools results did not reach significant value.
6.3.4.2 Socioeconomic background
Using a composite socioeconomic background indicator (measured by high school background), Giuiliani and al. (55)
observed that a classical and/or scientific high school background correlates positively to performance in dental
school (overall dental school GPA), while a vocational (dental mechanical high school) background correlates
14
Although the drafting of the MMI scenarios requires an intensive amount of resources, once this step is done MMI seems to be
more cost effective that traditional interviews. 15
It is unclear whether the authors meant , and that r is a typographical error on their parts, or if they used the wrong statistical
test considering their variable’s format.
56
negatively to performance in dental school. No other relationship between dental school or board examination
performance and socioeconomic background indicators reached a significance level.
6.3.4.3 Age
Age was found to be not significantly related to all selection tools reviewed, except for the extraversion/introversion item of the MBTI tests, where age was associated with lower extraversion scores (28.8 vs. 29.8, p=0.0005).
6.3.4.4 Geographical origin
None of the studies consulted addressed the issue of geographical diversity (i.e. rural/urban divide), and the potential
impact of selections tools on this issue. In the medical context, contradictory results were observed. Raghavan et al.
(64) found that applicants from rural high schools obtained significantly lower scores on the MMI compared with
applicants from urban high schools (4.4 vs. 4.6), hinting that rural students might be disadvantaged by MMI format
interviews. Another study found the opposite results. Wright & Woloschuk (65) examined the progression of rural
students through the admission process. They found that, contrary to common belief, rural students were not
disadvantaged by the interview process; their under-representation was rather based on the fact that fewer of them
applied to medical school. No other selection tools seem to impact on geographical student diversity, in dental or in
other high-stakes admission contexts.
6.3.4.5 Ethnic/racial background
Both for cognitive and non-cognitive assessment tools, ethnic and racial status were generally found to be not
significantly correlated to selection tool performance.
6.3.4.6 Student Diversity overview
Therefore, our results regarding gender, socioeconomic background, age, geographical origin and ethnic/racial
background suggest that the underrepresentation of certain population groups in a dental school’s student body does
not seem to result from biases linked to the selection tools used during the admission process. When exploring race-
neutral alternatives to race-conscious policies, Steinecke, Beaudreau, Bletziger and Terrel (66) proposed three
potential avenues to increase diversity while respecting the new US legal context: firstly, implementing a combination
of lower thresholds for GPAs and MCAT and non-cognitive assessments tools; secondly, using Goggin’s merit-aware
index measures, which measures “the extent to which a student’s achievement [on traditional performance
measures] exceed[s] what could have been reasonably expected given his or her academic background” (p. 120); and
thirdly, using a constrained optimization decision analysis to maximize the predictive power of predictor variables.
Out of the three avenues, the merit-aware index seems to be most promising. Lopez and al. (15) reported on the
University of Minnesota School of Dentistry revised admission process, which includes a measure similar to the merit-
aware index that now accounts for 35% of the total admission score. The factors assessed include: extracurricular
activities, volunteer and work experience, research and shadowing experiences, first-generation and
underrepresented minority status, and personal statements. Merit-aware index-type initiatives are also part of more
holistic “whole-file review” admission processes (67), and have shown considerable positive impact on diversity when
implemented.
Even when appropriate strategies are implemented to increase diversity, other issues may hinder this process. Price
et al. (68) highlighted five main issues that influence admission committees’ effectiveness when trying to impact on
student diversity: dental school’s institutional climate toward diversity; presence of explicit admission committee’s
mission statement toward diversity; diversity in the composition of the committee itself; leadership and function of
the admission committee in supporting and promoting diversity; and finally the presence of evaluation and selection
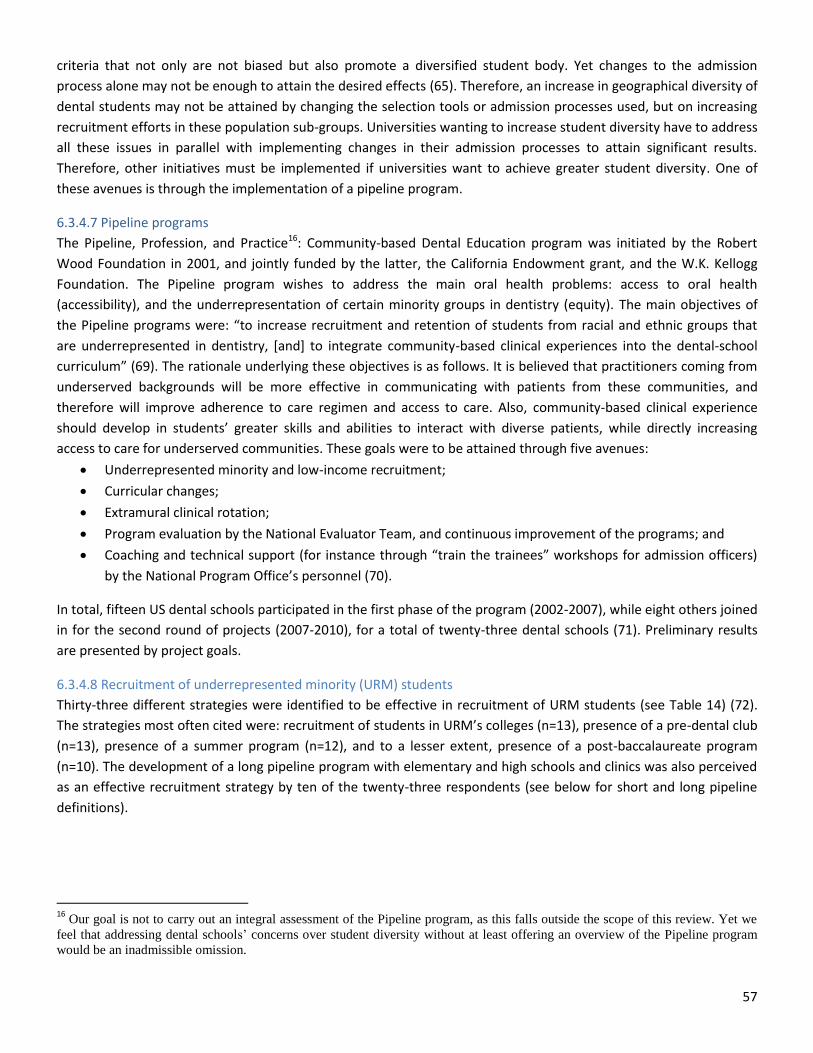
57
criteria that not only are not biased but also promote a diversified student body. Yet changes to the admission
process alone may not be enough to attain the desired effects (65). Therefore, an increase in geographical diversity of
dental students may not be attained by changing the selection tools or admission processes used, but on increasing
recruitment efforts in these population sub-groups. Universities wanting to increase student diversity have to address
all these issues in parallel with implementing changes in their admission processes to attain significant results.
Therefore, other initiatives must be implemented if universities want to achieve greater student diversity. One of
these avenues is through the implementation of a pipeline program.
6.3.4.7 Pipeline programs
The Pipeline, Profession, and Practice16: Community-based Dental Education program was initiated by the Robert
Wood Foundation in 2001, and jointly funded by the latter, the California Endowment grant, and the W.K. Kellogg
Foundation. The Pipeline program wishes to address the main oral health problems: access to oral health
(accessibility), and the underrepresentation of certain minority groups in dentistry (equity). The main objectives of
the Pipeline programs were: “to increase recruitment and retention of students from racial and ethnic groups that
are underrepresented in dentistry, [and] to integrate community-based clinical experiences into the dental-school
curriculum” (69). The rationale underlying these objectives is as follows. It is believed that practitioners coming from
underserved backgrounds will be more effective in communicating with patients from these communities, and
therefore will improve adherence to care regimen and access to care. Also, community-based clinical experience
should develop in students’ greater skills and abilities to interact with diverse patients, while directly increasing
access to care for underserved communities. These goals were to be attained through five avenues:
Underrepresented minority and low-income recruitment;
Curricular changes;
Extramural clinical rotation;
Program evaluation by the National Evaluator Team, and continuous improvement of the programs; and
Coaching and technical support (for instance through “train the trainees” workshops for admission officers)
by the National Program Office’s personnel (70).
In total, fifteen US dental schools participated in the first phase of the program (2002-2007), while eight others joined
in for the second round of projects (2007-2010), for a total of twenty-three dental schools (71). Preliminary results
are presented by project goals.
6.3.4.8 Recruitment of underrepresented minority (URM) students
Thirty-three different strategies were identified to be effective in recruitment of URM students (see Table 14) (72).
The strategies most often cited were: recruitment of students in URM’s colleges (n=13), presence of a pre-dental club
(n=13), presence of a summer program (n=12), and to a lesser extent, presence of a post-baccalaureate program
(n=10). The development of a long pipeline program with elementary and high schools and clinics was also perceived
as an effective recruitment strategy by ten of the twenty-three respondents (see below for short and long pipeline
definitions).
16
Our goal is not to carry out an integral assessment of the Pipeline program, as this falls outside the scope of this review. Yet we
feel that addressing dental schools’ concerns over student diversity without at least offering an overview of the Pipeline program
would be an inadmissible omission.

58
Table 14: Strategies identified to be effective in recruiting URM students by administrators (and number of times cited - Andersen et al. 2009, S239) (72)
Recruitment at URM students’ colleges (n=13) Pre-dental club (n=13) Summer program (n=12) Post-baccalaureate program (n=10) Developing a long pipeline with elementary and high schools and clinics (n=10)
Brochures (n=8)
Pipeline program (n=8) Partnership with URM dental associations Increased visibility of URM recruitment programs (n=7) Scholarships (n= 6) Regional post-baccalaureate program (n=5) Changes in admission process (n=5) Pre-dental advisors (n=5) Faculty mentors (n=5) URM student dental associations (n=4) Partnership with medical school (n=4) Travel and outreach (n=4) Partnership with a community health centre (n=3) Change in faculty attitudes (n=3) Email advisements (n=3) Pressure from state legislators (n=2) Open admissions for out-of-state applicants (n=2) Hiring a recruiter (n=2) Pre-dental counsellor seminars (n=2) Alumni groups (n=2) Having students on admissions and recruitment
committees (n=2) Regional recruitment conferences and efforts (n=2) Connecting with minority groups (n=2) Eliminating institutional barriers (n=1) Having administrative support for diversity (n=1) Developing cohorts of URM students (n=1) Increasing cultural sensitivity in dental school (n=1) Change in interview process (n=1)
There are two designs of pipeline programs. The short pipeline program targets students beyond high school, while
the long pipeline program targets a wider audience (grades 11-12 until first and second-year of college). Activities in
short program pipelines include mentoring programs, summer enrichment programs and pre-dental clubs and
associations, all aiming for a more effective recruitment of URM. As a result of these activities, Andersen et al.(73)
observed a 500% increase in URM students participating in short pipeline, an increase from n=493 in 2003 to n=2,466
in 2007. Greater URM student involvement was also observed for pre-dental clubs (n=1,345 in 2007), summer
enrichment programs (n=396 in 2007), and special mentoring programs (n=311 in 2007). As for the long pipeline
programs, which are “designed to ensure a continuous supply of talented URM students as members of the
profession”(72), they were found to be controversial, “as outcomes of these programs are often difficult to track, and
activities more expensive and distant from the payoff” (72).
The impact of the Pipeline program was also observed in the number of URM applicants and URM enrolees in the
participating dental schools. Only for the first phase of the program (2002-2003 to 2006-2007) the number of URM
applicants increased in all participating dental schools, for a total of a 180% increase (n=3249 in 2006-2007). This
increase was observed for Hispanic students (176%, n=1518 in 2006-2007), for African-American (187%, n=1609 in
2006-2007) and for Native American (153%, n=122 in 2006-2007) (73) .
Other elements to Pipeline programs – Curricular changes
Many revisions occurred in participating dental school curricula, aiming at increasing students’ cultural competence
(74). Those include the addition of new classes and activities on cultural diversity and competence, the expansion of
the cultural content in existing classes, and the revision of the academic program’s structure to prepare for earlier
rotations of community-service work. Additional emphasis was also placed on the importance of cultural competence
in clinical setting throughout the curricula (74).

59
Other elements to Pipeline programs - Extramural clinical rotation
When launching the Pipeline program, one of the primary objectives of the Robert Wood Johnson Foundation was to
have “senior students, as well as general and paediatric dentistry residents, spend an average of sixty days in patient-
centred community clinics and practices treating underserved patients, [...] 25% of these being located in rural
communities” (73). At the end of the first round of the Pipeline project, all participating dental schools had increased
their community involvement. At the beginning of the program (2001-2002), students had participated in an average
of 16 days of extramural rotation, compared to an average of 41 days in 2006-2007. A total of 344 community
facilities participated in the project, 24% of them (n=98) located in rural communities (75).
Davidson et al. (2009) observed, however, that clinical rotation didn’t have the expected effect on students’
immediate future practice plans (next five years). At the beginning of their dental school curricula, students were
questioned about their intention to provide care for underserved communities in their future practice. The same
questions were asked at the end of their clinical rotation. Contrary to the expected outcomes, the authors observed
no variation in students’ intention to provide care for underserved communities. Financial barriers were most
frequently stated as the main reason for this situation (76). Yet, specific characteristics were associated with an
increase tendency to plan to provide care for underserved populations, such as being female (Inverted OR 1.21,
p<0.01), being considered URM (OR = 3.23, p<0.001), being of Asian/Island Pacific descent (OR=1.88, p<0.01), having
low income parents (OR=1.37 p<0.001), and (counter intuitively) in having educational debt higher than $168,000
(r=1.49 p<0.001).
Overall, results of the Pipeline program seem promising, especially if we look at the increase of URM number of
applicants. Yet further research is needed to assess these initiatives’ mid- and long-term influence in recruitment and
retention of URM students, and on underserved population accessibility of dental care.
6.3.5 What can be learned from other disciplines
In the last five years, academics have shown interest in the validity and reliability of assessment tools in high-stakes
selection contexts, especially in the medical school admission process. As there seems to be a relative consensus on
the value of cognitive and academic tests for dental school selection, this section will concentrate on non-cognitive
selection tests, as this is where the debate lies. The results of these studies are presented by discipline (Medicine,
Nursing and Veterinary science).
6.3.5.1 Medicine school admission context
Out of the 183 articles consulted for this literature review, 143 pertained to Medical school admission tests or
processes.
Interviews
As our results seem to indicate, unstructured and semi-structured interviews were of weak predictive and content
validity in dental school admission context. Our findings corroborate those found in the medical context. No
relationships were found between unstructured interview scores and cumulative medical school GPA, first-year
medical school GPA, school merit (p>0.05, n= 513, (77), or licensing exam performance (p>0.05, n=441(78). Dahlin et
al. (79) also concluded that, although the interview procedure seems to reduce the selection of students with inferior
communication skills, it was not able to distinguish the students with superior fourth-year performance (GPA) from
the rest of the applicant pool (n=137, p>0.05).

60
As for what was observed in the dental school context, interview format influences widely in its validity and
reliability. Axelson et al. (40) performed three univariate G-studies (n=3,043 interview scores) and one multivariate G-
study (n=168 re-test interview scores) to assess the reliability of unstructured and structured interviews. The authors
concluded that both types of interviews simply didn’t assess the same constructs, and that their mutual reliability
could be increased by combining both formats.
Although in general studies seem to agree that structured interviews have higher predictive validity than their
unstructured counterpart, the structured interviews’ reliability and validity still vary widely. Using social network
analysis, Dawson et al. (80) investigated the admission criteria that better predict student performance and their
engagement in a social learning environment. Their results show that not only interview scores show a weak but
significant correlation with first-year overall academic performance (r = 0.253, p < 0.05, n=132), but that they also
correlate to learning community engagement (closeness component: r = 0.311, p < 0.05, eigenvector scores: r =
0.152, p < 0.05). Stansfield and Kreite (78) explored the reliability and validity of a structured interview. The authors
found that raw interview scores did not predict United States Medical Licensing Examination (USMLE) Step II scores
(after controlling for Step I), but that weighting interview ratings by estimated conditional reliability considerably
improved its predictive validity (incremental r2= 0.121, P < 0.01 for Step II). They also concluded that since raters
tended to agree more about the lowest and highest quality applicant interviews, changing from a five to a three point
scale may increase an interview’s reliability. Still, these relationships stay weak, and account only for a small variation
on Step II performance.
Medical school MMI was found to have better validity and reliability than both unstructured and structured
interviews. Based on studies published in the medical context, MMI scores were significantly correlated with student
academic performance (r = 0.253, p < 0.05, (80). As with traditional interviews, there seems to be differing
expectations and understandings between applicants and examiners of what the MMI is assessing, for example,
reasoning skills in areas such as teamwork and empathy vs. communication skills (81). Still, more research is needed
to assess the predictive validity and reliability in the dental school admission context, even if MMI remains extremely
promising.
Many of the studies also assessed different MMI’s formats, to try to come up with a configuration that optimizes its
validity and reliability. In light of these results, an effective MMI should have been between seven to ten interview
stations (Cronbach ɑ = 0.55-0.79; (20, 82, 83). As for time per station, Dodson et al. (84) observed high correlations
between 5- and 8-minute scores at single stations and between cumulative 5- and 8-minute scores, and that
applicant ranking based on scores awarded after 5 and 8 minutes were almost identical. Therefore, 5 minute MMI
stations could be considered, even if the authors concluded that the content of the station may influence the time
needed.
Another issue of interviews as assessment tools is linked to truthfulness in applicants’ interview answers, as reported
by Kelley et al. (85). The authors assessed the validity of asking prospective students about their future career plans.
Out of the ninety-five students interviewed, half (n=50) already had an idea about their future field of practice. Still,
when asked during the interview if they had an idea of the aspect of medicine they planned to pursue, 34% (17/50) of
them were not completely forthcoming and truthful, while only 58% (n=29/50) reported being truthful in their
responses. The reason most commonly stated for this untruthfulness were: “My desire goes against the goal of the
college of medicine, such as trying to develop physicians who will practice medicine in rural areas” (n=11); “Heard
from sources that revealing true desire could possibly hinder my interview” (n=8); “Interviewed by a MD outside of
the aspect of medicine I am interested in” (n=8), and “Was not sure how the interviewer would react” (n=7) (85).

61
These results seem to reinforce the argument that in high stakes situations, applicants have a tendency to give what
they feel is the expected response, especially if they feel the real answer would hinder their chances of an admission
offer.
Manual Dexterity tests
As with what was observed in the dental school’s admission context, most of the studies on manual dexterity tests for
medicine pertained to their validity as predictors of academic performance. The results seemed to infer little to no
predictive abilities of manual dexterity tests. These findings were similar to those found in the dental admission
context. Goldberg et al. (86) carried out a clinical study of manual dexterity assessment, using the Stromberg
Dexterity Test (gross motor function of arm and hand coordination), the O'Conner Tweezer Test (fine motor function
test where students are required to place 100 small pins in a ordered fashion into a pegboard using forceps), and the
MIST-VR17 laparoscopic simulator (requires virtual movement and placement of a ball into a container using
alternated hands) (87). In total, 113 fourth-year medical students at Virginia Commonwealth University School of
Medicine participated in the study. Academic performance was operationalized as USMLE Step I and II scores, and
medical school class rank. The authors found no relationship between performance time on the three manual tests
and medical school performance, except for gross dexterity that was significantly correlated with class rank (r= -0.20,
p=0.04) and USMLE Step I scores (r = 0.20, p=0.04).
Goldberg et al. (86) also observed that participants who considered themselves to have good manual dexterity
participated in more extracurricular activities involving manual dexterity, such as cooking, sports, video games, and
playing musical instruments, and seemed to have better dexterity skills than those reporting not being good with
their hands. Therefore, an alternate, more reliable way to assess manual dexterity could be through a proxy
composite measure of self-assessment weighted by extracurricular activities scoring. This could be done through
analysis of applicant’s files and of interview answers at low cost.
Personality and value assessment
As for personality and value tests, our previous findings suggest that the validity and reliability of personality and
values tests vary widely in the dental school context. These finding were corroborated by those observed in the
medical school admission context.
NEO-PI-R
The weak to null validity of most of the NEO-PI-R dimensions observed in the dental school admission context is
corroborated by studies in the medical context, although its validity seems to slightly increase throughout medical
school (from r2 = 0.22 for the first-year, to r2 0.56 for the seventh-year, p<0.05, n= 631) (88). Doherty (89) performed
a review of the literature (2000-2009) to try to determine which of the personality dimensions influenced both
medical students’ and doctors’ performance. They found that only one of the dimensions – conscientiousness –
seems to be associated in a consistent manner to academic and clinical performance in the literature.
Furthermore, there seems to be debate about the truthfulness of applicants’ answers on NEO-PR-I test, and that
these considerations relate especially to the dimensions that seem to have the highest predictive validity. Using
17
Developed by a joint venture between the North England Wolfson Center for Minimally Invasive Therapy and Virtual Presence
Ltd., MIST-VR is a part-task virtual reality laparoscopic simulator.
For more information, see 87. Chaudhry A, Sutton C, Wood J, Stone R, McCloy R. Learning rate for laparoscopic surgical skills
on MIST VR, a virtual reality simulator: quality of human-computer interface. Annals of the Royal College of Surgeons of
England 1999;81(4):281.

62
scores outside the 95% CI, Griffin and Wilson (90) explored the extent of self-enhancement of medical schools
applicants on NEO-PI-R test. The authors found that 62.7% of the applicants’ samples were deceptive on at least one
of the five personality scales (with 4.8% who had self-enhanced on all five scales). They also found that more
candidates (33.7%) were deceptive on conscientiousness than on any other factors (neuroticism 26.7%, extraversion
21.7%, agreeableness 19.3% and openness 14.3%), which ironically was found in our review to be the one factor with
the most predictive power. NEO-PI also seems to have weak convergent/divergent validity, as no significant
relationship was found between the five personality factors and any of the cognitive and non-cognitive measures
used in admission process (GPA, MCAT, interview scores) (91).
Autobiographical essays
None of the studies published between the years 2007-2013 assessed the validity of autobiographical essays in the
dental context. Yet, findings in the medical context suggest weak predictive validity and reliability, as high expectancy
bias is associated with this type of selection tool18. Essay scores were not related to any of the performance measures
during medical school or their internship (92, 93). Hanson et al. (94) compared the results of on-site (controlled) and
off-site (non-controlled) performance of students’ autobiographical submission scores. They found that candidates’
mean performance scores were significantly higher when completed off-site, and that off-site scores were non-
predictive of scores assigned to onsite autobiographical essay submissions (r = 0.16), which seems to indicate that
candidates were not writing their essays alone when off-site, and casts doubt on the truthfulness of their answers.
These findings were corroborated by White et al. (95), who examined 210 essays and 30 pilots of 2007 medical
students of a Canadian medical school (name undisclosed). The authors proposed a theory named "What do they
want me to say?" to describe the ways in which applicants modulate their responses to conform to their expectations
of the selection process, and revealed tension between “genuine” and perceived “expected responses” by applicants.
Also, applicants and raters seem to have different approaches to the essay questions (96), which may explain its lack
of validity.
Situational Judgement tests
As our findings suggest, SJT was found to have weak convergent and predictive validity in dental school context. Yet,
these findings were based on one study only, and these findings contradict those of a large body of literature on
medical selection tools which found the opposite results. In fact, Patterson et al. (5) performed a comprehensive
literature review of MEDLINE, PsychINFO, and Web of Science for the years 1990-2010 (n=76 articles). The authors
concluded that “situational judgment tests have good levels of reliability, predictive validity and incremental validity
for testing a range of professional attributes, such as empathy and integrity, […] and can test a broad range of non-
academic constructs depending on the selection context (so can be tailored to context)” (5). The instrument is a cost-
efficient methodology compared with high-fidelity assessments of non-academic attributes, such as those used in
objective structured clinical examinations. Also, the instrument seems positively received by candidates, who think of
it as reliable, fair and adequate.
In addition, three other selections tools and processes pertaining to non-cognitive assessment in medical school
admission were reviewed: the Anatomical Self-Efficacy instrument (ASE), the Computer-based Multiple Sample
Evaluation of Noncognitive Skills (CMSENS), and Hogan’s Development Survey.
18
In this case, high expectancy bias refers to the tendency to give the expected response to an essay question, instead of being
entirely truthful.
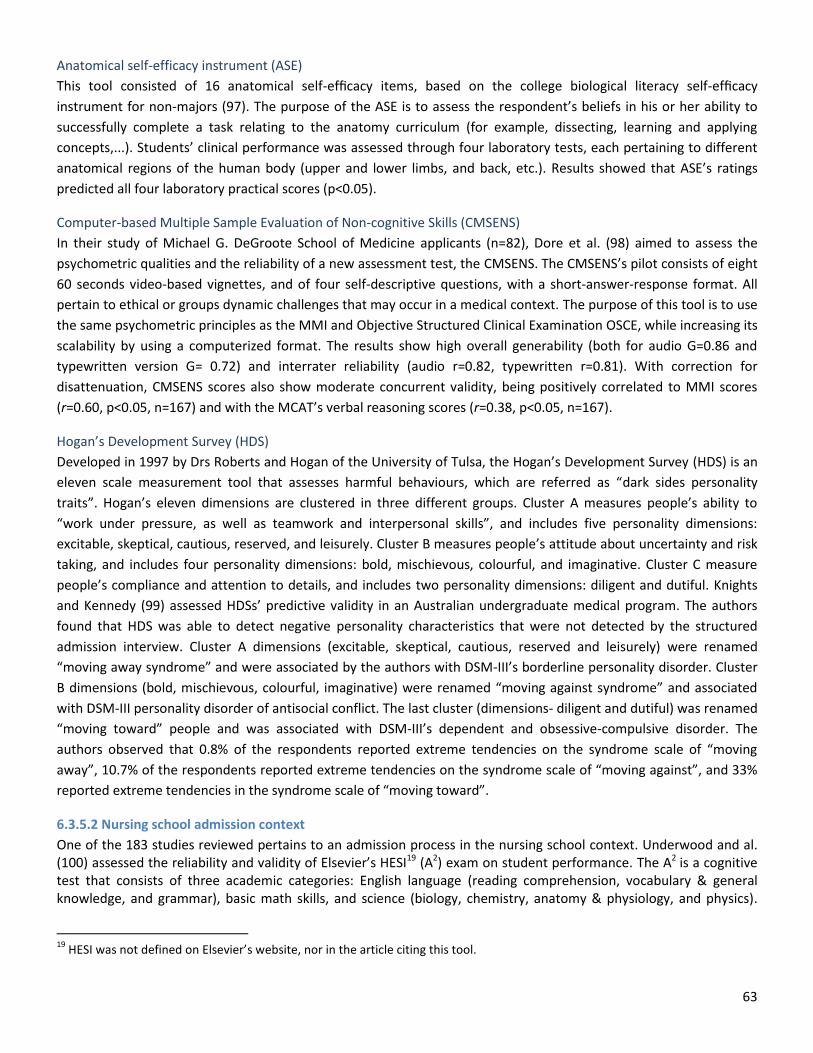
63
Anatomical self-efficacy instrument (ASE)
This tool consisted of 16 anatomical self-efficacy items, based on the college biological literacy self-efficacy
instrument for non-majors (97). The purpose of the ASE is to assess the respondent’s beliefs in his or her ability to
successfully complete a task relating to the anatomy curriculum (for example, dissecting, learning and applying
concepts,...). Students’ clinical performance was assessed through four laboratory tests, each pertaining to different
anatomical regions of the human body (upper and lower limbs, and back, etc.). Results showed that ASE’s ratings
predicted all four laboratory practical scores (p<0.05).
Computer-based Multiple Sample Evaluation of Non-cognitive Skills (CMSENS)
In their study of Michael G. DeGroote School of Medicine applicants (n=82), Dore et al. (98) aimed to assess the
psychometric qualities and the reliability of a new assessment test, the CMSENS. The CMSENS’s pilot consists of eight
60 seconds video-based vignettes, and of four self-descriptive questions, with a short-answer-response format. All
pertain to ethical or groups dynamic challenges that may occur in a medical context. The purpose of this tool is to use
the same psychometric principles as the MMI and Objective Structured Clinical Examination OSCE, while increasing its
scalability by using a computerized format. The results show high overall generability (both for audio G=0.86 and
typewritten version G= 0.72) and interrater reliability (audio r=0.82, typewritten r=0.81). With correction for
disattenuation, CMSENS scores also show moderate concurrent validity, being positively correlated to MMI scores
(r=0.60, p<0.05, n=167) and with the MCAT’s verbal reasoning scores (r=0.38, p<0.05, n=167).
Hogan’s Development Survey (HDS)
Developed in 1997 by Drs Roberts and Hogan of the University of Tulsa, the Hogan’s Development Survey (HDS) is an
eleven scale measurement tool that assesses harmful behaviours, which are referred as “dark sides personality
traits”. Hogan’s eleven dimensions are clustered in three different groups. Cluster A measures people’s ability to
“work under pressure, as well as teamwork and interpersonal skills”, and includes five personality dimensions:
excitable, skeptical, cautious, reserved, and leisurely. Cluster B measures people’s attitude about uncertainty and risk
taking, and includes four personality dimensions: bold, mischievous, colourful, and imaginative. Cluster C measure
people’s compliance and attention to details, and includes two personality dimensions: diligent and dutiful. Knights
and Kennedy (99) assessed HDSs’ predictive validity in an Australian undergraduate medical program. The authors
found that HDS was able to detect negative personality characteristics that were not detected by the structured
admission interview. Cluster A dimensions (excitable, skeptical, cautious, reserved and leisurely) were renamed
“moving away syndrome” and were associated by the authors with DSM-III’s borderline personality disorder. Cluster
B dimensions (bold, mischievous, colourful, imaginative) were renamed “moving against syndrome” and associated
with DSM-III personality disorder of antisocial conflict. The last cluster (dimensions- diligent and dutiful) was renamed
“moving toward” people and was associated with DSM-III’s dependent and obsessive-compulsive disorder. The
authors observed that 0.8% of the respondents reported extreme tendencies on the syndrome scale of “moving
away”, 10.7% of the respondents reported extreme tendencies on the syndrome scale of “moving against”, and 33%
reported extreme tendencies in the syndrome scale of “moving toward”.
6.3.5.2 Nursing school admission context
One of the 183 studies reviewed pertains to an admission process in the nursing school context. Underwood and al. (100) assessed the reliability and validity of Elsevier’s HESI19 (A2) exam on student performance. The A2 is a cognitive test that consists of three academic categories: English language (reading comprehension, vocabulary & general knowledge, and grammar), basic math skills, and science (biology, chemistry, anatomy & physiology, and physics).
19
HESI was not defined on Elsevier’s website, nor in the article citing this tool.

64
The sample consisted of 184 nursing students, while performance was monitored in three different courses: NU301 (fundamentals of nursing), NU302 (community health nursing), and NU305 (health and physical assessment). Results show that A2 is a good predictor of academic performance in nursing school, being related to NU301 (r=0.564, p≤0.01, β = 0.213, p≤0.01, n=184), RU302 (r=0.604, p≤0.01, β = 0.269, p≤0.01, n=184), and RU305 final grades (r=.518, p≤0.01, β = 0.318, p≤0.01, n=184).
6.3.5.3 Veterinary school context Two studies reviewed pertained to selection tools in the veterinary schools’ admission context: one assessed the
validity and reliability of MMI, and the other a supervised essay. Hecker and Violato (101) investigated the reliability
and concurrent validity of using essays for veterinary medical school admissions. In total, 103 applicants at the
University of Calgary’s School of Veterinary Medicine were asked to write a 750 word-count, one hour-long
supervised essay regarding their interest in veterinary medicine and practice. Results show reliability coefficients of
G= 0.52 with two raters. Based on decision study results, increasing the number of raters to three and the number of
items to four also is believed to potentially increase the reliability coefficient to G=0.68. Hecker and Violato (83) also
investigated the reliability of the MMI process at Calgary’s School of Veterinary Medicine. Using generalisation
theory, the authors estimated that the MMI had satisfactory reliability (overall G-coefficient=0.79; inter-rater
reliability=0.52, and the interstation reliability=0.25), and that systematic error and varying scores of applicants
across interviewers and stations accounted for 37.22% of the variation (σ = 2.255). In summary, University of
Calgary’s MMI seems to be a reliable, although its predictive validity has not been assessed in a veterinary school
context.

65
7 Discussion
After reviewing the literature and evaluating potential assessment tools during the dental school admission process,
we found that some DAT components (mainly DAT-AA, DAT-QR and DAT-RC) and Pre-dental Overall and Science GPA
scores still represent the best predictors of academic performance of dental students, and seem to have some
correlation with clinical and board examination performance as well, even though the strength of these relationships
is only weak to moderate. Yet, some questions remain about the concurrent validity of the DAT-PAT, since its results
were not compared with those of any other forms of perceptual ability assessment. Our results also suggest that
combining cognitive assessment tools together (22), but also with non-cognitive assessment tools (36) considerably
increases their predictive validity. The debate still remains regarding which non-cognitive tools to use.
Interviews remain a popular way to assess non-cognitive and personality traits. Our findings show that increasing the
structure of the interview, whether it is through a structured or MMI format, drastically increases its reliability and
validity. As for comparing MMI and structured interview, our findings seem to indicate that MMI have a slightly
higher reliability, although more research is needed to be able to arrive to more definite results.
Manual dexterity test were found to have null to weak predictive validity on student performance. That being said,
manual dexterity can perhaps be utilized as an effective screening tool in admissions and has been shown in the past
to reduce attrition rates in dental school.
Two of the Emotional Competency Inventory items (relationship management and self-management) were found to
be a good predictor of clinical performance. Yet, we feel it is impossible at this point to arrive at a definite conclusion
on the basis of a sole study, especially one with such a small sample size (n=100). Therefore, in this case as well, more
research is required before we can make a definitive statement about its reliability and predictive validity in the
dental school admission context.
As for NEO-PI-R, and autobiographical essays, our findings suggest that they are not reliable for predicting
performance, and concerns can be raised regarding their usefulness in a high-stakes context. Finally, in trying to
assess non-cognitive abilities, findings concerning the use of Situational Judgement Tests are promising but more
research is needed to fully understand their impact in the dental school context.
Many aspects have to be investigated to assess the quality and value of the selection tools. Yet, most of the reviewed
articles only focused on predictive and convergent/divergent validity, and to a lesser extent, on concurrent validity.
Face, construct and content validities of the selection tools were only assessed in the case of MMI. Concerning the
reliability, this aspect was only addressed by a few studies pertaining to manual dexterity tests (tweezers, computer-
assisted dental simulation) and structured interviews. Therefore, based on this review, there are still many areas that
need to be explored and researched before any well-informed statement upon the validity and reliability of these
selection tools can be made. As for other limits of the article reviewed, most of the results were based on correlations
and/or descriptive statistics analysis. So it is impossible to infer causality from these tests, highlighting the need for
further research in this area as well.
When it comes to achieving greater student diversity, our findings suggest that students of diverse background
(rural/minority) are not disadvantaged by the selection tools currently used in dental admission processes. Therefore,
other initiatives such as URM recruitment and pipeline-type programs should be implemented if universities want to
achieve greater student diversity. Our literature review suggested different possible avenues to achieve this goal.

66
8 Recommendations
Based on the findings of the literature review and interviews, the working group makes the following
recommendations:
1. The current CDA Dental Aptitude Test Sub-Committee should be replaced by a national Admissions Committee
jointly administered by the CDA and the ACFD. The membership of the new Admissions Committee should
include:
admissions officers from each of the 10 dental schools
individuals with expertise in admissions and relevant research
individuals with expertise in assessing the validity and reliability of admissions tools
individuals with expertise in generating items, scenarios and elements of non-cognitive tests (e.g. MMIs and
structured interviews)
administrative support
2. The mandate of the new national Admissions Committee needs to be broadened to include the following
functions:
Development of guidelines concerning overall student selection and admissions processes (i.e. beyond simply
oversight of the DAT);
Development of guidelines on the use of specific tools and processes to ensure they are used appropriately
e.g. cut-off scores, use for screening etc.;
Training on the use of admissions tools;
Development of elements of tests and processes (e.g. questions for structured interviews or scenarios for
MMIs); and
Oversight of evaluating the validity of admissions tools and processes.
3. The new national Admissions Committee needs to be appropriately funded to enable the performance of the
expanded mandate outlined above.
4. All admissions tools that the new national Admissions Committee recommends to the schools for consideration in
their admissions processes:
must be available in both English and French
must be at an appropriate academic level to be able to be administered to all applicants to dental programs
in Canada, specifically to have a level playing field for University-based and CEGEP-based applicants
5. Efforts to investigate validation of tests should focus on those showing promise:
DAT-AA (Academic Average); DAT-QR (Quantitative Reasoning); DAT-RC (Reading Comprehension)
Overall predental GPA; Science GPA
MMI; Structured interviews
Combinations
6. As the DAT-CD (Manual Dexterity Test) is currently being used by seven of the ten dental schools in Canada,
evaluation of the validity and reliability of this admission test component needs to be undertaken, including its
most appropriate use.

67
7. Efforts should be made by dental schools to focus their admissions processes on tools with the strongest
evidence to support them, while ceasing the use of approaches that have little evidence to support them and/or
with evidence that shows the tools are not effective in the admissions process.
8. Efforts should be focused on the recruitment of appropriate candidates as well as the processes used to select
them.

68
9 References
1. Papadakis MA, Teherani A, Banach MA, Knettler TR, Rattner SL, Stern DT, et al. Disciplinary action by medical boards and prior behavior in medical school. The New England journal of medicine 2005;353(25):2673-2682. 2. Bailit HL, Formicola AJ. Preface: about the dental Pipeline program. J Dent Educ 2010;74(10 Suppl):S5-6. 3. Cooper HM. Integrating research: A guide for literature reviews. Sage Publications, Inc; 1989. 4. Oudshoorn WC. The utility of Canadian DAT Perceptual Ability and Carving Dexterity scores as predictors of psychomotor performance in first-year operative dentistry. Journal of Dental Education 2003;67(11):1201-1208. 5. Patterson F, Ashworth V, Zibarras L, Coan P, Kerrin M, O'Neill P. Evaluations of situational judgement tests to assess non-academic attributes in selection. Medical Education 2012;46(9):850-868. 6. Koenig TW, Parrish SK, Terregino CA, Williams JP, Dunleavy DM, Volsch JM. Core Personal Competencies Important to Entering Students' Success in Medical School: What Are They and How Could They Be Assessed Early in the Admission Process? Academic Medicine 2013;88(5):603-613. 7. Champagne F, Contandriopoulos A-P, Brousselle A, Hartz Z, Denis J-L. L’évaluation dans le domaine de la santé: concepts et méthodes. L’évaluation: Concepts et méthodes 2009:35-56. 8. Polgar S, Thomas SA. Introduction to research in the health sciences. Churchill Livingstone Edinburgh; 2008. 9. Salkind NJ, Rasmussen K. Encyclopedia of educational psychology. Sage; 2008. 10. Cronbach LJ, Meehl PE. Construct validity in psychological tests. Psychological bulletin 1955;52(4):281. 11. Eaves R, Woods-Groves S. Criterion Validity. Encyclopedia of Measurement and Statistics. Sage Publications, Inc. Sage Publications, Inc.; 2007. 12. Kingsley K, Sewell J, Ditmyer M, O'Malley S, Galbraith GM. Creating an evidence-based admissions formula for a new dental school: University of Nevada, Las Vegas, School of Dental Medicine. Journal of Dental Education 2007;71(4):492-500. 13. Gordis L. Epidemiology. Elsevier/Saunders; 2009. 14. Okunseri C, Bajorunaite R, Abena A, Self K, Iacopino AM, Flores G. Racial/ethnic disparities in the acceptance of Medicaid patients in dental practices. Journal of public health dentistry 2008;68(3):149-153. 15. Lopez N, Self K, Karnitz J. Developing a Tool for Systematic Inclusion of Non-Academic Factors in Dental School Admissions: Towards Building Diversity in the Dental Workforce. Journal of Dental Education 2009;73(12):1347-1352. 16. Graham JW. Substitution of perceptual-motor ability test for chalk carving in Dental Admission Testing Program. Journal of dental education 1972;36(11):9-14. 17. Boyd MA, Teteruck WR. The Dental Aptitude Test--its application in admissions. J Can Dent Assoc 1979;45(8):414-419. 18. Latham GP, Finnegan BJ. In Schuler, H. et al. eds.: Personnel selection and assessment : individual and organizational perspectives. Hillsdale, N.J.: L. Erlbaum Associates; 1993. 19. Poole A, Catano VM, Cunningham DP. Predicting performance in Canadian dental schools: the new CDA structured interview, a new personality assessment, and the DAT. Journal of Dental Education 2007;71(5):664-676. 20. Eva KW, Reiter HI, Trinh K, Wasi P, Rosenfeld J, Norman GR. Predictive validity of the multiple mini-interview for selecting medical trainees. Medical Education 2009;43(8):767-775.
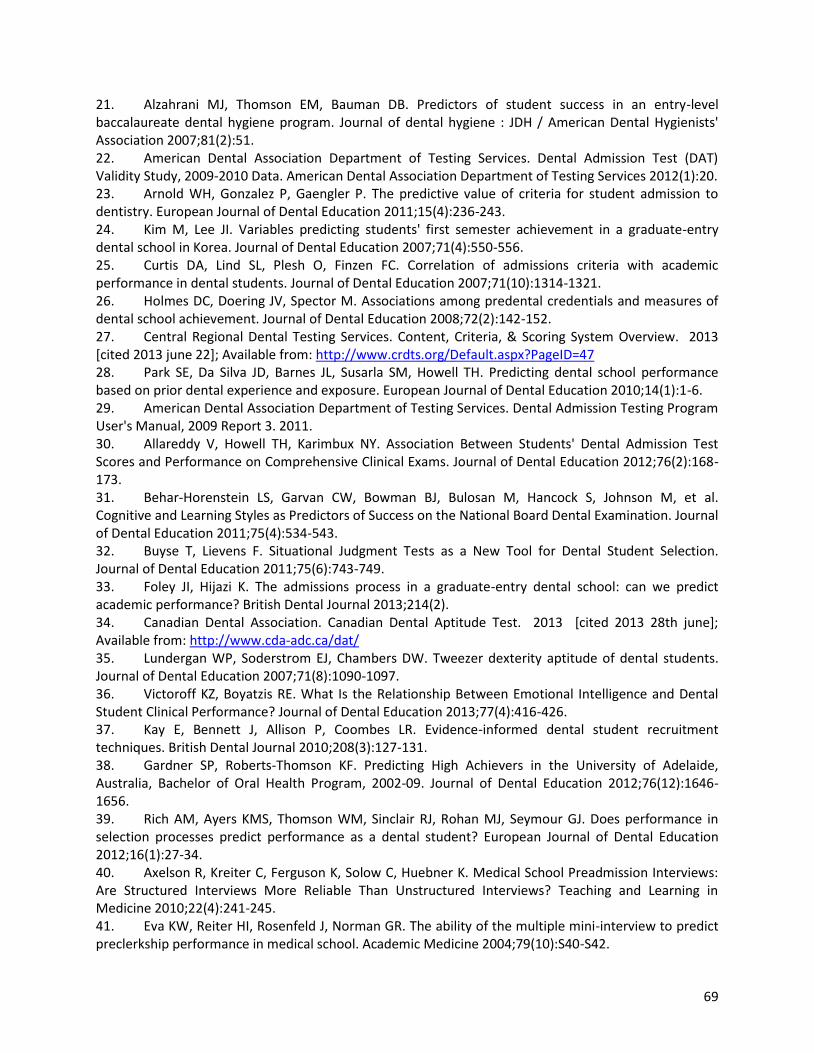
69
21. Alzahrani MJ, Thomson EM, Bauman DB. Predictors of student success in an entry-level baccalaureate dental hygiene program. Journal of dental hygiene : JDH / American Dental Hygienists' Association 2007;81(2):51. 22. American Dental Association Department of Testing Services. Dental Admission Test (DAT) Validity Study, 2009-2010 Data. American Dental Association Department of Testing Services 2012(1):20. 23. Arnold WH, Gonzalez P, Gaengler P. The predictive value of criteria for student admission to dentistry. European Journal of Dental Education 2011;15(4):236-243. 24. Kim M, Lee JI. Variables predicting students' first semester achievement in a graduate-entry dental school in Korea. Journal of Dental Education 2007;71(4):550-556. 25. Curtis DA, Lind SL, Plesh O, Finzen FC. Correlation of admissions criteria with academic performance in dental students. Journal of Dental Education 2007;71(10):1314-1321. 26. Holmes DC, Doering JV, Spector M. Associations among predental credentials and measures of dental school achievement. Journal of Dental Education 2008;72(2):142-152. 27. Central Regional Dental Testing Services. Content, Criteria, & Scoring System Overview. 2013 [cited 2013 june 22]; Available from: http://www.crdts.org/Default.aspx?PageID=47 28. Park SE, Da Silva JD, Barnes JL, Susarla SM, Howell TH. Predicting dental school performance based on prior dental experience and exposure. European Journal of Dental Education 2010;14(1):1-6. 29. American Dental Association Department of Testing Services. Dental Admission Testing Program User's Manual, 2009 Report 3. 2011. 30. Allareddy V, Howell TH, Karimbux NY. Association Between Students' Dental Admission Test Scores and Performance on Comprehensive Clinical Exams. Journal of Dental Education 2012;76(2):168-173. 31. Behar-Horenstein LS, Garvan CW, Bowman BJ, Bulosan M, Hancock S, Johnson M, et al. Cognitive and Learning Styles as Predictors of Success on the National Board Dental Examination. Journal of Dental Education 2011;75(4):534-543. 32. Buyse T, Lievens F. Situational Judgment Tests as a New Tool for Dental Student Selection. Journal of Dental Education 2011;75(6):743-749. 33. Foley JI, Hijazi K. The admissions process in a graduate-entry dental school: can we predict academic performance? British Dental Journal 2013;214(2). 34. Canadian Dental Association. Canadian Dental Aptitude Test. 2013 [cited 2013 28th june]; Available from: http://www.cda-adc.ca/dat/ 35. Lundergan WP, Soderstrom EJ, Chambers DW. Tweezer dexterity aptitude of dental students. Journal of Dental Education 2007;71(8):1090-1097. 36. Victoroff KZ, Boyatzis RE. What Is the Relationship Between Emotional Intelligence and Dental Student Clinical Performance? Journal of Dental Education 2013;77(4):416-426. 37. Kay E, Bennett J, Allison P, Coombes LR. Evidence-informed dental student recruitment techniques. British Dental Journal 2010;208(3):127-131. 38. Gardner SP, Roberts-Thomson KF. Predicting High Achievers in the University of Adelaide, Australia, Bachelor of Oral Health Program, 2002-09. Journal of Dental Education 2012;76(12):1646-1656. 39. Rich AM, Ayers KMS, Thomson WM, Sinclair RJ, Rohan MJ, Seymour GJ. Does performance in selection processes predict performance as a dental student? European Journal of Dental Education 2012;16(1):27-34. 40. Axelson R, Kreiter C, Ferguson K, Solow C, Huebner K. Medical School Preadmission Interviews: Are Structured Interviews More Reliable Than Unstructured Interviews? Teaching and Learning in Medicine 2010;22(4):241-245. 41. Eva KW, Reiter HI, Rosenfeld J, Norman GR. The ability of the multiple mini-interview to predict preclerkship performance in medical school. Academic Medicine 2004;79(10):S40-S42.

70
42. McAndrew R, Ellis J. An evaluation of the multiple mini-interview as a selection tool for dental students. British Dental Journal 2012;212(7):331-335. 43. Roberts C, Zoanetti N, Rothnie I. Validating a multiple mini-interview question bank assessing entry-level reasoning skills in candidates for graduate-entry medicine and dentistry programmes. Medical Education 2009;43(4):350-359. 44. Urbankova A, Engebretson SP. Computer-assisted dental simulation as a predictor of preclinical operative dentistry performance. Journal of Dental Education 2011a;75(9):1249-1255. 45. Spratley M. Aptitude testing and the selection of dental students. Australian Dental Journal 1990;35(2):159-168. 46. Peterson S. The ADA chalk carving test. Journal of Dental Education 1974;38(1):11-15. 47. Chen M, Podshadley D, Schrock J. A factorial study of some psychological, vocational interest, and mental ability variables as predictors of success in dental school. J Appl Psychol 1967;51(3):236-241. 48. Graham J, Boyd M. The content and use of the Dental Aptitude Test program. J Can Dent Assoc 1979;45(3):403–404. 49. Wood W, Boyd M. The DAT as a predictor of pre-clinical technique performance. J Can Dent Assoc 1982;48(9):599-600. 50. Boyd M, Teteruck W, Thompson G. Interpretation and use of the dental admission and aptitude tests. J Dent Educ 1980;44(5):275–278. 51. Ranney RR, Wilson MB, Bennett RB. Evaluation of applicants to predoctoral dental education programs: review of the literature. Journal of Dental Education 2005;69(10):1095-1106. 52. Urbankova A, Engebretson SP. The Use of Haptics to Predict Preclinic Operative Dentistry Performance and Perceptual Ability. Journal of Dental Education 2011b;75(12):1548-1557. 53. Al-Johany S, AlShaafi M, Bin-Shuwaish M, Alshahrani F, Alazmah A, Aldhuwayhi S, et al. Correlation between handwriting, drawing skills and dental skills of junior dental students. The journal of contemporary dental practice 2011;12(5):327-332. 54. Beier US, Kapferer I, Ostermann H, Staudinger R, Dumfahrt H. Impact of a Novel Dental School Admission Test on Student Performance at Innsbruck Medical University, Austria. Journal of Dental Education 2010;74(5):531-538. 55. Giuliani M, Lajolo C, Clemente L, Querqui A, Viotti R, Boari A, et al. Is manual dexterity essential in the selection of dental students? British Dental Journal 2007;203(3):149-155. 56. Grim AM. Use of Situational Judgment Test to Measure Individual Adaptability in Applied Settings. Fairfax, VA: George Mason University; 2010. 57. Itaya LE, Chambers DW, King PA. Analyzing the influence of admissions criteria and cultural norms on success in an international dental studies program. Journal of Dental Education 2008;72(3):317-328. 58. Goleman D, Cherniss C. The emotionally intelligent workplace: How to select for, measure, and improve emotional intelligence in individuals, groups, and organizations. Jossey-Bass; 2001. 59. Becker T. The Case for Emotional Intelligence in Organizational Research Since its popularization by Goleman (1995). the concept of emotional intelligence has been the subject of ongoing controversy, so it is un. 2010. 60. Wolff SB. Emotional Competence Inventory: Technical Manual. Consortium for Research on Emotional Intelligence in Organizations 2005:84 pp. 61. Rosenfeld JM, Reiter HI, Trinh K, Eva KW. A cost efficiency comparison between the multiple mini-interview and traditional admissions interviews. Advances in Health Sciences Education 2008;13(1):43-58. 62. Axelson RD, Kreiter CD. Rater and occasion impacts on the reliability of pre-admission assessments. Medical Education 2009;43(12):1198-1202.

71
63. Bender DJ, Burk DT, Candito KP. Applicant-interviewer gender concordance and the decision to enroll in dental school. Journal of Dental Education 2007;71(3):348-353. 64. Raghavan M, Martin BD, Burnett M, Aoki F, Christensen H, Mackalski B, et al. Multiple mini-interview scores of medical school applicants with and without rural attributes. Rural and Remote Health 2013a;13:2362. 65. Wright B, Woloschuk W. Have rural background students been disadvantaged by the medical school admission process? Medical Education 2008;42(5):476-479. 66. Steinecke A, Beaudreau J, Bletzinger RB, Terrell C. Race-neutral admission approaches: Challenges and opportunities for medical schools. Academic Medicine 2007;82(2):117-126. 67. McClain MA, Jones FR, McClain CR, Curd FM. Increasing Dental Student Diversity Through the UNLV Dental Prospects Program. Journal of Dental Education 2013;77(5):548-553. 68. Price SS, Brunson WD, Mitchell DA, Alexander CJ, Jackson DL. Increasing the enrollment of underrepresented minority dental students: Experiences from the dental pipeline program. Journal of Dental Education 2007;71(3):339-347. 69. Leviton LC. Foreword. Journal of Dental Education 2009;73(2 suppl):S5-S7. 70. Carreon DC, Davidson PL, Andersen RM. The evaluation framework for the dental pipeline program with literature review. Journal of Dental Education 2009;73(2 suppl):S23-S36. 71. PPP. Pipeline Profession and Practice: Community-based dental education. 2013 [cited 2013; Available from: 72. Andersen RM, Friedman J-A, Carreon DC, Bai J, Nakazono TT, Afifi A, et al. Recruitment and retention of underrepresented minority and low-income dental students: effects of the pipeline program. Journal of Dental Education 2009a;73(2 suppl):S238-S258. 73. Andersen RM, Davidson PL, Atchison KA, Crall JJ, Friedman J-A, Hewlett ER, et al. Summary and implications of the dental pipeline program evaluation. Journal of Dental Education 2009b;73(2 suppl):S319-S330. 74. Hewlett ER, Davidson PL, Nakazono TT, Carreon DC, Gutierrez JJ, Afifi A. Revisions to dental school curricula: effects of the pipeline program. Journal of Dental Education 2009;73(2 suppl):S259-S268. 75. Atchison KA, Thind A, Nakazono TT, Wong D, Gutierrez JJ, Carreon DC, et al. Community-based clinical dental education: effects of the pipeline program. Journal of Dental Education 2009;73(2 suppl):S269-S282. 76. Davidson PL, Nakazono TT, Carreon DC, Bai J, Afifi A. Practice plans of dental school graduating seniors: effects of the pipeline program. Journal of Dental Education 2009;73(2 suppl):S283-S296. 77. Fan AP, Tsai TC, Su TP, Kosik RO, Morisky DE, Chen CH, et al. A Longitudinal Study of the Impact of Interviews on Medical School Admissions in Taiwan. Evaluation & the Health Professions 2010;33(2):140-163. 78. Stansfield RB, Kreiter CD. Conditional reliability of admissions interview ratings: extreme ratings are the most informative. Medical Education 2007;41(1):32-38. 79. Dahlin M, Soderberg S, Holm U, Nilsson I, Farnebo L-O. Comparison of communication skills between medical students admitted after interviews or on academic merits. Bmc Medical Education 2012;12:46. 80. Dawson S, Macfadyen L, Lockyer L, Mazzochi-Jones D. Using social network metrics to assess the effectiveness of broad based admission practices. Australasian Journal of Educational Technology 2011;27(1):16-27. 81. Kumar K, Roberts C, Rothnie I, du Fresne C, Walton M. Experiences of the multiple mini-interview: a qualitative analysis. Medical Education 2009;43(4):360-367.

72
82. Uijtdehaage S, Doyle L, Parker N. Enhancing the reliability of the multiple mini-interview for selecting prospective health care leaders. Academic medicine : journal of the Association of American Medical Colleges 2011;86(8):1032-1039. 83. Hecker K, Violato C. A Generalizability Analysis of a Veterinary School Multiple Mini Interview: Effect of Number of Interviewers, Type of Interviewers, and Number of Stations. Teaching and Learning in Medicine 2011;23(4):331-336. 84. Dodson M, Crotty B, Prideaux D, Carne R, Ward A, de Leeuw E. The multiple mini-interview: how long is long enough? Medical Education 2009;43(2):168-174. 85. Kelley SR, Ray MA, Tsuei BJ. Trends concerning a common medical school interview question, revisited. Medical Teacher 2007;29(5):E139-E142. 86. Goldberg AE NJ, Wolfe LG, Goldberg SR. Correlation of manual dexterity with USMLE scores and medical student class rank. Journal of surgical research 2008(147):212-215. 87. Chaudhry A, Sutton C, Wood J, Stone R, McCloy R. Learning rate for laparoscopic surgical skills on MIST VR, a virtual reality simulator: quality of human-computer interface. Annals of the Royal College of Surgeons of England 1999;81(4):281. 88. Lievens F, Ones DS, Dilchert S. Personality Scale Validities Increase Throughout Medical School. Journal of Applied Psychology 2009;94(6):1514-1535. 89. Doherty R. Summary of: The admissions process in a graduate-entry dental school: can we predict academic performance? British Dental Journal 2013;214(2):68-69. 90. Griffin B, Wilson IG. Faking good: self-enhancement in medical school applicants. Medical Education 2012;46(5):485-490. 91. Kulasegaram K, Reiter HI, Wiesner W, Hackett RD, Norman GR. Non-association between Neo-5 personality tests and multiple mini-interview. Advances in Health Sciences Education 2010;15(3):415-423. 92. Dong T, Kay A, Artino AR, Gilliland WR, Waechter DM, Cruess D, et al. Application Essays and Future Performance in Medical School: Are They Related? Teaching and Learning in Medicine 2013;25(1):55-58. 93. Leddy JJ, Moineau G, Puddester D, Wood TJ, Humphrey-Murto S. Does an Emotional Intelligence Test Correlate With Traditional Measures Used to Determine Medical School Admission? Academic Medicine 2011;86(10):S40-S42. 94. Hanson MD, Dore KL, Reiter HI, Eva KW. Medical school admissions: Revisiting the veracity and independence of completion of an autobiographical screening tool. Academic Medicine 2007;82(10):S8-S11. 95. White J, Brownell K, Lemay J-F, Lockyer JM. "What do they want me to say?" The hidden curriculum at work in the medical school selection process: a qualitative study. Bmc Medical Education 2012;12:17. 96. White JS, Lemay JF, Brownell K, Lockyer J. "A Chance To Show Yourself" - how do applicants approach medical school admission essays? Medical Teacher 2011;33(10):E541-E548. 97. Baldwin JA, Ebert-May D, Burns DJ. The development of a college biology self-efficacy instrument for nonmajors. Science Education 1999;83(4):397-408. 98. Dore KL, Reiter HI, Eva KW, Krueger S, Scriven E, Siu E, et al. Extending the Interview to All Medical School Candidates-Computer-Based Multiple Sample Evaluation of Noncognitive Skills (CMSENS). Academic Medicine 2009;84:S9-S12. 99. Knights JA, Kennedy BJ. Medical school selection: impact of dysfunctional tendencies on academic performance. Medical Education 2007;41(4):362-368. 100. Underwood LM, Williams LL, Lee MB, Brunnert KA. Predicting Baccalaureate Nursing Students' First-Semester Outcomes: HESI Admission Assessment. Journal of Professional Nursing 2013;29(2):S38-S42.

73
101. Hecker K, Violato C. Using Standardized Essays in the Veterinary Medicine Admissions Process: Are the Ratings Reliable and Valid? Journal of Veterinary Medical Education 2010;37(3):254-257. 102. McAndrew R, Salem-Rahemi M. Advice and guidance on the admissions process to UK dental schools. Dental update 2013;40(2):129-132, 135-128, 141-122.

74
10 Appendices Appendix A: Questionnaire sent to all dental schools Appendix B: Interview guide for dental schools Appendix C: Interview guide for other dental stakeholders Appendix D: Tables summarizing validity studies in the literature review

75
Appendix A
Summary of Admissions Processes in Canada
What Admissions Tools Are Currently Being Used
Dental school A
Used in Admissions
GPA
DAT
Unstructured Interview
CDA Structured interview
Structured Interview (Not CDA)
PBL evaluation
NEO-PI-R Personality inventory
Curriculum vitae
Letters of reference
Personal statement

76
How Admissions Tools are used
% Weight
Minimum
Cut Score
GPA
DAT
Academic Average
Reading Comprehension
Natural Sciences
Perceptual Ability
Manual Dexterity
Unstructured Interview
CDA Structured interview
Structured Interview (Not CDA)
PBL evaluation
NEO-PI-R Personality inventory
Curriculum vitae
Letters of reference
Personal statement

77
Institution:
Name: Dr.
Question Response
1. What factors should be evaluated in candidates with a
view to admissions to dental school (examples could
include cognitive and non-cognitive attributes)?
2. What instruments and/or techniques should be used
to evaluate these attributes?
3. What other admissions tools would you like to
incorporate into your admissions process and why?
4. Minimum cut scores are used for some admissions
components by some schools but there is a great deal of
variation in the cut scores chosen (see examples below).
Perceptual Ability 10-15
Manual Dexterity 3-15
Should a minimum cut score be recommended for DAT test
components?
5. Do you feel there is value in having a standardized
admissions test (DAT or some other standardized test) to all
applicants to Canadian Dental Schools?

78
All 10 schools use an interview in their admissions
process. Structured interviews are used in 9 of the 10
schools. 5 of the 9 schools using a structured interview
use the CDA Structured Interview.
6. If the CDA Structured Interview is NOT used, what are
the reasons?
7. How should the DAT and its test components be
improved?
8. If you answered YES to Q7, what test components
should be included?
9. What do perceive are inherent flaws in the tools you
currently use?
10. How do deal with the flaws in your admissions
process (security, calibration for interviews, etc.)?
11. Is there a desire to have a national admissions test
battery for dental schools to utilize?
12. If you answered YES to Q11, why is a national
admissions test important?
13. If a new national Admission Committee was
established to serve the needs of the 10 Canadian dental
schools, what should be included in the terms of
reference for this committee?
79
14. Are any other admissions tools being used at your
dental school that do NOT appear on the Admissions
Survey sheet?
A follow-up call will be scheduled with at least two of the
ad hoc Committee members. Please advise of the best
days and times for a conference call to be arranged.

80
Appendix B
CDA-ACFD DAT Review Working Group
Interview Questions
January 2013
1. Please provide a rationale for each of the admissions tools used at your institution. 2. What are the reasons for rejecting some admissions tools that your school has considered? 3. What concerns do you have with the admissions tools currently being used at your institution? 4. Are there any factors/constructs/phenomena that you think should be evaluated in dental
admissions processes but which are not currently evaluated? And if so, do you have any idea how we could evaluate such factors?
5. Are you aware of any experts in the field of selection/admissions tools that should be consulted in
this process? 6. Non-cognitive attributes have been identified as an important component of the admissions
process. The CDA Structured Interview was designed to measure those attributes. Should effort be made to improve the CDA structured Interview or should another assessment method be sought?
7. What tests should be included in a national standardized test battery? 8. The CDA has been responsible for the management and administration of the DAT. What
suggestions do you have for the structure and function of a Committee charged with this responsibility in the future?
9. What outcomes would you like to see from the ACFD-CDA DAT Working Group?

81
Appendix C
ACFD-CDA DAT Review Working Group Interview Questions
ACFD, CDA, CDAC, CDRAF, NDEB May 2013 1.Does your organization have an interest in admissions policies and procedures used at Canadian dental schools? 2. If the answer is NO, there is no need to go further. 3. If the answer is YES, please explain. 4. What do you know of the various admissions tools and policies used by Canadian dental schools? 5. What concerns do you have with the admissions tools currently being used to admit students to Canadian dental programs? 6. Are there any factors/constructs/phenomena that you think should be evaluated in dental admissions processes but which, as far as you know, are not currently evaluated or are inadequately evaluated? And if so, do you have any idea how we could evaluate such factors? 7. Are you aware of any experts in the field of selection/admissions tools that should be consulted in this process? 8. Non-cognitive attributes have been identified as an important component of the admissions process, including assessment of manual dexterity, perception of spatial relationships, and ethical/professional attitudes. The CDA Structured Interview and the CDA DAT were designed to measure those attributes. Should effort be made to improve the CDA Structured Interview and CDA DAT or should other assessment methods be sought? 9. The CDA has been responsible for the management and administration of the DAT. What suggestions do you have for the structure and function of a Committee charged with this responsibility in the future? 10. How do you think your organization and/or its members could contribute to the process of admissions to dental programs in Canada? 11. What outcomes would you like to see from the ACFD-CDA DAT Working Group?

82
ACFD-CDA DAT Review Working Group Interview Questions
ADA May 2013 1. What are the most significant concerns regarding the admissions process or admissions tool identified by Admissions officers in US dental schools? 2. Are there any factors/constructs/phenomena that you think should be evaluated in dental admissions processes but which are not currently evaluated? And if so, do you have any idea how we could evaluate such factors? 3. Are you aware of any experts in the field of selection/admissions tools that should be consulted in this process? 4. Non-cognitive attributes have been identified as an important component of the admissions process. What admissions tools are currently being used or are being evaluated to assess non-cognitive attributes? 5. Are Admissions officers in the US schools concerned about assessing manual dexterity in the admissions process? 6. If YES, are there any tests being considered to assess manual dexterity?
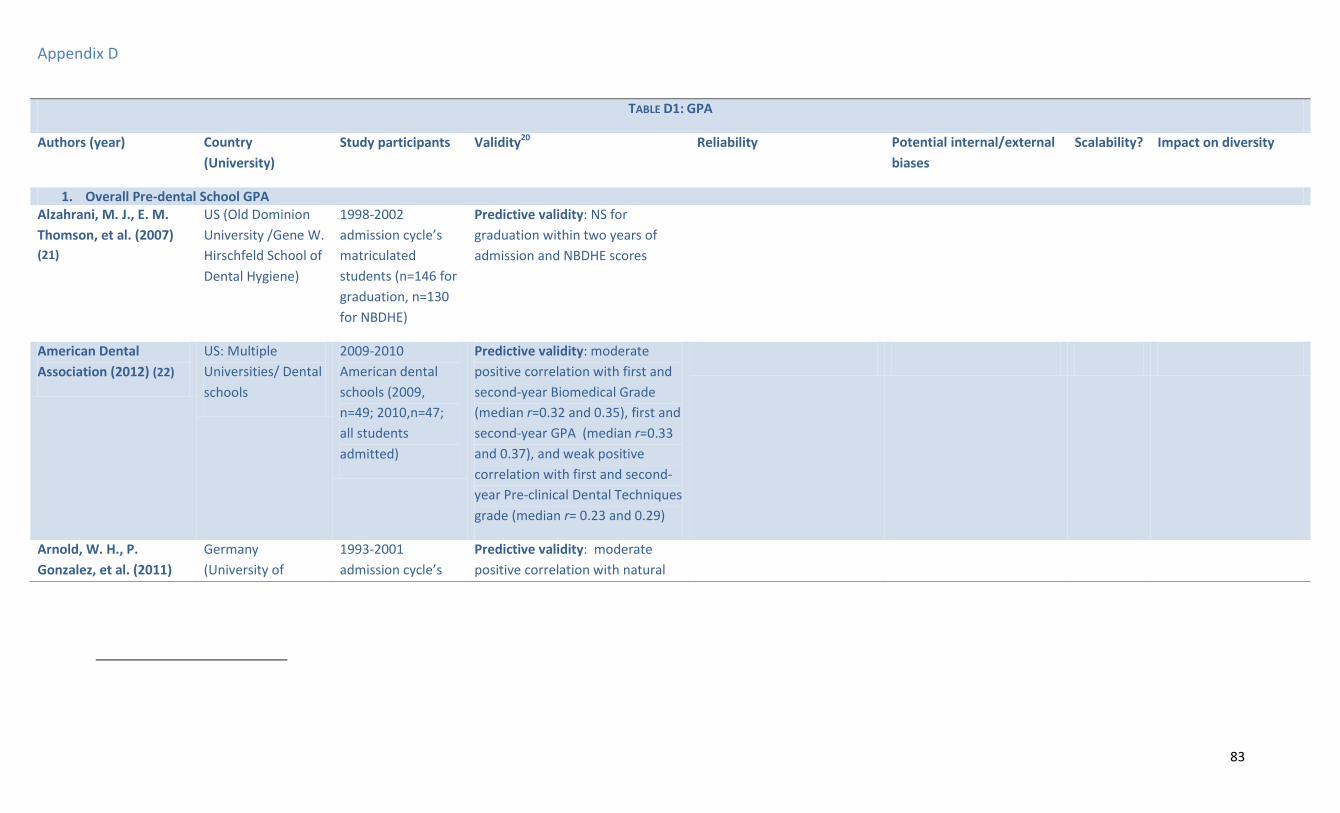
83
Appendix D
TABLE D1: GPA
Authors (year) Country
(University)
Study participants Validity20 Reliability Potential internal/external
biases
Scalability? Impact on diversity
1. Overall Pre-dental School GPA Alzahrani, M. J., E. M.
Thomson, et al. (2007)
(21)
US (Old Dominion
University /Gene W.
Hirschfeld School of
Dental Hygiene)
1998-2002
admission cycle’s
matriculated
students (n=146 for
graduation, n=130
for NBDHE)
Predictive validity: NS for
graduation within two years of
admission and NBDHE scores
American Dental
Association (2012) (22)
US: Multiple
Universities/ Dental
schools
2009-2010
American dental
schools (2009,
n=49; 2010,n=47;
all students
admitted)
Predictive validity: moderate
positive correlation with first and
second-year Biomedical Grade
(median r=0.32 and 0.35), first and
second-year GPA (median r=0.33
and 0.37), and weak positive
correlation with first and second-
year Pre-clinical Dental Techniques
grade (median r= 0.23 and 0.29)
Arnold, W. H., P.
Gonzalez, et al. (2011)
Germany
(University of
1993-2001
admission cycle’s
Predictive validity: moderate
positive correlation with natural

84
(23) Witten /Herdecke) matriculated
students (n=194 for
first dental exam,
n=193 for national
science exam, and
n=163 for state
board exam)
science examination (r=0.343 r2 =
0.12, p<0.001), and weak positive
correlation with first dental
examination and state board
examination scores (r= 0.268 and
0.269 respectively, p< 0.001
r2=0.07) Convergent/Divergent
validity: significant positive
correlation with unstructured
interview (R=0.238, p< 0.001)
Curtis, D. A., S. L. Lind, et
al. (2007) (25)
US (University of
California / School
of Dentistry)
2001-2005
graduating classes’
normally tracking
students (n=49) and
underachieving
students (n=45)
Predictive validity: Normally
tracking students: moderate
positive correlation with fourth-
year GPA (r=0.33 p< 0.05) but non
significantly correlated with firs-
year GPA Underachieving
students: weak positive
correlation with first-year GPA
(r=0.26 p< 0.05) but non
significantly correlated with
fourth-year GPA. Multiple
regressions: NS for both groups for
Y1 and Y4.
Gardner, S. P. and K. F.
Roberts-Thomson (2012)
(38)
Australia
(University of
Adelaide )
2003-2009
admission cycle’s
applicants (n=216)
(uGPA/STAT) Predictive
validity: Significantly associated
with achieving three or more
credits in year 1 (RR 0.38
p=0.008 vs. 150 and up), but

85
not for year 2 and 3
Holmes, D. C., J. V.
Doering, et al. (2008)
(26)
US (University of
Iowa / College of
Dentistry)
2000-2007
graduate students
(n= 574)
Predictive validity: moderate
positive correlation to Dental
school GPA (r= 0.529), NBDE Part I
and II (r= 0.497 and 0.433), and
weak positive correlation with
Final Clinical grade (r = 0.276).
Concurrent validity: Weak
Convergent/ divergent validity:
strong positive correlation with
pre-dental Science (r=0.936), and
moderate positive correlation with
DAT Academic Average, DAT
Perceptual Ability, and DAT Total
science scores (r = 0.252 - 0.400).
Kim, M. and J. I. Lee
(2007) (24)
Korea (Seoul
National University)
2005 admission
cycle matriculated
first semester
student (n=90)
Predictive validity: positively
related to achievement in first
semester (β=.242, p< 0.01).
Convergent/Divergent validity:
No significant relationship with
MEET/DEET, oral exam and
interview scores.
Kingsley, K., J. Sewell, et
al. (2007) (12)
US (University of
Nevada /School of
Dental Medicine)
2002-2004
admission cycle’s
matriculated
Predictive validity: non
significantly correlated with NBDE-
1 and Dental School GPA
Ethnic/racial: Non
minority students have
significantly higher
scores than minority

86
students (n=275) students(3.38 vs. 3.20,
p= 0.02) Gender bias:
NS
Lopez, N., K. Self, et al.
(2009) (15)
US (University of
Minnesota/ School
of Dentistry)
2007-2008
admission cycle
applicants (n=1838)
Ethnic/racial: minority
students had lower
weighted GPA than non
minority students.
Gender: NS
Rich, A. M., K. M. S.
Ayers, et al. (2012) (39)
New Zealand
(University of
Otago, Faculty of
Dentistry)
students
admitted into
their second
year of dental
school between
2004-2009
(n=411)
Predictive validity: comparing
students with pre-dental GPA
above and under 82%: NS with
graduation with distinction, any
subject distinction, any subject
prize, or remedial examination
request
2. Pre-dental College Science GPA
Alzahrani, M. J., E. M.
Thomson, et al. (2007)
(21)
US (Old Dominion
University /Gene W.
Hirschfeld School of
Dental Hygiene)
1998-2002
admission cycle’s
matriculated
students (n=146 for
graduation, n=130
for NBDHE)
Predictive validity: non
significantly related with
graduation within two year of
admission and NBDHE scores
American Dental
Association (2012) (22)
US: Multiple
Universities/ Dental
schools
2009-2010
American dental
schools (2009,
Predictive validity: moderate
positive correlation with first and
second-year Biomedical grades

87
n=49; 2010,n=47) (median r=0.33 and 0.32), first and
second-year GPA (median r=0.35
and 0.37 ) and weak positive
correlation with first and second-
year Pre-clinical Dental Techniques
grades (median r= 0.24 and 0.28)
Arnold, W. H., P.
Gonzalez, et al. (2011)
(23)
Germany
(University of
Witten /Herdecke)
1993-2001
admission cycle’s
matriculated
students (n=194 for
first dental exam,
n=193 for national
science exam, and
n=163 for state
board exam)
Predictive validity: natural
science examination subject
grade: moderate positive
correlation with biology scores
(r=0.276, r2 = 0.07 p=0.008), and
chemistry (r= 0.623, r2 = 0.38
p=0.023), but NS with physics
scores (p=0.27)
Convergent/Divergent validity:
significant positive correlation
with unstructured interview
(R=0.238, p< 0.001)
Curtis, D. A., S. L. Lind, et
al. (2007) (25)
US (University of
California / School
of Dentistry)
2001-2005
graduating classes’
normally tracking
students (n=49) and
underachieving
students (n=45)
Predictive validity: Normally
tracking students: weak positive
correlation with first and fourth-
year GPA (r=0.27 and 0.32,
p<0.05), Underachieving students:
non significantly correlated with
first and fourth-year GPA .
Multiple regressions: NS for both
groups for Y1 and Y4

88
Holmes, D. C., J. V.
Doering, et al. (2008)
(26)
US (University of
Iowa College of
Dentistry)
2000-2007
graduate students
(n= 574)
Predictive validity: moderately
correlated to Dental school GPA
(r= 0.537) and NBDE Part I and II
(r= 0.527 and 0.460), and weakly
correlate with Final Clinical Grade
(r = 0.277). Concurrent validity:
unable to distinguish between
those who passed CRDTS EXAM
and those who failed. Convergent
/ Divergent validity: strongly
correlated with overall pre-dental
GPA (r=0.936), and moderately
correlated with DAT Academic
Average, DAT Perceptual Ability,
and DAT Total science scores
(r=0.288 - 0.472).
Kingsley, K., J. Sewell, et
al. (2007) (12)
US (University of
Nevada, School of
Dental Medicine)
2002-2004
admission cycle’s
matriculated
students (n=275)
Predictive validity: non
significantly correlated with NBDE-
1 and Dental School GPA
Ethnic/racial: Non
minority have higher
scores than minority
(3.26 vs. 3.05) Gender:
NS
Park, S. E., J. D. Da Silva,
et al. (2010) (28)
US (Harvard
/School of Dental
Medicine)
2001-2005
graduate
students (n=159)
Predictive validity : non
significantly correlated with
performance in TXAD with
Honours (OR 3.9, p=0.10)
3. GPA-Pathology

89
Alzahrani, M. J., E. M.
Thomson, et al. (2007)
(21)
US (Old Dominion
University /Gene W.
Hirschfeld School of
Dental Hygiene)
1998-2002
admission cycle’s
matriculated
students (n=146 for
graduation, n=130
for NBDHE)
Predictive validity: related with
graduation within two years of
admission (β=1.0967 , p=0.0008)
and NBDHE scores (β =2.98093
p<0.0001)
4. GPA-Microbiology
Alzahrani, M. J., E. M.
Thomson, et al. (2007)
(21)
US (Old Dominion
University /Gene W.
Hirschfeld School of
Dental Hygiene)
1998-2002
admission cycle’s
matriculated
students (n=146 for
graduation, n=130
for NBDHE)
Predictive validity: non
significantly related with
graduation within two years of
admission and NBDHE scores
5. GPA-Chemistry
Alzahrani, M. J., E. M.
Thomson, et al. (2007)
(21)
US (Old Dominion
University /Gene W.
Hirschfeld School of
Dental Hygiene)
1998-2002
admission cycle’s
matriculated
students (n=146 for
graduation, n=130
for NBDHE)
Predictive validity: non
significantly related with
graduation within two years of
admission and NBDHE scores
6. GPA-Oral Anatomy
Alzahrani, M. J., E. M.
Thomson, et al. (2007)
US (Old Dominion
University /Gene W.
1998-2002
admission cycle’s
Predictive validity: non
significantly related with

90
(21) Hirschfeld School of
Dental Hygiene)
matriculated
students (n=146 for
graduation, n=130
for NBDHE)
graduation within two years of
admission but significantly related
to NBDHE scores (β=3.31188 p<
0.0001)
7. GPA-Anatomy
Alzahrani, M. J., E. M.
Thomson, et al. (2007)
(21)
US (Old Dominion
University /Gene W.
Hirschfeld School of
Dental Hygiene)
1998-2002
admission cycle’s
matriculated
students (n=146 for
graduation, n=130
for NBDHE)
Predictive validity: non
significantly related with
graduation within two years of
admission and NBDHE scores
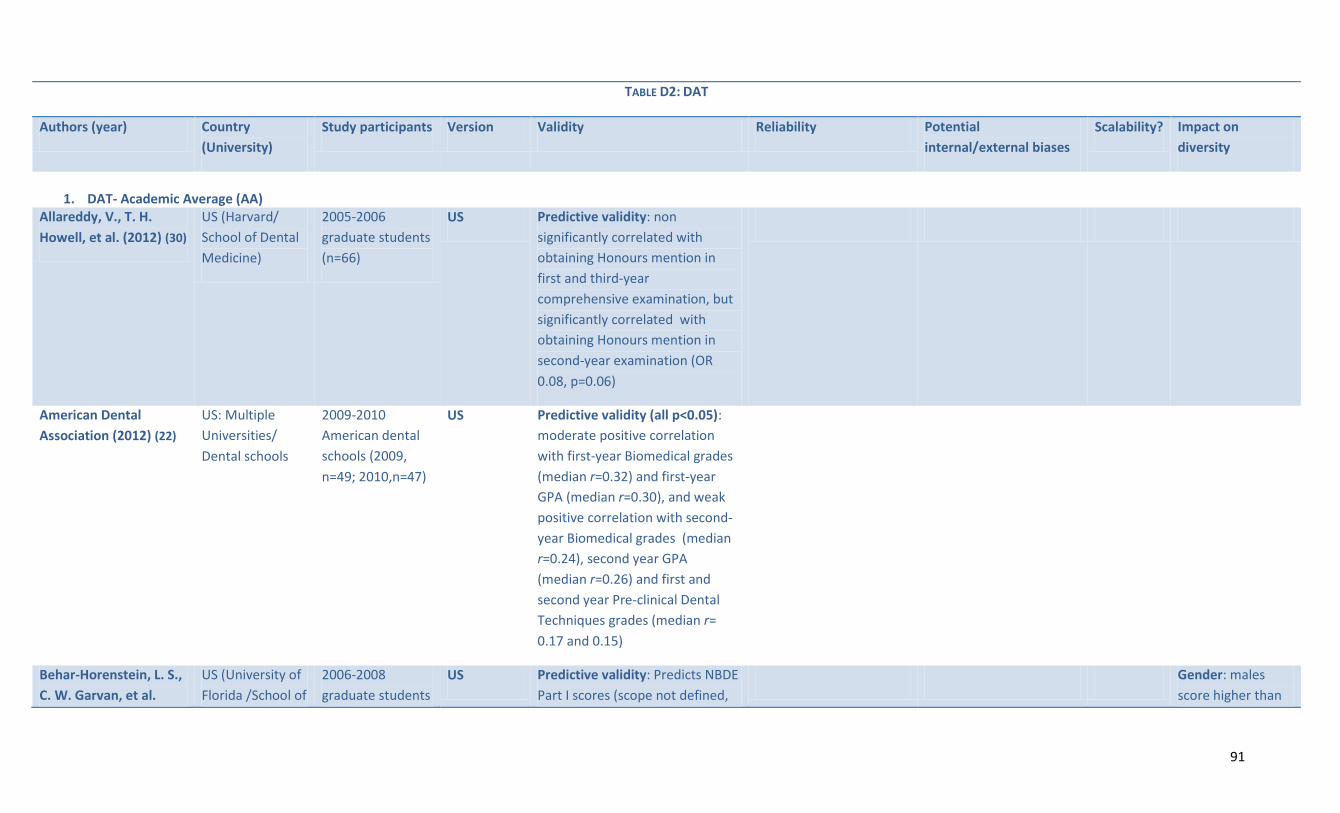
91
TABLE D2: DAT
Authors (year) Country
(University)
Study participants Version Validity Reliability Potential
internal/external biases
Scalability? Impact on
diversity
1. DAT- Academic Average (AA)
Allareddy, V., T. H.
Howell, et al. (2012) (30)
US (Harvard/
School of Dental
Medicine)
2005-2006
graduate students
(n=66)
US Predictive validity: non
significantly correlated with
obtaining Honours mention in
first and third-year
comprehensive examination, but
significantly correlated with
obtaining Honours mention in
second-year examination (OR
0.08, p=0.06)
American Dental
Association (2012) (22)
US: Multiple
Universities/
Dental schools
2009-2010
American dental
schools (2009,
n=49; 2010,n=47)
US Predictive validity (all p<0.05):
moderate positive correlation
with first-year Biomedical grades
(median r=0.32) and first-year
GPA (median r=0.30), and weak
positive correlation with second-
year Biomedical grades (median
r=0.24), second year GPA
(median r=0.26) and first and
second year Pre-clinical Dental
Techniques grades (median r=
0.17 and 0.15)
Behar-Horenstein, L. S.,
C. W. Garvan, et al.
US (University of
Florida /School of
2006-2008
graduate students
US Predictive validity: Predicts NBDE
Part I scores (scope not defined,
Gender: males
score higher than

92
(2011) (31) Dentistry) (n=209) p<0.001) but not Part II females (19.9 vs.
19.4 p=0.084
Curtis, D. A., S. L. Lind,
et al. (2007) (25)
US (University of
California /
School of
Dentistry)
2001-2005
graduating
classes’ normally
tracking students
(n=49) and
underachieving
students (n=45)
US Predictive validity: Normally
tracking students: moderate
positive correlation with first-year
GPA (r=0.36 p<0.05) and weak
positive correlation with fourth-
year GPA (r=0.28 p<0.05),
Underachieving students: non
significantly correlated with first
and fourth-year GPA Multiple
regressions: NS for both groups
for Y1 and Y4
Holmes, D. C., J. V.
Doering, et al. (2008)
(26)
US (University of
Iowa / College of
Dentistry)
2000-2007
graduate students
(n= 574)
US Predictive validity: moderate
positive correlation to Dental
school GPA ( r = 0.494), and NBDE
Part I and II (r= 0.610 and 0.524),
and weakly correlated to Final
Clinical Grade (r = 0.204)
Concurrent validity: NS
Convergent/ divergent validity:
Strong positive correlation to DAT
Total Science scores (r= 0.899)
and moderately correlated to DAT
Perceptual Ability scores (r=
0.504)
Kingsley, K., J. Sewell, et US (University of
Nevada /School
2002-2004
admission cycle’s
US Predictive validity: non
significantly correlated with
Ethnic/racial: NS

93
al. (2007) (12) of Dental
Medicine)
matriculated
students (n=275)
NBDE-1 scores and Dental School
GPA
Gender: NS
Poole, A., V. M. Catano,
et al. (2007) (19)
Canada (Four
Dental schools
names
undisclosed)
Year undisclosed -
dental school
students, Y1 to Y4
(n=373 Y1, n= 237
Y2, n=176 Y3, and
n=161 Y4)
Canadian Predictive validity: modest
positive correlated with first-year
GPA (r=0.46 p<0.01), Y2 clinical
(r=0.23 p<0.05) and Y2 academic
GPA (r=0.52 p<0.01), but non
significantly correlated with Y3
clinical or academic GPA and Y4
academic and clinical GPA-
corrected for range restriction
and measurement error
Concurrent validity: matriculated
participants have a higher DAT
scores than applicant pool (17.36
SD 2.64 vs. 19.15 SD 2.42)
Convergent /Divergent validity:
moderate positive correlation
with DAT reading comprehension
(r=0.63 p<0.01) and perceptual
ability (r=0.41 p<0.01), and weak
positive correlation with
academic average (r=0.14 p<0.05)
Victoroff, K. Z. and R. E.
Boyatzis (2013) (36)
US (Case
Western Reserve
University /
School of Dental
Medicine)
Year undisclosed -
third and fourth-
year students
(n=100)
US Predictive validity: positively
correlated with Didactic GPA
(Model 1 β= 0.424 p≤ 0.001;
Model II β= 0.442 p≤ 0.001), and
negatively correlated with
Gender: NS Age:
NS

94
Preclinical GPA Model 1 NS;
Model II β= - 0.342 p≤ 0.001;
Model III β= - 0.336, p≤ 0.001),
but non significantly correlated
with clinical GPA (all 3 models: Y3-
Y4) Convergent/Divergent
validity: moderate positive
correlation with DAT-PAT
(r=0.266)
2. DAT- Perceptual Ability Test (PAT)
Allareddy, V., T. H.
Howell, et al. (2012) (30)
US (Harvard/
School of Dental
Medicine)
2005-2006
graduate students
(n=66)
US Predictive validity: NS with
obtaining Honours in first, second
and third comprehensive
examination
American Dental
Association (2012) (22)
US: Multiple
Universities/
Dental schools
2009-2010
American dental
schools (2009,
n=49; 2010,n=47)
US Predictive validity (all p<0.05):
weak positive correlation with
first and second year Biomedical
Grades (r= 0.27 and 0.21), First
year and second year GPA
(r=0.24 and 0.19) and first and
second year pre-clinical dental
techniques grades (r= 0.12 and
0.12
Behar-Horenstein, L. S.,
C. W. Garvan, et al.
US (University of
Florida /School of
2006-2008
graduate students
US Predictive validity: NS for NBDE
Part I, but almost significantly
Gender: males
score higher than
females (18.4 vs.

95
(2011) (31) Dentistry) (n=209) predicts Part II (p=0.08) 17.5 p=0.004
Curtis, D. A., S. L. Lind,
et al. (2007) (25)
US (University of
California /
School of
Dentistry)
2001-2005
graduating
classes’ normally
tracking students
(n=49) and
underachieving
students (n=45)
US Predictive validity: Multiple
regressions and correlations: NS
for both normally tracking
students and underachieving
students Y1 and Y4
Holmes, D. C., J. V.
Doering, et al. (2008)
(26)
US (University of
Iowa / College of
Dentistry)
2000-2007
graduate students
(n= 574)
US Predictive validity: (all p<0.05)
Moderate positive correlation
with NBDE Part I (r=0.363), part II
(r= 0.344), Dental school GPA
(r=0.370) and final clinical
grade(r=0.259)
Kim, M. and J. I. Lee
(2007) (24)
Korea (Seoul
National
University)
2005 admission
cycle matriculated
first semester
student (n=90)
MEET/DEET Predictive validity: NS related to
achievement in first semester
Convergent/Divergent validity:
No significant relationship with
GPA, oral exam and interview
scores.
Kingsley, K., J. Sewell, et
al. (2007) (12)
US (University of
Nevada /School
of Dental
Medicine)
2002-2004
admission cycle’s
matriculated
students (n=275)
US Predictive validity: non
significantly correlated with
NBDE-1 and Dental School GPA
Ethnic/racial: NS
Gender: NS
Lundergan, W. P., E. J.
Soderstrom, et al.
US (University of
the Pacific Arthur
Year undisclosed -
randomly selected
US Predictive validity (all p<0.05):
weak positive correlation with

96
(2007) (35) A. Dugoni School
of Dentistry)
first-year students
in their first
quarter (n=51)
first-year Laboratory and Study
skills (r=.271), and moderate
positive correlation with
Operative Dentistry (r=.308),
Fixed Prosthodontics (r=.318),
Dental Anatomy (.447) and
clinical GPA (r=.423)
Park, S. E., J. D. Da Silva,
et al. (2010) (28)
US (Harvard
/School of Dental
Medicine)
2001-2005
graduate students
(n=159)
US Predictive validity: non
significantly correlated with
performance in TXAD with
Honours (OR 1.1, p=0.13)
Poole, A., V. M. Catano,
et al. (2007) (19)
Canada (Four
Dental schools
names
undisclosed)
Year undisclosed -
dental school
students, Y1 to Y4
(Y1 n=373, Y2
n=237, Y3 n=176, Y4
n=161)
Canadian Predictive validity: weak positive
correlation with Y1 GPA (r=.21,
p<0.05) and Y2 clinical (r=.27,
p<0.05) NS for Y2 academic GPA,
Y3 clinical and academic GPA and
Y4 academic and clinical GPA -
corrected for range restriction
and measurement error
Concurrent validity: matriculated
participants have a higher DAT
scores than applicant pool (17.80
SD 2.62 vs. 17.05 SD 2.66)
Convergent /Divergent validity:
weak correlation with DAT
reading comprehension(r=.13 p<
0.05), and moderate correlation
with academic average (r=.44 p<

97
0.01)
Urbankova, A. and S. P.
Engebretson (2011a)
(44)
US (Stony Brook
School of Dental
Medicine)
2012 admission
cycle’s
matriculated first-
year dental
students (n=39)
US Predictive validity: the students
who scored lower (both for below
18 and below 19) scored
significantly lower on Exam I (r2 =
0.13, p=0.02)
Victoroff, K. Z. and R. E.
Boyatzis (2013) (36)
US (Case
Western Reserve
University /
School of Dental
Medicine)
Year undisclosed -
third and fourth-
year students
(n=100)
US Predictive validity: NS with
Didactic GPA and clinical GPA but
positively related with Preclinical
GPA (Model 1 β= 0.388; Model II
β= 0.73 p≤ 0.001; Model III β=
0.360, p≤ 0.001),
Convergent/Divergent validity:
moderate positive correlation
with DAT-AA (r=0.266)
Gender: NS Age:
NS
3. DAT- Survey of Natural Science / Total Science (TS)
Allareddy, V., T. H.
Howell, et al. (2012) (30)
US (Harvard/
School of Dental
Medicine)
2005-2006
graduate students
(n=66)
US Predictive validity: non
significantly correlated with
obtaining Honours mention in
first and third comprehensive
examination, but significantly
correlated with obtaining
Honours mention second-year
examination (OR 14.17 p=0.01)
American Dental US: Multiple 2009-2010 US Predictive validity (all p<0.05):

98
Association (2012) (22) Universities/
Dental schools
American dental
schools (2009,
n=49; 2010,n=47)
weak positive correlation with
first and second-year Biomedical
grades (r=0.28 and 0.20), first
and second-year GPA (r=0.26 and
0.21) and first and second-year
Pre-clinical Dental Techniques
grades (r= 0.16 and 0.15)
Behar-Horenstein, L. S.,
C. W. Garvan, et al.
(2011) (31)
US (University of
Florida /School of
Dentistry)
2006-2008
graduate students
(n=209)
US Gender: males
have almost
significant higher
scores than
females (9.6 vs.
18.9, p=0.115)
Holmes, D. C., J. V.
Doering, et al. (2008)
(26)
US (University of
Iowa / College of
Dentistry)
2000-2007
graduate students
(n= 574)
US Predictive validity: moderate
positive correlation with dental
school GPA ( r = 0.449), and NBDE
Part I and II (r= 0.582 and 0.469),
and weak positive correlation
with Final Clinical Grade (r =
0.152) Concurrent validity: NS
Convergent/ divergent validity:
Strong positive correlation with
DAT Academic Average (r= 0.899)
and moderate positive correlation
with DAT Perceptual Ability (r=
0.470).

99
4. DAT Quantitative Analysis (QR)
Allareddy, V., T. H.
Howell, et al. (2012) (30)
US (Harvard/
School of Dental
Medicine)
2005-2006
graduate students
(n=66)
US Predictive validity: non
significantly correlated with
obtaining Honours mention in
first and third comprehensive
examination, but significantly
correlated with obtaining
Honours mention second year
examination (OR 2.48 p=0.03)
American Dental
Association (2012) (22)
US: Multiple
Universities/
Dental schools
2009-2010
American dental
schools (2009,
n=49; 2010,n=47)
US Predictive validity (all p<0.05):
moderate positive correlation
with first-year Biomedical grades
(r=0.36), first-year GPA (r=0.34),
and weak correlation with
second-year Biomedical Grades
(r=0.27), second-year GPA
(r=0.29), first and second-year
Pre-clinical Dental Techniques
grades (r= 0.20 and 0.16)
Behar-Horenstein, L. S.,
C. W. Garvan, et al.
(2011) (31)
US (University of
Florida /School of
Dentistry)
2006-2008
graduate students
(n=209)
US Predictive validity: non
significantly related with NBDE
Part I and Part II
Gender: NS
Kingsley, K., J. Sewell, et
al. (2007) (12)
US (University of
Nevada, School
of Dental
Medicine)
2002-2004
admission cycle’s
matriculated
students (n=275)
US Predictive validity: non
significantly correlated with
NBDE-1 and Dental School GPA
Ethnic/racial: Non
minority have
higher scores than
minority (3.26 vs.

100
3.05) Gender: NS
5. DAT Reading Comprehension (RC)
Allareddy, V., T. H.
Howell, et al. (2012) (30)
US (Harvard/
School of Dental
Medicine)
2005-2006
graduate students
(n=66)
US Predictive validity: non
significantly correlated with
obtaining Honours mention in
first and second-year
comprehensive examination, but
significantly correlated with
obtaining Honours mention third-
year examination (OR 1.81
p=0.01)
American Dental
Association (2012) (22)
US: Multiple
Universities/
Dental schools
2009-2010
American dental
schools (2009,
n=49; 2010,n=47)
US Predictive validity (all p<0.05):
weak positive correlation with
first and second year Biomedical
Grades (0.18 and 0.12), First year
and second year GPA (0.22 and
0.22) and first and second year
pre-clinical dental techniques
grades (0.27 and 0.27)
Behar-Horenstein, L. S.,
C. W. Garvan, et al.
(2011) (31)
US (University of
Florida /School of
Dentistry)
2006-2008
graduate students
(n=209)
US Predictive validity: non
significantly related with NBDE
Part I but positive relationship
with Part II (p=0.023 range
undisclosed)
Gender: NS
Buyse, T. and F. Lievens Belgium (two 1997-2009 Belgium Content validity: high -

101
(2011) (32) Flemish school -
names
undisclosed)
admission cycle
matriculated
applicants (Y1
n=781, Y2n=489,
y3 n=343, Y4
n=274)
Silent
reading
protocol
specifically developed medical
content article (10p) with 30
multiple-choice (4) questions
Predictive validity: non
significantly correlated with any
GPA scores (year 1-5 and overall
GPA) Convergent/Divergent
validity: non significantly
correlated with cognitive portion
of admission exam and SJT
Foley, J. I. and K. Hijazi
(2013) (33)
UK (University of
Aberdeen Dental
School and
Hospital)
2008-2011
admission cycle’s
matriculated
students (n=75)
Silent
reading
protocol
Predictive validity: NS correlated
with CAS Scores
Kingsley, K., J. Sewell, et
al. (2007) (12)
US (University of
Nevada, School
of Dental
Medicine)
2002-2004
admission cycle’s
matriculated
students (n=275)
US Predictive validity: modest
positive correlation with NBDE
and dental school GPA for the
first cohort only (r=0.318 and
0.332 p<0.05) For all participants:
linear regression – only related to
NBDE-I (β= 0.310, p=.041), the
rest: NS
Ethnic/racial: NS
Gender: NS
Poole, A., V. M. Catano,
et al. (2007) (19)
Canada (Four
Dental schools
names
undisclosed)
Year undisclosed -
dental school
students, Y1 to Y4
(Y1 n=373, Y2
n=237, Y3 n=176,
Canadian Predictive validity: modest
positive correlated with first-year
GPA (r=0.25 p<0.05) but non
significantly correlated with Y2
clinical and academic GPA, Y3
academic and clinical GPA and Y4
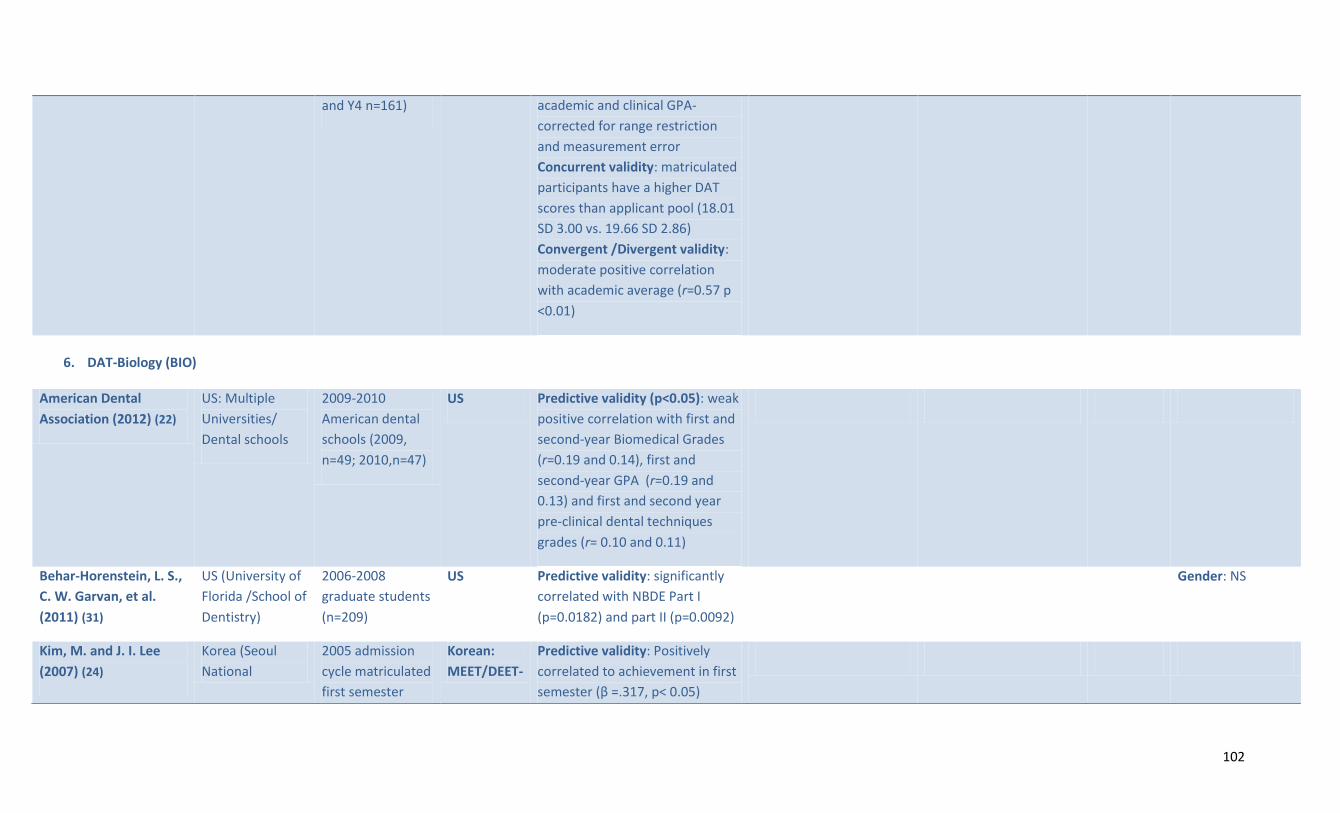
102
and Y4 n=161) academic and clinical GPA-
corrected for range restriction
and measurement error
Concurrent validity: matriculated
participants have a higher DAT
scores than applicant pool (18.01
SD 3.00 vs. 19.66 SD 2.86)
Convergent /Divergent validity:
moderate positive correlation
with academic average (r=0.57 p
<0.01)
6. DAT-Biology (BIO)
American Dental
Association (2012) (22)
US: Multiple
Universities/
Dental schools
2009-2010
American dental
schools (2009,
n=49; 2010,n=47)
US Predictive validity (p<0.05): weak
positive correlation with first and
second-year Biomedical Grades
(r=0.19 and 0.14), first and
second-year GPA (r=0.19 and
0.13) and first and second year
pre-clinical dental techniques
grades (r= 0.10 and 0.11)
Behar-Horenstein, L. S.,
C. W. Garvan, et al.
(2011) (31)
US (University of
Florida /School of
Dentistry)
2006-2008
graduate students
(n=209)
US Predictive validity: significantly
correlated with NBDE Part I
(p=0.0182) and part II (p=0.0092)
Gender: NS
Kim, M. and J. I. Lee
(2007) (24)
Korea (Seoul
National
2005 admission
cycle matriculated
first semester
Korean:
MEET/DEET-
Predictive validity: Positively
correlated to achievement in first
semester (β =.317, p< 0.05)

103
University) student (n=90) Part I Convergent/Divergent validity:
high positive correlation with Part
I (r=.603, p< 0.01), and modest
correlation with perceptual ability
scores (r=.208, p< 0.05) and oral
exam scores (r=.222, p< 0.05)
Kingsley, K., J. Sewell, et
al. (2007) (12)
US (University of
Nevada, School
of Dental
Medicine)
2002-2004
admission cycle’s
matriculated
students (n=275)
US Predictive validity: for the first
cohort only: modest positive
correlation with NBDE and dental
school GPA (r=0.383 and 0.310).
Linear regression for NBDE-I (B=
1.043, p=.012); All participants:
Pearson's NBDE R=0.304;
Correlation DS-GPA NS. Linear
regression NBDE-I (B= 0.585,
p=.001)
Ethnic/racial: NS
Gender: Males
have slightly higher
scores than
females (17.20 vs.
17.92)
7. DAT- Organic Chemistry (OC)
American Dental
Association (2012) (22)
US: Multiple
Universities/
Dental schools
2009-2010
American dental
schools (2009,
n=49; 2010,n=47)
US Predictive validity (p<0.05): weak
positive correlation with first and
second-year Biomedical Grades
(r=0.23 and 0.21), first and
second-year GPA (r=0.23 and
0.24) and first and second year
pre-clinical dental techniques
grades (r= 0.09 and 0.14)
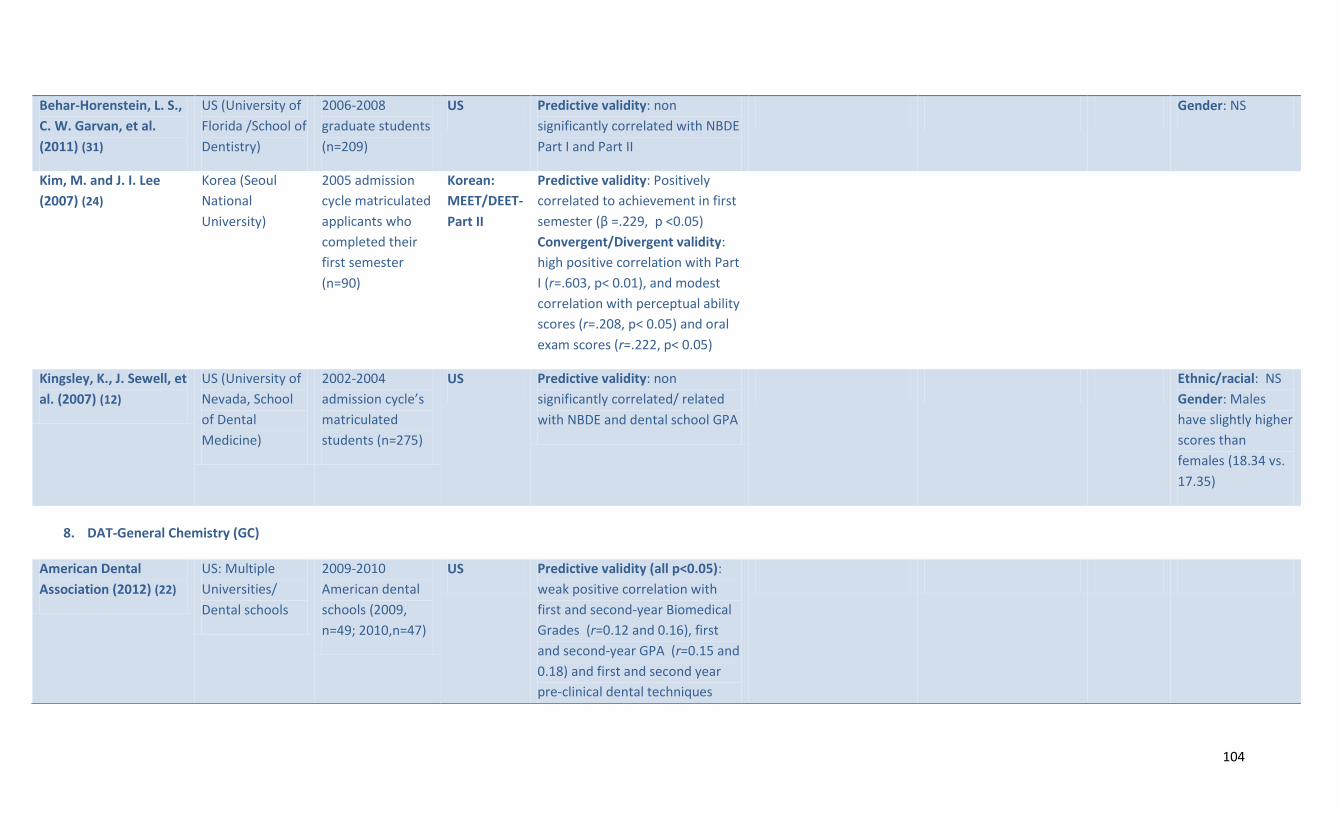
104
Behar-Horenstein, L. S.,
C. W. Garvan, et al.
(2011) (31)
US (University of
Florida /School of
Dentistry)
2006-2008
graduate students
(n=209)
US Predictive validity: non
significantly correlated with NBDE
Part I and Part II
Gender: NS
Kim, M. and J. I. Lee
(2007) (24)
Korea (Seoul
National
University)
2005 admission
cycle matriculated
applicants who
completed their
first semester
(n=90)
Korean:
MEET/DEET-
Part II
Predictive validity: Positively
correlated to achievement in first
semester (β =.229, p <0.05)
Convergent/Divergent validity:
high positive correlation with Part
I (r=.603, p< 0.01), and modest
correlation with perceptual ability
scores (r=.208, p< 0.05) and oral
exam scores (r=.222, p< 0.05)
Kingsley, K., J. Sewell, et
al. (2007) (12)
US (University of
Nevada, School
of Dental
Medicine)
2002-2004
admission cycle’s
matriculated
students (n=275)
US Predictive validity: non
significantly correlated/ related
with NBDE and dental school GPA
Ethnic/racial: NS
Gender: Males
have slightly higher
scores than
females (18.34 vs.
17.35)
8. DAT-General Chemistry (GC)
American Dental
Association (2012) (22)
US: Multiple
Universities/
Dental schools
2009-2010
American dental
schools (2009,
n=49; 2010,n=47)
US Predictive validity (all p<0.05):
weak positive correlation with
first and second-year Biomedical
Grades (r=0.12 and 0.16), first
and second-year GPA (r=0.15 and
0.18) and first and second year
pre-clinical dental techniques

105
grades (r= 0.10 and 0.09)
Behar-Horenstein, L. S.,
C. W. Garvan, et al.
(2011) (31)
US (University of
Florida /School of
Dentistry)
2006-2008
graduate students
(n=209)
US Predictive validity: non
significantly correlated with NBDE
Part I and Part II
Gender: NS
9. DAT-Average Weighted Score
American Dental
Association (2012) (22)
US: Multiple
Universities/
Dental schools
2009-2010
American dental
schools (2009,
n=49; 2010,n=47)
US Predictive validity (all p<0.05):
weak positive correlation with
first and second-year Biomedical
Grades (r=0.19 and 0.14), first
and second-year GPA (r=0.19 and
0.17) and first and second year
pre-clinical dental techniques
grades (r= 0.16 and 0.17)
Lopez, N., K. Self, et al.
(2009) (15)
US (University of
Minnesota/
School of
Dentistry)
2007-2008
admission cycle’s
applicants
(n=1838)
US Ethnic/racial:
minority students
had lower
weighted GPA than
non minority
students Gender:
males have higher
scores than
females

106
10. DAT Overall Test Scores
Beier, U. S., I. Kapferer,
et al. (2010) (54)
Austria
(Innsbruck
Medical
University)
2001-2005
admission cycle’s
matriculated
applicants (n=97)
Austrian –
total DAT
theory
scores
Predictive validity: Graduation on
time: Yes 217.62 SD 21.95 vs.
206.16 SD 23.13, Tstat 3.151
p=0.002
Beier, U. S., I. Kapferer,
et al. (2010) (54)
Austria
(Innsbruck
Medical
University)
2001-2005
admission cycle’s
matriculated
applicants (n=97)
Austrian –
total DAT
theory and
practical
scores
Predictive validity: Graduation on
time: Yes 417.66 SD 45.99 vs.
384.92 SD 51.68, Tstat 3.151
p=0.002
Beier, U. S., I. Kapferer,
et al. (2012) (54)
Austria
(Innsbruck
Medical
University
/Dental School
2001-2006
admission cycle’s
matriculated
applicants (n=122)
Austrian Predictive validity: significantly
related to average on final exam
grades (β = -.220, p=0.017)
Park, S. E., J. D. Da Silva,
et al. (2010) (28)
US (Harvard
/School of Dental
Medicine)
2001-2005
graduate students
(n=159)
US Predictive validity: correlated
with performance in TXAD with
Honours (OR 1.1, p=0.13)
11. Other cognitive selection tools Gardner, S. P. and K. F.
Roberts-Thomson
(2012) (38)
Australia
(University of
Adelaide)
2003-2009
admission cycle’s
applicants (n=216)
UMAT Predictive validity: Significantly
correlated with achieving three or
more credits in year 1, but only
for UMAT scores 100-129 (RR
0.59 p=0.046 vs. 150 and up), but
NS for year 2 and 3 (all scores)

107
Rich, A. M., K. M. S.
Ayers, et al. (2012) (39)
New Zealand
(University of
Otago, Faculty of
Dentistry)
Students admitted
into their second
year of dental
school between
2004-2009
(n=411)
UMAT Predictive validity: a larger
proportion of students who had
median or above scores in section
2 graduated with credit or
distinction than below median
(85.2% vs. 50% p<0.001); a larger
proportion of below median
students required remedial
examination than median and
above (16 vs. 3.5% p<0.05)
Gardner, S. P. and K. F.
Roberts-Thomson
(2012) (38)
Australia
(University of
Adelaide)
2003-2009
admission cycle’s
applicants (n=216)
TER Predictive validity: significantly
correlated with achieving three or
more credits in year 1, for TER 80-
89.99 (RR 0.46 p=0.030 vs. 150
and up), TER 75-79.99 (RR 0.43
p=0,0016 vs. 150 and up), and for
TER <75 (RR 0.11 p= 0.006 vs. 150
and up), but NS for year 2 and 3

108
TABLE D3: INTERVIEW FORMATS
Authors (year) Country (University) Study participants Validity Reliability Potential internal/external
biases
Scalability? Impact on diversity
1. Unstructured /Semi-structured interview
Kim, M. and J. I. Lee
(2007) (24)
Korea (Seoul
National University)
2005 admission
cycle matriculated
first semester
student (n=90)
Predictive validity: negatively
correlated to achievement in first
semester (β=.272, p< 0.01)
Convergent/Divergent validity:
moderate positive correlation with
oral exam scores (r=.622, p<0.01)
2. Structured interview
Bender, D. J., D. T. Burk,
et al. (2007) (63)
US (Tufts University,
School of Dental
Medicine
2001-2005
admission cycle’s
applicants
(n=1,192)
Gender: no relationship
btw applicant-
interviewer gender
concordance and
applicant’s decision to
enrol.
Kay, E., J. Bennett, et al.
(2010) (37)
UK (Exeter and
Plymouth
University/Peninsula
College of Medicine
and Dentistry)
2007 matriculated
applicants (n=62)
Convergent/Divergent validity:
correlations between interview
scores and traditional aptitude
test (GAMSAT, Year one progress
test scores and Year-one test
scores in life sciences) were weak
and failed to reach statistical
Testing effects: Low
Experimenter expectation
Bias: Low
Yes Gender or
socioeconomic
background: NS except
for one question that
displayed visually
detectable differential
item functioning

109
significance. between subgroups
Gardner, S. P. and K. F.
Roberts-Thomson (2012)
(38)
Australia (University
of Adelaide)
2003-2009
admission cycle’s
matriculated
applicants (n=216)
Predictive validity: non
significantly correlated with
achieving three or more credits in
year 1, and 2, and 3
Poole, A. et al. (2007)
(19)
Canada (four dental
schools names
undisclosed)
Year undisclosed -
dental school
students, Y1 to Y4
(Y1 n=373, Y2
n=237, Y3 n=176,
Y4 n=161)
CDA interview -Predictive validity:
moderate positive correlation with
Y3 clinical (r=.31 p<0.05) and Y4
clinical (r=.44 p<0.001) - corrected
for range restriction and
measurement error. Concurrent
validity: Matriculated participants
scored higher than applicant pool
(57.20 SD 5.94 vs. 51.73 SD 9.14)
Convergent /Divergent validity:
NS correlated with the DAT AA, RC
and PAT, but positively correlated
with two of the personality factors
of the NEO-PI-R: extraversion (r=
.27 p<0.01), and openness to
experience (r= .21 p<0.01)
Rich, A. M., K. M. S.
Ayers, et al. (2012) (39)
New Zealand
(University of
Otago, Faculty of
Dentistry)
2004-2009
admission cycle’s
matriculated
applicants admitted
in their second year
of dental school
Predictive validity: NS for
predicting top half of the class in
year 2 and 5, graduation with
credit or distinction, any subject
distinction, any subject prize or
remedial examination required
Concurrent validity: Weak

110
(n=411) Convergent/ divergent validity:
strong positive correlation with
pre-dental Science (r=0.936
p<0.05), and moderate positive
correlation with DAT Academic
Average, DAT Perceptual Ability,
and DAT Total science scores (r =
0.252 - 0.400 p<0.05).
3. Multiple Mini Interviews
Foley, J. I. and K. Hijazi
(2013) (33)
UK (University of
Aberdeen Dental
School and Hospital)
2008-2011
admission cycle’s
matriculated
applicants (n=75)
Construct validity: CAS scores
significantly positively correlated
to teamwork (r=0.097 p=0.024),
communication skills (r=0.151
p=0.035), work experience
(r=0.189 p=0.001), and manual
dexterity (r=0.126 p=0.003); NS for
commitment to Aberdeen, core
qualities and article review
Ethnic/racial: Non
minority students have
significantly higher CAS
scores than minority
students (3.38 vs. 3.20,
p= 0.02) Gender bias:
NS
McAndrew, R. and J. Ellis
(2012) (102)
UK (Cardiff
University)
2011 admission
cycle applicants
(n=190) and
interviewers (n=38)
Face validity (applicants) 64,8%
(n=114) considered them to be
better than conventional
interviews, 10,2% (n=18) worse,
and 25% (n=44) ambivalent. Main
critics: lack of control/flexibility,
anxiety and nervousness when
bad performance; impossible to
prepare for in advance; difficulty
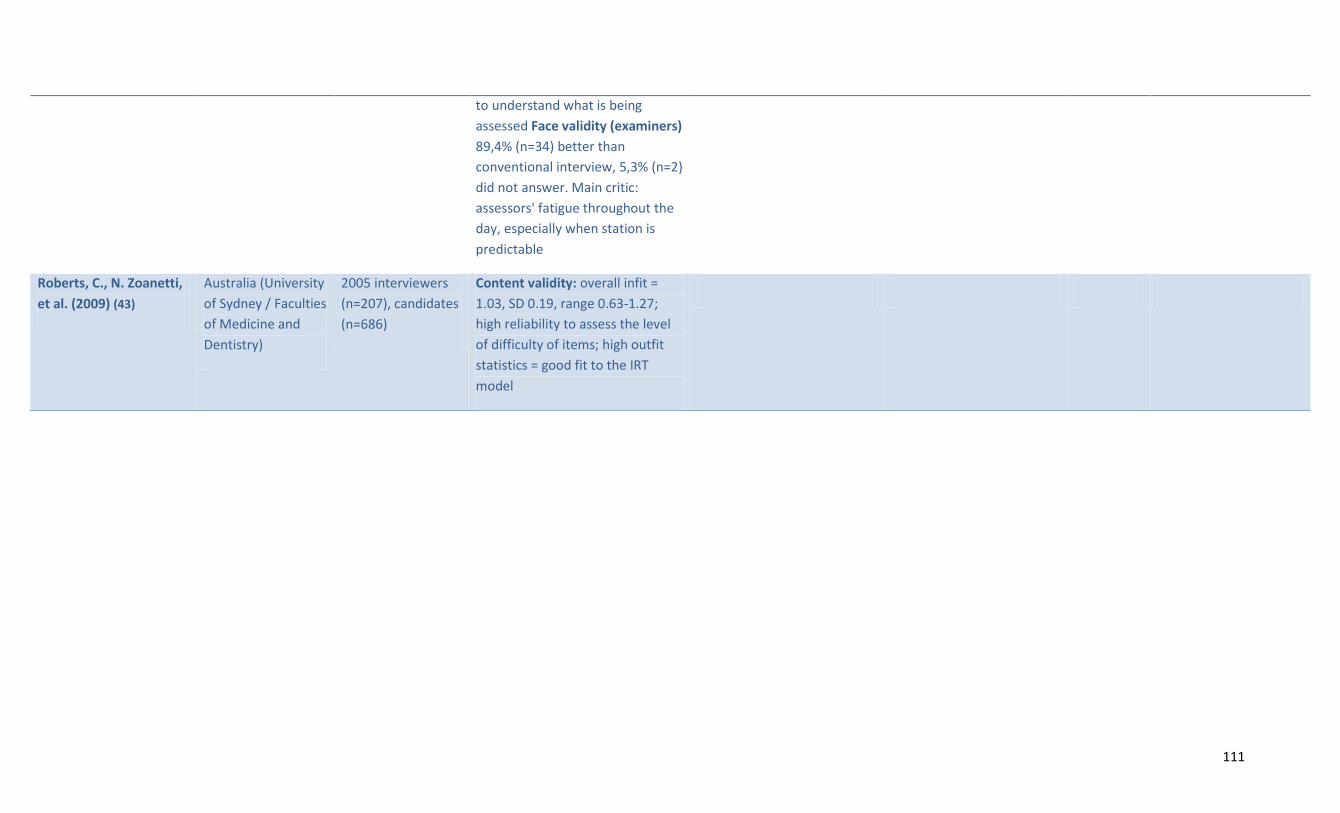
111
to understand what is being
assessed Face validity (examiners)
89,4% (n=34) better than
conventional interview, 5,3% (n=2)
did not answer. Main critic:
assessors' fatigue throughout the
day, especially when station is
predictable
Roberts, C., N. Zoanetti,
et al. (2009) (43)
Australia (University
of Sydney / Faculties
of Medicine and
Dentistry)
2005 interviewers
(n=207), candidates
(n=686)
Content validity: overall infit =
1.03, SD 0.19, range 0.63-1.27;
high reliability to assess the level
of difficulty of items; high outfit
statistics = good fit to the IRT
model
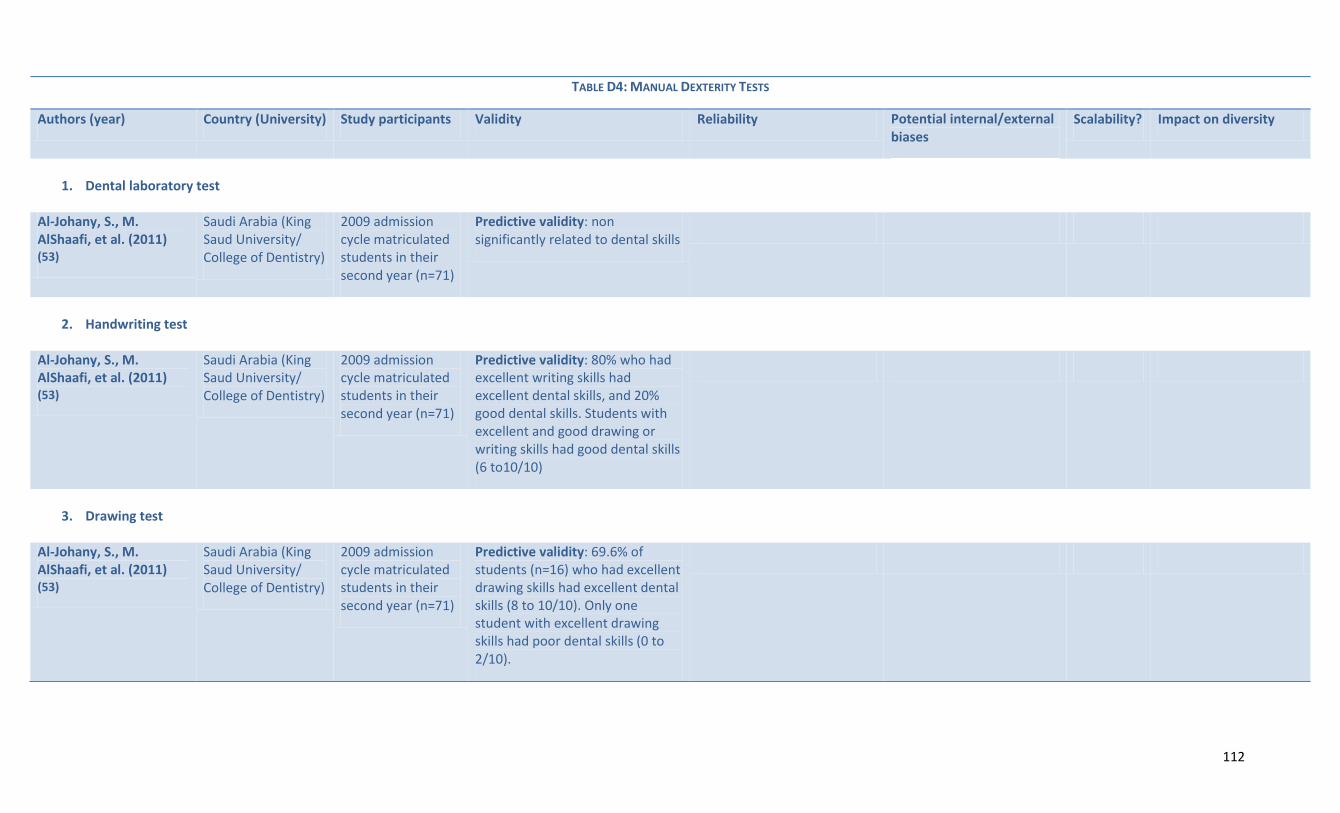
112
TABLE D4: MANUAL DEXTERITY TESTS
Authors (year) Country (University) Study participants Validity Reliability Potential internal/external biases
Scalability? Impact on diversity
1. Dental laboratory test
Al-Johany, S., M. AlShaafi, et al. (2011) (53)
Saudi Arabia (King Saud University/ College of Dentistry)
2009 admission cycle matriculated students in their second year (n=71)
Predictive validity: non significantly related to dental skills
2. Handwriting test
Al-Johany, S., M. AlShaafi, et al. (2011) (53)
Saudi Arabia (King Saud University/ College of Dentistry)
2009 admission cycle matriculated students in their second year (n=71)
Predictive validity: 80% who had excellent writing skills had excellent dental skills, and 20% good dental skills. Students with excellent and good drawing or writing skills had good dental skills (6 to10/10)
3. Drawing test
Al-Johany, S., M. AlShaafi, et al. (2011) (53)
Saudi Arabia (King Saud University/ College of Dentistry)
2009 admission cycle matriculated students in their second year (n=71)
Predictive validity: 69.6% of students (n=16) who had excellent drawing skills had excellent dental skills (8 to 10/10). Only one student with excellent drawing skills had poor dental skills (0 to 2/10).
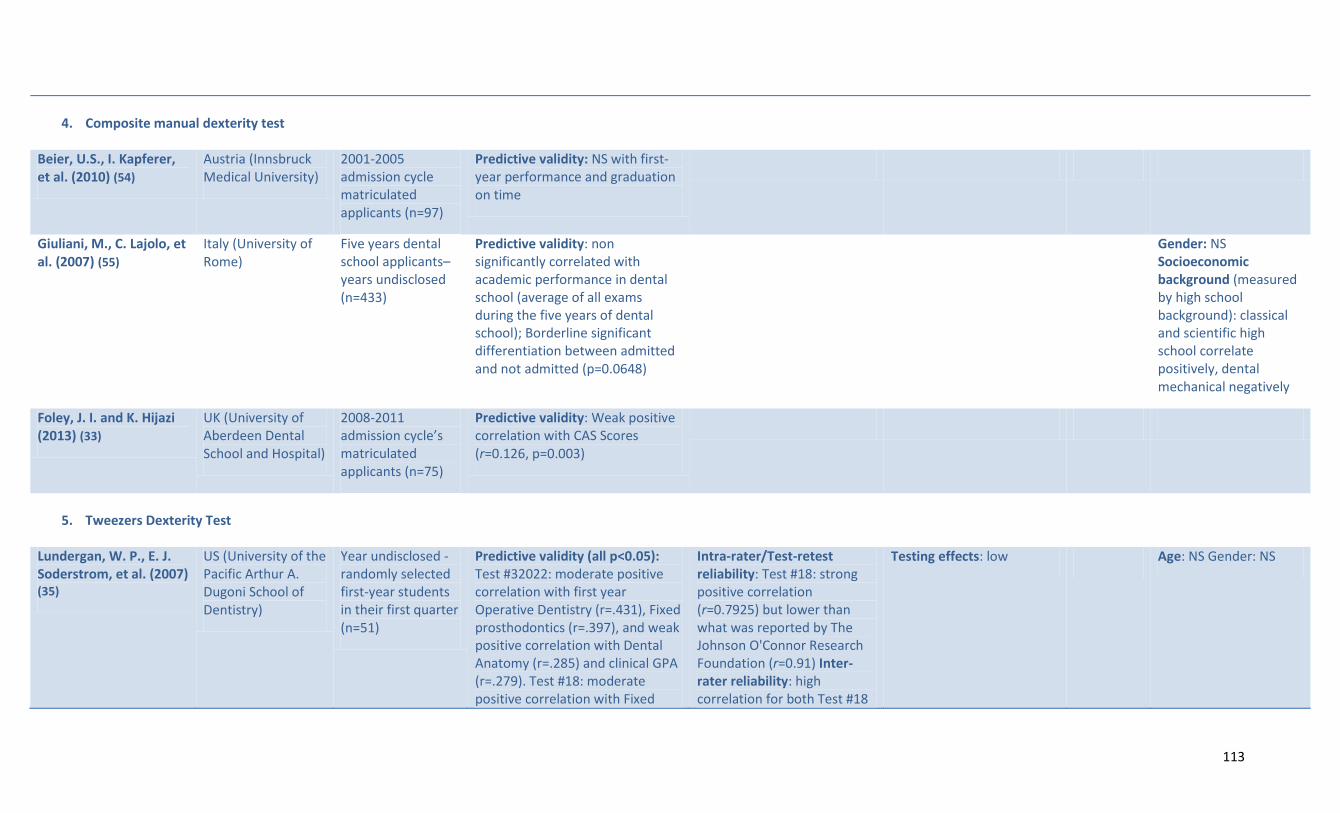
113
4. Composite manual dexterity test
Beier, U.S., I. Kapferer, et al. (2010) (54)
Austria (Innsbruck Medical University)
2001-2005 admission cycle matriculated applicants (n=97)
Predictive validity: NS with first-year performance and graduation on time
Giuliani, M., C. Lajolo, et al. (2007) (55)
Italy (University of Rome)
Five years dental school applicants– years undisclosed (n=433)
Predictive validity: non significantly correlated with academic performance in dental school (average of all exams during the five years of dental school); Borderline significant differentiation between admitted and not admitted (p=0.0648)
Gender: NS Socioeconomic background (measured by high school background): classical and scientific high school correlate positively, dental mechanical negatively
Foley, J. I. and K. Hijazi (2013) (33)
UK (University of Aberdeen Dental School and Hospital)
2008-2011 admission cycle’s matriculated applicants (n=75)
Predictive validity: Weak positive correlation with CAS Scores (r=0.126, p=0.003)
5. Tweezers Dexterity Test
Lundergan, W. P., E. J. Soderstrom, et al. (2007) (35)
US (University of the Pacific Arthur A. Dugoni School of Dentistry)
Year undisclosed - randomly selected first-year students in their first quarter (n=51)
Predictive validity (all p<0.05): Test #32022: moderate positive correlation with first year Operative Dentistry (r=.431), Fixed prosthodontics (r=.397), and weak positive correlation with Dental Anatomy (r=.285) and clinical GPA (r=.279). Test #18: moderate positive correlation with Fixed
Intra-rater/Test-retest reliability: Test #18: strong positive correlation (r=0.7925) but lower than what was reported by The Johnson O'Connor Research Foundation (r=0.91) Inter-rater reliability: high correlation for both Test #18
Testing effects: low Age: NS Gender: NS

114
Prosthodontics (r=.335), Endodontic (r=.329), and weak positive correlation with clinical GPA (r=.260) and graduation rank (r=.242). Adjusting for PAT: Test #32022 adds predictive value to: Operative Dentistry (r=.386) and fixed prosthodontics (r=.348). Test #18 adds predictive value to fixed prosthodontics (r=.339), endodontic (r=.326), and clinical GPA (r=.266). Convergent/ Divergent validity: Test #18 and #32022: moderate positive correlation (r=0.318, p<0.05). Test #32022: weak positive correlation with the DAT-PAT (r=0.245, p<0.05), but #18 is NS
and #32022 (r=0.9977 and 0.9999) -assessed on 11 of the 51 students
6. Haptics
Urbankova, A. and S. P. Engebretson (2011a) (44)
US (Stony Brook School of Dental Medicine)
2012 admission cycle’s matriculated first-year dental students (n=39)
Predictive validity: line exercise: NS; circle tests: two moderate positive correlation with Exam I scores (Time left and Accuracy left, respectively r =0.38, p< 0.10; and r=0.43, p< 0.05). Mirror test - all four were moderately correlated with Exam I (r2 = 0.30 – 0.33), Total score: all moderately correlated time left completed total, accuracy left completed total, and time and accuracy
High

115
completed total (r= 0.34 – 0.37, p<0.05) Convergent/Divergent validity: circle test -one moderate positive correlation with DAT-PAT scores (Time left completed (r2 = 0.34 p< 0.10), mirror test - one was weakly correlated with DAT-PAT scores (Accuracy left: r2 = 0.27, p< 0.01)
7. Computer-assisted dental simulation
Urbankova, A. and S. P. Engebretson (2011b) (52)
US (Stony Brook School of Dental Medicine)
2012 admission cycle’s matriculated first-year dental students (n=38)
Predictive validity: Students who passed the CDS had significantly higher mean Exam I scores (73.4 vs. 68.3, two sided Students p< 0.0001) and mean Exam II scores (but NS). Students who passed CDS test were 30.9 times more likely to pass Exam I (two-sided Fisher's exact p=0.0002). Exam I; 72% sensitivity and 92% specificity (positive predictive value 95%, negative 63%). Exam II: 1.7 times more likely, but NS (p=0.35)
Inter-rater reliability: Correlation coefficients between the two raters btw .69 and .90
Potential internal bias due to the possibility of different level of motivation between students chosen to participate and those not chosen
Low
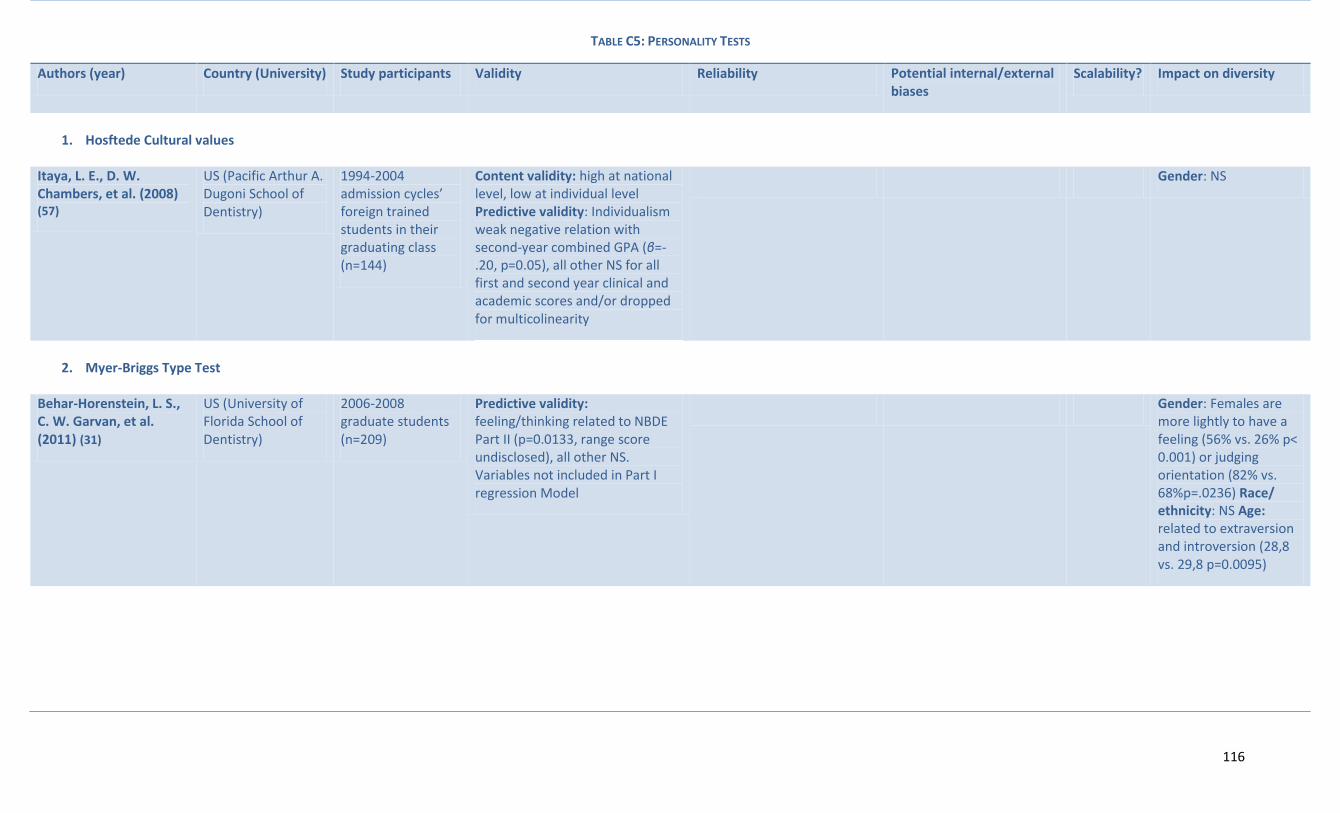
116
TABLE C5: PERSONALITY TESTS
Authors (year) Country (University) Study participants Validity Reliability Potential internal/external biases
Scalability? Impact on diversity
1. Hosftede Cultural values
Itaya, L. E., D. W. Chambers, et al. (2008) (57)
US (Pacific Arthur A. Dugoni School of Dentistry)
1994-2004 admission cycles’ foreign trained students in their graduating class (n=144)
Content validity: high at national level, low at individual level Predictive validity: Individualism weak negative relation with second-year combined GPA (β=-.20, p=0.05), all other NS for all first and second year clinical and academic scores and/or dropped for multicolinearity
Gender: NS
2. Myer-Briggs Type Test
Behar-Horenstein, L. S., C. W. Garvan, et al. (2011) (31)
US (University of Florida School of Dentistry)
2006-2008 graduate students (n=209)
Predictive validity: feeling/thinking related to NBDE Part II (p=0.0133, range score undisclosed), all other NS. Variables not included in Part I regression Model
Gender: Females are more lightly to have a feeling (56% vs. 26% p< 0.001) or judging orientation (82% vs. 68%p=.0236) Race/ ethnicity: NS Age: related to extraversion and introversion (28,8 vs. 29,8 p=0.0095)
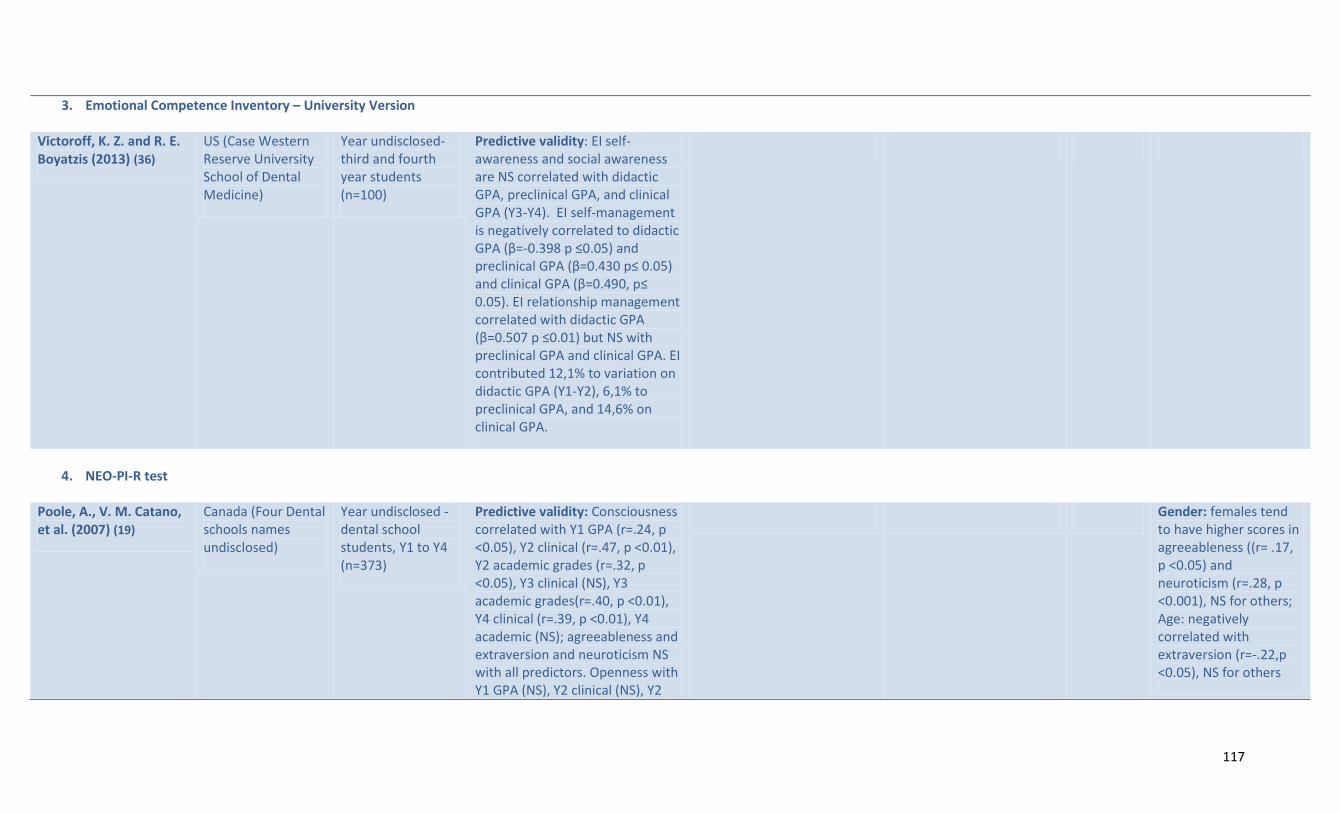
117
3. Emotional Competence Inventory – University Version
Victoroff, K. Z. and R. E. Boyatzis (2013) (36)
US (Case Western Reserve University School of Dental Medicine)
Year undisclosed- third and fourth year students (n=100)
Predictive validity: EI self-awareness and social awareness are NS correlated with didactic GPA, preclinical GPA, and clinical GPA (Y3-Y4). EI self-management is negatively correlated to didactic GPA (β=-0.398 p ≤0.05) and preclinical GPA (β=0.430 p≤ 0.05) and clinical GPA (β=0.490, p≤ 0.05). EI relationship management correlated with didactic GPA (β=0.507 p ≤0.01) but NS with preclinical GPA and clinical GPA. EI contributed 12,1% to variation on didactic GPA (Y1-Y2), 6,1% to preclinical GPA, and 14,6% on clinical GPA.
4. NEO-PI-R test
Poole, A., V. M. Catano, et al. (2007) (19)
Canada (Four Dental schools names undisclosed)
Year undisclosed - dental school students, Y1 to Y4 (n=373)
Predictive validity: Consciousness correlated with Y1 GPA (r=.24, p <0.05), Y2 clinical (r=.47, p <0.01), Y2 academic grades (r=.32, p <0.05), Y3 clinical (NS), Y3 academic grades(r=.40, p <0.01), Y4 clinical (r=.39, p <0.01), Y4 academic (NS); agreeableness and extraversion and neuroticism NS with all predictors. Openness with Y1 GPA (NS), Y2 clinical (NS), Y2
Gender: females tend to have higher scores in agreeableness ((r= .17, p <0.05) and neuroticism (r=.28, p <0.001), NS for others; Age: negatively correlated with extraversion (r=-.22,p <0.05), NS for others

118
academic (NS), Y3 clinical (NS), Y3 academic (r=.24, p <0.05), Y4 clinical (NS), Y4 academic (NS). Concurrent validity: Applicant pool have higher personality scores for neuroticism (78,45 SD 22.87 vs. 60.01 SD 18.49), but lower scores for extraversion (126.11 SD 17.03, vs. 133.25 SD 17.24), openness to experience (121,20 SD 17.44 vs. 127.15 SD 16.85), agreeableness (127.87 SD 19.18 vs. 137.88 SD 16.88) and conscientiousness (130.66 SD 19.37 vs. 147.22 SD 18.24) Convergent/ Divergent validity: neuroticism- NS with interview and DAT; extraversion correlated with Interview (r=- .26, p <0.01), DAT perceptual ability test (r=-.15, p <0.05), openness to experience - with interview (r=.19, p <0.01), DAT Academic Average (r=.15, p <0.05), agreeableness and conscientiousness NS with all. Correlations BTW personality factors: neuroticism correlated with extraversion (r=-.22, p <0.05), agreeableness (-.29, p <0.01) NS with others; extraversion correlated with neuroticism (-.25, p <0.01), openness to experience (.35, p <0.01), consciousness (.16, p <0.05) NS for others. Openness

119
to experience: extraversion (.40, p <0.01), and agreeableness (.19, p <0.05), NS with others. Agreeableness is correlated with neuroticism (-.34, p <0.05), extraversion (.18, p <0.05), openness to experience (.29, p <0.01) and conscientiousness (.32, p <0.01). Conscientiousness correlated with neuroticism (-.41, p <0.01), extraversion (.26, p <0.01), openness to experience (.20, p <0.01) and agreeableness (.41, p <0.01)

120
TABLE D6: SITUATIONAL JUDGMENT TEST
Authors (year) Country (University) Study participants Validity Reliability Potential internal/external biases
Scalability? Impact on diversity
Buyse, T. and F. Lievens (2011) (32)
Belgium (two Flemish school -names undisclosed)
1997-2009 admission cycle matriculated applicants (Y1 n=781, Y2 n=489, Y3 411, Y4 n=343, Y5 n=274)
Content validity: high - vignettes tested for realism by two professors Predictive validity: Non correlated with GPA (Y1-4 and overall GPA); Incremental value only for fifth year (B=.16, R2 = 0.03 p <0.01) Convergent/Divergent validity: non significantly correlated with cognitive portion of admission test and silent reading protocol

121