adoption of some cocoa production technologies by …€¦ · · 2017-07-13adoption of some cocoa...
TRANSCRIPT
www.ccsenet.org/sar Sustainable Agriculture Research Vol. 1, No. 1; February 2012
Published by Canadian Center of Science and Education 103
Adoption of Some Cocoa Production Technologies by Cocoa Farmers in Ghana
F. Aneani (Corresponding author), V. M. Anchirinah, F. Owusu-Ansah & M. Asamoah
Social Science & Statistics Unit, Cocoa Research Institute of Ghana
PO Box 8, New Tafo-Akim, Ghana
Tel: 233-024-476-3516 E-mail: [email protected]
Received: October 17, 2011 Accepted: January 6, 2012 Published: February 1, 2012
doi:10.5539/sar.v1n1p103 URL: http://dx.doi.org/10.5539/sar.v1n1p103
Abstract
Adoption of the cocoa (Theobroma cacao) production technologies recommended to cocoa farmers by Cocoa Research Institute of Ghana (CRIG) had been low, leading to yield and production levels below potential. To investigate this issue, a formal socio-economic sample survey of 300 cocoa farmers selected randomly, by a multi-stage sampling technique, from all the cocoa growing regions of Ghana was conducted with a structured questionnaire for the individual interviews. The adoption rates of CRIG-recommended technologies such as control of capsids with insecticides, control of black pod disease with fungicides, weed control manually or with herbicides, planting hybrid cocoa varieties and fertilizer application were 10.3%, 7.5%, 3.7%, 44.0% and 33.0%, respectively. Adoption models indicated that credit, number of cocoa farms owned by the farmer, gender, age of the cocoa farm, migration, cocoa farm size, and cocoa yield affected the adoption decisions of cocoa farmers concerning the CRIG-recommended technologies analyzed in this study.
Keywords: Cocoa, Survey, Technology, Adoption, Ghana
1. Introduction
Cocoa technology could be defined as the total stock of knowledge including traditional skills necessary for cocoa production, processing and marketing (Laryea, 1981). The Cocoa Research Institute of Ghana (CRIG) was established to investigate into problems militating against cocoa production in Ghana. As such, research of the institute has been tailored to the development of technologies such as improved farm practices that address constraints to cocoa production such as pests, diseases and other poor agronomic practices. The technologies were previously handed over to the then Extension Division of Ghana Cocoa Board (COCOBOD), Cocoa Services, currently known as Cocoa Swollen Shoot Virus Control Unit (CSSVDCU) to disseminate to cocoa farmers to enhance productivity and production. Despite the dissemination of the CRIG-recommended technologies to farmers, the adoption levels of these technologies over the years by the cocoa farmers have been low (Henderson and Jones, 1990; Donkor, et al., 1991; MASDAR, 1998). The reasons given by farmers for their low adoption of the technologies involve lack of resources such as money and labour to apply the technologies, and technical difficulties (MASDAR, 1998). The government then intervened with national programmes such as the Cocoa Diseases and Pests Control Programme (CODAPEC or mass spraying of cocoa farms) and the Cocoa High Technology Programme (Hi-tech) which provides free inputs and labour for the control of capsids and black pod (CODAPEC), and insecticides, fungicides and fertilizer (Hi-tech) to cocoa farmers on credit. This is because the spraying frequency of the CODAPEC programme is inadequate and farmers are expected to do additional sprayings.
CRIG has established that due to the additive and interactive nature of the recommended technologies, the full package must be adopted for the total impact to be realized (Asante, 1992). However, the main practice of cocoa farmers in Ghana tends to be a ‘stepwise’ mode of adoption of the innovations (World Bank/FAO, 1986). The high cost of some of the component technologies and the apparent non-adoption of these high-cost technologies suggest that farmers, who are risk-averse, may be reacting directly to the possible negative effects on their already low income (Asante, 1992).
To support the dissemination of recommended packages, a cocoa farmers’ newspaper project was initiated under a collaborative effort of Cocoa Research Institute of Ghana (CRIG) and Cadbury International Limited. It was
www.ccsenet.org/sar Sustainable Agriculture Research Vol. 1, No. 1; February 2012
ISSN 1927-050X E-ISSN 1927-0518 104
aimed at disseminating CRIG-recommended technologies to cocoa farmers for adoption to increase cocoa output. As part of the newspaper project, a baseline socio-economic survey was conducted on cocoa production practices of the farmers. Also, this survey was aimed at generating insights that would contribute to improving the reliability of technology development and transfer, as well as designing agricultural policies conducive to widespread adoption of CRIG-recommended technologies. The main purpose of this study was to determine generally the adoption levels, and the socio-economic factors of adoption of the cocoa production technologies by cocoa farmers in Ghana. Consequently, the research questions one would want to ask are: what is the nature of adoption of these technologies by the cocoa farmers? What are the current determinants/constraints to their adoption?
2. Methodology
2.1 Study Areas
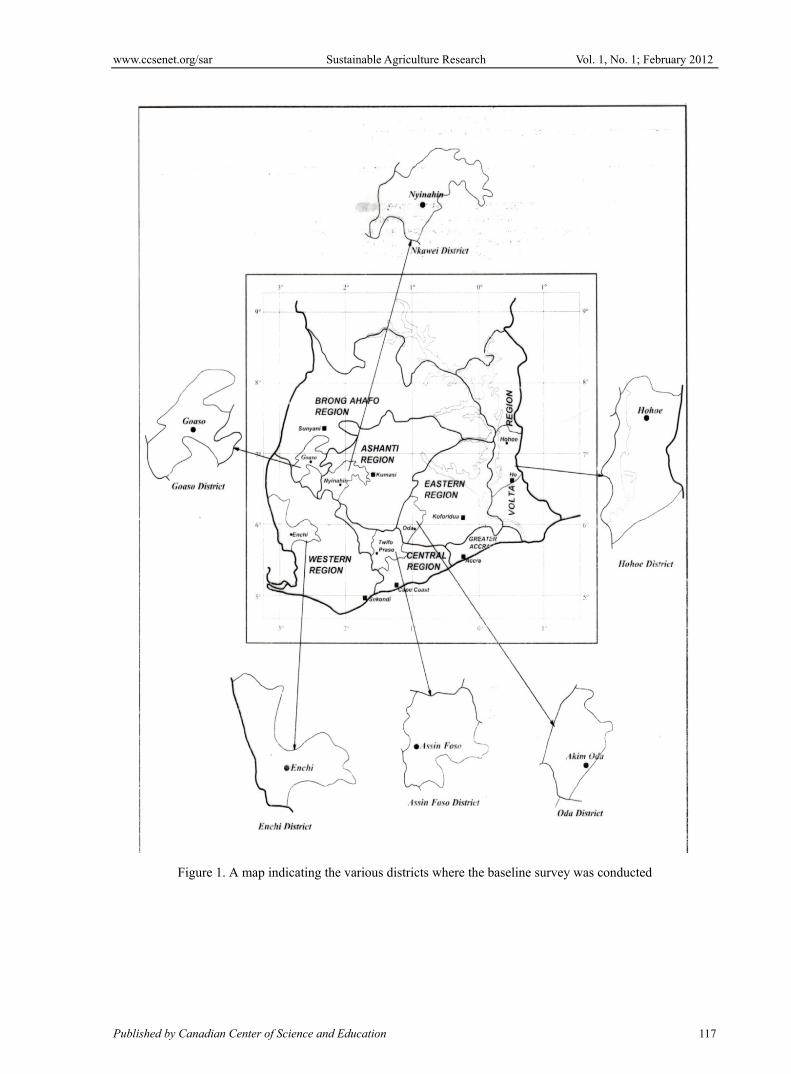
The study was conducted in six (6) cocoa growing districts: Nkawie (Atwima Mponua). Goaso (Asunafo North), Enchi (Aowin/Suaman), Oda (Birim South), Twifo Praso/Assin Fosu and Hohoe (Fig. 1). The land areas ranged from 894.2 km2 to 2 638 km2. The average rainfall in the selected districts ranged from 1 077 mm to 1 784 mm and the mean temperature ranged from a minimum of 22 oC to a maximum of 34 oC. Altitude ranged from 61m to 890 m above sea level. The vegetation was moist semi-deciduous rain forest and savanna. The main socio-economic activities in the districts were farming, trading, logging, small-scale mining and quarrying. Key crops grown in the districts are cocoa (Theobroma cacao), citrus (Citrus spp.), oil palm (Elaeis guineensis) and food crops such as maize (Zea mays), cassava (Manihot esculenta), rice (Oryza sativa), yam (Dioscorea spp.) and plantain (Musa spp.).
2.2 Sampling and Data Collection
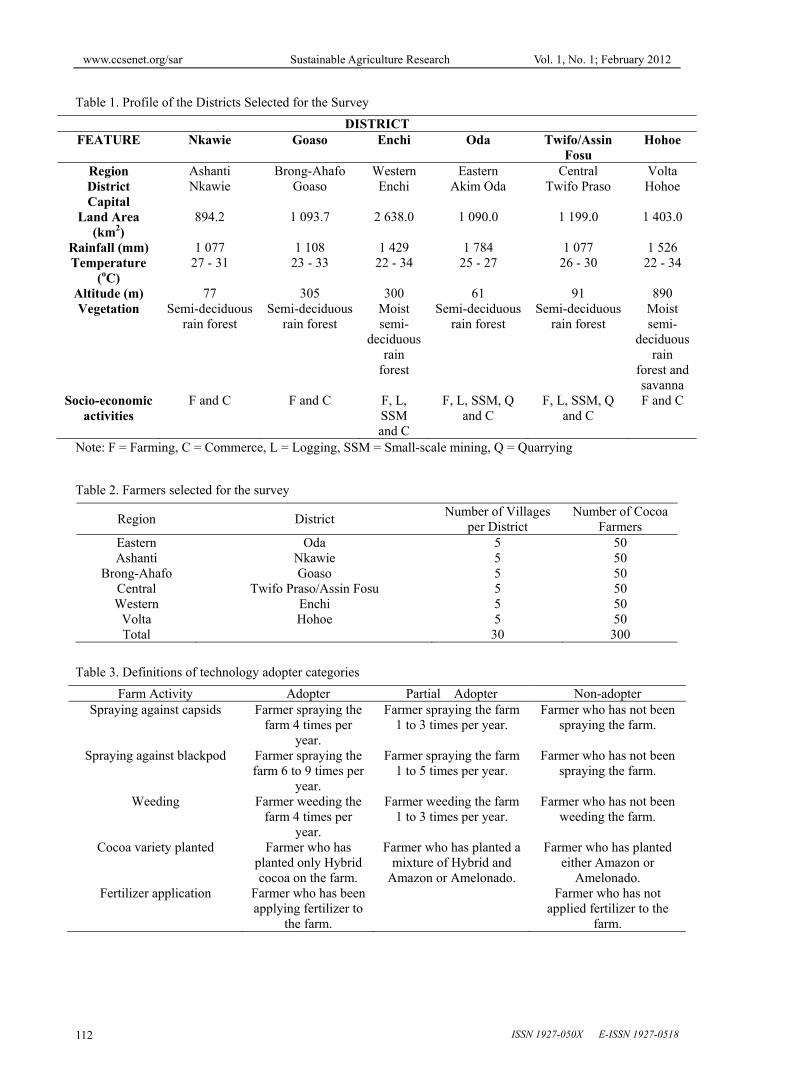
The study was conducted from March to May, 2006. A sample of 300 cocoa farmers was randomly selected using the multi-stage sampling approach (Barnett, 1974; Boyd et al., 2004) for individual personal interview. This sample size was determined by using the standard deviation of 16.3 years obtained from the age variable of a previous survey to achieve a precision of 0.94 (standard error of the mean) for the current study. A list of names of farmers of the Produce Buying Company Ltd (PBC) served as the sampling frame from which a sample of farmers was selected. The list of PBC farmers was considered since the company is widely represented in the cocoa farming communities. The cocoa farmers were selected from households in the 30 farming communities in some cocoa districts. This sample size was chosen due to cost consideration and to ensure a broad coverage of a representative sample of farmers. A four-stage sampling technique was used leading to the selection of a final sample of 300 farmers. All the 6 cocoa growing regions were considered in the first stage sampling in the study to ensure generalization of the conclusions over cocoa farmers in the country. In the second, third, and fourth stages, one district from each of the six regions, and a total of 30 farming communities as well as 300 farmers were respectively selected randomly using simple random sampling technique and the sampling result is presented in Table 1.
This survey involved individual interviews with selected farmers using a structured questionnaire which covered issues such as personal information, farm management practices, farm income, credit, technology adoption, constraints to cocoa production and extension. The questionnaire was pre-tested with a group of farmers to correct fundamental problems in the survey design such as difficulties in question wording, problems with leading questions and bias due to question order. Enumerators and supervisors were selected and trained in how to administer the questionnaires efficiently. The survey focused more on farmers’ experience with agronomic practices (technologies), asking them of their technological choices and how they affect their cocoa production. The response rate was 100%.
2.3 Analytical Framework
Descriptive and inferential analyses of the survey data were done. The analysis was aimed at establishing the adoption rate of CRIG-recommended technologies to the farmers. This rate was measured as the proportion of farmers interviewed who had used recommended technologies. Using econometric techniques, the data were analyzed to establish whether the adoption of agronomic practices by the cocoa farmers was affected by socio-economic factors.
2.3.1 Empirical Models
Multinomial Logistic Regression Analysis of the Factors of Adoption of Cocoa Production Technologies: The multinomial logistic regression model (Hosmer & Lemeshow, 1989; Chan, 2005) was used to investigate the factors that affect the adoption behaviour of cocoa farmers relating to CRIG-recommended cocoa production
www.ccsenet.org/sar Sustainable Agriculture Research Vol. 1, No. 1; February 2012
Published by Canadian Center of Science and Education 105
technologies. This model was chosen because it handles the case of a dependent variable with more than two categories (Salasya, Mwangi, Mwanbu & Diallo, 2007; Adekunle & Henson, 2007) as compared to the probit model which deals with only dependent variables with two categories (Chirwa, 2005; Jatoe, et al., 2005). The definitions of technology adopter categories are presented in Table 3. The model involves a dependent variable, the technology adoption decision variable (Y) and a set of explanatory/independent variables that might influence the final probability, Pi, of adoption of the technologies. These explanatory variables can be thought of as being in a k vector Xi and the model then takes the form
Pi = E [(Yi/ni) \ Xi]
The logits of the unknown binomial probabilities (that is, the logarithms of the odds) are modeled as a linear function of the Xi.
Logit (Pi) = In [(Pi/1-Pi)] = βo + β1X1i +… +βkXki
The unknown parameters βj (j = 1, 2, 3…k) are usually estimated by Maximum Likelihood method. Five categorical dependent variables representing the individual technologies considered in the study were weeding of cocoa farm (3 categories), spraying against blackpod disease (3 categories), spraying against capsids (3 categories), applying fertilizer to the farm or not (2 categories), and the type of cocoa variety planted (3 categories).
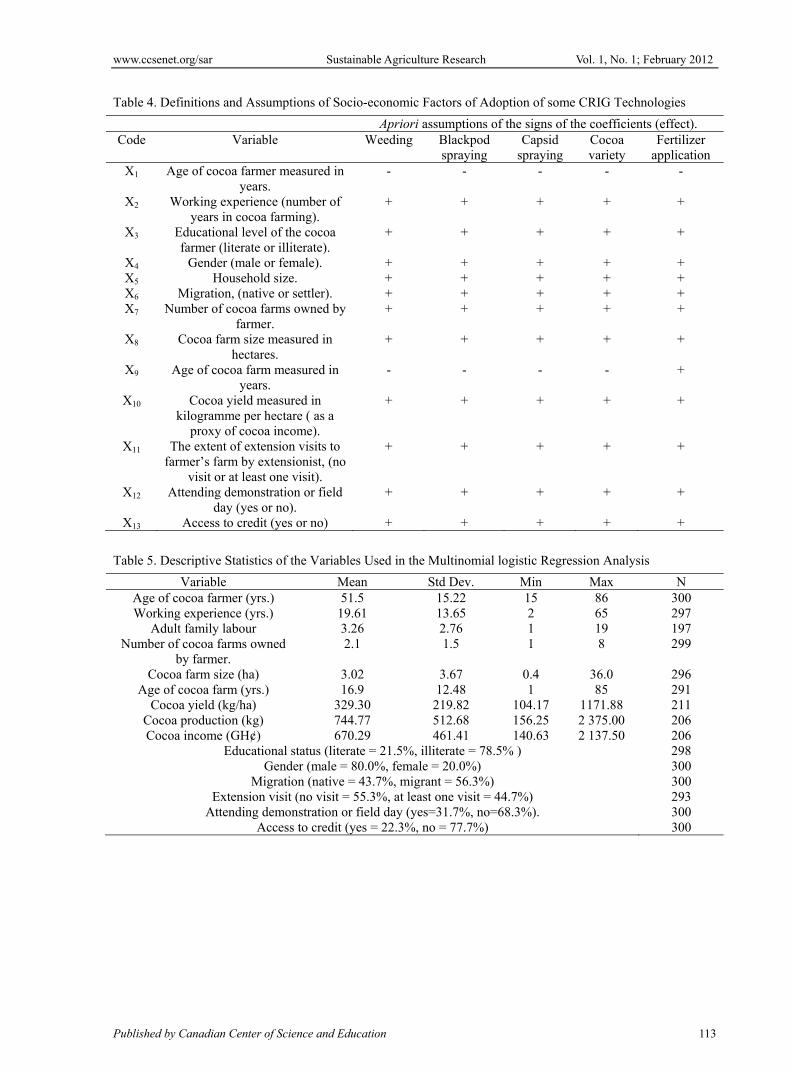
Studies (Feder & Slade, 1984; Rahm & Huffman, 1984; Feder, Just & Zilberman, 1985; Strauss et al., 1991; Morris, Tripp & Dankyi, 1998; Kosarek, Garcia & Morris 2001; Doss, 2003; Jatoe, et al., 2005; Mazuze, 2007) have indicated that the key determinants or factors of adoption of agricultural technologies include: Farmer’s educational level; time of residence in the area or community; availability and quality of extension and research; farmer’s experience; farm size, soil characteristics, and cropping systems; profitability of the new technology; off-farm income; adequate provision of inputs; availability of timely credit; performance of the technology ( increase productivity); transportation; functional marketing channels; and social capital (farmer associations, etc.). Although limited by the data collected, it is believed that the socio-economic factors (that is, explanatory/independent variables) which might influence the probability of adoption of CRIG technologies are those presented in Table 4. Specifically, the following empirical model is specified:
A = β0 + β1X1 + β2X2 + β3X3 + β4X4 + β5X5 + β6X6 + β7X7 + β8X8 + β9X9 + β10X10 + β11X11+ β12X12 + β13X13+ e
Where
A = the categorical dependent variable of adoption decision of the cocoa farmers;
Xi = the ith independent variable ( i = 1, 2, 3, …,13);
βi = the parameters to be estimated;
and e = error term.
Age of cocoa farmer is predicted to have a negative impact on adoption because as the age increases, his physical strength tends to reduce and this is assumed to impact negatively on adoption of the technologies. Farmers with more experience in cocoa cultivation would be able to apply their cropping experience in the cultivation of cocoa and this would increase their ability to adopt the cocoa technologies. Educational status is assumed to influence cocoa production technologies positively because with higher level of education the farmer would be in a position to technically and economically assess the new crop or technology to clear doubts and uncertainties associated with it and enhance its adoption. Since cocoa farming is dominated by male farmers, it is expected that more male cocoa farmers would adopt technologies than their female counterparts, other things being equal. This is because women have less access to credit and land as collateral than men, as well as relying mostly on hired labour which is scarce due to migration of the rural youth to the urban areas to seek for jobs with relatively better remuneration (MASDAR, 1998). It is assumed that the more adult household members a farmer possesses, the more household labour would be available to him for farm activities in the adoption of cocoa technologies. With migration, it is expected that migrant farmers are likely to introduce the use of new technologies into the farming community and promote their adoption by the natives of the area. The number of cocoa farms owned by the farmer is assumed to have a positive impact on the adoption of cocoa technologies. A farmer having many cocoa farms could harvest more cocoa which may translate into higher income for the purchase of the relevant inputs to implement the technologies. Cocoa farm size is expected to have a positive effect on adoption since as the farmer devotes more of his total available land to cocoa cultivation, there is the likelihood that cocoa output and income would increase, enhancing the probability of technology adoption. With aging farm, there is the likelihood that the yield and income from cocoa would decline. This can discourage the
www.ccsenet.org/sar Sustainable Agriculture Research Vol. 1, No. 1; February 2012
ISSN 1927-050X E-ISSN 1927-0518 106
farmer from weeding and spraying the farm. However, he may apply fertilizer to increase output. It is predicted that increase in cocoa yield would have a positive impact on technology adoption because the resultant increased cocoa income can enhance the ability of the farmer to purchase the necessary inputs for the implementation of the technology. Frequent visits to the farmer by the extension agent would provide the farmer with necessary information about the availability of needed resources, market and prices as well as the profitability status of the new technology to clear any doubts and uncertainties concerning it to increase the probability of its adoption. It is predicted that attending demonstration of the technology or field day may convince the farmer to adopt the technology. Access to credit in the form of cash is predicted to have a positive influence on technology adoption since the farmer receiving credit would have the capability to purchase the necessary resources for the cultivation of cocoa.
3. Results
3.1 Profile of sample cocoa farmers
A summary of the general characteristics of cocoa farmers is presented in Table 5. The mean age of the farmers was 51.5 years. The mean working experience was 19.6 years. The average number of adults working on the farm was 3.3 people. The educational status of the farmers was low as the majority (52.0 %) had middle school education and 21.5% of them were illiterates. Considering gender, 80.0 % of the interviewed farmers were males while 20.0 % were females. The mean farm size was 3.0 ha, implying that cocoa cultivation is dominated by small-scale farmers who on average had cocoa yield of 317 kg/ha. The cocoa output variable with mean value of 797.4 kg had a bigger standard deviation or variance, which might be due to the differences in farm management practices of the cocoa farmers and varying rainfall amounts and its distribution patterns experienced over the years. The mean income from cocoa was GH¢ 717.68 with a high standard deviation of GH¢820.87, which was due to the high variation in cocoa output. Cocoa farmers also cultivated food crops (plantain, cassava, maize, cocoyam, yam, rice, banana, pineapple, okro and ginger) and other tree crops (coffee, oil palm, citrus and coconut) with respective average farm sizes of about 1 ha and 2 ha. Cocoa farmers also reared some poultry and livestock such as fowls, pigs, sheep and goats for home consumption and sale. However, the data from the survey did not allow for the estimation of income from the other crops and livestock of the farmers.
3.2 Adoption rates of cocoa production technologies
The adoption rates of the CRIG-recommended technologies such as control of capsids with insecticides, control of black pod disease with fungicides, weed control manually or with herbicides, planting hybrid cocoa varieties and fertilizer application were 10.3%, 7.5%, 3.7%, 44.0% and 33.0%, respectively.
3.3 Multinomial Logistic Regression Analysis of the Factors of Adoption of Cocoa Production Technologies.
3.3.1 Fertilizer Application Model
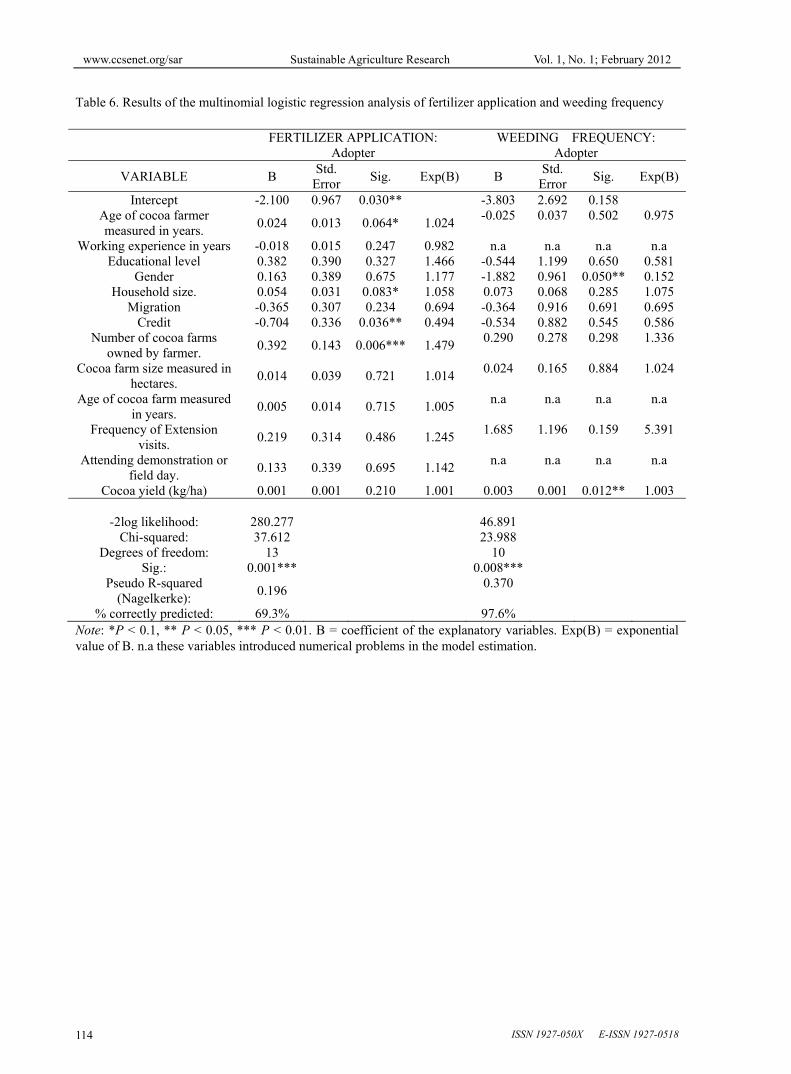
The summary of the descriptive statistics of the socio-economic factors to adoption of some CRIG technologies is presented in Table 5. The results of the multinomial logistic regression analysis of fertilizer application and weeding frequency are presented in Table 6. For the fertilizer adoption model, the adopter of the technology is modeled relative to the non-adopter with respect to the adoption factors. The -2log likelihood estimate of 280.277 with a statistically significant chi-square of 37.612 (P = 0.001) indicated that the independent variables jointly determined the adoption decision of the cocoa farmers. The pseudo R-squared was estimated to be 0.196, implying that about 19.6 per cent of the variation in the dichotomous dependent variable (fertilizer application) was explained jointly by the predictors. The results further demonstrated that 69.3 per cent of the cases were correctly predicted by the model.
The intercept of the model was significant (P < 0.1). The fertilizer model indicated that the significant determinants include credit (P < 0.1) and number of cocoa farms (P < 0.05). Credit appeared less likely to affect the decision to apply fertilizer to the cocoa farm or not by the farmer. Getting credit tended to decrease the log of the odds ratio by 0.704 and decrease the odds ratio by a factor of 0.494 for a farmer applying fertilizer compared to one not applying. However, the number of cocoa farms owned by the farmer was more likely to influence fertilizer adoption. As the number of farms increased by one, the log of the odds ratio increased by 0.392 which led to an increase in the odds ratio by 1.479 times.
3.3.2 Weeding Frequency Model
In the case of weeding frequency, the adopters were compared to the partial adopters since the cocoa farmers at least weeded their farms once (Table 6). The overall model was found significant by diagnostic test, indicating a -2log likelihood estimate of 46.891 and significant chi-square of 23.988 (P = 0.008). The pseudo R-squared of
www.ccsenet.org/sar Sustainable Agriculture Research Vol. 1, No. 1; February 2012
Published by Canadian Center of Science and Education 107
0.370, meaning 37.0 per cent of the variation in the weeding frequency was jointly explained by the independent variables included in the model. In addition, the model correctly predicted 97.6 per cent of the cases.
Gender of the cocoa farmer was statistically significant (P < 0.1) while cocoa yield variable emerged significant (P < 0.05). Being a male cocoa farmer compared to female was less likely to influence the decision of the farmer to weed his farm four times a year (adopter of CRIG recommendation). Being a male farmer reduced the log of the odds ratio of adopter relative to partial adopter by 1.882 and decreased the odds by a multiplicative factor of 0.152. For 1 kg/ha increase in yield, the odds in favour of the adopter was increased by a factor of 1.003. The positive sign of the yield coefficient was as expected because the increase in yield leads to an increase in cocoa income which allows the farmer to hire labour for weed control.
3.3.3 Cocoa Variety Planted
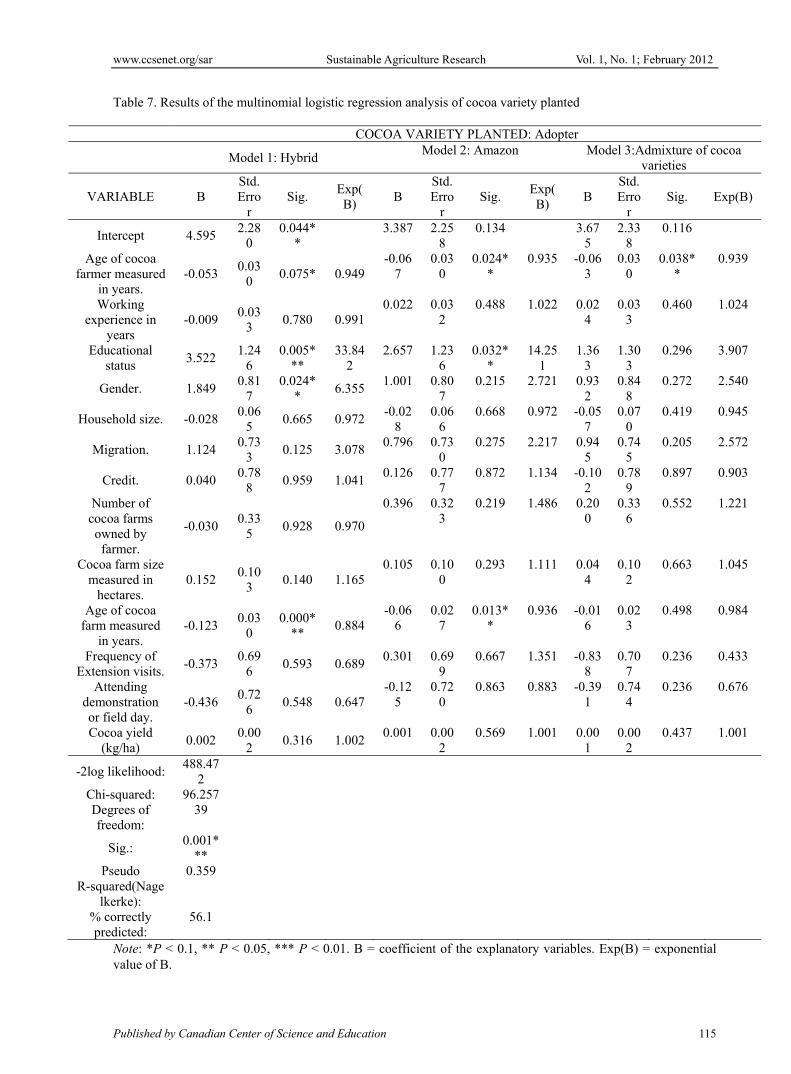
Of the cocoa seed planted by the cocoa farmers, the improved varieties (Hybrids, Amazon, and combination of the varieties) were modeled relative to the old and traditional Amelonado variety (Table 7). The diagnostic test of the three models indicated that the -2log likelihood estimate of 488.472 and a chi-square of 96.257 was statistically significant (P = 0.001). The pseudo R-squared was estimated to be 0.359, meaning that 35.9 per cent of the differences in improved variety planted were jointly explained by the independent variables. In addition, the analysis indicated that 56.1 per cent of the cases were correctly predicted.
3.3.3.1 Hybrid Model
The intercept, gender, educational status, and age of cocoa farm were statistically significant with P < 0.1, P < 0.05, P < 0.01, P < 0.01, respectively. The gender of the farmer emerged more likely to influence the adoption decision of the farmer to plant hybrid relative to amelonado cocoa on his/her farm. Being a male farmer increased the log of the odds ratio by 1.849 for a farmer planting hybrid and not amelonado. This result indicated that the odds ratio was increased by a factor of 6.36. Educational status of the farmer was more likely to affect the farmer’s preference to plant hybrid relative to amelonado. The higher the educational level, controlling for other factors, resulted in log of the odds ratio of 3.522 for the preference of hybrid to amelonado, meaning that the odds ratio increased by 33.842 times. The result also demonstrated that the older the farmer the less likely to observe hybrid compared to amelonado on his/her farm. As age of the farmer increased by one year, the log of the odds ratio decreased by 0.123, which shows that the odds ratio decreased by 0.884 times.
3.3.3.2 Amazon Model
Age and educational status of the cocoa farmer were statistically significant at P < 0.05 and P < 0.1, respectively. The age of the farmer was less likely to affect the adoption decision of planting Amazon relative to Amelonado cocoa on his/her farm. As the cocoa farmer got older by one year, the odds of planting Amazon compared to Amelonado decreased by a factor of 0.935. However, the educational status of the farmer was more likely to influence his/her preference for planting Amazon relative to Amelonado. Being an educated farmer increased the odds of planting Amazon relative to Amelonado by 14.251 times.
3.3.3.3 Admixture Model
In this model only farmer age emerged statistically significant (P < 0.1). This means that age affected the likelihood of the farmer planting admixture of cocoa varieties. As the farmer got older by one year, the odds of planting admixture of varieties compared to Amelonado decreased by a factor of 0.939, controlling for the other adoption variables.
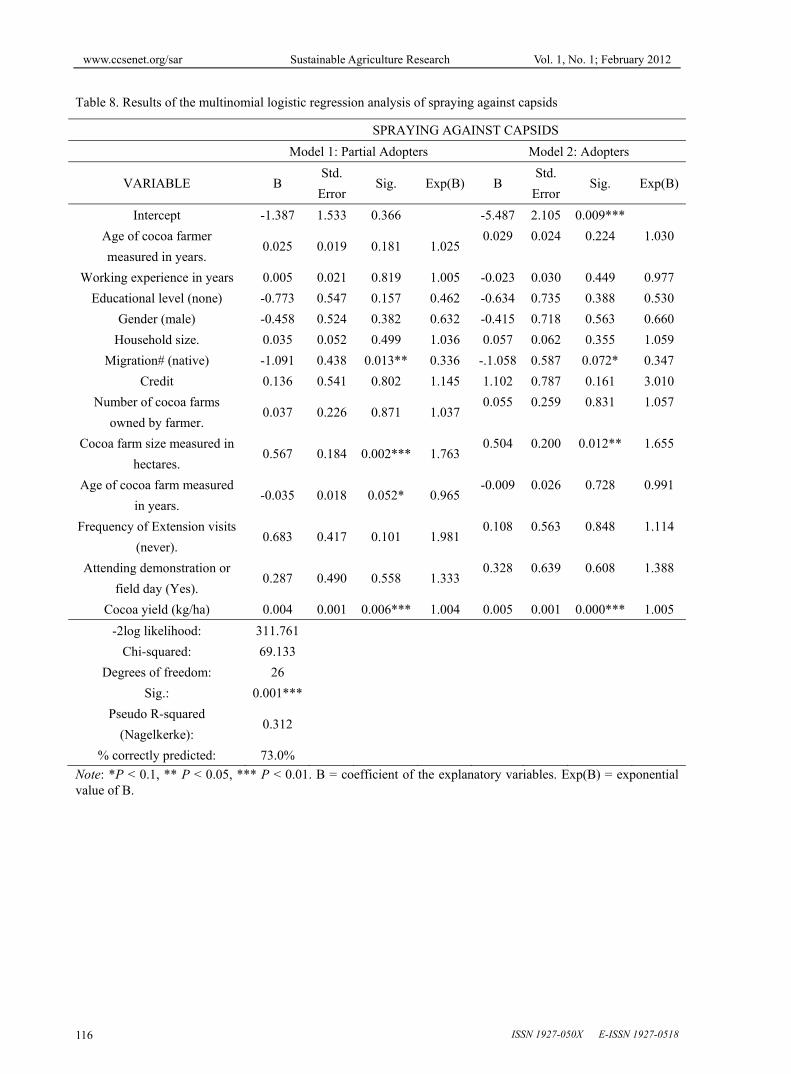
3.3.4 Capsid Sparying Frequency Model
The adoption decision of spraying frequency against capsids was modeled to reflect farmer categories of adopter, partial adopter, and non-adopter, which was the reference category (Table 8). The overall model was statistically significant as indicated by the -2log likelihood estimate of 311.761, a significant chi-square of 69.133 (P = 0.001). The pseudo R-squared was estimated to be 0.312 and the cases were 73.0 per cent correctly predicted.
3.3.4.1 Adopter Model
The intercept was statistically significant (P < 0.01), migration (P < 0.1), cocoa farm size (P < 0.05), and cocoa yield (P < 0.01). Migration tended to be less probable to influence the decision of a farmer to spray his/her farm against capsids four times per year (CRIG recommendation). Being a native of the place compared to a migrant/settler reduced the log of the odds ratio of being adopter relative to non-adopter of CRIG capsid control recommendation by 1.058 and the odds in favour of the adopter decreased by a factor of 0.347. Moreover, farm size had a more probable influence on the farmer’s capsid control decision. As farm size increased by one hectare, the log odds ratio increased by 0.504 and the odds by a factor of 1.655 times. Yield also was recognized

www.ccsenet.org/sar Sustainable Agriculture Research Vol. 1, No. 1; February 2012
ISSN 1927-050X E-ISSN 1927-0518 108
to affect the probability of a farmer spraying his/her farm four times against capsids as compared to one who did not spray at all. When yield increased by 1 kg/ha, the likelihood in favour of adopters increased by a factor of 1.005.
3.3.4.2 Partial Adopter Model
Migration emerged statistically significant (P < 0.05), farm size (P < 0.01), and yield (P < 0.05). Migration was less probable to influence the decision of afarmer to spray his/her farm against capsids from one through three times per year (partial adopter of CRIG recommendation). Being a native of the place compared to a settler reduced the log of the odds ratio of being partial adopter relative to non-adopter of CRIG capsid control recommendation by 1.091, and the odds in favour of the partial adopter decreased by a factor of 0.336. This implies that the native farmers tended to be non-adopters whilst the migrants were partial adopters. The negative sign of migration coefficient was as expected due to the reason given for the expected signs. In addition, farm size was seen to be more probable in influencing the farmer decision of spraying partially against capsids. As farm size increased by one hectare, the log odds ratio increased by 0.567 and its odds increased by a factor of 1.763 times. Yield also was recognized to affect the probability of a farmer spraying his/her farm partially against capsids as compared to one who did not spray at all. When yield increased by 1 kg/ha, the likelihood in favour of partial adopters relative to the non-adopters increased by a factor of 1.004 times.
3.3.5 Blackpod Spraying Frequency Model
The attempt to model the adoption decision of the frequency of spraying against blackpod disease was unsuccessful because the likelihood ratio test for the overall model was not significant.
4. Discussion
The study has demonstrated that cocoa farmers have adopted CRIG-recommended cocoa production technologies to some extent. Fertilizer adoption decision is affected by access to credit and number of cocoa farms owned by the farmer. The decision on weeding frequency is also influenced by gender of the farmer and cocoa yield. The adoption of cocoa variety is affected by age of the farmer and educational status. The adoption decision on frequency of spraying against capsids tended to be influenced by migration, cocoa farm size and yield. The adoption rates of insecticide and fungicide applications to control pests and diseases were low as compared to those of hybrid variety use and fertilizer application. This might be due to the inadequate funds of the farmers to purchase the relatively expensive chemicals, scarcity of labour and the fear that, for example, herbicides would kill intercrops like cocoyam (MASDAR, 1998). The results of the adoption models are clearly consistent with the observation by Asante (1992) and World Bank/FAO (1986) that the main practice of cocoa farmers in Ghana tended to be stepwise mode of adoption of the innovations.
4.1 Fertilizer Application
For fertilizer adoption, the negative sign of credit coefficient was unexpected but possible explanation of the situation is that as fertilizer application competes with other farm activities such as pests and diseases control for the limited funds, farmers may tend to shift their loans to control weeds as well as pests and diseases instead of applying fertilizer to their cocoa farms (Aneani, et al., 2007). However, in Kenya, Njagi (1980) observed that availability of cash, access to inputs on credit and availability of manure affected adoption of soil fertility management recommendations. Green and Ng’ong’ola (1993) reported that crop type, farming system, crop variety, credit access, off-farm income, and availability of regular labour as the main factors affecting adoption of fertilizer recommendations in Malawi. The Hitech programme might consider these findings in their activities to ensure efficient and effective fertilizer application on cocoa farms. The positive sign of the number of farms coefficient was consistent with expectation because the increase in number of farms, assuming matured and yielding, will increase the cocoa output and then the farmer’s income which could be used to purchase fertilizer.
4.2 Weed Control Frequency
The high input requirements for controlling excessive weed growth is one of the most important problems with tree crop production (Baidoo-Addo et al., 2000). The result of this study indicated that the male farmer compared to female was less likely to weed his farm four times a year, supporting the observation by MASDAR (1998) that the weeding frequency of cocoa farms by women farmers was higher than that of men on the average. MASDAR noted that women have less access to credit than men because of having less land as collateral, and relied mostly on hired labour which is scarce and costly due to migration of the rural youth to the urban areas to seek for jobs with relatively better remuneration. The women tend to finance the employment of available hired labour using additional incomes from off-farm activities such as trading. Kamau (1980) reported that adoption of weed control recommendations was influenced by availability and cost of labour, and cash flow constraints.
www.ccsenet.org/sar Sustainable Agriculture Research Vol. 1, No. 1; February 2012
Published by Canadian Center of Science and Education 109
Cocoa yield was more probable to affect the decision of a farmer to weed his/her farm as recommended by CRIG because the resultant increased cocoa income would enable the farmer to hire labour for weed control.
4.3 Cocoa Variety Adopted
The hybrid model suggests that age of the farmer and the educational status influence the adoption of cocoa variety. The negative coefficient of age indicated that the older the farmer the lesser his/her willingness to try new innovations or take risk. The older farmers who are used to the traditional Amelonado and Amazon varieties are more resistant to change to Hybrid seeds by replanting their old cocoa farms. In the process of growing old, a farmer’s social, psychological and physical conditions change. These changes result in reduced interaction with others and declined physical energy (Odoemenem & Obinne, 2010). Al-Karablieh et al. (2009) reported a negative relationship between age and likelihood of barley variety adoption and attributed this to younger farmers being more likely to be willing to innovate, whereas older farmers may be less willing to adopt new varieties given the heavy labour requirement. Ntege-Nanyeenya et al. (1997) found level of education to have a statistically significant positive impact on a farmer’s choice to adopt longe1 (a coffee variety). Farmers who received any kind of education were more likely to adopt longe1 than farmers who were illiterate. Other studies have indicated similar effects for education (Nkonya et al., 1997; Al-Karablieh et al., 2009; Odoemenem & Obinne, 2010). Generally, the low level of education of the farmers retards the adoption of innovation, especially one that is complex. Literate farmers are more disposed to understand new ideas and concepts provided by extension workers and other informants. With lack of formal education, information cannot be passed to these farmers through the print media or mass media, except through personal contact methods, personal discussion, result demonstrations, and visual aid. The implication from the hybrid model is that cocoa farmers should be educated on the benefits of growing hybrid cocoa variety as compared to the traditional Amelonado and Amazon varieties. The youth should be attracted into cocoa farming through farm mechanization by developing new labour-saving innovations since they are likely to plant hybrid cocoa.
4.4 Capsid Control Frequency
Concerning the capsid spraying frequency model, migration variable was less probable to affect the spraying decision of the farmers. The negative sign of the migration coefficient was as expected because migrant farmers are assumed to be more enterprising and prepared to increase cocoa output by adopting new technologies than the natives (MASDAR, 1998). Furthermore, the positive sign of the farm size and the yield coefficients were expected since larger farms tend to produce higher cocoa output which leads to higher income to enable the farmer to purchase insecticides for capsid control. Kalyebara (1999) indicated that farm size is a significant predictor of adoption of pesticide use; that is, the use of fungicides and insecticides. Kebede et al. (1990) observed that farm size has statistically significant effect on adoption of pesticide technology on Ethiopian crop production systems. The policy implication here is that the CODAPEC programme should spray both large and small farms. This is to ensure complete control of capsids because farmers are not serious in controlling capsids on relatively small farms. Also, some farmers do not adequately control capsids on their farms.
4.5 Limitation and Future Suggestions
Finally, it is expedient to point out some of the limitations and future research directions. Although the sample size on which the analysis was conducted is relatively small, the researchers think that the results portray a realistic picture of technology adoption by the Ghanaian cocoa farmers. There should be further investigation into the adoption behaviour of the cocoa farmers on the chemical control of blackpod disease since our attempt to model it failed because the overall model was statistically insignificant. Besides the set of variables used in the analysis, many other public policies might have influence on the adoption of CRIG’s cocoa production technologies; for instance, the mass spraying programme (CODAPEC) and the Cocoa High Technology programme (Hi-tech). We could not incorporate the effect of those variables owing to inadequate data.
5. Conclusion
This study estimated the respective adoption rates of 10.3%, 7.5%, 3.7%, 44.0% and 33.0%, for CRIG-recommended cocoa production technologies such as control of capsids with insecticides, control of black pod disease with fungicides, weed control manually or with herbicides, planting hybrid cocoa varieties and fertilizer application. Factors such as access to credit, number of farms, gender, yield, educational status of farmer, age of farm, migration, and farm size were statistically recognized to influence the probability of adoption of CRIG-recommended technologies.
www.ccsenet.org/sar Sustainable Agriculture Research Vol. 1, No. 1; February 2012
ISSN 1927-050X E-ISSN 1927-0518 110
Acknowledgements
The support provided by the technical staff, Mr. L. K. Akuffo, Mr. S. Duodu, Mr. Dickson Agyapong and Mr. Patric Zeal, of the Social Science and Statistics Unit (SSSU) of Cocoa Research Institute of Ghana (CRIG) is gratefully acknowledged. The research was supported by grant from Cadbury & Fry Ghana Ltd. and Cocoa Research Institute of Ghana. This paper, CRIG / 02 / 2011/ 045 / 004, is published with the permission of the Executive Director, CRIG, Tafo. .
References
Adekunle, D., & Henson, S. J. (2007). The effect of cooperative thrift and credit societies on personal agency belief: a study of entrepreneurs in Osun State, Nigeria. African Journal of Agricultural Research, 2(12), 678-686.
Al-Karablieh E. K., Al-Rimawi, A. S., & Hunaiti, D.A. (2009). Logit models for identifying the factors that influence the adoption of barley production technologies in low rainfall areas. Jordan Journal of Agricultural Sciences, 5(3), 251-265.
Aneani, F., Anchirinah, V. M., Asamoah, M., & Owusu-Ansah, F. (2007). Baseline socio-economic and farm managements survey. A Final Report for the Ghana Cocoa Farmers’ Newspaper Project. New Tafo-Akim: Cocoa Research Institute of Ghana (CRIG).
Asante, E. G. (1992). Benefit-cost analysis of CRIG recommended technologies in relation to farmer adoption patterns and implication for the cocoa industry in Ghana. A Final Report Submitted to the Research Committee. Akim Tafo: Cocoa Research Institute of Ghana (CRIG).
Baidoo-Addo, K., Nuertey, B. N., & Asamoah, T.E.O. (2000). Use of round up (glyphosate) in weed control under oil palm: some costs implications. Journal of the Ghana Science Association, 2(2), 94-98.
Bamett, V. (1974). Elements of sampling theory. London, UK: The English Universities Press Ltd..
Boyd, H. W. Jr., Westfall, R., & Stasch, S. F. (2004). Marketing research: text and cases. Seventh Edition. Homewood, Illinois, USA: Richard D. Irwin, Inc., 357-416.
Chan, Y. H. (2005). Multinomial logistic regression. Biostatistics 305. Sigapore Medical Journal, 46(6), 259-269.
Chirwa, E. W. (2005). Fertilizer and hybrid seeds adoption among smallholder maize farmers in Southern Malawi. Development Southern Africa, 22(1), 1-12. http://dx.doi.org/10.1080/03768350500044065
Donkor, M. A., Henderson, C. P., & Jones, A.P. (1991). Survey to quantify adoption of CRIG recommendations. Farming Systems Unit Research Paper No. 3, New Tafo: Cocoa Research Institute of Ghana (CRIG). 29.
Doss, C. R. (2003). Understanding farm technology adoption: Lessons learned from CIMMYT’s micro surveys in Eastern Africa. CIMMYT Economics Working Paper No. 03-07, Mexico City, Mexico: CIMMYT.
FAO/World Bank (1986). Draft report on third cocoa project for Ghana. Ghana Agricultural Sector Review, World Bank Report No. 5366-GH. Washington, D. C.: World Bank.
Feder, G. Just, R.E., & Zilberman, D. (1985). Adoption of agricultural innovations in developing countries: a survey. Economic Development and Cultural Change, 33(2), 255-298. http://dx.doi.org/10.1086/451461
Feder, G., & Slade, R. (1984). The acquisition of information and the adoption of the technology. American Agricultural Economics Association, 66(3), 312-320. http://dx.doi.org/10.2307/1240798
Green, D. A. G., & Ng’ong’ola, D. H. (1993). Factors affecting fertilizer adoption in less developed countries: an application of multivariate logistic analysis in Malawi. Journal of Agricultural Economics, 44(1), 99-109. http://dx.doi.org/10.1111/j.1477-9552.1993.tb00253.x
Henderson, C. P., & Jones, A. P. (1990). Analysis of Constraints to the Adoption of CRIG Recommendations in Offinso Districts: Results and Discussion. CRIG farming systems Unit Research. Paper No. 1, Tafo, Ghana: Cocoa Research Institute of Ghana (CRIG). 15.
Hosmer, D. W., & Lemeshow, S. (1989). Applied logistic regression, New York: Wiley.
Jatoe, J. B. D., Al-Hassan, R. M., & Abatania, L. N. (2005). Factors affecting the adoption of improved sorghum varieties among farm households in the northwest Ghana: a probit analysis. Ghana Journal of Development Studies, 2(1), 37-50.
www.ccsenet.org/sar Sustainable Agriculture Research Vol. 1, No. 1; February 2012
Published by Canadian Center of Science and Education 111
Kalyebara, R. (1999). A comparison of factors affecting adoption of improved coffee management recommendations small and large farmers in Uganda. A paper presented at the CIAT International Workshop on “Assessing the Impact of Agricultural Research on Poverty Alleviation”, San Jose, Costa Rica: CIAT International.
Kamau, P. C. (1980). Economics of herbicide use in coffee. Kenya-Coffee, 1980, 45(529), 111-119.
Kebede, Y., Gunjal, K., & Coffin, G. (1990). Adoption of new technologies in Ethiopian agriculture: the case of Tegulet-Bulga district, Shoa Province. Agricultural Economics, 4, 495-502. http://dx.doi.org/10.1016/0169-5150(90)90018-V
Kosarek, L. J., Garcia, P., & Morris, L. M. (2001). Factors explaining the diffusion of hybrid maize in latin america and the carribean region. Agricultural Economics, 26(3), 267-280. http://dx.doi.org/10.1111/j.1574-0862.2001.tb00069.x
Laryea, A. A. (1981). Technology transfer to cocoa farmers in west africa. Proceedings of the 8th International Cocoa Conference, 18th to 23rd October, Cartagena, Colombia: Cocoa Producer Alliance (COPAL). 583-591.
MASDAR. (1998). Socio-economic study of cocoa farming communities in Ghana. Accra: MASDAR International Consultants/Ghana Cocoa Board.
Mazuze, F. M. (2007). Analysis of adoption of orange-fleshed sweetpotatoes: The case study of Gaza Province in Mozambique. Research Report Series No. 4E, Directorate of Training, Documentation and Technology Transfer . Mozambique: Institute of Agricultural Research of Mozambique (IIAM). 1-35.
Morris, M. L., Tripp, R., & Dankyi, A. A. (1998b). Adoption and impacts of improved maize production technology: a case study of the Ghana grains development project. Mexico, D.F.: CIMMYT.
Njagi, S. B. C. (1980). Economics of fertilizer use in coffee production. nitrogen and phosphate. Kenya-Coffee. 1980, 45(532), 219-233.
Nkonya, E. M., Schroeder, T., & Norman, D. (1997). Factors affecting adoption of improved maize seed and fertilizer in Northern Tanzania. Journal of Agricultural Economics, 48(1), 1-12. http://dx.doi.org/10.1111/j.1477-9552.1997.tb01126.x
Ntege-Nanyeenya, W., Mugisa-Mutetikka, M., Mwangi, W., & Verkuijl, H. (1997). An assessment of factors affecting adoption of maize production technologies in Iganga Districts, Uganda. Addis Ababa, Ethiopia: National Agricultural Research Organization (NARO) and International Maize and Wheat Improvement Centres (CIMMYT).
Odoemenem, I. Q., & Obinne, C. P. O. (2010). Assessing the factors influencing the utilization of improved local crop production technologies by small-scale farmers in Nigeria. Indian Journal of Science and Technology, 3(1), 180-183.
Rahm, R. M., & Huffman, E. W. (1984). The adoption of reduced tillage: the role of human capital and other variables. American Agricultural Economics Association, 66(4), 405-413. http://dx.doi.org/10.2307/1240918
Salasya, B., Mwangi, W., Mwabu, D., & Diallo, A. ( 2007). Factors influencing adoption of stress-tolerant maize hybrid (WH502) in Western Kenya. African Journal of Agricultural Research, 2(10), 544-551.
Strauss, J., Barbosa, M., Teixeira, S., Thomas, D., & Gomes, Jr. R. (1991). Role of education and extension in the adoption of technology: a study of upland rice and soybean farmers in Central-West Brazil. Agricultural Economics, 5(4), 341-359. http://dx.doi.org/10.1016/0169-5150(91)90027-I
www.ccsenet.org/sar Sustainable Agriculture Research Vol. 1, No. 1; February 2012
ISSN 1927-050X E-ISSN 1927-0518 112
Table 1. Profile of the Districts Selected for the Survey
DISTRICT FEATURE
Nkawie Goaso Enchi Oda Twifo/Assin
Fosu Hohoe
Region Ashanti Brong-Ahafo Western Eastern Central Volta District Capital
Nkawie Goaso Enchi Akim Oda Twifo Praso Hohoe
Land Area (km2)
894.2 1 093.7 2 638.0 1 090.0 1 199.0 1 403.0
Rainfall (mm) 1 077 1 108 1 429 1 784 1 077 1 526 Temperature
(oC) 27 - 31 23 - 33 22 - 34 25 - 27 26 - 30 22 - 34
Altitude (m) 77 305 300 61 91 890 Vegetation Semi-deciduous
rain forest Semi-deciduous
rain forest Moist semi-
deciduous rain
forest
Semi-deciduous rain forest
Semi-deciduous rain forest
Moist semi-
deciduous rain
forest and savanna
Socio-economic activities
F and C F and C F, L, SSM and C
F, L, SSM, Q and C
F, L, SSM, Q and C
F and C
Note: F = Farming, C = Commerce, L = Logging, SSM = Small-scale mining, Q = Quarrying
Table 2. Farmers selected for the survey
Region District Number of Villages
per District Number of Cocoa
Farmers Eastern Oda 5 50 Ashanti Nkawie 5 50
Brong-Ahafo Goaso 5 50 Central Twifo Praso/Assin Fosu 5 50 Western Enchi 5 50
Volta Hohoe 5 50 Total 30 300
Table 3. Definitions of technology adopter categories
Farm Activity Adopter Partial Adopter Non-adopter Spraying against capsids Farmer spraying the
farm 4 times per year.
Farmer spraying the farm 1 to 3 times per year.
Farmer who has not been spraying the farm.
Spraying against blackpod Farmer spraying the farm 6 to 9 times per
year.
Farmer spraying the farm 1 to 5 times per year.
Farmer who has not been spraying the farm.
Weeding Farmer weeding the farm 4 times per
year.
Farmer weeding the farm 1 to 3 times per year.
Farmer who has not been weeding the farm.
Cocoa variety planted Farmer who has planted only Hybrid cocoa on the farm.
Farmer who has planted a mixture of Hybrid and
Amazon or Amelonado.
Farmer who has planted either Amazon or
Amelonado. Fertilizer application Farmer who has been
applying fertilizer to the farm.
Farmer who has not applied fertilizer to the
farm.
www.ccsenet.org/sar Sustainable Agriculture Research Vol. 1, No. 1; February 2012
Published by Canadian Center of Science and Education 113
Table 4. Definitions and Assumptions of Socio-economic Factors of Adoption of some CRIG Technologies
Apriori assumptions of the signs of the coefficients (effect). Code Variable Weeding Blackpod
spraying Capsid
spraying Cocoa variety
Fertilizer application
X1 Age of cocoa farmer measured in years.
- - - - -
X2 Working experience (number of years in cocoa farming).
+ + + + +
X3 Educational level of the cocoa farmer (literate or illiterate).
+ + + + +
X4 Gender (male or female). + + + + + X5 Household size. + + + + + X6 Migration, (native or settler). + + + + + X7 Number of cocoa farms owned by
farmer. + + + + +
X8 Cocoa farm size measured in hectares.
+ + + + +
X9 Age of cocoa farm measured in years.
- - - - +
X10 Cocoa yield measured in kilogramme per hectare ( as a
proxy of cocoa income).
+ + + + +
X11 The extent of extension visits to farmer’s farm by extensionist, (no
visit or at least one visit).
+ + + + +
X12 Attending demonstration or field day (yes or no).
+ + + + +
X13 Access to credit (yes or no) + + + + +
Table 5. Descriptive Statistics of the Variables Used in the Multinomial logistic Regression Analysis
Variable Mean Std Dev. Min Max N Age of cocoa farmer (yrs.) 51.5 15.22 15 86 300 Working experience (yrs.) 19.61 13.65 2 65 297
Adult family labour 3.26 2.76 1 19 197 Number of cocoa farms owned
by farmer. 2.1 1.5 1 8 299
Cocoa farm size (ha) 3.02 3.67 0.4 36.0 296 Age of cocoa farm (yrs.) 16.9 12.48 1 85 291
Cocoa yield (kg/ha) 329.30 219.82 104.17 1171.88 211 Cocoa production (kg) 744.77 512.68 156.25 2 375.00 206 Cocoa income (GH¢) 670.29 461.41 140.63 2 137.50 206
Educational status (literate = 21.5%, illiterate = 78.5% ) 298 Gender (male = 80.0%, female = 20.0%) 300
Migration (native = 43.7%, migrant = 56.3%) 300 Extension visit (no visit = 55.3%, at least one visit = 44.7%) 293
Attending demonstration or field day (yes=31.7%, no=68.3%). 300 Access to credit (yes = 22.3%, no = 77.7%) 300
www.ccsenet.org/sar Sustainable Agriculture Research Vol. 1, No. 1; February 2012
ISSN 1927-050X E-ISSN 1927-0518 114
Table 6. Results of the multinomial logistic regression analysis of fertilizer application and weeding frequency
Note: *P < 0.1, ** P < 0.05, *** P < 0.01. B = coefficient of the explanatory variables. Exp(B) = exponential value of B. n.a these variables introduced numerical problems in the model estimation.
FERTILIZER APPLICATION:
Adopter WEEDING FREQUENCY:
Adopter
VARIABLE B Std.
Error Sig. Exp(B) B
Std. Error
Sig. Exp(B)
Intercept -2.100 0.967 0.030** -3.803 2.692 0.158 Age of cocoa farmer measured in years.
0.024 0.013 0.064* 1.024-0.025 0.037 0.502 0.975
Working experience in years -0.018 0.015 0.247 0.982 n.a n.a n.a n.a Educational level 0.382 0.390 0.327 1.466 -0.544 1.199 0.650 0.581
Gender 0.163 0.389 0.675 1.177 -1.882 0.961 0.050** 0.152Household size. 0.054 0.031 0.083* 1.058 0.073 0.068 0.285 1.075
Migration -0.365 0.307 0.234 0.694 -0.364 0.916 0.691 0.695Credit -0.704 0.336 0.036** 0.494 -0.534 0.882 0.545 0.586
Number of cocoa farms owned by farmer.
0.392 0.143 0.006*** 1.4790.290 0.278 0.298 1.336
Cocoa farm size measured in hectares.
0.014 0.039 0.721 1.0140.024 0.165 0.884 1.024
Age of cocoa farm measured in years.
0.005 0.014 0.715 1.005n.a n.a n.a n.a
Frequency of Extension visits.
0.219 0.314 0.486 1.2451.685 1.196 0.159 5.391
Attending demonstration or field day.
0.133 0.339 0.695 1.142n.a n.a n.a n.a
Cocoa yield (kg/ha) 0.001 0.001 0.210 1.001 0.003 0.001 0.012** 1.003
-2log likelihood: 280.277 46.891 Chi-squared: 37.612 23.988
Degrees of freedom: 13 10 Sig.: 0.001*** 0.008***
Pseudo R-squared (Nagelkerke):
0.196
0.370
% correctly predicted: 69.3% 97.6%
www.ccsenet.org/sar Sustainable Agriculture Research Vol. 1, No. 1; February 2012
Published by Canadian Center of Science and Education 115
Table 7. Results of the multinomial logistic regression analysis of cocoa variety planted
Note: *P < 0.1, ** P < 0.05, *** P < 0.01. B = coefficient of the explanatory variables. Exp(B) = exponential value of B.
COCOA VARIETY PLANTED: Adopter
Model 1: Hybrid
Model 2: Amazon Model 3:Admixture of cocoa varieties
VARIABLE B Std. Erro
r Sig.
Exp(B)
B Std. Erro
r Sig.
Exp(B)
B Std. Erro
r Sig. Exp(B)
Intercept 4.595 2.28
0 0.044*
* 3.387 2.25
8 0.134 3.67
5 2.33
8 0.116
Age of cocoa farmer measured
in years. -0.053
0.030
0.075* 0.949-0.06
7 0.03
0 0.024*
* 0.935 -0.06
3 0.03
0 0.038*
* 0.939
Working experience in
years -0.009
0.033
0.780 0.9910.022 0.03
2 0.488 1.022 0.02
4 0.03
3 0.460 1.024
Educational status
3.522 1.24
6 0.005*
** 33.84
2 2.657 1.23
6 0.032*
* 14.25
1 1.36
3 1.30
3 0.296 3.907
Gender. 1.849 0.81
7 0.024*
* 6.355
1.001 0.807
0.215 2.721 0.932
0.848
0.272 2.540
Household size. -0.028 0.06
5 0.665 0.972
-0.028
0.066
0.668 0.972 -0.057
0.070
0.419 0.945
Migration. 1.124 0.73
3 0.125 3.078
0.796 0.730
0.275 2.217 0.945
0.745
0.205 2.572
Credit. 0.040 0.78
8 0.959 1.041
0.126 0.777
0.872 1.134 -0.102
0.789
0.897 0.903
Number of cocoa farms owned by farmer.
-0.030 0.33
5 0.928 0.970
0.396 0.323
0.219 1.486 0.200
0.336
0.552 1.221
Cocoa farm size measured in
hectares. 0.152
0.103
0.140 1.1650.105 0.10
0 0.293 1.111 0.04
4 0.10
2 0.663 1.045
Age of cocoa farm measured
in years. -0.123
0.030
0.000***
0.884-0.06
6 0.02
7 0.013*
* 0.936 -0.01
6 0.02
3 0.498 0.984
Frequency of Extension visits.
-0.373 0.69
6 0.593 0.689
0.301 0.699
0.667 1.351 -0.838
0.707
0.236 0.433
Attending demonstration or field day.
-0.436 0.72
6 0.548 0.647
-0.125
0.720
0.863 0.883 -0.391
0.744
0.236 0.676
Cocoa yield (kg/ha)
0.002 0.00
2 0.316 1.002
0.001 0.002
0.569 1.001 0.001
0.002
0.437 1.001
-2log likelihood: 488.47
2
Chi-squared: 96.257 Degrees of freedom:
39
Sig.: 0.001*
**
Pseudo R-squared(Nage
lkerke):
0.359
% correctly predicted:
56.1
www.ccsenet.org/sar Sustainable Agriculture Research Vol. 1, No. 1; February 2012
ISSN 1927-050X E-ISSN 1927-0518 116
Table 8. Results of the multinomial logistic regression analysis of spraying against capsids
Note: *P < 0.1, ** P < 0.05, *** P < 0.01. B = coefficient of the explanatory variables. Exp(B) = exponential value of B.
SPRAYING AGAINST CAPSIDS
Model 1: Partial Adopters Model 2: Adopters
VARIABLE B Std.
ErrorSig. Exp(B) B
Std.
Error Sig. Exp(B)
Intercept -1.387 1.533 0.366 -5.487 2.105 0.009***
Age of cocoa farmer
measured in years. 0.025 0.019 0.181 1.025
0.029 0.024 0.224 1.030
Working experience in years 0.005 0.021 0.819 1.005 -0.023 0.030 0.449 0.977
Educational level (none) -0.773 0.547 0.157 0.462 -0.634 0.735 0.388 0.530
Gender (male) -0.458 0.524 0.382 0.632 -0.415 0.718 0.563 0.660
Household size. 0.035 0.052 0.499 1.036 0.057 0.062 0.355 1.059
Migration# (native) -1.091 0.438 0.013** 0.336 -.1.058 0.587 0.072* 0.347
Credit 0.136 0.541 0.802 1.145 1.102 0.787 0.161 3.010
Number of cocoa farms
owned by farmer. 0.037 0.226 0.871 1.037
0.055 0.259 0.831 1.057
Cocoa farm size measured in
hectares. 0.567 0.184 0.002*** 1.763
0.504 0.200 0.012** 1.655
Age of cocoa farm measured
in years. -0.035 0.018 0.052* 0.965
-0.009 0.026 0.728 0.991
Frequency of Extension visits
(never). 0.683 0.417 0.101 1.981
0.108 0.563 0.848 1.114
Attending demonstration or
field day (Yes). 0.287 0.490 0.558 1.333
0.328 0.639 0.608 1.388
Cocoa yield (kg/ha) 0.004 0.001 0.006*** 1.004 0.005 0.001 0.000*** 1.005
-2log likelihood: 311.761
Chi-squared: 69.133
Degrees of freedom: 26
Sig.: 0.001***
Pseudo R-squared
(Nagelkerke): 0.312
% correctly predicted: 73.0%
www.ccsenet.org/sar Sustainable Agriculture Research Vol. 1, No. 1; February 2012
Published by Canadian Center of Science and Education 117
Figure 1. A map indicating the various districts where the baseline survey was conducted