adsorption of a multicomponent rhamnolipid surfactant to soil
TRANSCRIPT
Adsorption of a MulticomponentRhamnolipid Surfactant to SoilW O U T E R H . N O O R D M A N , †
M A R K L . B R U S S E A U , ‡ A N DD I C K B . J A N S S E N * , †
Department of Biochemistry, Groningen Biomolecular Sciencesand Biotechnology Institute, University of Groningen,Nijenborgh 4, 9747 AG Groningen, The Netherlands,and Soil, Water and Environmental Science Department,University of Arizona, Tucson, Arizona 85721
The adsorption of rhamnolipid, a multicomponent bio-surfactant with potential application in soil remediation, totwo sandy soils was investigated using batch andcolumn studies. The surfactant mixture contained sixanionic components differing in lipid chain length andnumber of rhamnose moieties. Batch adsorption experimentsindicated that the overall adsorption isotherms of totalsurfactant and of the individual components leveled offabove a concentration at which micelles were formed. Columnexperiments showed that the retardation factors for thetotal surfactant and for the individual components decreasedwith increasing influent concentration. Extended tailingwas observed in the distal portion of the surfactantbreakthrough curve. The concentration-dependent retardationfactors and the extended tailing are in accordance withthe nonlinear (concave) adsorption isotherms found in thebatch adsorption studies. The more hydrophobic rhamnolipidcomponents were preferentially adsorbed, but adsorptionwas not correlated with the organic carbon content ofthe soil. This suggests that adsorption of rhamnolipid to soilis not a partitioning process but mainly an interfacialadsorption process.
IntroductionThe understanding of surfactant adsorption is of importancefor the application of surfactants for enhanced oil recovery(1, 2) and for surfactant-enhanced soil remediation (3-6).Adsorption of surfactants is detrimental for these applicationsas it results in surfactant loss and reduced surfactant mobility.Furthermore, adsorption of surfactants may create newadsorption sites for hydrophobic compounds (7). Manycommercially available surfactants such as linear alkylben-zenesulfonates (8) and alcohol ethoxylates (9) consist ofmultiple components. Natural surfactants also often aremixtures (10-14). Multicomponent surfactants may changein composition during adsorption and transport, which canresult in altered surface active properties (2). Insight into theadsorption behavior of multicomponent surfactants thus isneeded for understanding surfactant transport and foroptimal design of surfactant mixtures (2, 4).
Rhamnolipid is a bacterial biosurfactant produced byseveral Pseudomonas species as a mixture of R-L-rhamnopy-
ranosyl-â-hydroxyalkanoyl-â-hydroxyalkanoate and 2-O-R-L-rhamnopyranosyl-R-L-rhamnopyranosyl-â-hydroxyalkanoyl-â-hydroxyalkanoate species (13, 15, 16). These biosurfactantsresemble synthetic gemini surfactants because they containtwo covalently linked headgroups (a nonionic (di)rham-nopyranosyl and an anionic carboxylate headgroup) and twotails (17). Rhamnolipid has potential for application in foods(18), use as pest-control agent (16, 19), as a source ofrhamnose (20), and for the remediation of soils contaminatedwith sparingly soluble organic compounds and heavy metals(5, 6, 15, 21). Favorable properties of rhamnolipid forapplication in soil remediation include the relatively lowadsorption to soil and the solubilization characteristics, whichare similar to those of synthetic surfactants (5).
The factors that determine rhamnolipid adsorption tosoil have not been elucidated, and the occurrence ofpreferential adsorption of specific components has not beeninvestigated. For application of rhamnolipid as well as ofother multicomponent surfactants in situations where ad-sorption occurs, knowledge of the factors that determinesurfactant adsorption and of preferential adsorption ofindividual components is indispensable. Therefore, weinvestigated the adsorption of the surfactant mixture and ofthe individual components to soil using batch adsorptionand column experiments. Two frequently used representativesandy soils, the Borden material and Eustis soil, were selectedfor this study (5, 22-24).
Materials and MethodsSoils and Solutions. The Borden material is a sandy subsoilcollected at the Canadian Air Force base in Borden, Ontario,Canada (23). This material consisted primarily of sand (>99%)and had an organic carbon content of 0.03%. Eustis soil isa sandy surface soil from Florida, U.S.A. (22) that consistedof 95.1% sand, 2.2% silt; 2.7% clay, and 0.27% organic carbon.Soils were air-dried and sieved (<2 mm) prior to use. In allexperiments, a background electrolyte solution was usedwhich contained 10 mM KNO3, 10 mM Tris-HCl, pH 7.0, and3 mM NaN3 (to suppress microbial activity) in MilliQ water.
Rhamnolipid. Rhamnolipid was produced by Pseudomo-nas aeruginosa UG2 (15) and isolated by consecutive stepsof acid precipitation and dissolution in aqueous NaHCO3
solution (21). Acid-precipitated rhamnolipid was purified bycolumn chromatography over Sephadex LH20 with methanolas the eluent. Fractions were analyzed for rhamnolipidcontent and purity by TLC. Pooled fractions were evaporatedto dryness and dissolved in water. The pH was adjusted to7.0 using NaHCO3. The rhamnolipid concentration in thisstock solution was determined using the 6-deoxyhexose assaywith L-rhamnose as a standard (25). For this mixture, anaverage molecular weight of 588 and a rhamnose content of0.45 (w/w) were calculated using the composition of themixture as determined with HPLC. About 1.4 g of purifiedrhamnolipid was isolated per liter of culture medium. Thismulticomponent surfactant mixture was used in all experi-ments.
Batch Adsorption Experiments. Adsorption of rhamno-lipid to soil was measured in a 1:2 (w/v) soil:solution ratioin 8 mL Pyrex tubes that were closed with aluminum coatedsepta. After 2-7 days of end-over-end rotation (1.4 rpm, roomtemperature), the incubation vessels were centrifuged at 3000rpm for 20 min, and subsequently the clear supernatant wasanalyzed for the concentration of total aqueous surfactant(C, µM) by surface tension measurements or, in a separateexperiment, for the individual C20 components (C, µM) byHPLC. The adsorbed concentration of total surfactant or
* Corresponding author phone: +31-50 363 4209; fax: +31-50363 4165; e-mail: [email protected].
† University of Groningen.‡ University of Arizona.
Environ. Sci. Technol. 2000, 34, 832-838
832 9 ENVIRONMENTAL SCIENCE & TECHNOLOGY / VOL. 34, NO. 5, 2000 10.1021/es9909982 CCC: $19.00 2000 American Chemical SocietyPublished on Web 02/03/2000

individual components (S, µmol/kg) was determined fromthe difference in the rhamnolipid concentration in theaqueous phase before and after adsorption. To determinethe mass balances, the amount of adsorbed rhamnolipidwas measured after removal of the aqueous phase byextracting several soil pellets three times with methanol.These mass balance checks revealed a total rhamnolipidrecovery of 92-124%. Five initial concentrations (85-1275µM), in triplicate, were used to determine the isotherms oftotal surfactant. Nineteen initial concentrations (2-2000 µM)were used to determine the isotherms for the individual C20
components.One batch adsorption experiment was performed on a
larger scale by contacting 37.5 g of Borden soil and 75 mLof 700 µM rhamnolipid solution. After equilibration for 24 h,the aqueous phase was removed, analyzed by HPLC, andconcentrated by lyophilization. The cmc of this concentratedmixture was determined using surface tension measure-ments. All adsorption experiments were performed at 22 (2 °C.
Column Experiments. The experimental setup for thecolumn studies was described previously by Noordman etal. (5). A stainless steel column of 7.0 cm length and 2.2 cmi.d. was used. The bulk density (F) and porosity (θ) weredetermined gravimetrically. Flow rates and pore watervelocities used were 0.4 mL/min and 20 cm/h, respectively,for Borden material and 2 mL/min and 90 cm/h, respectively,for Eustis soil, unless specified otherwise. The experimentswere performed at 22 ( 2 °C. Breakthrough of the conservativetracer pentafluorobenzoic acid was analyzed using a flow-through variable wavelength detector at 250 nm. For theexperiments with rhamnolipid, the column effluent wasdirected to a fraction collector and analyzed for rhamnolipidusing surface tension measurements or, in independentexperiments, by HPLC. After the effluent concentrationreached the concentration in the influent (C0, 34 or 850 µMtotal rhamnolipid), elution was continued with a rhamno-lipid-free solution. The experiments were continued untilthe effluent contained extremely low (surface tension > 69mN/m) or no detectable amount of rhamnolipid.
The Peclet number for each column was determined byanalysis of the breakthrough curve of the conservative tracerwith a local equilibrium advective-dispersive transport modelusing nonlinear least squares optimization (26). The retarda-tion factors (R) for total surfactant and for the componentswere determined from the area above the frontal limb of thebreakthrough curves. Moment analysis revealed a totalrecovery of rhamnolipid of 96-116%.
Analytical Procedures. The surface tension of aqueousrhamnolipid solutions was measured using a du Nouy ringtensiometer (Fischer Scientific, model 21, Pittsburgh, PA).Surfactant concentrations were determined quantitativelyby surface tension measurements after dilution to concen-trations where the surface tension was linearly correlatedwith the logarithm of the aqueous concentration (1-20 µMtotal rhamnolipid, experimental error 5%). The surfacetension analyses were calibrated with dilutions of therhamnolipid stock solution. The surface tension of theelectrolyte solution was higher than 70 mN/m.
Individual rhamnolipid components were analyzed byHPLC using a Merck AS 4000 autosampler, a Merck L-6200pump, and a Chromsphere PAH 100 mm column (Chrom-pack, Bergen op Zoom, The Netherlands). Detection was doneusing an evaporative light scattering detector (ELSD, MARKIII, Varex, Burtonsville, U.S.A.) (9, 14, 27, 28). Two sets ofconditions were used. For the standard conditions, the mobilephase contained 55% acetonitrile, 45% water, and 0.03%trifluoroacetic acid (isocratic); the flow rate was 0.5 mL/min;the injection volume was 150 µL; the ELSD drift tubetemperature was 100 °C; and the nebulizer flow was 1.5 L/min.For the analysis of samples with low rhamnolipid concen-trations, the mobile phase contained 35% water, 45%acetonitrile, 20% methanol, and 0.03% trifluoroacetic acid(isocratic); the flow rate was 0.5 mL/min; the injection volumewas 500 µL; the ELSD drift tube temperature was 80 °C; andthe nebulizer flow was 1.0 L/min. Because pure componentswere not available, the mass fractions of the individualrhamnolipid species in the stock solution were determinedfrom their respective relative peak areas at a total rhamnolipidconcentration of 850 µM assuming that the ELSD responseis directly related to the mass of compounds applied (28).The mass fractions thus obtained allowed calculation of themole fractions of the components in the mixture, therhamnose content, and the average molecular weight (Table1). For several experiments (Figures 6 and 7), the totalrhamnolipid concentration was calculated from the con-centration of the individual components.
The lipid components of rhamnolipid where analyzed byGC-MS after hydrolysis and methylation of the total surfactantmixture (29). For the HPLC-MS analysis of the rhamnolipidproduced by strain UG2, 50 nmol (50 µL of an aqueoussolution containing 1 mM purified rhamnolipid) was sepa-
TABLE 1. Properties of the Rhamnolipid Produced by P. aeruginosa UG2
total surfactant C18RL2 C18RL1 C20RL2 C22:1RL2 C20RL1 C22RL2
molecular weight 588a 622 476 650 776 504 678mole fraction in mixture 0.06 0.11 0.49 0.02 0.28 0.03HPLC retention time (min) 3.5 6 7 9 12 14MS major ions (M + TFAb - 1) 735 589 763 789 617 791MS major ions (M - 1) 621 649a Average molecular weight. b Trifluoroacetic acid, a component of the eluens (molecular weight ) 114).
FIGURE 1. HPLC-ELSD chromatogram of rhamnolipid from P.aeruginosa UG2. Abbreviations denote components. The inset showsthe structure of the main component (C20RL2).
VOL. 34, NO. 5, 2000 / ENVIRONMENTAL SCIENCE & TECHNOLOGY 9 833
rated by HPLC as described above. The HPLC eluate wasdirectly introduced into a Nermag R 3010 triple quadrupolemass spectrometer operated in negative ion mode using anionization potential of 3.5 kV and a nozzle potential of 70 V.
Results and DiscussionAnalysis and Composition of Rhamnolipid. The rhamnolipidproduced by Pseudomonas aeruginosa strain UG2 wasanalyzed by mass spectrometry to determine the compositionof the mixture. GC-MS analysis of the methylated fatty acidsof total rhamnolipid showed mass spectra corresponding tothe methyl esters of â-hydroxydecanoic acid and â-hydroxy-dodecanoic acid. An HPLC-ELSD chromatogram of thesurfactant showed six rhamnolipid components: C18RL2,C18RL1, C20RL2, C20RL1, C22:1RL2, and C22RL2 (Figure 1).The abbreviation Cx(:y)RLn designates the individual com-ponent with x as the total number of carbon atoms in thelipid moieties, y as the number of unsaturated bonds in thelipid moieties, and n as the number of rhamnose groups.These components were identified by HPLC-MS (Table 1).The small peak that eluted between C20RL2 and C22:1RL2
showed a large signal at a m/z of 777, which is the expectedvalue for C21RL2. However, since a C11-lipid was notobserved with GC-MS and the presence of odd-numberedlipids in rhamnolipid has never been reported, identificationof this component as C21RL2 would need further investiga-tion. The main component C20RL2 constituted almost 50mol % of the mixture. The combined HPLC-MS and GC-MSanalysis indicated that rhamnolipid produced by strain UG2was a mixture of monorhamnolipids and dirhamnolipids,mainly containing â-hydroxydecanoic acid moieties, but alsoâ-hydroxy-octanoic, -dodecenoic, and -dodecanoic acidmoieties. This has also been found for other strains (13, 27).
HPLC-ELSD was used to determine the concentration ofthe rhamnolipid components in subsequent experiments.When the standard set of experimental conditions was used,the concentrations of individual rhamnolipids could bedetermined in the range of 8-1700 µM with high accuracy(experimental error 3%). For lower concentrations, the useof a different eluent allowed operation of the ELSD at a lowernebulizer flow rate and drift tube temperature. This, togetherwith a larger injection volume, increased the sensitivity ofthe analysis and allowed determination of individual com-ponents down to 1 µM with a maximal experimental errorof 10% at the lowest concentration. The ELSD response waslinear with the rhamnolipid concentration in the range ofconcentrations used. The HPLC-ELSD method provided a
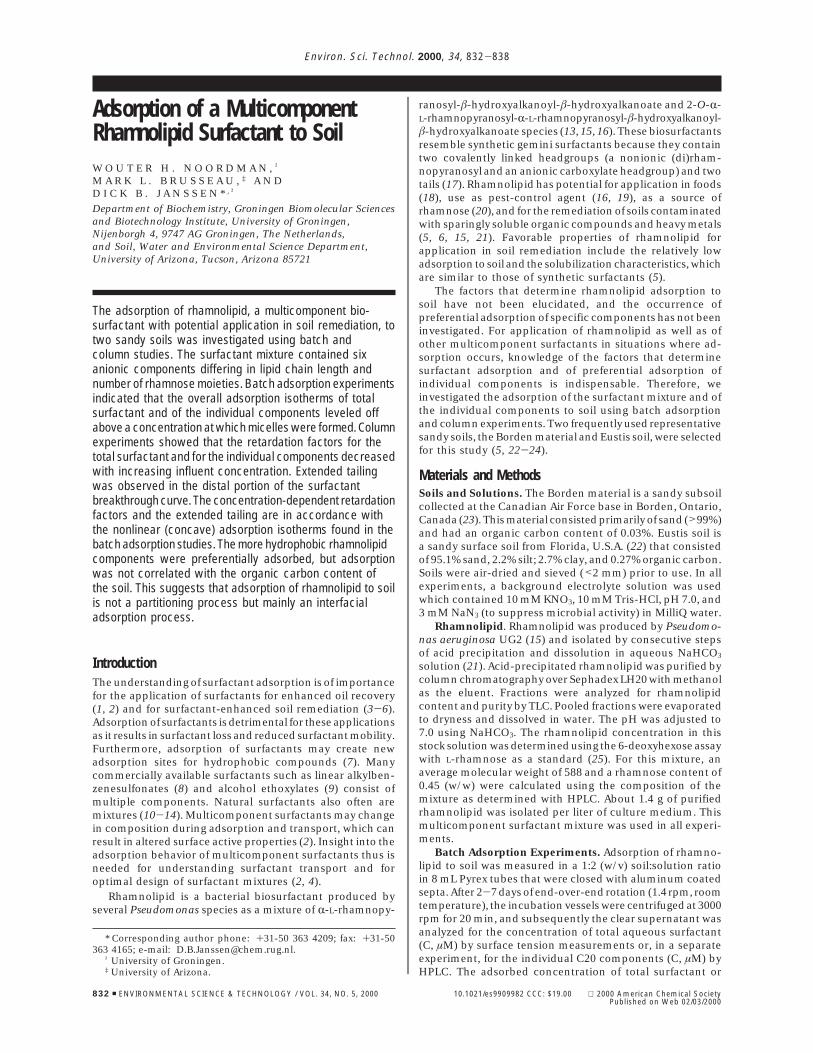
FIGURE 2. Adsorption isotherms of rhamnolipid on Borden soil. (A)Adsorption of total rhamnolipid (b). Error bars denote 1 SD and maybe within symbol size. The X-axis gives the total aqueous surfactantconcentration. (B) Adsorption of the individual components C20RL2(4) and C20RL1 (1). The total aqueous concentration of the C20components is plotted on the X-axis.
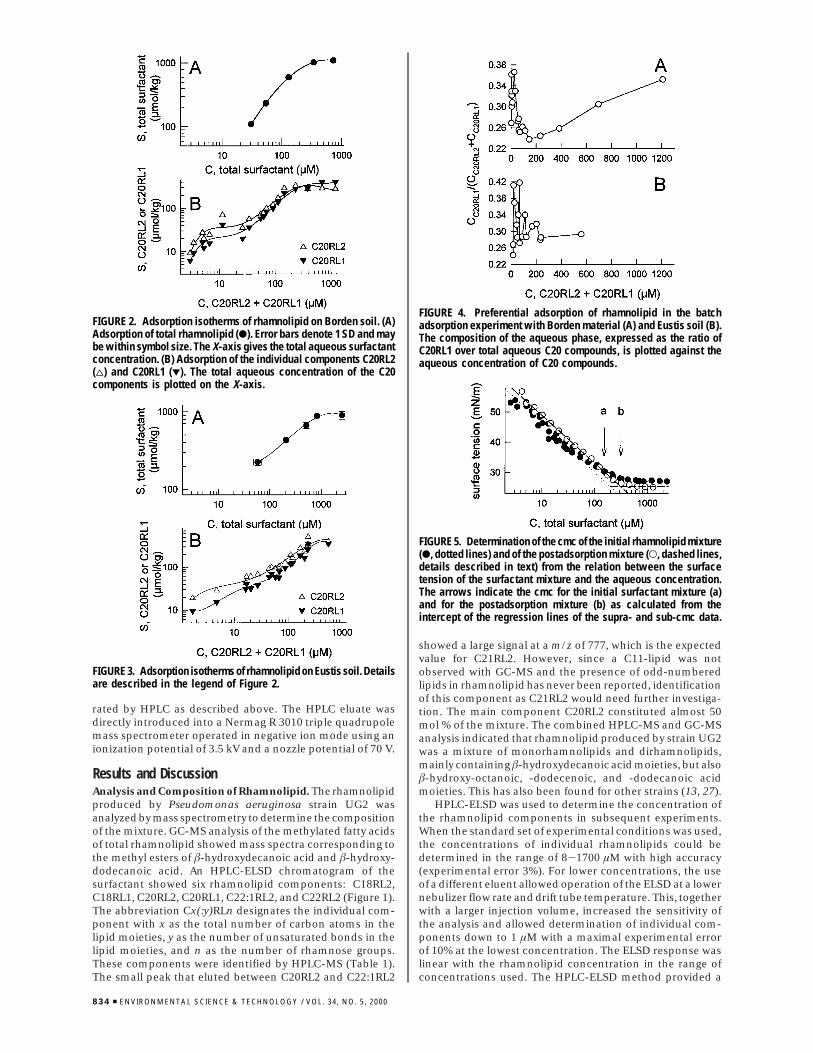
FIGURE 3. Adsorption isotherms of rhamnolipid on Eustis soil. Detailsare described in the legend of Figure 2.
FIGURE 4. Preferential adsorption of rhamnolipid in the batchadsorption experiment with Borden material (A) and Eustis soil (B).The composition of the aqueous phase, expressed as the ratio ofC20RL1 over total aqueous C20 compounds, is plotted against theaqueous concentration of C20 compounds.
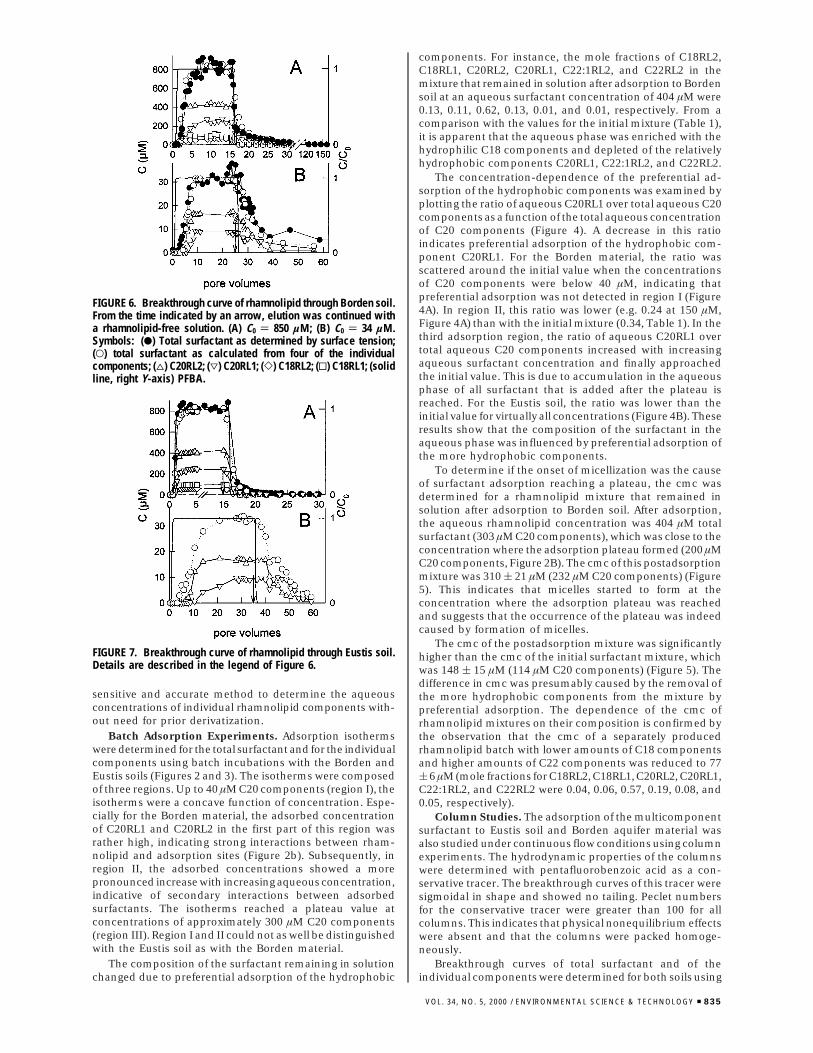
FIGURE 5. Determination of the cmc of the initial rhamnolipid mixture(b, dotted lines) and of the postadsorption mixture (O, dashed lines,details described in text) from the relation between the surfacetension of the surfactant mixture and the aqueous concentration.The arrows indicate the cmc for the initial surfactant mixture (a)and for the postadsorption mixture (b) as calculated from theintercept of the regression lines of the supra- and sub-cmc data.
834 9 ENVIRONMENTAL SCIENCE & TECHNOLOGY / VOL. 34, NO. 5, 2000
sensitive and accurate method to determine the aqueousconcentrations of individual rhamnolipid components with-out need for prior derivatization.
Batch Adsorption Experiments. Adsorption isothermswere determined for the total surfactant and for the individualcomponents using batch incubations with the Borden andEustis soils (Figures 2 and 3). The isotherms were composedof three regions. Up to 40 µM C20 components (region I), theisotherms were a concave function of concentration. Espe-cially for the Borden material, the adsorbed concentrationof C20RL1 and C20RL2 in the first part of this region wasrather high, indicating strong interactions between rham-nolipid and adsorption sites (Figure 2b). Subsequently, inregion II, the adsorbed concentrations showed a morepronounced increase with increasing aqueous concentration,indicative of secondary interactions between adsorbedsurfactants. The isotherms reached a plateau value atconcentrations of approximately 300 µM C20 components(region III). Region I and II could not as well be distinguishedwith the Eustis soil as with the Borden material.
The composition of the surfactant remaining in solutionchanged due to preferential adsorption of the hydrophobic
components. For instance, the mole fractions of C18RL2,C18RL1, C20RL2, C20RL1, C22:1RL2, and C22RL2 in themixture that remained in solution after adsorption to Bordensoil at an aqueous surfactant concentration of 404 µM were0.13, 0.11, 0.62, 0.13, 0.01, and 0.01, respectively. From acomparison with the values for the initial mixture (Table 1),it is apparent that the aqueous phase was enriched with thehydrophilic C18 components and depleted of the relativelyhydrophobic components C20RL1, C22:1RL2, and C22RL2.
The concentration-dependence of the preferential ad-sorption of the hydrophobic components was examined byplotting the ratio of aqueous C20RL1 over total aqueous C20components as a function of the total aqueous concentrationof C20 components (Figure 4). A decrease in this ratioindicates preferential adsorption of the hydrophobic com-ponent C20RL1. For the Borden material, the ratio wasscattered around the initial value when the concentrationsof C20 components were below 40 µM, indicating thatpreferential adsorption was not detected in region I (Figure4A). In region II, this ratio was lower (e.g. 0.24 at 150 µM,Figure 4A) than with the initial mixture (0.34, Table 1). In thethird adsorption region, the ratio of aqueous C20RL1 overtotal aqueous C20 components increased with increasingaqueous surfactant concentration and finally approachedthe initial value. This is due to accumulation in the aqueousphase of all surfactant that is added after the plateau isreached. For the Eustis soil, the ratio was lower than theinitial value for virtually all concentrations (Figure 4B). Theseresults show that the composition of the surfactant in theaqueous phase was influenced by preferential adsorption ofthe more hydrophobic components.
To determine if the onset of micellization was the causeof surfactant adsorption reaching a plateau, the cmc wasdetermined for a rhamnolipid mixture that remained insolution after adsorption to Borden soil. After adsorption,the aqueous rhamnolipid concentration was 404 µM totalsurfactant (303 µM C20 components), which was close to theconcentration where the adsorption plateau formed (200 µMC20 components, Figure 2B). The cmc of this postadsorptionmixture was 310 ( 21 µM (232 µM C20 components) (Figure5). This indicates that micelles started to form at theconcentration where the adsorption plateau was reachedand suggests that the occurrence of the plateau was indeedcaused by formation of micelles.
The cmc of the postadsorption mixture was significantlyhigher than the cmc of the initial surfactant mixture, whichwas 148 ( 15 µM (114 µM C20 components) (Figure 5). Thedifference in cmc was presumably caused by the removal ofthe more hydrophobic components from the mixture bypreferential adsorption. The dependence of the cmc ofrhamnolipid mixtures on their composition is confirmed bythe observation that the cmc of a separately producedrhamnolipid batch with lower amounts of C18 componentsand higher amounts of C22 components was reduced to 77( 6 µM (mole fractions for C18RL2, C18RL1, C20RL2, C20RL1,C22:1RL2, and C22RL2 were 0.04, 0.06, 0.57, 0.19, 0.08, and0.05, respectively).
Column Studies. The adsorption of the multicomponentsurfactant to Eustis soil and Borden aquifer material wasalso studied under continuous flow conditions using columnexperiments. The hydrodynamic properties of the columnswere determined with pentafluorobenzoic acid as a con-servative tracer. The breakthrough curves of this tracer weresigmoidal in shape and showed no tailing. Peclet numbersfor the conservative tracer were greater than 100 for allcolumns. This indicates that physical nonequilibrium effectswere absent and that the columns were packed homoge-neously.
Breakthrough curves of total surfactant and of theindividual components were determined for both soils using
FIGURE 6. Breakthrough curve of rhamnolipid through Borden soil.From the time indicated by an arrow, elution was continued witha rhamnolipid-free solution. (A) C0 ) 850 µM; (B) C0 ) 34 µM.Symbols: (b) Total surfactant as determined by surface tension;(O) total surfactant as calculated from four of the individualcomponents; (4) C20RL2; (3) C20RL1; (]) C18RL2; (0) C18RL1; (solidline, right Y-axis) PFBA.
FIGURE 7. Breakthrough curve of rhamnolipid through Eustis soil.Details are described in the legend of Figure 6.
VOL. 34, NO. 5, 2000 / ENVIRONMENTAL SCIENCE & TECHNOLOGY 9 835
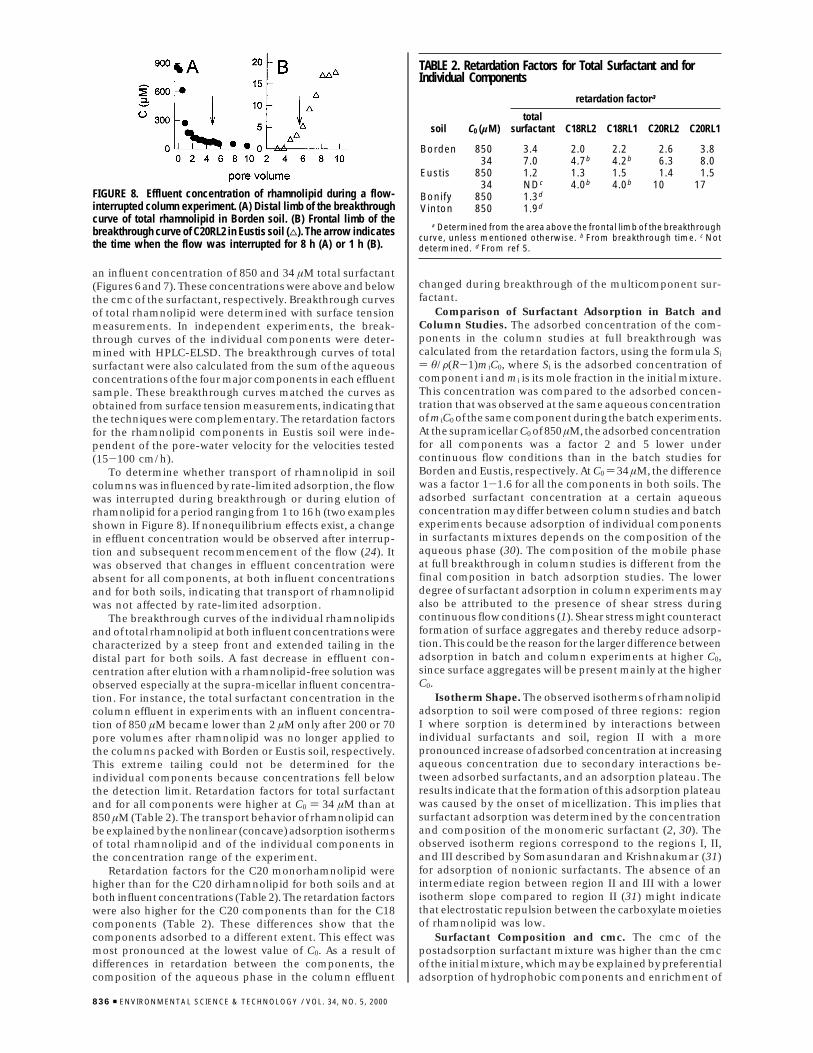
an influent concentration of 850 and 34 µM total surfactant(Figures 6 and 7). These concentrations were above and belowthe cmc of the surfactant, respectively. Breakthrough curvesof total rhamnolipid were determined with surface tensionmeasurements. In independent experiments, the break-through curves of the individual components were deter-mined with HPLC-ELSD. The breakthrough curves of totalsurfactant were also calculated from the sum of the aqueousconcentrations of the four major components in each effluentsample. These breakthrough curves matched the curves asobtained from surface tension measurements, indicating thatthe techniques were complementary. The retardation factorsfor the rhamnolipid components in Eustis soil were inde-pendent of the pore-water velocity for the velocities tested(15-100 cm/h).
To determine whether transport of rhamnolipid in soilcolumns was influenced by rate-limited adsorption, the flowwas interrupted during breakthrough or during elution ofrhamnolipid for a period ranging from 1 to 16 h (two examplesshown in Figure 8). If nonequilibrium effects exist, a changein effluent concentration would be observed after interrup-tion and subsequent recommencement of the flow (24). Itwas observed that changes in effluent concentration wereabsent for all components, at both influent concentrationsand for both soils, indicating that transport of rhamnolipidwas not affected by rate-limited adsorption.
The breakthrough curves of the individual rhamnolipidsand of total rhamnolipid at both influent concentrations werecharacterized by a steep front and extended tailing in thedistal part for both soils. A fast decrease in effluent con-centration after elution with a rhamnolipid-free solution wasobserved especially at the supra-micellar influent concentra-tion. For instance, the total surfactant concentration in thecolumn effluent in experiments with an influent concentra-tion of 850 µM became lower than 2 µM only after 200 or 70pore volumes after rhamnolipid was no longer applied tothe columns packed with Borden or Eustis soil, respectively.This extreme tailing could not be determined for theindividual components because concentrations fell belowthe detection limit. Retardation factors for total surfactantand for all components were higher at C0 ) 34 µM than at850 µM (Table 2). The transport behavior of rhamnolipid canbe explained by the nonlinear (concave) adsorption isothermsof total rhamnolipid and of the individual components inthe concentration range of the experiment.
Retardation factors for the C20 monorhamnolipid werehigher than for the C20 dirhamnolipid for both soils and atboth influent concentrations (Table 2). The retardation factorswere also higher for the C20 components than for the C18components (Table 2). These differences show that thecomponents adsorbed to a different extent. This effect wasmost pronounced at the lowest value of C0. As a result ofdifferences in retardation between the components, thecomposition of the aqueous phase in the column effluent
changed during breakthrough of the multicomponent sur-factant.
Comparison of Surfactant Adsorption in Batch andColumn Studies. The adsorbed concentration of the com-ponents in the column studies at full breakthrough wascalculated from the retardation factors, using the formula Si
) θ/F(R-1)miC0, where Si is the adsorbed concentration ofcomponent i and mi is its mole fraction in the initial mixture.This concentration was compared to the adsorbed concen-tration that was observed at the same aqueous concentrationof miC0 of the same component during the batch experiments.At the supramicellar C0 of 850 µM, the adsorbed concentrationfor all components was a factor 2 and 5 lower undercontinuous flow conditions than in the batch studies forBorden and Eustis, respectively. At C0 ) 34 µM, the differencewas a factor 1-1.6 for all the components in both soils. Theadsorbed surfactant concentration at a certain aqueousconcentration may differ between column studies and batchexperiments because adsorption of individual componentsin surfactants mixtures depends on the composition of theaqueous phase (30). The composition of the mobile phaseat full breakthrough in column studies is different from thefinal composition in batch adsorption studies. The lowerdegree of surfactant adsorption in column experiments mayalso be attributed to the presence of shear stress duringcontinuous flow conditions (1). Shear stress might counteractformation of surface aggregates and thereby reduce adsorp-tion. This could be the reason for the larger difference betweenadsorption in batch and column experiments at higher C0,since surface aggregates will be present mainly at the higherC0.
Isotherm Shape. The observed isotherms of rhamnolipidadsorption to soil were composed of three regions: regionI where sorption is determined by interactions betweenindividual surfactants and soil, region II with a morepronounced increase of adsorbed concentration at increasingaqueous concentration due to secondary interactions be-tween adsorbed surfactants, and an adsorption plateau. Theresults indicate that the formation of this adsorption plateauwas caused by the onset of micellization. This implies thatsurfactant adsorption was determined by the concentrationand composition of the monomeric surfactant (2, 30). Theobserved isotherm regions correspond to the regions I, II,and III described by Somasundaran and Krishnakumar (31)for adsorption of nonionic surfactants. The absence of anintermediate region between region II and III with a lowerisotherm slope compared to region II (31) might indicatethat electrostatic repulsion between the carboxylate moietiesof rhamnolipid was low.
Surfactant Composition and cmc. The cmc of thepostadsorption surfactant mixture was higher than the cmcof the initial mixture, which may be explained by preferentialadsorption of hydrophobic components and enrichment of
FIGURE 8. Effluent concentration of rhamnolipid during a flow-interrupted column experiment. (A) Distal limb of the breakthroughcurve of total rhamnolipid in Borden soil. (B) Frontal limb of thebreakthrough curve of C20RL2 in Eustis soil (4). The arrow indicatesthe time when the flow was interrupted for 8 h (A) or 1 h (B).
TABLE 2. Retardation Factors for Total Surfactant and forIndividual Components
retardation factora
soil C0 (µM)total
surfactant C18RL2 C18RL1 C20RL2 C20RL1
Borden 850 3.4 2.0 2.2 2.6 3.834 7.0 4.7b 4.2b 6.3 8.0
Eustis 850 1.2 1.3 1.5 1.4 1.534 NDc 4.0b 4.0b 10 17
Bonify 850 1.3d
Vinton 850 1.9d
a Determined from the area above the frontal limb of the breakthroughcurve, unless mentioned otherwise. b From breakthrough time. c Notdetermined. d From ref 5.
836 9 ENVIRONMENTAL SCIENCE & TECHNOLOGY / VOL. 34, NO. 5, 2000
the less hydrophobic components in the aqueous phase. Thecmc of surfactant mixtures usually is determined by theindividual cmc values of the components, by their molefractions, and by their activity coefficients (32). Since thecmc of a surface active compound generally increases withdecreasing hydrophobicity (33, 34), the critical micelleconcentration of a surfactant mixture increases when themixture is enriched in hydrophilic components.
Nature of the Adsorption Process. Adsorption of rham-nolipid to soils in region II and III was not primarilydetermined by the soil organic carbon content. For example,the amount of rhamnolipid adsorbed at the plateau regionin the batch experiments was not dependent on the organiccarbon content of the soils since the amount of surfactantadsorbed per amount of organic carbon differed 10-fold forBorden and Eustis soil, with values of 2.2 and 0.20 mgsurfactant/mg organic matter, respectively. Similarly, theretardation factors for total rhamnolipid at C0 ) 850 µM forthe Borden material and Eustis soil (this study) and for Bonifyand Vinton soil (5) were not correlated with the organiccarbon content of these four soils (Table 2). Bonify and Vintonsoil are sandy soils with an organic carbon content of 0.36%and 0.09%, respectively. The anionic character of the rham-nolipid surfactants might counteract partitioning into thenegatively charged humic matter. Adsorption of an alcoholethoxylate and alkylbenzene sulfonates to sediments wasalso not correlated to the soil organic carbon content (35,36). In contrast, sorption of hydrophobic organic compoundsto soil is often determined by the soil organic matter contentand is therefore assumed to be a partitioning process insteadof an adsorption process (37). Sorption of phenanthrene tothe four soils mentioned here was indeed correlated to thesoil organic matter content (5). These results imply thatadsorption of rhamnolipid was an adsorption processoccurring at the soil-water interface and not a partitioningprocess into soil organic matter. Primary interactions betweenthe first adsorbed surfactant layer and soil might result fromion exchange reactions involving the anionic carboxylatemoiety of the surfactant, surface complexation, or hydrogenbonding interactions involving the rhamnose headgroups(31).
Both in the batch and column studies, the adsorptivity ofthe components (defined as the percentage that was ad-sorbed) corresponded to the relative retention times of the(protonated) components in the isocratic reversed-phaseHPLC system in the order of C18RL2 < C18RL1 < C20RL2< C20RL1 (Figure 1, Table 1). The increase of adsorptivity ofthe components with increasing hydrophobicity suggests thatadsorption of rhamnolipid components was driven byhydrophobic interactions. However, the lower mole fractionof C20RL1 than for C20RL2 in the initial mixture may alsocause adsorption of C20RL1 to be relatively larger than forC20RL2 since the overall shapes of the isotherms wereconcave. A correlation between the degree of (preferential)adsorption of nonionic and anionic surfactant componentsand their hydrophobicity has also been observed for adsorp-tion to soil (9) and to sediment (35, 36). Furthermore,hydrophobic interactions determined the concentrationwhere region II started for isotherms adsorption nonionicsurfactants on silica (31, 34, 38). Thermodynamic analysis ofsurfactant adsorption also indicates that hydrophobic in-teractions play an important role during adsorption ofsurfactants (34, 39, 40). The positive correlation of theadsorptivity of the rhamnolipid components with theirhydrophobicity, and the absence of a positive correlationbetween the degree of adsorption and the soil organic mattercontent, suggests that adsorption of rhamnolipid to soil inregions II and III involved the formation of surface aggregates,such as hemimicelles or admicelles. These types of aggregateshave been observed with AFM for adsorption of other
surfactants containing two headgroups and two tails (geminisurfactants) (17).
The results from this study indicate that rhamnolipidadsorption to soil is an interfacial adsorption process whichis driven by hydrophobic interactions between the rham-nolipid components. The adsorption of total surfactant andof the individual components increased with increasing totalaqueous surfactant concentration up to a level where micellesstarted to form. Due to preferential adsorption, the com-position of surfactant mixture remaining in the aqueousphase changed, both in the batch and column experiments.The changes in composition of the multicomponent sur-factant due to adsorption affected the cmc of the surfactantmixture, and potentially also the solubilizing or emulsifyingproperties. To avoid the occurrence of changes of composi-tion during application of mixed surfactants for enhancedoil recovery or soil remediation, high surfactant concentra-tions (.cmc) should preferably be used. Due to the overallconcave shape of the adsorption isotherms, both relativesurfactant losses and changes in composition will then beminimal.
AcknowledgmentsThis research was funded by the Dutch IOP EnvironmentalBiotechnology Program (Contract IOP91224). W.H.N. ac-knowledges the Dutch Program for Integrated Soil Researchfor a travelling grant (Project Number 35037-191).
Literature Cited(1) Kwok, W.; Hayes, R. E.; Nasr-el-din, H. A. Can. J. Chem. Eng.
1995, 73, 705-716.(2) Mannhardt, K.; Novosad, J. J. Chem. Eng. Sci. 1991, 46, 75-83.(3) Jawitz, J. W.; Annable, M. D.; Rao, P. S. C.; Rhue, R. D. Environ.
Sci. Technol. 1998, 32, 523-530.(4) West, C. C.; Harwell, J. H. Environ. Sci. Technol. 1992, 26, 2324-
2330.(5) Noordman, W. H.; Ji, W.; Brusseau, M. L.; Janssen, D. B. Environ.
Sci. Technol. 1998, 32, 1806-1812.(6) Torrens, J. L.; Herman, D. C.; Miller, R. M. Environ. Sci. Technol.
1998, 32, 776-781.(7) Edwards, D. A.; Adeel, Z.; Luthy, R. G. Environ. Sci. Technol.
1994, 28, 1550-1560.(8) Nakae, A.; Tsuji, K.; Yamanaka, M. Anal. Chem. 1981, 53, 1818-
1821.(9) Kibbey, T. C. G.; Hayes, K. F. Environ. Sci. Technol. 1997, 31,
1171-1177.(10) Passeri, A.; Lang, S.; Wagner, F.; Wray, V. Z. Naturforsch. C 1991,
46, 204-209.(11) Kitamoto, D.; Yanagishita, H.; Shinbo, T.; Nakane, T.; Kamisawa,
C.; Nakahara, T. J. Biotechnol. 1993, 29, 91-96.(12) Jenny, K.; Kappeli, O.; Fiechter, A. Appl. Microbiol. Biotechnol.
1991, 36, 5-13.(13) Rendell, N. B.; Taylor, G. W.; Somerville, M.; Todd, H.; Wilson,
R.; Cole, P. J. Biochim. Bioph. Acta 1990, 1045, 189-193.(14) Davila, A. M.; Marchal, R.; Monin, N.; Vandecasteele, J. P. J.
Chromatogr. 1993, 648, 139-149.(15) Van-Dyke, M. I.; Couture, P.; Brauer, M.; Lee, H.; Trevors, J. T.
Can. J. Microbiol. 1993, 39, 1071-1078.(16) Itoh, S.; Honda, H.; Tomita, F.; Suzuki, T. J. Antibiot. 1971, 24,
855-859.(17) Manne, S.; Schaffer, T. E.; Huo, Q.; Hansma, P. K.; Morse, D. E.;
Stucky, G. D.; Aksay, I. A. Langmuir 1997, 13, 6382-6387.(18) Velikonja, J.; Kosaric, N. In Biosurfactants; Surfactant science
series 48; Kosaric, N., Ed.; Marcel Dekker: New York, 1994; pp419-446.
(19) Stanghellini, M. E.; Miller, R. M. Plant Disease 1997, 81, 4-12.(20) Linhardt, R. J.; Bakhit, R.; Daniels, L.; Mayerl, F.; Pickenhagen,
W. Biotechnol. Bioeng. 1989, 33, 365.(21) Zhang, Y.; Miller, R. M. Appl. Environ. Microbiol. 1992, 58, 3276-
3282.(22) Rao, P. S. C.; Davidson, J. M.; Jessup, R. E.; Selim, H. M. Soil Sci.
Soc. Am. J. 1979, 43, 22-28.(23) Ball, W. P.; Roberts, P. V. Environ. Sci. Technol. 1991, 25, 1223-
1237.(24) Brusseau, M. L.; Rao, P. S. C.; Jessup, R. E.; Davidson, J. M. J.
Contam. Hydrol. 1989, 4, 223-240.
VOL. 34, NO. 5, 2000 / ENVIRONMENTAL SCIENCE & TECHNOLOGY 9 837
(25) Chandrasekaran, E. V.; BeMiller, J. N. In Methods in CarbohydrateChemistry; Whistler, R. L., BeMiller, J. N., Eds.; Academic Press:New York, 1980; Vol. 8, pp 89-96.
(26) Parker, J. C.; Van Genuchten, M. T. Determining transportparameters from laboratory and field tracer experiments; Bulletin84-3; Virginia agricultural experiment station: Blacksburg, 1984.
(27) Arino, S.; Marchal, R.; Vandecasteele, J.-P. Appl. Microbiol.Biotechnol. 1996, 45, 162-168.
(28) Bear, G. R. J. Chromatogr. 1988, 459, 91-107.(29) Lageveen, R. G.; Huisman, G. W.; Preusting, H.; Ketelaar, P.;
Eggink, G.; Witholt, B. Appl. Environ. Microbiol. 1988, 54, 2924-2932.
(30) Trogus, F. J.; Schechter, R. S.; Wade, W. H. J. Colloid InterfaceSci. 1979, 70, 293-305.
(31) Somasundaran, P.; Krishnakumar, S. Colloids Surf. A 1997, 123-124, 491-513.
(32) Nishikido, N. In Surfactant science series; Ogino, K., Abe, M.,Eds.; Marcel Dekker: New York, 1993; Vol. 46, Mixed surfactantsystems, pp 23-63.
(33) Physicochemical properties of selected anionic, cationic, andnonionic surfactants; Van Os, N. M., Haak, J. R., Rupert, L. A.M., Eds.; Elsevier: Amsterdam, 1993.
(34) Somasundaran, P.; Healy, T. W.; Fuerstenau, D. W. J. Phys. Chem.1964, 68, 3562-3566.
(35) Cano, M. L.; Dorn, P. B. Environ. Toxicol. Chem. 1996, 15, 684-690.
(36) Hand, V. C.; Williams, G. K. Environ. Sci. Technol. 1987, 21,370-373.
(37) Schwarzenbach, R. P.; Gschwend, P. M.; Imboden, D. M.Environmental Organic Chemistry, 1st ed.; John Wiley & Sons:New York, 1993.
(38) Portet, F.; Desbene, P. L.; Treiner, C. J. Colloid Interface Sci.1996, 184, 216-226.
(39) Kronberg, B.; Costas, M.; Silveston, R. Pure Appl. Chem 1995,67, 897-902.
(40) Mehrian, T.; De Keizer, A.; Korteweg, A. J.; Lyklema, J. ColloidsSurf. A 1993, 73, 133-143.
Received for review August 30, 1999. Revised manuscriptreceived December 3, 1999. Accepted December 7, 1999.
ES9909982
838 9 ENVIRONMENTAL SCIENCE & TECHNOLOGY / VOL. 34, NO. 5, 2000