adult social care in england: policy ... - gtc homepage · adult social care in england: policy,...
TRANSCRIPT

Adult Social Care in England: Policy, Spending and
Outcomes 2010-2015
Tania Burchardt,Polina Obolenskaya and Polly Vizard
Centre for Analysis of Social Exclusion
London School of Economics

Outline
• Coalition government’s inheritance
• Goals and policies
• Resources
• Outputs
• Outcomes
• Challenges for the current government

The Coalition inherited a system already under pressure
• Increasing life expectancy
• Increasing numbers of physically and cognitively impaired young people surviving into adulthood
• Multiple boundaries in financing and provision of social care: • NHS and local authorities
• universal, means-tested and needs-tested support
• individuals, families and the state
• residential and community care; direct payments
• public, not-for-profit and private providers
• Emerging concerns over care quality
Goals and policies• “Wherever possible, we want people to call the shots
over the decisions that affect their lives”
• “completely recast the relationship between people and the state: citizens empowered; individual opportunity extended; communities coming together to make lives better”
• “a much stronger society: one where those who can, do; and those who cannot, we always help”
... and cutting the deficit!

Box 1: The Coalition Agreement and party manifestos
Social care received little attention in the Coalition Agreement. Shared policies are underlined below; clauses in bold type stem entirely from the Lib Dems, while those in italics are solely from the Conservatives.
We will establish a commission on long-term care, to report within a year. The commission will consider a range of ideas, including both a voluntary insurance scheme to protect the assets of those who go into residential care, and a partnership scheme as proposed by Derek Wanless.
We will break down barriers between health and social care funding to incentivise preventative action.
We will extend the greater roll-out of personal budgets to give people and their carers more control and purchasing power.
We will use direct payments to carers and better community-based provision to improve access to
respite care.
There were no specific Conservative manifesto commitments that did not make it into the Coalition Agreement, although they had wanted voluntary insurance rather than a commission on future funding. In two areas, Lib Dem manifesto commitments were included but in a weaker form than originally expressed: to ‘Integrate health and social care to create a seamless service', and 'provide guaranteed respite care for the one million carers who work the longest hours’.

Local authorities responsible for
continuity of care when providers
cease to function
Adult social care policy timeline
Commission
on Funding of
Care and
Support (Dilnot
Commission)
2014 2015
National Dementia Strategy for England
Stronger statutory basis for Adult Safeguarding Boards
Changes to the right to request flexible working
Extension of statutory rights of carers to social services support
Health and Well-Being Boards (Health and Social Care Act 2012)
‘Putting People First’ vision for future of social care
More pooling of existing NHS and social care resources (Better Care Fund – delayed implementation)
Valuing People Now (strategy for people with learning disabilities)
Adult Social Care Outcomes Framework
New inspection regime by Care
Quality Commission
2010
New national criteria for social care eligibility based on level of need
National Carers’ Strategy
2016

PoliciesFuture funding• Commission on Funding of Care and Support (Dilnot Commission), 2010-2011• Significant relaxation of capital means test for residential care (announced in March
2013 budget – now postponed)• Lifetime cap on care costs (Care Act 2014, following Dilnot – now postponed)Eligibility criteria• New national criteria for social care eligibility based on levels of need (came into force
April 2015)Integration of health and social care• Health and Well-Being Boards (Health and Social Care Act 2012)• More pooling of existing NHS and social care resources (Care Act 2014; Better Care
Fund)Support for carers• Extension of statutory rights of carers to support from social services (Care Act 2014)• Changes to right to request flexible working (July 2014)Regulation, monitoring and inspection• Stronger statutory basis for Adult Safeguarding Boards (Care Act 2014)• Local authorities responsible for continuity of care (Care Act 2014)• Adult Social Care Outcomes Framework (from 2011)• New inspection regime by Care Quality Commission (from 2013)

Resources
• Total local government funding in England fell by 40 per cent from 2009/10 to 2014/15
• Total local government spending on adult social care fell by 10.3 per cent in real terms
• Total spending on adult social care including NHS joint arrangements and user charges (‘gross total cost’) fell by 7.4 per cent
• Spending on older people fell faster... despite a 10 per cent increase in the number of people aged 65 or over, and a 9 per cent increase in the number of people aged 85 or over

Resources did not match population growth
Population: 65 and over
Population: 85 and over
100
110
120
130
140
150
160
170
1801
99
7/9
8
19
98
/99
19
99
/20
00
20
00
/01
20
01
/02
20
02
/03
20
03
/04
20
04
/05
20
05
/06
20
06
/07
20
07
/08
20
08
/09
20
09
/10
20
10
/11
20
11
/12
20
12
/13
20
13
/14
Ind
ex n
um
ber
s, 1
99
7/9
8=1
00
Labour Govt. Coalition Govt.

Resources did not match population growth
Spending: all
Spending: 65 and over
Population: 65 and over
Population: 85 and over
100
110
120
130
140
150
160
170
1801
99
7/9
8
19
98
/99
19
99
/20
00
20
00
/01
20
01
/02
20
02
/03
20
03
/04
20
04
/05
20
05
/06
20
06
/07
20
07
/08
20
08
/09
20
09
/10
20
10
/11
20
11
/12
20
12
/13
20
13
/14
Ind
ex n
um
ber
s, 1
99
7/9
8=1
00
Labour Govt. Coalition Govt.
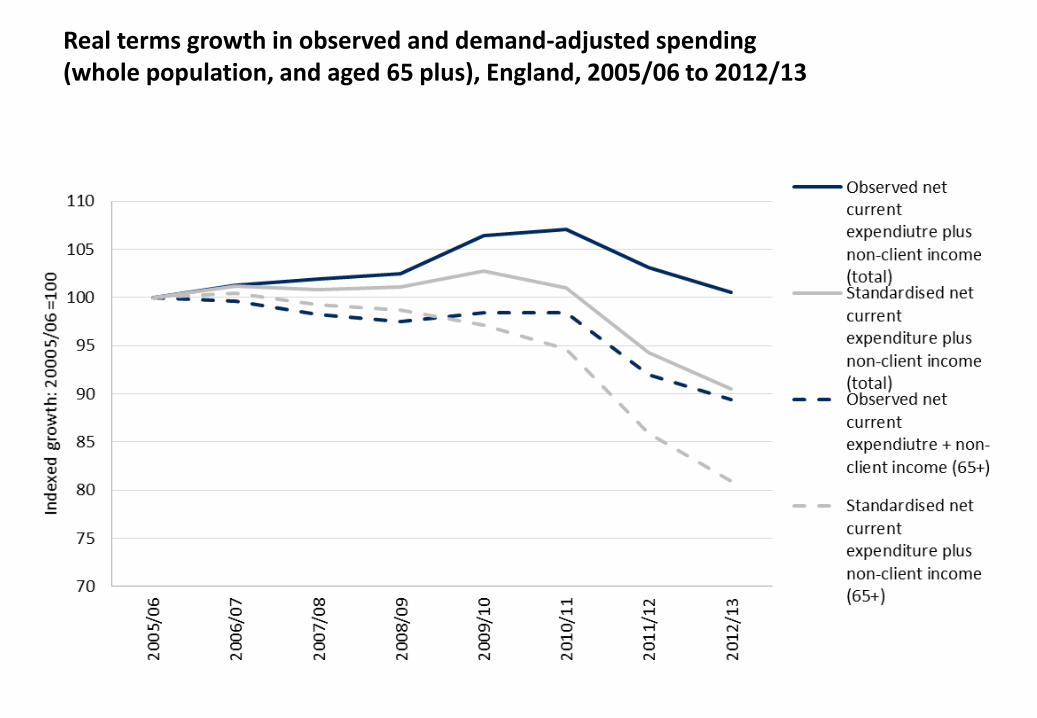
Real terms growth in observed and demand-adjusted spending (whole population, and aged 65 plus), England, 2005/06 to 2012/13

Outputs

1.02m 0.96m
0.87m
0.67m
0.47m 0.51m 0.47m 0.38m
1.49m 1.54m
1.46m
1.34m
1.05m
0
200,000
400,000
600,000
800,000
1,000,000
1,200,000
1,400,000
1,600,000
1,800,000
2005/06 2006/07 2007/08 2008/09 2009/10 2010/11 2011/12 2012/13 2013/14
Nu
mb
er o
f co
mm
un
ity
serv
ice
use
rs
Age 65 and over Age 18 to 64 Total
Less care was providedNumber of people receiving community-based services each year, by age
CoalitionLabour

Falling numbers of community service users
% change 000s of
clients in
2013/14
Age 18-64
2005/06 to
2009/10
2009/10 to
2013/14
Physical disability -1.1 -27.7 143
Mental health 19.0 -36.7 119
Learning disability 7.0 4.0 107
Substance misuse -0.9 -46.4 5
Other vulnerable people 3.8 -35.6 5
Age 65 plus
Physical disability -8.0 -31.3 571
Mental health 26.7 -18.7 78
Learning disability 18.3 22.6 10
Substance misuse -1.4 -20.1 0.5
Other vulnerable people -39.5 -40.4 13

Falling numbers of community service users
% change
Age 18-64
2005/06 to
2009/10
2009/10
to
2013/14
Physical disability -1.1 -27.7
Mental health 19.0 -36.7
Learning disability 7.0 4.0
Substance misuse -0.9 -46.4
Other vulnerable people 3.8 -35.6
Age 65 plus
Physical disability -8.0 -31.3
Mental health 26.7 -18.7
Learning disability 18.3 22.6
Substance misuse -1.4 -20.1
Other vulnerable people -39.5 -40.4

...particularly in mental health
% change
Age 18-64
2005/06 to
2009/10
2009/10
to
2013/14
Physical disability -1.1 -27.7
Mental health 19.0 -36.7
Learning disability 7.0 4.0
Substance misuse -0.9 -46.4
Other vulnerable people 3.8 -35.6
Age 65 plus
Physical disability -8.0 -31.3
Mental health 26.7 -18.7
Learning disability 18.3 22.6
Substance misuse -1.4 -20.1
Other vulnerable people -39.5 -40.4

...and in substance misuse
% change
Age 18-64
2005/06 to
2009/10
2009/10
to
2013/14
Physical disability -1.1 -27.7
Mental health 19.0 -36.7
Learning disability 7.0 4.0
Substance misuse -0.9 -46.4
Other vulnerable people 3.8 -35.6
Age 65 plus
Physical disability -8.0 -31.3
Mental health 26.7 -18.7
Learning disability 18.3 22.6
Substance misuse -1.4 -20.1
Other vulnerable people -39.5 -40.4

Distribution of clients of community-based services by number of hours received per week, England, 2008/09 to 2013/14

Outcomes

ASCOF
• Domain 1: quality of life
• Domain 2: delaying and reducing the need for care
• Domain 3: experience of care and support
• Domain 4: safeguarding vulnerable adults
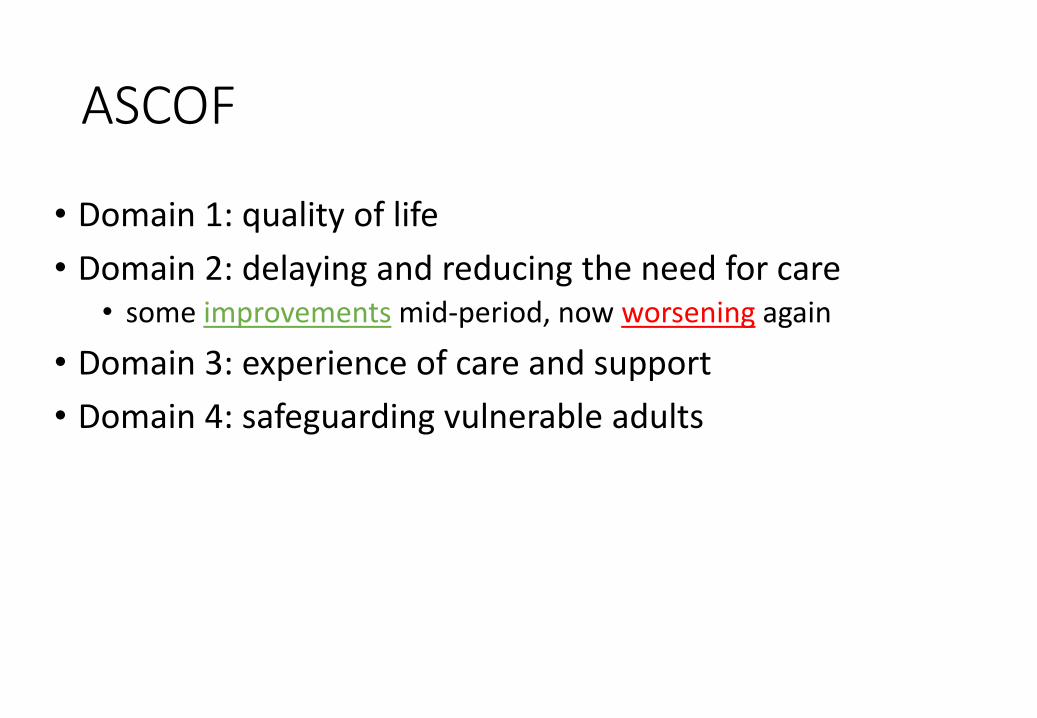
ASCOF
• Domain 1: quality of life
• Domain 2: delaying and reducing the need for care• some improvements mid-period, now worsening again
• Domain 3: experience of care and support
• Domain 4: safeguarding vulnerable adults

Domain 4: safeguarding
• Adult social care users survey: improving (66% feel safe in 2013/14 compared to 62% in 2010/11)
BUT
Year Alerts Referrals
Substantiated or
partially substantiated
(as % of completed
investigations)
2010/11 92,865 95,065 30,365 (41%)
2011/12 133,395 106,165 34,670 (41%)
2012/13 172,130 107,650 37,410 (43%)
2013/14 n/a104,050
individuals43%

Domains 1 and 3: Service users, carers (and ex-users?)
• Quality of life and satisfaction with services of service users has improved (7 indicators out of 11)
• Quality of life and satisfaction with services of carershas deteriorated (4 indicators out of 5)
• Quality of life and satisfaction with services of people who are no longer eligible to receive services ???

Number of unpaid carers, by age group, UK, 2002/3 to 2013/14 (Source: FRS)
0
1
2
3
4
5
6
20
02
/03
20
03
/04
20
04
/05
20
05
/06
20
06
/07
20
07
/08
20
08
/09
20
09
/10
20
10
/11
20
11
/12
20
12
/13
20
13
/14
No
. of
un
pai
d c
arer
s (m
illio
ns)
All
Wkgage
Pens
Child

Population aged 50 and over reporting to be informal carers, around 2007, OECD
8.0 8.7 9.3 9.8 10.3 10.7 10.8 11.0 11.2 11.4 11.7 12.0 12.1
14.6 15.2 15.316.2
0
5
10
15
20
%

Unmet need for care, by age group and number of difficulties, 2007/08 to 2011/12, UK (source: FRS)
0%
10%
20%
30%
40%
50%
60%
70%
80%
90%
100%
16-44 45-59 60-74 75+ Total 16-44 45-59 60-74 75+ Total
Individuals with moderate (1-3) difficulties Individuals with more severe (4+) difficulties
Perc
enta
ge o
f re
spo
nd
ents
wit
h u
nm
et n
eed
fo
r ca
re
2007-08 2009-10 2011-12
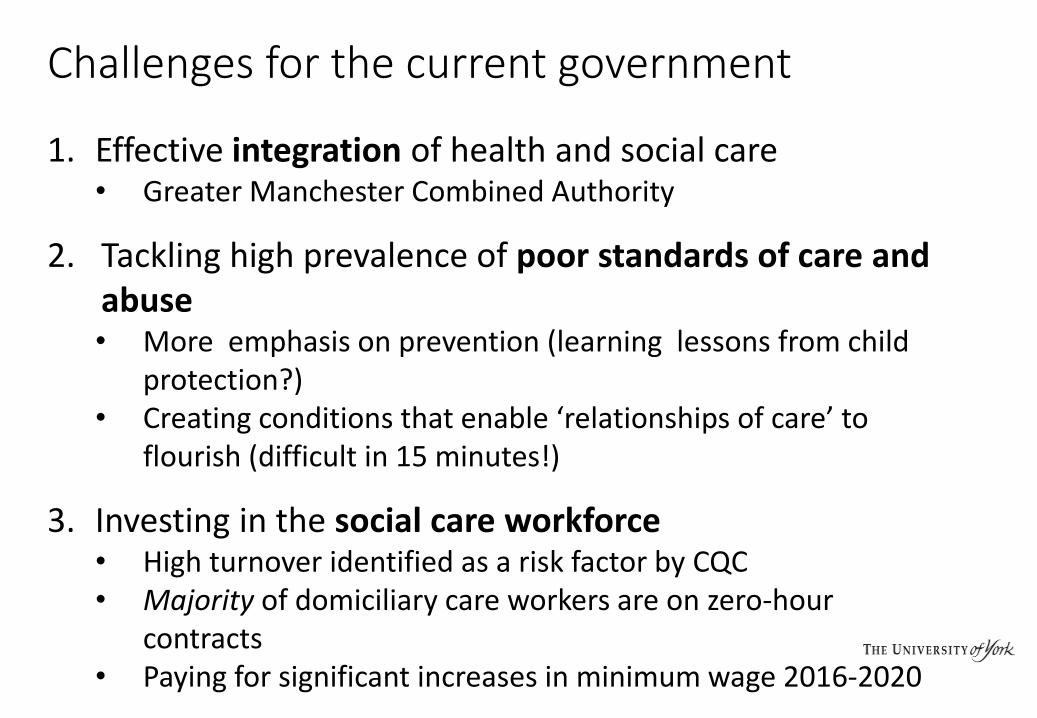
1. Effective integration of health and social care• Greater Manchester Combined Authority
2. Tackling high prevalence of poor standards of care and abuse• More emphasis on prevention (learning lessons from child
protection?)• Creating conditions that enable ‘relationships of care’ to
flourish (difficult in 15 minutes!)
3. Investing in the social care workforce• High turnover identified as a risk factor by CQC• Majority of domiciliary care workers are on zero-hour
contracts• Paying for significant increases in minimum wage 2016-2020
Challenges for the current government

4. Addressing unmet need and relieving pressure on unpaid carers• Shortfall in care expenditure was already £1.5 billion by
2012/13• Dilnot reforms postponed• Rise in number of unpaid carers and intensity of caring is not
sustainable
5. Reconciling further cuts and continued demographic pressure• Local authorities have been successful in affording some
protection to social care but LGA warns further cuts cannot be absorbed without risk to “basic services for vulnerable people”
Challenges for the new government

More need, less money
Projections of total local authority funding and population aged 75 or over, England, 2010 to 2019
40
50
60
70
80
90
100
110
120
130
2010 2011 2012 2013 2014 2015 2016 2017 2018 2019
Ind
ex
, 2
01
0 =
10
0
Populationaged 75+
LGA totalfundingforecast
Sources: ONS and LGA

The Coalition’s record on adult social care: policy, spending and outcomes 2010-2015
SPCC working paper 17http://sticerd.lse.ac.uk/dps/case/spcc/WP17.pdfTania Burchardt, Polina Obolenskaya and Polly Vizard, LSE
Forthcoming April 2016 in Lupton, Hills, Burchardt, Stewart and Vizard (eds) Social Policy in a Cold Climate, Policy Press.