advanced automatic optical blast fragmentation sizing and tracking
TRANSCRIPT

8/8/2019 Advanced Automatic Optical Blast Fragmentation Sizing and Tracking
http://slidepdf.com/reader/full/advanced-automatic-optical-blast-fragmentation-sizing-and-tracking 1/9
259
1 INTRODUCTION
1.1 Optical sizing
Size distribution is a critical component of managing any mining operation, from the drilling
and blasting to the final product; the material size
dictates all downstream operating costs.
Previously, the only way to measure a size
distribution was to stop production, manually
collect a sample, pass the sample through a battery
of screens, weigh the material on each screen and
plot the data on a granulation curve to reflect what
size the material was at the time of sampling. This
method is slow, cumbersome, disruptive and
impractical for the sizing of blasted material where
the particles can range in size from microns to
meters. Even though sieve analysis offers a high
degree of precision and accuracy within the
sample, the sample size is traditionally very small,
making the results much less representative.
In 1987 the WipFrag photoanalysis system was
developed to characterize the size distribution of
blasted material. This system was the first of its
kind of optical sizing system, and offered
significant advantages over preceding methods
such as speed and ease of use. It was non-
disruptive and practical for sizing any material that
could be successfully imaged, including blasted
material.
Since then, photoanalysis has been used in anumber of applications around the world, such as
the analysis of muck piles, conveyor belts, surge
bins and, most recently, vehicle conveyances. This
technical paper describes the evolution of this
technology into case-specific applications of
automated vehicle conveyance analysis.
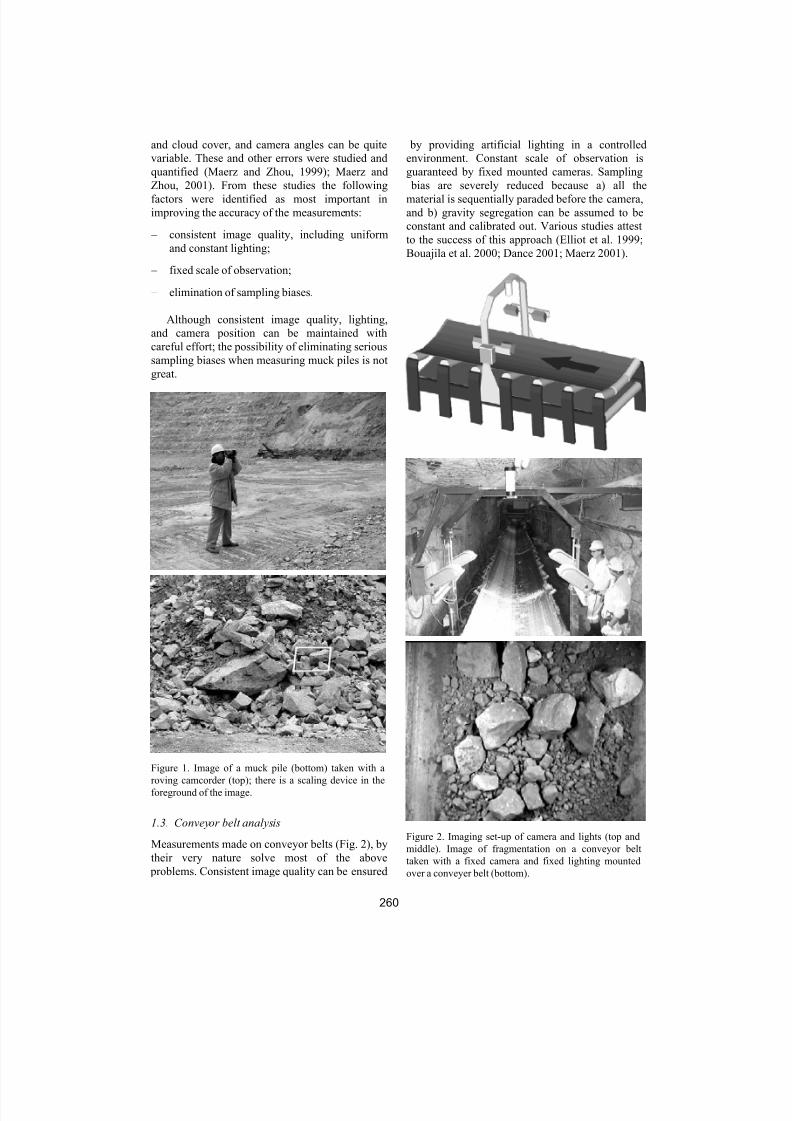
1.2 Muck pile analysis
Automated sizing analysis of muck piles has
been done for many years (Fig. 1). A review is
given by Franklin et al. (1996). The WipFrag
System first proposed in 1987 (Maerz et al. 1987)
and commercialized in 1996 (Maerz et al., 1996),
was initially used primarily to characterize the size
distribution of muck piles. Various studies attest to
the success of this approach (Bartley and
Trousselle 1998; Chiappetta 1998, Ethier et al.
1999; Barkley and Carter 1999; Palangio and
Maerz 1999).
Still, muck piles are inhomogeneous, natural
lighting conditions vary, depending on sun angle
Advanced automatic optical blast fragmentation sizing and tracking
T.W. Palangio & T.C. Palangio
WipWare Inc, Bonfield Ontario, Canada
N. MaerzUniversity of Missouri-Roll, Rolla, MO, USA, and WipWare Inc, Bonfield Ontario, Canada
ABSTRACT: Sizing of blast fragmentation using digital image analysis has proven an effective way to
evaluate the results of blasting technique. Image analysis methods like WipWares’s WipFrag system work
best under controlled conditions like over moving conveyor belts, where camera angles and distances can
be held constant, lighting can be controlled, and sampling errors can be kept to a minimum. However,once the fragmentation is on the belt, it has usually passed through a primary crusher and is no longer
completely indicative of the blasting process. In practice, for many operations, this means that the best
measurements can be made by imaging the rock while in transit between the muck pile and the primary
crushing station. This includes surface and underground HD (Haul Dump) and LHD (Load Haul Dump)
type vehicles which can be images as they dump, or prepare to dump, or as they pass through a gate or
other restriction.
Brighton Conference Proceedings 2005, R. Holmberg et al © 2005 European Federation of Explosives Engineers, ISBN 0-9550290-0-7
8/8/2019 Advanced Automatic Optical Blast Fragmentation Sizing and Tracking
http://slidepdf.com/reader/full/advanced-automatic-optical-blast-fragmentation-sizing-and-tracking 2/9
260
and cloud cover, and camera angles can be quite
variable. These and other errors were studied and
quantified (Maerz and Zhou, 1999); Maerz and
Zhou, 2001). From these studies the following
factors were identified as most important inimproving the accuracy of the measurements:
− consistent image quality, including uniform
and constant lighting;
− fixed scale of observation;
− elimination of sampling biases.
Although consistent image quality, lighting,
and camera position can be maintained with
careful effort; the possibility of eliminating serious
sampling biases when measuring muck piles is not
great.
Figure 1. Image of a muck pile (bottom) taken with a
roving camcorder (top); there is a scaling device in the
foreground of the image.
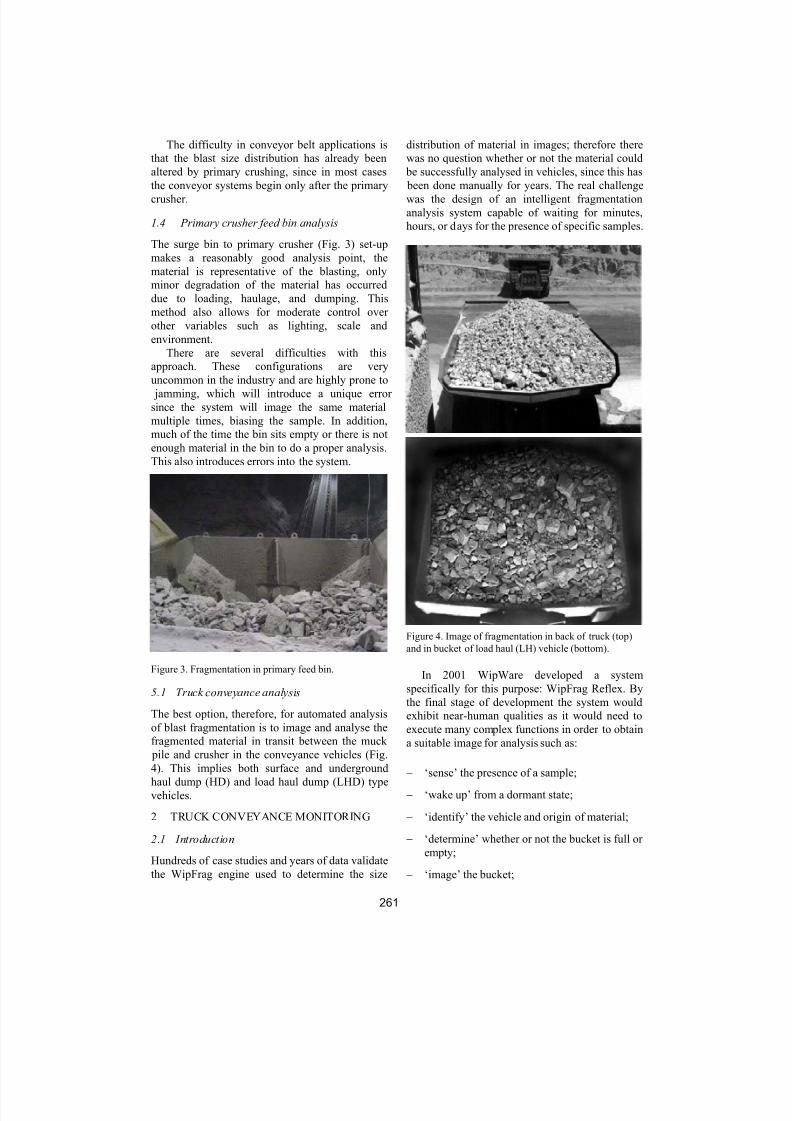
1.3. Conveyor belt analysis
Measurements made on conveyor belts (Fig. 2), by
their very nature solve most of the above
problems. Consistent image quality can be ensured
by providing artificial lighting in a controlled
environment. Constant scale of observation is
guaranteed by fixed mounted cameras. Sampling
bias are severely reduced because a) all the
material is sequentially paraded before the camera,and b) gravity segregation can be assumed to be
constant and calibrated out. Various studies attest
to the success of this approach (Elliot et al. 1999;
Bouajila et al. 2000; Dance 2001; Maerz 2001).
Figure 2. Imaging set-up of camera and lights (top and
middle). Image of fragmentation on a conveyor belt
taken with a fixed camera and fixed lighting mounted
over a conveyer belt (bottom).
8/8/2019 Advanced Automatic Optical Blast Fragmentation Sizing and Tracking
http://slidepdf.com/reader/full/advanced-automatic-optical-blast-fragmentation-sizing-and-tracking 3/9
261
The difficulty in conveyor belt applications is
that the blast size distribution has already been
altered by primary crushing, since in most cases
the conveyor systems begin only after the primary
crusher.
1.4 Primary crusher feed bin analysis
The surge bin to primary crusher (Fig. 3) set-up
makes a reasonably good analysis point, the
material is representative of the blasting, only
minor degradation of the material has occurred
due to loading, haulage, and dumping. This
method also allows for moderate control over
other variables such as lighting, scale and
environment.
There are several difficulties with this
approach. These configurations are very
uncommon in the industry and are highly prone to
jamming, which will introduce a unique error since the system will image the same material
multiple times, biasing the sample. In addition,
much of the time the bin sits empty or there is not
enough material in the bin to do a proper analysis.
This also introduces errors into the system.
Figure 3. Fragmentation in primary feed bin.
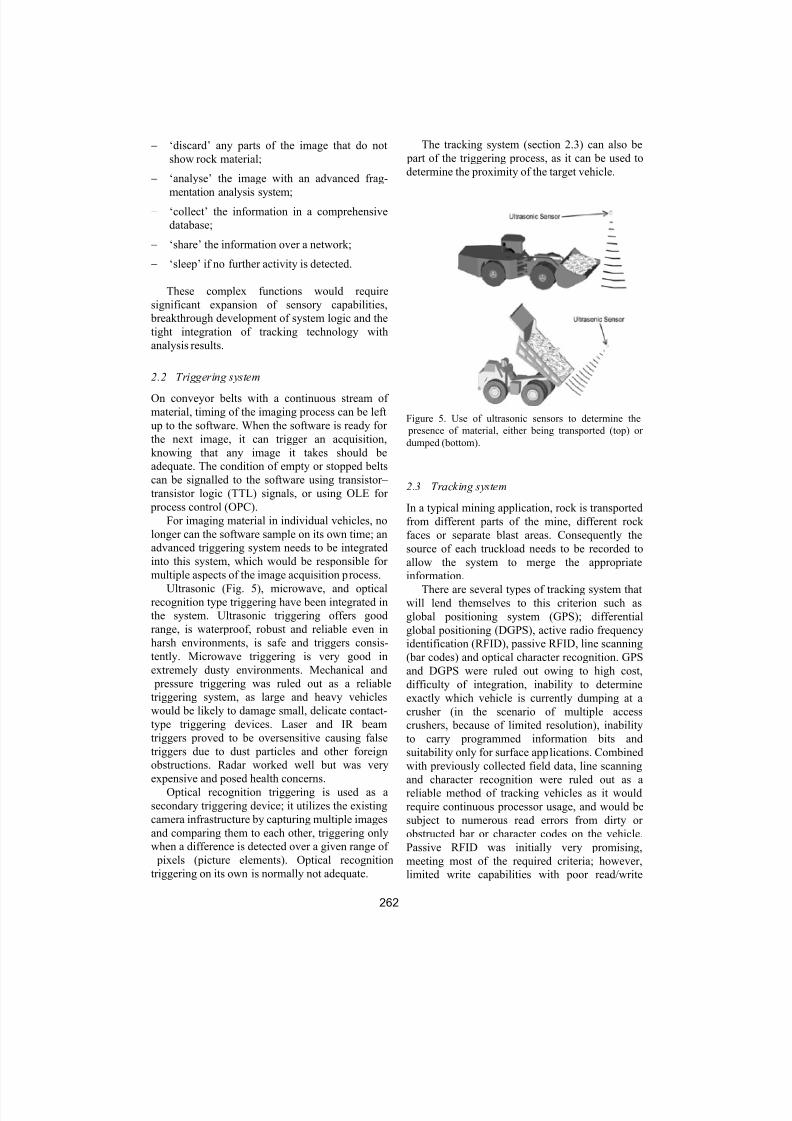
5.1 Truck conveyance analysis
The best option, therefore, for automated analysis
of blast fragmentation is to image and analyse the
fragmented material in transit between the muck
pile and crusher in the conveyance vehicles (Fig.
4). This implies both surface and underground
haul dump (HD) and load haul dump (LHD) typevehicles.
2 TRUCK CONVEYANCE MONITORING
2.1 Introduction
Hundreds of case studies and years of data validate
the WipFrag engine used to determine the size
distribution of material in images; therefore there
was no question whether or not the material could
be successfully analysed in vehicles, since this has
been done manually for years. The real challenge
was the design of an intelligent fragmentationanalysis system capable of waiting for minutes,
hours, or days for the presence of specific samples.
Figure 4. Image of fragmentation in back of truck (top)
and in bucket of load haul (LH) vehicle (bottom).
In 2001 WipWare developed a system
specifically for this purpose: WipFrag Reflex. By
the final stage of development the system would
exhibit near-human qualities as it would need to
execute many complex functions in order to obtain
a suitable image for analysis such as:
− ‘sense’ the presence of a sample;
− ‘wake up’ from a dormant state;
− ‘identify’ the vehicle and origin of material;
− ‘determine’ whether or not the bucket is full or
empty;
− ‘image’ the bucket;
8/8/2019 Advanced Automatic Optical Blast Fragmentation Sizing and Tracking
http://slidepdf.com/reader/full/advanced-automatic-optical-blast-fragmentation-sizing-and-tracking 4/9
262
− ‘discard’ any parts of the image that do not
show rock material;
− ‘analyse’ the image with an advanced frag-
mentation analysis system;− ‘collect’ the information in a comprehensive
database;
− ‘share’ the information over a network;
− ‘sleep’ if no further activity is detected.
These complex functions would require
significant expansion of sensory capabilities,
breakthrough development of system logic and the
tight integration of tracking technology with
analysis results.
2.2 Triggering system
On conveyor belts with a continuous stream of
material, timing of the imaging process can be left
up to the software. When the software is ready for
the next image, it can trigger an acquisition,
knowing that any image it takes should be
adequate. The condition of empty or stopped belts
can be signalled to the software using transistor–
transistor logic (TTL) signals, or using OLE for
process control (OPC).
For imaging material in individual vehicles, no
longer can the software sample on its own time; an
advanced triggering system needs to be integrated
into this system, which would be responsible for
multiple aspects of the image acquisition process.
Ultrasonic (Fig. 5), microwave, and opticalrecognition type triggering have been integrated in
the system. Ultrasonic triggering offers good
range, is waterproof, robust and reliable even in
harsh environments, is safe and triggers consis-
tently. Microwave triggering is very good in
extremely dusty environments. Mechanical and
pressure triggering was ruled out as a reliable
triggering system, as large and heavy vehicles
would be likely to damage small, delicate contact-
type triggering devices. Laser and IR beam
triggers proved to be oversensitive causing false
triggers due to dust particles and other foreign
obstructions. Radar worked well but was very
expensive and posed health concerns.
Optical recognition triggering is used as a
secondary triggering device; it utilizes the existing
camera infrastructure by capturing multiple images
and comparing them to each other, triggering only
when a difference is detected over a given range of
pixels (picture elements). Optical recognition
triggering on its own is normally not adequate.
The tracking system (section 2.3) can also be
part of the triggering process, as it can be used to
determine the proximity of the target vehicle.
Figure 5. Use of ultrasonic sensors to determine the
presence of material, either being transported (top) or
dumped (bottom).
2.3 Tracking system
In a typical mining application, rock is transported
from different parts of the mine, different rock
faces or separate blast areas. Consequently the
source of each truckload needs to be recorded to
allow the system to merge the appropriate
information.
There are several types of tracking system thatwill lend themselves to this criterion such as
global positioning system (GPS); differential
global positioning (DGPS), active radio frequency
identification (RFID), passive RFID, line scanning
(bar codes) and optical character recognition. GPS
and DGPS were ruled out owing to high cost,
difficulty of integration, inability to determine
exactly which vehicle is currently dumping at a
crusher (in the scenario of multiple access
crushers, because of limited resolution), inability
to carry programmed information bits and
suitability only for surface applications. Combined
with previously collected field data, line scanning
and character recognition were ruled out as a
reliable method of tracking vehicles as it would
require continuous processor usage, and would be
subject to numerous read errors from dirty or
obstructed bar or character codes on the vehicle.
Passive RFID was initially very promising,
meeting most of the required criteria; however,
limited write capabilities with poor read/write
8/8/2019 Advanced Automatic Optical Blast Fragmentation Sizing and Tracking
http://slidepdf.com/reader/full/advanced-automatic-optical-blast-fragmentation-sizing-and-tracking 5/9
263
speed and low range (0.5 m or less) ruled out this
method of tracking vehicles.
An active RFID type tracking system was
chosen to be integrated into the WipFrag Reflex
System. Active RFID tracking systems offer excellent range (15 m), low power consumption,
and high speed consistent read/write performance
that is both robust and reliable, even in harsh
environments. In addition, the tag can dynamically
store data, such as the weight or source of the
material.
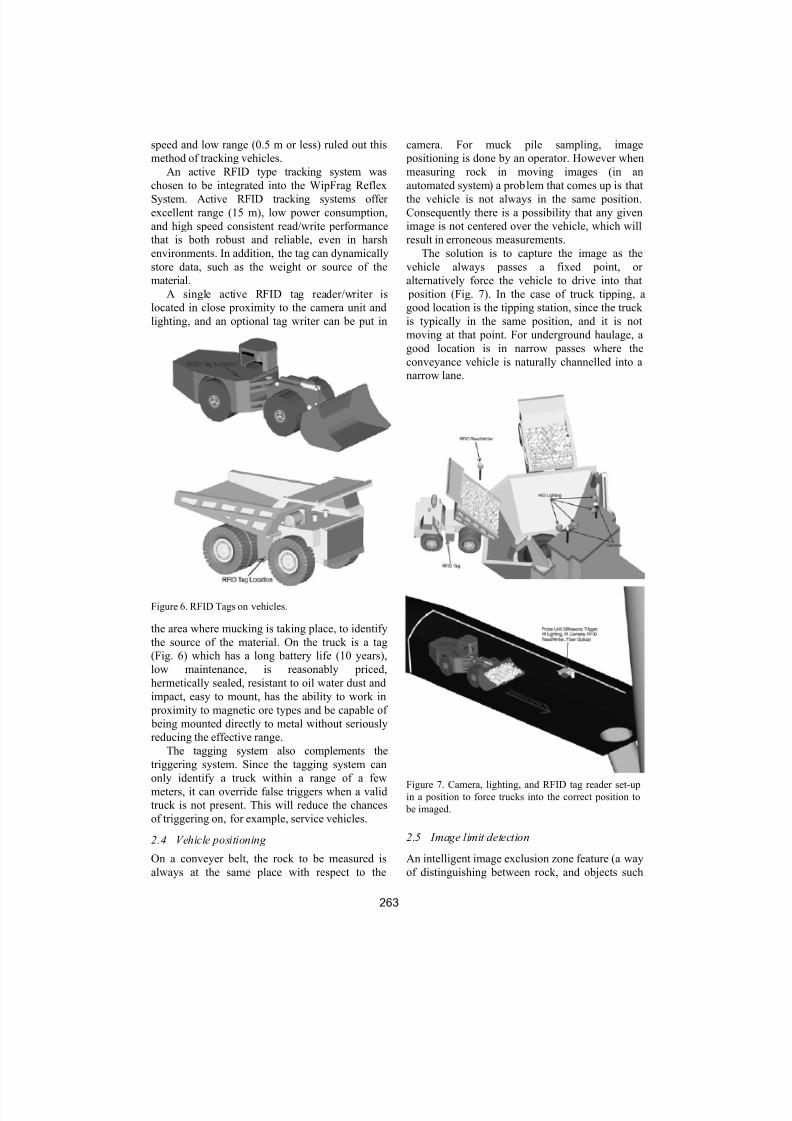
A single active RFID tag reader/writer is
located in close proximity to the camera unit and
lighting, and an optional tag writer can be put in
Figure 6. RFID Tags on vehicles.
the area where mucking is taking place, to identify
the source of the material. On the truck is a tag
(Fig. 6) which has a long battery life (10 years),
low maintenance, is reasonably priced,
hermetically sealed, resistant to oil water dust and
impact, easy to mount, has the ability to work in
proximity to magnetic ore types and be capable of
being mounted directly to metal without seriously
reducing the effective range.
The tagging system also complements the
triggering system. Since the tagging system can
only identify a truck within a range of a few
meters, it can override false triggers when a valid
truck is not present. This will reduce the chances
of triggering on, for example, service vehicles.
2.4 Vehicle positioning
On a conveyer belt, the rock to be measured is
always at the same place with respect to the
camera. For muck pile sampling, image
positioning is done by an operator. However when
measuring rock in moving images (in an
automated system) a problem that comes up is that
the vehicle is not always in the same position.Consequently there is a possibility that any given
image is not centered over the vehicle, which will
result in erroneous measurements.
The solution is to capture the image as the
vehicle always passes a fixed point, or
alternatively force the vehicle to drive into that
position (Fig. 7). In the case of truck tipping, a
good location is the tipping station, since the truck
is typically in the same position, and it is not
moving at that point. For underground haulage, a
good location is in narrow passes where the
conveyance vehicle is naturally channelled into a
narrow lane.
Figure 7. Camera, lighting, and RFID tag reader set-upin a position to force trucks into the correct position to
be imaged.
2.5 Image limit detection
An intelligent image exclusion zone feature (a way
of distinguishing between rock, and objects such
8/8/2019 Advanced Automatic Optical Blast Fragmentation Sizing and Tracking
http://slidepdf.com/reader/full/advanced-automatic-optical-blast-fragmentation-sizing-and-tracking 6/9
264
as the edges of the container) was required to
ensure that only the rock material in the bucket or
truck bed part of the image is analysed instead of
other items such as the vehicle, ground or
background. This is because the edge detectionalgorithm will attempt to force edges onto
everything on the image, including those of
foreign materials.
2.6 Lighting systems
On conveyor belts, adequate lighting is not
difficult to attain, since a relatively small area from
a relatively small standoff distance needs to be
illuminated. However, when even illumination
must be provided to negate sunlight effects on
vehicles larger than a house under both day and
night conditions or illumination of large
conveyances in a pitch black underground
environment, other concerns arise, such as lighting
fixture cost, cost of maintenance, cost of operating
and safety.
HID type sodium and HID type metal halide
provide the best solution for surface applications,
even though the lighting has a moderate initial
cost, there are numerous advantages – such as
moderate operating cost, reasonably high efficient,
resistance to vibration, long bulb life – and are
generally well suited for outdoor industrial heavy
duty environments. The average bulb life of a HID
metal halide bulb is 13000 hours, and the colour
temperature is similar to daylight, making it more
desirable. Both lighting types generate some heat
but it is not excessive.LED array visible and infrared type lighting is
the best solution for underground applications
owing to its extremely low power factor and
resistance to environmental factors such as
moisture, vibration, shock (concussion from
blasting), dust and temperature conditions,
coupled with the longest average bulb life of all
lighting types – 60,000 hours (over six years of
continuous use). LED type arrays are very light
and have built in redundancy against lighting
failure (if one LED burns out, then there are a few
thousand left). The disadvantages to this type of
lighting are initial cost, as these lighting types are
somewhat expensive, though not as expensive as
intrinsically safe fluorescent lighting, and the
relatively low lumen output compared to other
lighting types. The visible LED lighting may be
disruptive to the vehicle operator (as would any
type of lighting); therefore, infrared sensitive
cameras combined with the infrared type LED
lighting are used. The infrared LED illuminator is
low powered and considered no more dangerous to
personnel than a couple of 100 W lightbulbs.
Another property that the infrared type lighting
has over the other types is its ability to cut through
dust particles suspended in the air; infrared lighttends to illuminate the subject instead of
illuminating the dust particulate, making this
lighting type the best for the underground
application.
2.7 Environmental Conditions
Dust, fog, rain, snow and particulates can be an
issue if they obstruct the image or the triggering
mechanism. Infrared lighting in underground
applications will eliminate much of the dust
problem; however, surface applications usually
have more difficulty with this issue. WipFrag is
equipped with software image filters that require
certain image quality criteria to be met, prior toimage analysis; this filter will discard any non-
suitable images from a ‘set’ taken from a tipping
event, for example when an HD type vehicle
approaches the crusher to dump, the system will
take a preset number of images (usually 3–5)
during the dumping process; prior to analysis it
will audit each image to determine if the image
characteristics are suitable for analysis. If it is, the
image is analysed; if it is not, the image is
discarded.
Variable daylight conditions serve to confuse
the image analysis sequence. Light intensity
variations, sun angles, superstructure shadows,
and differences between natural and artificiallighting all serve to create small differences in the
analysis results. Solutions range from shielding the
material from direct sunlight or operating at night
only to accepting the errors.
In some occasions where a rock breaker is
used, it may obstruct the camera view; this cannot
be helped, and every effort must be made to
position the camera to minimize this issue.
3 HD APPLICATIONS
HD applications are typically used in surface
mining.
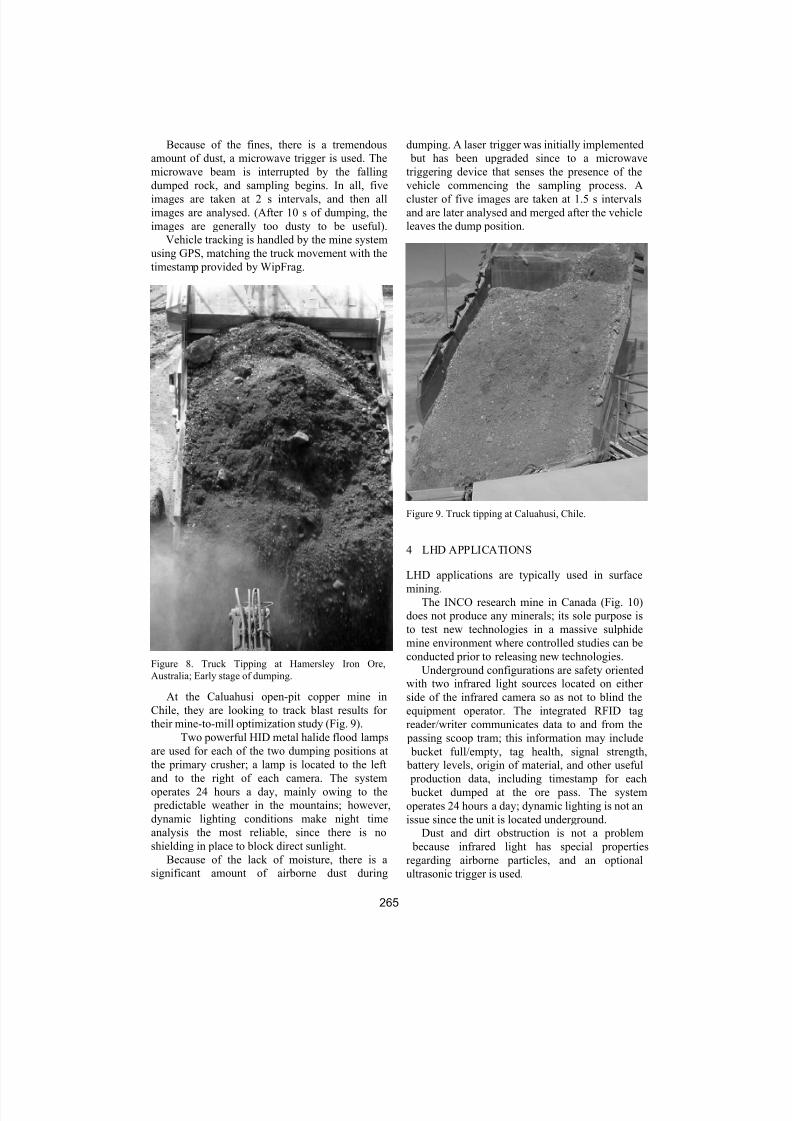
The Hamersly iron ore open pit mine in
Australia is looking to reduce the number of fines
and is verifying this using optical analysis on
tipping trucks (Fig. 8). Two powerful quartz
halogen lamps are used, one beside the camera
mount, another from the side at an oblique angle.
Imaging can only be done at night, as there is no
shielding in place for direct sunlight.
8/8/2019 Advanced Automatic Optical Blast Fragmentation Sizing and Tracking
http://slidepdf.com/reader/full/advanced-automatic-optical-blast-fragmentation-sizing-and-tracking 7/9
265
Because of the fines, there is a tremendous
amount of dust, a microwave trigger is used. The
microwave beam is interrupted by the falling
dumped rock, and sampling begins. In all, five
images are taken at 2 s intervals, and then allimages are analysed. (After 10 s of dumping, the
images are generally too dusty to be useful).
Vehicle tracking is handled by the mine system
using GPS, matching the truck movement with the
timestamp provided by WipFrag.
Figure 8. Truck Tipping at Hamersley Iron Ore,
Australia; Early stage of dumping.
At the Caluahusi open-pit copper mine in
Chile, they are looking to track blast results for
their mine-to-mill optimization study (Fig. 9).
Two powerful HID metal halide flood lamps
are used for each of the two dumping positions at
the primary crusher; a lamp is located to the left
and to the right of each camera. The system
operates 24 hours a day, mainly owing to the
predictable weather in the mountains; however,
dynamic lighting conditions make night time
analysis the most reliable, since there is no
shielding in place to block direct sunlight.
Because of the lack of moisture, there is a
significant amount of airborne dust during
dumping. A laser trigger was initially implemented
but has been upgraded since to a microwave
triggering device that senses the presence of the
vehicle commencing the sampling process. A
cluster of five images are taken at 1.5 s intervalsand are later analysed and merged after the vehicle
leaves the dump position.
Figure 9. Truck tipping at Caluahusi, Chile.
4 LHD APPLICATIONS
LHD applications are typically used in surface
mining.The INCO research mine in Canada (Fig. 10)
does not produce any minerals; its sole purpose is
to test new technologies in a massive sulphide
mine environment where controlled studies can be
conducted prior to releasing new technologies.
Underground configurations are safety oriented
with two infrared light sources located on either
side of the infrared camera so as not to blind the
equipment operator. The integrated RFID tag
reader/writer communicates data to and from the
passing scoop tram; this information may include
bucket full/empty, tag health, signal strength,
battery levels, origin of material, and other useful
production data, including timestamp for each
bucket dumped at the ore pass. The system
operates 24 hours a day; dynamic lighting is not an
issue since the unit is located underground.
Dust and dirt obstruction is not a problem
because infrared light has special properties
regarding airborne particles, and an optional
ultrasonic trigger is used.

8/8/2019 Advanced Automatic Optical Blast Fragmentation Sizing and Tracking
http://slidepdf.com/reader/full/advanced-automatic-optical-blast-fragmentation-sizing-and-tracking 8/9
266
One to three images are taken at 0.2 s intervals
which are later analysed and merged after the
vehicle leaves the dump position. Intelligent
exclusion zones and filters discard images or
analysis results that are unacceptable.
Figure 10. Sequence of images at INCO. Top: well-timed
image. Bottom: image taken too late.
The LKAB Kiruna mine in Sweden (Fig. 11) is
an underground iron ore mine, the largest of its
kind in the world. They are looking to quantify
underground blast results as well as track both
manned and unmanned mine machinery, this data
is used for mine-to-mill optimization studies.
Underground configurations are safety oriented
with two infrared light sources located on either
side of the infrared camera to not blind the
equipment operator. The integrated RFID tag
reader/writer communicated data to and from the
passing scoop tram. The system operates 24 hours
a day.
One to three images are taken at 0.2 s intervals
which are later analysed and merged after the
vehicle leaves the dump position. Intelligent
exclusion zones and filters discard images or
analysis results that are unacceptable.
Vehicle tracking is used; RFID tags are placed
on each scoop tram located in a safe position close
to the front of the vehicle. The RFID tags are
relatively inexpensive and are considered
consumable and disposable items if damaged or if the battery dies.
Figure 11. Tracking Ore at LKAB Mine.
5 CONCLUSIONS
Recent experience has shown that with
technological innovations, the size of blast
fragmentation can be measured where it is most
useful, in transit on haul trucks, after being
removed from the muck pile, and before entering
the primary crusher.
This required adapting optical image analysis
programs to act on external triggering, developing
a mechanism to provide that trigger, anddeveloping a way to force the truck into the
correct position for imaging without disrupting the
routine of the truck or truck driver.
In addition, because mining is typically a
complex operation, with simultaneous muck from
various source areas, vehicle tracking is required,
to tie each measurement to the appropriate
database.
Other issues include lighting concerns and
issues of automatic rejection of poor images
because of obscurement by dust (because no
manual intervention is possible).
The cited case studies show that the methods
described here are working and in use in a number
of facilities, and are being used to measure the
optimization of the blasting process for each
facility.
REFERENCES
Barkley, T. & Carter, R., 1999. Evaluation of Optical
Sizing Methods. Proc. 25th Ann. Conf. On Explo-
8/8/2019 Advanced Automatic Optical Blast Fragmentation Sizing and Tracking
http://slidepdf.com/reader/full/advanced-automatic-optical-blast-fragmentation-sizing-and-tracking 9/9
267
sives and Blasting Technique, Nashville, Tennessee,
USA, pp. 305–324.
Bartley, D.A. & Trousselle, R., 1998. Daveytronic, digi-
tal detonator testing in a vibration sensitive environ-
ment. Proc. 24th Ann. Conf. On Explosives and Blasting Technique, New Orleans, Louisiana, USA,
pp. 247–261.
Bouajila, A., Bartolacci, G., Koch, N., Cayouette, J. &
Cote C., 2000. Toward the improvement of primary
grinding productivity and energy investigation
consumption efficiency. Mine to Mill 2000, Finland.
Chiappetta, R.F., Treleaven, T. & Smith, J.D., 1998.
History and expansion of the Panama Canal. Proc.
24th Ann. Conf. On Explosives and Blasting Tech-
nique, New Orleans, Louisianna, USA, pp. 1–34.
Dance, A., 2001. The importance of primary crushing in
mill feed size optimization. SAG 2001.
Elliott, R., Ethier, R. & Levaque, J. 1999. Lafarge
Exshaw finer fragmentation study. Proc. 25th Ann.
Conf. On Explosives and Blasting Technique, Nash-
ville, Tennessee, USA, Vol. II, pp. 333–354.Ethier, R., Levaque, J.-G. & Wilson, M. 1999. Achiev-
ing finer fragmentation and proving the cost benefits.
Fragblast 1999. Johannesburg, South Africa, Insti-
tute of Mining and Metallurgy, pp. 99–102.
Franklin, J.A., Kemeny, J.M. & Girdner, K.K. 1996.
Evolution of measuring systems: a review. Franklin,
J.A, and Katsabanis, T. (eds). Proceedings of the
FRAGBLAST 5 Workshop on Measurement of Blast
Fragmentation, Montreal, Quebec, Canada. Rotter-
dam: A.A. Balkema, 1996, pp. 47–52.
Maerz, N.H. 1999. Online fragmentation analysis:
achievements in the mining industry. Center For
Aggregates Research (ICAR) Seventh Annual
Symposium Proceedings, Austin Texas, 19–21April,
pp. C1–1–1 to B1–1–10.
Maerz, N.H., 2001. Automated online optical sizing
analysis. SAG 2001 Conference Proceedings, 29
September–3 October, Vancouver, Canada, pp.
II250–269.
Maerz, N.H., Franklin, J.A. & Coursen, D.L. 1987.
Fragmentation measurement for experimental blast-
ing in Virginia. S.E.E., Proc. 3rd. Mini-Symposium
on Explosives and Blasting Research, pp. 56–70.
Maerz, N.H., Palangio, T.C. & Franklin, J.A., 1996.
WipFrag image based granulometry system. Frank-
lin, J.A, & Katsabanis, T. (eds). Proceedings of the
FRAGBLAST 5 Workshop on Measurement of Blast
Fragmentation, Montreal, Quebec, Canada. Rotter-
dam: A.A. Balkema, pp. 91–99.
Maerz, N.H. & Zhou, W. 1998. Optical digital fragmen-
tation measuring systems – inherent sources of error.
FRAGBLAST, The International Journal for Blast-
ing and Fragmentation, 2 (4): 415–431.
Maerz, N.H. & Zhou, W. 2000. Calibration of optical
digital fragmentation measuring systems.
FRAGBLAST, The International Journal for Blast-
ing and Fragmentation, 4 (20): 126–138.
Palangio, T.C. & Maerz, N.H., 1999. Case studies using
the WipFrag image analysis system. FRAGBLAST 6,
Sixth International Symposium For Rock Fragmen-
tation By Blasting , Johannesburg, South Africa, 8–
12 August 1999, pp. 117–120.