simplified target sizing model for visual sample plan … · simplified target sizing model for...
TRANSCRIPT
Simplified Target Sizing Model for Visual Sample Plan (VSP) – Redacted Version
Methodology for Munition Specific Fragmentation Distances for use in VSP based on TP-16 Methodology
STATISTICAL VERIFICATION AND REMEDIATION SAMPLING METHODS (200837)
April 2013
Pacific Northwest National Laboratory
John Hathaway, Brent Pulsipher, John Wilson, Lisa Newburn
Target Sizing in VSP February 2013 I
Table of Contents
1 INTRODUCTION ................................................................................................................................ 1 1.1 Wide Area Assessment ........................................................................................................... 2 1.2 Visual Sample Plan .................................................................................................................. 2 1.3 Transect Spacing for Target Area Identification ....................................................................... 2 1.4 Technical Paper 16 and Munitions Safety Development .......................................................... 3
2 Technical Basis for VSP Target Area Radii ...................................................................................... 3 2.1 Background on Target Radii Development .............................................................................. 4 2.2 Simplifying the Target Sizing Approach ................................................................................... 6 2.3 Munition Fragmentation Modeling ......................................................................................... 6 2.4 VSP Fragmentation Modeling for Target Area Radii ................................................................ 6 2.5 Diameter / Fragmentation Distance Relationship .................................................................... 7
3 Data Analysis and Modeling of VSP Fragmentation Distances ....................................................... 7 3.1 Munitions Used for Diameter/Fragmentation Relationship ..................................................... 8 3.2 Modeling the Relationship between Munition Diameter and Fragmentation Distance .......... 10
3.2.1 Nth Order Polynomial Linear Model Evaluation ..................................................................... 10 3.2.2 Loess Modeling ..................................................................................................................... 11 3.2.3 Defining the Lower Prediction bound for Chemical Rounds ................................................. 14 3.2.4 Defining the Lower Bounds for Aerial Bombs ....................................................................... 15
3.3 Comparison of Final Results to VSP Camp Beale Demonstration Designs ............................... 16
4 Implementation in VSP ...................................................................................................................... 17
5 Conclusion ........................................................................................................................................... 19
6 References ........................................................................................................................................... 19
Appendix A – Table of VSP Generated Target Area Radii .................................................................... 1
Appendix B – VSP Fragment Distances .................................................................................................... 1
Appendix C – Linear Model Output and Graphics ................................................................................. 1
Target Sizing in VSP February 2013 II
Table of Figures
Figure 1 -- VSP 6.0 Dialog for the target area input options for target area dimensions ............................. 3 Figure 2 – Diagram of how target area dimensions could be defined using probable errors and fragment dispersion. ..................................................................................................................................................... 4 Figure 3 – Example of Firing Table information where columns 3 and 4 show the range and deflection errors for different firing distances. .............................................................................................................. 5 Figure 4 – Scatterplot of the percentage decrease in fragmentation distance observed using the VSP fragmentation distance as compared to the maximum fragmentation distance (no 20% explosive weight increase). ....................................................................................................................................................... 8 Figure 5 – Scatterplots of the different munitions types and their relationship between diameter and VSP fragmentation distance. The colors of the points represent the munitions modeling category assignment. 8 Figure 6 – The four munition types that are used to build the munition diameter relationship to fragmentation distance. Note that a munition’s robustness does not appear to differentiate its modeled relationship between diameter and fragmentation distance within a munition type. .................................... 9 Figure 7 – Final set of munitions data used for modeling (excluding circled points above 400 mm). ......... 9 Figure 8 -- Model comparison of the best nth order polynomial fit in each y~x space. Where y = fragmentation distance and x = munition diameter. The shaded area on each model is the region from the mean fit line to the lower bound of the prediction interval. ........................................................................ 11 Figure 9 – Loess model (dark purple) compared three of the nth order polynomial models shown in Figure 8. .................................................................................................................................................................. 12 Figure 10 – Residual plot with a Loess fit through the residuals. This plot is used to diagnose the fit of the model to the data. In this case the fit is reasonable as the residuals are distributed randomly about zero. ............................................................................................................................................................. 13 Figure 11 – Final adjusted Loess lower bound prediction interval of the relationship between munition diameter and fragmentation distance. ......................................................................................................... 14 Figure 12 – Lower prediction interval bound for the chemical rounds (green) and the non-chemical rounds (red). The chemical rounds were fit with the same Loess assumptions explained in Section3.2.2. .......... 15 Figure 13 – Scatter plot of the aerial bombs. The dashed lines show the VSP target area radii to be used for transect design. ...................................................................................................................................... 16 Figure 14 – Target area inputs with target sizing lookup enabled .............................................................. 18 Figure 15 – Target area input for air-launched munitions .......................................................................... 18
List of Tables
Table 1 – Summary of the 6 dropped munitions that had diameters over 400 mm. ................................... 10 Table 2 – Comparison of the Camp Beale results to the proposed radius assumptions documented in this report. .......................................................................................................................................................... 16

Target Sizing in VSP February 2013 1
1 INTRODUCTION The Department of Defense (DoD) is currently performing many remedial investigations (RI) to identify locations where concentrated regions of munitions of explosive concern (MEC) and unexploded ordnance (UXO) may be present, estimate potential remediation efforts and costs, and support land transfer decisions and no further remediation on some areas. Through the SERDP and ESTCP programs, DoD has supported the development of statistical design modules that assist with UXO remediation within Visual Sample Plan (VSP), a statistical support software program developed by Pacific Northwest National Laboratory. This technical paper documents the methods used by the Visual Sample Plan (VSP) software to define the conservative radius used to establish the size of a munition specific impact area. As the use of VSP has increased within the Department of Defense (DoD) environmental restoration community the need to standardize the dimensions of the impact areas of interest has increased. These conservative radii values will provide a stronger technical basis and ease the future implementation of VSP in DoD assessments. The majority of this document summarizes the work to implement a simple interface in VSP that allows the user to pick the target area radius using a few features of the munition of interest and its respective diameter. This functionality is primarily for VSP users that cannot get access to the complete list of munition specific VSP fragmentation distances available in the appendices of the restricted version of this document. The restricted version of this document can be obtained from the U.S. Army Corps of Engineers Engineering and Support Center, Huntsville, Environmental and Munitions Center of Expertise. When designing transect surveys for the detection and remediation of unexploded ordnance (UXO), the high anomly density areas are used as an indicator for regions with potential UXO. Detection of these high fragment density areas is accomplished using geophysical sensors to locate metallic anomalies on or underneath the earth’s surface. After the data have been collected, the spatial density of these anomalies must be interpreted in order to make an inference on the location of potential target areas. Transect surveys that are appropriately spaced to ensure a high probability of traversing and detecting target areas of concern are usually performed. The spacing between transects is a function of several parameters, some of which depend on the munition of concern. A primary consideration for transect survey design is the expected size and shape of a target area of concern, which requires knowledge about the expected fragmentation dispersion pattern for the particular munition of interest and its use on the site. Historically, site managers and munitions experts have been required to provide their best estimate of the size and shape of the high density fragmentation area (target area) that would result from using a particular munition on that site. These best estimates came from educated guesses or from examining firing tables and lethal or safety circle estimates. Visual Sample Plan (VSP) was then used to derive the transect survey design given this user input. An earlier ESTCP sponsored project (0507) conducted by Huntsville Army Corps of Engineers, explored an engineering simulated model approach for deriving expected target area sizes and shapes given munitions use. This project derived preliminary estimates but was never fully completed. To better assist with transect survey design in VSP, we have derived an approach for determining the expected target area radius for various munitions. We have used the data and general techniques put forth in Department of Defense Explosive Safety Board Technical Paper No.16. This report outlines how we derived the conservative radius values that will be implemented in VSP and summarizes the VSP fragment distances for all the munitions’ data provided to PNNL.
Target Sizing in VSP February 2013 2
1.1 Wide Area Assessment
The document “ESTCP Pilot Project Wide Area Assessment for Munitions Response” documents the full wide area assessment (WAA) demonstration completed in 2008 (Andrews and Nelson 2008). In addition, Pacific Northwest National Laboratory (PNNL) has published multiple technical papers on the applications of VSP to this problem1. Statistical sampling methods and tools were developed for several phases of the characterization and decision-making process including optimal sampling designs for the detection, delineation and anomaly density estimation of impact areas. These optimal sampling design procedures were implemented in VSP and demonstrated during the larger ESTCP WAA pilot study.
1.2 Visual Sample Plan
VSP is a software tool that supports the development of a defensible sampling plan based on statistical sampling theory and the statistical analysis of sample results to support confident decision-making. VSP couples site, building, and sample location visualization capabilities with optimal sampling design and statistical analysis strategies. VSP, available for free at vsp.pnnl.gov, is currently focused on design and analysis for the following applications.
• Environmental Characterization and Remediation • Environmental Monitoring and Stewardship • Response and Recovery of Chemical/Biological/Radiation Terrorist Event • Footprint Reduction and Remediation of Unexploded Ordnance (UXO) Sites • Sampling of Soils, Buildings, Groundwater, Sediment, Surface Water, Subsurface Layers.
1.3 Transect Spacing for Target Area Identification
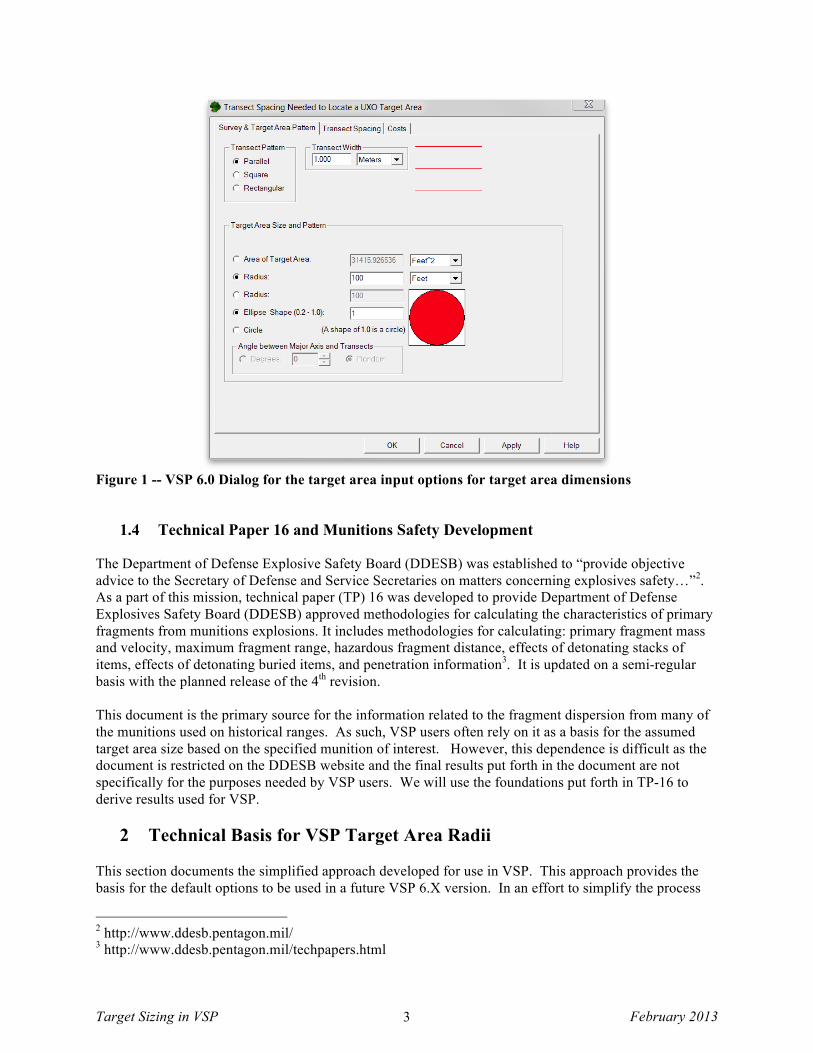
The VSP software has a module focused on determining the required spacing between geophysical transects to confidently detect a specified target area of interest. Before a VSP user can begin optimizing a transect design, he/she must define the size of the target area of interest. A target area represents the area within which the geophysical anomaly density is expected to be significantly elevated above background/clutter. Figure 1 shows the first tab of the “Transect Spacing Needed to Locate a UXO Target Area” VSP dialog. The lower half of the dialog has the target area size and dimension inputs used to define the target area of interest. The interface itself is simple to use and intuitive as to what the inputs represent; however, the process of identifying a munition of interest from the conceptual site model and determining the appropriate size of a target area for that munition is not easy. Additionally, the target area dimension is the most influential of all the inputs necessary to complete a transect design. There have been a number of approaches considered to derive this input including accounting for probable errors of impact around a target, frag dispersion modeling, hazard safety circles, elicitation of expert opinion, and using historical spatial frag dispersion observed on similar sites with similar munitions. None of these were standardized so the inputs of these parameters varied significantly from project to project. This report addresses this issue and presents a standardized approach for determining the expected target area size and shape for various munitions.
1 http://serdp.org/Program-Areas/Munitions-Response/Support-Tools/MR-200325
Target Sizing in VSP February 2013 3
Figure 1 -- VSP 6.0 Dialog for the target area input options for target area dimensions
1.4 Technical Paper 16 and Munitions Safety Development
The Department of Defense Explosive Safety Board (DDESB) was established to “provide objective advice to the Secretary of Defense and Service Secretaries on matters concerning explosives safety…”2. As a part of this mission, technical paper (TP) 16 was developed to provide Department of Defense Explosives Safety Board (DDESB) approved methodologies for calculating the characteristics of primary fragments from munitions explosions. It includes methodologies for calculating: primary fragment mass and velocity, maximum fragment range, hazardous fragment distance, effects of detonating stacks of items, effects of detonating buried items, and penetration information3. It is updated on a semi-regular basis with the planned release of the 4th revision. This document is the primary source for the information related to the fragment dispersion from many of the munitions used on historical ranges. As such, VSP users often rely on it as a basis for the assumed target area size based on the specified munition of interest. However, this dependence is difficult as the document is restricted on the DDESB website and the final results put forth in the document are not specifically for the purposes needed by VSP users. We will use the foundations put forth in TP-16 to derive results used for VSP.
2 Technical Basis for VSP Target Area Radii This section documents the simplified approach developed for use in VSP. This approach provides the basis for the default options to be used in a future VSP 6.X version. In an effort to simplify the process
2 http://www.ddesb.pentagon.mil/ 3 http://www.ddesb.pentagon.mil/techpapers.html
Target Sizing in VSP February 2013 4
and be conservative, we have based the approach entirely on the munition specific fragmentation distances and have ignored the implications of the range and deflection probable errors (discussed below) that were considered in the original research.
2.1 Background on Target Radii Development
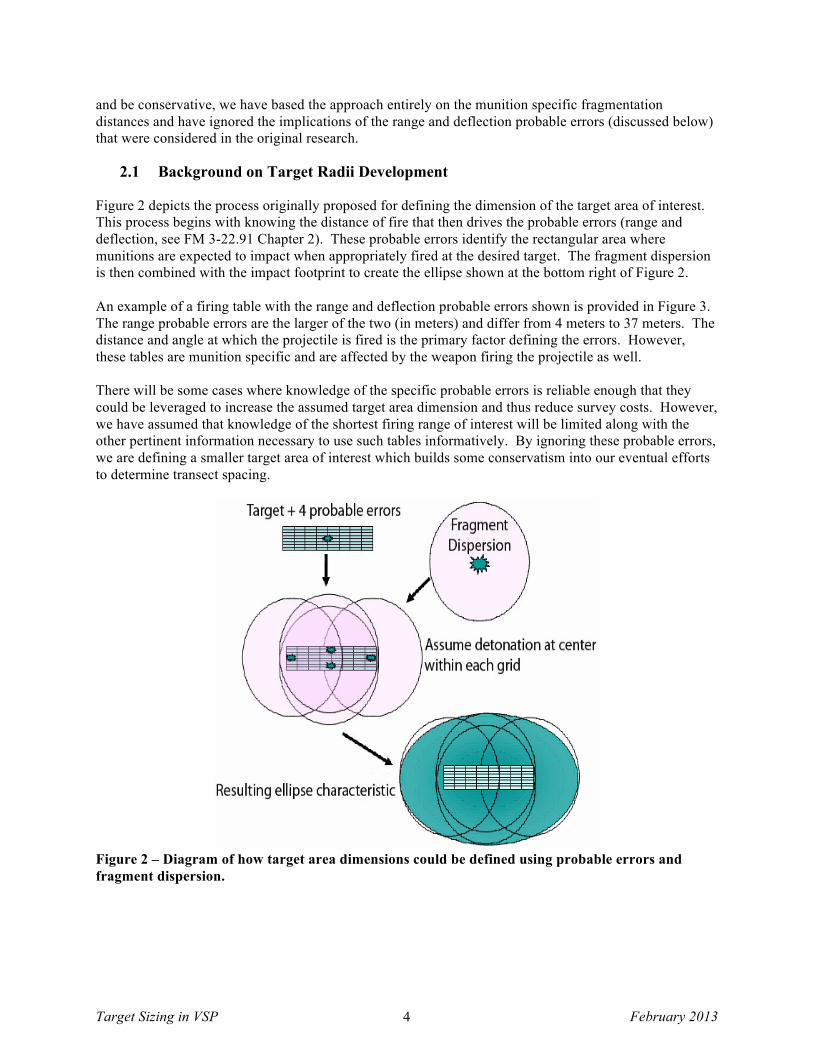
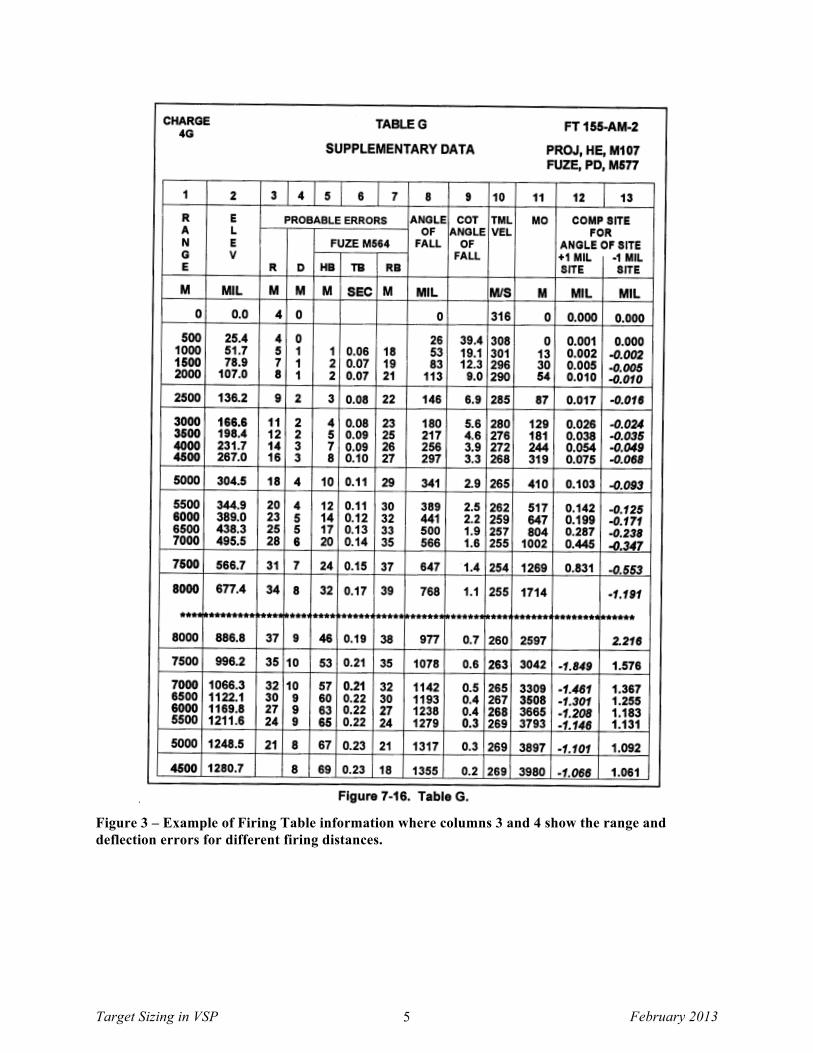
Figure 2 depicts the process originally proposed for defining the dimension of the target area of interest. This process begins with knowing the distance of fire that then drives the probable errors (range and deflection, see FM 3-22.91 Chapter 2). These probable errors identify the rectangular area where munitions are expected to impact when appropriately fired at the desired target. The fragment dispersion is then combined with the impact footprint to create the ellipse shown at the bottom right of Figure 2. An example of a firing table with the range and deflection probable errors shown is provided in Figure 3. The range probable errors are the larger of the two (in meters) and differ from 4 meters to 37 meters. The distance and angle at which the projectile is fired is the primary factor defining the errors. However, these tables are munition specific and are affected by the weapon firing the projectile as well. There will be some cases where knowledge of the specific probable errors is reliable enough that they could be leveraged to increase the assumed target area dimension and thus reduce survey costs. However, we have assumed that knowledge of the shortest firing range of interest will be limited along with the other pertinent information necessary to use such tables informatively. By ignoring these probable errors, we are defining a smaller target area of interest which builds some conservatism into our eventual efforts to determine transect spacing.
Figure 2 – Diagram of how target area dimensions could be defined using probable errors and fragment dispersion.
Target Sizing in VSP February 2013 5
Figure 3 – Example of Firing Table information where columns 3 and 4 show the range and deflection errors for different firing distances.
Target Sizing in VSP February 2013 6
2.2 Simplifying the Target Sizing Approach
As with any modeling routine there are trade-offs between usability and exactness. Specifically, the inputs are intuitive and the user has access to the necessary values to use while the model is reasonably matched to reality. Every modeling project has to deal with the realities of these trade-offs. The original target-sizing project leaned more heavily towards exactness at the expense of usability (Versar, 2007). We have established a method that results in a set of standardized conservative assumptions regarding angle of impact of the munition, firing distance, firing orientation, and probable errors that have allowed for a more useable approach.
2.3 Munition Fragmentation Modeling
Technical paper (TP) 16 provides Department of Defense Explosives Safety Board (DDESB) approved methodologies for calculating the characteristics of primary fragments. It includes methodologies for calculating maximum fragment distances4. This paper methodically documents the mathematical engineering models used to represent the fragment dispersion of over 200 different items, which range from grenades to mortars to 2,000 lb bombs. One of the primary uses of the paper was to provide safety distances to explosive ordnance disposal (UXO) technicians. With this use in mind the developers of TP-16 defined ‘conservative’ as making sure the fragmentation distance was not underestimated. We will use the same engineering models for fragmentation distance (TP-16 process), but will alter some of the inputs and data analysis for the specific needs of VSP target area development.
2.4 VSP Fragmentation Modeling for Target Area Radii
As shown in Figure 1, the default target area dimensions are generally defined using the radius of a circular area. We have assumed that the fragment distance estimates from the TP-16 process would represent the radius of the target area of interest as the fragments could be thrown any direction at the distance specified. In making this assumption we recognize the simplification we have imposed and discuss some of these specific simplifications below. The fragments from one explosion are used to model the entire target area. Unlike previous target-sizing work we are not requiring duration of use as an input to drive the target area density and size. In addition, we recognize that the fragment dispersions modeled in TP-16 are for one explosion. As explained in Section 2.2, we have made the simplifying ‘conservative’ assumption that the range and deflection probable errors are not included in the target area size definition. Without including the probable errors, we have assumed the fragment dispersion of one item is sufficient to mark the footprint of the assumed target area for VSP use. Target area shape is not circular. There are many cases, if not most, where the target area is not circular. The previous work under the target-sizing project proposed that many target areas would have more of an oval or cone shape. Often specific firing targets are close enough to each other, especially with smaller munitions, that the impact area would be a much more elongated oval. We have assumed that the circular footprint as a result of firing at one target is the smallest the area that could exist based on the identified munition of interest and therefore would drive the transect design. The VSP user is still left with the option to override the conservative radius if they have specific information about the shape and orientation of the target area. Each munition has unique characteristics and therefore a unique fragment radius that should be used to drive the target area dimension. TP-16 is a restricted document due to some of the sensitivities 4 http://www.ddesb.pentagon.mil/techpapers.html

Target Sizing in VSP February 2013 7
of having munition specific information. In order for VSP to use the research from TP-16, we honored those restrictions as well. Based on our interaction with the TP-16 authors the simplest method to avoid munition specific information while still providing enough detail for VSP users was to fit a statistical model to the relationship between the munition diameter and the fragmentation distance to the pertinent munitions modeled in TP-16. Additionally, this simplifying step helps when the specific model of munition is unknown. For example, in TP-16 there are multiple 81 mm projectiles listed that each have a different fragmentation distance and some munitions are not listed as well. Appendix B of the PNNL technical report does have the VSP fragmentation distance for all munitions provided to PNNL. While these values are not included in VSP, they can be obtained from the Army Corps of Engineers for project use.
2.5 Diameter / Fragmentation Distance Relationship
There are many factors that control the distance of fragment dispersion from a munition. The primary inputs that are used in the TP-16 process include
• Casing material, • Explosive type, • Explosive weight, and • Ordnance purpose (practice bomb, high explosive munitions, bombs, mortars, chemical, etc.).
These characteristics would be the general elements that describe the differences in fragmentation distances for two munitions of the same diameter. In general the diameter is strongly correlated with the explosive weight and the casing material is related to the ordnance purpose. With the exception of practice bombs all the modeled munitions will have fragment dispersion. We have used the munition diameter as the user defined input that will drive the target area radius based on the fragmentation distance. To partially address the casing material and ordnance purpose we have derived separate diameter-fragmentation distance statistical models for aerial munitions (bombs) standard surface-fired rounds, and chemical surface-fired rounds.
3 Data Analysis and Modeling of VSP Fragmentation Distances As explained previously, we used the same engineering model/software as documented in TP-16. As the maximum fragmentation distance reported in TP-16 are too large for the design needs in VSP and the hazardous distances shown are too small, the fragmentation distance of the objects of 95th percentile weight were selected to establish a “VSP fragmentation distance”. Figure 4 shows the relative decrease in the VSP fragmentation distance as compared to the maximum fragmentation distance using the TP-16 process. The points are colored by munition type and labeled in the figure.
Target Sizing in VSP February 2013 8
Figure 4 – Scatterplot of the percentage decrease in fragmentation distance observed using the VSP fragmentation distance as compared to the maximum fragmentation distance (no 20% explosive weight increase). As can be seen from the previous figure, we were provided with munition models for 9 different munitions types for a total of approximately 200 munitions. TP-16 categorizes some of the munitions based on their modeled relationship. The data that were provided by the TP-16 authors have four different modeling categories – not labeled, Extremely Heavy Case, Non-Robust, and Robust (Figure 5 shows these data).
REMOVED FOR PNNL VERSION Figure 5 – Scatterplots of the different munitions types and their relationship between diameter and VSP fragmentation distance. The colors of the points represent the munitions modeling category assignment.
3.1 Munitions Used for Diameter/Fragmentation Relationship
The purpose of this work is to define a standard relationship that maps munition diameter to fragmentation distance, similar to the work done in TP-16, but for applications in VSP based transect designs. As such, a few of the munition types provided to us will be dropped from the
Target Sizing in VSP February 2013 9
diameter/fragmentation model analysis (aerial bombs will be modeled separately in 3.2.4). These types are listed below with a short justification.
• Grenades and Mines – It is not clear that these items make sense in the diameter to fragmentation relationship and will be dropped (VSP can still be used for target areas resulting from these munitions but the target area size of interest will not be determined within VSP).
• Rocket Motors – There are only three listed and any study looking for rocket motors would probably not be trying to find target areas. If rockets were a driver for target area dimension definition, the fragmentation from the rocket itself would be much larger.
• Fuzes – These can exist in a remedial investigation study. However, their fragmentation distance is very small and the fragmentation from the munition would be much larger. It is also not clear that diameter would be a common way to identify them in a generic fashion.
• HE Hellfire – There are relatively few items, but those that are available from TP-16 show no relationship between diameter and fragmentation distance.
• Aerial bombs -- From the scatter plot it should be clear that aerial high explosive bombs (HE bombs in Figure 5) have larger munition diameters relative to the other rounds and the linear relationship between diameter and fragmentation distance is not very strong. As such, bomb specific analyses will be done separately from the ground fired munitions.
The following two figures show the final set of data that will be used to create a model between diameter and fragmentation distance. Almost all the Chemical rounds are extremely heavy cased and there are few heavy cased items in the other munitions types.
REMOVED FOR PNNL VERSION Figure 6 – The four munition types that are used to build the munition diameter relationship to fragmentation distance. Note that a munition’s robustness does not appear to differentiate its modeled relationship between diameter and fragmentation distance within a munition type. For the cases shown above, it is not clear that using the munition robustness provides any significant benefit to explaining the diameter/fragmentation relationship that munition type doesn’t already address (we should note that the non-categorized munitions do show less variability). As such, we will group all munitions together and ignore robustness in the modeling process. Figure 7 shows the 126 remaining munitions in one frame and highlights that the chemical rounds (green dots) should be fit separately from the non-chemical rounds as they tend to have a much shorter fragmentation rate for similar diameter non-chemical rounds. As there are few munitions with diameters above 400 mm, the modeling in this area will be very imprecise and can affect the relationship along the rest of the space inappropriately. Thus, we have dropped these from the generic relationship modeling. This will limit the modeling to munitions with a diameter less than 350 mm. A summary of the six dropped munitions is listed in Table 1. Note that the torpedo and naval mine are the two extreme purple dots observed on the right and would not be generally searched for under the current uses of VSP.
REMOVED FOR PNNL VERSION Figure 7 – Final set of munitions data used for modeling (excluding circled points above 400 mm).

Target Sizing in VSP February 2013 10
Table 1 – Summary of the 6 dropped munitions that had diameters over 400 mm.
REMOVED FOR PNNL VERSION
3.2 Modeling the Relationship between Munition Diameter and Fragmentation Distance
TP-16 and the scientists developing that work have proposed using different order polynomials for modeling the relationship between the munition diameter and fragmentation distance. PNNL recommends using LOESS methods for modeling the relationship. We will present the results from both methods and then compare them after each is presented. For the comparison of each method we will be fitting the statistical model assuming a multiplicative error structure (i.e. modeling the relationship between munition diameter and the ln(Fragmentation Distance)). However, many more modeling assumptions were evaluated. We describe all of the comparisons in the following section and Appendix A.
3.2.1 Nth Order Polynomial Linear Model Evaluation TP-16 proposes fitting both a third order and fifth order polynomial to model the relationship. They also propose fitting the relationship with both the dependent and independent variables in the natural log space. Specifically, their equations are
• !" !"#$%&'( !"#$%&'( = ! + !× !" !"#$%&%' + !× ln !"#$%&%' ! + !× ln !"#$%&%' !
• ln !"#$%&'( !"#$%&'( = ! + !× ln !"#$%&%! + !× ln !"#$%&%' ! + !× ln !"#$%&%' ! + !× ln !"#$%&%' ! + !× ln !"#$%&%' !
We have also fit the 2nd order polynomial model as well for the case where both variables are modeled in the natural log space.
• !" !"#$%&'( !"#$%&'( = ! + !× !" !"#$%&%' + !× ln !"#$%&%' ! There are additional options beyond fitting the linear relationship in the ln !"#$%&'( !"#$%&'( ~ ln !"#$%&%' space. We also looked at six additional fits resulting from the three nth order polynomial options previously proposed while fitting in the following two spaces.
• ln !"#$%&'( !"#$%&'( ~!"#$%&%' • !"#$%&'( !"#$%&'(~!"#$%&%'
The plots of these nine fits and the linear model output are shown in Appendix C. From the results in Appendix C, we recommend using the ln(distance)~diameter 3rd order model for comparison against the loess modeling for the following reasons;

Target Sizing in VSP February 2013 11
• The distance~diameter assumption space assumes an additive error model which we do not
believe -- especially for munitions below 100 mm in diameter. • The ln(distance)~ln(diameter) overfits the low diameter munitions. • The ln(distance)~diameter is simpler and more intuitive model space (We should note that we
will propose some adjustments at the boundary results when using this space). Figure 8 shows the three model spaces and the best fitting nth order polynomial. From this figure, we highlight that the reasonableness of the 3rd order polynomial ln(distance)~diameter model. We are primarily concerned with good lower bound estimates at the lower diameters. The lower bounds on the other two models are too wide in in this area.
Figure 8 -- Model comparison of the best nth order polynomial fit in each y~x space. Where y = fragmentation distance and x = munition diameter. The shaded area on each model is the region from the mean fit line to the lower bound of the prediction interval.
3.2.2 Loess Modeling We propose using Loess regression to model the relationship between munition diameter and fragment distance. These methods are well suited for the problem at hand and are accepted and well established within statistical modeling5. A major difference between Loess and parametric modeling is the lack of final parametric equation that can be reported. However, there is a final model available from a Loess fit
5 http://www.itl.nist.gov/div898/handbook/pmd/section1/pmd144.htm
Target Sizing in VSP February 2013 12
that provides a similar ability to estimate uncertainty and the associated prediction intervals. Loess is a fairly straight forward, computationally intense, extension of least squares regression (Jacoby 2000). Figure 9 shows the fit of the loess model compared to the other three models shown in Figure 8 – the purple band shows the Loess fit. We note the lower bound performance across the entire range of diameters. The Loess model performs better (i.e. tighter) for lower diameters and approaches the tightness of the y-x model in the upper diameters. While there is some slight upward tendency at the lower diameters, the loess model does not overfit as well. Figure 10 is an additional diagnostic to the reliability of the Loess model. In this case the fit is reasonable as the residuals are distributed randomly about zero. The Loess model was fit with a 0.75 span with M-estimator local weighting using a locally quadratic fit6.
Figure 9 – Loess model (dark purple) compared three of the nth order polynomial models shown in Figure 8.
6 http://stat.ethz.ch/R-manual/R-patched/library/stats/html/loess.html
Target Sizing in VSP February 2013 13
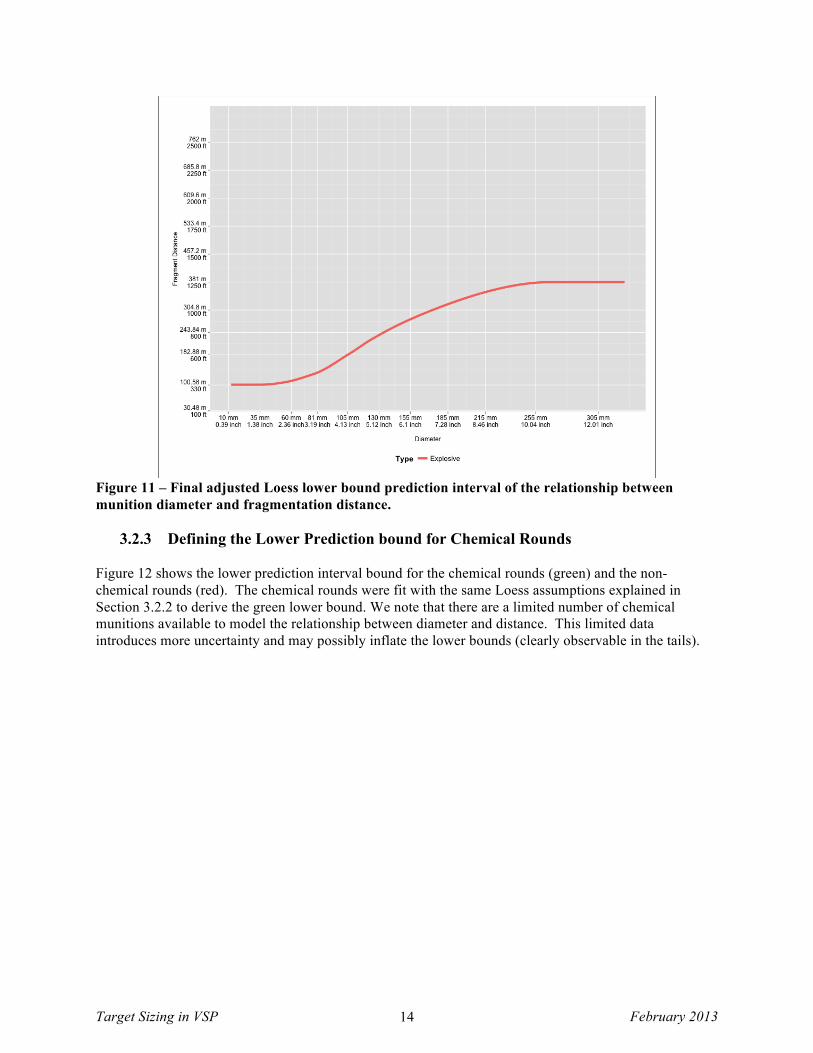
Figure 10 – Residual plot with a Loess fit through the residuals. This plot is used to diagnose the fit of the model to the data. In this case the fit is reasonable as the residuals are distributed randomly about zero. Figure 11 shows the final high explosive (non-chemical) ground fired rounds lower prediction interval bound proposed for use in VSP. As compared to Figure 9, the tails of the lower bound are fixed. For the small diameter munitions the lower bound was constrained such that smaller rounds could not have a larger fragmentation distance. Similarly, the larger diameter rounds were constrained such that the larger diameter rounds could not have a smaller fragmentation distance.
Target Sizing in VSP February 2013 14
Figure 11 – Final adjusted Loess lower bound prediction interval of the relationship between munition diameter and fragmentation distance.
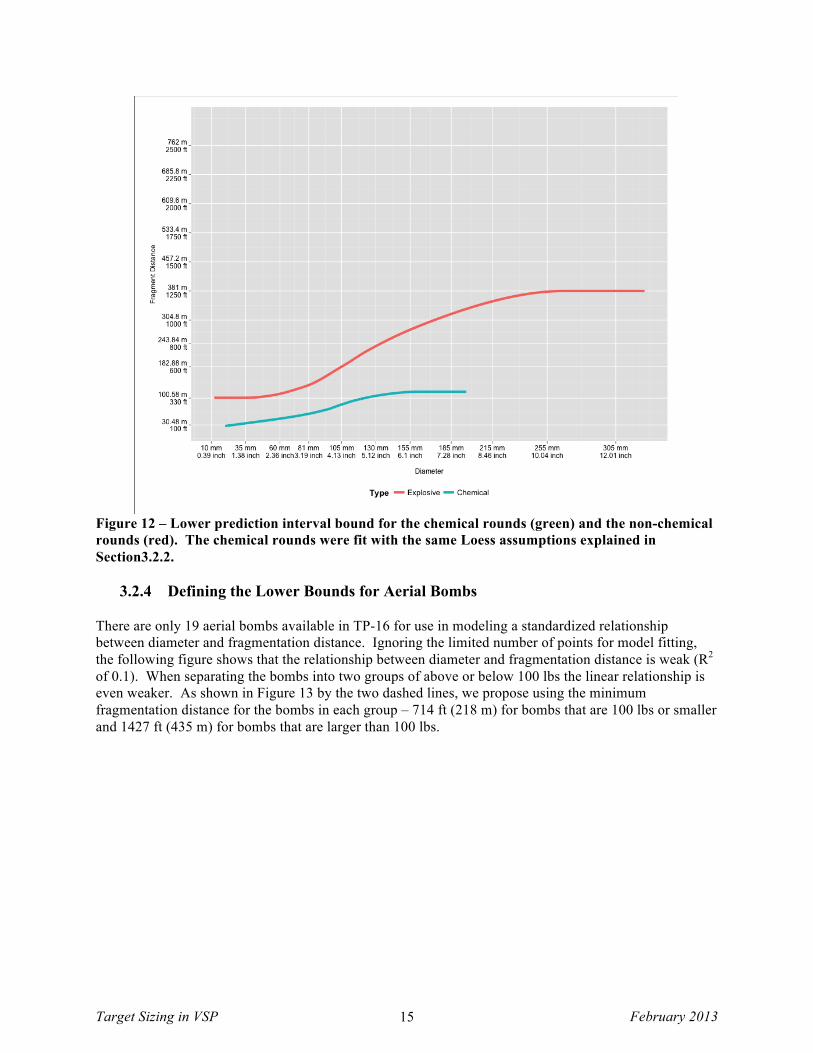
3.2.3 Defining the Lower Prediction bound for Chemical Rounds Figure 12 shows the lower prediction interval bound for the chemical rounds (green) and the non-chemical rounds (red). The chemical rounds were fit with the same Loess assumptions explained in Section 3.2.2 to derive the green lower bound. We note that there are a limited number of chemical munitions available to model the relationship between diameter and distance. This limited data introduces more uncertainty and may possibly inflate the lower bounds (clearly observable in the tails).
Target Sizing in VSP February 2013 15
Figure 12 – Lower prediction interval bound for the chemical rounds (green) and the non-chemical rounds (red). The chemical rounds were fit with the same Loess assumptions explained in Section3.2.2.
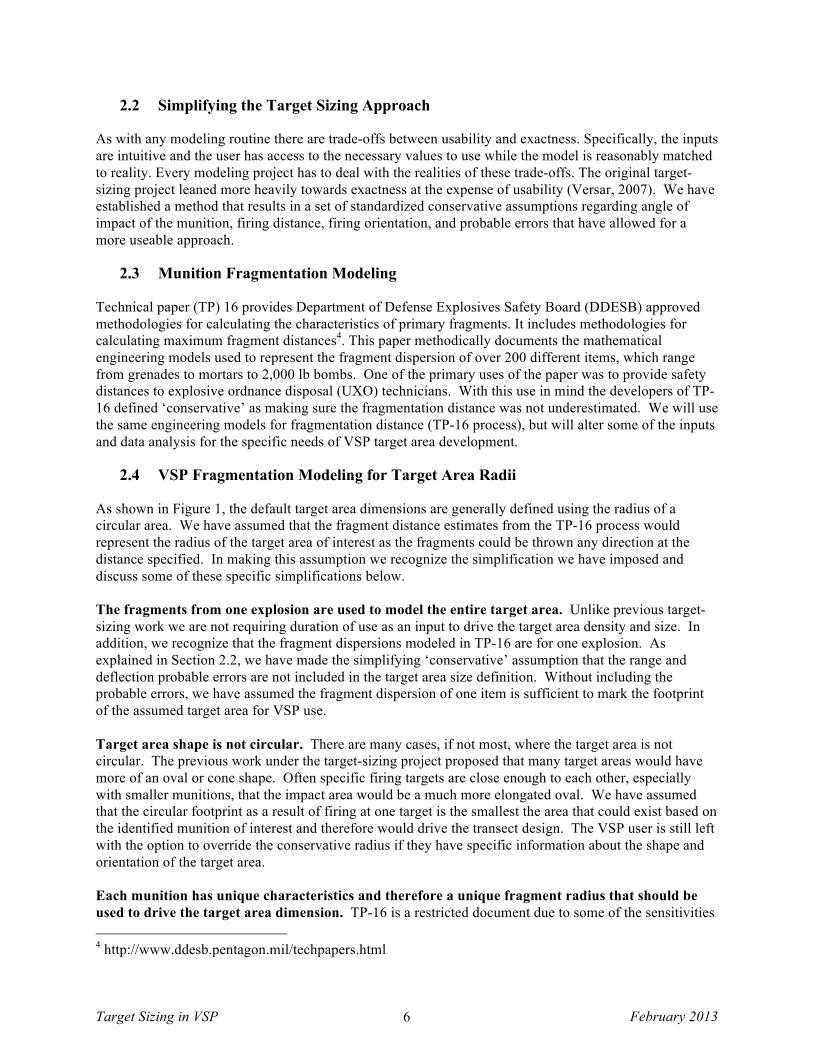
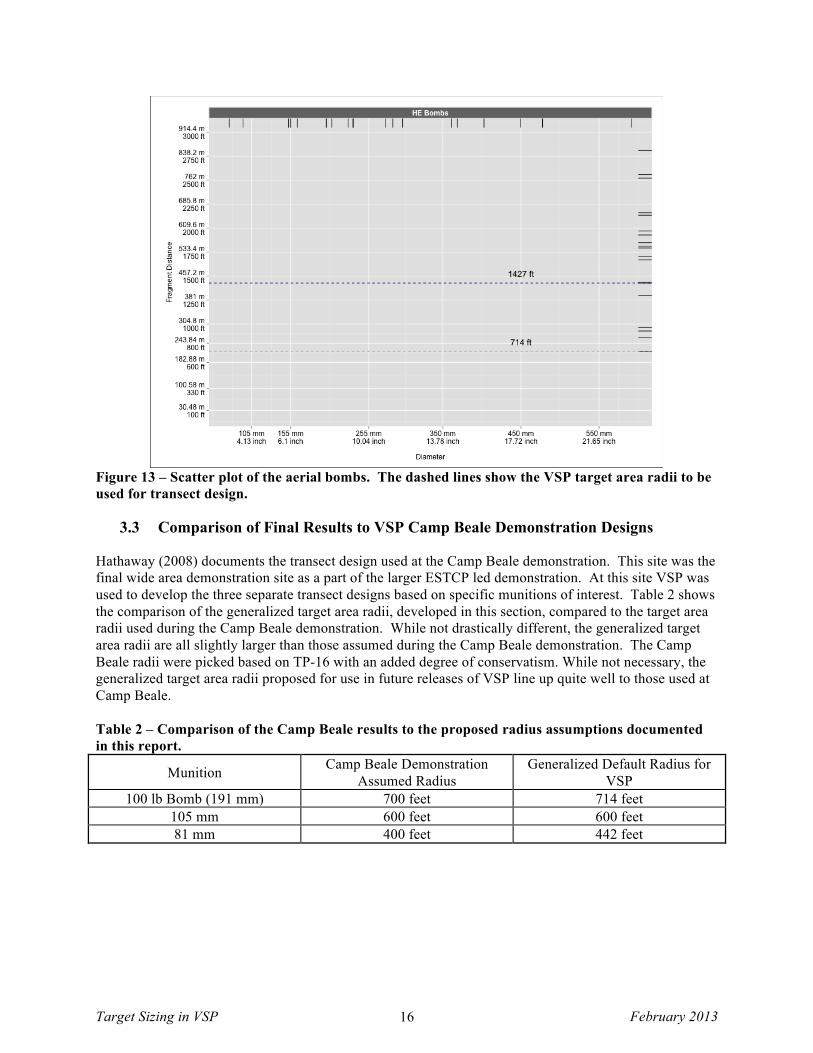
3.2.4 Defining the Lower Bounds for Aerial Bombs There are only 19 aerial bombs available in TP-16 for use in modeling a standardized relationship between diameter and fragmentation distance. Ignoring the limited number of points for model fitting, the following figure shows that the relationship between diameter and fragmentation distance is weak (R2 of 0.1). When separating the bombs into two groups of above or below 100 lbs the linear relationship is even weaker. As shown in Figure 13 by the two dashed lines, we propose using the minimum fragmentation distance for the bombs in each group – 714 ft (218 m) for bombs that are 100 lbs or smaller and 1427 ft (435 m) for bombs that are larger than 100 lbs.
Target Sizing in VSP February 2013 16
Figure 13 – Scatter plot of the aerial bombs. The dashed lines show the VSP target area radii to be used for transect design.
3.3 Comparison of Final Results to VSP Camp Beale Demonstration Designs
Hathaway (2008) documents the transect design used at the Camp Beale demonstration. This site was the final wide area demonstration site as a part of the larger ESTCP led demonstration. At this site VSP was used to develop the three separate transect designs based on specific munitions of interest. Table 2 shows the comparison of the generalized target area radii, developed in this section, compared to the target area radii used during the Camp Beale demonstration. While not drastically different, the generalized target area radii are all slightly larger than those assumed during the Camp Beale demonstration. The Camp Beale radii were picked based on TP-16 with an added degree of conservatism. While not necessary, the generalized target area radii proposed for use in future releases of VSP line up quite well to those used at Camp Beale. Table 2 – Comparison of the Camp Beale results to the proposed radius assumptions documented in this report.
Munition Camp Beale Demonstration Assumed Radius
Generalized Default Radius for VSP
100 lb Bomb (191 mm) 700 feet 714 feet 105 mm 600 feet 600 feet 81 mm 400 feet 442 feet
Target Sizing in VSP February 2013 17
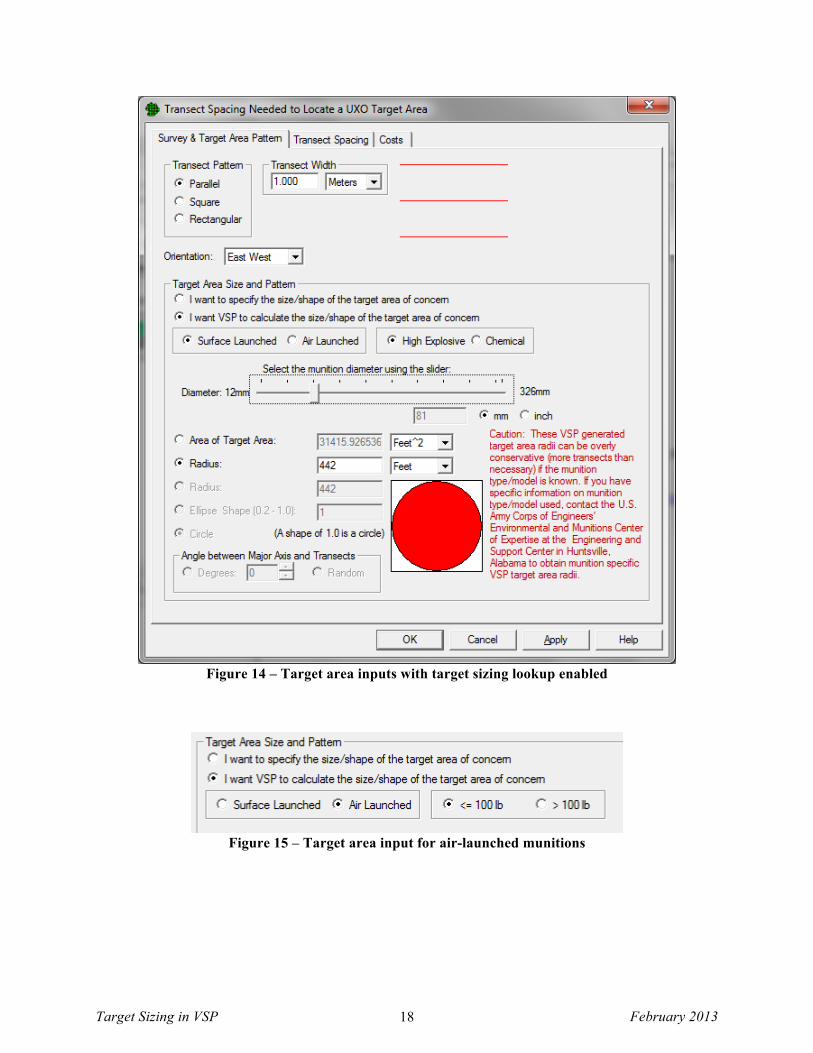
4 Implementation in VSP Figure 14 depicts the target sizing options that will be implemented in the next release of VSP. The following list highlights the options on the transect design dialog and how they can be used for selecting a default target area size.
• Manual / Munition selection: If the user selects the radio button labeled “I want VSP to calculate the size/shape of the target area of concern” the various inputs and selections are displayed allowing automatic lookup of target radius based on munition features. If the user selects “I want to specify the size/shape of the target area of concern”, all of these additional inputs and selections are hidden and the dialog reverts to the basic use as shown in Figure 1 above.
• Surface Launched / Air Launched selection: If the user selects “Surface Launched” then the various inputs and selections are displayed allowing automatic lookup of target radius based on munition size. If the use selects “Air Launched“ then the “High Explosive / Chemical” selector is changed to “<= 100 lb” or “> 100 lb” selection. All other inputs and selections are hidden. The configuration is illustrated in Figure 14 and 15.
• High Explosive / Chemical selection: If the user selects “High Explosive” then the range of inputs on the slider is 12mm to 326mm (0.47” to 12.83”) and the Target Area radius is looked up from the Target-HE table stored within VSP (see Appendix A). If the user selects Chemical then the range of inputs on the slider is 20mm to 196mm (0.79” to 7.72”) and the Target Area radius is looked up from the table stored within VSP (see Appendix A).
• <= 100 lb / > 100 lb selection: If the user selects “<= 100 lb” then the Target Area radius is set to 714 feet (217.627 m). If the user selects “> 100 lb” then the Target Area radius is set to 1427 feet (434.95 m).
• Slider selection: Allows the user to select a munition size between the minimum and maximum. The selected munition size is shown in the text below the slider. The slider can be moved by the mouse or arrow keys once it is selected.
• mm / inch selection: If the user selects “mm” then the slider limits and munition size text are displayed in millimeters. If the user selects “inch” then the slider limits and munition size text are displayed in inches.
Target Sizing in VSP February 2013 18
Figure 14 – Target area inputs with target sizing lookup enabled
Figure 15 – Target area input for air-launched munitions
Target Sizing in VSP February 2013 19
5 Conclusion This report summarizes the work done by PNNL to incorporate a standardized approach to default target area radius selection. This report in its entirety will be made available from the U.S. Army Corps of Engineers Engineering and Support Center, Huntsville, Environmental and Munitions Center of Expertise. PNNL will not distribute the complete report with all data and appendices. A PNNL-distributable version is available with all tables in section 3, Figures 5-7, Appendix B, and Appendix C removed. We will include modified versions of Figures 8-13 that have all points removed. PNNL has obtained ESTCP and Army COE approval on the unrestricted report version. The information in the unrestricted report is used as the help file in VSP. An appropriate target area radius is the primary driver in establishing a reliable transect spacing to traverse and detect areas of interest within previously used military ranges. TP-16 has been used heavily in the past for this objective. However, as its objectives were not to establish values for use in VSP, we have leveraged all the methods and data from TP-16 to create a “VSP” fragment distance. This work establishes a standardized framework that all projects can leverage for use in VSP transect designs.
6 Acknowledgements The Army Corps of Engineers was key in getting these methods developed and implemented in VSP. Specifically Andrew Schwartz, Michelle Crull, and Susan Hamilton. Michelle and Susan provided us with the data from TP-16 to be able to make adjustments for VSP needs. This work would have been almost impossible without their support. With Versar corporation, Andy has shepherded the idea of standard target area definitions for almost a decade. His guidance and support on getting a tool that will work for all interested parties was invaluable. Lastly, Herb Nelson and ESTCP have funded this work and continue to push the necessary research to improve the usability of VSP in project specific applications.
7 References Andrews, Anne and Nelson, Herb. “ESTCP Pilot Project Wide Area Assessment for Munitions Response”. ESTCP. (2008) Cleveland, W.S. (1979). "Robust Locally Weighted Regression and Smoothing Scatterplots". Journal of the American Statistical Association. 74 (368): 829–836 Cleveland, W.S.; Devlin, S.J. (1988). "Locally-Weighted Regression: An Approach to Regression Analysis by Local Fitting". Journal of the American Statistical Association. 83 (403): 596–610 Hathaway, J., B. Roberts, B. Pulsipher, S. McKenna. “Application of Integrated Visual Sample Plan UXO Design and Analysis Module to the Former Camp Beale for the ESTCP Wide Area Assessment Demonstration”. PNNL. (2008) Jacoby, William G. (2000). “Loess” Electoral Studies 19 (4) (December): 577–613. Versar. “Demonstration and Validation of Target Size Modeling Methods”. ESTCP. (2007)
Target Sizing in VSP February 2013 1
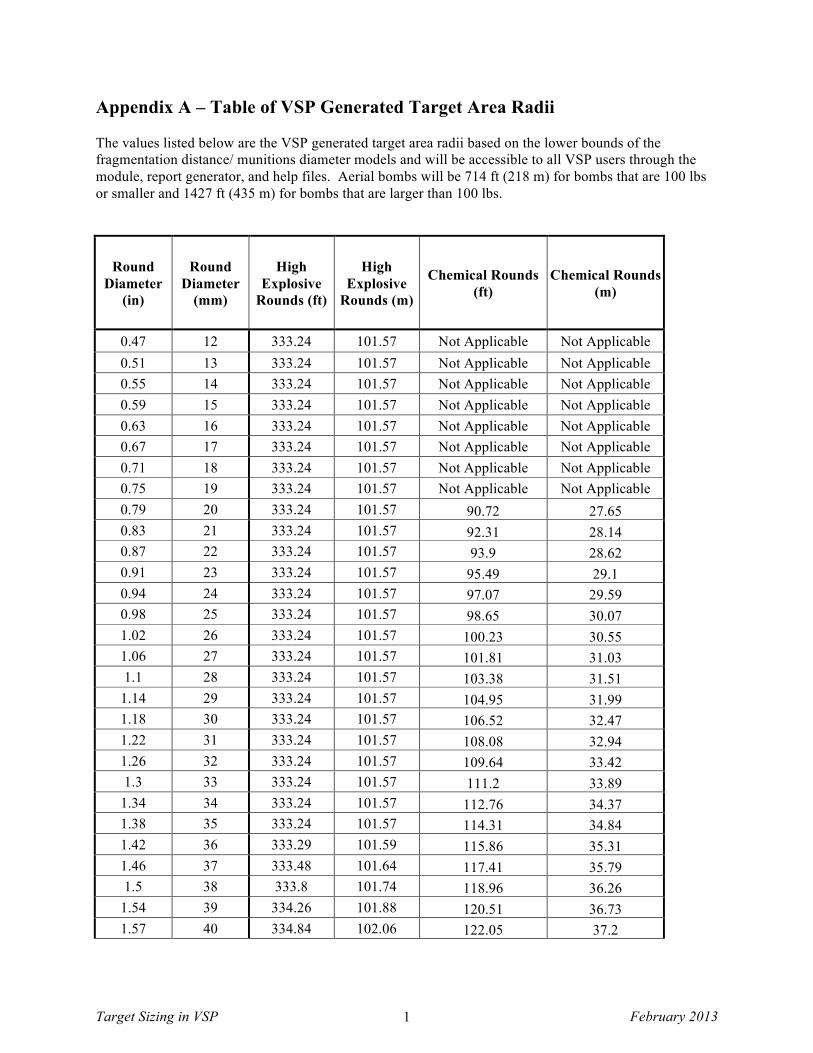
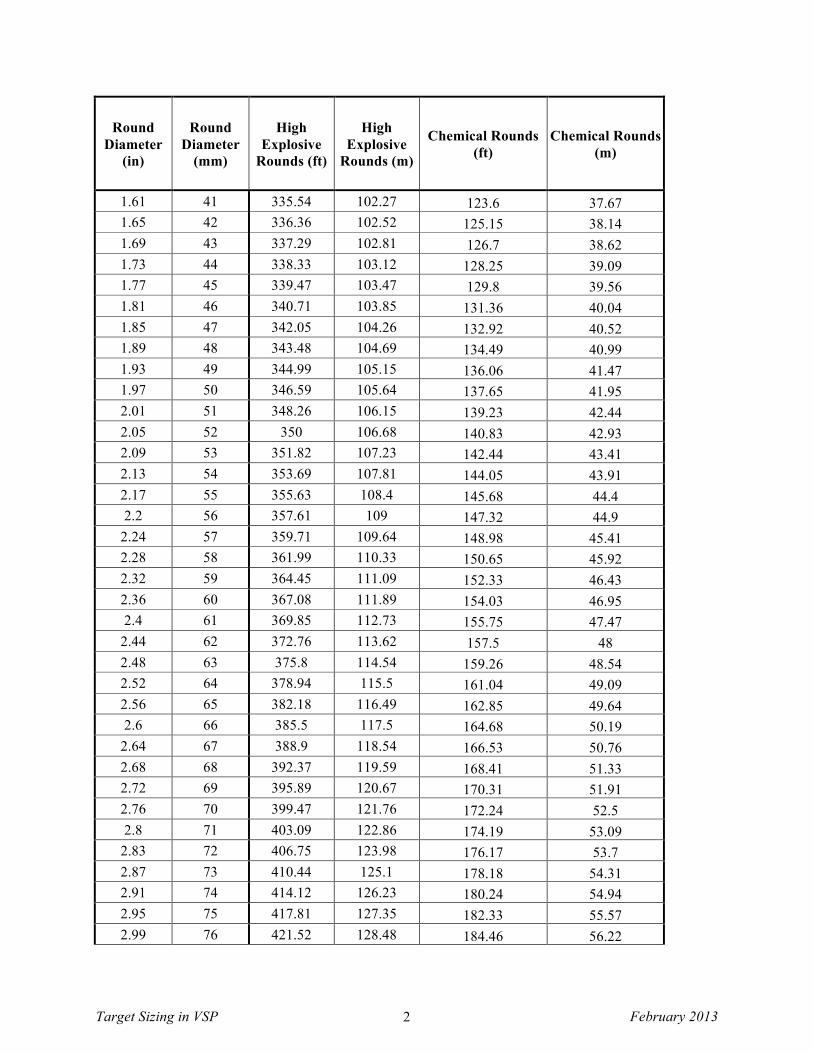
Appendix A – Table of VSP Generated Target Area Radii The values listed below are the VSP generated target area radii based on the lower bounds of the fragmentation distance/ munitions diameter models and will be accessible to all VSP users through the module, report generator, and help files. Aerial bombs will be 714 ft (218 m) for bombs that are 100 lbs or smaller and 1427 ft (435 m) for bombs that are larger than 100 lbs.
Round Diameter
(in)
Round Diameter
(mm)
High Explosive
Rounds (ft)
High Explosive
Rounds (m)
Chemical Rounds (ft)
Chemical Rounds (m)
0.47 12 333.24 101.57 Not Applicable Not Applicable 0.51 13 333.24 101.57 Not Applicable Not Applicable 0.55 14 333.24 101.57 Not Applicable Not Applicable 0.59 15 333.24 101.57 Not Applicable Not Applicable 0.63 16 333.24 101.57 Not Applicable Not Applicable 0.67 17 333.24 101.57 Not Applicable Not Applicable 0.71 18 333.24 101.57 Not Applicable Not Applicable 0.75 19 333.24 101.57 Not Applicable Not Applicable 0.79 20 333.24 101.57 90.72 27.65 0.83 21 333.24 101.57 92.31 28.14 0.87 22 333.24 101.57 93.9 28.62 0.91 23 333.24 101.57 95.49 29.1 0.94 24 333.24 101.57 97.07 29.59 0.98 25 333.24 101.57 98.65 30.07 1.02 26 333.24 101.57 100.23 30.55 1.06 27 333.24 101.57 101.81 31.03 1.1 28 333.24 101.57 103.38 31.51
1.14 29 333.24 101.57 104.95 31.99 1.18 30 333.24 101.57 106.52 32.47 1.22 31 333.24 101.57 108.08 32.94 1.26 32 333.24 101.57 109.64 33.42 1.3 33 333.24 101.57 111.2 33.89
1.34 34 333.24 101.57 112.76 34.37 1.38 35 333.24 101.57 114.31 34.84 1.42 36 333.29 101.59 115.86 35.31 1.46 37 333.48 101.64 117.41 35.79 1.5 38 333.8 101.74 118.96 36.26
1.54 39 334.26 101.88 120.51 36.73 1.57 40 334.84 102.06 122.05 37.2
Target Sizing in VSP February 2013 2
Round Diameter
(in)
Round Diameter
(mm)
High Explosive
Rounds (ft)
High Explosive
Rounds (m)
Chemical Rounds (ft)
Chemical Rounds (m)
1.61 41 335.54 102.27 123.6 37.67 1.65 42 336.36 102.52 125.15 38.14 1.69 43 337.29 102.81 126.7 38.62 1.73 44 338.33 103.12 128.25 39.09 1.77 45 339.47 103.47 129.8 39.56 1.81 46 340.71 103.85 131.36 40.04 1.85 47 342.05 104.26 132.92 40.52 1.89 48 343.48 104.69 134.49 40.99 1.93 49 344.99 105.15 136.06 41.47 1.97 50 346.59 105.64 137.65 41.95 2.01 51 348.26 106.15 139.23 42.44 2.05 52 350 106.68 140.83 42.93 2.09 53 351.82 107.23 142.44 43.41 2.13 54 353.69 107.81 144.05 43.91 2.17 55 355.63 108.4 145.68 44.4 2.2 56 357.61 109 147.32 44.9
2.24 57 359.71 109.64 148.98 45.41 2.28 58 361.99 110.33 150.65 45.92 2.32 59 364.45 111.09 152.33 46.43 2.36 60 367.08 111.89 154.03 46.95 2.4 61 369.85 112.73 155.75 47.47
2.44 62 372.76 113.62 157.5 48 2.48 63 375.8 114.54 159.26 48.54 2.52 64 378.94 115.5 161.04 49.09 2.56 65 382.18 116.49 162.85 49.64 2.6 66 385.5 117.5 164.68 50.19
2.64 67 388.9 118.54 166.53 50.76 2.68 68 392.37 119.59 168.41 51.33 2.72 69 395.89 120.67 170.31 51.91 2.76 70 399.47 121.76 172.24 52.5 2.8 71 403.09 122.86 174.19 53.09
2.83 72 406.75 123.98 176.17 53.7 2.87 73 410.44 125.1 178.18 54.31 2.91 74 414.12 126.23 180.24 54.94 2.95 75 417.81 127.35 182.33 55.57 2.99 76 421.52 128.48 184.46 56.22
Target Sizing in VSP February 2013 3
Round Diameter
(in)
Round Diameter
(mm)
High Explosive
Rounds (ft)
High Explosive
Rounds (m)
Chemical Rounds (ft)
Chemical Rounds (m)
3.03 77 425.3 129.63 186.64 56.89 3.07 78 429.18 130.82 188.84 57.56 3.11 79 433.22 132.05 191.08 58.24 3.15 80 437.47 133.34 193.35 58.93 3.19 81 441.98 134.72 195.64 59.63 3.23 82 446.78 136.18 197.97 60.34 3.27 83 451.85 137.72 200.4 61.08 3.31 84 457.17 139.35 202.94 61.86 3.35 85 462.74 141.04 205.57 62.66 3.39 86 468.54 142.81 208.27 63.48 3.43 87 474.55 144.64 211.05 64.33 3.46 88 480.76 146.54 213.88 65.19 3.5 89 487.15 148.48 216.76 66.07
3.54 90 493.72 150.48 219.66 66.95 3.58 91 500.43 152.53 222.58 67.84 3.62 92 507.27 154.62 225.5 68.73 3.66 93 514.23 156.74 228.41 69.62 3.7 94 521.29 158.89 231.3 70.5
3.74 95 528.43 161.07 234.43 71.45 3.78 96 535.63 163.26 237.99 72.54 3.82 97 542.88 165.47 241.91 73.74 3.86 98 550.16 167.69 246.09 75.01 3.9 99 557.44 169.91 250.42 76.33
3.94 100 564.71 172.12 254.81 77.67 3.98 101 571.95 174.33 259.2 79 4.02 102 579.14 176.52 263.5 80.31 4.06 103 586.27 178.69 267.66 81.58 4.09 104 593.3 180.84 271.64 82.8 4.13 105 600.21 182.95 275.4 83.94 4.17 106 606.99 185.01 278.88 85 4.21 107 613.83 187.1 282.48 86.1 4.25 108 620.86 189.24 286.38 87.29 4.29 109 628.06 191.43 290.44 88.53 4.33 110 635.4 193.67 294.5 89.76 4.37 111 642.86 195.95 298.42 90.96 4.41 112 650.42 198.25 302.09 92.08
Target Sizing in VSP February 2013 4
Round Diameter
(in)
Round Diameter
(mm)
High Explosive
Rounds (ft)
High Explosive
Rounds (m)
Chemical Rounds (ft)
Chemical Rounds (m)
4.45 113 658.05 200.57 305.38 93.08 4.49 114 665.71 202.91 308.49 94.03 4.53 115 673.39 205.25 311.54 94.96 4.57 116 681.06 207.59 314.53 95.87 4.61 117 688.68 209.91 317.46 96.76 4.65 118 696.23 212.21 320.33 97.64 4.69 119 703.67 214.48 323.14 98.49 4.72 120 710.99 216.71 325.88 99.33 4.76 121 718.14 218.89 328.56 100.14 4.8 122 725.09 221.01 331.17 100.94
4.84 123 731.82 223.06 333.73 101.72 4.88 124 738.34 225.04 336.21 102.48 4.92 125 744.81 227.02 338.63 103.21 4.96 126 751.25 228.98 340.99 103.93
5 127 757.65 230.93 343.28 104.63 5.04 128 764.03 232.87 345.5 105.31 5.08 129 770.36 234.81 347.66 105.97 5.12 130 776.65 236.72 349.76 106.61 5.16 131 782.91 238.63 351.79 107.23 5.2 132 789.12 240.52 353.76 107.83
5.24 133 795.29 242.4 355.67 108.41 5.28 134 801.41 244.27 357.52 108.97 5.31 135 807.48 246.12 359.31 109.52 5.35 136 813.5 247.95 361.04 110.04 5.39 137 819.47 249.77 362.71 110.55 5.43 138 825.39 251.58 364.32 111.05 5.47 139 831.26 253.37 365.88 111.52 5.51 140 837.07 255.14 367.39 111.98 5.55 141 842.82 256.89 368.84 112.42 5.59 142 848.52 258.63 370.24 112.85 5.63 143 854.17 260.35 371.58 113.26 5.67 144 859.76 262.05 372.88 113.65 5.71 145 865.29 263.74 374.12 114.03 5.75 146 870.77 265.41 375.32 114.4 5.79 147 876.19 267.06 376.47 114.75 5.83 148 881.56 268.7 377.56 115.08
Target Sizing in VSP February 2013 5
Round Diameter
(in)
Round Diameter
(mm)
High Explosive
Rounds (ft)
High Explosive
Rounds (m)
Chemical Rounds (ft)
Chemical Rounds (m)
5.87 149 886.87 270.32 378.61 115.4 5.91 150 892.13 271.92 379.61 115.71 5.94 151 897.33 273.51 380.54 115.99 5.98 152 902.49 275.08 381.4 116.25 6.02 153 907.59 276.63 382.17 116.48 6.06 154 912.65 278.17 382.86 116.69 6.1 155 917.66 279.7 383.46 116.88
6.14 156 922.62 281.21 383.97 117.03 6.18 157 927.54 282.71 384.39 117.16 6.22 158 932.41 284.2 384.71 117.26 6.26 159 937.25 285.67 384.93 117.33 6.3 160 942.05 287.14 385.06 117.37
6.34 161 946.81 288.59 385.08 117.37 6.38 162 951.54 290.03 385.08 117.37 6.42 163 956.24 291.46 385.08 117.37 6.46 164 960.9 292.88 385.08 117.37 6.5 165 965.53 294.29 385.08 117.37
6.54 166 970.14 295.7 385.08 117.37 6.57 167 974.73 297.1 385.08 117.37 6.61 168 979.28 298.49 385.08 117.37 6.65 169 983.82 299.87 385.08 117.37 6.69 170 988.33 301.24 385.08 117.37 6.73 171 992.81 302.61 385.08 117.37 6.77 172 997.27 303.97 385.08 117.37 6.81 173 1001.7 305.32 385.08 117.37 6.85 174 1006.11 306.66 385.08 117.37 6.89 175 1010.49 308 385.08 117.37 6.93 176 1014.84 309.32 385.08 117.37 6.97 177 1019.17 310.64 385.08 117.37 7.01 178 1023.47 311.95 385.08 117.37 7.05 179 1027.74 313.26 385.08 117.37 7.09 180 1031.99 314.55 385.08 117.37 7.13 181 1036.21 315.84 385.08 117.37 7.17 182 1040.4 317.11 385.08 117.37 7.2 183 1044.56 318.38 385.08 117.37
7.24 184 1048.7 319.64 385.08 117.37
Target Sizing in VSP February 2013 6
Round Diameter
(in)
Round Diameter
(mm)
High Explosive
Rounds (ft)
High Explosive
Rounds (m)
Chemical Rounds (ft)
Chemical Rounds (m)
7.28 185 1052.81 320.9 385.08 117.37 7.32 186 1056.88 322.14 385.08 117.37 7.36 187 1060.93 323.37 385.08 117.37 7.4 188 1064.95 324.6 385.08 117.37
7.44 189 1068.94 325.81 385.08 117.37 7.48 190 1072.9 327.02 385.08 117.37 7.52 191 1076.83 328.22 385.08 117.37 7.56 192 1080.72 329.4 385.08 117.37 7.6 193 1084.59 330.58 385.08 117.37
7.64 194 1088.43 331.75 385.08 117.37 7.68 195 1092.23 332.91 385.08 117.37 7.72 196 1096 334.06 385.08 117.37 7.76 197 1099.74 335.2 Not Applicable Not Applicable 7.8 198 1103.45 336.33 Not Applicable Not Applicable
7.83 199 1107.12 337.45 Not Applicable Not Applicable 7.87 200 1110.76 338.56 Not Applicable Not Applicable 7.91 201 1114.37 339.66 Not Applicable Not Applicable 7.95 202 1117.94 340.75 Not Applicable Not Applicable 7.99 203 1121.48 341.83 Not Applicable Not Applicable 8.03 204 1124.98 342.89 Not Applicable Not Applicable 8.07 205 1128.45 343.95 Not Applicable Not Applicable 8.11 206 1131.88 345 Not Applicable Not Applicable 8.15 207 1135.27 346.03 Not Applicable Not Applicable 8.19 208 1138.63 347.05 Not Applicable Not Applicable 8.23 209 1141.95 348.07 Not Applicable Not Applicable 8.27 210 1145.23 349.07 Not Applicable Not Applicable 8.31 211 1148.48 350.06 Not Applicable Not Applicable 8.35 212 1151.68 351.03 Not Applicable Not Applicable 8.39 213 1154.85 352 Not Applicable Not Applicable 8.43 214 1157.97 352.95 Not Applicable Not Applicable 8.46 215 1161.06 353.89 Not Applicable Not Applicable 8.5 216 1164.1 354.82 Not Applicable Not Applicable
8.54 217 1167.1 355.73 Not Applicable Not Applicable 8.58 218 1170.06 356.64 Not Applicable Not Applicable 8.62 219 1172.98 357.52 Not Applicable Not Applicable 8.66 220 1175.86 358.4 Not Applicable Not Applicable
Target Sizing in VSP February 2013 7
Round Diameter
(in)
Round Diameter
(mm)
High Explosive
Rounds (ft)
High Explosive
Rounds (m)
Chemical Rounds (ft)
Chemical Rounds (m)
8.7 221 1178.69 359.26 Not Applicable Not Applicable 8.74 222 1181.47 360.11 Not Applicable Not Applicable 8.78 223 1184.22 360.95 Not Applicable Not Applicable 8.82 224 1186.91 361.77 Not Applicable Not Applicable 8.86 225 1189.56 362.58 Not Applicable Not Applicable 8.9 226 1192.17 363.37 Not Applicable Not Applicable
8.94 227 1194.72 364.15 Not Applicable Not Applicable 8.98 228 1197.23 364.92 Not Applicable Not Applicable 9.02 229 1199.69 365.66 Not Applicable Not Applicable 9.06 230 1202.1 366.4 Not Applicable Not Applicable 9.09 231 1204.46 367.12 Not Applicable Not Applicable 9.13 232 1206.76 367.82 Not Applicable Not Applicable 9.17 233 1209.02 368.51 Not Applicable Not Applicable 9.21 234 1211.23 369.18 Not Applicable Not Applicable 9.25 235 1213.38 369.84 Not Applicable Not Applicable 9.29 236 1215.48 370.48 Not Applicable Not Applicable 9.33 237 1217.52 371.1 Not Applicable Not Applicable 9.37 238 1219.51 371.71 Not Applicable Not Applicable 9.41 239 1221.44 372.3 Not Applicable Not Applicable 9.45 240 1223.32 372.87 Not Applicable Not Applicable 9.49 241 1225.13 373.42 Not Applicable Not Applicable 9.53 242 1226.9 373.96 Not Applicable Not Applicable 9.57 243 1228.6 374.48 Not Applicable Not Applicable 9.61 244 1230.24 374.98 Not Applicable Not Applicable 9.65 245 1231.82 375.46 Not Applicable Not Applicable 9.69 246 1233.34 375.92 Not Applicable Not Applicable 9.72 247 1234.8 376.37 Not Applicable Not Applicable 9.76 248 1236.19 376.79 Not Applicable Not Applicable 9.8 249 1237.52 377.2 Not Applicable Not Applicable
9.84 250 1238.79 377.58 Not Applicable Not Applicable 9.88 251 1239.99 377.95 Not Applicable Not Applicable 9.92 252 1241.12 378.29 Not Applicable Not Applicable 9.96 253 1242.19 378.62 Not Applicable Not Applicable 10 254 1243.19 378.92 Not Applicable Not Applicable
10.04 255 1244.12 379.21 Not Applicable Not Applicable 10.08 256 1244.98 379.47 Not Applicable Not Applicable
Target Sizing in VSP February 2013 8
Round Diameter
(in)
Round Diameter
(mm)
High Explosive
Rounds (ft)
High Explosive
Rounds (m)
Chemical Rounds (ft)
Chemical Rounds (m)
10.12 257 1245.77 379.71 Not Applicable Not Applicable 10.16 258 1246.49 379.93 Not Applicable Not Applicable 10.2 259 1247.14 380.13 Not Applicable Not Applicable
10.24 260 1247.72 380.3 Not Applicable Not Applicable 10.28 261 1248.22 380.46 Not Applicable Not Applicable 10.31 262 1248.65 380.59 Not Applicable Not Applicable 10.35 263 1249 380.69 Not Applicable Not Applicable 10.39 264 1249.27 380.78 Not Applicable Not Applicable 10.43 265 1249.47 380.84 Not Applicable Not Applicable 10.47 266 1249.59 380.88 Not Applicable Not Applicable 10.51 267 1249.63 380.89 Not Applicable Not Applicable 10.55 268 1249.63 380.89 Not Applicable Not Applicable 10.59 269 1249.63 380.89 Not Applicable Not Applicable 10.63 270 1249.63 380.89 Not Applicable Not Applicable 10.67 271 1249.63 380.89 Not Applicable Not Applicable 10.71 272 1249.63 380.89 Not Applicable Not Applicable 10.75 273 1249.63 380.89 Not Applicable Not Applicable 10.79 274 1249.63 380.89 Not Applicable Not Applicable 10.83 275 1249.63 380.89 Not Applicable Not Applicable 10.87 276 1249.63 380.89 Not Applicable Not Applicable 10.91 277 1249.63 380.89 Not Applicable Not Applicable 10.94 278 1249.63 380.89 Not Applicable Not Applicable 10.98 279 1249.63 380.89 Not Applicable Not Applicable 11.02 280 1249.63 380.89 Not Applicable Not Applicable 11.06 281 1249.63 380.89 Not Applicable Not Applicable 11.1 282 1249.63 380.89 Not Applicable Not Applicable
11.14 283 1249.63 380.89 Not Applicable Not Applicable 11.18 284 1249.63 380.89 Not Applicable Not Applicable 11.22 285 1249.63 380.89 Not Applicable Not Applicable 11.26 286 1249.63 380.89 Not Applicable Not Applicable 11.3 287 1249.63 380.89 Not Applicable Not Applicable
11.34 288 1249.63 380.89 Not Applicable Not Applicable 11.38 289 1249.63 380.89 Not Applicable Not Applicable 11.42 290 1249.63 380.89 Not Applicable Not Applicable 11.46 291 1249.63 380.89 Not Applicable Not Applicable 11.5 292 1249.63 380.89 Not Applicable Not Applicable
Target Sizing in VSP February 2013 9
Round Diameter
(in)
Round Diameter
(mm)
High Explosive
Rounds (ft)
High Explosive
Rounds (m)
Chemical Rounds (ft)
Chemical Rounds (m)
11.54 293 1249.63 380.89 Not Applicable Not Applicable 11.57 294 1249.63 380.89 Not Applicable Not Applicable 11.61 295 1249.63 380.89 Not Applicable Not Applicable 11.65 296 1249.63 380.89 Not Applicable Not Applicable 11.69 297 1249.63 380.89 Not Applicable Not Applicable 11.73 298 1249.63 380.89 Not Applicable Not Applicable 11.77 299 1249.63 380.89 Not Applicable Not Applicable 11.81 300 1249.63 380.89 Not Applicable Not Applicable 11.85 301 1249.63 380.89 Not Applicable Not Applicable 11.89 302 1249.63 380.89 Not Applicable Not Applicable 11.93 303 1249.63 380.89 Not Applicable Not Applicable 11.97 304 1249.63 380.89 Not Applicable Not Applicable 12.01 305 1249.63 380.89 Not Applicable Not Applicable 12.05 306 1249.63 380.89 Not Applicable Not Applicable 12.09 307 1249.63 380.89 Not Applicable Not Applicable 12.13 308 1249.63 380.89 Not Applicable Not Applicable 12.17 309 1249.63 380.89 Not Applicable Not Applicable 12.2 310 1249.63 380.89 Not Applicable Not Applicable
12.24 311 1249.63 380.89 Not Applicable Not Applicable 12.28 312 1249.63 380.89 Not Applicable Not Applicable 12.32 313 1249.63 380.89 Not Applicable Not Applicable 12.36 314 1249.63 380.89 Not Applicable Not Applicable 12.4 315 1249.63 380.89 Not Applicable Not Applicable
12.44 316 1249.63 380.89 Not Applicable Not Applicable 12.48 317 1249.63 380.89 Not Applicable Not Applicable 12.52 318 1249.63 380.89 Not Applicable Not Applicable 12.56 319 1249.63 380.89 Not Applicable Not Applicable 12.6 320 1249.63 380.89 Not Applicable Not Applicable
12.64 321 1249.63 380.89 Not Applicable Not Applicable 12.68 322 1249.63 380.89 Not Applicable Not Applicable 12.72 323 1249.63 380.89 Not Applicable Not Applicable 12.76 324 1249.63 380.89 Not Applicable Not Applicable 12.8 325 1249.63 380.89 Not Applicable Not Applicable
12.83 326 1249.63 380.89 Not Applicable Not Applicable

Target Sizing in VSP February 2013 1
Appendix B – VSP Fragment Distances These values will not be available in VSP or distributed by PNNL. They will be available for the Army Corps of Engineers to supply to contractors in much the same fashion as TP-16 is distributed.
REMOVED FOR PNNL VERSION

Target Sizing in VSP February 2013 1
Appendix C – Linear Model Output and Graphics In following three figures, the blue line show the 5th order fit, the red line shows the 3rd order fit, and the green line shows the 2nd order fit. The shaded area on each model is the region from the mean fit line to the lower bound of the prediction interval.
REMOVED FOR PNNL VERSION