advanced clean transit · complete transition to a zero emission bus fleet by 2040 or sooner...
TRANSCRIPT

Advanced Clean Transit May 2015
Mobile Source Control Division
Air Resources Board
1

Introduction
The importance of public transit
Air quality and climate change goals
Technology assessment
Costs and funding
Proposed amendments
Discussion topics
Timeline and contacts
Agenda
2

Introduction
3

Transit Fleet Rule originally adopted in 2000
Transit fleet vehicles & urban buses achieved significant PM and NOx emissions reductions
Diesel fuel path fleets
More than 50% of the new purchase are hybrid
Zero emission bus demonstration and purchases
12 fuel cell bus demonstration in Bay Area
Alternative fuel path fleets
Converted to natural gas
Transit Fleet Achievements
4

Significant advancements for zero emission buses in the past few years
Are commercially available
Costs have come down substantially
Have reliable performance
Zero emission buses are operated in California successfully
Zero Emission Bus Technologies Have Matured
5

Many Fleets Operating Zero Emission Buses in California
6
Bus Operator Technology
Type
Total
Buses
Operating
period (yrs)
Antelope Valley Transit Battery 2 <1
Foothill Transit Battery 15 4
LA MTA Battery 5 --
San Joaquin RTD* Battery 2 2
Stanford Battery 13 1
SunLine Transit Fuel Cell 4 4
UC, Irvine Fuel Cell 1 --
ZEBA (AC Transit lead) Fuel Cell 13 8
Total 53 --
*As of 4/1/2015 five more buses under contract for delivery

Driving Change
Significant reductions needed to meet air quality and climate goals, and reduce dependence on depletable resources
Achieving goals will require a transformational change in every sector
Zero emission technologies will be necessary where feasible
Near-zero emission technologies need to be applied everywhere else
Transit fleets will play a major role

Transit buses are highly suitable for advanced technologies
Operate in congested areas where pollution is a problem
Centrally located and fueled
Government support
Experiences aid other fleets in deploying heavy-duty zero-emission vehicles
Zero-emission technology in buses can be transferable
Leading the Way
8

Complete transition to a zero emission bus fleet by 2040 or sooner
Require near-zero emission technology and fuels for conventional engines during transition
Low NOx engines with use of low carbon intensity fuels
Provide regional flexibility for zero emission bus goals
Encourage innovative transit beyond buses
Key Step to Zero and Near-Zero Emissions Begins with Transit
9
The Importance of Public Transit
10

Provides safe, reliable, affordable transportation to millions every day
Transit reduces
Roadway congestion
Emissions
Reliance on petroleum and automobiles
Supports sustainable communities goals and improves air quality
Leads technology advancement
Transit Systems Provide a Critical Public Service
11

Buses
Trains
Ferries
Trolley
Other (shuttles, paratransit)
Modes of Transportation
12

Urban bus service
Short routes with frequent stops in urban centers
Typically served by low floor transit bus
Commuter service
Travel between urban centers at peak times
Typically served by motor coaches
Paratransit service
Flexible transportation, supplements fixed-route service
Bus Operation
13

The Sustainable Communities and Climate Protection Act of 2008 (SB 375)
Reduce GHG emissions through coordinated transportation and land use planning
Improve transit system efficiencies while reducing passenger car use
Role in Sustainable Communities and Climate Protection
14
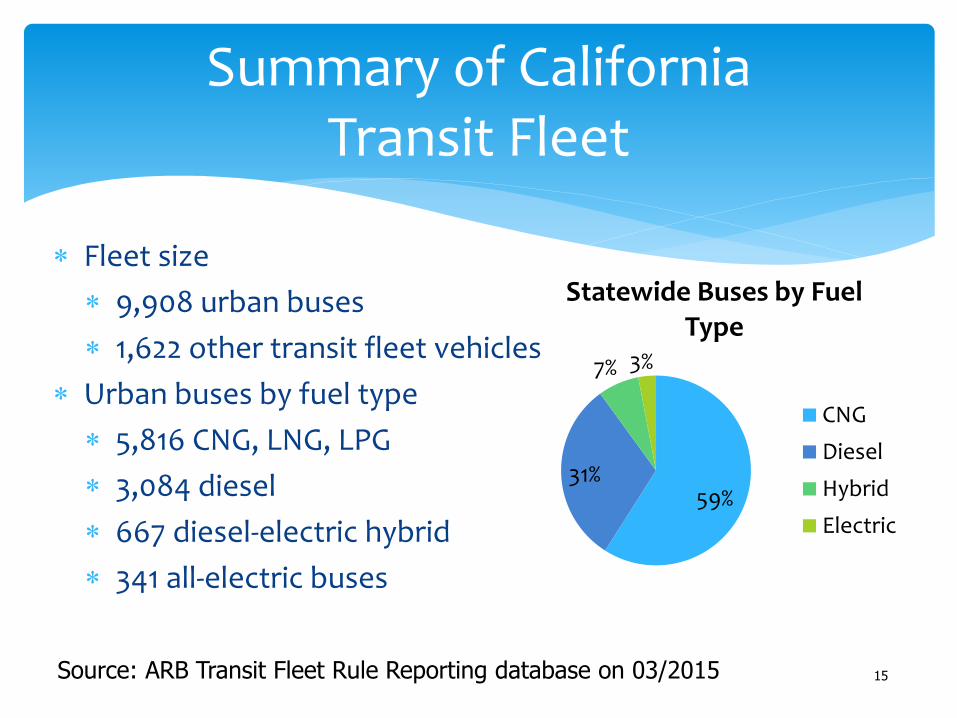
Fleet size
9,908 urban buses
1,622 other transit fleet vehicles
Urban buses by fuel type
5,816 CNG, LNG, LPG
3,084 diesel
667 diesel-electric hybrid
341 all-electric buses
Summary of California Transit Fleet
15 Source: ARB Transit Fleet Rule Reporting database on 03/2015
59% 31%
7% 3%
Statewide Buses by Fuel Type
CNG
Diesel
Hybrid
Electric

Air Quality and Climate Goals
16

Significant technology advancement needed to meet air quality, climate, petroleum reduction, and public health goals:
40% reduction in GHG by 2030
50 % reduction in petroleum use by 2030
90% reduction in NOx by 2031
80% reduction in GHG by 2050
Continued reductions in diesel PM and air toxics to protect public health
Air Quality and Climate Change Goals
17
Statewide NOx Emissions
18
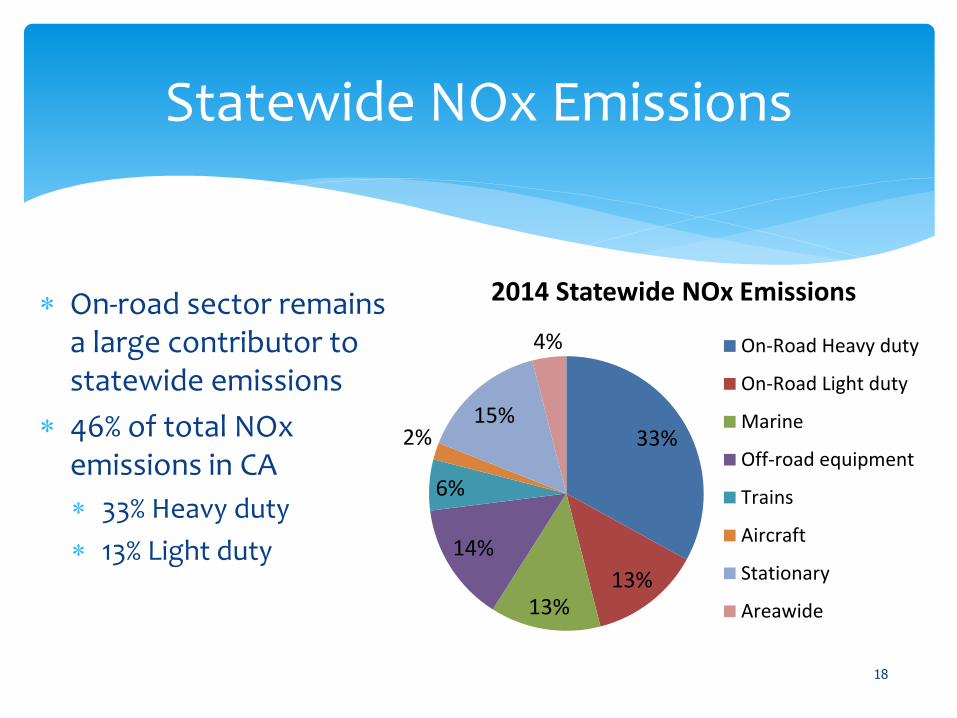
On-road sector remains a large contributor to statewide emissions
46% of total NOx emissions in CA
33% Heavy duty
13% Light duty
33%
13% 13%
14%
6%
2% 15%
4%
2014 Statewide NOx Emissions
On-Road Heavy duty
On-Road Light duty
Marine
Off-road equipment
Trains
Aircraft
Stationary
Areawide

Statewide GHG Emissions
19
On-road sector contributes to
30% of total GHG emissions in CA 30%
20%
19%
7%
6%
4%
2012 Statewide GHG Emissions
On-Road
Industrial
Electricity
Agriculture
Residential
Commercial

Planning efforts focus on Achieving climate change emissions reduction
targets Meeting ozone air quality standards Technology development, deployment, and
incentives
Zero emission technologies will be needed everywhere feasible and near zero emission everywhere else as technology matures
Zero emission buses are a key part of strategy
ARB Planning Strategies to Meet Goals
20

Technology Assessment
21

Zero emission bus purchase requirement on hold pending technology review
Resolution 09-49; (January 2010 mailout, MSC #10-04)
Technology assessment conclusions
Over the past 5 years technology has matured
Costs have come down substantially
Both battery and fuel cell electric buses ready for transit applications
Existing Zero Emission Bus Requirements on Hold
22 More information on the technical assessments can be found at: http://www.arb.ca.gov/msprog/tech/tech.htm.

Zero emission technologies
Battery electric buses
Fuel cell electric buses
Other advanced technologies
Hybrid buses
Low NOx engines
Renewable fuels
Bus Technology and Fuel Options
23
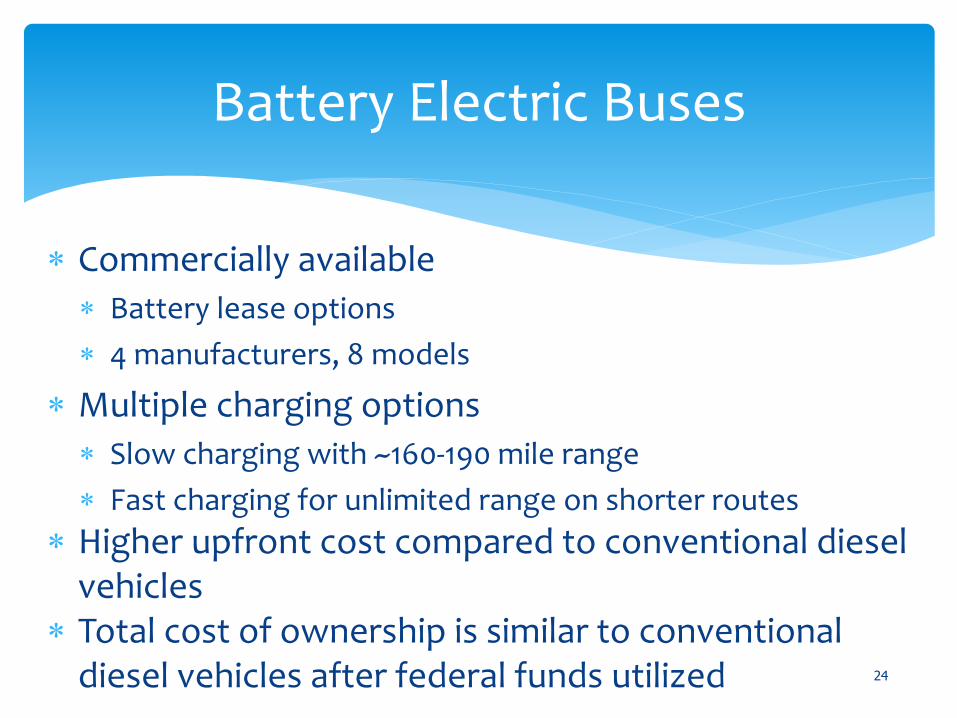
Commercially available
Battery lease options
4 manufacturers, 8 models
Multiple charging options
Slow charging with ~160-190 mile range
Fast charging for unlimited range on shorter routes
Higher upfront cost compared to conventional diesel vehicles
Total cost of ownership is similar to conventional diesel vehicles after federal funds utilized
Battery Electric Buses
24

Technology Manufacturer Bus Type Charge/Fuel Time
Battery BYD 30’ 2-4 hours
Battery BYD 35’ 2-4 hours
Battery BYD *40’ 2-4 hours
Battery BYD 60’ Articulated 2-3 hours
Battery Proterra *35’ Fast Charge (<10 min.)
Slow Charge (90 min.)
Battery Proterra *40’ Fast Charge (<10 min.)
Slow Charge (90 min.)
Battery Nova 40’ Fast Charge (6 min.)
Battery New Flyer 40’ Slow Charge 96 min.
Fast charge 4-6 min.
Commercially Available Battery Electric Buses
* Completed Altoona testing 25

Battery Electric Buses Currently Operating in California
26
Bus Operator Total Active
Buses
Operating Period
(years)
Antelope Valley Transit 2 <1
Foothill Transit 15 4
LA MTA 5 --
San Joaquin RTD* 2 2
Stanford 13 1
Total 37 --
*As of 4/1/2015 five more buses under contract for delivery

Early commercialization Capital costs substantially higher than conventional and
battery electric buses Expect further cost reductions over time
Two manufacturers
Performance, durability and availability similar to conventional buses
Hydrogen fueling 4-6 minutes
Range of ~300 miles
Operational flexibility same as conventional buses
Fuel Cell Electric Buses
27

Technology Manufacturer Bus Type Fuel Time
Fuel Cell New Flyer 40’ 4-6 min.
Fuel Cell New Flyer 60’ 4-6 min.
Fuel Cell El Dorado National 41’ 4-6 min.
Fuel Cell Electric Buses
28

Fuel Cell Electric Buses Operating in California
29
Bus Operator Total Active
Buses
Operating Period
(years)
SunLine Transit 4 13
UC Irvine 1 --
ZEBA (AC Transit lead) 12 8
Total 17 --
About 50 percent of current diesel purchases Reduces GHG emissions with improved fuel
efficiency
Support supply chain for zero emission drivetrain and components
Hybrids certified to same emission standards as conventional diesel and natural gas vehicles
Conventional Hybrid Buses
30

Expected to be available for CNG buses in 2016-2017 Certified to ARB optional low NOx standards Likely to be 90% lower NOx than existing engines
Expect limited impact on bus cost
Low NOx Engines
31

Renewable fuels are commonly available
Renewable natural gas
Renewable diesel
Biodiesel
Power to gas from renewables
Renewable Fuels
32
Low Carbon Fuel Standard: http://www.arb.ca.gov/fuels/lcfs/lcfs.htm

GHG emissions compared with a well-to-wheel analysis where the emissions associated with the vehicle use and fuel consumed
Regardless of where the activity occurs
NOx emissions compared by engine certification standard
Reflects regional exposure where engine exhaust occurs
In-use comparison varies by a number of factors
Emissions Comparison
33

Urban Bus GHG Emission Comparison
34 Low Carbon Fuel Standard Carbon Intensity as of April 28, 2015
0
500
1,000
1,500
2,000
2,500
3,000
3,500
4,000
ICE-
Dsl
(MY
20
10
)
CN
G(M
Y 2
01
0)
ICE-
Dsl
(MY
20
24
)
CN
G(M
Y 2
02
4)
Hyb
rid
-Dsl
(MY
20
24
)
Elec
tric
(MY
20
24
)
Fue
l Cel
l(M
Y 2
02
4)
Dra
ft G
HG
Em
issi
on
Fac
tor
(g/m
i)
Fuel Production and Delivery Vehicle Emissions
(Model Year Vehicle)
Diesel Reference CNG Reference
All LCFS carbon intensity are draft proposed and subject to change until LCFS readoption in 2015.
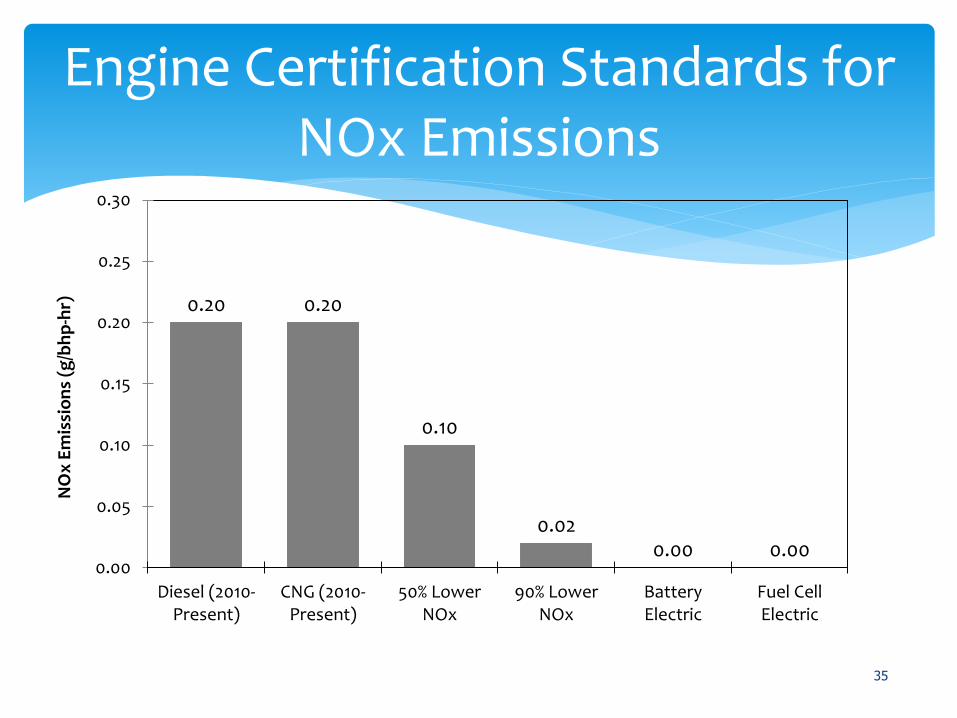
Engine Certification Standards for NOx Emissions
35
0.20 0.20
0.10
0.02 0.00 0.00
0.00
0.05
0.10
0.15
0.20
0.25
0.30
Diesel (2010-Present)
CNG (2010-Present)
50% LowerNOx
90% LowerNOx
BatteryElectric
Fuel CellElectric
NO
x E
mis
sio
ns
(g/b
hp
-hr)

Costs and Funding
36

Federal Transportation Agency (FTA)
80% of capital funding for buses (Section 5307)
Funds distributed by MPO/RTPA
Funding requirements for buses: Buy America, Altoona tested and have a 12 year minimum service life
Must maintain minimum spare ratio
Operation and maintenance funded mainly through local funds
Ticket fares, sales tax, property taxes, bridge tolls, etc.
Normal Transit Funding Sources
37

Bus Capital Cost Comparison
38
Technology Purchase Price Estimated
FTA Section 5307 Funding
Transit Agency Cost Share
Incremental Cost to Transit
Agencies above Diesel
Diesel $485,000 $398,000 $87,300 ---
Natural Gas $525,000 $431,000 $95,000 $7,000
Diesel Hybrid $758,000 $622,000 $136,000 $49,000
Battery Electric $800,000 $656,000 $144,000 $57,000
Fuel Cell Electric* $1,300,000 $1,066,000 $234,000 $147,000

Incremental Cost Example: Battery Electric Buses
39
*Assume standard overnight charging *Does not include $17,000 in annual fuel savings for battery electric *Does not include maintenance bay upgrades and training
Diesel CNG Battery Electric
Bus Cost $485,000 $525,000 $800,000
Charger and Installation 0 0 $40,000
FTA Formula Funds -$398,000 -$431,000 -$656,000
HVIP1 0 0 -$110,000
Net Transit Agency Cost $87,000 $94,000 $74,000
1Hybrid and Zero Emission Truck and Bus Voucher Incentive Project

Analysis period 2018 to 2040
Total cost of ownership comparison
Bus, fueling and maintenance facility infrastructure
Fuel and maintenance costs
Cost analysis at transit fleet level
Normal replacement practices
Projection of likely actions with rule
Information on type(s) of buses that can serve needs
Annual mileage, fuel use, cost of fuel or electricity
Cost Analysis
40
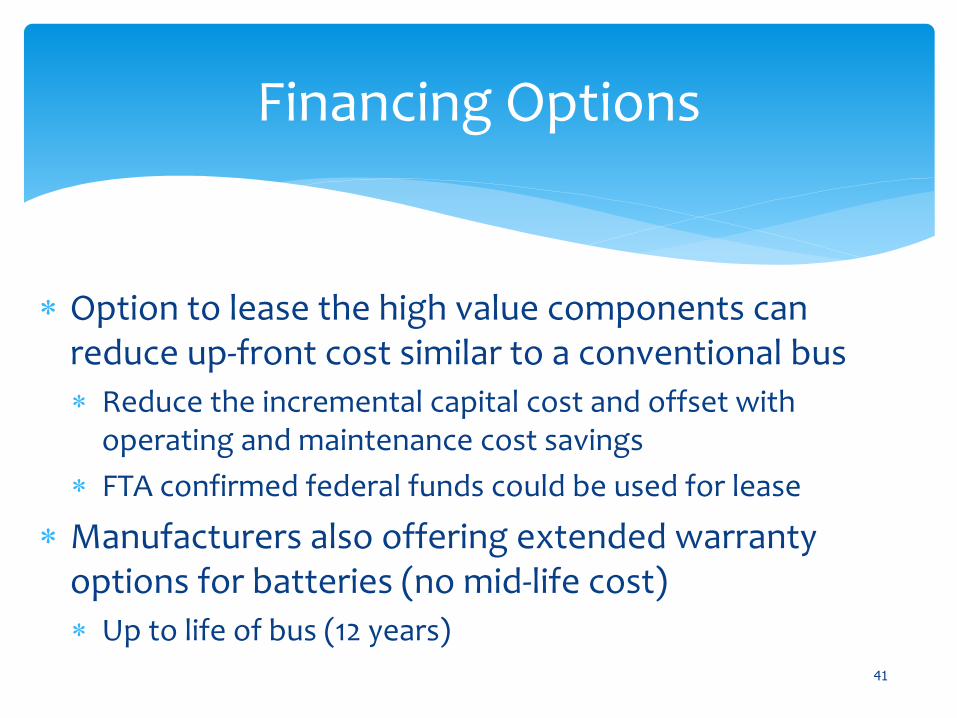
Option to lease the high value components can reduce up-front cost similar to a conventional bus
Reduce the incremental capital cost and offset with operating and maintenance cost savings
FTA confirmed federal funds could be used for lease
Manufacturers also offering extended warranty options for batteries (no mid-life cost)
Up to life of bus (12 years)
Financing Options
41

Proposed Amendments
42

Beginning January 1, 2018
Low initial targets allow fleets to prepare and become familiar with technologies
Requirements will increase over time, with goal to achieve full zero emission fleet by 2040
Base requirements on percentage of bus purchases
Potentially higher initial credit for fuel cell electric buses
Potentially additional time for smaller transit fleets
Need to establish appropriate size threshold
Zero Emission Bus Targets
43

2040 Zero Emission Bus Goal Requires Action Now
44
0%
10%
20%
30%
40%
50%
60%
70%
80%
90%
100%
201
5
202
0
202
5
203
0
203
5
204
0
Pe
rce
nt
of
Fle
et
More Than One Way to Reach Zero Emission Goal
Scenario 1
Scenario 2
Scenario 3
Scenario 4
Year

Beginning January 1, 2017
Purchase best available technology at time of replacement
Purchase renewable diesel or CNG for entire fleet at time of fuel contract
Need to discuss role of hybrid electric buses
Potential for zero emission miles
All transit fleet vehicles must have PM filters
Minimize Emissions from Conventional Fleet
45

Option for transit fleets to pool bus purchases
Meet same total zero emission bus milestone
Allows for flexibility for vehicle and infrastructure deployment
Regional Flexibility Options
46

Opportunity for transit fleets and regional planning agencies to transform passenger transportation with creative methods and new technologies
Result in additional GHG reduction
Beyond buses and conventional technologies
Provide additional flexibility in zero emission bus requirements
Potential to be recognized in meeting regional Sustainable Communities Strategies (SB375)
Innovative Transit Beyond Buses
47

Incentives alignment with federal formula funding
Role for hybrids (including plug-ins)
Economic analysis data and assumptions
Axle weight
Areas Staff is Working On
48

Bus purchases prohibited if exceeding axle weight limits California: 20,500 lbs./axle Federal: 24,000 lbs./axle
Bus axle weight limits commonly exceeded when at capacity
Higher axle weights result in greater road wear National study identified pros and cons of potential options1
American Public Transportation Association Continuing to monitor outcome
Bus Axle Weight Status
49
1http://www.apta.com/resources/reportsandpublications/Documents/An-Analysis-of-Transit-Bus-Axle-Weight-Issues-TCRP-J11-T20.pdf

Discussion Topics
50

How to phase-in requirements for zero emission bus purchases in a manner that is consistent with existing purchase patterns?
How existing funding programs could be improved to provide more certainty about available funding and funding levels?
Should smaller transit fleets be given more time to phase-in zero emission buses?
Discussion Topics (1)
51

How to encourage deployments of fuel cell buses to bring them into broader commercialization?
How should conventional and plug-in hybrid (PHEV) buses be included in the strategy?
What are the approaches to build innovative transit beyond buses?
Discussion Topics (2)
52

Summer 2015: Public workshops
September 2015: Update to Board on progress
Winter 2015: Public workshops
Spring 2016: Board hearing
Timeline
53

Lynsay Carmichael, Staff - In-Use Control Measures Section
(916) 322-0407
Sara Dastoum, Staff – Zero Emission Truck and Bus Section
(916) 323-1696
Peter Christensen, Manager - Incentive Strategies Section
(916) 322-1520
Contacts
54