advanced crystal examples - centralsquare
TRANSCRIPT

Crystal Report Examples – Advanced Training
Advanced Crystal Examples
Contents Example 22A .................................................................................................................................... 1
Example 23A .................................................................................................................................... 5
Example 24A .................................................................................................................................... 8
Example 25A .................................................................................................................................. 10
Example 26A .................................................................................................................................. 12
Example 27A .................................................................................................................................. 17
Example 28A .................................................................................................................................. 19
Example 29A .................................................................................................................................. 22
Example 30A .................................................................................................................................. 24
Example 31A .................................................................................................................................. 25
Example 32A .................................................................................................................................. 27
Example 22A

ExA-2
Modify the Request List Report (ReqListWeb.rpt) to limit the Category to Sewer Manholes,
Group on Problem and add a graph.
Original
Revised (CT_ReqListMHProbGraphWeb.rpt)
Solution

ExA-3
1. From the Lucity Web Request module export ReqListWeb.rpt and name the new report
CT_ReqListMHProbGraphWeb.rpt.
2. Open CT_ReqListMHProbGraphWeb.rpt and remove the Save Data with Report option.
3. Click on Select Expert and limit the Category Code (RQ_CAT_CD) to USCMH. This will
bring in just the Sewer Manhole category.
• Remove the Category header title and field.
4. Group on the Problem text field.
a. Click on the Problem field (RQ_PROB_TY)
b. Click Insert Group
c. OK
d. Left align the Group Name field with the Title.
e. Remove Problem header title and field.
5. Rearrange the Column headers and fields to match the “Change to” example.
a. Header information bold.
b. “Comments for work Order” in italic.
6. Change Comment subreport text to italic.
7. Change title to “Manhole Request List by Problem”
8. Add count of Request Number (RQ_NUMBER) and place in the Problem Group Footer.
Left align.
9. Add text object to Problem Group Footer “Number of Requests”.
a. Drag the Problem text field (RQ_PROB_TY) between “of” and “Requests”.
b. Right align field.
c. Increase text box width.
10. Unsuppress the Report Footer and increase the size to 3”.
11. Add a Bar graph.
a. Click Insert Chart.
b. Click in the Report Footer to place the chart.
c. In Chart Expert remove the Auto-Text checks and change the text for the Title,
Group Title (x) and Data Title (y). See “Change to” example.
d. OK
12. Remove the Group (Problem) axes names.

ExA-4
a. Click on a Group axis name to highlight.
b. Right click in the highlighted box and select Format Axis Label…
c. Under Color select Transparent.
d. OK
13. Move the Group axis title (Problem) up closer to the graph by click and drag.
14. Change the line in the Detail c section to black.
15. Increase the space of the Group footer 1 section to about 3/8”.

ExA-5
Example 23A
Modify the Sewer Pipe Summary Report (PipeSum.rpt) to group by Material and Pipe Diameter.
Use a doughnut graph to show percentage of the number of pipes of each diameter for each
material type.
Original
Revised
Solution
1. From the Sewer Report folder, open CT_PipeMatDia1.rpt.
2. Remove Width, Length, Sec Length and Liner column header and fields.
ExA-6
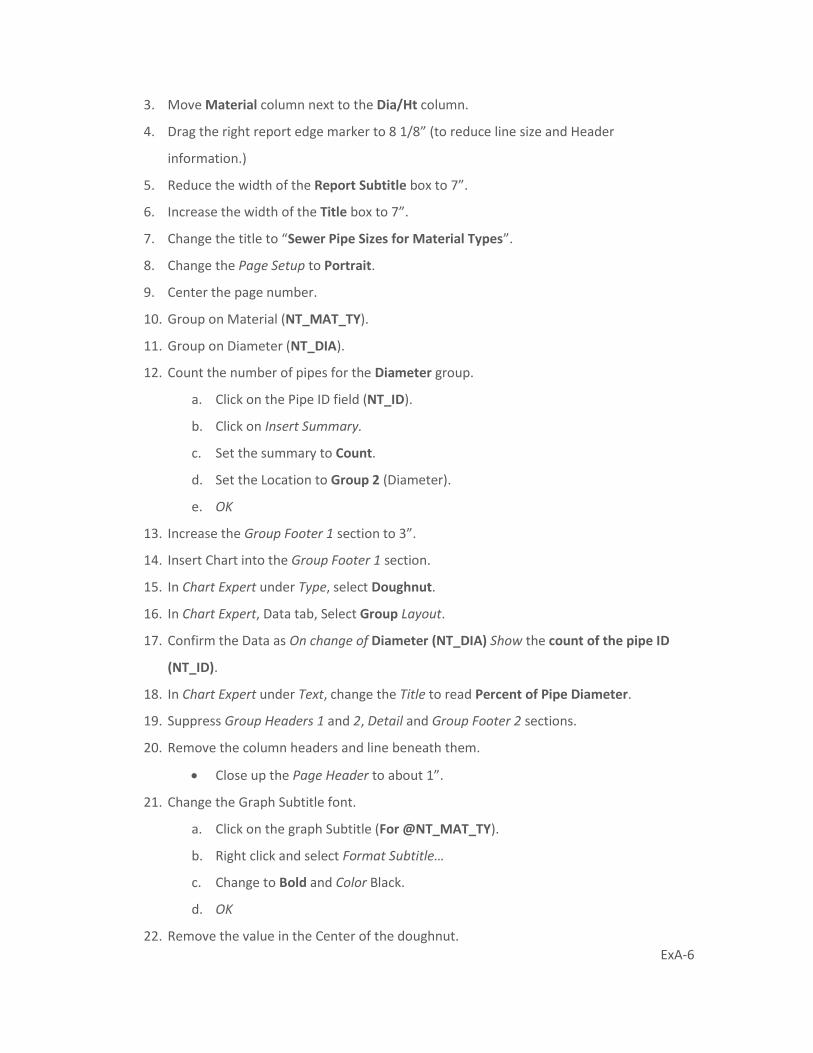
3. Move Material column next to the Dia/Ht column.
4. Drag the right report edge marker to 8 1/8” (to reduce line size and Header
information.)
5. Reduce the width of the Report Subtitle box to 7”.
6. Increase the width of the Title box to 7”.
7. Change the title to “Sewer Pipe Sizes for Material Types”.
8. Change the Page Setup to Portrait.
9. Center the page number.
10. Group on Material (NT_MAT_TY).
11. Group on Diameter (NT_DIA).
12. Count the number of pipes for the Diameter group.
a. Click on the Pipe ID field (NT_ID).
b. Click on Insert Summary.
c. Set the summary to Count.
d. Set the Location to Group 2 (Diameter).
e. OK
13. Increase the Group Footer 1 section to 3”.
14. Insert Chart into the Group Footer 1 section.
15. In Chart Expert under Type, select Doughnut.
16. In Chart Expert, Data tab, Select Group Layout.
17. Confirm the Data as On change of Diameter (NT_DIA) Show the count of the pipe ID
(NT_ID).
18. In Chart Expert under Text, change the Title to read Percent of Pipe Diameter.
19. Suppress Group Headers 1 and 2, Detail and Group Footer 2 sections.
20. Remove the column headers and line beneath them.
• Close up the Page Header to about 1”.
21. Change the Graph Subtitle font.
a. Click on the graph Subtitle (For @NT_MAT_TY).
b. Right click and select Format Subtitle…
c. Change to Bold and Color Black.
d. OK
22. Remove the value in the Center of the doughnut.

ExA-7
a. Right click on the chart and select Chart Options…
b. Under Data labels, uncheck the Show Pie Total option.
c. OK

ExA-8
Example 24A
The report created in Example 23A showed the Legend in ascending order by pipe diameter. In
this example we would like the Legend to show in order of percent.
Original (CT_PipeMatDia1.rpt)
Solution
1. Use a Copy of CT_PipeMatDia1.rpt and name it CT_PipeMatDia2.rpt.
2. Change the Summary field to show as a percent.
a. Right click on the summary field and select Edit Summary...
b. Under Options check Show as a percentage of.
c. The drop down box should show Group #1.
d. OK
3. Change the sort for the report.
a. Click on the summary field.

ExA-9
b. Click on Group Sort Expert .
c. OK

ExA-10
Example 25A We will add a crosstab to the Request Summary Report (ReqSum.rpt).
The report will query a date range and list the employees in the Recorded By field (RQ_REC_BY)
and show for each day the number of requests created.
The report will show only the crosstab.
Original
Revised
Solution
1. In the Work Report folder, open CT_ReqByDt.rpt.
2. Keep the RQ_NUMBER and @ReqDate fields; remove all other fields and all Column
Titles.
3. In the Report Footer section remove the Total Requests text box and summary field.
4. Reduce the width of the lines to 8” and move the Print Date and Print Time fields to
have their right edge at 8”.
5. In Page Setup change the orientation to Portrait.
6. Change the title to “Daily Number of Requests Summary”.
7. Add Start Date and End Date parameters.
a. In Field Explorer right click on Parameter Fields.
b. Type in a Name (Start Date) and select the Type (Date).

ExA-11
c. OK
d. Repeat for End Date.
8. Use the Date parameters to select records.
a. In the report, click on the @ReqDate formula.
b. Click on Select Expert
c. From the drop down box select is between.
d. Then select the two parameter fields (Start Date and End Date).
e. OK
9. Increase the Report Footer section to 1”.
10. Add a Cross-Tab.
a. Click on the Insert Cross-Tab button or in the menu bar click on Insert > Cross-
Tab…
b. Click in the Report Footer section to place the crosstab.
11. Set up the Cross-Tab.
a. Right click in the top left corner of the Cross-Tab and select Cross-Tab Expert…
b. Set up Columns (@ReqDate), Rows (WKREQ.RQ_REC_BY) and Summarized
fields (Count of WKREQ.RQ_NUMBER)
c. In the Customize Style tab review the options and make sure the Column Totals
on Top and Row Totals on Left are unchecked.
d. OK
12. Add a text field to the top left box that says “Recorded By”.
13. Suppress the Detail section.
14. Preview and adjust cell sizes.
15. Change the font of the Total cells to bold.
ExA-12
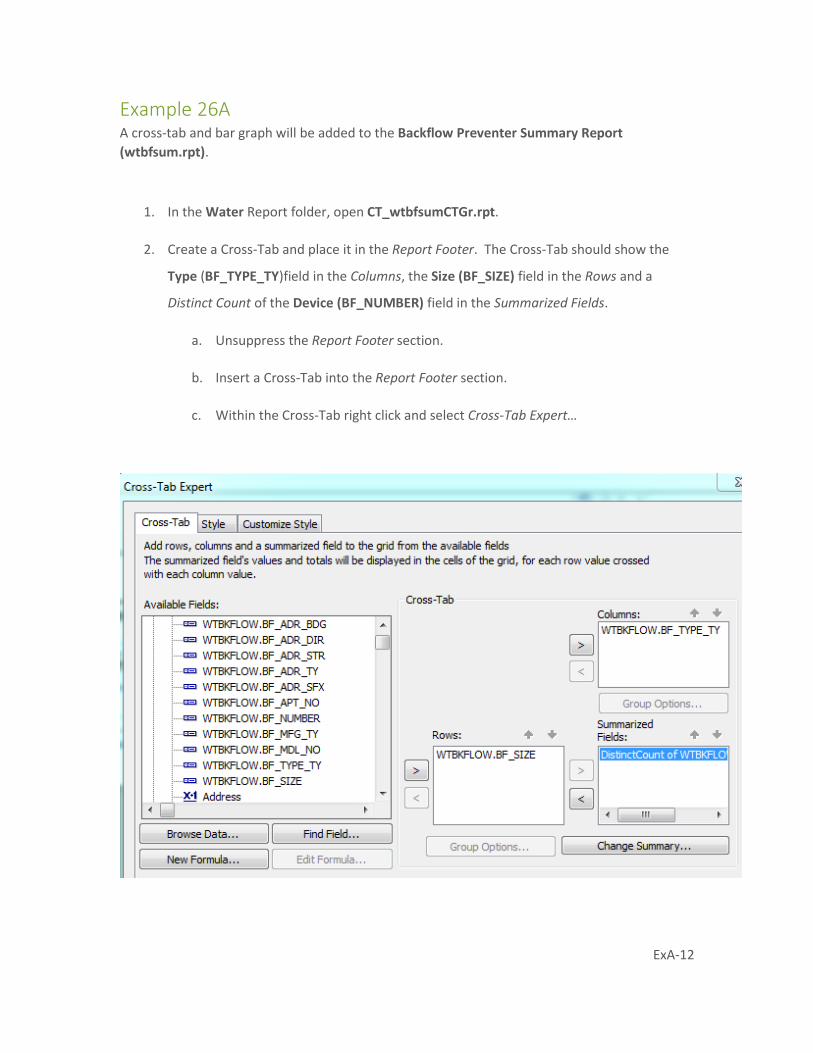
Example 26A A cross-tab and bar graph will be added to the Backflow Preventer Summary Report
(wtbfsum.rpt).
1. In the Water Report folder, open CT_wtbfsumCTGr.rpt.
2. Create a Cross-Tab and place it in the Report Footer. The Cross-Tab should show the
Type (BF_TYPE_TY)field in the Columns, the Size (BF_SIZE) field in the Rows and a
Distinct Count of the Device (BF_NUMBER) field in the Summarized Fields.
a. Unsuppress the Report Footer section.
b. Insert a Cross-Tab into the Report Footer section.
c. Within the Cross-Tab right click and select Cross-Tab Expert…

ExA-13
d. Within the Customize Style tab, set the totals to be on the right and the bottom.
e. OK
3. Add another Report Footer section. (RFb)
4. Add a bar graph to this section. The Data should use the Cross-Tab with the “On Change
of” being the Type field, Subdivided by Size and Showing the distinct count of Device
number.

ExA-14
a. Insert a graph into the Report Footer b section.
b. In the Chart Expert set the Data tab up as follows:
c. OK
5. Right click in the chart and select Chart Options…
a. In the Legend tab the Color Mode should be on Color by Series.
b. In the Titles tab change the Title to read Device Count of Type and Size.
c. Change the Group Title to read Type and Size.
d. Change the Data Title to read Number.
e. OK

ExA-15
6. Right click on a Group (X) axis label and select Format Axis Label.
a. Change the Rotation to 45.
b. OK
7. Click and drag the Group Title to avoid the labels if necessary.
Design

ExA-16
Preview

ExA-17
Example 27A We will add to the Employee Cost List Report (EmpCostList.rpt) the Work Orders each
Employee has worked on. Then set it up to Hide the Work Orders unless called on.
1. In the Work Report folder, open CT_EmpCostListWO.rpt.
2. Change the title to Employee Cost List Summary with Work Orders.
3. In the Database Expert bring in the WKORDER and WKRESRCE tables.
4. Link
5. Group on the Employee Code (EM_EMPL_CD).
6. Move the Employee data to the Group Header 1 section.
7. Bring the Work Order Number (WO_NUMBER) field into the Detail section.
8. In Section Expert click on the Details section and then select Hide (Drill-Down OK).

ExA-18
9. Suppress the Group Footer 1 Section.
When the report is run it will look like the original Employee Cost List Report.
If you double click on an employee name it will show the Work Orders the employee has
worked on.
It would be helpful to state to the user how the hidden information is shown.

ExA-19
Example 28A We will create a Work Order Task Labor Cost Summary report which shows Category subtotals
as well as the total. This could easily be done with Running Totals but this should be done with
variables. The intent is to guide you through the basic use of variables.
1. Create a new Work report called Work Order Task Labor Cost Summary
(CT_WOTskLabCostSum.rpt). You may use the Report Wizard (then modify) or Blank
Report. Use the following tables:
• WKORDER
• WKWOTSK
• WKRESRCE
• WKORDERLOC
• WKWOASSET
2. Link

ExA-20
3. Bring in the following fields.
• WO Number
• Problem (text field)
• Main Task (text field)
• Labor Cost (WKORDER.WO_LC_ACT using variables to declare and sum)
4. Group on Main Task.
5. Group on WO Number.
6. Put in a subtotal for Main Task (variable).
7. Select on Closed Work Orders, STAT_CD>950.
8. Put in a Grand Total (variable).
9. Add Dollar symbol ($) to the cost fields.
Set up the fields as follows:

ExA-21
Suggested Formulas:
LaborCost
WhilePrintingRecords;
shared numbervar LabCost;
LabCost:={WKORDER.WO_LC_ACT}
-------------------------------------------------------------------------------------------------------
LaborSum
WhilePrintingRecords;
shared numbervar LabCost;
shared numbervar TskTot;
shared numbervar GrTot;
TskTot:=TskTot + LabCost;
GrTot:=GrTot + LabCost;
-------------------------------------------------------------------------------------------------------
TaskTot
WhilePrintingRecords;
shared numbervar TskTot;
TskTot
GrandTot
WhilePrintingRecords;
shared numbervar GrTot;
GrTot
-------------------------------------------------------------------------------------------------------
ZeroTask

ExA-22
WhilePrintingRecords;
shared numbervar TskTot:=0;
Example 29A We will modify the Sewer Pipe Summary report (PipeSum.rpt) to group by pipe material and
then show the sum of the pipe length and the percentage for that material type. The Summary
Tool should be used to calculate the percentage.
Original
1. From the Sewer Report folder, open CT_SWPipeMat.rpt.
2. Change the title to Sewer Pipe By Material Summary Report.
3. Add a Group on the Material field.

ExA-23
4. Add the group option to Repeat Group Header On Each Page.
5. Add a summary for Pipe Length for each Material Type.
6. Using the Summary tool add a Percent for Pipe Length for each Material Type.
If the previous summary formula is still where Crystal placed it then the Percent formula
will be placed on top of it. Click and drag on the formula field to separate them.
7. Add a text object with “Total” and the Material field embedded to restate the material
type in the Group Footer.
8. Add a top Border to the length summary.
9. Add a line to separate material type sections.
Revised

ExA-24
Example 30A We will modify the Summary of Requests report (ReqSum.rpt) to show the number of days
between when the Request is created and the Work Order is created. This will be done without
the use of subreports but using the table linkings just learned.
1. From the Work Report folder, open CT_ReqWODays.rpt.
2. Change the title to Days For Request to Work Order.
3. Bring in the following tables: WKORDER, WKWOMWO and WKWOMWO again.
4. Link
5. Change the Priority column to WO Number.
6. Change the Problem column to WO Creation Date.
7. Create a date formula (WODate) to bring in the WO_INIDATE field.
8. Create a column to the right of WO Creation Date for “Req to WO”.

ExA-25
9. Create a formula (DateDiff) to find the difference between the WO creation date
(@WODate) and the Request creation date (@ReqDate).
{@WODate}-{@ReqDate}
Example 31A We will modify the Work Order Summary Report (WOSum.rpt) by adding assets and limiting it
to show only Sewer Assets. The Assets will be brought in with grouping instead of a subreport.
This will allow the Asset filters in Lucity to be applied to the report.
Original
1. From the Work Report folder, open CT_WOSWAssetSum.rpt.
2. Change the title to Work Order with Sewer Assets Report.
3. In Select Expert add a formula to limit the work orders to those with Sewer Assets. (The
asset numbers can be found in the WKCATINV table.)
{WKORDER.WO_INV_ID} in [2 to 6, 232 to 235]
4. Add a group on the Asset ID (WKWOASSET.AS_ID).

ExA-26
5. Unsuppress the Group Header 1 section.
6. Move the Work Order data from the GF1a section to the GH1 section.
7. Delete the GF1a section.
8. Add a Group Header 1 section (GH1b).
9. Add to the GH1b section Asset column headers; Asset Type, System ID 1,
Desc 1 and Desc 2. Underline, Italic and not bold.
10. Add the appropriate Asset fields to the Group Header 2 section.
11. Suppress the Group Footer 2 section.
Revised

ExA-27
Example 32A
We will modify the Work Order Summary With Asset Report (WOSumAsset.rpt) to bring in
Sewer and Storm Pipes and show their lengths with a total combined length.
Original
1. From the Work Report folder, open CT_WOSwSmPipeSum.rpt.
2. Change the title to Work Orders with Sewer and Storm Pipes Report.
3. In Select Expert add a formula to limit the work orders to those with Sewer and Storm
Pipe Assets. (The asset numbers can be found in the WKCATINV table.)
{WKORDER.WO_INV_ID} in [26, 6]
4. Using the Save Subreport As… option, save a copy of the WOAsset subreport in the Work
Report folder (WOSmAssetSub).
5. Add a Group Footer 1 section below GF1c.
6. Add a subreport to the new section (GF1d). Choose an Existing Report
(WOSmAssetSub). Format
7. Link the new subreport to the WKORDER table.

ExA-28
8. In the new subreport (WOSmAssetSub) delete the two added blank sections.
9. In the WOSmAssetSub subreport’s Select Expert, remove the additional linking formula.
10. In this same Select Expert, limit the records to the Storm Pipes.
{WKWOASSET.AS_CAT_INV} = 26
11. Rename the other Asset subreport to WOSwAsset.
o This is done in the Subreport’s Format Editor > Subreport tab > Subreport
options > Subreport Name box.
12. In the Select Expert for the WOSwAsset subreport, limit the records to the Sewer Pipes.
{WKWOASSET.AS_CAT_INV} = 6
13. In WOSwAsset add the Sewer Pipe table and link. (Remember to use the Views for the
Work Database)
14. Change the Cost column to “Length”.
15. Bring in the Length field (NT_LENGTH).

ExA-29
16. Create a Running total for the Length field (SwLength).
17. Create a formula (SwTot) to have a variable use the running total field. Place in the
Report Footer a section.
WhilePrintingRecords;
shared numbervar SwTotL;
SwTotL:={#SwLength}
18. Create a formula to reset the variable – just to be safe (Zero). Place in the Report
Header a section.
WhilePrintingRecords;
shared numbervar SwTotL:=0;
19. Set up the Storm subreport similarly.

ExA-30
20. In the main report add a new Group Footer section below GF1d. Suppress
21. Create two formulas to bring in and sum the sewer and storm pipe lengths. Place in the
GF1d section.
SwLengthSum
WhilePrintingRecords;
shared numbervar SwTotL;
Shared numbervar WOSwTot;
WOSwTot:=WOSwTot + SwTotL;
SmLengthSum
WhilePrintingRecords;
shared numbervar SmTotL;
Shared numbervar WOSmTot;
WOSmTot:=WOSmTot + SmTotL;
22. Create two formulas to state the sewer and storm pipe total lengths. Place in the
Report Footer.
SWPipeL
WhilePrintingRecords;
Shared numbervar WOSwTot;
WOSwTot

ExA-31
SMPipeL
WhilePrintingRecords;
Shared numbervar WOSmTot;
WOSmTot
23. Create one more formula to state the total length of all pipes. Place in the Report
Footer.
TotalPipe
WhilePrintingRecords;
Shared numbervar WOSwTot;
Shared numbervar WOSmTot;
WOSwTot + WOSmTot
Revised