advanced semiconductor engineering, inc. annual report … · · 2009-07-16advanced semiconductor...
TRANSCRIPT

Advanced Semiconductor Engineering, Inc.
ANNUAL REPORT 2oo2
True Partnership Amidst Changing Times
TAIEX : 2311
NYSE : ASX
www.aseglobal.com

Contents
oo2_ True Partnership Amidst Changing Times
oo8_ Letter to Shareholders
o10_ Financial Highlights
o13_ 2oo2 Form 20-F

True Partnership Amidst Changing Times
True partnership is a promise,
a pact designed to
enhance our performance,
optimize our potential,
and promote mutual prosperity.

Characterized by shared values,
close communication, and common concerns,
our partnership creates a convergence of
talents and capabilities,
with the power to overcome the challenges of
a dynamic global business environment
in which the only constant is change.

o7
Chungli, TaiwanKaohsiung, Taiwan
Paju, Korea
Cavite, Philippines
Penang, Malaysia
Singapore
Shanghai, China
Greater China ClusterSingapore Cluster
ASE was the first industry player to provide mass production 300mm wafer packaging, and remains the industry leader in 300mm wafer flip chip bumping assembly and test services. By the year 2006, 300mm wafer capabilities are projected to account for 45% of total wafer production, creating the value-added products of the future such as processors, graphics, and communications chips. And our 300mm wafer backend manufacturing capabilities stand as just one example of ASE’s commitment to industry leading technology, the foundation of continued growth—and the litmus test of a good partner.
ASE has a strong track record of investing in a comprehensive
range of industry-leading technologies, and making the capital
improvements essential to industry success. These investments have
become increasingly important as our IDM partners move away from
vertical integration to focus on design and marketing, and the costs
involved in retooling and acquiring the most advanced backend
equipment have risen dramatically. ASE remains committed to
maintaining our lead in the race for advanced technologies and
services, and while competitors may share that commitment, few can match our financial ability to turn this very capital-intensive commitment into concrete reality.
As the only vertically integrated SATS industry player, ASE has a unique combination of resources that enable us to offer industry-leading total turnkey flip chip solutions and services. Our Test Development Centers put our cooperative efforts on the right track from the start, smoothing out processes from substrate design and manufacturing to bumping, probing and assembly, through final testing and drop shipments for a variety of flip chip platforms in different package sizes and I/Os. Each step of the way our breadth, depth, and flexibility generates speed and efficiency, which we leverage with industry-leading technology to create comprehensive backend solutions for the most advanced semiconductor products.
ASE is meeting the needs of the burgeoning opto-electronics market with volume production of Ceramic Leadless Chip Carrier (CLCC), and our Organic Leadless Chip Carrier (OLCC)—fast becoming a mainstream image sensor chip package application. The global leader in camera modules, our world-class team of engineers, combined with the latest image sensor process equipment and toolings, are taking over the lead in a wide range of opto-electronics applications. Working with our partners, ASE is pushing the imaging technology envelope to meet the demand for enhanced portability and power management capabilities in a world where a pixel is worth a thousand words.
ASE is one of the fastest growing total-solution SATS (Semiconductor Assembly and Test Services) providers in the world, making us one of the few industry players to thrive during the recent downturn. The boom in outsourcing of backend services by global IDMs has contributed to ASE’s strong balance sheet, enabling us to turn a strong commitment to technology and capital investment into customer benefits. A rising force during the down-cycle, ASE is now poised to mount the SATS industry summit—and will be an even stronger partner when the inevitable industry rebound arrives.
ASE has a strong presence in the manufacturing clusters that have sprouted in both the Greater China and ASEAN regions, in close proximity to the bulk of global pure-play foundry output, and a significant portion of global test outsourcing. This strategic deployment gives our IDM customers all the benefits of a more intimate working relationship, facilitating the close communication and cooperation that enhance speed and efficiency, shortening the critical time-to-market cycle. In a highly complementary and interdependent industry where partnership is paramount, ASE has a commanding presence where it counts.
o4
Image sensor applications are the wave of the future,and we need a dependable backend partner to be part of it.
I need a long-term partner withthe ability to invest in the future.
For the future, I need a partner that’s thriving--even during the down-cycle.To produce that order, I need a partner
that gives me faster time-to-market.
I need one partner that providestotal turnkey backend solutions
for the most advanced chip packages.
We’re investing in 300mm wafer manufacturing,so I need reliable backend services
for those products.

Many industry experts had expected 2002 to be a period of recovery but global economic uncertainties led to another
challenging year as in 2001. Despite the overall semiconductor industry’s lackluster performance, ASE still managed to report an
impressive 19% growth, compared with the industry’s growth of a mere 1.9%. We ended the fiscal year with revenues of
NT$45,587 million and a net profit of NT$129 million, reversing our previous year’s losses. We are pleased to have delivered on
our commitment to shareholders in achieving sequential revenue growth and margin improvement every quarter.
Perseverance in technology advancements
We believe that one of the factors behind our ability to pull through another difficult year was due to our continued pursuit in
developing leading edge technologies that maximize performance and cost-effectiveness for our customers. During the year, we
successfully launched our patented tri-tier fine pitch wire bonding capability that enabled IC designers to integrate multiple
functions onto a limited chip area without sacrificing speed and performance. This development further seals our leadership in
fine pitch wire bonding capabilities. We also embarked on volume production of image sensor packages, catering to a market that
is forecast to grow at an approximate compound annual growth rate of 25% from 2001 to 2005.
We continue to maintain our leadership in wafer bumping and flip chip packaging and test, where we added more capacity to
meet growing demands. We believe that we are the leading company with the capability to offer customers the full turnkey
solution in flip chip packaging; from wafer bumping, wafer probing, packaging, final testing to drop shipping to customers’
designated locations.
ASE also works closely with partners and customers on packaging, material and test technologies. Together with MTB Solutions
Inc, a developer of scalable bandwidth packaging technologies, we developed packages designed for large silicon flip chip used in
very high I/O and large bandwidth applications. We also collaborated with IBM Microelectronics, the industry’s foremost supplier
of interconnect products and services, on next generation flip chip packaging technology using IBM’s surface laminar circuit
(SLC) substrates.
We keep close pace with advancements in front end manufacturing and align our processes to ensure seamless integration of our
package technologies with that of the silicon wafer fabrication. With the industry’s migration to 300mm wafer fabrication, we
have already ramped up volume production of 300mm wafer bumping and packaging capabilities. Our engineering teams are
working with the world’s largest foundry to qualify wire bond and flip chip packages for the industry’s all-copper, 0.13 micron
low-k dielectric process (currently the most advanced chip manufacturing process technology). We will also develop our
technologies in line with chip manufacturing technology nodes–90 nanometers and down to 65 nanometers.
Outsourcing trend continues
ASE continues to benefit from the industry’s increased outsourcing trend, especially from IDMs (integrated device
manufacturers). The downturn in the past two years has simply aggravated the financial capacity of most IDMs’ capacity to invest
in advanced equipment and processes. At the same time, semiconductor subcontractors of foundry, assembly and test have
already proven themselves to be competent in their respective areas of expertise. Technology and quality gaps are narrowing or
reversing between IDMs and subcontractors due to the latter’s continuing investments. Particularly, most IDMs do not have
sufficient business scale to build and support their own 300mm fabs, and will need to outsource to foundries. As a result,
assembly and test subcontractors also benefit down the semiconductor value chain.
Letter to Shareholders
Dear Shareholders,
o8

ASE’s healthy financial position has enabled us to make sound capital investments. In 2002, we purchased almost 900 fine pitch
wire bonders and 55 testers. Such additions in capacity are necessary to accommodate customers’ increasingly sophisticated chip
designs. In the assembly and test business, the financial ability to acquire equipment within the shortest timeframe to meet
customers’ production requirements, is critical to winning market share from the competition.
Riding the tide
The year 2002 may have been another tough year but we have emerged a much stronger player and increased our market share
in the backend manufacturing industry to 26%, up from 20% a few years ago, according to Lehman Brothers figures (Electronic
News 1/10/2003). During rough market conditions, competing on price alone is no longer a key differentiating factor for ASE.
Rather, it is our ability to offer complete solutions, cutting-edge technologies and service excellence that allow our customers to
successfully bring products to market faster and boosting their competitive edge.
We are approaching 2003 with caution as the industry is still exhibiting signs of a slow recovery. Overall, the market is still
reeling from the depressed stock market and a bout of corporate crises. Nonetheless, we are seeing indications that inventory
levels have reached its optimal low, allowing a gradual return to supply-demand equilibrium.
In 2003, we will focus on expanding our market share through superior service offerings and improving our profitability. Our
strategy would be to offer customers leading edge assembly and test solutions for higher pincount, smaller packages, multi-chip
packages, wafer level processes, 300mm wafers; value-added advantages especially our internal substrate and leadframe (through
ASE Material Inc) supply. We will continue to streamline our business and maintain a sound financial position allowing us to
align our capital investments to meet customers’ demands in a volatile market.
Maximum results, minimum risks
Adhering to our corporate theme - ‘Maximum with Minimum’, we aim to deliver our shareholder commitment through
aggressive research and development in technologies, analysis of market trends which will determine our future investments, and
ensure excellence in our operations. Our team will endeavor to offer maximum results with minimum risks to our customers,
shareholders, employees and suppliers.
Thank you for your confidence in ASE and we look forward to reporting another year of achievements in 2003.
Richard H.P. ChangVice-ChairmanChief Executive Officer
Jason C.S. ChangChairmanChief Operating Officer
o9

Financial Highlights
* Note: With retroactive adjustment ** Note: To be approved by shareholders’ meeting on June 19, 2003
Net Revenues
Gross Profit
Income (Loss) from Operations
Income (Loss) Before Tax
Net Income (Loss)
Earning (Loss) Per Common Share (NT$ / Share)*
Dividedds Per Common Share (NT$ / Share)
Properties
Shareholds’ Equity
Total Assets
Employees (Person)
ASE Market Value (Year Ended December 31)
1998 1999 2000 2001 2002
20,762.4
5,294.3
2,840.9
1,981.3
1,604.0
0.49
1.07
20,356.8
21,874.8
47,011.5
8,737
96,120.0
32,609.6
8,650.0
4,848.6
9,062.4
7,794.7
2.45
3.15
38,107.5
30,057.0
77,330.8
14,184
221,760.0
50,893.4
15,326.1
9,877.1
8,403.6
5,837.2
1.8
1.7
60,566.2
43,669.2
108,341.2
18,121
60,268.8
38,367.8
5,410.8
(462.1)
(2,985.5)
(2,142.2)
(0.66)
---
60,555.1
41,946.3
106,326.3
15,681
105,781.0
45,586.8
7,094.6
(685.2)
(2,709.7)
129.0
0.04
** 1.00
63,088.9
39,430.7
104,869.4
20,401
66,397.9
Selected Consolidated Financial and Other Data
Net Revenues (In NT$ Million)
60,000
50,000
40,000
30,000
20,000
10,000
01998 1999 2000 2001 2002
1o
NT$ 45,586.8
NT$ 38,367.8
NT$ 50,893.4
NT$ 32,609.6
NT$ 20,762.4
(In NT$ Million)

Gross Profit (In NT$ Million)
Income (Loss) from Operation (In NT$ Million)
10,000
16,000
14,000
12,000
10,000
8,000
6,000
4,000
2,000
0
8,000
6,000
4,000
2,000
0
-2,0001998 1999 2000 2001 2002
1998 1999 2000 2001 2002
11
NT$ 2,840.9
NT$ 4,848.6
NT$ 9,877.1
NT$ 462.1 NT$ 685.2
NT$ 5,294.3
NT$ 8,650.0
NT$ 15,326.1
NT$ 5,410.8
NT$ 7,094.6

Total Assets (In NT$ Million)
ASE Market Value (In NT$ Million)
120,000
100,000
80,000
60,000
40,000
20,000
0
250,000
200,000
150,000
100,000
50,000
10,000
0
NT$ 47,011.5
NT$ 77,330.8
NT$ 108,341.2 NT$ 106,326.3 NT$ 104,869.4
NT$ 96,120.0
NT$ 221,760.0
NT$ 60,268.8
NT$ 105,781.0
NT$ 66,397.9
1998 1999 2000 2001 2002
1998 1999 2000 2001 2002
12

2002 Annual Report

TABLE OF CONTENTS
Page
INTRODUCTION.........................................................................................................................................................1 USE OF CERTAIN TERMS..................................................................................................................................1 SPECIAL NOTE REGARDING FORWARD-LOOKING STATEMENTS.........................................................1
PART I ..........................................................................................................................................................................2 Item 1. Identity of Directors, Senior Management and Advisers. .......................................................................2 Item 2. Offer Statistics and Expected Timetable.................................................................................................2 Item 3. Key Information......................................................................................................................................2
SELECTED FINANCIAL DATA.......................................................................................................2 EXCHANGE RATES..........................................................................................................................4 CAPITALIZATION AND INDEBTEDNESS ....................................................................................5 REASON FOR THE OFFER AND USE OF PROCEEDS .................................................................5 RISK FACTORS .................................................................................................................................5
Item 4. Information on the Company. ...............................................................................................................17 HISTORY AND DEVELOPMENT OF THE COMPANY...............................................................17 BUSINESS OVERVIEW ..................................................................................................................18 ORGANIZATIONAL STRUCTURE................................................................................................36 PROPERTIES....................................................................................................................................38
Item 5. Operating and Financial Review and Prospects....................................................................................41 OPERATING RESULTS AND TREND INFORMATION..............................................................41 LIQUIDITY AND CAPITAL RESOURCES....................................................................................54 RESEARCH AND DEVELOPMENT...............................................................................................57
Item 6. Directors, Senior Management and Employees. ...................................................................................58 DIRECTORS AND SENIOR MANAGEMENT AND BOARD PRACTICE..................................58 COMPENSATION ............................................................................................................................61 EMPLOYEES....................................................................................................................................62
Item 7. Major Shareholders and Related Party Transactions ............................................................................64 MAJOR SHAREHOLDERS .............................................................................................................64 RELATED PARTY TRANSACTIONS............................................................................................64
Item 8. Financial Information. ..........................................................................................................................66 CONSOLIDATED STATEMENTS AND OTHER FINANCIAL INFORMATION.......................66 LEGAL PROCEEDINGS..................................................................................................................66 DIVIDENDS AND DIVIDEND POLICY ........................................................................................67 SIGNIFICANT CHANGES...............................................................................................................68
Item 9. Listing Details.......................................................................................................................................68 MARKET PRICE INFORMATION AND MARKETS....................................................................68
Item 10. Additional Information. ......................................................................................................................70 ARTICLES OF INCORPORATION.................................................................................................70 MATERIAL CONTRACTS ..............................................................................................................74 EXCHANGE CONTROLS ...............................................................................................................76 TAXATION.......................................................................................................................................77 DOCUMENTS ON DISPLAY ..........................................................................................................80
Item 11. Quantitative and Qualitative Disclosures about Market Risk. ............................................................80 MARKET RISK ................................................................................................................................80
Item 12. Description of Securities Other Than Equity Securities. ....................................................................82 PART II .......................................................................................................................................................................82
Item 13. Defaults, Dividend Arrearages and Delinquencies. ............................................................................82 Item 14. Material Modifications to the Rights of Security Holders and Use of Proceeds.................................82
MATERIAL MODIFICATIONS TO THE RIGHTS OF SECURITY HOLDERS ..........................82 Item 15. Controls and Procedures. ....................................................................................................................82
PART III......................................................................................................................................................................83 Item 17. Financial Statements. ..........................................................................................................................83 Item 18. Financial Statements. ..........................................................................................................................83 Item 19. Exhibits. ..............................................................................................................................................83
i

INTRODUCTION
USE OF CERTAIN TERMS
All references herein to (i) the “Company”, “ASE Group”, “ASE Inc.”, “we”, “us”, or “our” are to Advanced Semiconductor Engineering, Inc. and, unless the context requires otherwise, its subsidiaries, (ii) “ASE Test” are to ASE Test Limited and its subsidiaries, (iii) “ASE Test Taiwan” are to ASE Test, Inc., a company incorporated in the ROC, (iv) “ASE Test Malaysia” are to ASE Electronics (M) Sdn. Bhd., a company incorporated under the laws of Malaysia, (v) “ISE Labs” are to ISE Labs, Inc., a corporation incorporated in the State of California, (vi) “ASE Philippines” are to ASE Holdings Electronics (Philippines) Inc., a company incorporated in the Philippines, (vii) “Universal Scientific” are to Universal Scientific Industrial Co., Ltd., a company incorporated in the ROC, (viii) “ASE Material” are to ASE Material Inc., a company incorporated in the ROC, (ix) “ASE Korea” are to ASE (Korea) Inc., a company incorporated under the laws of the Republic of Korea, (x) “ASE Chung Li” are to ASE (Chung Li) Inc., a company incorporated in the ROC and (xi) “Hung Ching” are to Hung Ching Development & Construction Co. Ltd.
All references to the “Republic of China”, the “ROC” and “Taiwan” are to the Republic of China, including Taiwan and certain other possessions. All references to “Korea” or “South Korea” are to the Republic of Korea.
We publish our financial statements in New Taiwan Dollars, the lawful currency of the ROC. In this annual report, references to “United States Dollars”, “U.S. Dollars” and “US$” are to United States Dollars and references to “New Taiwan Dollars”, “NT Dollars” and “NT$” are to New Taiwan Dollars. Unless otherwise noted, all translations from NT Dollars to U.S. Dollars were made at the noon buying rate in the City of New York for cable transfers in NT Dollars per U.S. Dollar as certified for customs purposes by the Federal Reserve Bank of New York (the “Noon Buying Rate”) as of December 31, 2002, which was NT$34.70=US$1.00. All amounts translated into U.S. Dollars in this annual report are provided solely for your convenience and no representation is made that the NT Dollar or U.S. Dollar amounts referred to herein could have been or could be converted into U.S. Dollars or NT Dollars, as the case may be, at any particular rate or at all.
SPECIAL NOTE REGARDING FORWARD-LOOKING STATEMENTS
This annual report on Form 20-F contains “forward-looking statements” within the meaning of Section 27A of the Securities Act of 1933 and Section 21E of the Securities Exchange Act of 1934, including statements regarding our future results of operations and business prospects. Although these forward-looking statements, which may include statements regarding our future results of operations, financial condition or business prospect, are based on our own information and information from other sources we believe to be reliable, you should not place undue reliance on these forward-looking statements, which apply only as of the date of this annual report. Our actual results of operations, financial condition or business prospects may differ materially from those expressed or implied in these forward looking statements for a variety of reasons, including risks associated with the highly competitive nature of the semiconductor industry, our ability to introduce new packaging and testing technologies in order to remain competitive, our ability to successfully integrate future acquisitions, risks associated with international business activities, our business strategy, general economic and political conditions, possible disruptions in commercial activities caused by natural disasters or industrial accidents, our future expansion plans and capital expenditures, fluctuations in foreign currency exchange rates, and other factors. For a discussion of these risks and other factors, please see “Item 3. Key Information—Risk Factors”.
1

2
PART I
Item 1. Identity of Directors, Senior Management and Advisers.
Not applicable.
Item 2. Offer Statistics and Expected Timetable.
Not applicable.
Item 3. Key Information.
SELECTED FINANCIAL DATA
The following selected consolidated financial data have been derived from our consolidated financial statements. Our consolidated statements of income for the years ended December 31, 2000, 2001 and 2002 and our consolidated balance sheets as of December 31, 2001 and 2002 have been audited by T.N. Soong & Co., independent public auditors. Our consolidated financial statements, and the report of T.N. Soong & Co. on those financial statements, are included in this annual report. The selected consolidated financial information for those periods and as of those dates are qualified by reference to those financial statements and that report, and should be read in conjunction with them and with “Item 5. Operating and Financial Review and Prospects”. Effective April 22, 2002, T.N. Soong & Co. became an associate member firm of Deloitte Touche Tohmatsu. T.N. Soong & Co. was formerly a member firm of Andersen Worldwide SC. The selected consolidated statement of income data for the years ended December 31, 1998 and 1999 and the selected consolidated balance sheet data as of December 31, 1998, 1999 and 2000 set forth below are derived from our audited consolidated financial statements not included in this annual report. These financial statements were also audited by T.N. Soong & Co. Our consolidated financial statements are prepared and presented in accordance with generally accepted accounting principles in the ROC, or ROC GAAP, which differ in some material respects from generally accepted accounting principles in the United States, or US GAAP. Notes 26 and 27 to our consolidated financial statements contain additional disclosures required under US GAAP and provide descriptions of the significant differences between ROC GAAP and US GAAP and reconciliations of net income to US GAAP for the years ended December 31, 2000, 2001 and 2002 and the reconciliations of shareholders’ equity to US GAAP as of December 31, 2001 and 2002.
As of and for the Year Ended December 31,
1998 1999 2000 2001 2002 2002
NT$ NT$ NT$ NT$ NT$ US$
(in millions, except share, ADS and earnings per share and per ADS data)
ROC GAAP: Income Statement Data: Net revenues ......................................................... 20,762.4 32,609.6 50,893.4 38,367.8 45,586.8 1,313.7Cost of revenues ................................................... (15,468.1) (23,959.6) (35,567.3) (32,957.0) (38,492.2) (1,109.2)Gross profit........................................................... 5,294.3 8,650.0 15,326.1 5,410.8 7,094.6 204.5Total operating expenses...................................... (2,453.4) (3,801.4) (5,449.0) (5,872.9) (7,779.8) (224.2)Operating income (loss) ....................................... 2,840.9 4,848.6 9,877.1 (462.1) (685.2) (19.7)Net non-operating income (expense) ................... (859.6) 4,213.8 (1,473.5) (2,523.4) (2,024.5) (58.4)Income tax benefit (expense) ............................... 150.8 (459.5) (1,065.8) 199.2 1,140.3 32.9Income before acquisition .................................... — (65.1) — — — —Extraordinary loss ................................................ — — — (144.6) (34.6) (1.0)Minority interest in net loss (income) of
subsidiary......................................................... (528.1) (743.1) (1,500.6) 788.7 1,733.0 49.9
Net income (loss) ................................................. 1,604.0 7,794.7 5,837.2 (2,142.2) 129.0 3.7Earnings per common share:
Basic(1)............................................................ 0.51 2.49 1.84 (0.66) 0.04 0.00Diluted(1)......................................................... 0.49 2.45 1.80 (0.66) 0.04 0.00
Dividends per common share(2) .......................... 7.20 1.07 3.15 1.70 Earnings per pro forma equivalent ADS:
Basic(1)............................................................ 2.56 12.43 9.22 (3.29) 0.21 0.01Diluted(1)......................................................... 2.43 12.27 9.01 (3.29) 0.21 0.01

As of and for the Year Ended December 31,
1998 1999 2000 2001 2002 2002
NT$ NT$ NT$ NT$ NT$ US$
(in millions, except share, ADS and earnings per share and per ADS data)
Number of common shares(3).............................. 3,135,196,466 3,135,196,466 3,166,809,827 3,254,800,000 3,090,678,225 3,090,678,225Number of pro forma equivalent ADSs ............... 627,039,293 627,039,293 633,361,965 650,960,000 618,135,645 618,135,645Balance Sheet Data: Current assets:
Cash and cash equivalents............................... 8,173.9 11,809.1 14,166.5 11,770.7 10,381.9 299.2Short-term investments.................................... 647.2 216.3 1,682.7 4,601.2 2,038.0 58.7Notes and accounts receivable ........................ 3,636.7 7,463.4 9,260.6 7,126.1 8,998.5 259.3Inventories ....................................................... 1,744.8 2,449.7 3,246.3 2,768.4 3,131.7 90.3Other ................................................................ 771.9 1,411.8 2,431.6 3,383.2 2,481.7 71.5Total ................................................................. 14,974.5 23,350.3 30,787.7 29,649.6 27,031.8 779.0
Long-term investments......................................... 7,317.0 9,674.4 10,712.2 9,530.4 6,566.7 189.3Properties.............................................................. 20,356.8 38,107.5 60,566.2 60,555.1 63,088.9 1,818.1Other assets........................................................... 1,125.9 952.8 1,275.6 1,342.3 2,640.2 76.1Consolidated debits .............................................. 3,237.3 5,245.8 4,999.5 5,248.9 5,541.8 159.7
Total assets ........................................................... 47,011.5 77,330.8 108,341.2 106,326.3 104,869.4 3,022.2Short-term bank borrowings/loans(4) .................. 6,810.2 9,868.2 13,768.0 13,983.1 13,453.8 387.8Long-term bank borrowings/loans(5) .................. 12,235.0 24,551.5 25,976.9 30,674.3 30,553.7 880.5Other liabilities and minority interest .................. 6,091.5 12,854.1 24,927.1 19,722.6 21,431.2 617.6
Total liabilities and minority interest ................... 25,136.7 47,273.8 64,672.0 64,380.0 65,438.7 1,885.9Shareholders’ equity............................................. 21,874.8 30,057.0 43,669.2 41,946.3 39,430.7 1,136.3Other Data: Net cash outflow from acquisition of fixed
assets ................................................................ (6,945.0) (9,869.2) (30,063.6) (11,565.7) (12,657.9) (364.8)Depreciation and amortization ............................. 3,237.2 5,554.4 8,593.8 11,127.3 12,286.3 354.1Net cash inflow (outflow) from operations.......... 5,194.2 7,017.2 17,459.9 11,578.4 11,313.8 326.0Net cash inflow (outflow) from sale of
investments ...................................................... 290.5 7,889.3 — — — —Net cash inflow (outflow) from investing
activities(6) ...................................................... (8,558.3) (11,782.7) (33,392.0) (15,051.2) (13,167.2) (379.5)Net cash inflow (outflow) from financing
activities(7) ...................................................... 589.3 8,569.0 17,607.3 603.5 530.5 15.3Segment Data: Net revenues:
Packaging......................................................... 16,867.4 24,523.0 38,028.8 28,898.2 35,515.4 1,023.5Testing ............................................................. 3,131.3 7,793.2 12,768.4 9,459.2 10,060.6 289.9Other ................................................................ 763.7 293.4 96.2 10.4 10.8 0.3
Gross profit: Packaging......................................................... 3,693.8 5,753.0 10,016.9 4,625.8 6,255.4 180.3Testing ............................................................. 1,484.6 3,105.2 5,294.4 782.8 841.2 24.2Other ................................................................ 115.9 (208.2) 14.8 2.2 (2.0) (0.0)
US GAAP: Income Statement Data: Net revenues ......................................................... 50,893.4 38,367.8 45,586.8 1,313.7Cost of revenues ................................................... 37,081.2 34,538.3 39,308.2 1,132.8Gross profit........................................................... 13,812.2 3,829.5 6,5278.6 180.9Total operating expenses...................................... 5,820.8 6,209.9 9,294.2 267.8Operating income (loss) ....................................... 7,991.4 (2,380.4) (3,015.6) (86.9)Net non-operating income (expense) ................... (1,502.5) (2,511.8) (2,747.7) (79.2)Income tax benefit (expense) ............................... (1,059.2) 206.2 1,151.1 33.2Extraordinary loss ................................................ — (144.6) (34.6) (1.0)Minority interest in net loss (income) of
subsidiary ........................................................ (1,499.7) 784.0 1,572.5 45.3
Net income (loss) ................................................. 3,390.0 (4,046.6) (3,074.3) (88.6)Earnings per common share:
Basic(1) ........................................................... 1.34 (1.32) (0.99) (0.03)Diluted (1) ....................................................... 1.29 (1.32) (0.99) (0.03)
Earnings per common share: Basic(1) ........................................................... 6.69 (6.59) (4.97) (0.14)
3

As of and for the Year Ended December 31,
1998 1999 2000 2001 2002 2002
NT$ NT$ NT$ NT$ NT$ US$
(in millions, except share, ADS and earnings per share and per ADS data)
Diluted (1) ....................................................... 6.47 (6.59) (4.97) (0.14)Number of common shares(8).............................. 2,938,004,535 3,071,234,458 3,090,678,225 3,090,678,225Number of pro forma equivalent ADSs ............... 587,600,907 614,246,892 618,135,645 618,135,645Balance Sheet Data: Current Assets Cash and cash equivalents.................................... 11,770.7 10,381.9 299.2 Short-term investments ........................................ 4,642.1 2,040.0 58.8 Notes and accounts receivable ............................. 7,126.1 8,998.5 259.3 Inventories ............................................................ 2,768.4 3,131.7 90.3 Other ..................................................................... 3,383.2 2,481.7 71.5 Total...................................................................... 29,690.5 27,033.8 779.1 Long-term investments......................................... 6,608.3 5,609.3 161.7 Properties.............................................................. 60,363.1 62,797.4 1,809.7 Other assets........................................................... 1,371.0 2,679.7 77.2 Consolidated debts ............................................... 4,331.6 3,227.0 93.0
Total assets ........................................................... 102,364.5 101,347.2 2,920.7 Short-term bank borrowings/loans(4) .................. 13,383.1 13,453.8 387.7 Long-term bank borrowings/loans(5) .................. 30,674.3 30,553.7 880.5 Other liabilities and minority interest .................. 19,746.8 21,622.9 623.2
Total liabilities and minority interest ................... 64,404.2 65,630.4 1,891.4 Shareholders’ equity............................................. 37,960.3 35,716.8 1,029.3
(1) The numerator of both basic and diluted earnings per share is calculated with consideration of the adjustment of ASE Test’s basic and diluted earnings per share. See notes 19 and 27(i) to our consolidated financial statements.
(2) Dividends per common share issued as a stock dividend. (3) Represents the weighted average number of shares after retroactive adjustments to give effect to stock dividends and employee stock
bonuses. Beginning in 2002, common shares held by consolidated subsidiaries are classified for accounting purposes as “treasury stock”, and are deducted from the number of common shares outstanding.
(4) Includes current portions of long-term debt and long-term payable for investments. (5) Excludes current portion of long-term debt and long-term payable for investments. (6) Includes proceeds from the sale of common shares, including common shares represented by global depositary shares, by affiliates of ASE
Inc. and proceeds from the sale of ordinary shares of ASE Test by ASE Inc. (7) Includes proceeds from primary offerings of common shares represented by ADSs by ASE Inc., and of ordinary shares by ASE Test. (8) Represents the weighted average number of shares after retroactive adjustments to give effect to stock dividends. EXCHANGE RATES
Fluctuations in the exchange rate between NT dollars and U.S. dollars will affect the U.S. dollar equivalent of the NT dollar price of the common shares on the Taiwan Stock Exchange and, as a result, will likely affect the market price of the ADSs. Fluctuations will also affect the U.S. dollar conversion by the depositary of cash dividends paid in NT dollars on, and the NT dollar proceeds received by the depositary from any sale of, common shares represented by ADSs, in each case, according to the terms of the deposit agreement.
The following table sets forth, for the periods indicated, information concerning the number of NT dollars for which one U.S. dollar could be exchanged based on the noon buying rate for cable transfers in NT dollars as certified for customs purposes by the Federal Reserve Bank of New York.
4

NT Dollars per U.S. Dollar Noon Buying Rate
Average High Low Period-End
1998 ........................................................................................... 33.50 35.00 32.05 32.271999 ........................................................................................... 32.28 33.40 31.39 31.392000 ........................................................................................... 31.37 33.25 30.35 33.172001 ........................................................................................... 33.91 35.13 32.23 35.002002 ........................................................................................... 34.53 34.79 34.70 34.70
December ............................................................................... 34.80 34.89 34.70 34.702003
January................................................................................... 34.57 34.76 34.40 34.61February................................................................................. 34.74 34.82 34.61 34.78March..................................................................................... 34.72 34.80 34.58 34.75April....................................................................................... 34.82 34.98 34.79 34.85May........................................................................................ 34.70 34.85 34.60 34.71June (through June 20� ............................. 34.65 34.70 34.52 34.59
Source: Federal Reserve Statistical Release, Board of Governors of the Federal Reserve System.
On June 20, the noon buying rate was NT$34.59 to US$1.00.
We publish our financial statements in NT dollars, the lawful currency of the ROC. This annual report contains translations of NT dollar amounts into U.S. dollars at specific rates solely for the convenience of the reader. Unless otherwise noted, all translations from NT dollars to U.S. dollars and from U.S. dollars to NT dollars were made at the noon buying rate in The City of New York for cable transfers in NT dollars per U.S. dollar as certified for customs purposes by the Federal Reserve Bank of New York as of December 31, 2002, which was NT$34.70 to US$1.00 on that date. No representation is made that the NT dollar or U.S. dollar amounts referred to in this annual report could have been or could be converted into U.S. dollars or NT dollars, as the case may be, at any particular rate or at all.
CAPITALIZATION AND INDEBTEDNESS
Not applicable.
REASON FOR THE OFFER AND USE OF PROCEEDS
Not applicable.
RISK FACTORS
Risks Relating to Our Business
Since we are dependent on the highly cyclical semiconductor industry and conditions in the markets for the end-use applications of our products, our revenues and earnings may fluctuate significantly.
Our semiconductor packaging and testing business is affected by market conditions in the highly cyclical semiconductor industry. All of our customers operate in this industry, and variations in order levels from our customers and service fee rates may result in volatility in our revenues and earnings. From time to time, the semiconductor industry has experienced significant, and sometimes prolonged, downturns. As our business is, and will continue to be, dependent on the requirements of semiconductor companies for independent packaging and testing services, any future downturn in the semiconductor industry would reduce demand for our services. For example, a worldwide slowdown in demand for semiconductors led to excess capacity and increased competition beginning in early 1998. As a result, price declines in 1998 accelerated more rapidly and, together with a significant decrease in demand, adversely affected our operating results in 1998. Prices for packaging and testing services improved due to an upturn in the industry in the second half of 1999 that continued through the third quarter of 2000, but have fallen since an industry downturn that commenced in the fourth quarter of 2000. This most recent
5

6
•
•
•
•
•
•
•
•
•
worldwide downturn resulted in an even more significant deterioration in the average selling prices, as well as demand, for our services in 2001, and significantly and adversely affected our operating results in 2001. Although there has been a modest recovery in the semiconductor industry during 2002, we expect the market conditions to continue to exert downward pressure on the average selling prices for our packaging and testing services. If we cannot reduce our costs to sufficiently offset any decline in average selling prices, our profitability will suffer and we may incur losses.
Market conditions in the semiconductor industry depend to a large degree on conditions in the markets for the end-use applications of semiconductor products, such as communications, personal computer and consumer electronics products. Any deterioration of conditions in the markets for the end-use applications of the semiconductors we package and test would reduce demand for our services, and would likely have a material adverse effect on our financial condition and results of operations. In 2001 and 2002, approximately 71.5% and 69.8% of our net revenues, respectively, were attributable to the packaging and testing of semiconductors used in personal computer and communications applications. Both industries are subject to intense competition and significant shifts in demand, which could put pricing pressure on the packaging and testing services provided by us and adversely affect our revenues and earnings.
A reversal or slowdown in the outsourcing trend for semiconductor packaging and testing services could adversely affect our growth prospects and profitability.
In recent years, semiconductor manufacturers that have their own in-house packaging and testing capabilities, known as integrated device manufacturers, have increasingly outsourced stages of the semiconductor production process, including packaging and testing, to independent companies to reduce costs and shorten production cycles. In addition, the availability of advanced independent semiconductor manufacturing services has also enabled the growth of so-called “fabless” semiconductor companies that focus exclusively on design and marketing, and that outsource their manufacturing, packaging and testing requirements to independent companies. We cannot assure you that these integrated device manufacturers and fabless semiconductor companies will continue to outsource their packaging and testing requirements to third parties like us. A reversal of, or a slowdown in, this outsourcing trend could result in reduced demand for our services and adversely affect our growth prospects and profitability.
If we are unable to compete favorably in the highly competitive semiconductor packaging and testing markets, our revenues and earnings may decrease.
The semiconductor packaging and testing markets are very competitive. We face competition from a number of sources, including other independent semiconductor packaging and testing companies, especially those which offer turnkey packaging and testing services. We believe that the principal competitive factors in the markets for our products and services are:
ability to provide total solutions to customers;
technological expertise;
range of package types and testing platforms available;
ability to work closely with customers at the product development stage;
responsiveness and flexibility;
capacity;
production cycle time;
production yield; and
price.

7
•
We face increasing competition from other packaging and testing companies, as most of our customers obtain packaging or testing services from more than one source. In addition, some of our competitors may have access to more advanced technologies and greater financial and other resources than we do. Many of our competitors have shown a willingness to quickly and sharply reduce prices, as they did in 1998 and in 2001, in order to maintain capacity utilization in their facilities during periods of reduced demand. Although prices have stabilized, any renewed erosion in the prices for our packaging and testing services could cause our revenues and earnings to decrease and have a material adverse effect on our financial condition and results of operations.
The outbreak of Severe Acute Respiratory Syndrome, or SARS, in mainland China, Hong Kong, Singapore, Taiwan and certain other regions may have an adverse effect on the economies and financial markets of certain Asian countries and as a result may adversely affect our results of operations.
In March 2003, mainland China, Hong Kong, Singapore and certain other regions in Asia encountered an outbreak of SARS, a highly contagious form of atypical pneumonia. Since April 2003, the outbreak of SARS has spread to certain other regions, including Taiwan. According to the World Health Organization, or WHO, as of June 24, 2003, 8,458 cases of SARS and 807 deaths have been reported worldwide, including 687 cases and 84 deaths in Taiwan. In response to the severity of the SARS outbreak in certain regions, the WHO issued a travel advisory recommending that persons traveling to certain regions, including much of mainland China and Taiwan, consider postponing all but essential travel. The ROC government has also imposed a variety of SARS-preventive measures, including rules that require residents and visitors to undergo a 10-day quarantine under certain circumstances. As a result, the SARS outbreak may restrict the level of economic activity in the affected areas, which may adversely affect our business and prospects.
While the long-term impact of the SARS outbreak is unclear at this time, the prolonged existence of the SARS outbreak, or the perception that the SARS outbreak has not been contained, may have an adverse effect on the economic conditions of certain regions in Asia. Each of the governments of Hong Kong, Singapore and the ROC has recently revised downward its gross domestic product growth forecasts for 2003 due to SARS. As a result, the economic fallout of the SARS outbreak may result in a decrease in the demand for our packaging and testing services. In addition, our production operations and that of our suppliers or customers may be seriously interrupted due to the SARS outbreak or the measures taken by the respective government of the ROC, Hong Kong, Singapore, the PRC or other regions against SARS.
Our profitability depends on our ability to respond to rapid technological changes in the semiconductor industry.
The semiconductor industry is characterized by rapid increases in the diversity and complexity of semiconductors. As a result, we expect that we will need to constantly offer more sophisticated packaging and testing technologies and processes in order to respond to competitive industry conditions and customer requirements. If we fail to develop, or obtain access to, advances in packaging or testing technologies or processes, we may become less competitive and less profitable. In addition, advances in technology typically lead to declining average selling prices for semiconductors packaged or tested with older technologies or processes. As a result, if we cannot reduce the costs associated with our services, the profitability on a given service, and our overall profitability, may decrease over time.
Our operating results are subject to significant fluctuations, which could adversely affect the market value of your investment.
Our operating results have varied significantly from period to period and may continue to vary in the future. Downward fluctuations in our operating results may result in decreases in the market price of our ADSs and common shares. Among the more important factors affecting our quarterly and annual operating results are the following:
changes in general economic and business conditions, particularly given the cyclical nature of the semiconductor industry and the markets served by our customers;

8
•
•
•
•
•
•
•
our ability to quickly adjust to unanticipated declines or shortfalls in demand and market prices for our packaging and testing services, due to our high percentage of fixed costs;
timing of capital expenditures in anticipation of future orders;
changes in prices of our packaging and testing services;
volume of orders relative to our packaging and testing capacity;
our ability to obtain adequate packaging and testing equipment on a timely basis;
changes in costs and availability of raw materials, equipment and labor; and
earthquakes, drought and other natural disasters, as well as industrial accidents.
Due to the factors listed above, it is possible that our future operating results or growth rates may be below the expectations of research analysts and investors. If so, the market price of our ADSs and common shares, and thus the market value of your investment, may fall.
Due to our high percentage of fixed costs, we will be unable to maintain our gross margin at past levels if we are unable to achieve relatively high capacity utilization rates.
Our operations, in particular our testing operations, are characterized by relatively high fixed costs. We expect to continue to incur substantial depreciation and other expenses as a result of our previous acquisitions of packaging and testing equipment and facilities. Our profitability depends in part not only on absolute pricing levels for our services, but also on utilization rates for our packaging and testing equipment, commonly referred to as “capacity utilization rates”. In particular, increases or decreases in our capacity utilization rates can have a significant effect on gross margins since the unit cost of packaging and testing services generally decreases as fixed costs are allocated over a larger number of units. In periods of low demand, we experience relatively low capacity utilization rates in our operations due to relatively low growth in demand, which leads to reduced margins during that period. During 2001, we experienced lower than anticipated utilization rates in our operations due to a significant decline in worldwide demand for our packaging and testing services, which led to reduced margins during that period. Although our capacity utilization rates have improved recently, we cannot assure you that we will be able to maintain or surpass our past gross margin levels if we cannot consistently achieve or maintain relatively high capacity utilization rates.
If we are unable to manage our expansion effectively, our growth prospects may be limited and our future profitability may be affected.
We have significantly expanded our packaging and testing operations in recent years, and expect to continue to expand our operations in the future, including the expansion of our interconnect materials operations. In particular, we intend to provide total solutions covering all stages of the semiconductor manufacturing process to attract new customers and broaden our product range to include products packaged and tested for a variety of end-use applications. In the past, we have expanded through both internal growth and the acquisition of new operations. Rapid expansion puts strain on our managerial, technical, financial, operational and other resources. As a result of our expansion, we have implemented and will continue to need to implement additional operational and financial controls and hire and train additional personnel. Any failure to manage our growth effectively could lead to inefficiencies and redundancies and result in reduced growth prospects and profitability.
Because of the highly cyclical nature of our industry, our capital requirements are difficult to plan. If we cannot obtain additional capital when we need it, our growth prospects and future profitability may be adversely affected.
Our capital requirements are difficult to plan in our highly cyclical and rapidly changing industry. We will need capital to fund the expansion of our facilities as well as research and development activities in order to remain competitive. We believe that our existing cash and cash equivalents, short-term investments, expected cash flow from operations and existing credit lines under our short-term loan facilities will be sufficient to meet our capital

9
•
•
•
expenditures, working capital, cash obligations under our existing debt and lease arrangements, and other requirements for at least the next twelve months. However, future capacity expansions or market or other developments may cause us to require additional funds. Our ability to obtain external financing in the future is subject to a variety of uncertainties, including:
our future financial condition, results of operations and cash flows;
general market conditions for financing activities by semiconductor companies; and
economic, political and other conditions in Taiwan and elsewhere.
If we are unable to obtain funding in a timely manner or on acceptable terms, our growth prospects and future profitability may decline.
Restrictive covenants and broad default provisions in the agreements governing our existing debt may materially restrict our operations as well as adversely affect our liquidity, financial condition and results of operations.
We are a party to numerous loan and other agreements relating to the incurrence of debt, many of which include restrictive covenants and broad default provisions. In general, covenants in the agreements governing our existing debt, and debt we may incur in the future, may materially restrict our operations, including our ability to incur debt, pay dividends, make certain investments and payments and encumber or dispose of assets. In the event of a prolonged downturn in the demand for our services as a result of a downturn in the worldwide semiconductor industry or otherwise, we cannot assure you that we will be able to remain in compliance with our financial covenants which, as a result, may lead to a default. Furthermore, a default under one agreement by us or one of our subsidiaries may also trigger cross-defaults under other agreements. In the event of default, we may not be able to cure the default or obtain a waiver on a timely basis, and our operations would be significantly disrupted or harmed and our liquidity would be adversely affected. An event of default under any agreement governing our existing or future debt, if not cured or waived, would have a material adverse effect on our liquidity, financial condition and results of operations.
As a result of the reduced levels of operating cash flow due primarily to the recent downturn in the worldwide semiconductor industry, we had on occasion during 2001 failed to comply with certain financial covenants in some of our loan agreements. Such non-compliance may also have, through broadly worded cross-default provisions, resulted in default under some of the agreements governing our other existing debt. We have obtained waivers from the relevant lenders relating specifically to such non-compliance. In addition, we have repaid or refinanced all amounts owed under agreements containing cross-default provisions that we have identified which may have been triggered by such non-compliance. Such non-compliance has not had any significant effect on our ability to repay or refinance amounts due in respect of our existing debt. For these and other reasons, including our financial condition and our relationship with our lenders, no lender has to date sought and we do not believe that any of our lenders would seek to declare a default or enforce remedies in respect of our existing debt, as a result of cross-default provisions or otherwise, although we cannot provide any assurance in this regard.
We depend on select personnel and could be affected by the loss of their services.
We depend on the continued service of our executive officers and skilled technical and other personnel. Our business could suffer if we lose the services of any of these personnel and cannot adequately replace them. Although some of these management personnel have entered into employment agreements with us, they may nevertheless leave before the expiration of these agreements. We are not insured against the loss of any of our personnel. In particular, we may be required to increase substantially the number of these employees in connection with our expansion plans, and there is intense competition for their services in the semiconductor industry. We may not be able to either retain our present personnel or attract additional qualified personnel as and when needed. In addition, we may need to increase employee compensation levels in order to attract and retain our existing officers and employees and the additional personnel that we expect to require. A portion of the workforce at our facilities in Taiwan are foreign workers employed by us under work permits which are subject to government regulations on renewal and other terms. Consequently, our business could also suffer if the Taiwan regulations relating to the

10
import of foreign workers were to become significantly more restrictive or if we are otherwise unable to attract or retain these workers at reasonable cost.
Criminal charges were brought in December 1998 by the district attorney for Taipei against Jason C.S. Chang, our Chairman and Chief Executive Officer, Richard H.P. Chang, our Vice Chairman and President, and Chang Yao Hung-ying, our then director, and others for alleged breach of fiduciary duties owed to Hung Ching Development & Construction Co. Ltd., or Hung Ching, an affiliate of ASE Inc., in their capacity as directors and officer of Hung Ching relating to a sale of land. ASE Inc. is not a party to these proceedings and we do not expect that these charges will result in any liability to us. In January 2001, the District Court of Taipei rendered a judgment finding Jason C.S. Chang and Chang Yao Hung-ying guilty of forgery of corporate and other documents and breach of fiduciary duties and Richard H.P. Chang not guilty. In January 2002, the High Court of Taiwan, the Republic of China, or ROC, rendered a judgment relating to the appeal of the judgment by the District Court, and found Jason C.S. Chang and Chang Yao Hung-ying guilty and Richard H.P. Chang not guilty. In order to comply with the Singapore Companies Act, Jason C.S. Chang and Chang Yao Hung-ying have both resigned as directors of our subsidiary, ASE Test. Neither Jason C.S. Chang nor Chang Yao Hung-ying believes that he or she committed any offense in connection with such transactions, and they appealed the decision to the Supreme Court of Taiwan, ROC. On January 23, 2003, the Supreme Court reversed the judgment of the High Court with respect to Jason C.S. Chang and Chang Yao Hung-ying and remanded the case to the High Court for retrial. If a final adverse judgment is rendered against Jason C.S. Chang, he may be required to resign as Chairman and a director of ASE Inc. See “Item 8. Financial Information— Legal Proceedings”.
If we are not successful in developing and enhancing our in-house interconnect materials capabilities, our margins and profitability may be adversely affected.
We expect that we will need to offer more advanced interconnect materials designs and production processes in order to respond to competitive industry conditions and customer requirements. In particular, our competitive position will depend to a significant extent on our ability to design and produce interconnect materials that are comparable to or better than those produced by independent suppliers and others. Many of these independent suppliers have dedicated greater resources than we have for the research and development and design and production of interconnect materials. In addition, we may not be able to acquire the technology and personnel that would enable us to further develop our in-house expertise and enhance our design and production capabilities. We expect to continue making investments in our subsidiary ASE Material Inc., or ASE Material, which focuses on the design and production of interconnect materials. In particular, we intend to further develop our in-house interconnect materials capabilities with a view to sourcing a majority of our substrate requirements by value from ASE Material by the end of 2003. If we are unable to maintain and enhance our in-house interconnect materials expertise to offer advanced interconnect materials that meet the requirements of our customers, we may become less competitive and our margins and profitability may suffer as a result.
If we are unable to obtain additional packaging and testing equipment or facilities in a timely manner and at a reasonable cost, our competitiveness and future profitability may be adversely affected.
The semiconductor packaging and testing business is capital intensive and requires significant investment in expensive equipment manufactured by a limited number of suppliers. The market for semiconductor packaging and testing equipment is characterized, from time to time, by intense demand, limited supply and long delivery cycles. Our operations and expansion plans depend on our ability to obtain a significant amount of such equipment from a limited number of suppliers, including, in the case of wire bonders, Kulicke & Soffa Industries Inc., and in the case of testers, Advantest Corporation, Agilent Technologies, Inc., Credence Systems Corporation, LTX Corporation, NP Test Inc. and Teradyne, Inc. We have no binding supply agreements with any of our suppliers and acquire our packaging and testing equipment on a purchase order basis, which exposes us to changing market conditions and other substantial risks. For example, shortages of capital equipment could result in an increase in the price of equipment and longer delivery times. Semiconductor packaging and testing also requires us to operate sizeable facilities. If we are unable to obtain equipment or facilities in a timely manner, we may be unable to fulfill our customers’ orders, which could adversely affect our growth prospects as well as financial condition and results of operations.

11
Fluctuations in exchange rates could result in foreign exchange losses.
Currently, the majority of our revenues from packaging and testing services are denominated in U.S. dollars and NT dollars. Our costs of revenues and operating expenses associated with packaging and testing services, on the other hand, are incurred in several currencies, primarily in NT dollars and U.S. dollars, as well as, to a lesser extent, Malaysian ringgit, Korean won, Japanese yen and Philippine pesos. In addition, a substantial portion of our capital expenditures, primarily for the purchase of packaging and testing equipment, has been, and is expected to continue to be, denominated in U.S. dollars with much of the remainder in Japanese yen. Fluctuations in exchange rates, primarily among the U.S. dollar, the NT dollar and the Japanese yen, will affect our costs and operating margins. In addition, these fluctuations could result in exchange losses and increased costs in NT dollar and other local currency terms. Despite hedging and mitigating techniques implemented by us, fluctuations in exchange rates have affected, and may continue to affect, our financial condition and results of operations.
The loss of a major customer or termination of our strategic alliance and other commercial arrangements with semiconductor foundries and providers of other complementary semiconductor manufacturing services may result in a decline in our revenues and profitability.
Although we have over 200 customers, due in part to the concentration of market share in the semiconductor industry, we have derived and expect to continue to derive a large portion of our revenues from a small group of customers during any particular period. Our five largest customers together accounted for approximately 44%, 41% and 40% of our net revenues in 2000, 2001 and 2002, respectively. Other than Motorola, Inc. and VIA Technologies, Inc. in 2000 and 2001, and Motorola, Inc. in 2002, no other customer accounted for more than 10% of our net revenues in 2000, 2001 and 2002. The demand for our services from each customer is directly dependent upon that customer’s level of business activity, which could vary significantly from year to year. The loss of a major customer may adversely affect our revenues and profitability.
Our strategic alliance with TSMC, the world’s largest dedicated semiconductor foundry, as well as our other commercial arrangements with providers of other complementary semiconductor manufacturing services, enable us to offer total semiconductor manufacturing solutions to our customers. This strategic alliance and any of our other commercial arrangements may be terminated at any time. A termination of this strategic alliance and other commercial arrangements, and our failure to enter into substantially similar alliances and commercial arrangements, may adversely affect our competitiveness and our revenues and profitability.
All of our key customers operate in the cyclical semiconductor business and have varied in the past, and may vary in the future, order levels significantly from period to period. Some of these companies are relatively small, have limited operating histories and financial resources, and are highly exposed to the cyclicality of the industry. We cannot assure you that these customers or any other customers will continue to place orders with us in the future at the same levels as in prior periods. The loss of one or more of our significant customers, or reduced orders by any one of them, and our inability to replace these customers or make up for such orders could reduce our profitability. In addition, we have in the past reduced, and may in the future be requested to reduce, our prices to limit the level of order cancellations. Any price reduction would likely reduce our margins and profitability.
We depend on our agents for sales and customer service in North America and Europe. Any serious interruption in our relationship with these agents, or substantial loss in their effectiveness, could significantly reduce our revenues and profitability.
We depend on non-exclusive agents for sales and customer service in North America and Europe. Our sales agents help us identify customers, monitor delivery acceptance and payment by customers and, within parameters set by us, help us negotiate price, delivery and other terms with our customers. Purchase orders are placed directly with us by our customers. Our customer service agents provide customer service and after-sales support to our customers.
Currently, our sales and customer service agents perform services only for us and our subsidiaries, but they are not owned or controlled by us. These agents are free to perform sales and support services for others, including our competitors. In particular, we may not be able to find an adequate replacement for these agents or to develop

12
•
•
•
sufficient capabilities internally on a timely basis. Any serious interruption in our relationship with these agents or substantial loss in their effectiveness in performing their sales and customer service functions could significantly reduce our revenues and profitability.
Our revenues and profitability may decline if we are unable to obtain adequate supplies of raw materials in a timely manner and at a reasonable price.
Our packaging operations require that we obtain adequate supplies of raw materials on a timely basis. Shortages in the supply of raw materials experienced by the semiconductor industry have in the past resulted in occasional price increases and delivery delays. For example, in 1999 and the first half of 2000, the industry experienced a shortage in the supply of advanced substrates used in ball grid array, or BGA, packaging. We established ASE Material in 1997 to partially reduce this risk. However, we do not expect ASE Material to supply all of our raw materials requirements. Consequently, we will remain dependent on market supply and demand for our raw materials. We cannot assure you that we will be able to obtain adequate supplies of raw materials in a timely manner and at a reasonable price. Our revenues and earnings could decline if we were unable to obtain adequate supplies of high quality raw materials in a timely manner or if there were significant increases in the costs of raw materials that we could not pass on to our customers.
Any environmental claims or failure to comply with any present or future environmental regulations may require us to spend additional funds and may materially and adversely affect our financial condition and results of operations.
We are subject to a variety of laws and regulations relating to the use, storage, discharge and disposal of chemical by-products of, and water used in, our packaging and interconnect materials production process. Although we have not suffered material environmental claims in the past, the failure to comply with any present or future regulations could result in the assessment of damages or imposition of fines against us, suspension of production or a cessation of our operations. New regulations could require us to acquire costly equipment or to incur other significant expenses. Any failure on our part to control the use of, or adequately restrict the discharge of, hazardous substances could subject us to future liabilities that may have a material adverse effect on our financial condition and results of operations.
Our controlling shareholders may take actions that are not in, or may conflict with, our public shareholders’ best interest.
Members of the Chang family own, directly or indirectly, a controlling interest in our outstanding common shares. See “Item 7. Major Shareholders and Related Party Transactions—Major Shareholders”. Accordingly, these shareholders will continue to have the ability to exercise a controlling influence over our business, including matters relating to:
our management and policies;
the timing and distribution of dividends; and
the election of our directors and supervisors.
Members of the Chang family may take actions that you may not agree with or that are not in our or our public shareholders’ best interests.
We are a ROC company and, because the rights of shareholders under ROC law differ from those under U.S. law, you may have difficulty protecting your shareholder rights.
Our corporate affairs are governed by our Articles of Incorporation and by the laws governing corporations incorporated in the Republic of China. The rights of shareholders and the responsibilities of management and the members of the board of directors under ROC law are different from those applicable to a corporation incorporated in the United States. As a result, public shareholders of ROC companies may have more difficulty in protecting their

13
interest in connection with actions taken by management or members of the board of directors than they would as public shareholders of a U.S. corporation.
Any impairment charges required under US GAAP may have a material adverse effect on our financial condition and results of operations on a US GAAP reconciled basis.
Under currently effective US GAAP, we are required to evaluate our equipment, goodwill and other long-lived assets for impairment whenever there is an indication of impairment. If certain criteria are met, we are required to record an impairment charge. We can give no assurance that impairment charges will not be required in periods subsequent to December 31, 2002.
As a result of new standards under US GAAP that became effective on January 1, 2002, we are no longer permitted to amortize remaining goodwill. Total goodwill amortization expense amounted to NT$815.6 million (US$23.5 million) under ROC GAAP for the year ended December 31, 2002. Starting from January 2002, all goodwill must be periodically tested for impairment under US GAAP. As a result of our impairment test as of December 31, 2002, we wrote off the remaining goodwill associated with our purchase of shares of ASE Test of NT$2,213.0 million (US$63.8 million) under US GAAP. As of December 31, 2002, goodwill under US GAAP amounted to NT$3,227.1 million (US$93.0 million). We currently are not able to estimate the extent and timing of any goodwill impairment charge for future years. Any goodwill impairment charge required under US GAAP may have a material adverse effect on our financial condition and results of operations on a US GAAP reconciled basis.
The determination of an impairment charge at any given time is based significantly on our expected results of operations over a number of years subsequent to that time. As a result, an impairment charge is more likely to occur during a period when our operating results are otherwise already depressed.
Risks Relating to Taiwan, Republic of China
Strained relations between the Republic of China and the People’s Republic of China could negatively affect our business and the market value of your investment.
Our principal executive offices and our principal packaging and testing facilities are located in Taiwan and approximately 77% of our net revenues in 2002 were derived from our operations in Taiwan. The Republic of China has a unique international political status. The People’s Republic of China asserts sovereignty over all of China, including Taiwan. The People’s Republic of China government does not recognize the legitimacy of the Republic of China government. Although significant economic and cultural relations have been established in recent years between the Republic of China and the People’s Republic of China, relations have often been strained and the government of the People’s Republic of China has indicated that it may use military force to gain control over Taiwan in some circumstances, such as the declaration of independence by the Republic of China. Relations between the Republic of China and the People’s Republic of China have been particularly strained in recent years. Past developments in relations between the Republic of China and the People’s Republic of China have on occasion depressed the market price of the securities of ROC companies. Relations between the Republic of China and the People’s Republic of China and other factors affecting the political or economic conditions in Taiwan could have a material adverse effect on our financial condition and results of operations, as well as the market price and the liquidity of our ADSs and common shares.
In July 2000, our shareholders approved a resolution which authorized our board of directors to make investments in the People’s Republic of China. However, the Republic of China government currently restricts certain types of investments by ROC companies in the People’s Republic of China, including investments in facilities for the packaging and testing of semiconductors. We do not know when or if such laws and policies governing investment in the People’s Republic of China will be amended, and we cannot assure you that any such amendments to the Republic of China investment laws and policies will permit us to make an investment that we consider beneficial to us in the People’s Republic of China in the future. As a result, our growth prospects and profitability may be adversely affected if we are restricted from making certain investments in the People’s Republic of China and are not able to fully capitalize on the growth of the semiconductor industry in the People’s Republic of China.

14
As a substantial portion of our business and operations are located in Taiwan, we are vulnerable to earthquakes, typhoons, drought and other natural disasters, which could severely disrupt the normal operation of our business and adversely affect our earnings.
Taiwan is susceptible to earthquakes and has experienced severe earthquakes which caused significant property damage and loss of life, particularly in the central and eastern parts of Taiwan. These earthquakes damaged production facilities and adversely affected the operations of many companies involved in the semiconductor and other industries. We experienced no structural damage to our facilities and no damage to our machinery and equipment as a result of these earthquakes. There were, however, interruptions to our production schedule primarily as a result of power outage caused by the earthquakes.
Taiwan is also susceptible to typhoons, which may cause damage and business interruption to companies with facilities located in Taiwan. In 2001, Taiwan experienced severe damage from typhoons, including a typhoon on September 16 that caused over 100 deaths, severe flooding and extensive damage to property and businesses. We have not experienced any material damage or business interruption from the increased typhoon activity in Taiwan.
In May 2002, Taiwan experienced a severe drought. Although our manufacturing process does not rely on an adequate supply of water and we were not affected by the May 2002 drought directly, a drought may interrupt the manufacturing process of the foundries located in Taiwan, in turn disrupting some of our customers’ production, and this could result in a decline in the demand for our services. In addition, any temporary or sustained adverse impact from any future droughts may adversely affect Taiwan’s economic, social or political conditions and may lead to fluctuations in the market price of our ADSs.
While we maintain several insurance policies relating to our business, we do not currently carry any insurance coverage for interruptions in public utility services or any other business interruption insurance except in connection with fire. Should these interruptions occur, we will be exposed to substantial risks and may be liable for the full amount of any losses.
Our production facilities as well as many of our suppliers and customers and providers of complementary semiconductor manufacturing services, including foundries, are located in Taiwan. If our customers are affected by an earthquake, a typhoon, a drought or other natural disasters, it could result in a decline in the demand for our packaging and testing services. If our suppliers and providers of complementary semiconductor manufacturing services are affected, our production schedule could be interrupted or delayed. As a result, a major earthquake, typhoon, drought, or other natural disasters in Taiwan could severely disrupt the normal operation of business and have a material adverse effect on our financial condition and results of operations.
Risks Relating to Ownership of ADSs
If an active market for our ADSs fails to be sustained, the price of our ADSs may fall.
Active, liquid trading markets generally result in lower price volatility and more efficient execution of buy and sell orders for investors, compared to less active and less liquid markets. Liquidity of a securities market is often a function of the volume of the underlying shares that are publicly held by unrelated parties. Although ADS holders are entitled to withdraw the common shares underlying the ADSs from the depositary at any time, ROC law requires that the common shares be held in an account in the ROC or sold for the benefit of the holder on the Taiwan Stock Exchange. In connection with any withdrawal of common shares from our ADR facility, the ADSs evidencing these common shares will be cancelled. Unless additional ADSs are issued, the effect of withdrawals will be to reduce the number of outstanding ADSs. If a significant number of withdrawals are effected, the liquidity of our ADSs will be substantially reduced. We cannot assure you that the ADS depositary will be able to arrange for a sale of deposited shares in a timely manner or at a specified price, particularly during periods of illiquidity or volatility.

15
As a holder of ADSs, your voting rights are limited by the terms of the deposit agreement. You will not be able to exercise your voting rights on an individual basis.
As a holder of ADRs evidencing ADSs, you will not be able to exercise voting rights on an individual basis. You may exercise your voting rights with respect to the underlying common shares only in accordance with the provisions of the deposit agreement. In particular, for any resolution to be proposed at a shareholders meeting, only holders who (1) have provided voting instructions in a timely manner in accordance with the provisions of the deposit agreement, and (2) together own at least 51% of the outstanding ADSs voting in the same manner, will be able to vote the common shares representing their ADSs in the manner set forth in their voting instructions. In all other cases, holders will be deemed to have authorized and directed the depositary to give a discretionary proxy to our Chairman or his designee to vote the common shares represented by their ADSs in any manner he or his designee may wish, which may not be in the interests of the holders.
You may not be able to participate in rights offerings and may experience dilution of your holdings.
We may, from time to time, distribute rights to our shareholders, including rights to acquire securities. Under the deposit agreement, the depositary will not distribute rights to holders of ADSs unless the distribution and sale of rights and the securities to which these rights relate are either exempt from registration under the U.S. Securities Act of 1933, as amended, or the Securities Act, with respect to all holders of ADSs, or are registered under the provisions of the Securities Act. We can give no assurances that we can establish an exemption from registration under the Securities Act, and we are under no obligation to file a registration statement with respect to these rights or underlying securities or to endeavor to have a registration statement declared effective. Accordingly, holders of ADSs may be unable to participate in our rights offerings and may experience dilution of their holdings as a result.
If the depositary is unable to sell rights that are not exercised or not distributed or if the sale is not lawful or reasonably practicable, it will allow the rights to lapse, in which case you will receive no value for these rights.
Restrictions on the ability to deposit our common shares into our ADR facility may adversely affect the liquidity and price of our ADSs.
The ability to deposit our common shares into our ADR facility is restricted by ROC law. A significant number of withdrawals of our common shares underlying our ADSs would reduce the liquidity of our ADSs by reducing the number of ADRs outstanding. As a result, the prevailing market price of our ADSs may differ from the prevailing market price of our common shares on the Taiwan Stock Exchange. Under current ROC law, no person or entity, including you and us, may deposit our common shares into our ADR facility without specific approval of the ROC Securities and Futures Commission except where:
(1) we pay stock dividends on our common shares;
(2) we make a free distribution of our common shares;
(3) you exercise preemptive rights in the event of a capital increase for cash; or
(4) you purchase our common shares, directly or through the depositary, on the Taiwan Stock Exchange, and deliver our common shares to the custodian for deposit into our ADR facility. The depositary may issue ADSs against the deposit of our common shares only if the total number of ADSs outstanding following the deposit will not exceed the number of ADSs previously approved by the ROC Securities and Futures Commission, plus any additional ADSs issued pursuant to the events described in (1) through (3) above.
In addition, in the case of a deposit of common shares requested as described above, the depositary may refuse to accept our common shares for deposit if such deposit is not permitted under any restriction notified by us to the depositary from time to time. These restrictions may include blackout periods during which deposits may not be made and as well as limitations on the size and frequencies of deposits.

16
•
•
•
•
The value of your investment may be reduced by possible future sales of ADSs or common shares by us or our shareholders.
While we are not aware of any plans by any major shareholders to dispose of significant numbers of common shares, we cannot assure you that one or more existing shareholders or owners of securities convertible or exchangeable into or exercisable for our common shares or ADSs will not dispose of significant numbers of common shares or ADSs. In addition, several of our subsidiaries and affiliates hold common shares, depositary shares representing common shares and options to purchase common shares or ADSs. We or they may decide to sell those securities in the future. See “Item 7. Major Shareholders and Related Party Transactions—Major Shareholders” for a description of our significant shareholders and affiliates that hold our common shares. We cannot predict the effect, if any, that future sales of ADSs or common shares, or the availability of ADSs or common shares for future sale, will have on the market price of ADSs or common shares prevailing from time to time. Sales of substantial amounts of ADSs or common shares in the public market, or the perception that such sales may occur, could depress the prevailing market prices of our ADSs or common shares.
Changes in exchange controls which restrict your ability to convert proceeds received from your ownership of ADSs may have an adverse effect on the value of your investment.
Under current ROC law, the depositary, without obtaining further approvals from the Central Bank of China or any other governmental authority or agency of the ROC, may convert NT dollars into other currencies, including U.S. dollars, for:
the proceeds of the sale of common shares represented by ADSs or received as stock dividends from the common shares and deposited into the depositary receipt facility; and
any cash dividends or distributions received from the common shares.
In addition, the depositary may also convert into NT dollars incoming payments for purchases of common shares for deposit in the ADR facility against the creation of additional ADSs. The depositary may be required to obtain foreign exchange approval from the Central Bank of China on a payment-by-payment basis for conversion from NT dollars into foreign currencies of the proceeds from the sale of subscription rights for new common shares. Although it is expected that the Central Bank of China will grant this approval as a routine matter, we cannot assure you that in the future any approval will be obtained in a timely manner, or at all.
Under current ROC law, a holder, without obtaining further approval from the Central Bank of China, may convert from NT dollars into other currencies, including U.S. dollars, the following:
the proceeds of the sale of any underlying common shares withdrawn from the depositary receipt facility or received as a stock dividend; and
any cash dividends or distribution received.
However, such holder may be required to obtain foreign exchange approval from the Central Bank of China on a payment-by-payment basis for conversion from NT dollars to foreign currencies of the proceeds from the sale of subscription rights for new common shares. Although the Central Bank of China is generally expected to grant this approval as a routine matter, we cannot assure you that you will actually obtain this approval in a timely manner, or at all.
Under the ROC Foreign Exchange Control Law, the Executive Yuan of the ROC government may, without prior notice but subject to subsequent legislative approval, impose foreign exchange controls in the event of, among others, a material change in international economic conditions. We cannot assure you that foreign exchange controls or other restrictions will not be introduced in the future.

17
The market value of your investment may fluctuate due to the volatility of the ROC securities market.
The ROC securities market is smaller and more volatile than the securities markets in the United States and in other European countries. The Taiwan Stock Exchange has experienced substantial fluctuations in the prices and volumes of sales of listed securities and there are currently limits on the range of daily price movements on the Taiwan Stock Exchange. The Taiwan Stock Exchange Index peaked at 12,495.3 in February 1990, and subsequently fell to a low of 2,560.5 in October 1990. On June 20, 2003, the Taiwan Stock Exchange Index closed at 5,002.6. The Taiwan Stock Exchange has experienced problems such as market manipulation, insider trading and payment defaults. The recurrence of these or similar problems could have a material adverse effect on the market price and liquidity of the securities of ROC companies, including our ADSs and common shares, in both the domestic and the international markets.
Holders of ADSs may incur dilution as a result of the practice among ROC technology companies of issuing stock bonuses and stock options to employees.
Similar to other ROC technology companies, we issue from time to time bonuses in the form of common shares valued at par under our employee stock bonus plan. In addition, under the revised ROC Company Law we may, upon approval from our board of directors and the ROC Securities and Futures Commission, establish an employee stock option plan. On August 13, 2002, we adopted an employee stock option plan pursuant to which our full-time employees and the full-time employees of our domestic and foreign subsidiaries are eligible to receive stock option grants. As of December 31, 2002, 145,989,000 options have been issued. See “Item 6. Directors, Senior Management and Employees—Compensation—ASE Inc. Employee Bonus Plan and Stock Option Plans”. The issuance of our shares pursuant to stock bonuses or stock options may have a dilutive effect on your ADSs.
Item 4. Information on the Company.
HISTORY AND DEVELOPMENT OF THE COMPANY
Our legal name is Advanced Semiconductor Engineering, Inc. and we are also known as “ASE”. We were incorporated on March 23, 1984 under the laws of the Republic of China as a company limited by shares. Our principal place of business is at 26 Chin Third Road, Nantze Export Processing Zone, Nantze, Kaohsiung, Taiwan, Republic of China and our phone number is 886-7-361-7131. Our agent for service of process in the U.S. is CT Corporation System, 111 Eighth Avenue, New York, New York 10011 and our agent’s phone number is 212-894-8940.
We were established in 1984 as a packaging and testing company, with facilities in the Nantze Export Processing Zone. Our business grew and we were listed on the Taiwan Stock Exchange in 1989. In 1990, we acquired ASE Test Taiwan, which provides our customers with testing services. In 1991, we established ASE Test Malaysia, which provides our customers with testing and packaging services. In 1996, we established ASE Philippines, which also conducts testing and packaging services. In 1997, we established ASE Materials, which manufactures etched leadframes and assists us in reducing our dependency on outsourced leadframes. In 1997, we constructed a new facility in Kaohsiung for packaging services and established a research and development laboratory.
ASE Chung Li and ASE Korea
In July 1999, we purchased Motorola’s Semiconductor Products Sector operations in Chung Li, Taiwan and Paju, South Korea for the packaging and testing of semiconductors with principally communications, consumer and automotive applications. The businesses are now operated by ASE Chung Li and ASE Korea. We acquired substantially all of the assets of ASE Chung Li for a base price of US$150.0 million in cash, consisting of an initial payment of US$80.0 million at closing and an additional US$70.0 in three annual installments ending in July 2002, contingent upon certain targets of revenue from packaging and testing services provided to Motorola being met. These targets were met for the first two years. The last installment of $23.3 million was due in July 2002. In 2002, we and Motorola re-negotiated the agreement for the payment of the final installment to take place in three smaller

18
•
•
•
•
•
installments ending in July 2004 contingent upon certain targets of revenue from packaging and testing services provided to Motorola being met.
We acquired 100% of the outstanding shares of ASE Korea for a base price of US$140.0 million in cash, consisting of an initial payment of US$36.0 million and an additional US$104.0 million payable over five years. In addition to the combined base price of US$290.0 million, we also paid an aggregate of approximately US$60.1 million in cash to purchase capital assets at both facilities which were acquired after January 1, 1999 and specified inventories and cash positions at both facilities. Under the acquisition agreements, ASE Inc. acquired a 70.0% interest in each of the two businesses, and ASE Test acquired the remaining 30.0% interest. This division of the investment reflected in part our estimate of the relative packaging and testing values at the facilities. Both facilities provide semiconductor packaging and testing services for Motorola’s Semiconductor Products Sector, and will continue to do so for at least three to five years following the completion of the acquisition under manufacturing services agreements with Motorola.
ISE Labs
In May 1999, we acquired 70.0% of the outstanding shares of ISE Labs, a semiconductor testing company with principal facilities located in Fremont and Santa Clara, California. The total purchase price for our 70.0% equity interest in ISE Labs was US$98.0 million.
In April, July and November, 2000, we purchased additional shares of ISE Labs at an aggregate purchase price of US$70.9 million. As a result of these purchases, we owned 80.4% of the outstanding shares of ISE Labs as of December 31, 2000. In January 2002, we purchased the remaining portion of the shares of ISE Labs for a purchase price of US$50.1 million.
Universal Scientific
From February through July of 1999, we purchased 22.6% of the outstanding shares of Universal Scientific for approximately NT$3,532.5 million (US$115.0 million), principally through open market purchases on the Taiwan Stock Exchange. We subsequently increased our holding to 23.3% following the open market purchase of additional shares in July and August of 2000. As of March 31, 2003, we held 23.5% of Universal Scientific’s outstanding equity shares. Six out of the nine directors on the Universal Scientific board of directors, including the chairman, are our representatives.
BUSINESS OVERVIEW
We are one of the world’s largest independent providers of semiconductor packaging services and, together with our subsidiary ASE Test, the world’s largest independent provider of semiconductor testing services. Our services include semiconductor packaging, design and production of interconnect materials, front-end engineering testing, wafer probing and final testing services. We believe that we are better positioned than our competitors to meet the requirements of semiconductor companies worldwide for outsourced packaging and testing services across a wide range of end-use applications because of:
our ability to provide a broad range of advanced semiconductor packaging and testing services on a large scale turnkey basis;
our expertise in developing and providing advanced packaging and testing technologies and solutions;
our scale of operations and financial position which enable us to make significant investments in capacity expansion and research and development as well as to make selective acquisitions;
our geographic presence in key centers of outsourced semiconductor and electronics manufacturing; and
our long-term relationships with providers of complementary semiconductor manufacturing services, including our strategic alliance with TSMC, the world’s largest dedicated semiconductor foundry.

19
• • • • • • • • • • • • • • •
We believe that the trend for semiconductor companies to outsource their packaging and testing requirements is accelerating as semiconductor companies increasingly rely on independent providers of foundry and advanced packaging and testing services. In response to the increased pace of new product development and shortened product life and production cycles, semiconductor companies are increasingly seeking independent packaging and testing companies that can provide turnkey services in order to reduce time-to-market. We believe that our expertise and scale in advanced technology and our ability to integrate our broad range of solutions into turnkey services allow us to benefit from the accelerated outsourcing trend and better serve our existing and potential customers.
We believe that we have benefited, and will continue to benefit, from our geographic location in Taiwan. Taiwan is currently the largest center for outsourced semiconductor manufacturing in the world and, in addition, has a high concentration of electronics manufacturing service providers, which are the end users of our customers’ products. Our close proximity to foundries and other providers of complementary semiconductor manufacturing services is attractive to our customers who wish to take advantage of the efficiencies of a total semiconductor manufacturing solution by outsourcing several stages of their manufacturing requirements. Our close proximity to end users of our customers’ products is attractive to our customers who wish to take advantage of the logistical efficiencies of direct shipment services that we offer. We believe that, as a result, we are well positioned to meet the advanced semiconductor engineering requirements of our customers.
Our global base of over 200 customers includes leading semiconductor companies across a wide range of end-use applications:
Advanced Micro Devices, Inc. NVIDIA Corporation Altera Corporation ON Semiconductor Corp. ATI Technologies Inc. Qualcomm Incorporated Conexant Systems, Inc. RF Micro Devices, Inc. IBM Corporation Silicon Integrated Systems Corp. Koninklijke Philips Electronics N.V. STMicroelectronics N.V. LSI Logic Corporation VIA Technologies, Inc. Motorola, Inc.
Industry Background
General
Semiconductors are the basic building blocks used to create an increasing variety of electronic products and systems. Continuous improvements in semiconductor manufacturing processes and design technologies have led to smaller, more complex and more reliable semiconductors at a lower cost per function. These improvements have resulted in significant performance and price benefits to manufacturers of electronic systems. As a result, semiconductor demand has grown substantially in our primary markets of communications, personal computers and consumer electronics, and has experienced increased growth in other markets such as automotive products, industrial automation and control systems.
The semiconductor industry is characterized by strong long-term growth, with periodic and sometimes severe cyclical downturns. The Semiconductor Industry Association estimates that worldwide sales of semiconductors increased from approximately US$50.5 billion in 1990 to US$140.7 billion in 2002. The semiconductor industry experienced strong growth between 1992 and 1995 and between 1998 and 2000, with declines between 1996 and first half of 1997 as well as in 1998. Starting from the fourth quarter of 2000, the semiconductor industry experienced a severe downturn due to a slowdown in the global economy, overcapacity in the semiconductor industry and worldwide inventory adjustment. The semiconductor industry started to show signs of a modest recovery in 2002, primarily as a result of inventory replenishment and the introduction of new products. We believe that the pattern of long-term growth and cyclical fluctuations will continue in the semiconductor industry.

20
Outsourcing Trends in Semiconductor Manufacturing
Historically, semiconductor companies designed, manufactured, packaged and tested semiconductors primarily in their own facilities. Over the past several years, there has been a trend in the industry to outsource stages in the manufacturing process. Virtually every significant stage of the manufacturing process can be outsourced. Wafer foundry services and semiconductor packaging services are currently the largest segments of the independent semiconductor manufacturing services market. Most of the world’s major integrated device manufacturers use some independent manufacturing services to maintain a strategic mix of internal and external manufacturing capacity.
The availability of technologically advanced independent manufacturing services has also enabled the growth of “fabless” semiconductor companies that focus on semiconductor design and marketing and outsource their fabrication, packaging and testing requirements to independent semiconductor manufacturing companies. The growth in the number and scale of fabless semiconductor companies that rely solely on independent companies to meet their manufacturing requirements will continue to be a driver of growth in the market for independent foundry, packaging and testing services. Similarly, the availability of technologically advanced independent manufacturing services has encouraged integrated device manufacturers, which had traditionally relied on in-house semiconductor manufacturing capacity, to increasingly outsource their manufacturing requirements to independent semiconductor manufacturing companies.
We believe the outsourcing of semiconductor manufacturing services will increase in the future from current levels for many reasons, including the following:
Technological Expertise and Significant Capital Expenditure. Semiconductor manufacturing processes have become highly complex, requiring substantial investment in specialized equipment and facilities and sophisticated engineering and manufacturing expertise. Technical expertise becomes increasingly important as the industry transitions from one generation of technology to another, as evidenced by the current migration of fabrication technology from 8-inch to 12-inch wafers. In addition, product life cycles have been shortening, magnifying the need to continuously upgrade or replace manufacturing equipment to accommodate new products. As a result, new investments in in-house packaging, testing and fabrication facilities are becoming less desirable to integrated device manufacturers because of the high investment costs as well as the inability to achieve sufficient economies of scale and the utilization rates necessary to be competitive with the independent service providers. Independent packaging, testing and foundry companies, on the other hand, are able to realize the benefits of specialization and achieve economies of scale by providing services to a large base of customers across a wide range of products. This enables them to reduce costs and shorten production cycles through high capacity utilization and process expertise. In the process, they are also able to focus on discrete stages of semiconductor manufacturing and deliver services of superior quality.
Since the recent industry downturn in 2001, semiconductor companies have significantly reduced their investment in in-house packaging and testing technologies and capacity. As a result, some semiconductor companies may have a limited amount of the necessary in-house expertise and capacity to accommodate large orders following a recovery in demand, particularly in the area of advanced technology. We expect semiconductor companies to increasingly outsource their packaging and testing requirements to take advantage of the advanced technology and scale of operations of independent packaging and testing companies.
Focus on Core Competencies. As the semiconductor industry becomes more competitive, semiconductor companies are expected to further outsource their semiconductor manufacturing requirements in order to focus their resources on core competencies, such as semiconductor design and marketing.
Time-to-Market Pressure. The increasingly short product life cycle has accelerated time-to-market pressure for semiconductor companies, leading them to rely increasingly on outsourced suppliers as a key source for effective manufacturing solutions.
Gartner Dataquest forecasts that the total outsourced semiconductor packaging market will grow from US$6.8 billion in 2002 to US$14.2 billion in 2005. Gartner Dataquest also forecasts that the total outsourced semiconductor testing market will grow from US$1.6 billion in 2002 to US$3.9 billion in 2005.

21
The Semiconductor Industry in Taiwan
The semiconductor industry in Taiwan has been a leader in, and a major beneficiary of, the trend in outsourcing. The growth of the semiconductor industry in Taiwan has been the result of several factors. First, semiconductor manufacturing companies in Taiwan typically focus on one or two stages of the semiconductor manufacturing process. As a result, these companies tend to be more efficient and are better able to achieve economies of scale and maintain higher capacity utilization rates. Second, semiconductor manufacturing companies in Taiwan that provide the major stages of the manufacturing process are located close to each other and typically enjoy close working relationships. This close network is attractive to customers who wish to outsource several stages of the semiconductor manufacturing process. For instance, a customer could reduce production cycle time and unit cost and streamline logistics by outsourcing its foundry, packaging, testing and drop shipment services to semiconductor manufacturing companies in Taiwan. Third, Taiwan also has an educated labor pool and a large number of engineers suitable for sophisticated manufacturing industries such as semiconductors.
As a result of the growth of the global semiconductor market, the semiconductor industry in Taiwan has in recent years made significant capital expenditures to expand capacity and technological capabilities. The ROC government has also provided tax incentives, long-term loans at favorable rates and research and development support, both directly and indirectly through support of research institutes and universities. As a result of investments made in recent years, Taiwan has achieved substantial market share in the outsourced semiconductor manufacturing industry. Furthermore, the growth of Taiwan’s electronics manufacturing industry, particularly in personal computer design and manufacturing, has created substantial local demand for semiconductors.
The Semiconductor Industry in Other Asian Regions
Many of the factors that contributed to the growth of the semiconductor industry in Taiwan have also contributed to the recent development of the semiconductor industry in Southeast Asia. Access to expanding semiconductor foundry services in Singapore, convenient proximity to major downstream electronics manufacturing operations in Malaysia, Singapore and Thailand, government sponsored infrastructure support, tax incentives and pools of skilled engineers and labor at a relatively low cost have all encouraged the development of back-end semiconductor service operations in Southeast Asia. The downstream electronics manufacturers in Southeast Asia have typically focused on products used in the communications, industrial and consumer electronics and personal computer peripheral sectors. The proximity to both semiconductor foundries and end users has influenced local and international semiconductor companies increasingly to obtain packaging, testing and drop shipment services from companies in Southeast Asia.
In addition, the world’s leading electronics manufacturing service providers, many of them from Taiwan, are increasingly establishing manufacturing facilities in the People’s Republic of China in order to take advantage of lower labor costs, government incentives for investment and the potential size of the domestic market for end users of electronics products. Many of the factors that contributed to the growth of the semiconductor industry in Taiwan are beginning to emerge in the People’s Republic of China and may play an increasingly important role in the growth of its semiconductor industry over the long-term.
Overview of Semiconductor Manufacturing Process
The manufacturing of semiconductors is a complex process that requires increasingly sophisticated engineering and manufacturing expertise. We are involved in all stages of the semiconductor manufacturing process except circuit design and wafer fabrication.
Process Description
Circuit Design The design of a semiconductor is developed by laying out circuit components and interconnections. A complex circuit may be designed with as many as 20 layers of patterns or more.
Front-End Engineering Test Throughout and following the design process, prototype semiconductors undergo front-end engineering testing, which involves software development, electrical design validation, reliability and failure analysis.
Wafer Fabrication The process begins with the generation of a photomask through the definition of
the circuit design pattern on a photographic negative, known as a mask, by an electron beam or laser beam writer. These circuit patterns are transferred to the wafers using various advanced processes.
Wafer Probe Each individual die is electrically tested, or probed, for defects. Dies that fail this test are marked to be discarded.
Packaging Packaging, also called assembly, is the processing of bare semiconductors into finished semiconductors and serves to protect the die and facilitate electrical connections and heat dissipation. The patterned silicon wafers received from our customers are diced by means of diamond saws into separate dies, also called chips. Each die is attached to a leadframe or a laminate (plastic or tape) substrate by epoxy resin. A leadframe is a miniature sheet of metal, generally made of copper and silver alloys, on which the pattern of input/output leads has been cut. On a laminate substrate, typically used in ball grid array packages, the leads take the shape of small bumps or balls. Leads on the leadframe or the substrate are connected by extremely fine gold wires or bumps to the input/output terminals on the chips, through the use of automated machines known as “wire bonders”. Each chip is then encapsulated, generally in a plastic casing molded from a molding compound, with only the leads protruding from the finished casing, either from the edges of the package as in the case of the leadframe-based packages, or in the form of small bumps on a surface of the package as in the case of ball grid array or other substrate-based packages.
Final Test Final testing is conducted to ensure that the packaged semiconductor meets performance specifications. Final testing involves using sophisticated testing equipment and customized software to electrically test a number of attributes of packaged semiconductors, including functionality, speed, predicted endurance and power consumption. The final testing of semiconductors is categorized by the functions of the semiconductors tested into logic/mixed-signal final testing and memory final testing. Memory final testing typically requires simpler test software but longer testing time per device tested.
Strategy
Our objective is to provide advanced semiconductor packaging and testing services which set industry standards and to lead and facilitate the industry trend towards outsourcing semiconductor manufacturing requirements. The principal elements of our strategy are to:
Maintain Our Focus on Providing a Complete Range of Semiconductor Packaging and Testing Services
We believe that an important factor in our ability to attract leading semiconductor companies as our customers has been our ability to provide turnkey services on a large scale. Turnkey services consist of the integrated packaging, testing and direct shipment of semiconductors to end users designated by our customers. As a result of our technical expertise and large production capacity in both packaging and testing, we are able to provide turnkey services on a large scale. As product lives and production cycles shorten and packaging and testing technologies advance more rapidly, our customers increasingly value our ability, as a downstream service provider, to work with them as an integral and strategic partner in the upstream development of their products. We intend to enhance and expand our expertise in both the upstream and downstream semiconductor manufacturing processes in order to better serve our customers in providing our core services of packaging and testing. The front-end engineering testing expertise of ISE Labs has greatly enhanced our ability to participate in the earlier stages of circuit design and the semiconductor manufacturing process. Our establishment of ASE Material in 1997 for the design and production of interconnect materials, such as substrates and leadframes, has provided us with expertise in interconnect technology, which has become increasingly critical for our customers both in terms of cost and production cycle time.
22
23
Continue to Focus on Advanced Technological, Processing and Materials Capabilities
We intend to continue our focus on developing advanced process and product technologies in order to meet the advanced packaging and testing requirements of our customers. Our expertise in packaging technology has enabled us to develop advanced solutions such as fine-pitch bonding, stacked die packaging and bump chip carrier packaging. We are continuously investing in research and development in response to and in anticipation of migrations in technology and intend to continue to acquire access to new technologies through strategic alliances and licensing arrangements.
We intend to continue to focus on developing and enhancing our existing interconnect materials capabilities through ASE Material. We expect that interconnect materials will become an increasingly important value-added component of the semiconductor packaging business as packaging technology migrates from the traditional wirebonding process towards the flip-chip wafer bumping process. As a result, we expect high density interconnect materials to be a core element for the next generation of semiconductor packaging technology. By focusing on the design and production of interconnect materials, we plan to capture most of the value-added components of the packaging business and lead the migration in packaging technology. In 2002, ASE Material supplied approximately one third of our substrate requirements by value. We intend to continue to invest in ASE Material in order to further develop and enhance our existing capabilities in interconnect materials with a view to sourcing a majority of our substrate requirements by value from ASE Material by the end of 2003.
We intend to continue to strengthen our capabilities in testing complex, high-performance semiconductors. In particular, we plan to focus on testing logic/mixed-signal semiconductors that are characterized by very high clock speeds, high pin count and high levels of integration.
The increasing miniaturization of semiconductors and the growing complexity of interconnect technology have also resulted in the blurring of the traditional distinctions among assembly at different (that is, upstream and downstream) levels of integration: chip, module, board and system. Our controlling interest in Universal Scientific has provided us with access to process and product technologies at the levels of module, board and system assembly and test, which helps us to better anticipate industry trends and take advantage of potential growth opportunities.
Strategically Expand Production Capacity
We intend to strategically expand our production capacity, both through internal growth and through selective acquisitions, with a focus on providing more advanced packaging and testing services, which we believe present greater opportunities to achieve higher growth in our revenues and higher margins. We believe that the demand for advanced semiconductor packaging and testing services will grow at a faster pace than demand for traditional packaging and testing services. Packaging and testing services for more advanced semiconductors also generally have higher margins for two reasons. First, as the packaging and testing of advanced semiconductors become more complex, requiring greater expertise in process and technology, such services typically command higher average selling prices. Second, we have been able to achieve higher utilization rates for the equipment we use for more advanced packaging and testing, compared to other equipment that we maintain. We believe that our technical expertise, as well as our scale of operations and financial position, which had enabled us to continue to make investments in more advanced packaging and testing equipment even in times of market downturn, have also enabled us to attract a greater proportion of the demand for more advanced packaging and testing services.
We evaluate acquisition opportunities on the basis of access to new markets and technology, the enhancement of our production capacity, economies of scale and management resources, and closer proximity to existing and potential customers. In 1999, we acquired ISE Labs, an independent testing company with operations in California, Hong Kong and Singapore. Through combining the front-end engineering testing capabilities of ISE Labs with our existing final testing capabilities, we are able to provide our customers with complete semiconductor testing solutions. We acquired ASE Chung Li and ASE Korea in 1999, formerly the semiconductor packaging and testing operations of Motorola, Inc. located in Chung Li, Taiwan and Paju, South Korea, which allowed us to expand our capacity and gain access to specialized packaging and testing technologies with a focus on wireless communications and automotive end-products.

24
•
•
•
Continue to Leverage Our Presence in Key Centers of Semiconductor and Electronics Manufacturing
We intend to continue leveraging our presence in key centers of semiconductor and electronics manufacturing to further grow our business. We have significant packaging and testing operations in Taiwan, currently the largest center for outsourced semiconductor manufacturing in the world. This presence enables our engineers to work closely with our customers as well as foundries and other providers of complementary semiconductor manufacturing services early in the semiconductor design process, enhances our responsiveness to the requirements of our customers and shortens production cycles. In addition, as a provider of turnkey services, we are able to offer in Taiwan packaging and testing services, including interconnect materials solutions, all within relatively close geographic proximity to our customers, other service providers and the end users of our customers’ products. In addition to our expansion plans in Kaohsiung, Taiwan, we intend to expand our packaging, testing and interconnect materials operations in Chung Li, Taiwan to better serve our customers located in northern Taiwan and customers who request that we maintain the capability of packaging and testing their products at more than one location in Taiwan.
In addition to our locations in Taiwan, we have operations in the following locations:
Korea—a center for the manufacturing of memory devices and semiconductors for communications applications with a concentration of integrated device manufacturers specializing in these products;
Malaysia and Singapore—an emerging center for outsourced semiconductor manufacturing in Southeast Asia with a concentration of integrated device manufacturers; and
Silicon Valley in California—the preeminent center for semiconductor design with a concentration of fabless customers.
Strengthen and Develop Strategic Relationships with Providers of Complementary Semiconductor Manufacturing Services
We intend to strengthen existing and develop new strategic relationships with providers of other complementary semiconductor manufacturing services, such as foundries, as well as equipment vendors, raw material suppliers and technology research institutes, in order to offer our customers total semiconductor manufacturing solutions covering all stages of the manufacturing of their products from design to shipment.
Since 1997, we have maintained a strategic alliance with TSMC, the world’s largest dedicated semiconductor foundry, which designates us as the non-exclusive preferred provider of packaging and testing services for semiconductors manufactured by TSMC. Through our strategic alliance with and close geographic proximity to TSMC, we are able to offer our customers a total semiconductor manufacturing solution that includes access to foundry services in addition to our packaging, testing and direct shipment services.
We are developing similar strategic relationships with other major foundries and providers of other complementary semiconductor manufacturing services in Taiwan and Southeast Asia with which we already have close business relationships.
Principal Products and Services
We offer a broad range of advanced semiconductor packaging and testing services. Our package types employ either leadframes or substrates as interconnect materials. The semiconductors we package are used in a wide range of end-use applications, including communications, personal computers, consumer electronics, industrial, automotive and other applications. Our testing services include front-end engineering testing, which is performed during and following the initial circuit design stage of the semiconductor manufacturing process; wafer probe; final testing and other related semiconductor testing services. We focus on packaging and testing logic semiconductors. We offer our customers turnkey services which consist of packaging, testing and direct shipment of semiconductors to end users designated by our customers. In 2001 and 2002, our packaging revenues accounted for 75.3% and 77.9% of our net revenues, respectively, and our testing revenues accounted for 24.7% and 22.1% of our net revenues, respectively.

25
•
•
•
Packaging Services
We offer a broad range of package types to meet the requirements of our customers, with a focus on advanced packaging solutions. Within our portfolio of package types, we focus on the packaging of semiconductors for which there is expected to be a strong demand. These include advanced leadframe-based package types such as quad flat package, thin quad flat package, bump chip carrier and quad flat no-lead package, and package types based on substrates, such as BGA, including flip-chip BGA. We are among the leaders in such advanced packaging process and technologies and are well-positioned to lead the technology migration in the semiconductor packaging industry.
The semiconductor packaging industry has evolved to meet the advanced packaging requirements of high-performance semiconductors. The development of high-performance electronics products has spurred the innovation of semiconductor packages that have higher interconnect density and better electrical performance. As a part of this technology migration, semiconductor packages have evolved from leadframe-based packages to substrate-based packages. The key differences of these package types are:
the size of the package;
the density of electrical connections the package can support; and
the thermal and electrical characteristics of the package.
Leadframe-Based Packages. Leadframe-based packages are packaged by connecting the die, using wire bonders, to the leadframe with gold wire. As packaging technology improves, the number of leads per package increases. Packages have evolved from the lower pin-count plastic dual in-line packages to higher pin-count quad flat packages. In addition, improvements in leadframe-based packages have reduced the footprint of the package on the circuit board and improved the electrical performance of the package. The following table sets forth our principal leadframe-based packages.

Package Types Number of Leads Description End-Use Applications
Quad Flat Package (QFP)/Thin Quad Flat Package (TQFP)
44-304 Designed for advanced processors and controllers, application specific integrated circuits and digital signal processors.
Multimedia applications, cellular phones, personal computers, automotive and industrial products, hard disk drives, communication boards such as ethernet, integrated services digital network, and notebook computers.
Quad Flat No-Lead Package (QFN)/Microchip Carrier(MCC)
16-88 QFN or MCC uses half- encapsulation technology to expose the rear side of the die pad and the tiny fingers, which are used to connect the chip and bonding wire with printed circuit boards.
Cellular phones, wireless LAN, personal digital assistant devices and digital cameras.
Bump Chip Carrier (BCC)
16-116 BCC packages use plating metal pads to connect with printed circuit boards, creating enhanced thermal and electrical performance.
Cellular phones, wireless LAN, personal digital assistant devices and digital cameras.
Small Outline Plastic Package OP)/Thin Small Outline Plastic Package (TSOP)
8-56 Designed for memory devices including static random access memory, or SRAM, dynamic random access memory, or DRAM, fast static RAM, also called FSRAM, and flash memory devices.
Consumer audio/video and entertainment products, cordless telephones, pagers, fax machines, printers, copiers, personal computer peripherals, automotive parts, telecommunications products, recordable optical disks and hard disk drives.
Small Outline Plastic J-Bend Package (SOJ)
20-44 Designed for memory and low pin-count applications.
DRAM memory devices, microcontrollers, digital analog conversions and audio/video applications.
Plastic Leaded Chip Carrier (PLCC)
28-84 Designed for applications that do not require a low profile package with a high density of interconnects.
Personal computers, scanners, electronic games and monitors.
Plastic Dual In-line Package (PDIP)
8-56 Designed for consumer electronic products.
Telephones, televisions, audio/video applications and computer peripherals.
Substrate-Based Packages. Substrate-based packages generally employ the ball grid array design which
utilizes a substrate rather than a leadframe. Whereas traditional leadframe technology places the electrical connection around the perimeter of the package, the BGA package type places the electrical connection at the bottom of the package surface in the form of small bumps or balls. These small bumps or balls are typically distributed evenly across the bottom surface of the package, allowing greater distance between individual leads and higher pin-counts.
The BGA package type was developed in response to the requirements of advanced semiconductors. The benefits of the BGA package type include:
smaller package size; •
• higher pin-count; 26

27
•
•
•
greater reliability;
superior electrical signal transmission; and
better heat dissipation.
The industry demand for BGA packages has grown significantly in recent years. BGA packages are generally used in applications where size, density and performance are important considerations, such as cellular handsets and high pin-count graphic chipsets. Our expertise in BGA packages also includes capabilities in stacked-die BGA, which assembles multiple dies into a single package. As an extension to stacked-die BGA, we also assemble systems-in-a-package products, which involve the integration of more than one chip into the same package. We believe that we are among the leaders in these packaging technologies.
We believe that there will continue to be a growing demand for packaging solutions with increased input/output density, a smaller size and better heat dissipation characteristics. In anticipation of this demand, we have focused on developing our capabilities in some advanced packaging solutions, such as flip-chip BGA. Flip-chip BGA technology replaces wire bonding with wafer bumping for interconnections within the package. Wafer bumping involves the placing of tiny solder balls, instead of wires, on top of dies for connection to substrates. As compared with more traditional packages which allow input/output connection only on the boundaries of the dies, flip-chip packages significantly enhance the input/output flow by allowing input/output connection over the entire surface of the dies. We commenced volume production of flip-chip packages in July 2000.
The following table sets forth our principal substrate-based packages.
Package Types Number of
Leads Description End-Use Applications
Plastic BGA 5-1152 Designed for semiconductors which require the enhanced performance provided by plastic BGA, including personal computer chipsets, graphic controllers and microprocessors, application specific integrated circuits, digital signal processors and memory devices.
Wireless products, cellular phones, global positioning systems, notebook computers, disk drives and video cameras.
Film BGA 96-280 Substrate-based package that has a higher performance and lower profile than plastic BGA.
Cellular phones, pagers, wireless communications, digital signal processors and micro-controller applications and high performance disk drives.
Cavity Down BGA 256-854 Designed for memory devices such as flash memory devices, SRAM, DRAM and FSRAM, microprocessors/controllers and high value application specific integrated circuits requiring a low profile, light and small package.
Cellular and other telecommunications products, wireless and consumer systems, PDAs, disk drives, notebook computers and memory boards.
Stacked-Die BGA 48-341 Combination of multiple dies in a single package that enables package to have multiple functions within a small surface area.
Cellular phones, local area networks, graphic processors, digital cameras and pagers.

Package Types Number of
Leads Description End-Use Applications
Flip-Chip BGA 16-1681 Using advanced interconnect technology, flip-chip BGA package allows higher density of input/output connection over the entire surface of the dies. Designed for high-performance semiconductors that require high density of interconnects in a small package.
High-performance networking, graphics and processor applications.
System-in-Package 256-972 Integrated combination of microprocessor, logic controller and memory chips assembled in one package.
Digital televisions, fax modems, personal computer peripherals, compact disc players and copiers.
Land Grid Array 32-78 Leadless package which is essentially a BGA package without the solder balls. Based on laminate substrate, land grid array packages allow flexible routing and are capable of multichip module functions.
High frequency integrated circuits such as wireless communications products, computer servers and personal computer peripherals.
Tape Carrier Package 51-384 The light-weight tape carrier package uses a labor-saving reel-to-reel bonding technique to facilitate high input/output and frequency as well as flexible interconnections.
Liquid crystal displays, ink printers, cellular phones, PDA and notebook computers.
The following table sets forth, for the periods indicated, the percentage of our packaging revenues accounted for
by each package type.
Year Ended December 31,
2000 2001 2002
(percentage of packaging revenues)
Package Types: BGA and other substrate-based package types ..................................................... 44.2% 52.0% 53.5%TQFP/LQFP.......................................................................................................... 18.2 14.3 15.2 QFP....................................................................................................................... 14.6 12.7 12.1 SOJ/SOP ............................................................................................................... 9.9 6.7 5.8 PLCC .................................................................................................................... 3.0 2.1 1.8 PDIP...................................................................................................................... 3.0 3.0 3.4 Other ..................................................................................................................... 7.1 9.2 8.2
Total .................................................................................................................. 100.0% 100.0% 100.0%
Interconnect Materials. Interconnect materials connect the input/output on the semiconductor dies to the printed circuit board. Interconnect materials include leadframe, which is a miniature sheet of metal, generally made of copper and silver alloys, on which the pattern of input/output leads has been cut, and substrate, which is a multi-layer miniature printed circuit board. Interconnect materials are an important element of the electrical characteristics and overall performance of semiconductors. We produce both leadframes and substrates for our packaging operations through ASE Material. In 2002, ASE Material supplied approximately one-quarter, by value, of the leadframes and one-third, by value, of the substrates used in our operations.
28

29
•
•
•
•
We expect substrates will become an increasingly important value-added component of the semiconductor packaging business. The demand for higher performance semiconductors in smaller packages will continue to spur the development of advanced substrates that can support the advancement in circuit design and fabrication. As a result, we believe that the market for substrates will grow and the cost of substrates as a percentage of the total packaging process will increase, especially for advanced packages such as flip-chip BGA packages. In the past, substrates we designed for our customers were produced by independent substrate manufacturers. In anticipation of the migration in packaging technology, we established ASE Material in 1997 to develop our capabilities in the design and production of interconnect materials for use in our packaging operations. Through ASE Material, we believe we can capture the growth opportunities in the interconnect materials business as well as reduce the production cycle time for our customers by integrating substrate design and production into our packaging services. See “Item 3. Key Information—Risk Factors—Risk Relating to Our Business—If we are not successful in developing and enhancing our in-house interconnect materials capabilities, our margins and profitability may be adversely affected”.
Testing
We provide a complete range of semiconductor testing services, including front-end engineering testing, wafer probing, final testing of logic/mixed-signal and memory semiconductors and other test-related services.
The testing of semiconductors requires technical expertise and knowledge of the specific applications and functions of the semiconductors tested as well as the testing equipment utilized. We believe that our testing services employ technology and expertise which are among the most advanced in the semiconductor industry. In addition to maintaining different types of testing equipment, which enables us to test a variety of semiconductor functions, we work closely with our customers to design effective testing and conversion programs on multiple equipment platforms for particular semiconductors.
In recent years, complex, high-performance logic/mixed-signal semiconductors have accounted for an increasing portion of our testing revenues. As the testing of complex, high-performance semiconductors requires a large number of functions to be tested using more advanced testing equipment, these products generate higher revenues per unit of testing time, as measured in central processing unit seconds.
Front-End Engineering Testing. We provide front-end engineering testing services, including customized software development, electrical design validation, and reliability and failure analysis.
Customized Software Development. Test engineers develop customized software to test the semiconductor using advanced testing equipment. A customized software, developed on specific testing platforms, is required to test the conformity of each particular semiconductor type to its unique functionality and specification.
Electrical Design Validation. A prototype of the designed semiconductor is subjected to electrical tests using advanced test equipment and customized software. These tests assess whether the prototype semiconductor complies with a variety of different operating specifications, including functionality, frequency, voltage, current, timing and temperature range.
Reliability Analysis. Reliability analysis is designed to assess the long-term reliability of the semiconductor and its suitability of use for intended applications. Reliability testing can include “burn-in” services, which electrically stress a device, usually at high temperature and voltage, for a period of time long enough to cause the failure of marginal devices.
Failure Analysis. In the event that the prototype semiconductor does not function to specifications during either the electrical design validation or reliability testing processes, it is typically subjected to failure analysis to determine why it did not perform as anticipated. As part of this analysis, the prototype semiconductor may be subjected to a variety of analyses, including electron beam probing and electrical testing.

30
•
•
•
Wafer Probing. Wafer probing is the step immediately before the packaging of semiconductors and involves visual inspection and electrical testing of the processed wafer for defects to ensure that it meets our customers’ specifications. Wafer probing services require expertise and testing equipment similar to that used in final testing, and most of our testers can also be used for wafer probing.
Logic/Mixed-Signal Final Testing. We conduct final tests of a wide variety of logic/mixed-signal semiconductors, with the number of leads ranging from the single digits to over one thousand and operating frequencies of up to 800 MHz for digital semiconductors and 6 GHz for radio frequency semiconductors, which are at the high end of the range for the industry. The products we test include semiconductors used for networking and wireless communications, graphics and disk controllers for home entertainment and personal computer applications, as well as a variety of application specific integrated circuits for various specialized applications.
Memory Final Testing. We provide final testing services for a variety of memory products, such as SRAM, DRAM, single-bit erasable programmable read-only memory semiconductors and flash memory semiconductors.
Other Test-Related Services. We provide a broad range of additional test-related services, including:
Burn-in Testing. Burn-in testing is the process of electrically stressing a device, usually at high temperature and voltage, for a period of time to simulate the continuous use of the device to determine whether this use would cause the failure of marginal devices.
Dry Pack. Process which involves heating semiconductors in order to remove moisture before packaging and shipping to customers.
Tape and Reel. Process which involves transferring semiconductors from a tray or tube into a tape-like carrier for shipment to customers.
Drop Shipment Services. We offer drop shipment services for the shipment of semiconductors directly to end users designated by our customers. Drop shipment services are provided mostly in conjunction with logic/mixed-signal testing. We provide drop shipment services to a significant percentage of our testing customers. A substantial portion of our customers at each of our facilities have qualified these facilities for drop shipment services. Since drop shipment eliminates the additional step of inspection by the customer before shipment to the end user, quality of service is a key consideration. We believe that our ability to successfully execute our full range of services, including drop shipment services, is an important factor in maintaining existing customers as well as attracting new customers.
The following table sets forth, for the periods indicated, the percentage of our testing revenues accounted for by each type of testing service.
Year Ended December 31,
2000 2000 2000
(percentage of testing revenues)
Testing Services: Front-end engineering test ........................................................................................ 4.5% 8.7% 7.4%Wafer probe .............................................................................................................. 9.9 9.0 8.9 Final test ................................................................................................................... 85.6 82.3 83.7
Total .................................................................................................................. 100.0% 100.0% 100.0% Sales and Marketing
Sales and Marketing Offices
We maintain sales and marketing off ices in Taiwan, the United States, Europe and Malaysia. Our Hsinchu and Kaohsiung offices in Taiwan are staffed with employees from both ASE Inc. and ASE Test Taiwan. In addition, the sales agent for our packaging and testing services maintains sales and marketing offices in Austria, Belgium,

31
• • • • • • • • • • • • • • •
Germany, Japan, Korea, Malaysia and the United States. We conduct marketing research through our customer service personnel and those of our sales agent and through our relationships with our customers and suppliers to keep abreast of market trends and developments. We also provide advice in the area of production process technology to our major customers planning the introduction of new products. In placing orders with us, our customers specify which of our facilities these orders will go to. Our customers conduct separate qualification and correlation processes for each of our facilities that they use. See “—Sales and Marketing—Qualification and Correlation by Customers”.
Sales and Customer Service Agents
Under commission agreements, each of ASE Inc., ASE Test Taiwan, ASE Korea, ASE Chung Li and ASE Test Malaysia has appointed Gardex International Limited, or Gardex, as the non-exclusive sales agent for its services and products worldwide, excluding Asia. Gardex helps us identify customers, monitor delivery acceptance and payment by customers and, within parameters set by us, negotiate price, delivery and other terms with our customers. Purchase orders are placed directly with us by our customers. We pay Gardex a commission of between 0.5% and 1.0% of our sales outside of Asia, payable monthly, depending on the amount of these sales. In 2001 and 2002, we paid US$5.9 million and US$5.6 million, respectively, in commission to Gardex.
Under service agreements, each of ASE Inc., ASE Test Taiwan, ASE Korea, ASE Chung Li and ASE Test Malaysia has appointed ASE (U.S.) Inc. as its non-exclusive agent to provide customer service and after-sales support to its customers in Europe and North America. We pay ASE (U.S.) Inc. a monthly fee based on its monthly associated costs and expenses plus a commission set by reference to the lower of a percentage of sales or a fixed fee. In 2001 and 2002, we paid US$15.8 million and US$15.6 million, respectively, in fees and service charges to ASE (U.S.) Inc.
Both Gardex and ASE (U.S.) Inc. are wholly owned by Y.C. Hsu, who has had a long personal relationship with Jason C.S. Chang, our Chairman and Chief Executive Officer, that pre-dates the founding of our company. We have maintained business relationships with Gardex, ASE (U.S.) Inc. and their predecessors since 1985. Gardex and ASE (U.S.) Inc. currently perform services only for us.
Customers
Our global base of over 200 customers includes leading semiconductor companies across a wide range of end-use applications:
Advanced Micro Devices, Inc. NVIDIA Corporation Altera Corporation ON Semiconductor Corp. ATI Technologies Inc. Qualcomm Incorporated Conexant Systems, Inc. RF Micro Devices, Inc. IBM Corporation Silicon Integrated Systems Corp. Koninklijke Philips Electronics N.V. STMicroelectronics N.V. LSI Logic Corporation VIA Technologies, Inc. Motorola, Inc.
Our five largest customers together accounted for approximately 44%, 41% and 40% of our net revenues in
2000, 2001 and 2002, respectively. Other than Motorola, Inc. and VIA Technologies, Inc. in 2000 and 2001 and Motorola, Inc. in 2002, no customer accounted for more than 10% of our net revenues in 2000, 2001 and 2002.
We package and test for our customers a wide range of products with end-use applications in the communications, personal computers, consumer electronics, industrial and automotive sectors. The following table sets forth a breakdown of the percentage of our net revenues, for the periods indicated, by the principal end-use applications of the products which we packaged and tested.
Year Ended
December 31,
2001 2002
End-Use Applications: Communications ...................................................................................................... 36.0% 34.4% Personal computers .................................................................................................. 35.5 35.4 Consumer electronics/industrial/automotive ............................................................ 27.7 28.8 Other ........................................................................................................................ 0.8 1.4
Total .................................................................................................................... 100.0% 100.0%
Many of our customers are leaders in their respective end-use markets. For example, we provide Motorola, an industry leader in automotive and wireless communications semiconductor products, with most of its outsourced packaging and testing requirements. The following table sets forth some of our largest customers, in alphabetical order, categorized by the principal end-use applications of the products which we package and test for them.
Communications Personal Computers Consumer Electronics/ Industrial/Automotive
Advanced Micro Devices, Inc. Advanced Micro Devices, Inc. Altera Corporation Conexant Systems, Inc. ATI Technologies, Inc. LSI Logic Corporation Koninklijke Philips Electronics N.V. IBM Corporation Motorola, Inc. Motorola, Inc. NVIDIA Corporation ON Semiconductor Corp. Qualcomm Incorporated Silicon Integrated Systems Corp. STMicroelectronics N.V. RF Micro Devices, Inc. VIA Technologies, Inc. STMicroelectronics N.V. Winbond Electronics Corporation
We categorize our packaging and testing revenues geographically based on the country in which the customer is headquartered. The following table sets forth, for the periods indicated, the percentage breakdown by geographic regions of our packaging and testing revenues.
Year Ended December 31,
2000 2001 2002
North America .......................................................................................... 65.0% 65.0% 59.1% Taiwan ...................................................................................................... 24.8 26.7 24.9 Europe ...................................................................................................... 3.8 3.9 6.1 Others ....................................................................................................... 6.4 4.4 9.9
Total ..................................................................................................... 100.0% 100.0% 100.0%
In 2002, approximately 83% of the testing revenues of ASE Test Taiwan and 79% of the testing revenues of ASE Test Malaysia were accounted for by the testing of semiconductors packaged at our packaging facilities in Kaohsiung, Taiwan and Malaysia, respectively. The balance represented testing revenues from customers who delivered packaged semiconductors directly to ASE Test Taiwan or ASE Test Malaysia for testing. In 2002, approximately 34% of our packaging revenues in Kaohsiung, Taiwan and 62% of our packaging revenues in Malaysia were accounted for by the packaging of semiconductors which were subsequently tested at ASE Test Taiwan and ASE Test Malaysia, respectively. We expect that more customers of our packaging facilities in Kaohsiung, Taiwan and Malaysia will begin to contract for our packaging and testing services on a turnkey basis.
Qualification and Correlation by Customers
Customers generally require that our facilities undergo a stringent qualification process during which the customer evaluates our operations and production processes, including engineering, delivery control and testing capabilities. The qualification process typically takes up to eight weeks, but can take longer depending on the requirements of the customer. In the case of our testing operations, after we have been qualified by a customer and before the customer delivers semiconductors to us for testing in volume, a process known as correlation is undertaken. During the correlation process, the customer provides us with sample semiconductors to be tested and
32

33
either provides us with the test program or requests that we develop a conversion program. In some cases, the customer also provides us with a data log of results of any testing of the semiconductors which the customer may have conducted previously. The correlation process typically takes up to two weeks, but can take longer depending on the requirements of the customer. We believe our ability to provide turnkey services reduces the amount of time spent by our customers in the qualification and correlation process. As a result, customers utilizing our turnkey services are able to achieve shorter production cycles.
Pricing
We price our packaging services primarily on a cost-plus basis with reference to prevailing market prices. We price our testing services primarily on the basis of the amount of time, measured in central processing unit seconds, taken by the automated testing equipment to execute the test programs specific to the products being tested, as well as the cost of the equipment, with reference to prevailing market prices. Prices for our packaging and testing services are confirmed at the time firm orders are received from customers, which is typically four to eight weeks before delivery.
Raw Materials and Suppliers
Packaging
The principal raw materials used in our packaging processes are interconnect materials such as leadframes and substrates, gold wire and molding compound. Interconnect materials, such as leadframes and substrates, gold wire and molding compound represented approximately 57.5%, 21.2% and 9.6%, respectively, of our total cost of packing materials in 2002.
The silicon die, which is the functional unit of the semiconductor to be packaged, is supplied in the form of silicon wafers. Each silicon wafer contains a number of identical dies. We receive the wafers from the customers or the foundries on a consignment basis. Consequently, we generally do not incur inventory costs relating to the silicon wafers used in our packaging process.
We do not maintain large inventories of leadframes, substrates, gold wire or molding compound, but generally maintain sufficient stock of each principal raw material for approximately one month’s production based on blanket orders and rolling forecasts of near-term requirements received from customers. In addition, several of our principal suppliers dedicate portions of their inventories, typically in amounts equal to the average monthly amounts supplied to us, as reserves to meet our production requirements. However, shortages in the supply of materials experienced by the semiconductor industry have in the past resulted in occasional price adjustments and delivery delays. For example, in 1999 and the first half of 2000, the industry experienced a shortage in the supply of advanced substrates used in BGA packages, which, at the time, were only available from a limited number of suppliers located primarily in Japan. In these instances, we generally negotiate an extension of the delivery date from our customers. See “—Strategy—Continue to Focus on Advanced Technological, Processing and Materials Capabilities”.
Testing
Apart from packaged semiconductors, no other raw materials are needed for the functional and burn-in testing of semiconductors. For the majority of our testing equipment, we often base our purchases on prior discussions with our customers about their forecast requirements. The balance consists of testing equipment on consignment from customers, which are dedicated exclusively to the testing of these customers’ specific products.
Equipment
Packaging
The most important equipment used in the semiconductor packaging process is the wire bonder. The number of wire bonders at a given facility is commonly used as a measure of the packaging capacity of the facility. The wire bonders connect the input/output terminals on the silicon die using extremely fine gold wire to leads on leadframes or substrates. Typically, wire bonders may be used, with minor modifications, for the packaging of different

34
products. We purchase our wire bonders principally from Kulicke & Soffa Industries Inc. As of December 31, 2002, we operated an aggregate of 4,393 wire bonders, of which 3,109 were fine-pitch wire bonders and 21 were consigned by customers, respectively. In addition to wire bonders, we maintain a variety of other types of packaging equipment, such as wafer grind, wafer mount, wafer saw, die bonders, automated molding machines, laser markers, solder plate, pad printers, dejunkers, trimmers, formers, substrate saw and scanners.
Testing
Testing equipment is the most capital intensive component of the testing process. We generally seek to purchase testers from different suppliers with similar functionality and the ability to test a variety of different semiconductors. We purchase testing equipment from major international manufacturers, including Advantest Corporation, Agilent Technologies, Inc., Credence Systems Corporation, LTX Corporation, NP Test Inc. and Teradyne, Inc. Upon acquisition of new testing equipment, we install, configure, calibrate, perform burn-in diagnostic tests on and establish parameters for the testing equipment based on the anticipated requirements of existing and potential customers and considerations relating to market trends. As of December 31, 2002, we operated an aggregate of 1,066 testers, 162 of which were consigned by customers. In addition to testers, we maintain a variety of other types of testing equipment, such as automated handlers and probers (special handlers for wafer probing), scanners, re-formers and computer workstations for use in software development. Each tester may be attached to a handler or prober. Handlers attach to testers and transport individual packaged semiconductors to the tester interface. Probers similarly attach to the tester and align each individual die on a wafer with the interface to the tester.
Test programs, which are the software that drive the testing of specific semiconductors, are written for a specific testing platform. We often perform test program conversions that enable us to test semiconductors on multiple test platforms. This portability between testers enables us to allocate semiconductors tested across our available test capabilities and thereby improve capacity utilization rates. In cases where a customer requires the testing of a semiconductor product that is not yet fully developed, the customer may provide personal computer workstations to us to test specific functions. In cases where a customer has specified testing equipment that was not widely applicable to other products which we test, we have required the customer to furnish the equipment on a consignment basis.
Intellectual Property
As of December 31, 2002, we held 220 Taiwan patents and 88 U.S. patents related to various semiconductor packaging technologies. In addition, we registered “ASE” as a trademark and as a servicemark in Taiwan.
We have also entered into various non-exclusive technology license agreements with other companies involved in the semiconductor manufacturing process, including Tessera Inc., Fujitsu Limited, Flip Chip Technologies, Motorola, Inc. and LSI Logic Corporation. We paid royalties under these license agreements in the amount of NT$199.8 million, NT$151.2 million and NT$176.7 million (US$5.1 million) in 2000, 2001 and 2002, respectively. The technology we license from these companies includes solder bumping, redistribution, ultraCSP assembly and other technologies used in the production of package types, such as BCC, flip-chip BGA and film BGA. The license agreement with Tessera Inc. will not expire until the expiration of the Tessera Inc. patents licensed by the agreement. The license agreements with Motorola and Fujitsu Limited expired on December 31, 2002 and April 13, 2003, respectively, and we are in the process of negotiating the renewal of these license agreements with Motorola and Fujitsu, respectively. The license agreements with Flip Chip Technologies and LSI Logic Corporation will expire on March 1, 2009 and January 1, 2010, respectively.
Quality Control
We believe that our advanced process technology and reputation for high quality and reliable services have been important factors in attracting and retaining leading international semiconductor companies as customers for our packaging and testing services. We have maintained an average packaging yield rate of 99.8% or greater in each of the last three years. We maintain a quality control staff at each of our facilities. Our quality control staff typically includes engineers, technicians and other employees who monitor packaging and testing processes in order to ensure high quality. Our quality assurance systems impose strict process controls, statistical in-line monitors, supplier
35
control, data review and management, quality controls and corrective action systems. Our quality control employees operate quality control stations along production lines, monitor clean room environment and follow up on quality through outgoing product inspection and interaction with customer service staff. We have established quality control systems which are designed to ensure high quality service to customers, high product and testing reliability and high production yields at our facilities. In addition, our packaging and testing facilities have been qualified by all of our major customers after satisfying stringent quality standards prescribed by these customers.
Our packaging and testing operations are undertaken in clean rooms where air purity, temperature and humidity are controlled. To ensure stability and integrity of our operations, we maintain clean rooms at our facilities that meet U.S. Federal 209E class 1,000, 10,000 and 100,000 standards. All of our facilities have been certified as meeting the ISO 9002 quality standards by the International Standards Organization, or ISO. In addition, our packaging facilities in Kaohsiung and Chung Li have been certified as meeting the ISO 9001 quality standards and our facilities in Taiwan, Korea, Malaysia and the Philippines have been certified as meeting the ISO 14001 quality standards. The ISO certifications are required by many countries in connection with sales of industrial products in these countries. Our facilities in Taiwan, Korea, Malaysia and the Philippines have also been certified as meeting the Quality System 9000, also known as QS-9000, quality standards. The QS-9000 quality standards provide for continuous improvement with an emphasis on the prevention of defects and reduction of variation and waste in the supply chain. Like the ISO 9002 certification, the QS-9000 certification is required by some semiconductor manufacturers as a threshold indicating a company’s quality control standards. Furthermore, our testing and packaging facilities in Kaohsiung have received the SAC Level-1 certification for quality assurance from the Semiconductor Assembly Council. The Semiconductor Assembly Council is an organization of semiconductor manufacturers, subcontractors, end-users, materials and service providers established to certify subcontract quality systems and process control practices. In addition, we have received various vendor awards from our customers for the quality of our products and services.
Competition
We compete in the highly competitive independent semiconductor packaging and testing markets. We face competition from a number of sources, including other independent semiconductor packaging and testing companies, especially those that also offer turnkey packaging and testing services. More importantly, we compete for the business of integrated device manufacturers with in-house packaging and testing capabilities and fabless semiconductor design companies with their own in-house testing capabilities. Some of these integrated device manufacturers have commenced, or may commence, in-house packaging and testing operations in Asia. Furthermore, several independent packaging and testing companies have established their packaging operations in Taiwan.
Integrated device manufacturers that use our services continuously evaluate our performance against their own in-house packaging and testing capabilities. These integrated device manufacturers may have access to more advanced technologies, and greater financial and other resources than we do. We believe, however, that we can offer greater efficiency and lower costs while maintaining equivalent or higher quality products and services for several reasons. First, as we benefit from specialization and economies of scale by providing services to a large base of customers across a wide range of products, we are better able to reduce costs and shorten production cycles through high capacity utilization and process expertise. Second, as a result of our customer base and product offerings, our equipment generally has a longer useful life. Third, as a result of the continuing reduction of investments in in-house packaging and testing capacity and technology at integrated device manufacturers, we are better positioned to meet advanced packaging and testing requirements on a large scale.
Environmental Matters
Our packaging and interconnect materials operations generate environmental wastes, including gaseous chemical, liquid and solid industrial wastes. We have installed various types of anti-pollution equipment for the treatment of liquid and gaseous chemical waste, generated at all of our semiconductor packaging facilities. We believe that we have adopted adequate anti-pollution measures for the effective maintenance of environmental protection standards that are consistent with the industry practice in the countries in which our facilities are located. In addition, we believe we are in compliance in all material respects with present environmental laws and regulations applicable to our operations and facilities.

36
Insurance
We have insurance policies covering property damage and damage to our production facilities, buildings and machinery due to fire. In addition, we have insurance policies covering our liabilities in connection with certain accidents. Significant damage to any of our production facilities, whether as a result of fire or other causes, would have a material adverse effect on our results of operations. We are not insured against the loss of key personnel.
ORGANIZATIONAL STRUCTURE
The following chart illustrates our corporate structure and effective ownership interest in each of our principal operating subsidiaries and affiliates as of March 31, 2003.
ADVANCED SEMICONDUCTOR ENGINEERING, INC.(1)
ASE Test Limited(2)
ASE(Chung Li)
Inc.
ASE(Korea) Inc.
ASEElectronics(M) Sdn.
Bhd.
ISE Labs,Inc.
ASE Test,Inc.
ASE HoldingElectronics
(Philippines)Inc.
UniversalScientificIndustrial
Co., Ltd.(3)
ASEMaterialInc. (5)
72.4% 70%
27.6% 30% 100% 100% 100%
50.5%100%56.6% 23.5%
4.0%
Hung ChingDevelopment
&ConstructionCo. Ltd. (4)
26.4%
(1) The common shares of ASE Inc. are listed on the Taiwan Stock Exchange under the symbol “2311”. The ADSs of ASE Inc. are listed on the New York Stock Exchange under the symbol “ASX”.
(2) The ordinary shares of ASE Test are quoted for trading on the Nasdaq National Market under the symbol “ASTSF”. ASE Test’s Taiwan depositary shares which represent its ordinary shares, are listed for trading on the Taiwan Stock Exchange under the symbol “9101”.
(3) The common shares of Universal Scientific Industrial Co., Ltd. are listed on Taiwan Stock Exchange under the symbol “2350”.
(4) The common shares of Hung Ching Development & Construction Co. Ltd. are listed on the Taiwan Stock Exchange under the symbol “2527”.
(5) The remaining shares of ASE Material Inc. are owned by the management and employees of ASE Material Inc., the management and employees of ASE Inc. and its affiliates, as well as a strategic investor.
Our Consolidated Subsidiaries
ASE Test
ASE Test is the largest independent testing company in the world, providing a complete range of semiconductor testing services to leading international semiconductor companies. ASE Test also provides semiconductor packaging

37
•
•
•
•
•
services. ASE Test has testing operations in Taiwan, the United States, Hong Kong and Singapore, and also maintains testing and packaging operations in Malaysia.
ASE Test was incorporated in 1995 and its ordinary shares have been quoted for trading on the Nasdaq National Market since June 1996 under the symbol “ASTSF”. ASE Test’s Taiwan depositary shares representing its ordinary shares have been listed for trading on the Taiwan Stock Exchange under the symbol “9101” since January 1998. As of March 31, 2003, we held 50.5% of the outstanding shares of ASE Test.
ASE Test is a holding company incorporated in Singapore whose significant assets are its ownership interests in the following operating companies as of March 31, 2003:
100% of ASE Test, Inc., also called ASE Test Taiwan;
100% of ASE Test Malaysia;
100% of ISE Labs;
27.6% of ASE Chung Li (the remaining 72.4% of which is owned by ASE Inc.); and
30% of ASE Korea (the remaining 70% of which is owned by ASE Inc.).
In 2002, ASE Test recorded net revenues of US$302.0 million, an operating loss of US$76.0 million and a net loss of US$81.3 million. In 2001, ASE Test recorded net revenues of US$298.5 million, an operating loss of US$24.1 million and a net loss of US$45.8 million.
ASE Material
ASE Material, which is a ROC company, was established in 1997 for the design and production of interconnect materials, such as leadframes and substrates, used in the packaging of semiconductors. See “—Strategy—Continue to Focus on Advanced Technological, Processing and Materials Capabilities”. ASE Material currently supplies our packaging facilities in Kaohsiung, Taiwan with a substantial portion of our leadframe and substrate requirements. See “—Raw Materials and Suppliers—Packaging”. As of March 31, 2003, we held 60.6% of the outstanding shares of ASE Material, comprising 56.6% held by ASE Inc. and 4.0% held by ASE Test Taiwan. The remaining shares of ASE Material are owned by the management and employees of ASE Material, the management and employees of ASE Inc. and its affiliates, as well as a strategic investor. The supervisor and two of the five directors of ASE Material are representatives of ASE Inc. and one director is a representative of ASE Test Taiwan. The remaining two directors of ASE Material are Jason C.S. Chang, our Chairman and Chief Executive Officer, and Richard H.P. Chang, our Vice Chairman and President, serving in their individual capacities.
ASE Material’s facilities are located in the Nantze Export Processing Zone near our packaging and testing facilities in Kaohsiung, and in Chung Li, Taiwan. In 2002, ASE Material recorded net revenues of NT$3,136.4 million (US$90.4 million), an operating loss of NT$583.6 million (US$16.8 million) and a net loss of NT$854.3 million (US$24.6 million). In 2001, ASE Material recorded net revenues of NT$2,458.4 million, operating income of NT$273.5 million and net income of NT$181.6 million. Substantially all of ASE Material’s sales are to us and our affiliates. Accordingly, substantially all of its sales and net income are eliminated in the preparation of our consolidated financial statements.
Our Unconsolidated Affiliates
As of March 31, 2003, we held approximately 23.5% of the outstanding shares of Universal Scientific and 26.4% of the outstanding shares of Hung Ching.
Universal Scientific
Universal Scientific, which is a ROC company, manufactures electronics products in varying degrees of system integration principally on a contract basis for original equipment manufacturers, including:

38
•
•
•
electronic components such as thick film mixed-signal devices, thick film resistors, high frequency devices and automotive and power electronic devices;
board and sub-system assemblies such as customized surface mount technology board assemblies, mother boards for personal computers, wireless local area network cards and fax control boards; and
system assemblies such as portable computers, desktop personal computers, network computers and servers.
We are the largest shareholder in Universal Scientific and six out of the nine directors on its board of directors, including the chairman, are representatives of ASE Inc.
Universal Scientific’s principal manufacturing facilities are located in Nantou, Taiwan. In 2002, Universal Scientific recorded net revenues of NT$28,310.0 million (US$815.9 million), operating income of NT$638.5 million (US$18.4 million) and net income of NT$276.0 million (US$8.0 million). In 2001, Universal Scientific recorded net revenues of NT$28,866.6 million, operating income of NT$1,157.7 million and a net loss of NT$163.1 million. The shares of Universal Scientific are listed on the Taiwan Stock Exchange. As of March 31, 2003, Universal Scientific had a market capitalization of NT$6,644.0 million (US$191.4 million).
Hung Ching
Hung Ching, which is a ROC company, is engaged in the development and management of commercial, residential and industrial real estate properties in Taiwan. Hung Ching’s completed development projects include the ASE Design Center commercial project and the Earl Village residential project, both located in Hsichih, Taiwan. Hung Ching was founded in 1986 by Chang Yao Hung-ying. Chang Yao Hung-ying is the mother of both Jason C.S. Chang, our Chairman and Chief Executive Officer, and Richard H.P. Chang, our Vice Chairman and President, and was a director of ASE Inc. from 1984 to June 2003. Jason C.S. Chang, Richard H.P. Chang, Chang Yao Hung-ying and other members of the Chang family are controlling shareholders of Hung Ching.
In 2002, Hung Ching recorded net revenues of NT$235.1 million (US$6.8 million), an operating loss of NT$177.8 million (US$5.1 million) and a net loss of NT$512.7 million (US$14.8 million). In 2001, Hung Ching recorded net revenues of NT$1,784.1 million, an operating income of NT$12.2 million and a net loss of NT$811.3 million. The shares of Hung Ching are listed on the Taiwan Stock Exchange. As of March 31, 2003, Hung Ching had a market capitalization of NT$1,046.8 million (US$30.2 million).
PROPERTIES
We operate a number of packaging and testing facilities in Asia and the United States. Our facilities provide varying types or levels of services with respect to different end-product focus, customers, technologies and geographic locations. Our facilities range from our large-scale turnkey facilities in Taiwan and Malaysia to our specialized Korea facility dedicated to wireless communications and automotive end-products. With our diverse facilities we are able to tailor our packaging and testing solutions closely to our customers’ needs. The following table sets forth the location, commencement of operation, primary use and approximate floor space as of December 31, 2002.

Facility Location Commencement of
Operation Primary Use Approximate Floor Space
(in sq. ft.)
ASE Inc.’s facility in Kaohsiung, Taiwan
Kaohsiung, Taiwan March 1984 Our primary packaging facility. Offers complete semiconductor manufacturing solutions in conjunction with ASE Test Taiwan and foundries located in Taiwan. Focuses primarily on advanced BGA and quad flat packages for integrated device manufacturers, fabless design companies and system companies.
2,160,000
ASE Test, Inc. Kaohsiung, Taiwan Chung Li, Taiwan
December 1987 Our primary testing facility. Offers complete semiconductor solutions in conjunction with ASE Inc.’s facility in Kaohsiung and foundries located in Taiwan. Focuses primarily on advanced logic/mixed-signal testing for integrated device manufacturers, fabless design companies and system companies.
750,000
ASE Material Kaohsiung, Taiwan Chung Li, Taiwan
December 1997 Design and production of interconnect materials such as leadframes and substrates used in packaging of semiconductors.
690,000
ASE Test Malaysia Penang, Malaysia February 1991 An integrated packaging and testing facility which focuses primarily on the requirements of integrated device manufacturers and system companies.
650,000
ASE Chung Li(1) Chung Li, Taiwan April 1985 An integrated packaging and testing facility which specializes in semiconductors for communications applications, particularly those incorporating Motorola’s proprietary Map BGA technology.
900,000
ASE Korea(2) Paju, Korea March 1967 An integrated packaging and testing facility which specializes in semiconductors for radio frequency, sensor and automotive applications.
470,000
ISE Labs(3) Fremont, CaliforniaHong Kong Singapore
November 1983 Front-end engineering and final testing facilities located in northern California in close proximity to several of the world’s largest fabless design companies. Testing facilities located in close proximity to integrated device manufacturers and fabless companies in Hong Kong and Southeast Asia.
370,000
39

Facility Location Commencement of
Operation Primary Use Approximate Floor Space
(in sq. ft.)
ASE Holding Electronics (Philippines) Inc., also called ASE Philippines
Cavite, Philippines November 1995 Focuses primarily on the packaging of commodity semiconductor products for integrated device manufacturers in the Philippines.
130,000
(1) We acquired a 70.0% interest in ASE Chung Li and ASE Test acquired the remaining 30.0% interest in July 1999. As of March 31, 2003, we held a 72.4% interest in ASE Chung Li and ASE Test held a 27.6% interest in ASE Chung Li.
(2) We acquired a 70.0% interest in ASE Korea and ASE Test acquired the remaining 30.0% interest in July 1999. (3) We acquired a 70.0% interest in ISE Labs in May 1999, which was subsequently increased to 80.4% following ASE Test’s purchase of additional shares of
ISE Labs in 2000. In January 2002, we purchased the remaining outstanding shares of ISE Labs.
40

Item 5. Operating and Financial Review and Prospects.
OPERATING RESULTS AND TREND INFORMATION
The following discussion of our business, financial condition and results of operations should be read in conjunction with our consolidated financial statements, which are included elsewhere in this annual report. This discussion contains forward-looking statements that reflect our current views with respect to future events and financial performance. Our actual results may differ materially from those anticipated in these forward-looking statements as a result of any number of factors, such as those set forth under “Item 3. Key Information—Risk Factors” and elsewhere in this annual report. See “Forward-Looking Statements”.
Overview
We offer a broad range of semiconductor packaging and testing services. In addition to offering each service separately, we also offer turnkey services, which consist of the integrated packaging, testing and direct shipment of semiconductors to end users designated by our customers. Our net revenues decreased from NT$50,893.4 million in 2000 to NT$38,367.8 million in 2001, primarily as a result of a severe downturn in the semiconductor industry, but increased to NT$45,586.8 million (US$1,313.7 million) in 2002, reflecting a modest recovery in the semiconductor industry and increased outsourcing of the packaging of advanced package types such as ball grid array, or BGA. The decrease in our net revenues from 2000 to 2001 was across each of the principal end-use applications of the semiconductors that we packaged and tested—communications, personal computers and consumer electronics. In 2002, we experienced a gradual improvement in our net revenues compared to 2001 across each of the end-use applications of the semiconductors that we packaged and tested. This improvement was generally concentrated in the packaging of more advanced package types and the testing of more complex, high-performance semiconductors.
Pricing and Revenue Mix
We price our services on a cost-plus basis, taking into account the actual costs involved in providing these services, with reference to prevailing market prices. The majority of our prices and revenues are denominated in U.S. dollars. However, as more than half of our costs, including most of our labor and overhead costs, are denominated in NT dollars, we consider the NT dollar to be our functional currency. Furthermore, the majority of our financing costs are denominated in NT dollars.
The semiconductor industry is characterized by a general trend towards declining prices for products and services of a given technology over time. In addition, during periods of intense competition and adverse conditions in the semiconductor industry, the pace of this decline may be more rapid than that experienced in other years. The average selling prices of our packaging and testing services have experienced sharp declines during such periods as a result of intense price competition from other independent packaging and testing companies that attempt to maintain high capacity utilization levels in the face of reduced demand. During the industry downturn commencing in the fourth quarter of 2000, we experienced a significant deterioration in average selling prices which resulted in our company incurring a net loss in 2001 and a significant decrease in net income in 2002, as compared with the years prior to 2001.
In 2000, 2001 and 2002, packaging revenues accounted for 74.7%, 75.3% and 77.9% while testing revenues accounted for 25.1%, 24.7% and 22.1%, respectively, of our net revenues. Testing revenues as a percentage of our net revenues have decreased in 2001 and 2002 as the average selling prices of our testing services are more severely affected by the downturn in the semiconductor industry than the average selling prices of our packaging services. In periods of an industry downturn, the decline in the average selling prices of our testing services is often exacerbated by the decrease in demand from our integrated device manufacturer customers, who typically maintain larger in-house testing capacity than in-house packaging capacity. These price declines are also exacerbated by the intense price competition from other independent testing service providers, who typically offer large price discounts during periods of depressed demand, such as in 2001, in order to maintain higher capacity utilization rates to defray the high fixed costs associated with testing operations.
The growth rate for outsourced semiconductor testing services has slowed as a result of the industry downturn in 2000 and 2001. However, we believe that the market for outsourced semiconductor testing services has more
41

potential for growth than the market for outsourced semiconductor packaging services over the long term for two reasons. First, the portion of the semiconductor testing market that is currently accounted for by independent testing service providers is smaller than that for packaging. Second, the large capital expenditures needed for increasingly sophisticated testing equipment, as compared to less expensive packaging equipment, are also a driving factor for further outsourcing of testing services by integrated device manufacturers.
Declines in average selling prices have been partially offset over the last three years by a change in our revenue mix. In particular, revenues derived from packaging more advanced package types, such as BGA, higher density packages with finer lead-to-lead spacing, or pitch, and testing of more complex, high-performance semiconductors have increased as a percentage of total revenues. We intend to continue focusing on packaging more advanced package types, such as BGA and flip-chip BGA, developing and offering new technologies in packaging and testing services and expanding our capacity to achieve economies of scale, as well as improving production efficiencies for older technology, in order to mitigate the effects of declining average selling prices on our profitability.
High Fixed Costs
Our operations, in particular our testing operations, are characterized by relatively high fixed costs. We expect to continue to incur substantial depreciation and other expenses as a result of our previous acquisitions of packaging and testing equipment and facilities. Our profitability depends in part not only on absolute pricing levels for our services, but also on utilization rates for our packaging and testing equipment, commonly referred to as “capacity utilization rates”. In particular, increases or decreases in our capacity utilization rates could have a significant effect on gross margins since the unit cost of packaging and testing services generally decreases as fixed costs are allocated over a larger number of units.
The current generation of advanced testers typically costs between US$2.0 million and US$5.0 million each, while wire bonders used in packaging typically cost approximately US$100,000 each. In 2000, 2001 and 2002, our depreciation expense as a percentage of net revenues was 15.7%, 27.0% and 25.0%, respectively. The significant increase in depreciation expense as a percentage of net revenues in 2001 and 2002 compared to 2000 was primarily a result of the lower net revenues during 2001 and 2002 compared to 2000 and our capacity expansion in 2000. We begin depreciating our equipment when it is placed into service. There may sometimes be a time lag between when our equipment is placed into service and when it achieves high levels of utilization. In periods of depressed industry conditions such as 2001 and 2002, we may experience lower than expected demand from customers and a sharp decline in the average selling price of our testing services, resulting in an increase in depreciation expense relative to net revenues. In particular, the capacity utilization rates for our testing equipment are more severely affected during an industry downturn as a result of the decrease in outsourcing demand from integrated device manufacturers, which typically maintain larger in-house testing capacity than in-house packaging capacity.
Raw Material Costs
Substantially all of our raw material costs are accounted for by packaging and the production of interconnect materials, as testing requires minimal raw materials. In 2000, 2001 and 2002, raw material cost as a percentage of our net revenues was 28.7%, 30.7% and 30.2%, respectively. We expect interconnect materials to become an increasingly important component of the cost of our packaging revenues and we plan to continue to develop and enhance our in-house interconnect materials capabilities through ASE Material in order to maintain and enhance our profitability, ensure an adequate supply of interconnect materials at competitive prices and reduce production time.
Goodwill Amortization
Our operating income and non-operating income in recent years have been affected by goodwill amortization charges in connection with the restructuring of our investment holdings and other share repurchases. Under ROC GAAP, additional purchases of shares of consolidated subsidiaries (majority owned) or of companies accounted for using the equity method (less than majority but at least 20% owned) will generate goodwill in an amount equal to the difference between the purchase price and the book value per share of those shares. The goodwill generated is amortized over ten years. Goodwill amortization from the purchases of shares of consolidated subsidiaries are recognized under general and administrative expense. Goodwill amortization from the purchases of shares of companies accounted for using the equity method are recognized as a debit under investment income. Transactions
42

which created significant goodwill charges were (1) the purchase of additional ordinary shares of ASE Test in the open market in 2002, (2) the purchase of additional ordinary shares of ASE Test in 2001 from two of our directors at the prevailing market price, (3) the purchase of a total of 26,250,000 shares of ISE Labs in 1999, 2000 and 2002 and (4) the open market purchase of shares of Universal Scientific between 1999 and 2000. See “Item 7. Major Shareholders and Related Party Transactions—Related Party Transactions” and note 10 to our consolidated financial statements.
Critical Accounting Policies and Estimates
Preparation of our consolidated financial statements requires us to make estimates and judgments in applying our critical accounting policies which have a significant impact on the results we report in our consolidated financial statements. We continually evaluate these estimates, including those related to allowances for doubtful accounts, inventories, allowances for deferred income tax assets, useful lives of properties, realizability of long-term assets, goodwill and the valuation of marketable securities and long-term investments. We base our estimates on historical experience and other assumptions which we believe to be reasonable under the circumstances. Actual results may differ from these estimates under different assumptions and conditions. We have identified below the accounting policies that are the most critical to our consolidated financial statements.
Revenue recognition. Revenues from semiconductor packaging services that we provide are recognized upon shipment. Revenues from testing services that we provide are recognized upon completion of the services. We do not take ownership of: (1) bare semiconductor wafers received from customers that we package into finished semiconductors, and (2) packaged semiconductors received from customers that we test. The title and risk of loss remains with the customer for those bare semiconductors and/or packaged semiconductors. Accordingly, the cost of customer-supplied semiconductors materials is not included in our consolidated financial statements. Other criteria that we use to determine when to recognize revenue are: (1) persuasive evidence that the services provided exist, (2) the selling price is fixed or determinable and (3) collectibility is reasonably assured. These policies are consistent with provisions in the Staff Accounting Bulletin No. 101 issued by the United States Securities and Exchange Commission, or SEC. We do not provide warranties to our customers except in cases of defects in the packaging services provided and deficiencies in testing services provided. An appropriate sales allowance is recognized in the period during which the sale is recognized, and is estimated based on historical experience.
Allowance for Doubtful Accounts. We periodically record a provision for doubtful accounts based on our evaluation of the collectibility of our accounts receivable. The total amount of this provision is determined by us as follows. We first identify the receivables of customers that are of a higher credit risk based on their current overdue accounts with us, difficulties collecting from these customers in the past or their overall financial condition. For each of these customers, we estimate the extent to which the customer will be able to meet its financial obligations to us, and we record an allowance that reduces our accounts receivable for that customer to the amount that we reasonably believe will be collected. For all other customers, we maintain an allowance for doubtful accounts equal to a percentage of their aggregate accounts receivable. Based on our experience, we currently maintain an allowance for the account receivables of these other customers which average between 3% and 4%, on a consolidated basis, of our accounts receivable. Additional allowances may be required in the future if the financial condition of our customers or general economic conditions deteriorate, and this additional allowance would reduce our net income.
Inventories. Inventories are recorded at cost when acquired and stated at the lower of weighted average cost or market value. Market value for finished goods and work in process is the net realized value. Market value for raw materials, supplies and spare parts is the replacement cost. An allowance for loss on decline in market value and obsolescence is provided based on the difference between the cost of inventory and the estimated market value based upon assumptions about future demand and market conditions. An additional inventory provision may be required if actual market conditions are less favorable than those projected.
Allowances for Deferred Income Tax Assets. Tax benefits arising from deductible temporary differences, unused tax credits and net operating loss carryforwards are recognized as deferred tax assets. We record a valuation allowance to reduce our deferred income tax assets to an amount that we believe will more likely than not be realized. We have considered future taxable income and ongoing prudent and feasible tax planning strategies in assessing the need and amount for the valuation allowance. In the event we were to determine that we would be able to realize our deferred income tax assets in the future in excess of our net recorded amount, an adjustment to our
43

deferred income tax assets would increase income in the period such determination was made. Alternatively, should we determine that we would not be able to realize all or part of our net deferred income tax assets in the future, an adjustment to our deferred income tax assets would decrease income in the period such determination was made.
Useful Lives of Properties. Our operations are capital intensive and we have significant investments in expensive packaging and testing equipment. Properties represented 55.9%, 57.0% and 60.2% of our total assets as of December 31, 2000, 2001 and 2002, respectively. We depreciate our properties based on our estimate of their economic useful lives to us, which is in turn based on our judgment, historical experience and the potential obsolescence of our existing equipment brought about by the introduction of more sophisticated packaging and testing technologies and processes. If we subsequently determine that the actual useful life of properties is shorter than what we had estimated, we will depreciate the remaining undepreciated value of that asset over its remaining economic useful life. This would result in increased depreciation expense and decreased net income during those periods. Similarly, if the actual lives of properties are longer than what we had estimated, we would have a smaller depreciation expense and higher net income in subsequent periods. As a result, if our estimations of the useful lives of our properties are not accurate or are required to be changed in the future, our net income in future periods would be affected.
Realizability of Long-Term Assets. We are required to evaluate our equipment, goodwill and other long-lived assets for impairment whenever there is an indication of impairment. If certain criteria are met, we are required to record an impairment charge. We have adopted U.S. Statement of Financial Accounting Standards, or U.S. SFAS, No. 144, “Accounting for the Impairment for Disposal of Long-Lived Assets” to account for the impairment of our long-lived assets under both ROC GAAP and US GAAP. In accordance with U.S. SFAS No. 144, long-lived assets held and used by us are reviewed for impairment whenever events or changes in circumstances indicate that the carrying amount of an asset may not be recoverable. For purposes of evaluating the recoverability of long-lived assets, the recoverability test is performed by comparing undiscounted net cash flows of the assets against the net book value of the assets. If the recoverability test indicates that an impairment has occurred, the impairment loss is the amount of the asset’s net book value in excess of the related fair value. For example, in 2002, we took a NT$1,225.6 million (US$35.3 million) impairment charge against some of our testing equipment to reflect the decline in economic value of these equipment.
Goodwill. Under US GAAP, goodwill recognized prior to June 30, 2001 is recognized as an asset and amortized over its estimated useful life. Goodwill is reviewed for impairment whenever events or changes in circumstances indicate that the carrying amount may not be recoverable. The U.S. Financial Accounting Standards Board, or FASB, recently issued U.S. SFAS No. 142, “Goodwill and Other Intangible Assets”. U.S. SFAS No. 142 requires the use of a nonamortization approach to account for purchased goodwill and certain intangibles. Under U.S. SFAS No. 142, goodwill and intangibles are evaluated at least annually to determine if an impairment writedown is required. Under US GAAP, we realized an impairment charge at December 31, 2002 related to the goodwill from the acquisition of ASE Test. See “—US GAAP Reconciliation”. We continue to carry goodwill resulting from the acquisition of ASE Korea and the purchase of shares of ISE Labs and Universal Scientific, and will have to assess such goodwill for impairment on at least an annual basis in the future. If events and circumstances deteriorate in the future, the value of the goodwill could be further impaired under US GAAP.
Valuation of Marketable Securities and Long-term Investments. Under ROC GAAP, marketable equity securities are carried at the lower of aggregate cost or market value and are classified as trading or long-term investments depending on management’s intent to hold the security for long-term investment purposes. Trading securities are primarily mutual funds with readily determinable market values. We hold significant long-term investments in public and non-public entities. We periodically evaluate these long-term investments based on market prices, if available, the financial condition of the investee company, economic conditions in the industry, and our intent and ability to hold the investment for a long period of time. These assessments usually require a significant amount of judgment as a significant decline in the market price may not be the best indicator of impairment. Under US GAAP, we evaluate long-term investments using the above mentioned criteria and to the extent any decline in the value of a long-term investment is determined to be other than temporary, an impairment charge is recorded in the current period. The methods to measure the amount of impairment under ROC GAAP and US GAAP may be based on different estimates of fair value depending on the circumstances. Under US GAAP, market price is to be used, if available, to determine the fair value. Under ROC GAAP, however, if the market price is deemed to be a
44

result of an inactive market, other measures of fair value may be used. Several of the long-term investments held by us are accounted for under the equity method. Any significant decline in the operations of an equity-method investee could affect the value of the long-term investment and an impairment charge may occur.
In determining whether an other-than-temporary impairment occurred in our long-term investments as of December 31, 2002, no amount was recorded under ROC GAAP based on the difference between the carrying value and the net-asset value of the investee with adjustments made to significant assets of the investee using appraised values and other appropriate information. The amount recorded under US GAAP was based on the market price of the stock of the investee at December 31, 2002. The difference resulted in an additional impairment charge for 2002 under US GAAP. See “—US GAAP Reconciliation”.
Results of Operations
The following table sets forth, for the periods indicated, financial data from our consolidated statements of income, expressed as a percentage of net revenues.
Year Ended December 31,
2000 2001 2002
(percentage of net revenues)
ROC GAAP: Net revenues ....................................................................................................... 100.0% 100.0% 100.0%
Packaging........................................................................................................ 74.7 75.3 77.9 Testing............................................................................................................. 25.1 24.7 22.1 Other ............................................................................................................... 0.2 0.0 0.0
Cost of revenues ................................................................................................. (69.9) (85.9) (84.4) Gross profit ......................................................................................................... 30.1 14.1 15.6 Operating expenses............................................................................................. (10.7) (15.3) (17.1) Operating income (loss)...................................................................................... 19.4 (1.2) (1.5) Non-operating income (expenses) ...................................................................... (2.9) (6.6) (4.4) Income (loss) before income tax and minority interest....................................... 16.5 (7.8) (5.9) Income tax benefit (expense).............................................................................. (2.1) 0.5 2.5 Income (loss) before minority interest................................................................ 14.4 (7.3) (3.4) Extraordinary loss............................................................................................... — (0.4) (0.1) Minority interest in net (income) loss of subsidiary ........................................... (2.9) 2.1 3.8 Net income (loss)................................................................................................ 11.5% (5.6)% 0.3%
The following table sets forth, for the periods indicated, the gross margins for our packaging and testing services and our total gross margin.
Year Ended December 31,
2000 2001 2002
ROC GAAP: Gross margin
Packaging...................................................................................................... 26.3% 16.0% 17.6% Testing .......................................................................................................... 41.5% 8.3% 8.4% Total .............................................................................................................. 30.1% 14.1% 15.6%
45

The following table sets forth, for the periods indicated, a breakdown of our total cost of revenues and operating expenses, expressed as a percentage of net revenues.
Year Ended December 31,
2000 2001 2002
(percentage of net revenues)
ROC GAAP: Cost of revenues
Raw materials ............................................................................................... 28.7% 30.7% 30.2% Labor............................................................................................................. 12.9 14.6 14.8 Depreciation.................................................................................................. 15.7 27.0 25.0 Other ............................................................................................................. 12.6 13.6 14.4
Total cost of revenues....................................................................................... 69.9% 85.9% 84.4% Operating expenses
Selling ........................................................................................................... 2.0% 2.3% 2.0% General and administrative(1)....................................................................... 5.1 7.3 8.8 Goodwill amortization(2).............................................................................. 1.1 1.8 1.8 Research and development ........................................................................... 2.5 3.9 4.5 Total operating expenses............................................................................... 10.7% 15.3% 17.1%
(1) Excludes goodwill amortization for purposes of this table only. (2) Included in general and administrative expense in our consolidated financial statements.
Year Ended December 31, 2002 Compared to Year Ended December 31, 2001
Net Revenues. Net revenues increased 18.8% to NT$45,586.8 million (US$1,313.7 million) in 2002 from NT$38,367.8 million in 2001. Packaging revenues increased 22.9% to NT$35,515.4 million (US$1,023.5 million) in 2002 from NT$28,898.2 million in 2001. Testing revenues increased 6.4% to NT$10,060.6 million (US$289.9 million) in 2002 from NT$9,459.3 million in 2001. The increase in packaging and testing revenues was primarily due to an increase in packaging and testing volume, which was partly offset by a decrease in the average selling prices for packaging and testing services. The increase in volume resulted primarily from the modest recovery in the semiconductor industry and the increase in outsourcing of the packaging and testing of semiconductor devices. The decrease in the average selling prices reflected the general trend in the semiconductor industry of declining prices for each input/output lead on a semiconductor device. This decrease was partially offset by a change in the revenue mix as our BGA packages and fine-pitch packages, which typically command higher average selling prices, accounted for a greater portion of the packaging volume, and as we tested more complicated semiconductor devices, which generally command higher prices.
Gross Profit. Gross profit increased 31.1% to NT$7,094.6 million (US$204.5 million) in 2002 from NT$5,410.8 million in 2001. Our gross margin increased to 15.6% in 2002 compared to 14.1% in 2001, primarily as a result of decreased depreciation expense as a percentage of net revenues. Our gross margin for packaging increased to 17.6% in 2002 from 16.0% in 2001. This increase was primarily due to a decrease in depreciation expense as a percentage of packaging revenues as a result of improved capacity utilization rates, as well as a decrease in raw material costs as a result of an increase in our sourcing of packaging materials from ASE Material. Our gross margin for testing increased to 8.4% in 2002 from 8.3% in 2001. This slight increase was primarily due to higher capacity utilization rates, which was partially offset by a decrease in average selling prices. Depreciation expense in 2002 was NT$11,398.3 million (US$328.5 million), compared to NT$10,375.0 million in 2001. This increase was due to increased capital expenditures in 2002. As a percentage of net revenues, depreciation expense decreased to 25.0% in 2002 from 27.0% in 2001, reflecting higher capacity utilization rates in 2002.
46
Operating Income (Loss). We had an operating loss of NT$685.2 million (US$19.7 million) in 2002 compared to operating loss of NT$462.1 million in 2001. Operating margin decreased to negative 1.5% in 2002 compared to negative 1.2% in 2001. This decrease was primarily due to an asset impairment charge of NT$1,225.6 million (US$35.3 million) booked under general and administrative expenses. Operating expenses increased 32.5% to NT$7.779.8 million (US$224.2 million) in 2002 compared to NT$5,872.9 million in 2001. The increase in operating

expenses was primarily due to higher general and administrative, goodwill amortization, and research and development expenses. Selling expense increased 3.6% to NT$909.4 million (US$26.2 million) in 2002 from NT$877.9 million in 2001. Selling expense amounted to 2.0% of our net revenues in 2002 compared to 2.3% in 2001. General and administrative expenses, excluding goodwill amortization, increased 43.2% to NT$4,005.8 million (US$115.4 million) in 2002 from NT$2,797.6 million in 2001. This increase was primarily due to the asset impairment charge of NT$1,225.6 million (US$35.3 million) booked under general and administrative expenses. General and administrative expense, excluding goodwill amortization, amounted to 8.8% of our net revenues in 2002 compared to 7.3% in 2001. Goodwill amortization expense increased 17.7% to NT$815.6 million (US$23.5 million) in 2002 from NT$692.9 million in 2001. This increase was primarily due to additional goodwill amortization expense resulting from our purchase of shares of ASE Test and ISE Labs in 2001 and 2002. Goodwill amortization expense amounted to 1.8% of our net revenues in 2002 compared to 1.8% in 2001. Research and development expense increased 36.2% to NT$2,049.0 million (US$59.0 million) in 2002 from NT$1,504.5 million in 2001. This increase was largely a result of an increase in the number of research and development employees, an increase in factory supplies expense as well as an increase in depreciation charges associated with testers and other equipment dedicated to research and development uses. Research and development expense amounted to 4.5% of our net revenues in 2002 compared to 3.9% in 2001.
Net Non-Operating Income (Expense). We recorded a net non-operating loss of NT$2,024.5 million (US$58.3 million) in 2002 compared to a net non-operating loss of NT$2,523.4 million in 2001. This decrease was primarily a result of a decrease in net long-term investment loss and a decrease in net interest expense, which were partially offset by our incurring of a net foreign exchange loss. Net investment loss decreased 67.1% to NT$410.3 million (US$11.8 million) in 2002 from NT$1,246.8 million in 2001. The significantly larger net investment loss in 2001 was primarily due to a one-time write down of goodwill arising from our investment in Hung Ching as a result of the prolonged weakness of Hung Ching’s stock price, as well as the improvement in the financial performance of Hung Ching and Universal Scientific in 2002 compared to 2001. Net interest expense decreased 9.2% to NT$1,578.6 million (US$45.5 million) in 2002 from NT$1,739.3 million in 2001, primarily due to lower market interest rates in 2002 as well as the refinancing of certain of our long-term debt. We recorded a net foreign exchange loss of NT$397.9 million (US$11.5 million) in 2002 compared to net foreign exchange gain of NT$247.5 million in 2001. The net foreign exchange loss in 2002 was primarily due to the depreciation of the NT dollar, which had a negative impact on our U.S. dollar-denominated and Japanese yen-denominated liabilities.
Net Income (Loss). As a result of the foregoing, we had a loss before minority interest of NT$1,569.4 million (US$45.2 million) in 2002 compared to a loss before minority interest of NT$2,786.3 million in 2001. After excluding minority interest in the net losses of our subsidiaries of NT$1,733.0 million (US$49.9 million) and taking into account an extraordinary loss of NT$34.6 million (US$1.0 million) due to our repurchase of US$68 million in aggregate principal amount of our US$200 million zero coupon convertible bonds due 2002, we had net income of NT$129.0 million (US$3.7 million) in 2002. In 2001, we recorded a net loss, after excluding minority interest in the net loss of our subsidiaries of NT$788.7 million and taking into account an extraordinary loss of NT$144.6 million due to our repurchase of US$131 million in aggregate principal amount of our US$200 million zero coupon convertible bonds due 2002, of NT$2,142.2 million. The net income per ADS was NT$0.21 in 2002 compared with net loss per ADS of NT$3.29 in 2001. We had an income tax benefit of NT$1,140.3 million (US$32.9 million) in 2002 compared to an income tax benefit of NT$199.2 million in 2001, primarily as a result of the additional tax credits generated by ASE Inc. in 2002 from qualifying equipment purchases. See “—Taxation”.
Year Ended December 31, 2001 Compared to Year Ended December 31, 2000
Net Revenues. Net revenues decreased 24.6% to NT$38,367.8 million in 2001 from NT$50,893.4 million in 2000. Packaging revenues decreased 24.0% to NT$28,898.2 million in 2001 from NT$38,028.8 million in 2000. Testing revenues decreased 25.9% to NT$9,459.2 million in 2001 from NT$12,768.4 million in 2000. The decreases in packaging and testing revenues were primarily due to an industry downturn commencing in the fourth quarter of 2000, resulting in a decrease in the average selling prices and volumes for packaging and testing services. This decrease was partially offset by a change in the revenue mix as our BGA packages and fine-pitch packages, which typically command higher average selling prices, accounted for a greater portion of the packaging volume, and as we tested more complex high-performance semiconductors, which generally command higher prices.
47

Gross Profit. Gross profit decreased 64.7% to NT$5,410.8 million in 2001 from NT$15,326.1 million in 2000. Our gross margin decreased to 14.1% in 2001 from 30.1% in 2000, primarily as a result of increased depreciation expense and increased raw materials costs, all as a percentage of net revenues. Our gross margin for packaging decreased to 16.0% in 2001 from 26.3% in 2000. This decrease was primarily due to increases in depreciation expense and raw materials costs, all as a percentage of packaging revenues. Our gross margin for testing decreased to 8.3% in 2001 from 41.5% in 2000. This decrease was primarily due to increases in depreciation expense and plant and machine rental costs, all as a percentage of testing revenues. Raw material costs in 2001 were NT$11,776.2 million, or 30.7% of net revenues, compared to NT$14,620.4 million, or 28.7% of net revenues, in 2000. The increase in raw material costs was largely a result of products with higher raw material costs, such as BGA packages, accounting for a larger proportion of our packaging services. Depreciation for 2001 was NT$10,375.0 million, compared to NT$7,992.3 million in 2000. This increase was primarily due to the full year effect of our capacity expansion in 2000. As a percentage of net revenues, depreciation increased to 27.0% in 2001 from 15.7% in 2000, principally as a result of the significant decrease in our net revenues and higher depreciation in 2001.
Operating Income (Loss). We incurred an operating loss of NT$462.1 million in 2001 compared to an operating income of NT$9,877.1 million in 2000. Operating margin decreased to negative 1.2% in 2001 compared to 19.4% in 2000. Operating expenses increased 7.8% to NT$5,872.9 million in 2001 compared to NT$5,449.0 million in 2000. This was primarily due to higher general and administrative, goodwill amortization and research and development expenses, partially offset by lower selling expense. Selling expense decreased 14.0% to NT$877.9 million in 2001 from NT$1,020.5 million in 2000. This decrease reflected decreased sales in 2001. Selling expense represented 2.3% of our net revenues in 2001 compared to 2.0% in 2000. General and administrative expenses, excluding goodwill amortization, increased 7.3% to NT$2,797.6 million in 2001 from NT$2,606.2 million in 2000. This increase was primarily due to increases in cash bonuses and directors’ compensation of our subsidiaries paid in 2001 with respect to the preceding fiscal year. General and administrative expense, excluding goodwill amortization, represented 7.3% of our net revenues in 2001 compared to 5.1% in 2000. Goodwill amortization expense increased 23.8% to NT$692.9 million in 2001 from NT$559.8 million in 2000. This increase was primarily due to additional goodwill amortization expense resulting from our purchase of additional shares of ASE Test in 2001. Goodwill amortization expense represented 1.8% of our net revenues in 2001 compared to 1.1% in 2000. Research and development expense increased 19.2% to NT$1,504.5 million in 2001 from NT$1,262.5 million in 2000. This increase was largely a result of an increase in the number of research and development employees as well as an increase in depreciation charges associated with testers and other equipment dedicated to research and development uses. Research and development expense accounted for 3.9% of our net revenues in 2001 compared to 2.5% in 2000.
Net Non-Operating Income (Expense). We recorded a net non-operating loss of NT$2,523.4 million in 2001 compared to a net non-operating loss of NT$1,473.5 million in 2000. This was primarily a result of an increase in net interest expense, an increase in net investment loss on long-term investments and a decrease in net foreign exchange gain. Net interest expense increased 13.1% to NT$1,739.3 million in 2001 from NT$1,538.0 million in 2000. This increase was primarily a result of increased debt financing incurred in 2001, which was partially offset by higher interest income resulting from higher cash balances resulting from our offering of ADSs in September 2000. We recorded a net investment loss of NT$1,246.8 million in 2001 as compared to a net investment loss of NT$167.3 million in 2000. The loss was principally a result of a one-time write down of goodwill in the amount of NT$475.6 million arising from our investment in Hung Ching due to the prolonged weakness of Hung Ching’s stock price, as well as the goodwill amortization associated with our purchase of the shares of, and the net investment losses incurred by, Hung Ching and Universal Scientific. We recorded a net foreign exchange gain of NT$247.5 million in 2001 compared to net foreign exchange gain of NT$302.7 million in 2000. These foreign exchange gains were primarily due to the Japanese yen’s depreciation, which reduced the NT dollar value of our Japanese yen denominated liabilities.
Net Income (Loss). As a result of the foregoing, we had a loss before minority interest of NT$2,786.3 million in 2001 compared to income before minority interest of NT$7,337.8 million in 2000. After excluding minority interest in the net losses of our subsidiaries of NT$788.7 million and taking into account an extraordinary loss of NT$144.6 million due to our repurchase of US$131 million in aggregate principal amount of our US$200 million zero coupon bonds due 2002, we had a net loss of NT$2,142.2 million in 2001. In 2000, we recorded net income, after excluding minority interest in the net income of our subsidiaries of NT$1,500.6 million, of NT$5,837.2 million. The net loss per ADS was NT$3.29 for 2001 compared with net income per ADS of NT$9.01 for 2000. As a result
48

of our net loss in 2001, we had an income tax benefit of NT$199.2 million in 2001 compared to an income tax expense of NT$1,065.8 million in 2000.
Quarterly Net Revenues, Gross Profit and Gross Margin
The following table sets forth our unaudited consolidated net revenues, gross profit and gross margin for the quarterly periods indicated. You should read the following table in conjunction with our consolidated financial statements and related notes included in this annual report. Our net revenues, gross profit and gross margin for any quarter are not necessarily indicative of the results for any future period. Our quarterly net revenues, gross profit and gross margin may fluctuate significantly.
Quarter Ended
Jun. 30, 2001
Sept. 30, 2001
Dec. 31, 2001
Mar. 31, 2002
Jun. 30, 2002
Sept. 30, 2002
Dec. 31, 2002
March 31, 2003
NT$ NT$ NT$ NT$ NT$ NT$ NT$ NT$
(in millions, except percentages) Consolidated
Net Revenues:
Packaging........................... 6,273.5 6,406.8 8,075.5 7,814.6 8,437.5 9,205.8 10,057.5 9,021.5 Testing ............................... 2,204.3 1,970.3 2,179.1 2,227.4 2,390.4 2,654.8 2,788.0 2,534.7 Other .................................. 4.6 3.7 — 1.7 0.6 0.3 8.2 28.2 Total................................... 8,482.4 8,380.8 10,254.6 10,043.7 10,828.5 11,860.9 12,853.7 11,584.4 Consolidated Gross
Profit:
Packaging........................... 779.0 846.7 1,493.5 1,281.9 1,507.5 1,598.2 1,867.8 1,159.9 Testing ............................... 103.5 (138.9) (57.7) (34.2) 132.4 287.1 455.9 355.3 Other .................................. (0.1) 0.6 1.4 0.2 — (0.1) (2.1) (4.1)Total................................... 882.4 708.4 1,437.2 1,247.9 1,639.9 1,885.2 2,321.6 1,511.1 Consolidated
Gross Margin:
Packaging........................... 12.4% 13.2% 18.5% 16.4% 17.9% 17.4% 18.6% 12.9%Testing ............................... 4.7% (7.0)% (2.6)% (1.5)% 5.5% 10.8% 16.4% 14.0%Total................................... 10.4% 8.5% 14.0% 12.4% 15.1% 15.9% 18.1% 13.0%
Our results of operations have been adversely affected by the global semiconductor industry downturn which
commenced in the fourth quarter of 2000 and continued through the fourth quarter of 2001. Beginning the second quarter of 2002, we experienced an improvement in our net revenues as a result of a modest recovery in the semiconductor industry. However, in the first quarter of 2003, our net revenues were adversely affected by global political and economic conditions. To a lesser extent, our results of operations have also been affected by seasonality. Our first quarter net revenues have historically decreased over the preceding fourth quarter, primarily due to the combined effects of holidays in the United States, Taiwan and Malaysia. Moreover, the increase or decrease in net revenues of a particular quarter as compared with the immediately preceding quarter varies significantly. See “Item 3. Key Information—Risk Factors—Risks Relating to Our Business—Our operating results are subject to significant fluctuations, which could adversely affect the value of your investment”.
Our testing operations historically have higher gross margins than our packaging operations. However, during periods of lower-than-normal capacity utilization, such as the last three quarters of 2001 and the full year of 2002, our testing operations have experienced lower gross margins than our packaging operations.
Exchange Rate Fluctuations
Currently, the majority of our revenues from packaging and testing services are denominated in U.S. dollars and NT dollars. Our cost of revenues and operating expenses associated with packaging and testing services, on the other hand, are incurred in several currencies, primarily in NT dollars and U.S. dollars, as well as, to a lesser extent, Malaysian ringgit, Korean won, Japanese yen and Philippine pesos. In addition, a substantial portion of our capital expenditures, primarily for the purchase of packaging and testing equipment, has been, and is expected to continue
49

to be, denominated in U.S. dollars with much of the remainder in Japanese yen. Fluctuations in exchange rates, primarily among the U.S. dollar, the NT dollar and the Japanese yen, will affect our costs and operating margins. In addition, these fluctuations could result in exchange losses and increased costs in NT dollar and other local currency terms. Despite hedging and mitigating techniques implemented by us, fluctuations in exchange rates have affected, and may continue to affect, our financial condition and results of operations. We recorded a net foreign exchange gain of NT$302.7 million in 2000 and NT$247.5 million in 2001 and we incurred a net foreign exchange loss of NT$397.9 million (US$11.5 million) in 2002. For a quantitative and qualitative disclosure of our exposure to foreign currency exchange rate risk, see “Item 11. Quantitative and Qualitative Disclosures about Market Risk—Market Risk—Foreign Currency Exchange Rate Risk”.
Taxation
The regular corporate income tax rate in the ROC applicable to us is 25%. We have obtained preferential tax treatment under the tax laws of the ROC and Malaysia. Under the ROC Statute of Upgrading Industries, which gives certain preferential tax treatment to companies that qualify as operating in an “important technology industry”, we have a tax exemption on income derived from the packaging of BGA products which expires at the end of 2005. In addition, ASE Electronics (M) Sdn, Bhd., or ASE Test Malaysia, qualified as a “pioneer” company in Malaysia and enjoyed a tax exemption which expired on June 30, 1999. ASE Test Malaysia subsequently obtained the status as “high-tech pioneer” and was granted a five-year tax exemption which expires on June 30, 2004. These tax exemptions resulted in tax savings for us of approximately NT$700.7 million, NT$26.4 million and NT$52.1 million (US$1.5 million) in 2000, 2001 and 2002, respectively.
We also have tax credits under the ROC Statute of Upgrading Industries. Under the previous tax credit rules, we obtained a tax credit of 20% for the purchase of equipment manufactured in Taiwan and 10% for the purchase of equipment manufactured outside Taiwan. In April 2002, the ROC Executive Yuan amended the tax credit rules and adopted a 13% rate of tax credit to be applied to the purchase of equipment regardless of where it was manufactured.
Under ROC tax laws, we may apply for additional tax holidays upon receipt of cash infusion from our shareholders, including through rights offerings, if the proceeds of which are used to purchase eligible machinery and equipment. We may also apply for this tax holiday after the capitalization of retained earnings through the issuance of stock dividends. See note 18 to our consolidated financial statements.
In addition, since we have facilities located in special export zones such as the Nantze Export Processing Zone in Taiwan and the Bayan Lepas Free Industrial Zone in Malaysia, we enjoy exemptions from various import duties and commodity taxes on imported machinery, equipment, raw materials and components. Goods produced by companies located in these zones and exported or sold to others within the zones are exempt from otherwise applicable commodity or business taxes.
Our effective income tax rate was 12.7%, 0% and 0% in 2000, 2001 and 2002, respectively. The effective tax rate was significantly lower in 2001 and 2002 because we incurred a net loss before income tax, minority interests acquisition and extraordinary loss in those periods, which resulted in income tax benefits of NT$247.3 million and NT$1,151.9 million (US$33.2 million) in 2001 and 2002, respectively.
The net deferred tax assets in 2001 consisted primarily of tax credit that we utilized in 2002 and expect to utilize thereafter. These tax credits were generated primarily as a result of our purchase of packaging equipment for our facilities in Kaohsiung, Taiwan. In 2002, we generated sufficient taxable income to utilize these tax credits, and thus realized the current portion of the net deferred tax assets recorded at December 31, 2001. We generated additional tax credits in 2002 and believe that the future estimated taxable income will be sufficient to realize the current and long-term portion of our net deferred tax assets recorded as of December 31, 2002.
In 1997, the ROC Income Tax Law was amended whereby, effective from January 1, 1998, all retained earnings generated in a year which are not distributed to shareholders as dividends in the following year will be assessed a 10% retained earnings tax. As a result, if we do not distribute all of our annual retained earnings generated after January 1, 1998 as either cash or stock dividends in the following year, these earnings will be subject to the 10% retained earnings tax.
50

US GAAP Reconciliation
Our financial statements are prepared in accordance with ROC GAAP, which differ in significant respects from US GAAP. The following table sets forth a comparison of our net income and shareholders’ equity in accordance with ROC GAAP and US GAAP as of and for the periods indicated.
As of and for the Year Ended December 31,
2000 2001 2002 2002
NT$ NT$ NT$ US$ (in millions)
Net income (loss) in accordance with: ROC GAAP.................................................................. 5,837.2 (2,142.2) 129.0 3.7 US GAAP..................................................................... 3,930.0 (4,046.6) (3,074.3) (88.6)Shareholders’ equity in accordance with: ROC GAAP.................................................................. 43,669.2 41,946.3 39,430.7 1,136.3 US GAAP..................................................................... 40,729.1 37,960.3 35,716.8 1,029.3
Note 26 to our consolidated financial statements provides a description of the principal differences between
ROC GAAP and US GAAP as they relate to us, and a reconciliation to US GAAP of select items, including net income and shareholders’ equity. Differences between ROC GAAP and US GAAP, which primarily affect our net income as reported under ROC GAAP, relate to impairment of goodwill and long-term investments and compensation expense pertaining to bonuses to employees, directors and supervisors.
Effective January 1, 2002, we adopted U.S. SFAS No. 142, “Goodwill and Other Intangible Assets”, which requires that goodwill no longer be amortized, and instead, be tested for impairment on a periodic basis. In conjunction with the implementation of U.S. SFAS No. 142, we completed a goodwill impairment review as of January 1, 2002 using a fair value based approach in accordance with the provision of the standard and found no impairment. Based on acquisitions completed as of June 30, 2001, application of the goodwill non-amortization provisions resulted in a decrease in amortization of approximately NT$815.6 million (US$23.5 million) for 2002 which continues to be recorded for ROC GAAP purposes. We completed our annual goodwill impairment test at December 31, 2002 and determined impairment of NT$2,213.0 million (US$63.8 million) of the remaining goodwill associated with our purchase of shares of ASE Test.
ROC GAAP and US GAAP require an assessment of impairment of long-term investments whenever events or circumstances indicate a decline in value may be other-than-temporary. The criteria for determination are similar under ROC GAAP and US GAAP. However, the methods to measure the amount of impairment may be based on different estimates of fair values depending on the circumstances. When impairment is determined to have occurred, US GAAP requires the market price to be used, if available, to determine the fair value of the long-term investment and measure the amount of impairment at the reporting date. Under ROC GAAP, if the market price is deemed to be a result of an inactive market, another measure of fair value may be used. As such, when determining whether an other-than-temporary impairment occurred in our long-term investment in Hung Ching at December 31, 2002, the fair value, under ROC GAAP, was based on the difference between the carrying value and the net-asset value of Hung Ching with adjustments made to significant assets of Hung Ching using appraised values and other appropriate information. Using this method under ROC GAAP, we determined that no impairment occurred in our long-term investment in Hung Ching in 2002. Under US GAAP, we determined an other-than-temporary impairment occurred in our long-term investment in Hung Ching as of December 31, 2002 in the amount of NT$883.6 million (US$25.5 million).
51
In 2001, we purchased 2,480,000 shares of ASE Test from two of our directors following their exercise of employee stock options in ASE Test shares. We entered into the transaction in order to maintain our investment in ASE Test at a level above 50% of the outstanding shares of ASE Test. We purchased these shares directly from these two directors based on a 10-day average of the market price of the shares. Although we entered into the transaction in order to maintain our majority ownership of ASE Test and not for compensation purposes, under US GAAP, all shares issued upon the exercise of employee incentive stock options which are repurchased by the ASE Test or ASE Test’s affiliates within six months of exercise results in compensation expense, which in our case

equals the excess of the purchase price over the exercise price. The transaction resulted in a US$26.7 million increase in ASE Test’s compensation expense and a corresponding increase in ASE Test’s capital surplus, which in turn led to a NT$908.7 million increase in ASE Inc.’s compensation expense. See “Item 7. Major Shareholders and Related Party Transactions—Related Party Transactions”.
In 1999, three of our consolidated subsidiaries sold an aggregate of 32.5 million ASE Inc. common shares in open market sales. Under US GAAP, when a subsidiary holds its parent’s common shares as investments, the common shares are treated as treasury stock and are presented in the consolidated balance sheet as a deduction to shareholders’ equity. The capital gain or loss from the sale of treasury stock is added to or deducted from the balance of treasury stock. Under ROC GAAP, this treatment is not required and, as a result, the investment in ASE Inc. common shares by its subsidiaries is presented as long-term investment in the consolidated balance sheet and the capital gain or loss from the sale of treasury stock is recognized as income or loss. As a result of these transactions, we recognized under ROC GAAP capital gains on sale of investments of NT$1,388.5 million in 1999. Under US GAAP, these investments in ASE Inc.’s common shares should be classified as treasury stock and the capital gain is not recognized as income but is deducted from treasury stock under capital surplus. Effective January 1, 2002, we adopted the ROC Statement of Financial Accounting Standards No. 30, “Accounting for Treasury Stock”, which is similar to the accounting and financial statement presentation under US GAAP except the minority ownership portion is deducted from the gross amount of treasury stock for ROC GAAP reporting purposes.
We paid employee bonuses in 2000 and 2001 in the form of common shares with respect to the results of the preceding fiscal years. We did not pay any employee bonuses in 2002 because we incurred a net loss in 2001. We typically pay all or a portion of employee bonuses in the form of common shares. The number of common shares distributed as part of employee bonuses is obtained by dividing the total nominal NT dollar amount of the bonus to be paid in the form of common shares by the par value of the common shares, or NT$10 per share, rather than their market value, which has generally been substantially higher than par value. Under ROC GAAP, the distribution of employee bonus shares is treated as an allocation from retained earnings, and we are not required to, and do not, charge the value of the employee bonus shares to employee compensation expense. Under US GAAP, however, we are required to charge the market value of the employee bonus shares to employee compensation expense in the period to which they relate, and correspondingly reduce our net income and income per common share. See “Item 6. Directors, Senior Management and Employees—Compensation—ASE Inc. Employee Bonus Plan and Stock Option Plans”.
The amount and the form of the payment of this compensation are subject to approval at our annual general shareholders’ meeting. Under US GAAP, the compensation expense is initially accrued at the nominal NT dollar amount of the aggregate bonus in the period to which it relates. For US GAAP purposes, the difference between the amount initially accrued and the market value of the common shares issued as payment of all or any part of the bonus is recorded as employee compensation expense in the period in which shareholders’ approval is obtained, which normally occurs during the second quarter of each year. The amount of the adjustment for market price for the purpose of US GAAP reconciliation for the special stock bonus paid in 2000 was allocated over a period of three years commencing in the second quarter of the year following the year in which the bonus was paid, reflecting the additional length of service required from employees who received the special stock bonus.
Recent US GAAP Accounting Pronouncements
In June 2001, the FASB issued U.S. SFAS No. 143, “Accounting for Asset Retirement Obligations”. This statement requires, among other provisions, retirement obligations to be recognized when they are incurred and displayed as liabilities, with a corresponding amount capitalized as part of the related long-lived asset. The capitalized element is required to be expensed using a systematic and rational method over its useful life. We adopted U.S. SFAS No. 143 on January 1, 2003 and we do not expect U.S. SFAS No. 143 will have a material impact on our US GAAP financial results.
In April 2002, the FASB issued U.S. SFAS No. 145, “Rescission of FASB Statements No. 4, 44, and 64, Amendment of FASB Statement No. 13, and Technical Corrections”. Among other things, this statement rescinds FASB Statement No. 4, “Reporting Gains and Losses from Extinguishment of Debt”, which required all gains and losses from the early extinguishment of debt to be aggregated and, if material, classified as extraordinary. This statement now requires those gains and losses to be classified as unusual and infrequently occurring events and
52

transactions. The statement was effective upon issuance in April 2002 for prospective transactions. The adoption of this statement would require the Company to reclassify the extraordinary loss recognized for ROC GAAP to unusual and unfrequent events for US GAAP. We believe there is no impact to other financial information under US GAAP.
In June 2002, the FASB issued U.S. SFAS No. 146, “Accounting for Costs Associated with Exit or Disposal Activities”. U.S. SFAS No. 146 requires that a liability for a cost associated with an exit or disposal activity should be measured at fair value and recorded when it meets the definition of a liability in FASB Concepts Statement No. 6, “Elements of Financial Statements”. U.S. SFAS No. 146 superceded EITF No. 94-3, “Liability Recognition for Certain Employee Termination Benefits and Other Costs to Exit and Activity (Including Certain Costs Incurred in Restructuring)”, which required recognition of a liability for costs associated with an exit or disposal activity when the company committed to an exit/disposal plan. U.S. SFAS No. 146 is effective for exit or disposal activities initiated after December 31, 2002. Restatement of prior periods is not required. U.S. SFAS No. 146 applies to future restructuring activities and the application of U.S. SFAS No. 146 has no impact on our US GAAP financial results.
In December 2002, the FASB issued U.S. SFAS No. 148, “Accounting for Stock-Based Compensation—Transition and Disclosure”, and amended U.S. SFAS No. 123, “Accounting for Stock Based Compensation”. This statement provides alternative methods of transition for an entity that voluntarily changes to the fair value based method of accounting for stock-based employee compensation. It also amends the disclosure provisions of that statement to require prominent disclosure about the effects on reported net income of an entity’s accounting policy decisions with respect to stock-based employee compensation. This statement is effective January 1, 2003. We have elected not to account for stock-based employee compensation using the fair value based method of accounting set forth in U.S. SFAS No. 123 and U.S. SFAS No. 128, but to continue to provide the disclosure requirements under U.S. SFAS No. 123. Accordingly, this statement will not affect our consolidated financial statements until we decide to adopt the fair value based method of accounting set forth in U.S. SFAS No. 123 and U.S. SFAS No. 128.
In November 2002, the FASB issued FASB Interpretation, or FIN, No. 45, “Guarantor’s Accounting and Disclosure Requirements for Guarantees, Including Indirect Guarantees of Indebtedness of Others”. The interpretation elaborates on the existing disclosure requirements for most guarantees, including loan guarantees such as standby letters of credit. It also clarifies that at the time a company issues a guarantee, the company must recognize an initial liability for the fair value, or market value, of the obligations it assumes under the guarantee and must disclose that information on its interim and annual financial statements. The provisions related to recognizing a liability at inception of the guarantee for the fair value of the guarantor’s obligations does not apply to product warranties or to guarantees accounted for as derivatives. The initial recognition and initial measurement provisions apply on a prospective basis to guarantees issued or modified after December 31, 2002. We are in the process of assessing the impact and currently believe the adoption of recognition and initial measurement requirements of FIN No. 45 will not have a material effect on our financial condition and results of operations.
In January 2003, the FASB issued FIN No. 46, “Consolidation of Variable Interest Entities—An Interpretation of Accounting Research Bulletin No. 51”. FIN No. 46 requires a primary beneficiary to consolidate a variable interest entity, or VIE, if it has a VIE that will absorb a majority of the entity’s expected losses if they occur, receive a majority of the entity’s expected residual returns if they occur, or both. FIN No. 46 applies immediately to VIEs created after January 31, 2003, and to VIEs in which the entity obtains an interest after that date. For VIEs acquired before February 1, 2003, the effective date for compliance is July 1, 2003. We are currently in the process of determining the impact of this statement on our results of operations, financial position and cash flows.
In November 2002, the FASB Emerging Issues Task Force, or EITF, reached a consensus on EITF 00-21, “Revenue Arrangements with Multiple Deliverables”, related to the timing of revenue recognition for arrangements in which goods or services or both are delivered separately in a bundled sales arrangement. The EITF requires that when the deliverables included in this type of arrangement meet certain criteria, they should be individually accounted for as separate units of accounting. This may result in a difference in the timing of revenue recognition but will not result in a change in the total amount of revenue recognized in a bundled sales arrangement. The allocation of revenue to the separate deliverables is based on the relative fair value of each item. If the fair value is not available for the delivered items, a residual method must then be used. This method requires the full fair value amount to be allocated to the undelivered items. This would result in a discount, if any, being allocated to the delivered items. This consensus is effective for bundled sales arrangements entered into in fiscal periods beginning
53

after June 15, 2003. We do not believe that the consensus will have a significant impact on our results of operations, financial position and cash flows.
In April 2003, the FASB issued SFAS No. 149, “Amendment to Statement 133 on Derivative Instruments and Hedging Activities”. SFAS No. 149 amends and clarifies accounting for derivative instruments, including certain derivative instruments embedded in other contracts, and for hedging activities under SFAS No. 133. SFAS No. 149 is applied prospectively and is effective for contracts entered into or modified after June 30, 2003. We have not determined the effect, if any, that SFAS No. 149 will have on our Consolidated Financial Statements.
In May 2003, the FASB issued SFAS No. 150, “Accounting for Certain Financial Instruments with Characteristics of Both Liabilities and Equity”. The Statement establishes standards for how an issuer classifies and measures certain financial instruments. This Statement is effective for financial instruments entered into or modified after May 31, 2003, and otherwise is effective at the beginning of the first interim period beginning after June 15, 2003. The Statement requires that certain financial instruments that, under previous guidance, could be accounted for as equity be classified as liabilities, or assets in some circumstances. This Statement does not apply to features embedded in a financial instrument that is not a derivative in its entirety. The Statement also requires disclosures about alternative ways of settling the instruments and the capital structure of entities whose shares are mandatorily redeemable. We do not expect the adoption of SFAS No. 150 to have an impact on our financial statements.
LIQUIDITY AND CAPITAL RESOURCES
We have historically been able to satisfy our working capital needs from cash flow from operations. We have historically funded our capacity expansion from internally generated cash and, to the extent necessary, the issuance of equity securities and long-term borrowings. If adequate funds are not available on satisfactory terms, we may be forced to curtail our expansion plans. Moreover, our ability to meet our working capital needs from cash flow from operations will be affected by the demand for our packaging and testing services, which in turn may be affected by several factors. Many of these factors are outside of our control, such as economic downturns and declines in the prices of our services caused by a downturn in the semiconductor industry. See “Item 3. Key Information—Risk Factors—Risks Relating to Our Business—Our operating results are subject to significant fluctuations, which would adversely affect the market value of your investment”. The average selling prices of our packaging and testing services are likely to be subject to further downward pressure in the future. To the extent we do not generate sufficient cash flow from our operations to meet our cash requirements, we will have to rely on external financing. Other than as described in “—Off-Balance Sheet Arrangements”, we have not historically relied, and we do not plan to rely in the foreseeable future, on off-balance sheet financing arrangements to finance our working capital or capacity expansion.
Net cash provided by operating activities amounted to NT$11,313.8 million (US$326.0 million) for 2002, partly as a result of adjusting for non-cash depreciation and amortization, including amortization of consolidated debits, of NT$13,101.9 million (US$377.6 million). Our net cash provided by operating activities amounted to NT$11,578.4 million for 2001, partly as a result of adjusting for non-cash depreciation and amortization, including amortization of consolidated debits, of NT$11,820.2 million. Our net cash provided by operating activities amounted to NT$17,459.9 million for 2000, partly as a result of adjusting for non-cash depreciation and amortization, including amortization of consolidated debits, of NT$9,153.6 million. The decline in net cash generated by operating activities in 2002 and 2001 compared to 2000 was primarily due to the significant decreases in our net income in 2002 and 2001 compared to a net profit of NT$5,837.2 million in 2000. Depreciation and amortization increased in 2002 compared to 2001, primarily due to an increase in capital expenditures in 2002. Depreciation and amortization increased in 2001 compared to 2000, primarily as a result of the full-year effect of our capacity expansion in 2000.
Net cash used in investing activities decreased to NT$13,167.2 million (US$379.5 million) for 2002 from NT$15,051.2 million in 2001. This decrease reflected a decrease in short-term investments, which was partially offset by the purchase of the shares of ISE Labs and an increase in acquisition of fixed assets. Net cash used in investing activities decreased to NT$15,051.2 million in 2001 from NT$33,392.0 million in 2000. This decrease was primarily due to a significant decrease in the acquisition of machinery and equipment for our packaging, testing and interconnect materials operations to NT$8,024.9 million in 2001 from NT$27,154.2 million in 2000.
54

Net cash provided by financing activities for 2002 amounted to NT$530.5 million (US$15.3 million). This amount reflected proceeds from short-term and long-term debt of NT$1,797.5 million (US$51.8 million), which was partially offset by the payment of NT$1,674.1 million (US$48.2 million) for the repurchase of the remaining outstanding portion of our US$200 million zero coupon convertible bonds due 2002. Net cash provided by financing activities in 2001 amounted to NT$603.5 million. This amount primarily reflected proceeds from long-term debt of NT$9,746.6 million, which was partially offset by the payment of NT$1,568.1 million to a sinking fund in connection with our US$200 million zero coupon convertible bonds due 2002 and by the payment of NT$6,066.0 million for the repurchase of a portion of our US$200 million zero coupon convertible bonds due 2002. Net cash provided by financing activities in 2000 amounted to NT$17,607.3 million, primarily reflecting proceeds of NT$4,151.3 million from our offering of ADSs in September 2000 and the increase of NT$9,854.5 million in minority interest resulting from the equity offering by ASE Test in 2000.
As of December 31, 2002, our primary source of liquidity was NT$10,381.9 million (US$299.2 million) of cash and cash equivalents and NT$2,038.0 million (US$58.7 million) of short-term investments. Our short-term investments primarily consisted of investments in fixed income mutual funds. As of December 31, 2002, we had total availability under existing short-term lines of credit of NT$12,764.6 million (US$367.9 million), of which we had borrowed NT$6,288.6 million (US$181.2 million). The interest rate for borrowings under these facilities ranged from 0.88% to 7.00% per year as of December 31, 2002, as compared to 0.85% to 7.30% per year as of December 31, 2001. All of our short-term loans are revolving facilities with a term of one year, each of which may be extended on an annual basis with lender consent. We believe that our existing credit lines under our short-term loan facilities, together with cash generated from our operations, are sufficient to finance our working capital needs for the next 12 months. As of December 31, 2002, we had working capital of NT$2,641.8 million (US$76.1 million).
Our long-term liabilities consist primarily of bank loans. As of December 31, 2002, we had outstanding long-term bank loans, less current portion, of NT$23,009.6 million (US$663.1 million). These long-term bank loans carried variable interest rates which ranged between 0.88% and 7.92% per year as of December 31, 2002, as compared to 0.86% to 7.92% per year as of December 31, 2001. We have pledged a portion of our assets, with a carrying value of NT$15,823.8 million (US$456.0 million) as of December 31, 2002, to secure our obligations under our short-term and long-term facilities.
In June 2003, we completed an offering of ADSs by our wholly-owned subsidiaries, ASE Investment Inc. and ASE Capital Inc. The net proceeds from the offering were approximately US$82.7 million. We plan to use the net proceeds to repay NT$1.12 billion in aggregate principal amount of borrowings of ASE Investment, NT$140 million in aggregate principal amount of borrowings of ASE Capital as well as NT$6 billion in aggregate principal amount of borrowings of us. In addition, pursuant to a merger agreement dated July 17, 2002, ASE Investment and ASE Capital plan to merge into ASE Inc. in July 2003. Upon the effectiveness of such merger, ASE Inc. will assume all of the assets and liabilities of both ASE Investment and ASE Capital.
In December 2002, we entered into a NT$7.0 billion three-year syndicated credit facility, for which Citibank N.A., Taipei Branch acted as the lead arranger. We used NT$5.2 billion (US$149.9 million) of the amount available under the facility to refinance a NT$5.2 billion syndicated credit facility, for which Citibank, N.A., Taipei Branch acted as the lead arranger, entered into on June 22, 2001. The remaining NT$1.8 billion (US$51.9 million) was used to repay a portion of our existing revolving credit lines.
In June 2003, ASE Test Finance Limited, a wholly-owned finance subsidiary of ASE Test, entered into a five-year syndicated credit facility for which Citibank N.A., Taipei Branch acted as the lead arranger. The total commitments under the facility amounted to US$150 million. ASE Test plans to use the loan to refinance a portion of its US$160 million 1% guaranteed convertible notes due 2004. ASE Inc., ASE Test and ASE Test’s wholly-owned subsidiary, ASE Test, Inc., provided guarantee for ASE Test Finance Limited’s payment obligations under the facility.
In November 1997, we issued US$200 million in aggregate principal amount of zero coupon convertible bonds due 2002. These bonds had an implied interest rate of 6.37%, and were convertible into our common shares. These bonds, which matured in November 2002, were convertible at the option of the holders from December 1997 through October 2002. As of November 2002, we had repurchased in the open market all of the outstanding bonds.
55

Our long-term loans and facilities contain various financial and other covenants that could trigger a requirement for early payment. Among other things, these covenants require the maintenance of certain financial ratios, such as liquidity ratio, indebtedness ratio, interest coverage ratio and other technical requirements. In general, covenants in the agreements governing our existing debt, and debt we may incur in the future, may materially restrict our operations, including our ability to incur debt, pay dividends, make certain investments and payments and encumber or dispose of assets. A default under one debt instrument may also trigger cross-defaults under our other debt instruments. An event of default under any debt instrument, if not cured or waived, could have a material adverse effect on our liquidity, as well as our financial condition and operations.
The reduced levels of operating cash flow as a result of the downturn in the semiconductor industry resulted in our failure on June 30, 2001 to comply with the interest coverage ratio under our NT$5.2 billion three-year syndicated credit facility. We successfully obtained a waiver for the breach and an amendment to the interest coverage ratio from Citibank, N.A., as manager on behalf of the syndicate, in November 2001. We cannot assure you that we will be able to remain in compliance with our financial covenants under our loan agreements. In the event of default, we may not be able to cure the default or obtain a waiver, and our operations could be significantly disrupted and harmed. See “Item 3. Key Information—Risk Factors—Risks Relating to Our Business—Restrictive covenants and broad default provisions in the agreements governing our existing debt may materially restrict our operations as well as adversely affect our liquidity, financial condition and results of operations”.
The following table sets forth the maturity of our contractual obligations as of December 31, 2002.
Payments Due by Period
Contractual Obligations Total Under 1
Year 1 to 3 Years 4 to 5 Years After 5 Years
NT$ NT$ NT$ NT$ NT$ (in millions)
Long-term debt ............................................ 33,924.4 6,008.7 26,821.4 1,067.6 26.7 Capital lease obligations .............................. 467.4 193.7 273.7 — — Operating leases........................................... 1,707.9 317.4 554.7 461.9 373.9 Payable for investment................................. 3,327.1 962.8 2,364.3 — —
Total .......................................................... 39,426.8 7,482.6 30,014.1 1,529.5 400.6
The payable for investment category set forth above relates to our earn-out arrangement with Motorola in connection with our acquisition of ASE Chung Li and ASE Korea in 1999. Under the arrangement, a portion of the purchase price would be paid in installments ending in July 2004 contingent upon certain targets of revenues from packaging and testing services provided to Motorola being met. See note 25 to our consolidated financial statements included in this annual report. In addition to the contractual obligations set forth above, as of December 31, 2002, we had made commitments to purchase approximately NT$3,462.6 million (US$99.8 million) of machinery and equipment, which may be canceled subject to the payment of certain penalties. We also have continuing obligations to make cash royalty payments under our technology license agreements for the procurement of the manufacturing technology for certain products. Under these agreements, we are obligated to pay royalties equal to a specified percentage of quantities. The royalties we paid amounted to NT$199.8 million, NT$151.2 million and NT$176.7 million (US$5.1 million) in 2000, 2001 and 2002, respectively.
Our contingent obligations consist of guarantees provided by us to our subsidiaries. As of December 31, 2002, we endorsed and guaranteed the promissory notes of our subsidiaries in the amount of NT$6,341.4 million (US$182.7 million). Other than such guarantees, we have no other contingent obligations. See note 21 to our consolidated financial statements.
We have made, and expect to continue to make, substantial capital expenditures in connection with the expansion of our production capacity. The table below sets forth our principal capital expenditures incurred for the periods indicated.
56

Year Ended December 31,
2000 2001 2002 2002
NT$ NT$ NT$ US$ (in millions)
Machinery and equipment ................................................ 27,154.2 8,024.9 13,786.8 397.3Building and improvements ............................................. 4,309.3 3,540.8 1,963.0 56.6
We have budgeted capital expenditures of approximately NT$13,880.0 million (US$400.0 million) to
NT$17,350.0 million (US$500.0 million) for 2003, primarily to purchase machinery and equipment in connection with the expansion of our packaging, testing, and interconnect materials operations. We may adjust the amount of our capital expenditures upward or downward based on cash flow from operations, the progress of our expansion plans and market conditions. Due to the rapid changes in technology in the semiconductor industry, we frequently need to invest in new machinery and equipment, which may require us to raise additional capital. We cannot assure you that we will be able to raise additional capital should it become necessary on terms acceptable to us or at all. See “Item 3. Key Information—Risk Factors—Risks Relating to Our Business—Because of the highly cyclical nature of our industry, our capital requirements are difficult to plan. If we cannot obtain additional capital when we need it, our growth prospects and future profitability may be adversely affected”.
We believe that our existing cash and cash equivalents, short-term investments, expected cash flow from operations and existing credit lines under our short-term loan facilities will be sufficient to meet our capital expenditures, working capital, cash obligations under our existing debt and lease arrangements, and other requirements for at least the next twelve months. We have contractual obligations of NT$37,496.7 million (US$1,080.6 million) due in the next three years. We intend to meet our payment obligations through the expected cash flow from operations, long-term borrowings and the issuance of additional equity or equity-linked securities. We will continue to evaluate our capital structure and may decide from time to time to increase or decrease our financial leverage through equity offerings or borrowings. The issuance of additional equity or equity-linked securities may result in additional dilution to our shareholders.
From time to time, we evaluate possible investments, acquisitions or divestments and may, if a suitable opportunity arises, make an investment, acquisition or divestment. We currently have no commitments to make any material investment, acquisition or divestment. In July 2000, our shareholders approved a resolution which authorizes our board of directors to make investments in the People’s Republic of China. However, the ROC government currently restricts certain types of investments by ROC companies in the People’s Republic of China. We intend to consider establishing semiconductor packaging, testing and interconnect materials operations in the People’s Republic of China if ROC investment law and policy is amended to permit such investments, and if suitable opportunities are available at that time.
Off-Balance Sheet Arrangements
We have, from time to time, entered into interest rate swap transactions to hedge our interest rate exposure. As of December 31, 2002, there were no outstanding interest rate swap transactions. In addition, we have entered into foreign currency option contracts to hedge our existing assets and liabilities denominated in foreign currencies and identifiable foreign currency purchase commitments. As of December 31, 2002, we had US$20.0 million outstanding in foreign currency option contracts and US$10.0 million outstanding in forward exchange contracts. See “Item 11. Quantitative and Qualitative Disclosure About Market Risk”.
Inflation
We do not believe that inflation in Taiwan has had a material impact on our results of operations.
RESEARCH AND DEVELOPMENT
For 2000, 2001 and 2002, our research and development expenditures totaled approximately NT$1,262.5 million, NT$1,504.5 million and NT$2,049.0 million (US$59.0 million), respectively. These expenditures represented approximately 2.5%, 3.9% and 4.5% of net revenues in 2000, 2001 and 2002, respectively. We have
57

historically expensed all research and development costs as incurred and none is currently capitalized. As of December 31, 2002, we employed 1,561 employees in research and development.
Packaging
We centralize our research and development efforts in packaging technology in our Kaohsiung, Taiwan facilities. After initial phases of development, we conduct pilot runs in one of our facilities before the new technologies or processes are implemented commercially at other sites. Facilities with special product expertise, such as ASE Korea, also conduct research and development of these specialized products and technologies at their sites. One of the areas of emphasis for our research and development efforts is improving the efficiency and technology of our packaging processes. We expect these efforts to continue. We are now also putting significant research and development efforts into the development and adoption of new technology. We work closely with the manufacturers of our packaging equipment, including Kulicke & Soffa Industries Inc., in designing and modifying the equipment used in our production process. We also work closely with our customers to develop new product and process technology.
A significant portion of our research and development efforts is also focused on the development of advanced substrate production technology for BGA packaging through ASE Material. Substrate is the principal raw material for BGA packages. Development and production of advanced substrates involve complex technology and, as a result, high quality substrates are currently available only from a limited number of suppliers, located primarily in Japan. We believe that the successful development of substrate production capability by ASE Material will, among other things, enable us to capture an increasingly important value-added component of the packaging process, help ensure a stable and cost-effective supply of substrates for our BGA packaging operations and shorten production time. In 2002, ASE Material supplied approximately one-third of our substrate requirements by value.
Testing
Our research and development efforts in the area of testing have focused primarily on improving the efficiency and technology of our testing processes. The efforts include developing software for parallel testing of logic semiconductors, rapid automatic generation and cross-platform conversion of test programs to test logic/mixed-signal semiconductors, automatic code generation for converting and writing testing programs, testing new products using existing machines and providing customers remote access to monitor test results. We are also continuing the development of interface designs to provide for high-frequency testing by minimizing electrical noise. We work closely with our customers in designing and modifying testing software and with equipment vendors to increase the efficiency and reliability of testing equipment. Our research and development operations also include a mechanical engineering group, which currently designs handler kits for semiconductor testing and wafer probing, as well as software to optimize capacity utilization.
Item 6. Directors, Senior Management and Employees.
DIRECTORS AND SENIOR MANAGEMENT AND BOARD PRACTICE
Directors
Our board of directors is elected by our shareholders in a general meeting at which a quorum, consisting of a majority of all issued and outstanding common shares, is present. The Chairman is elected by the board from among the directors. Our seven-member board of directors is responsible for the management of our business.
The term of office for our directors is three years from the date of election. The current board of directors began serving on June 19, 2003. The terms of the current directors will expire on June 18, 2006. Directors may serve any number of consecutive terms and may be removed from office at any time for a valid reason by a resolution adopted at a general meeting of shareholders. Normally, all board members are elected at the same time, except where the posts of one-third or more of the directors are vacant, at which time a special meeting of shareholders shall be convened to elect directors to fill the vacancies.
58
The following table sets forth the name of each of our directors, his or her position in ASE Inc., the year they were elected as director and other significant positions of our affiliates held by them.

Name Position Director
Since Age Other Significant Positions Held
Jason C.S. Chang(1) ............................ Director, Chairman and Chief Executive Officer
1984 59 Chairman of ASE Test Taiwan
Richard H.P. Chang(1) ........................ Director, Vice Chairman and President
1984 56 Chairman of ASE Test; Chairman of Universal Scientific
Joseph Tung(2) .................................... Director and Chief Financial Officer
1997 44 Supervisor of Universal Scientific; Director of ASE Test
Chin Ko-Chien(2)................................ Director and Executive Vice President
1997 56 Director of ASE Test
David Pan(2) ....................................... Director 1997 58 Director and President of ASE Test
Jeffrey Chen(2).................................... Director and Vice President
2003 39 Director of ASE Test
Tien Wu(2) .......................................... Director 2003 46 Chief Executive Officer of ISE Labs
(1) Jason C.S. Chang and Richard H.P. Chang are brothers. (2) Representative of ASE Enterprises Limited, a company organized under the laws of Hong Kong, which held
19.3% of our outstanding common shares as of May 31, 2003. All of the outstanding shares of ASE Enterprises Limited are held by a company organized under the laws of the British Virgin Islands in trust for the benefit of Chang Yao Hung-ying, who was our director from 1984 to June 2003 and is the mother of Jason C.S. Chang, our Chairman and Chief Executive Officer, and Richard H.P. Chang, our Vice Chairman and President. Jason C.S. Chang is the sole shareholder and director of that company.
Supervisors
We currently have five supervisors, each serving a three-year term. Supervisors are typically elected at the time that directors are elected. The current supervisors began serving on June 1, 2001, and their terms will expire on May 31, 2004. The supervisors’ duties and powers include investigation of our business condition, inspection of our corporate records, verification and review of financial statements presented by our board of directors at shareholders’ meetings, convening of shareholders’ meetings, representing us in negotiations with our directors and notification, when appropriate, to the board of directors to cease acting in contravention of any applicable law or regulation or in contravention of our Articles of Incorporation. Each supervisor is elected by our shareholders and cannot concurrently serve as a director, managerial officer or other staff member. The ROC Company Law requires at least one supervisor be appointed at all times, or two supervisors for a company with publicly issued equity shares, and that a supervisor’s term of office be no more than three years.
The following table sets forth the name of each of our supervisors, the year they were elected as supervisor and other significant positions of our affiliates held by them.
Name Position Supervisor
Since Age Other Significant Positions Held
Feng Mei-Jean(1) .................................. Supervisor 1984 48 Supervisor of ASE Chung Li Yen-Yi Tseng(2).................................... Supervisor 2000 61 Chairman of Hung Ching Alan Cheng(2) ....................................... Supervisor 1997 57 Director of ASE Test John Ho(2)............................................. Supervisor 1998 47 Director of Universal Scientific Raymond Lo(2) ..................................... Supervisor 2000 48 President of ASE Test Taiwan
(1) Feng Mei-Jean is the wife of Richard H.P. Chang. (2) Representative of ASE Enterprises Limited.
In accordance with ROC law, each of our directors and supervisors is elected either in the capacity as an individual or as an individual representative of a corporation or government. Persons designated to represent corporate or government shareholders as directors are typically nominated by such shareholders at the annual
59

general meeting. Of the current directors and supervisors, nine represent ASE Enterprises Limited. The remaining directors and supervisors serve in their capacity as individual shareholders.
Executive Officers
The following table sets forth information relating to our executive officers.
Name Position Years with the
Company Age
Jason C.S. Chang....................................... Chairman and Chief Executive Officer 19 58 Richard H.P. Chang................................... Vice Chairman and President 19 56 Chin Ko-Chien .......................................... Executive Vice President and General
Manager, Kaohsiung packaging facility 19 56
David Pan .................................................. President, ASE Test 9 58 Raymond Lo.............................................. President, ASE Test Taiwan 17 48 Kanapathi A/L Kuppusamy....................... President, ASE Test Malaysia 4 51 Shih-Song Lee ........................................... President, ASE Chung Li 4 62 James Stilson ............................................. President, ASE Korea 4 56 Gregory Lin ............................................... President, ASE Material 8 59 Joseph Tung............................................... Chief Financial Officer 8 44 Tien Wu..................................................... Chief Executive Officer, ISE Labs 3 46
Biographies of Directors, Supervisors and Executive Officers
Jason C.S. Chang has served as Chairman of ASE Inc. since its founding in March 1984 and as its Chief Executive Officer since May 2003. He holds a degree in electrical engineering from National Taiwan University and a masters degree from the Illinois Institute of Technology. He is the brother of Richard H.P. Chang, our Vice Chairman.
Richard H.P. Chang has served as Vice Chairman of ASE Inc. since November 1999 after having served as President of ASE Inc. since its founding in March 1984, and was Chief Executive Officer of ASE Inc. from July 2000 to April 2003. In February 2003, he was again appointed President of ASE Inc. upon the retirement of Mr. Leonard Y. Liu. Mr. Chang is also the Chairman of ASE Test. He holds a degree in industrial engineering from Chung Yuan Christian University of Taiwan. He is the brother of Jason C.S. Chang, our Chairman and Chief Executive Officer.
Joseph Tung has served as a director of ASE Inc. since April 1997 and Chief Financial Officer since December 1994. He is also a director of ASE Test. Before joining ASE Inc., Mr. Tung was a Vice President at Citibank, N.A. He received a degree in economics from the National Chengchi University of Taiwan and a masters degree in business administration from the University of Southern California.
Chin Ko-Chien has served as a director of ASE Inc. since March 1984 and Executive Vice President and General Manager of our packaging facility in Kaohsiung since March 1990. Mr. Chin is also a director of ASE Test. Before joining ASE Inc., he held managerial positions at Fu Hua Construction Co. Ltd. and De Ji Trading Company. He holds a degree in bearings technology from Taiwan Ocean University.
David Pan has served as a director of ASE Inc. since April 1997 and President and a director of ASE Test since November 1995. Before joining ASE Test, Mr. Pan was the Vice President responsible for research and development at Ultratech Stepper Inc. He holds a degree in physics from the University of Illinois and masters and doctorate degrees in physics from the University of California at Berkeley.
Jeffrey Chen has served as a director of ASE Inc. since June 2003 and a director of ASE Test since 1998. He was the Chief Financial Officer of ASE Test from July 1998 to August 2002. Mr. Chen has also served as our Vice President since May 2002 and Assistant Vice President of the President’s Office of ASE Inc. since 1994. Prior to joining ASE Inc., he worked in the corporate banking department of Citibank, N.A., in Taipei and as the Vice President of corporate finance at Bankers Trust in Taipei. He holds a degree in finance and economics from Simon
60
Fraser University in Canada and a masters degree in business administration from the University of British Columbia in Canada.
Tien Wu has served as a director of ASE Inc. since June 2003 and the Chief Executive Officer of ISE Labs since March 2003. He also serves as the Vice President of Worldwide Marketing and Strategy of ASE Group. Prior to joining ASE Inc. in March 2000, Mr. Wu held various managerial positions with IBM. He holds a B.S.C.E. degree from the National Taiwan University and a M.S. degree in mechanical engineering and a Ph.D. degree in applied mechanics from University of Pennsylvania.
Feng Mei-Jean has served as a supervisor of ASE Inc. since March 1984. She holds a degree in economics from National Taiwan University. She is the wife of Richard H.P. Chang, our Vice Chairman and President.
Yen-Yi Tseng has served as a supervisor of ASE Inc. since July 2000 and Chairman of Hung Ching since July 2002. Mr. Tseng served as President of Ret-Ser Engineering Agency from 1991 to 1998. He holds a degree in civil engineering from National Taiwan University and a masters degree in system engineering from Asian Institute of Technology in Thailand. He was also a participant in the Program for Management Development at Harvard Business School.
Alan Cheng has served as a supervisor of ASE Inc. since April 1997. Mr. Cheng served as the Chairman of Hung Ching from April 1997 to July 2002. He holds a degree in industrial engineering from Chung-Yuan University.
John Ho has served as a supervisor of ASE Inc. since April 1998. He is also a director of Universal Scientific. He served as Chief Financial Officer of ASE Inc. from 1988 until 1995. He holds a degree in business administration from National Taiwan University and a masters degree in business administration from the University of Iowa.
Raymond Lo has served as a supervisor of ASE Inc. since July 2000 and President of ASE Test Taiwan since December 1999, after serving as Vice President of Operations of ASE Inc. since July 1993. Before joining ASE Inc., Mr. Lo was the Director of Quality Assurance at Zeny Electronics Co. He holds a degree in electronic physics from the National Chiao Tung University of Taiwan.
Kanapathi A/L Kuppusamy has served as President of ASE Test Malaysia since July 1999. Before joining ASE Test Malaysia, Mr. Kanapathi was President of Motorola Asia Final Manufacturing. He holds a masters degree in business administration from the University of East Asia in Kuala Lumpur, Malaysia.
Shih-Song Lee has served as President of ASE Chung Li since July 1999. Before joining ASE Chung Li, Mr. Lee served as President of Motorola, Inc.’s Semiconductor Products Sector Businesses in Chung Li, Taiwan before we acquired the company. He holds a degree in electrical engineering from the Tatung Institute of Technology in Taiwan.
James Stilson has served as President of ASE Korea since July 1999. Before joining ASE Korea, Mr. Stilson served as President of Motorola, Inc.’s Semiconductor Products Sector Businesses in Paju, Korea before we acquired the company. He holds a degree in chemistry and a masters degree in business administration from the University of California.
Gregory Lin has served as President of ASE Material since its inception in December 1997. Before joining ASE Material, Mr. Lin held research positions with Xerox Palo Alto Research Center. He holds a degree in chemistry from National Taiwan Chung Hsing University, and masters and doctorate degrees in chemistry from the University of Illinois.
COMPENSATION
In 2002, we paid to our directors, supervisors and executive officers approximately NT$134.7 million (US$3.9 million) in cash remuneration. An aggregate of 14,000,000 options were granted to our directors, supervisors and executive officers in 2002 under our employee stock option plan at an exercise price of NT$20.8 per share. We did not grant any common shares of ASE Inc. in 2002 to our directors, supervisors and executive officers. In 2002, we
61

also set aside an aggregate of NT$2.7 million (US$0.08 million) to provide pension, retirement and similar benefits for our executive officers pursuant to existing plans provided by or contributed to by our company or its subsidiaries.
ASE Inc. Employee Bonus and Stock Option Plans
We award bonuses to employees of ASE Inc. and its affiliates who are located in Taiwan based on overall income and individual performance targets. These employees are eligible to receive bonuses in the form of common shares of ASE Inc. valued at par. Actual amounts of bonuses to individual employees are determined based upon the employee’s meeting specified individual performance objectives. We granted an aggregate of 47,833,062 common shares and 34,960,000 common shares in 2000 and 2001, respectively, as stock bonuses to employees of ASE Inc. and its affiliates with a fair market value at the date of grant of NT$3,429.2 million and NT$830.6 million, respectively. We did not grant any stock bonuses to employees of ASE Inc. or its affiliates in 2002.
On August 13, 2002, we adopted an employee stock option plan. We filed a report with the ROC Securities and Futures Commission for the issuance of employee stock options, which report became effective on August 28, 2002. Pursuant to such plan, full-time employees of ASE Inc. as well as the full-time employees of our domestic and foreign subsidiaries are eligible to receive stock option grants. Under this plan, for a period of one year from August 28, 2002, we may issue up to 160,000,000 options on one or more occasions. Each option entitles the holder to purchase one common share of ASE Inc. at a price equal to the closing market price on the date of the option issuance. Each option is exercisable upon vesting for five years. Forty percent of the options originally granted vest upon the second anniversary of the grant date, and an additional 10% of the options originally granted vest every six months thereafter. Each option expires at the end of the 10th year following its issue date. The options are generally not transferable. As of December 31, 2002, a total of 145,989,000 options have been issued at an exercise price of NT$20.8 per share.
ASE Test Share Option Plans
ASE Test currently maintains five option plans which include plans adopted in each year from 1996 to 2000. Under ASE Test’s share option plans, its directors, employees, advisors and consultants and those of its affiliates may, at the discretion of a committee of its directors administering the plan, be granted options to purchase its shares at an exercise price of no less than their market value on the date of grant. The committee has complete discretion to determine which eligible individuals are to receive option grants, the number of shares subject to each grant, the vesting schedule to be in effect for each option grant and the maximum term for which each granted option is to remain outstanding, up to a maximum term of five years, or in the case of the 1999 and 2000 option plans, ten years. ASE Test’s board of directors may amend or modify the plans at any time. As of December 31, 2002, an aggregate of 28,800,000 of ASE Test’s shares had been reserved for issuance and 13,331,363 options to purchase its shares remained outstanding under its various option plans. An aggregate of 7,030,000 options had been granted to the directors and executive officers of ASE Test. Options granted under the various plans are exercisable at an exercise price ranging from US$3.50 to US$25.00 per share. Options granted under the 1996, 1997 and 1998 option plans will expire five years from the date of grant, and in the case of the 1999 and 2000 plans, ten years from the date of grant.
Interests of Management in Related Party Transactions
Several of our directors, supervisors and executive officers also serve as directors, supervisors or executive officers of companies with which we do business. These companies include our affiliates. See “Item 7. Major Shareholders and Related Party Transactions”. We conduct these transactions on an arm’s-length commercial basis.
EMPLOYEES
The following table sets forth certain information concerning our employees for the dates indicated:
62

As of December 31, 2000 2001 2002
Total................................................................................................... 18,121 15,681 20,401 Function
Direct labor....................................................................................... 12,011 9,690 13,059 Indirect labor (manufacturing) ......................................................... 3,577 3,366 4,264 Indirect labor (administration).......................................................... 1,370 1,350 1,517 Research and development ............................................................... 1,163 1,275 1,561
Location Taiwan.............................................................................................. 12,430 10,811 15,061 Malaysia ........................................................................................... 3,407 2,854 3,140 Korea ................................................................................................ 965 885 1,305 United States .................................................................................... 523 438 361 Philippines........................................................................................ 568 571 461 Singapore.......................................................................................... 104 68 65 Hong Kong ....................................................................................... 124 54 8
Eligible employees may participate in the ASE Inc. Employee Share Bonus Plan and the ASE Test Share
Option Plans. See “—Compensation—ASE Inc. Employee Bonus Plan and Stock Option Plans” and “—Compensation—ASE Test Share Option Plans”.
With the exception of ASE Korea’s employees, our employees are not covered by any collective bargaining arrangements. We believe that our relationship with our employees is good.
63

Item 7. Major Shareholders and Related Party Transactions
MAJOR SHAREHOLDERS
The following table sets forth information known to us with respect to the beneficial ownership of our common shares, as of May 31, 2003, by (1) each shareholder known by us to own beneficially more than 5% of our common shares and (2) all directors, supervisors and executive officers as a group.
Common Shares
Beneficially Owned
Name of Shareholder or Group Number Percentage
ASE Enterprises Limited(1) ....................................................................... 628,395,834 19.3% Directors, supervisors and executive officers
as a group(2) ........................................................................................... 746,306,099 22.9%
(1) ASE Enterprises Limited is a company organized under the laws of Hong Kong. All of the outstanding shares of ASE Enterprises Limited are held by a company organized under the laws of the British Virgin Islands in trust for the benefit of Chang Yao Hung-ying, who was our director from 1984 to June 2003, and our Chairman Jason C.S. Chang, who is the sole shareholder and director of that company.
(2) Includes shareholding of ASE Enterprises Limited.
The following table sets forth information relating to our common shares held by our consolidated subsidiaries and non-consolidated affiliates as of June 24, 2003.
Common Shares Beneficially Owned
Name of Shareholder Number Percentage
ASE Test Taiwan(1) ............................................................................. 652,713 0.0% Hung Ching(2)...................................................................................... 39,535,822 1.2%
(1) ASE Test Taiwan is a subsidiary of ASE Test, our subsidiary. (2) As of May 31, 2003, we held 26.4% of the outstanding shares of Hung Ching. Our then director Chang Yao
Hung-ying, our Chairman and Chief Executive Officer Jason C.S. Chang, our Vice Chairman and President Richard H.P. Chang and other members of the Chang family are controlling shareholders of Hung Ching. See “Item 4. Information on the Company—Organizational Structure—Our Unconsolidated Affiliates”.
None of our major shareholders has different voting rights from those of our other shareholders. There have been no significant changes in the percentage ownership of any of our major shareholders in 2000, 2001 and 2002.
As of May 31, 2003, a total of 3,254,800,000 common shares were outstanding. With certain limited exceptions, holders of common shares that are not ROC persons are required to hold their common shares through a brokerage account in the ROC. As of June 19, 2003, 115,519,475 common shares were registered in the name of a nominee of Citibank, N.A., the depositary under our ADS deposit agreement. Citibank, N.A., has advised us that, as of June 19, 2003, 23,103,379 ADSs, representing 115,516,895 common shares, were held of record by Cede & Co. and 516 ADSs, representing 2,580 common shares, were held by 5 other U.S. persons. We have no further information as to common shares held, or beneficially owned, by U.S. persons.
RELATED PARTY TRANSACTIONS
In recent years, ASE Inc. has made awards of ASE Inc.’s common shares to the employees of affiliates of ASE Inc. as part of their compensation, based in part on the consolidated net income of ASE Inc. and the affiliates’ contribution to the consolidated income. ASE Inc. granted an aggregate of 13,510,250 common shares in 2000 and 9,872,725 common shares in 2001 as stock awards to employees of affiliates of ASE Inc. with a fair market value at the time of grant of NT$968.5 million and NT$234.6 million, respectively. ASE Inc. expects this practice to continue in future periods.
64

ASE Material sold interconnect materials in the aggregate amount of NT$1,765.6 million, NT$2,346.9 million and NT$2,885.6 million (US$83.2 million) to ASE Inc. in 2000, 2001 and 2002, respectively. In 2002, we purchased approximately 39% of our substrate requirements by value for our packaging facilities from ASE Material. We purchase, and plan to continue to purchase, materials from ASE Material at prevailing market prices.
ASE Test Taiwan has historically charged ASE Inc. fees for the testing of semiconductors packaged for a small number of customers that prefer to be billed through ASE Inc. for testing services performed by ASE Test Taiwan. These fees amounted to NT$142.7 million, NT$178.3 million and NT$232.5 million (US$6.7 million) in 2000, 2001 and 2002, respectively. ASE Inc. sold to ASE Test Taiwan at book value a building at an aggregate price of NT$18.4 million in 2000.
ASE Test Malaysia and ASE Philippines have historically purchased a portion of the raw materials used in their packaging operations, principally leadframes, from ASE Inc. when they face a shortage in the supply of these types of raw materials. These types of raw materials are typically resold by ASE Inc. to ASE Test Malaysia and ASE Philippines at book value. Purchases of raw materials by ASE Test Malaysia amounted to NT$3.6 million, NT$17.2 million and NT$11.7 million (US$0.3 million) in 2000, 2001 and 2002, respectively. Purchases of raw materials by ASE Philippines amounted to NT$2.1 million, NT$4.7 million and NT$2.3 million (US$0.1 million) in 2000, 2001 and 2002, respectively. In addition, ASE Inc. purchased raw materials, principally leadframes, from ASE Test Malaysia in an amount of NT$11.9 million, NT$12.8 million and NT$0.1 million in 2000, 2001 and 2002, respectively.
In 2002, ASE Test Malaysia purchased raw materials, primarily lead frames and substrates, from ASE Material in the aggregate amount of NT$181.6 million (US$5.2 million). These types of raw materials are typically sold by ASE Material to ASE Test Malaysia at the prevailing market price.
ASE Inc. has historically guaranteed the short-term borrowing of many of its subsidiaries. As of December 31, 2002, ASE Inc. has endorsed and guaranteed an aggregate amount of NT$6,341.4 million (US$182.7 million) of the outstanding promissory notes of its subsidiaries.
In 2000, 2001 and 2002, ASE Inc. sold to ASE Philippines at book value machinery and equipment for the packaging of plastic dual in-line packages at an aggregate price of NT$22.8 million, NT$30.5 million and NT$0.1 million, respectively.
In April 2003, ASE Inc. and its affiliate, Hung Ching, entered into an agreement for the development of a building in the Nantze Export Processing Zone on land currently leased by ASE Inc. Under the agreement, Hung Ching will bear all costs relating to the development. Upon completion of the development, which is currently expected to be in the second half of 2004, ASE Inc. will own the first two floors of the building with floor space of approximately 22,000 square feet, and Hung Ching will own remaining floors of the building with floor space of approximately 86,000 square feet. ASE Inc. plans to use its floor space to house part of its operations in Kaohsiung. ASE Inc. and its affiliates will have priority in purchasing the remaining floor space from Hung Ching. The total value of the project, including land and the completed building, is estimated at NT$1.4 billion.
In January 2000, ASE Chung Li and Hung Ching, our affiliate, entered into an agreement for the development of buildings on land currently owned by ASE Chung Li. Under the agreement, Hung Ching will bear all costs relating to the development. Upon completion of the development, floor space in the buildings will be sold by Hung Ching at prices to be negotiated between Hung Ching and the buyers. ASE Chung Li and its affiliates will have priority in the purchase of the floor space. In the event that floor space is sold to persons other than ASE Chung Li, ASE Chung Li will receive 25% of the selling price. The first phase of the development project is the construction of a building with aggregate floor space of approximately 800,000 square feet, which was completed in September 2000. The total value of the first phase of the project, including land and the completed building, is estimated at NT$2.0 billion. The new building houses ASE Chung Li’s testing operations as well as part of the operations of other subsidiaries of ASE Inc.
ASE Chung Li entered into two leases with ASE Material and one lease with ASE Test Taiwan to lease floor space in a building located at 550-5, Section 1, Chung-hwa Road, Fu-hwa Li, Chung Li, Taiwan. An area of
65

approximately 48,000 square feet per floor was leased, with two floors leased to ASE Material and one floor leased to ASE Test Taiwan. The leased area will be used for production facilities.
In October 1997, J&R Holding entered into agreements with Swiss Bank Corporation to purchase call options on a portion of our US$200 million zero coupon convertible bonds due 2002. The call options were offered by Swiss Bank Corporation as a part of the repackaging of our convertible bonds by SBC Warburg, an affiliate of Swiss Bank Corporation, into two separate instruments consisting of: (1) US$200 million callable floating rate notes secured by the convertible bonds and (2) call options on the convertible bonds. SBC Warburg decided to repackage the convertible bonds because the adverse market conditions resulting from the Asian financial crisis during the second half of 1997 made it difficult to market the convertible bonds. SBC Warburg was able to obtain commitments for the entire issue of the floating rate notes but, as a result of the adverse market conditions described above, was able to obtain commitments for only a portion of the call options. As a result, Swiss Bank Corporation approached a number of large institutional investors, including J&R Holding, with a proposal to sell a portion of the call options.
J&R Holding decided to purchase the call options because its management considered the call options to be a good investment. Under the first agreement with Swiss Bank Corporation, J&R Holding was required to make four cash payments to Swiss Bank Corporation in November 1998, 1999, 2000 and 2001. In return, J&R Holding had the right to call the convertible bonds back at any time during the period from November 1998 through November 2002. Under the second agreement, Swiss Bank Corporation paid US$200,000 to J&R Holding. In return, Swiss Bank Corporation had the right to sell a portion of the call options to J&R Holding at any time between November 4, 1997 and November 1, 1998. These options were terminated by agreement on December 11, 2001. As of November 2002, we had repurchased in the open market all of the remaining bonds.
ASE Holding Limited, one of our subsidiaries through which we hold ASE Test shares, entered into a share purchase agreement dated as of May 19, 2001 with two of our directors under which ASE Holding Limited agreed to purchase 2,480,000 shares of ASE Test from these directors upon the exercise of certain options granted to them under ASE Test’s 1996 option plan for an aggregate purchase price of US$35,389,600. The closing date of this acquisition of shares was May 22, 2001. We engaged in this acquisition principally to maintain our investment in ASE Test at a level above 50% of the outstanding shares of ASE Test. For more information relating to the transaction, see “Item 7. Major Shareholders—Related Party Transactions” of our annual report on Form 20-F for the fiscal year ended December 31, 2001.
Item 8. Financial Information.
CONSOLIDATED STATEMENTS AND OTHER FINANCIAL INFORMATION
Consolidated financial statements are set forth under “Item 18. Financial Statements”.
LEGAL PROCEEDINGS
We are not involved in material legal proceedings the outcome of which we believe would have a material adverse effect on us.
Criminal charges were brought in December 1998 by the district attorney for Taipei against Jason C.S. Chang, Richard H.P. Chang, Chang Yao Hung-ying and four others for alleged breach of fiduciary duties owed to Hung Ching, an affiliate of ASE Inc., in their capacity as directors and officer of Hung Ching in connection with a land sale transaction in 1992 valued at approximately NT$1.7 billion. ASE Inc. is not a party to these proceedings and we do not expect that these charges will result in any liability to us. It was alleged that the transaction in which Jason C.S. Chang sold the land to Hung Ching unfairly benefited Jason C.S. Chang to the detriment of Hung Ching. Hung Ching at that time was a privately-owned company whose principal shareholders were members of the Chang family. Ancillary charges were brought against Jason C.S. Chang, Chang Yao Hung-ying and another person for alleged forgery of Hung Ching board resolutions relating to that transaction. In January 2001, the District Court of Taipei rendered a judgment finding Jason C.S. Chang and Chang Yao Hung-ying guilty of forgery of corporate and other documents and breach of fiduciary duties and Richard H.P. Chang not guilty. In January 2002, the High Court of Taiwan, ROC rendered a judgment relating to the appeal of the judgment by the District Court, and found Jason C.S. Chang and Chang Yao Hung-ying guilty and Richard H.P. Chang not guilty, and reduced the sentences rendered by
66

the District Court relating to Jason C.S. Chang and Chang Yao Hung-ying from six years to four years and three years, respectively. In order to comply with the particular requirements of the Singapore Companies Act, Jason C.S. Chang and Chang Yao Hung-ying have both resigned as directors of ASE Test.
Neither Jason C.S. Chang nor Chang Yao Hung-ying believes that he or she committed any offense in connection with such transactions, and they appealed the decision to the Supreme Court of Taiwan, ROC. On January 23, 2003, the Supreme Court reversed the judgment of the High Court with respect to Jason C.S. Chang and Chang Yao Hung-ying and remanded the case to the High Court for retrial. If a final adverse judgment is rendered against Jason C.S. Chang, he may be required under ROC law to resign as Chairman and a director of ASE Inc. See “Item 3. Key Information—Risk Factors—Risks Relating to Our Business—We depend on select personnel and could be affected by the loss of their services”.
DIVIDENDS AND DIVIDEND POLICY
To date we have not paid cash dividends on our common shares, and we expect that we will continue to pay a substantial portion, if not all, of our dividends in the form of shares. We have paid annual stock dividends on our common shares since 1989 except in 2002, in which we did not pay any dividend due to the losses we incurred in the 2001 fiscal year.
The following table sets forth the aggregate number of outstanding common shares entitled to dividends, as well as the stock dividends paid during each of the years indicated. The stock dividends per common share represent dividends paid in the fiscal year for common shares outstanding on the record date applicable to the payment of these dividends.
Stock Dividends Per Common
Share(1) Total Common Shares
Issued as Stock DividendsOutstanding Common
Shares on Record Date(2)
Percentage of Outstanding Common Shares Represented by
Stock Dividends NT$ US$
1995 ................... 3.60 0.14 93,600,000 260,000,000 36.0% 1996 ................... 8.00 0.29 319,840,000 399,800,000(3) 80.0 1997 ................... 3.80 0.14 277,020,000 729,000,000 38.0 1998 ................... 7.20 0.21 732,240,000 1,017,000,000 72.0 1999 ................... 1.07 0.03 190,460,000 1,780,000,000 10.7 2000 ................... 3.15 0.10 623,811,852 1,980,355,086 31.5 2001 ................... 1.70 0.05 467,840,000 2,752,000,000 17.0 2002 ................... 3,254,800,000
(1) Holders of common shares receive as a stock dividend the number of common shares equal to the NT dollar value per common share of the dividend declared multiplied by the number of common shares owned and divided by the par value of NT$10 per share. Fractional shares are not issued but are paid in cash.
(2) Aggregate number of common shares outstanding on the record date applicable to the dividend payment. Includes common shares issued in the previous year under our employee bonus plan.
(3) Includes 43,000,000 common shares issued in connection with an offering of global depositary shares in July 1995.
In the general shareholders’ meeting held on June 19, 2003, our shareholders approved the issuance of
325,480,000 common shares as stock dividends with respect to the results of 2002. Such issuance is subject to the approval of the ROC Securities and Futures Commission. If approved by the ROC Securities and Futures Commission, the stock dividends to be paid would represent 10.0% of our outstanding common shares as of the record date and would be the equivalent of NT$1.00 (US$0.03) per common share.
We have historically paid stock dividends on our common shares with respect to the results of the preceding year after approval by our shareholders at the annual general meeting of shareholders. The form, frequency and amount of future cash or stock dividends on our common shares and ADSs will depend upon our earnings, cash flow, financial condition and other factors. See “Description of Common Shares Dividends and Distributions”.
67

In general, we are not permitted to distribute dividends or make other distributions to shareholders for any year where we did not record net income or retained earnings (excluding reserves). The ROC Company Law also requires that 10% of annual net income (less prior years’ losses, if any) be set aside as a legal reserve until the accumulated legal reserve equals our paid-in capital. In addition, our Articles of Incorporation require that before a dividend is paid out of our annual net income:
up to 2% of our annual net income (less prior years’ losses and legal and special reserves, if any) should be paid to our directors and supervisors as compensation; and
•
• between 5% and 7% of the annual net income (less prior years’ losses and legal and special reserves, if any) should be paid to our employees as bonuses; the 5% portion is to be distributed to all employees in accordance with our employee bonus plan, while any portion exceeding 5% is to be distributed in accordance with rules established by our board of directors to individual employees who have been recognized as having made special contributions to our company.
In order to meet the needs of our present and future capital expenditures, our dividend distribution will be primarily in the form of common shares. Cash dividends may also be distributed in certain circumstances. However, the percentage of cash dividends generally will not exceed 20% in any dividend distribution, provided further that cash dividends will not be paid if the dividend per share is less than NT$0.1.
Holders of ADSs will be entitled to receive dividends, subject to the terms of the deposit agreement, to the same extent as the holders of the commons shares. Cash dividends will be paid to the depositary in NT dollars and, except as other provided in the deposit agreement, will be converted by the depositary into U.S. dollars and paid to holders of ADSs according to the terms of the deposit agreement. Stock dividends will be distributed to the depositary and, except as other provided in the deposit agreement, will be distributed by the depositary, in the form of additional ADSs, to holders of ADSs according to the terms of the deposit agreement.
Holders of outstanding common shares on a dividend record date will be entitled to the full dividend declared without regard to any prior or subsequent transfer of common shares. Accordingly, purchasers of ADSs holding outstanding ADSs on the relevant dividend record date will, subject to the terms of the deposit agreement, be entitled to the full amount of any dividend declared at our next general meeting of the shareholders.
For information relating to ROC withholding taxes payable on dividends, see “Taxation ROC Taxation Dividends”.
SIGNIFICANT CHANGES
We have not experienced any significant changes since the date of the annual financial statements.
Item 9. Listing Details.
MARKET PRICE INFORMATION AND MARKETS
Our common shares were first issued in March 1984 and have been listed on the Taiwan Stock Exchange since July 1989. The Taiwan Stock Exchange is an auction market where the securities traded are priced according to supply and demand through announced bid and ask prices. As of May 31, 2003, there were an aggregate of 3,254,800,000 of our common shares outstanding. The following table sets forth, for the periods indicated, the high and low closing prices and the average daily volume of trading activity on the Taiwan Stock Exchange for the common shares and the high and low of the daily closing values of the Taiwan Stock Exchange Index. The closing price for our common shares on the Taiwan Stock Exchange on June 20, 2003 was NT$21.60 per share.
68

Closing Price per
Share Adjusted Closing Price per Share(1)
Average Daily
Trading Volume
Taiwan Stock Exchange Index
High Low High Low (in thousands
of shares) High Low
1998....................................................... 191.00 47.00 65.76 27.60 54,727 9,277.1 6,251.41999....................................................... 117.00 51.00 72.80 29.94 43,438 8,608.9 5,474.82000....................................................... 123.00 22.60 79.95 19.32 22,279 10,202.2 4,614.62001....................................................... 38.80 14.00 34.20 14.00 22,799 6,104.2 3,446.3
First Quarter........................................ 38.80 22.50 33.16 19.23 34,321 6,104.2 4,743.9Second Quarter ................................... 29.60 21.00 25.30 17.95 16,275 5,797.9 4,768.5Third Quarter ...................................... 22.60 14.00 20.20 14.00 14,249 4,886.9 3,493.8Fourth Quarter..................................... 34.20 14.40 34.20 14.40 27,237 5,551.2 3,446.3
2002....................................................... 38.50 15.90 38.50 15.90 22,543 6,462.3 3,850.0First Quarter........................................ 35.80 26.00 35.80 26.00 32,486 6,242.6 5,488.3Second Quarter ................................... 38.50 20.80 38.50 20.80 17,708 6,462.3 5,071.8Third Quarter ...................................... 24.50 17.10 24.50 17.10 15,666 5,416.5 4,185.9Fourth Quarter..................................... 24.30 15.90 24.30 15.90 25,694 4,823.7 3,850.0
December.......................................... 24.30 20.30 24.30 20.30 20,665 4,823.7 4,452.42003 (through June 20).......................... 22.50 16.90 22.50 16.90 20,133 5,078.8 4,139.5
First Quarter........................................ 22.50 16.90 22.50 16.90 13,573 5,078.8 4,139.5January.............................................. 22.50 19.80 22.50 19.80 18,052 5,078.8 4,524.4February............................................ 20.00 17.50 20.00 17.50 14,036 5,015.2 4,432.5March................................................ 20.20 16.90 20.20 16.90 12,875 4,599.3 4,260.4
Second Quarter (through June 20) ......... 22.50 17.80 22.50 17.80 25,195 5,048.9 4,139.5April.................................................. 21.00 18.00 21.00 18.00 13,628 4,658.3 4,139.5May................................................... 19.50 17.80 19.50 17.80 12,627 4,555.9 4,187.8June (through June 20)...................... 22.50 19.10 22.50 19.10 62,225 5,048.9 4,678.1
(1) As adjusted retroactively by the Taiwan Stock Exchange to give effect to stock dividends paid in the periods indicated.
The performance of the Taiwan Stock Exchange has in recent years been characterized by extreme price volatility. There are currently limits on the range of daily price movements on the Taiwan Stock Exchange.
Our ADSs have been listed on the New York Stock Exchange under the symbol “ASX” since September 26, 2000. The outstanding ADSs are identified by the CUSIP number 00756M404. As of June 19, 2003, a total of 23,103,895 ADSs were outstanding. The table below shows, for the periods indicated, the high and low closing prices and the average daily volume of trading activity on the New York Stock Exchange for our ADSs and the highest and lowest of the daily closing values of the New York Stock Exchange Index. The closing price for our ADSs on the New York Stock Exchange on June 20, 2003 was US$3.12 per ADS.
69

Closing Price per ADS Adjusted Closing Price per ADS(1)
Average Daily
Trading Volume
New York Stock Exchange Index
High Low High Low (In thousands
of ADSs) High Low
US$ US$ US$ US$
2000 ................................................ 6.75 3.06 5.77 2.62 28 7,164.55 6,094.91 Fourth Quarter.............................. 6.75 3.06 5.77 2.62 28 7,061.88 6,599.28
2001 ................................................ 6.05 1.75 5.17 1.75 97 7,048.13 5,331.38 First Quarter ................................. 6.05 3.06 5.17 2.62 90 7,048.13 5,998.43 Second Quarter............................. 4.55 2.99 3.89 2.56 128 7,016.30 6,049.02 Third Quarter ............................... 3.25 1.75 3.00 1.75 47 6,632.58 5,331.38 Fourth Quarter.............................. 5.07 2.15 5.07 2.15 114 6,284.81 5,731.49
2002 ................................................ 5.54 2.21 5.54 2.21 101 6,445.01 4,452.49 First Quarter ................................. 5.35 3.75 5.35 3.75 122 6,445.01 5,894.75 Second Quarter............................. 5.54 3.05 5.54 3.05 118 6,327.11 5,543.28 Third Quarter ............................... 3.70 2.39 3.70 2.39 100 5,598.68 4,549.66 Fourth Quarter.............................. 3.50 2.21 3.50 2.21 66 5,247.64 4,452.49
December................................... 3.50 2.89 3.50 2.89 79 5,236.85 4,958.02 2003 (through June 20) ................... 3.23 2.45 3.23 2.45 124 5,722.85 4,486.70
First Quarter ............................... 3.23 2.45 3.23 2.45 37 5,255.39 4,486.70 January....................................... 3.23 2.80 3.23 2.80 50 5,255.39 4,486.70 February..................................... 2.84 2.50 2.84 2.50 14 4,884.79 4,649.71 March......................................... 2.93 2.45 2.93 2.45 44 4,970.94 4,486.70
Second Quarter (through June 20).................................. 3.22 2.50 3.22 2.50 217 5,722.85 4,793.50
April........................................... 3.08 2.58 3.08 2.58 32 5,135.12 4,793.50 May............................................ 2.82 2.50 2.82 2.50 41 5,435.37 5,126.80 June (through June 20)............... 3.22 2.68 3.22 2.68 725 5,722.85 5,470.02
(1) As adjusted retroactively to give effect to stock dividends paid in the periods indicated.
Item 10. Additional Information.
ARTICLES OF INCORPORATION
General
We are a company limited by shares organized under the laws of the ROC. Our organizational document is our Articles of Incorporation. We have no by-laws.
Our Articles of Incorporation provide, in Article 2, that we are to engage in the following types of business:
1. The manufacture, assembly, processing, testing and export of various types of integrated circuitry;
2. The research, development, design and manufacture, assembly, processing, testing and export of various computers, electronics, communications, information products and their peripheral products; and
3. General import and export trading business (to the exclusion of certain approved businesses that require trading permits).
We were incorporated on March 23, 1984 as a company limited by shares under the ROC Company Law. Our authorized capital was NT$45,500,000,000, divided into 4,550,000,000 common shares, 3,254,800,000 were issued in registered form and outstanding as of March 31, 2003. We do not have any equity in the form of preference shares or otherwise outstanding as of the date of this annual report.
With the approval of our board of directors and the ROC Securities and Futures Commission, we may issue stock options to our employees, provided that the shares to be issued under any option plan shall not exceed 10% of
70

our outstanding common shares and the total number of shares to be issued under all option plans shall not exceed 15% of our outstanding common shares. The exercise price of an option shall not be less than the closing price of our common shares on the Taiwan Stock Exchange on the issue date of the option. As of December 31, 2002, we have issued 145,989,000 options to our full-time employees as well as full-time employees of our domestic and foreign subsidiaries pursuant to an employee stock option plan established on August 13, 2002. See “Item 6. Directors, Senior Management and Employees—Compensation—ASE Inc. Employee Bonus Plan and Stock Option Plans”. We have 300,000,000 common shares reserved for issuance under our employee stock options.
Directors
Our Articles of Incorporation provide that we are to have from five to seven directors with tenures of three years who are elected from among the shareholders. There is no minimum amount of shares necessary to stand for election to a directorship. Many of our directors are corporate shareholders, who appoint representatives. Re-elections are allowed. The directors have certain powers and duties, including devising operations strategy, proposing to distribute dividends or make up losses, proposing to increase or decrease capital, reviewing material internal rules and contracts, hiring and discharging the general manager or managers, establishing and dissolving branch offices, reviewing budgets and audited financial statements and other duties and powers granted by or in accordance with the ROC Company Law or shareholders resolutions.
The board of directors is constituted by the directors, who elect a chairman and a vice-chairman from among the directors to preside over the meeting of the Board. Meetings of the board may be held in the ROC or any place abroad. A director may appoint another director to attend a meeting and vote by proxy, but a director may accept only one proxy.
The Articles of Incorporation contain no provisions relating to a director’s power to vote on a proposal in which that director is interested, the directors’ power to vote compensation to themselves, borrowing powers, retirement or age-limit requirements.
Dividends and Distributions
In general, we are not permitted to distribute dividends or make other distributions to shareholders in any year in which we did not record net income or retained earnings (excluding reserves). The ROC Company Law also requires that 10% of annual net income (less prior years’ losses, if any) be set aside as a legal reserve until the accumulated legal reserve equals our paid-in capital. In addition, our Articles of Incorporation require that before a dividend is paid out of our annual net income:
up to 2% of our annual net income (less prior years’ losses and legal and special reserves, if any) should be paid to our directors and supervisors as compensation; and
•
• between 5% and 7% of the annual net income (less prior years’ losses and legal and special reserves, if any) should be paid to our employees as bonuses. The 5% portion is to be distributed to all employees in accordance with our employee bonus plan, while any portion exceeding 5% is to be distributed in accordance with rules established by our board of directors to individual employees who have been recognized as having made special contributions to our company.
At the annual general shareholders’ meeting, our board of directors submits to the shareholders for their approval any proposal for the distribution of a dividend or the making of any other distribution to shareholders from our net income for the preceding fiscal year. All common shares outstanding and fully paid as of the relevant record date are entitled to share equally in any dividend or other distribution so approved. Dividends may be distributed in cash, in the form of common shares or a combination of the two, as determined by the shareholders at the meeting.
We are also permitted to make distributions to our shareholders of additional common shares by capitalizing reserves. However, the capitalized portion payable out of our legal reserve is limited to 50% of the total accumulated legal reserve and the capitalization can only be effected when the accumulated legal reserve exceeds 50% of our paid-in capital.
71
For information as to ROC taxes on dividends and distributions, see “—Taxation—ROC Taxation—Dividends”.

Changes in Share Capital
Under ROC Company Law, any change in the authorized share capital of a company limited by shares requires an amendment to its Articles of Incorporation. In the case of a public company such as ASE Inc., the approval of the ROC Securities and Futures Commission and the ROC Ministry of Economic Affairs is also required. Authorized but unissued common shares may be issued, subject to applicable ROC law, upon terms as our board of directors may determine.
Preemptive Rights
Under the ROC Company Law, when a ROC company issues new shares for cash, existing shareholders who are listed on the shareholders’ register as of the record date have preemptive rights to subscribe for the new issue in proportion to their existing shareholdings, while a company’s employees, whether or not they are shareholders of the company, have rights to subscribe for 10% to 15% of the new issue. Any new shares that remain unsubscribed at the expiration of the subscription period may be offered by us to the public or privately placed.
In addition, in accordance with the ROC Securities and Exchange Law, a public company that intends to offer new shares for cash must offer to the public at least 10% of the shares to be sold. This percentage can be increased by a resolution passed at a shareholders’ meeting, which would diminish the number of new shares subject to the preemptive rights of existing shareholders.
The preemptive rights provisions do not apply to offerings by shareholders of outstanding shares. According to the amended ROC Securities and Exchange Law, which was passed by the Legislative Yuan on January 15, 2002 and became effective on February 8, 2002, the preemptive rights provisions will not apply to offerings of new shares through a private placement approved at a shareholders meeting.
Meetings of Shareholders
We are required to hold an ordinary meeting of our shareholders within six months following the end of each fiscal year. These meetings are generally held in Kaohsiung, Taiwan. Extraordinary shareholders’ meetings may be convened by resolution of the board of directors or by the board of directors upon the written request of any shareholder or shareholders who have held 3% or more of the outstanding common shares for more than one year. Extraordinary shareholders’ meetings may also be convened by a supervisor. Notice in writing of general meetings of shareholders, stating the place, time and purpose, must be dispatched to each shareholder at least 30 days, in the case of ordinary meetings, and 15 days, in the case of extraordinary meetings, before the date set for each meeting. A majority of the holders of all issued and outstanding common shares present at a shareholders’ meeting constitutes a quorum for meetings of shareholders.
Voting Rights
Under the ROC Company Law, a shareholder has one vote for each common share held. As previously required by law, our Articles of Incorporation provide that a holder of common shares has one vote for each common share, except that a holder of more than 3% of the total outstanding common shares is not permitted to vote 0.1% of the number of common shares held by the holder in excess of 3%. Such voting discount requirement has been eliminated under the newly amended ROC Company Law, and we amended the Articles of Incorporation to comply with the law in the shareholders’ meeting held on June 21, 2002. Under the ROC Company Law, the election of our directors and supervisors at a shareholders’ meeting is through cumulative voting.
In general, a resolution can be adopted by the holders of at least a majority of the common shares represented at a shareholders’ meeting at which the holders of a majority of all issued and outstanding common shares are present. Under ROC Company Law, the approval by at least a majority of the common shares represented at a shareholders meeting in which a quorum of at least two-thirds of all issued and outstanding common shares are represented is required for major corporate actions, including:
amendment to the Articles of Incorporation, including increase of authorized share capital and any changes of the rights of different classes of shares;
•
72

transfer of the whole or substantial part of its business or assets; •
•
•
•
•
•
•
•
•
•
taking over of the whole of the business or assets of any other company, which would have a significant impact on our company’s operations;
distribution of any stock dividend; or
removal of directors or supervisors.
A shareholder may be represented at an ordinary or extraordinary meeting by proxy if a valid proxy form is delivered to us five days before the commencement of the ordinary or extraordinary shareholders’ meeting.
Holders of ADSs, however, generally do not have the right to exercise voting rights with respect to the underlying common shares.
Register of Shareholders and Record Dates
Our share registrar, President Securities Corp., maintains our register of shareholders at its offices in Taipei, Taiwan, and enters transfers of common shares in our register upon presentation of, among other documents, certificates representing the common shares transferred. Under the ROC Company Law and our Articles of Incorporation, we may, by giving advance public notice, set a record date and close the register of shareholders for a specified period in order for us to determine the shareholders or pledgees that are entitled to rights pertaining to the common shares. The specified period required is as follows:
ordinary shareholders’ meeting—60 days;
extraordinary shareholders’ meeting—30 days; and
relevant record date—five days.
Annual Financial Statements
At least 10 days before the annual ordinary shareholders’ meeting, our annual financial statements must be available at our principal executive office in Kaohsiung, Taiwan for inspection by the shareholders.
Transfer of Common Shares
The transfer of common shares in registered form is effected by endorsement and delivery of the related share certificates but, in order to assert shareholders’ rights against us, the transferee must have his name and address registered on our register of shareholders. Shareholders are required to file their respective specimen seals, also known as chops, with us. Chops are official stamps widely used in Taiwan by individuals and other entities to authenticate the execution of official and commercial documents.
Acquisition of Common Shares by ASE Inc.
Under the ROC Securities and Exchange Law, we may purchase our own common shares for treasury stock in limited circumstances, including:
to transfer common shares to our employees;
to deliver shares upon the conversion or exercise of bonds with warrants, preferred shares with warrants, convertible bonds, convertible preferred shares or warrants issued by us; and
to maintain our credit and our shareholders’ equity, provided that the shares so purchased shall be cancelled.
We may purchase our common shares on the Taiwan Stock Exchange or by means of a public tender offer. These transactions require the approval of a majority of our board of directors at a meeting in which at least two-thirds of the directors are in attendance. The total amount of common shares purchased for treasury stock may not
73

exceed 10% of the total outstanding shares. In addition, the total cost of the purchased shares shall not exceed the aggregate amount of our retained earnings, any premium from share issuances and the realized portion of our capital reserve.
Pursuant to the amended ROC Company Law, effective from November 14, 2001, our subsidiaries are not permitted to acquire our common shares. This restriction does not affect any acquisition of our common shares made by our subsidiaries prior to November 14, 2001.
Liquidation Rights
In the event of our liquidation, the assets remaining after payment of all debts, liquidation expenses and taxes will be distributed pro rata to the shareholders in accordance with the relevant provisions of the ROC Company Law and our Articles of Incorporation.
Substantial Shareholders and Transfer Restrictions
The ROC Securities and Exchange Law currently requires (1) each director, supervisor, manager or substantial shareholder (that is, a shareholder who together with his or her spouse, minor children or nominees, holds more than 10% of the shares of a public company) to report any change in that person’s shareholding to the issuer of the shares and the ROC Securities and Futures Commission and (2) each director, supervisor, manager or substantial shareholder, after acquiring its status of director, supervisor, manager or substantial shareholder for a period of six months, to report his or her intent to transfer any shares on the Taiwan Stock Exchange to the ROC Securities and Futures Commission at least three days before the intended transfer, unless the number of shares to be transferred is less than 10,000 shares.
In addition, the number of shares that can be sold or transferred on the Taiwan Stock Exchange by any person subject to the restrictions described above on any given day may not exceed:
0.2% of the outstanding shares of the company in the case of a company with no more than 30 million outstanding shares; or
•
•
•
0.2% of 30 million shares plus 0.1% of the outstanding shares exceeding 30 million shares in the case of a company with more than 30 million outstanding shares; or
in any case, 5% of the average trading volume (number of shares) on the Taiwan Stock Exchange for the ten consecutive trading days preceding the reporting day on which the director, supervisor, manager or substantial shareholder reports the intended share transfer to the ROC Securities and Futures Commission.
These restrictions do not apply to sales or transfers of our ADSs.
MATERIAL CONTRACTS
Manufacturing Services Agreement dated as of July 3, 1999 among Motorola, Inc., ASE Inc. and ASE (Chung Li) Inc.
This contract was entered into to provide a strategic supplier relationship in which we use our ASE Chung Li subsidiary to provide testing and packaging services to Motorola on a priority basis. This contract has a duration of five years. The contract governs capacity reservation by Motorola at the Chung Li facility as well as our facilities in Kaohsiung or the facilities of ASE Test Taiwan and specifications of the work to be performed. Remuneration to us is confidential and the contract, as filed as an exhibit to our Form F-1 Registration Statement in 2000, was granted confidential treatment by the Commission.
Manufacturing Services Agreement dated as of July 3, 1999 among Motorola, Inc., ASE Inc. and ASE (Korea) Inc.
This contract was entered into to provide a strategic supplier relationship in which we use our ASE Korea subsidiary to provide testing and packaging services to Motorola on a priority basis. This contract has a duration of
74

five years. The contract governs capacity reservation by Motorola at the Korea facility and specifications of the work to be performed. Remuneration to us is confidential and the contract, as filed as an exhibit to our Form F-1 Registration Statement in 2000, was granted confidential treatment by the Commission.
BGA Immunity Agreement dated as of January 25, 1994 between ASE Inc. and Motorola, Inc.
Pursuant to this contract, Motorola released, acquitted and forever discharged us and our subsidiaries from any and all claims or liability for infringement or alleged infringement of any Motorola patents, as defined in the contract. Motorola granted us and our subsidiaries immunity from suit for Motorola patents involving BGA packages. We and our subsidiaries released, acquitted and forever discharged Motorola and its subsidiaries for any time prior to the date of the contract, from any and all claims or liability for infringement of any of our patents. We granted Motorola and its subsidiaries immunity from suit for our patents involving BGA packages. Remuneration to Motorola is confidential and the contract, as filed as an exhibit to our Form F-1 Registration Statement in 2000, was granted confidential treatment by the Commission. The agreement terminated on December 31, 2002.
Service Agreement dated as of August 1, 2002 between ASE Electronics (M) Sdn. Bhd. and ASE (U.S.) Inc.
This contract established ASE (U.S.) as our subsidiary, ASE Test Malaysia’s non-exclusive sales service and sales support agent in Europe and North America for its products and services. For such services, our subsidiary pays ASE (U.S.) 12% of their monthly incurred services associated costs and expenses plus 5% or US$189,000, whichever is lower. ASE (U.S.) agreed to reimburse our subsidiary for expenses for any employee traveling to the U.S. or Europe if such travel was necessary to ASE (U.S.)’s services. This agreement will expire on July 31, 2003.
Service Agreement dated as of August 1, 2002 between ASE Test Inc. and ASE (U.S.) Inc.
This contract established ASE (U.S.) as our subsidiary, ASE Test Inc.’s non-exclusive sales service and sales support agent in Europe and North America for its products and services. For such services, our subsidiary pays ASE (U.S.) 17% of their monthly incurred services associated costs and expenses plus 5% or US$267,750, whichever is lower. ASE (U.S.) agreed to reimburse our subsidiary for expenses for any employee traveling to the U.S. or Europe if such travel was necessary to ASE (U.S.)’s services. This agreement will expire on July 31, 2003.
Service Agreement dated as of August 1, 2002 between ASE (Korea) Inc. and ASE (U.S.) Inc.
This contract established ASE (U.S.) as our subsidiary, ASE Korea’s non-exclusive sales service and sales support agent in Europe and North America for its products and services. For such services, our subsidiary pays ASE (U.S.) 5.5% of their monthly incurred services associated costs and expenses plus 5% or US$86,625, whichever is lower. ASE (U.S.) agreed to reimburse our subsidiary for expenses for any employee traveling to the U.S. or Europe if such travel was necessary to ASE (U.S.)’s services. This agreement will expire on July 31, 2003.
Service Agreement dated as of August 1, 2002 between ASE (Chung-Li) Inc. and ASE (U.S.) Inc.
This contract established ASE (U.S.) as our subsidiary, ASE Chung Li’s non-exclusive sales service and sales support agent in Europe and North America for its products and services. For such services, our subsidiary pays ASE (U.S.) 13% of their monthly incurred services associated costs and expenses plus 5%, or US$204,750, whichever is lower. ASE (U.S.) agreed to reimburse our subsidiary for expenses for any employee traveling to the U.S. or Europe if such travel was necessary to ASE (U.S.)’s services. This agreement will expire on July 31, 2003.
Service Agreement dated as of August 1, 2002 between ASE Inc. and ASE (U.S.) Inc.
This contract established ASE (U.S.) as our non-exclusive sales service and sales support agent in Europe and North America for our products and services. For such services, we pay ASE (U.S.) 52.5% of their monthly incurred services associated costs and expenses plus 5% or US$826,875, whichever is lower. ASE (U.S.) agreed to reimburse us for expenses for any employee traveling to the U.S. or Europe if such travel was necessary to ASE (U.S.)’s services. This agreement will expire on July 31, 2003.
75

Commission Agreement dated as of August 1, 2002 between ASE Electronics (M) Sdn, Bhd. and Gardex International Limited
This contract established Gardex as our subsidiary, ASE Test Malaysia’s non-exclusive worldwide sales agent for all its products and services. For such services, our subsidiary pays Gardex monthly, in respect of net export sales outside Malaysia, 0.56% of the sales amount for monthly sales. This agreement will expire on July 31, 2003.
Commission Agreement dated as of August 1, 2002 between ASE Test Inc. and Gardex International Limited
This contract established Gardex as our subsidiary, ASE Test Inc.’s non-exclusive worldwide sales agent for all its products and services. For such services, our subsidiary pays Gardex monthly, in respect of net export sales outside Taiwan, 0.56% of the sales amount for monthly sales. This agreement will expire on July 31, 2003.
Commission Agreement dated as of August 1, 2002 between ASE (Korea) Inc. and Gardex International Limited
This contract established Gardex as our subsidiary, ASE Korea’s non-exclusive worldwide sales agent for all its products and services. For such services, our subsidiary pays Gardex monthly, in respect of net export sales outside Korea, 0.48% of the sales amount for monthly sales. This agreement will expire on July 31, 2003.
Commission Agreement dated as of August 1, 2002 between ASE (Chung Li) Inc. and Gardex International Limited
This contract established Gardex as our subsidiary, ASE Chung Li’s non-exclusive worldwide sales agent for all its products and services. For such services, our subsidiary pays Gardex monthly, in respect of net export sales outside Taiwan, 0.56% of the sales amount for monthly sales. This agreement will expire on July 31, 2003.
Commission Agreement dated as of August 1, 2002 between ASE Inc. and Gardex International Limited
This contract established Gardex as our non-exclusive worldwide sales agent for all its products and services. For such services, we pay Gardex monthly, in respect of net export sales outside Taiwan, 0.8% of the sales amount for monthly sales. This agreement will expire on July 31, 2003.
EXCHANGE CONTROLS
ROC Exchange Controls
The Foreign Exchange Control Statute and regulations provide that all foreign exchange transactions must be executed by banks designated to handle the business, by the ROC Ministry of Finance or by the Central Bank of China. Current regulations favor trade-related foreign exchange transactions. Consequently, foreign currency earned from exports of merchandise and services may now be retained and used freely by exporters, and all foreign currency needed for the importation of merchandise and services may be purchased freely from the designated foreign exchange banks.
Trade aside, ROC companies and resident individuals may, without foreign exchange approval, remit into and outside the ROC foreign currency of up to US$50 million (or its equivalent) and US$5 million (or its equivalent) respectively in each calendar year. The above limits apply to remittances involving a conversion of NT dollars to a foreign currency and vice versa. A requirement is also imposed on all enterprises to register medium-and long-term foreign debt with the Central Bank of China.
In addition, foreign persons may, subject to specified requirements, but without foreign exchange approval of the Central Bank of China, remit outside and into the ROC foreign currencies of up to US$100,000 (or its equivalent) for each remittance. The above limit applies to remittances involving a conversion of NT dollars to a foreign currency and vice versa. The above limit does not, however, apply to the conversion of NT dollars into other currencies, including U.S. dollars, from the proceeds of sale of any underlying shares withdrawn from a depositary receipt facility.
76

TAXATION
ROC Taxation
The following discussion describes the principal ROC tax consequences of the ownership and disposition of ADSs representing common shares or common shares to a non-resident individual or entity. It applies to you only if you are:
an individual who is not a ROC citizen, who owns ADSs and who is not physically present in the ROC for 183 days or more during any calendar year; or
•
•
•
•
a corporation or a non-corporate body that is organized under the laws of a jurisdiction other than the ROC for profit-making purposes and has no fixed place of business or other permanent establishment in the ROC.
You should also consult your tax advisors concerning the ROC tax consequences of owning ADSs.
Dividends
Dividends declared by us out of our retained earnings and distributed to you are subject to ROC withholding tax, currently at the rate of 20%, on the amount of the distribution in the case of cash dividends or on the par value of the common shares in the case of stock dividends. However, a 10% ROC retained earnings tax paid by us on our undistributed after-tax earnings, if any, would provide a credit up to 10% of the gross amount of any dividends declared out of such earnings that would reduce the 20% ROC tax imposed on these distributions.
Under current ROC law, it is not clear whether the dividends paid by us out of our capital reserves are subject to ROC withholding tax.
Capital Gains
Under ROC law, capital gains on share securities transactions are exempt from income tax.
Subscription Rights
Distributions of statutory subscription rights for common shares in compliance with ROC law are not subject to any ROC tax. Proceeds derived from sales of statutory subscription rights evidenced by securities are exempted from income tax but are subject to securities transaction tax at the rate of 0.3% of the gross amount received. Proceeds derived from sales of statutory subscription rights which are not evidenced by securities are subject to capital gains tax at the rate of:
35% of the realized gains received if you are a natural person; or
25% of the realized gains received if you are an entity that is not a natural person.
Subject to compliance with ROC law, we, at our sole discretion, can determine whether statutory subscription rights shall be evidenced by issuance of securities.
Securities Transaction Tax
A securities transaction tax, at the rate of 0.3% of the gross amount received, will be withheld upon a sale of common shares in the ROC. Transfers of ADSs are not subject to ROC securities transaction tax. Withdrawal of common shares from the deposit facility is not subject to ROC securities transaction tax.
Estate and Gift Tax
ROC estate tax is payable on any property within the ROC of a deceased who is an individual, and ROC gift tax is payable on any property within the ROC donated by any such person. Estate tax is currently payable at rates ranging from 2% of the first NT$600,000 to 50% of amounts over NT$100,000,000. Gift tax is payable at rates ranging from 4% of the first NT$600,000 to 50% of amounts over NT$45,000,000. Under ROC estate and gift tax
77

laws, common shares issued by ROC companies are deemed located in the ROC regardless of the location of the holder. It is unclear whether a holder of ADSs will be considered to hold common shares for this purpose since there is no authority directly indicating whether an ADR holder will be treated as owning the shares represented by the ADR. However, despite this lack of direct authority, we are of the view that a holder of ADSs will not be subject to the ROC estate and gift tax because (1) the ADSs are not considered property within the ROC and (2) the transfer of ADSs is not deemed to be a transfer of the underlying common shares.
Tax Treaty
The ROC does not have an income tax treaty with the United States. On the other hand, the ROC has income tax treaties with Indonesia, Singapore, South Africa, Australia, Vietnam, New Zealand, Malaysia, Macedonia, Swaziland, Gambia, the United Kingdom and the Netherlands, which may result in a reduction in the rate of ROC withholding tax on dividends paid with respect to common shares of ROC companies. It is unclear whether if you hold ADSs, you will be considered to hold common shares for the purposes of these treaties. Accordingly, if you may otherwise be entitled to the benefits of the relevant income tax treaty, you should consult your tax advisors concerning your eligibility for the benefits with respect to the ADSs.
United States Federal Income Taxation
The following discussion describes the material U.S. federal income tax consequences of the acquisition, ownership and disposition of ADSs or common shares to the U.S. holders of the ADSs or common shares. For these purposes, you are a U.S. holder if you are a beneficial owner of ADSs or common shares that, for U.S. federal income tax purposes, is:
a citizen or resident of the United States; •
•
•
•
•
•
•
•
•
•
•
a corporation or other entity taxable as a corporation organized under the laws of the United States or of any political subdivision of the United States; or
an estate or trust the income of which is includable in gross income for U.S. federal income tax purposes regardless of its source.
This discussion assumes that ASE Inc. will not be considered a passive foreign investment company. Please see our discussion of passive foreign investment company rules below.
Please note that this discussion does not address all of the tax consequences that may be relevant in light of your particular circumstances. In particular, it does not address all of the tax consequences that may be relevant to purchasers subject to special rules, including:
persons subject to the alternative minimum tax;
insurance companies;
tax-exempt entities;
dealers or traders in securities;
financial institutions;
persons who hold or will hold ADSs or common shares as part of an integrated investment, including a straddle, hedging or conversion transaction, comprised of common shares and one or more other positions for tax purposes;
persons whose functional currency is not the U.S. dollar; or
persons who own 10% or more of our voting stock.
78

This discussion is based on the Internal Revenue Code of 1986, Treasury Regulations, administrative announcements and judicial decisions currently in effect. These laws and regulations may change, possibly with retroactive effect. This discussion is also based in part on representations by the depositary and assumes that each obligation under the deposit agreement and any related agreement will be performed in accordance with its terms.
For U.S. federal income tax purposes, a U.S. holder of ADSs should be treated as the holder of the common shares represented by the ADSs. However, the U.S. Treasury has expressed concerns that parties to whom depositary shares are pre-released may be taking actions that are inconsistent with the claiming of foreign tax credits by the holders of ADSs. Accordingly, the analysis of the creditability of ROC taxes described below could be affected by future actions that may be taken by the U.S. Treasury.
Please consult your tax advisors with regard to the application of the U.S. federal income tax laws to ADSs as well as any tax consequences arising under the laws of any state, local or non-U.S. taxing jurisdictions.
Dividends
Any dividends you receive on ADSs or common shares, including the amount of any ROC taxes withheld thereon, reduced by any credit against the withholding tax on account of the 10% retained earnings tax imposed on ASE Inc., other than pro rata distributions of common shares to all shareholders including holders of ADSs, will constitute foreign source dividend income to the extent paid out of earnings and profits as calculated for U.S. federal income tax purposes. The amount you will be required to include in income for any dividend paid in NT dollars will be equal to the U.S. dollar value of the NT dollars paid, calculated by reference to the exchange rate in effect on the date the depositary receives the dividend. If you realize gain or loss on a sale or other disposition of NT dollars, it will be U.S. source ordinary income or loss. You will not be entitled to a dividends-received deduction for dividends you receive. Under recently enacted legislation, dividends received by noncorporate U.S. Holders on ADRs may be subject to U.S. federal income tax at lower rates than other types of ordinary income if certain conditions are met. U.S. Holders should consult their own tax advisors regarding the implications of this new legislation in their particular circumstances.
Subject to applicable limitations and restrictions, the ROC taxes withheld from dividend distributions, reduced by any credit against the withholding tax on account of the 10% retained earnings tax, will be eligible for credit against your U.S. federal income tax liabilities. The limitation on foreign taxes eligible for credit is calculated separately with respect to specific classes of income including, among others, “passive income”, “financial services income” and “general limitation income”. For this purpose, dividends paid with respect to the common shares will constitute “passive income” or, in the case of U.S. financial services providers, may be “financial services income”.
Pro rata distributions of common shares by a company to its shareholders, including holders of ADSs, will not be subject to U.S. federal income tax. Accordingly, these distributions will not give rise to U.S. federal income against which the ROC tax imposed on these distributions may be credited. Any ROC tax of this nature will only be creditable against a U.S. holder’s U.S. federal income tax liability with respect to income in the “general limitation income” class and not “passive income” or “financial services income”, subject to applicable limitations and restrictions.
Capital Gains
You will recognize capital gain or loss for U.S. federal income tax purposes on the sale or exchange of ADSs in the same manner as you would on the sale or exchange of any other common shares held as capital assets. The gain or loss will be U.S. source income or loss. You should consult your own tax advisor about the treatment of capital gains, which may be taxed at lower rates than ordinary income for non-corporate taxpayers, and capital losses, the deductibility of which may be limited.
Deposits and withdrawals of common shares by a U.S. holder in exchange for ADSs will not result in realization of gain or loss for U.S. federal income tax purposes.
79

Passive Foreign Investment Company Rules
Based on management estimates, we do not expect to be a passive foreign investment company. In general, a foreign corporation is a passive foreign investment company for any taxable year in which (1) 75% or more of its gross income consists of passive income (such as dividends, interest, rents and royalties) or (2) 50% or more of the average quarterly value of its assets consists of assets that produce, or are held for the production of, passive income. The determination of whether we may be a passive foreign investment company will be based on the composition of its income and assets, as well as those of its subsidiaries and certain affiliates, from time to time. Since the composition of our income and assets will vary over time, there can be no assurance that it will not be considered a passive foreign investment company for any fiscal year. If we were a passive foreign investment company at any time that you own ADSs or common shares:
You may be subject to additional taxes and interest charges on any gain realized on the disposition of the ADSs or common shares, as applicable, and on “excess distributions”. The additional taxes are assessed at the highest tax rate applicable for corporate or individual taxpayers for the relevant tax periods; and
•
• You will be subject to additional U.S. tax filing requirements for each year that you hold ADSs or common shares.
Please consult your tax advisors about the possibility that we may be a passive foreign investment company and the rules that would apply to you if it were.
Estate and Gift Tax
As discussed in “—ROC Taxation”, you might be required to pay ROC estate and gift tax. You should consult your tax advisor regarding the effect of these taxes.
DOCUMENTS ON DISPLAY
We file annual reports on Form 20-F and periodic reports on Form 6-K with the SEC. You may read and copy this information at the SEC’s Public Reference Room at 450 Fifth Street, N.W., Washington, D.C. 20549. You can also request copies of the documents, upon payment of a duplicating fee, by writing to the Public Reference Section of the SEC. Please call the SEC at 1-800-SEC-0330 for further information on the operation of the Public Reference Room. Our SEC filings are also available to the public from the SEC’s website at http://www.sec.gov.
Item 11. Quantitative and Qualitative Disclosures about Market Risk.
MARKET RISK
Our exposure to financial market risks relates primarily to changes in interest rates and foreign currency exchange rates. To mitigate these risks, we utilize derivative financial instruments, the application of which is primarily to manage these exposures, and not for speculative purposes.
Interest Rate Risk. Our exposure to interest rate risks relates primarily to our long-term floating rate debt, which is normally incurred to support our corporate activities and capital expenditures. We currently do not enter into derivative transactions with regard to interest rates, but would consider engaging in currency interest rate swaps to lock in favorable currency and interest rate levels from time to time, if available, on terms considered attractive by us. No interest rate derivative contracts were outstanding as of December 31, 2002.
The following table provides information about our significant obligations that are sensitive to interest rate fluctuations.
80

As of December 31, 2002
Expected Maturity Date
2003 2004 2005 2006 2007 Total Fair Value
(in millions, except percentages)
Short-term debt: Variable rate (NT$) .................... 3,152.4 — — — — 3,152.4 3,152.4
Average interest rate ................ 2.70% — — — — Variable rate (US$) .................... 52.5 — — — — 52.5 52.5
Average interest rate ................ 2.60% — — — — Variable rate (JP¥) ..................... 1,608.7 — — — — 1,608.7 1,608.7
Average interest rate ................ 1.44% — — — — Variable rate (KRW) .................. 21,726.8 — — — — 21,726.8 21,726.8
Average interest rate ................ 5.96% — — — — Variable rate (EUR) ................... 0.5 — — — — 0.5 0.5
Average interest rate ................ 5.31% — — — — Variable rate (RMB) .................. 47.0 — — — — 47.0 47.0
Average interest rate ................ 5.96% — — — — Long-term debt:
Variable rate (NT$) .................... 5,315.1 11,691.5 6,283.7 811.5 — 24,101.8 24,101.8 Average interest rate ................ 5.19% 4.07% 4.50% 4.01% —
Fixed rate (NT$)......................... 18.6 2.1 0.4 — — 21.1 21.1 Average interest rate ................ 8.53% 3.23% 3.23% — —
Variable rate (US$) .................... 1.6 49.7 6.6 4.5 3.6 66.0 66.0 Average interest rate ................ 4.22% 3.45% 5.17% 5.59% 5.93%
Fixed rate (US$)......................... 23.4 153.7 3.0 0.1 — 180.2 180.2 Average interest rate ................ 5.98% 7.32% 9.50% 7.75% —
Variable rate (JP¥) ..................... — 5,460.4 — — — 5,460.4 5,460.4 Average interest rate ................ — 1.00% — — —
Variable rate (EUR) ................... — 3.0 — — — 3.0 3.0 Average interest rate ................ — 4.53% — — —
Foreign Currency Exchange Rate Risk. Our foreign currency exposures give rise to market risk associated
with exchange rate movements against the NT dollar, our functional currency. Currently, the majority of our revenues from packaging and testing services are denominated in U.S. dollars, with a portion denominated in NT dollars. Our costs of revenues and operating expenses associated with packaging and testing services are incurred in several currencies, primarily in NT dollars and U.S. dollars, as well as, to a lesser extent, Malaysian ringgit, Korean won, Japanese yen and Philippine pesos. Fluctuations in exchange rates, primarily among the U.S. dollar, the NT dollar and the Japanese yen, will affect our costs and operating margins and could result in exchange losses and increased costs in NT dollar and other local currency terms. In 2000, 2001 and 2002, the average exchange rate of the NT dollar to the U.S. dollar was 31.37, 33.91 and 34.53, respectively. In addition, a substantial portion of our capital expenditures, primarily for the purchase of packaging and testing equipment, has been, and is expected to continue to be, denominated primarily in U.S. dollars with the remainder in Japanese yen.
Foreign currency denominated liabilities as of December 31, 2002 include U.S. dollar debt and Japanese yen debt. As of December 31, 2002, approximately 66.8% of our cash and accounts receivable were denominated in U.S. dollars, with a substantial portion of the remainder denominated in NT dollars. As of December 31, 2002, approximately 75.4% of our accounts payable and payable for fixed assets were denominated in currencies other than the NT dollar. To protect against reductions in value and the volatility of future cash flows caused by changes in foreign currency exchange rates, we may utilize currency forward contracts from time to time to reduce the impact of foreign currency fluctuations on our results of operations. Our policy is to account for these contracts on a mark-to-market rate basis, and the premiums are amortized on a straight-line basis over the life of the contract.
The table below presents our outstanding foreign currency option contracts and forward exchange contracts as of December 31, 2002.
81

Foreign Currency Option Contracts Amount Maturity
US$
(in millions)
Contracts to buy US$ call/NT$ put ...................................................... 5.0 January 2003 Contracts to buy US$ call/NT$ put ...................................................... 5.0 February 2003 Contracts to sell US$ call/NT$ put....................................................... 10.0 January 2003
Forward Exchange Contracts Amounts Maturity
US$
(in millions)
Contracts to buy NT$/sell US$......................................................... 5.0 January 2003 Contracts to buy NT$/sell US$......................................................... 5.0 February 2003
Item 12. Description of Securities Other Than Equity Securities.
Not applicable.
PART II
Item 13. Defaults, Dividend Arrearages and Delinquencies.
Not applicable.
Item 14. Material Modifications to the Rights of Security Holders and Use of Proceeds.
MATERIAL MODIFICATIONS TO THE RIGHTS OF SECURITY HOLDERS
In July 1995, we established with Citibank, N.A., as GDS depositary, two depositary receipts facilities, one for the purpose of facilitating the issuance of GDSs sold under Rule 144A and the other for the purpose of facilitating the issuance of GDSs sold pursuant to Regulation S. Each GDS represented five of our common shares. In December 1999, some of our affiliates offered and sold additional GDSs. The GDSs sold under Rule 144A were designated as eligible for trading in the PORTAL System of the National Association of Securities Dealers, Inc. in the United States. The GDSs sold pursuant to Regulation S were listed on the Stock Exchange of Singapore and the Luxembourg Stock Exchange and quoted on SEAQ International.
Concurrently with our offering of ADSs on September 25, 2000, we arranged with our GDS depositary and our ADS depositary for the automatic conversion of each of our outstanding GDSs sold pursuant to Regulation S into one ADS. The ADSs issued upon conversion of our GDSs sold pursuant to Regulation S were identified by a new CUSIP number. We have listed these ADSs for trading on the NYSE under the symbol “ASX”. We delisted these GDSs from the Stock Exchange of Singapore and the Luxembourg Stock Exchange and suspended quotation on SEAQ International.
Concurrently with our offering of ADSs of September 25, 2000, we offered to exchange one ADS for each of our outstanding GDSs sold under Rule 144A. The ADSs issued upon exchange of the GDSs sold under Rule 144A are identified by the same CUSIP number as that which identifies the ADSs issued upon conversion of the GDSs sold pursuant to Regulation S as described above, and all of those ADSs are fully fungible for trading on the NYSE. Upon the completion of the exchange offer, we instructed the GDS depositary to terminate the global depositary receipt facility.
Item 15. Controls and Procedures.
Within 90 days prior to the date of this annual report, we, under the supervision and with the participation of our management, including the Chief Executive Officer and the Chief Financial Officer, performed an evaluation of the effectiveness of our disclosure controls and procedures. Based on this evaluation, our Chief Executive Officer and Chief Financial Officer concluded that our disclosure controls and procedures are effective for gathering, analyzing and disclosing the information we are required to disclose in this annual report we file under the Securities
82

Exchange Act of 1934, within the time periods specified in the SEC’s rules and forms. Our management necessarily applied its judgment in assessing the costs and benefits of such controls and procedures, which by their nature can provide only reasonable assurance regarding management’s control objectives.
There have been no significant changes in our internal controls or other factors that could significantly affect internal controls subsequent to the date of their evaluation.
PART III
Item 17. Financial Statements.
The Company has elected to provide financial statements for fiscal year 2002 and the related information pursuant to Item 18.
Item 18. Financial Statements.
Reference is made to pages F-1 to F-54 of this annual report.
The consolidated financial statements of the Company and the report thereon by its independent auditors listed below are attached hereto as follows:
(a) Report of Independent Auditors of the Company dated February 11, 2003 (page F-2).
(b) Consolidated Balance Sheets of the Company and subsidiaries as of December 31, 2001 and 2002 (page F-3).
(c) Consolidated Statements of Income of the Company and subsidiaries for the years ended December 31, 2000, 2001 and 2002 (page F-5).
(d) Consolidated Statements of Changes in Stockholders’ Equity of the Company and subsidiaries for the years ended December 31, 2000, 2001 and 2002 (page F-8).
(e) Consolidated Statements of Cash Flows of the Company and subsidiaries for the years ended December 31, 2000, 2001 and 2002 (page F-11).
(f) Notes to Consolidated Financial Statements of the Company and subsidiaries (pages F-13).
Item 19. Exhibits.
1. (a) Articles of Association of the Registrant (in Chinese with English translation) (incorporating all amendments as of June 21, 2002) (incorporated by reference to Exhibit 3.1 to the Company’s registration statement on Form F-3 (File No. 333-89428) (the “Form F-3”) filed on March 31, 2003).
2. (a) Amended and Restated Deposit Agreement dated as of September 29, 2000 among ASE Inc., Citibank N.A., as depositary, and Holders and Beneficial Holders of American Depositary Shares evidenced by American Depositary Shares evidenced by American Depositary Receipts issued thereunder, including the form of American Depositary Receipt (incorporated by reference to Exhibit 4.1 to the Form F-3 filed on March 31, 2003).
(b) Form of Underwriting Agreement (incorporated by reference to Exhibit 1.1 to the Form F-3 filed on April 24, 2003).
4. (a) Asset Purchase Agreement dated as of July 3, 1999 among ASE (Chung Li) Inc., ASE Inc., Motorola Electronics Taiwan, Ltd. and Motorola, Inc. (incorporated by reference to Exhibit 10.2 to ASE Test Limited’s registration statement on Form F-3 (File No. 333-10892) which was declared effective by the SEC on December 22, 1999 (the “ASE Test 1999 Registration Statement”).
83

(b) Agreement dated as of June 5, 2002 among ASE (Chung Li) Inc., ASE Inc., Motorola Electronics Taiwan, Ltd. and Motorola, Inc. amending certain earn-out arrangement provided for in Section 2.09(b)(ii)(D) of the Asset Purchase Agreement dated as of July 3, 1999 among the same parties.
(c) Stock Purchase Agreement dated as of July 3, 1999 among ASE Investment (Labuan) Inc., ASE Inc., Motorola Asia Ltd. and Motorola, Inc. relating to the purchase and sale of 100% of the Common Stock of Motorola Korea Ltd. (incorporated by reference to Exhibit 10.3 to the ASE Test 1999 Registration Statement).
(d)† Manufacturing Services Agreement dated as of July 3, 1999 among Motorola, Inc., ASE Inc. and ASE (Chung Li) Inc. (incorporated by reference to Exhibit 10.4 to the Company’s registration statement on Form F-1 (File No. 333-44622) (the “Form F-1”)).
(e) † Manufacturing Services Agreement dated as of July 3, 1999 among Motorola, Inc., ASE Inc. and ASE (Korea) Inc. (incorporated by reference to Exhibit 10.5 to the Form F-1).
(f) † BGA Immunity Agreement dated as of January 25, 1994 between ASE Inc. and Motorola, Inc. (incorporated by reference to Exhibit 10.6 to the Form F-1).
(g) Land Lease effective October 1, 1999 until September 30, 2009 between ASE Inc. and the Nantze Export Processing Zone (incorporated by reference to Exhibit 10.14 to the Form F-1).
(h) Land Lease effective September 1, 1999 until August 30, 2009 between ASE Inc. and the Nantze Export Processing Zone (incorporated by reference to Exhibit 10.15 to the Form F-1).
(i) Land Lease effective April 1, 1998 until March 31, 2008 between ASE Inc. and the Nantze Export Processing Zone (incorporated by reference to Exhibit 10.16 to the Form F-1).
(j) Land Lease effective October 1, 1997 until September 30, 2007 between ASE Inc. and the Nantze Export Processing Zone (incorporated by reference to Exhibit 10.17 to the Form F-1).
(k) Land Lease effective October 1, 1997 until September 30, 2007 between ASE Inc. and the Nantze Export Processing Zone (incorporated by reference to Exhibit 10.18 to the Form F-1).
(l) Land Lease effective August 1, 1997 until July 31, 2007 between ASE Inc. and the Nantze Export Processing Zone (incorporated by reference to Exhibit 10.19 to the Form F-1).
(m) Land Lease effective January 1, 1996 until December 31, 2005 between ASE Inc. and the Nantze Export Processing Zone (incorporated by reference to Exhibit 10.20 to the Form F-1).
(n) Land Lease effective January 1, 1995 until October 31, 2005 between ASE Inc. and the Nantze Export Processing Zone (incorporated by reference to Exhibit 10.21 to the Form F-1).
(o) Land Lease effective October 1, 1999 until September 30, 2009 between ASE Inc. and the Nantze Export Processing Zone (incorporated by reference to Exhibit 10.14 to the Form F-1).
(p) Land Lease effective July 1, 1995 until June 30, 2005 between ASE Inc. and the Nantze Export Processing Zone (incorporated by reference to Exhibit 10.22 to the Form F-1).
(q) Land Lease effective July 1, 1995 until June 30, 2005 between ASE Inc. and the Nantze Export Processing Zone (incorporated by reference to Exhibit 10.23 to the Form F-1).
(r) Land Lease effective August 1, 1994 until July 31, 2004 between ASE Inc. and the Nantze Export Processing Zone (incorporated by reference to Exhibit 10.24 to the Form F-1).
(s) Land Lease effective April 6, 1994 until April 5, 2004 between ASE Inc. and the Nantze Export Processing Zone (incorporated by reference to Exhibit 10.25 to the Form F-1).
84

(u) License Agreement dated as of January 16, 2001 between 1st Silicon (Malaysia) Sdn. Bhd. and ASE Electronics (M) Sdn. Bhd. (incorporated by reference to Exhibit 4(u) to the Annual Report on Form 20-F for the year 2000, filed on June 28, 2001 (the “2000 20-F”)).
(v) Service Agreement dated as of August 1, 2002 between ASE Electronics (M) Sdn. Bhd. and ASE (U.S.) Inc. (incorporated by reference to Exhibit 10.21 to the Form F-3 filed on March 31, 2003).
(w) Service Agreement dated as of August 1, 2002 between ASE Test Inc. and ASE (U.S.) Inc. (incorporated by reference to Exhibit 10.22 to the Form F-3 filed on March 31, 2003).
(x) Service Agreement dated as of August 1, 2002 between ASE (Korea) Inc. and ASE (U.S.) Inc. (incorporated by reference to Exhibit 10.23 to the Form F-3 filed on March 31, 2003).
(y) Service Agreement dated as of August 1, 2002 between ASE (Chung-Li) Inc. and ASE (U.S.) Inc. (incorporated by reference to Exhibit 10.24 to the Form F-3 filed on March 31, 2003).
(z) Service Agreement dated as of August 1, 2002 between Advanced Semiconductor Engineering, Inc. and ASE (U.S.) Inc. (incorporated by reference to Exhibit 10.25 to the Form F-3 filed on March 31, 2003).
(aa) Commission Agreement dated as of August 1, 2002 between ASE Electronics (M) Sdn. Bhd. and Gardex International Limited. (incorporated by reference to Exhibit 10.26 to the Form F-3 filed on March 31, 2003).
(bb) Commission Agreement dated as of August 1, 2002 between ASE Test Inc. and Gardex International Limited. (incorporated by reference to Exhibit 10.27 to the Form F-3 filed on March 31, 2003).
(cc) Commission Agreement dated as of August 1, 2002 between ASE (Korea) Inc. and Gardex International Limited. (incorporated by reference to Exhibit 10.28 to the Form F-3 filed on March 31, 2003).
(dd) Commission Agreement dated as of August 1, 2002 between ASE (Chung Li) Inc. and Gardex International Limited. (incorporated by reference to Exhibit 10.29 to the Form F-3 filed on March 31, 2003).
(ee) Commission Agreement dated as of August 1, 2002 between Advanced Semiconductor Engineering, Inc. and Gardex International Limited. (incorporated by reference to Exhibit 10.30 to the Form F-3 filed on March 31, 2003).
(ff) Land Lease effective July 1, 2000 until June 30, 2010 between ASE Inc. and the Nantze Export Processing Zone. (incorporated by reference to Exhibit 4(ff) to the 2000 20-F).
(gg) Land Lease effective July 1, 2000 until June 30, 2010 between ASE Inc. and the Nantze Export Processing Zone. (incorporated by reference to Exhibit 4(ff) to the 2000 20-F).
(hh) Land Lease effective October 1, 2000 until September 30, 2010 between ASE Inc. and the Nantze Export Processing Zon0e. (incorporated by reference to Exhibit 4(hh) to the 2000 20-F).
(ii) Land Lease effective March 16, 2001 until March 15, 2011 between ASE Inc. and the Nantze Export Processing Zone. (incorporated by reference to Exhibit 4(ii) to the 2000 20-F).
(jj) Land Lease effective March 1, 2001 until February 28, 2011 between ASE Inc. and the Nantze Export Processing Zone. (incorporated by reference to Exhibit 4(jj) to the 2000 20-F).
(kk) First Amendment to Lease Agreement dated June 7, 2000 between ISE Labs, Inc. and RND Funding Company, Inc. (incorporated by reference to Exhibit 4(kk) to the 2000 20-F).
85

(ll) Sub-lease Agreement dated October 3, 2000 between ISE Labs Singapore Pte Ltd and Wan Tien Realty (Pte) Ltd. (incorporated by reference to Exhibit 4(ll) to the 2000 20-F).
(mm) Sub-lease Agreement dated June 3, 1999 between ISE Labs Singapore Pte Ltd and Wan Tien Realty (Pte) Ltd. (incorporated by reference to Exhibit 4(mm) to the 2000 20-F).
(nn) Sublease Agreement dated June 2000 between ISE Labs, Inc. and Cirrus Logic, Inc. (incorporated by reference to Exhibit 4(nn) to the 2000 20-F).
(oo) Sublease Agreement dated June 2000 between ISE Labs, Inc. and Cirrus Logic, Inc. (incorporated by reference to Exhibit 4(oo) to the 2000 20-F).
(pp) Tenancy Agreement dated April 1, 1999 between ISE Labs (HK) Limited and Hing Seng Plastic Factory Limited. (incorporated by reference to Exhibit 4(pp) to the 2000 20-F).
(qq) Lease dated September 28, 2000 between ISE Labs Hong Kong Limited and Shinano Kenshi (HK) Co., Ltd. (incorporated by reference to Exhibit 4(qq) to the 2000 20-F).
(rr) Lease dated October 20, 2000 between ISE Labs Hong Kong and Bless Silver Development Limited. (incorporated by reference to Exhibit 4(rr) to the 2000 20-F).
(ss) Lease Agreement between ASE Test Malaysia and Penang Development Corporation (incorporated by reference to Exhibit 2(c) to ASE Test Limited’s annual report on Form 20-F for the year ended December 31, 1997). (incorporated by reference to Exhibit 4(ss) to the 2000 20-F).
(tt) Sale and Purchase Agreement between Afasia Knitting Factory (Malaysia) Sdn. Bhd. and ASE Electronics (M) Sdn. Bhd. dated February 24, 1997. (incorporated by reference to Exhibit 4(tt) to the 2000 20-F).
(uu) Office Building Lease Agreement between ISE Labs, Inc. and JER/BRE Austin Tech L.P. dated October 4, 2001. (incorporated by reference to Exhibit 10.46 to the Form F-3 filed on May 30, 2002).
(vv) Plant Lease Agreement between ASE (Chung Li) Inc. and ASE Material Inc. dated October 31, 2001.
(ww) Plant Lease Agreement between ASE (Chung Li) Inc. and ASE Material Inc. dated October 31, 2001.
(xx) Plant Lease Agreement between ASE (Chung Li) Inc. and ASE Test Inc. dated October 5, 2001.
(iii) ASE Inc. Employee Bonus Plan in (Chinese with English language translation) (incorporated by reference to Exhibit 4(iii) to the Annual Report on Form 20-F for the year 2001, filed on June 28, 2002).
(iv) 2002 ASE Employee Stock Option Plan (in Chinese with English language translation) (incorporated by reference to Exhibit 10.50 to the Form F-3 filed on March 31, 2003.
8. List of Subsidiaries (incorporated by reference to Exhibit 21.1 to the Form F-3 filed on May 30, 2002).
12. (a) Co-Building and Sale Agreement dated as of January 27, 2000 between ASE (Chung Li) Inc. and Hung Ching Development & Construction Co. Ltd. (in Chinese with English language summary translation) (incorporated by reference to Exhibit 99.1 to the Form F-3 filed on May 27, 2003).
(b) Co-Building Agreement dated as of April 17, 2003 between ASE Inc. and Hung Ching Development & Construction Co. Ltd. (in Chinese with English language summary translation) (incorporated by reference to Exhibit 99.2 to the Form F-3 filed on May 27, 2003).
(c) Certification of the Chief Executive Officer and the Chief Financial Officer of Advanced Semiconductor Engineering, Inc. for the purpose of complying with Section 1350 of Chapter 63 of Title 18 of the United States Code.
86

____________________ † Does not contain portions for which confidential treatment has been granted.
The Company agrees to furnish to the Securities and Exchange Commission upon request a copy of any instrument which defines the rights of holders of long-term debt of the Company and its consolidated subsidiaries.
87
INDEX TO FINANCIAL STATEMENTS
Page
Consolidated Financial Statements of Advanced Semiconductor Engineering, Inc. and Subsidiaries
Independent Auditors’ Report ....................................................................................... F-2 Consolidated Balance Sheets......................................................................................... F-3 Consolidated Statements of Income .............................................................................. F-5 Consolidated Statements of Changes in Shareholders’ Equity...................................... F-8 Consolidated Statements of Cash Flows........................................................................ F-11 Notes to Consolidated Financial Statement ................................................................... F-13
F-1 (HK) 01141/017/20-F/ase.inc.20f.2002.doc
INDEPENDENT AUDITORS’ REPORT
The Board of Directors and Shareholders Advanced Semiconductor Engineering, Inc.
We have audited the accompanying consolidated balance sheets of Advanced Semiconductor Engineering, Inc., a corporation incorporated under the laws of the Republic of China, and its consolidated subsidiaries (the “Company”) as of December 31, 2001 and 2002, and the related consolidated statements of income, changes in shareholders’ equity and cash flows for each of the years in the three year period ended December 31, 2002, all prepared in accordance with accounting principles generally accepted in the Republic of China and expressed in New Taiwan dollars. These financial statements are the responsibility of the Company’s management. Our responsibility is to express an opinion on these financial statements based on our audits.
We conducted our audits in accordance with Regulations for Audit of Financial Statements by Certified Public Accountants and auditing standards generally accepted in the Republic of China and the United States of America. Those standards require that we plan and perform the audit to obtain reasonable assurance about whether the financial statements are free of material misstatement. An audit includes examining, on a test basis, evidence supporting the amounts and disclosures in the financial statements. An audit also includes assessing the accounting principles used and significant estimates made by management, as well as evaluating the overall financial statement presentation. We believe that our audits provide a reasonable basis for our opinion.
In our opinion, the consolidated financial statements referred to above present fairly, in all material respects, the consolidated financial position of the Company as of December 31, 2001 and 2002, and the consolidated results of their operations and their cash flows for each of the years in the three year period ended December 31, 2002, in conformity with accounting principles generally accepted in the Republic of China.
As disclosed in Note 3 to the consolidated financial statements, on January 1, 2002, the Company adopted Republic of China Statement of Financial Accounting Standards No. 30, “Accounting for Treasury Stock”.
Accounting principles generally accepted in the Republic of China vary in certain significant respects from accounting principles generally accepted in the United States of America. The application of the latter would have affected the determination of net income for each of the three years in the period ended December 31, 2002, and the determination of shareholders’ equity and financial position at December 31, 2001 and 2002, to the extent summarized in Note 26.
As discussed in Note 26 to the consolidated financial statements, the Company changed its method of accounting for goodwill and other intangible assets to conform to US Statement of Financial Accounting Standards No. 142, “Goodwill and Other Intangible Assets” effective January 1, 2002.
T.N. Soong & Co. (Associate Member Firm of Deloitte Touche Tohmatsu Effective April 22, 2002) (Formerly a Member Firm of Andersen Worldwide, SC) Taipei, Taiwan Republic of China
February 11, 2003
F-2 (HK) 01141/017/20-F/ase.inc.20f.2002.doc

ADVANCED SEMICONDUCTOR ENGINEERING, INC. AND SUBSIDIARIES
CONSOLIDATED BALANCE SHEETS (In Thousands, Except Share Data)
December 31,
2001 2002
NT$ NT$ US$
ASSETS CURRENT ASSETS Cash and cash equivalents (Note 2)....................................... 11,770,729 10,381,924 299,191Short-term investments (Notes 2 and 4)................................ 4,601,172 2,038,020 58,733Notes receivable .................................................................... 105,185 112,667 3,247Accounts receivable—net (Note 5) ....................................... 7,020,964 8,885,879 256,077Inventories (Notes 2 and 6) ................................................... 2,768,436 3,131,652 90,249Deferred income tax assets—net (Notes 2 and 18) ............... 873,008 1,084,441 31,252Pledged time deposit (Note 20) ............................................. 140,949 428,743 12,355Prepayments and other .......................................................... 801,161 968,433 27,909Sinking fund (Note 13).......................................................... 1,568,057 — —Total current assets................................................................ 29,649,661 27,031,759 779,013LONG-TERM INVESTMENTS (Notes 2, 3, 7, 10 and
20)...................................................................................... 9,530,398 6,566,734 189,243PROPERTIES (Notes 2, 8, 14 and 20) Cost
Land and land improvements ............................................ 3,877,876 3,870,967 111,555Buildings and improvements ............................................. 14,640,855 16,656,394 480,011Machinery and equipment ................................................. 66,986,146 72,203,572 2,080,795Transportation equipment.................................................. 107,927 104,225 3,004Furniture and fixtures ........................................................ 1,387,583 1,579,785 45,527Leased assets and leasehold improvements ....................... 584,163 855,487 24,654Long-term land leasehold rights ........................................ 62,600 62,206 1,793Total cost ........................................................................... 87,647,150 95,332,636 2,747,339
Accumulated depreciation..................................................... (31,751,538) (39,709,319) (1,144,361) 55,895,612 55,623,317 1,602,978Construction in progress........................................................ 1,728,587 1,683,387 48,512Machinery in transit and prepayments .................................. 2,930,886 5,782,166 166,633Net properties ........................................................................ 60,555,085 63,088,870 1,818,123OTHER ASSETS (Notes 2, 9 and 20)................................... 1,342,269 2,640,187 76,086CONSOLIDATED DEBITS (Notes 2 and 10)...................... 5,248,919 5,541,808 159,706TOTAL ASSETS .................................................................. 106,326,332 104,869,358 3,022,171
The accompanying notes are an integral part of the financial statements.
F-3 (HK) 01141/017/20-F/ase.inc.20f.2002.doc

ADVANCED SEMICONDUCTOR ENGINEERING, INC. AND SUBSIDIARIES
CONSOLIDATED BALANCE SHEETS – (Continued) (In Thousands, Except Share Data)
December 31,
2001 2002
NT$ NT$ US$
LIABILITIES AND SHAREHOLDERS’ EQUITY CURRENT LIABILITIES Short-term borrowings (Notes 10 and 20) ...................................... 3,456,149 3,903,994 112,507Commercial paper and bank acceptances payable (Note 12) ......... 3,444,314 2,384,577 68,720Accounts and notes payable ........................................................... 2,968,779 4,047,171 116,633Payable for fixed assets .................................................................. 1,928,469 4,494,828 129,534Income tax payable......................................................................... 244,618 172,453 4,970Current portion of long-term bonds payable (Note 13) .................. 3,090,345 — —Current portion of long-term debts (Notes 14 and 20) ................... 3,175,883 6,202,423 178,744Current portion of long-term payable for investments (Note
25)............................................................................................... 816,433 962,758 27,745Accrued expenses ........................................................................... 1,631,642 1,839,423 53,009Other............................................................................................... 512,295 382,349 11,019Total current liabilities ................................................................... 21,268,927 24,389,976 702,881LONG-TERM BONDS PAYABLE (Note 13) .............................. 4,778,291 5,179,793 149,273LONG-TERM DEBTS (Notes 14 and 20) ..................................... 23,101,135 23,009,563 663,100LONG-TERM PAYABLE FOR INVESTMENTS (Note 25) ....... 2,794,861 2,364,360 68,137ACCRUED PENSION COST (Notes 2 and 15) ............................ 294,438 416,671 12,008Total liabilities................................................................................ 52,237,652 55,360,363 1,595,399COMMITMENTS AND CONTINGENCIES (Note 21) MINORITY INTEREST IN CONSOLIDATED
SUBSIDIARIES ......................................................................... 12,142,359 10,078,329 290,441SHAREHOLDERS’ EQUITY (Notes 2, 3 and 16) Capital stock—NT$10 par values .................................................. 32,548,000 32,548,000 937,983
Authorized—4,150,000,000 shares in 2001 and 4,550,000,000 shares in 2002
Issued—3,254,800,000 shares in 2001 and 2002 Capital surplus
Capital in excess of par value ................................................... 3,171,933 3,171,933 91,410Net gain on disposal of properties ............................................ 23,109 — —Adjustment of equity in subsidiary due to change in
percentage of ownership ....................................................... 3,656,472 3,753,594 108,173Total capital surplus.................................................................. 6,851,514 6,925,527 199,583
Retained earnings ........................................................................... 1,015,654 1,173,564 33,821Unrealized loss on long-term investments in shares of stock......... (442,246) (423,620) (12,208)Cumulative translation adjustments 1,973,399 1,847,021 53,228Treasury stock ................................................................................ — (2,639,826) (76,076)Total shareholders’ equity .............................................................. 41,946,321 39,430,666 1,136,331TOTAL LIABILITIES AND SHAREHOLDERS’ EQUITY ........ 106,326,332 104,869,358 3,022,171
The accompanying notes are an integral part of the financial statements.
F-4 (HK) 01141/017/20-F/ase.inc.20f.2002.doc

ADVANCED SEMICONDUCTOR ENGINEERING, INC. AND SUBSIDIARIES
CONSOLIDATED STATEMENTS OF INCOME (In Thousands, Except Per Share and ADS Data)
Year Ended December 31,
2000 2001 2002
NT$ NT$ NT$ US$
NET REVENUES (Note 24) Packaging ................................................................... 38,028,799 28,898,185 35,515,397 1,023,498 Testing ........................................................................ 12,768,361 9,459,275 10,060,635 289,932 Other ........................................................................... 96,217 10,366 10,806 311 Subtotal....................................................................... 50,893,377 38,367,826 45,586,838 1,313,741 COST OF REVENUES Packaging ................................................................... 28,011,934 24,272,336 29,260,015 843,228 Testing ........................................................................ 7,473,964 8,676,475 9,219,424 265,689 Other ........................................................................... 81,380 8,203 12,831 370 Subtotal....................................................................... 35,567,278 32,957,014 38,492,270 1,109,287 GROSS PROFIT ........................................................ 15,326,099 5,410,812 7,094,568 204,454 OPERATING EXPENSES Selling......................................................................... 1,020,451 877,858 909,439 26,208 General and administrative (Notes 8 and 10) ............. 3,166,006 3,490,507 4,821,385 138,945 Research and development ......................................... 1,262,516 1,504,536 2,048,973 59,048 Total operating expenses ............................................ 5,448,973 5,872,901 7,779,797 224,201 INCOME (LOSS) FROM OPERATIONS................. 9,877,126 (462,089) (685,229) (19,747)NON-OPERATING INCOME Interest (Notes 2, 8, and 22)........................................ 554,180 503,603 392,593 11,314 Gain on sales of investments ...................................... 91,666 50,666 — — Investment income under equity method (Notes 2
and 7) ...................................................................... 69,915 — — — Foreign exchange gain—net (Notes 2 and 22) ........... 302,745 247,498 — — Other ........................................................................... 198,518 466,787 582,840 16,796 Total non-operating income........................................ 1,217,024 1,268,554 975,433 28,110 NON-OPERATING EXPENSES Interest (Notes 2, 8 and 22)......................................... 2,092,238 2,242,879 1,971,227 56,808 Investment loss under equity method (Notes 2 and
7) ............................................................................. 237,152 1,246,836 410,348 11,826 Foreign exchange loss—net (Notes 2 and 22) ............ — — 397,874 11,466 Other ........................................................................... 361,200 302,249 220,460 6,353 Total non-operating expenses ..................................... 2,690,590 3,791,964 2,999,909 86,453 INCOME (LOSS) BEFORE INCOME TAX
AND MINORITY INTEREST AND EXTRAORDINARY LOSS ................................... 8,403,560 (2,985,499) (2,709,705) (78,090)
INCOME TAX BENEFIT (EXPENSE) (Notes 2 and 18) .................................................................... (1,065,768) 199,160 1,140,324 32,863
INCOME (LOSS) BEFORE MINORITY INTEREST AND EXTRAORDINARY LOSS ...... 7,337,792 (2,786,339) (1,569,381) (45,227)
The accompanying notes are an integral part of the financial statements.
F-5 (HK) 01141/017/20-F/ase.inc.20f.2002.doc

ADVANCED SEMICONDUCTOR ENGINEERING, INC. AND SUBSIDIARIES
CONSOLIDATED STATEMENTS OF INCOME – (Continued) (In Thousands, Except Per Share and ADS Data)
Year Ended December 31,
2000 2001 2002
NT$ NT$ NT$ US$
EXTRAORDINARY LOSS (net of tax benefit of $48,188 in 2001 and $11,538 (US$333) in 2002) (Note 13)....................................................
— (144,565) (34,613) (997)MINORITY INTEREST IN NET (INCOME)
LOSS OF SUBSIDIARIES.................................. (1,500,643) 788,685 1,733,029 49,943NET INCOME (LOSS) ........................................... 5,837,149 (2,142,219) 129,035 3,719EARNINGS (LOSS) PER SHARE (Notes 2
and 19) Based on weighted average number of
outstanding shares of 3,090,678,225 in 2002, 3,254,800,000 in 2001 and 2,677,602,508 in 2000 Basic
Before income tax Income (Loss) before extraordinary loss......... 2.59 (0.71) (0.26) (0.01) Extraordinary loss ........................................... — (0.06) (0.01) (0.00) Net income (loss) ............................................ 2.59 (0.73) (0.27) (0.01) After income tax Income (Loss) before extraordinary loss......... 2.18 (0.61) 0.05 0.00 Extraordinary loss ........................................... — (0.05) (0.01) (0.00) Net income (loss) ............................................ 2.18 (0.66) 0.04 0.00
Diluted Before income tax Income (Loss) before extraordinary loss......... 2.54 (0.71) (0.26) (0.01) Extraordinary loss ........................................... — (0.06) (0.01) (0.00) Net income (loss) ............................................ 2.54 (0.77) (0.27) (0.01) After income tax Income (Loss) before extraordinary loss......... 2.13 (0.61) 0.05 0.00 Extraordinary loss ........................................... — (0.05) (0.01) (0.00) Net income (loss) ............................................ 2.13 (0.66) 0.04 0.00
Based on weighted average number of outstanding shares after giving retroactive adjustment to 2001 stock dividends Basic
Before income tax ........................................... 2.21 After income tax.............................................. 1.84
Diluted Before income tax ........................................... 2.17 After income tax.............................................. 1.80
The accompanying notes are an integral part of the financial statements.
F-6 (HK) 01141/017/20-F/ase.inc.20f.2002.doc

ADVANCED SEMICONDUCTOR ENGINEERING, INC. AND SUBSIDIARIES
CONSOLIDATED STATEMENTS OF INCOME – (Continued) (In Thousands, Except Per Share and ADS Data)
Year Ended December 31,
2000 2001 2002
NT$ NT$ NT$ US$
EARNINGS (LOSS) PER EQUIVALENT ADS (Notes 2 and 19)
Based on weighted average number of outstanding shares of 618,135,645 in 2002, 650,960,000 in 2001 and 535,520,502 in 2000 Basic
Before income tax Income (loss) before extraordinary loss........................... 12.95 (3.54) (1.29) (0.04)Extraordinary loss............................................................ — (0.30) (0.07) (0.00)Net income (loss)............................................................. 12.95 (3.84) (1.36) (0.04)After income tax Income (loss) before extraordinary loss........................... 10.90 (3.07) 0.26 0.01 Extraordinary loss............................................................ — (0.22) (0.05) (0.00)Net income (loss)............................................................. 10.90 (3.29) 0.21 0.01
Diluted Before income tax Income (loss) before extraordinary loss........................... 12.70 (3.54) (1.29) (0.04)Extraordinary loss............................................................ — (0.30) (0.07) (0.00)Net income (loss)............................................................. 12.64 (3.67) (1.65) (0.04)After income tax Income (loss) before extraordinary loss........................... 10.65 (3.07) 0.26 0.01 Extraordinary loss............................................................ — (0.22) (0.05) (0.00)Net income (loss)............................................................. 10.65 (3.29) 0.21 0.01
Based on weighted average number of outstanding shares after giving retroactive adjustment to 2001 stock dividends Basic
Before income tax............................................................ 11.05 After income tax .............................................................. 9.22
Diluted Before income tax............................................................ 10.85 After income tax .............................................................. 9.01
The accompanying notes are an integral part of the financial statements.
F-7 (HK) 01141/017/20-F/ase.inc.20f.2002.doc
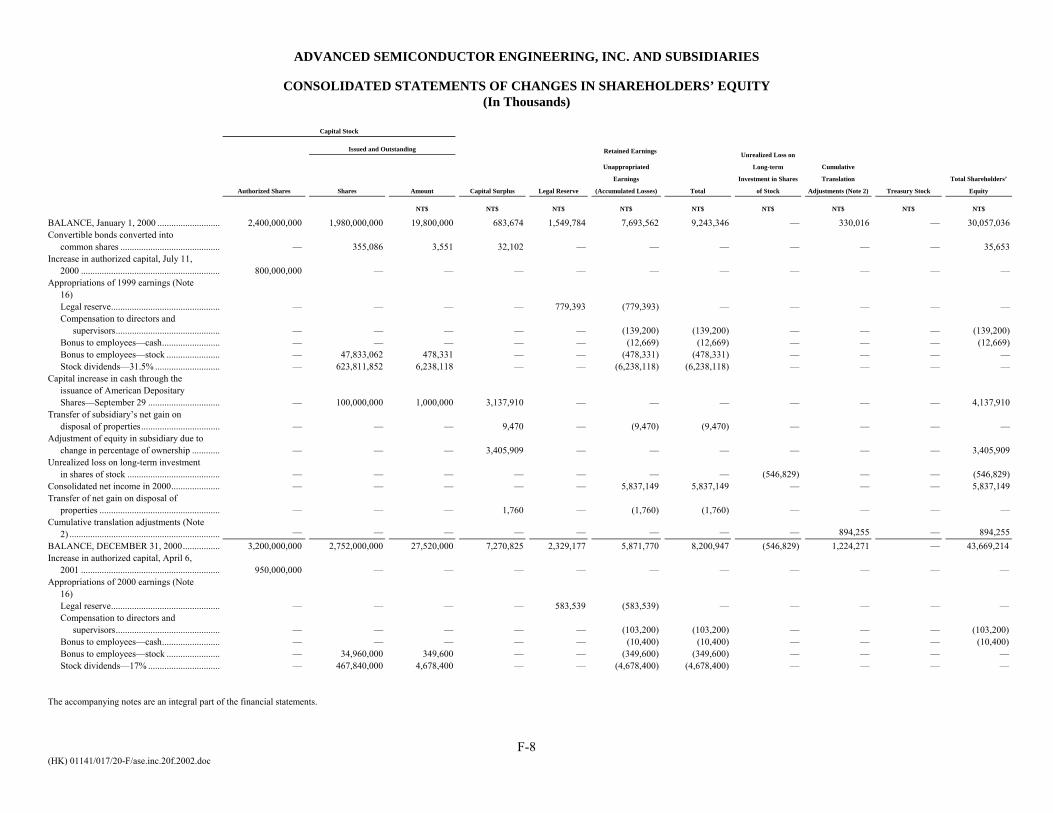
ADVANCED SEMICONDUCTOR ENGINEERING, INC. AND SUBSIDIARIES
CONSOLIDATED STATEMENTS OF CHANGES IN SHAREHOLDERS’ EQUITY (In Thousands)
Capital Stock
Issued and Outstanding Retained Earnings
Authorized Shares Shares Capital Surplus Legal Reserve
Unappropriated
Earnings
(Accumulated Losses) Total
Unrealized Loss on
Long-term
Investment in Shares
of Stock
Cumulative
Translation
Adjustments (Note 2) Treasury Stock
NT$ NT$ NT$ NT$ NT$ NT$ NT$
BALANCE, January 1, 2000 ........................... 2,400,000,000 19,800,000 683,674 1,549,784 7,693,562 — 330,016 — 30,057,036 Convertible bonds converted into
common shares ........................................... — 355,086 3,551 — — 653 Increase in authorized capital, July 11,
2000 ............................................................ — — — —Appropriations of 1999 earnings (Note
16)
Total Shareholders’
Equity Amount
— — — — 35,
— — — — —
— — — — —
— — — — — — — —
— — — —
— — — —
— — — —
Consolidated net income in 2000.....................
— — — —
NT$ NT$
1,980,000,000 9,243,346
32,102
800,000,000 —
Legal reserve............................................... — — — — 779,393 (779,393)Compensation to directors and
supervisors............................................. — — — — — (139,200) (139,200) — — — (139,200) Bonus to employees—cash......................... — — — — — (12,669) (12,669) — — — (12,669) Bonus to employees—stock ....................... — 47,833,062 478,331 — — (478,331) (478,331)Stock dividends—31.5% ............................ — 623,811,852 6,238,118 — — (6,238,118) (6,238,118)
Capital increase in cash through the issuance of American Depositary Shares—September 29 ............................... — 100,000,000 1,000,000 3,137,910 — — 4,137,910
Transfer of subsidiary’s net gain on disposal of properties.................................. — — — 9,470 — (9,470) (9,470)
Adjustment of equity in subsidiary due to change in percentage of ownership ............ — — — 3,405,909 — — 3,405,909
Unrealized loss on long-term investment in shares of stock ........................................ — — — — — — — (546,829) — — (546,829)
— — — — — 5,837,149 5,837,149 — — — 5,837,149 Transfer of net gain on disposal of
properties .................................................... — — — 1,760 — (1,760) (1,760)Cumulative translation adjustments (Note
2) ................................................................. — — — — — — — — 894,255 — 894,255 BALANCE, DECEMBER 31, 2000................ 3,200,000,000
— — — — —
— — — — —
2,752,000,000 27,520,000 7,270,825 2,329,177 5,871,770 8,200,947 (546,829) 1,224,271 — 43,669,214 Increase in authorized capital, April 6,
2001 ............................................................ 950,000,000 — — — — —Appropriations of 2000 earnings (Note
16) Legal reserve............................................... — — — — 583,539 (583,539)Compensation to directors and
supervisors............................................. — — — — — (103,200) (103,200) — — — (103,200) Bonus to employees—cash......................... — — — — — (10,400) (10,400) — — — (10,400) Bonus to employees—stock ....................... — 34,960,000 349,600 — — (349,600) (349,600) — — — — Stock dividends—17% ............................... — 467,840,000 4,678,400 — — (4,678,400) (4,678,400) — — — —
The accompanying notes are an integral part of the financial statements.
F-8 (HK) 01141/017/20-F/ase.inc.20f.2002.doc

F-9 (HK) 01141/017/20-F/ase.inc.20f.2002.doc
ADVANCED SEMICONDUCTOR ENGINEERING, INC. AND SUBSIDIARIES
CONSOLIDATED STATEMENTS OF CHANGES IN SHAREHOLDERS’ EQUITY – (Continued) (In Thousands)
Capital Stock
Issued and Outstanding Retained Earnings
Authorized Shares Shares Amount Capital Surplus Legal Reserve
Unappropriated
Earnings
(Accumulated Losses) Total
Unrealized Loss on
Long-term
Investment in Shares
of Stock
Cumulative
Translation
Adjustments (Note 2) Treasury Stock
Total Shareholders’
Equity
NT$ NT$ NT$ NT$ NT$ NT$ NT$ NT$ NT$
Adjustment of equity in subsidiary due to change in percentage of ownership.................. — — — (419,311) — 98,526 98,526 — — — (320,785)Reversal of unrealized loss on long-term investment in shares of stock ........................... — — — — — — — 104,583 — — 104,583Consolidated net loss in 2001 .......................... — — — — — (2,142,219) (2,142,219) — — — (2,142,219)Cumulative translation adjustments (Note 2) .. — — — — — — — — 749,128 — 749,128 BALANCE, DECEMBER 31, 2001................ 4,150,000,000
3,254,800,000 32,548,000 6,851,514 2,912,716 (1,897,062) 1,015,654 (442,246) 1,973,399 — 41,946,321Increase in authorized capital, June 21, 2002 .. 400,000,000 — — — — — — — — — — Transfer of ASE Inc. shares held by subsidiaries as treasury stock ........................... — — — — — — — — — (2,639,826) (2,639,826)Reversal of prior years’ gain on disposal of properties.......................................................... — — — (23,109) 2,310 20,799 23,109 — — — —Legal reserve offset against deficit .................. — — — — (1,876,264) 1,876,264 — — — — —Reversal of unrealized loss on long-term investment in share of stock............................. — — — — — — — 18,626 — — 18,626Adjustment of equity in subsidiary due to change in percentage of ownership.................. — — — 104,474 — (1,586) (1,586) — — — 102,888Adjustment of equity in subsidiary due to reversal of prior years’ gain on disposal of properties.......................................................... — — — (7,352) — 7,352 7,352 — — — —Consolidated net income in 2002..................... — — — — — 129,035 129,035 — — — 129,035Cumulative translation adjustments (Note 2) .. — — — — — — — — (126,378) — (126,378)
BALANCE, DECEMBER 31, 2002................ 4,550,000,000 3,254,800,000 32,548,000 6,925,527 1,038,762 134,802 1,173,564 (423,620) 1,847,021 (2,639,826) 39,430,666
The accompanying notes are an integral part of the financial statements.

F-10 (HK) 01141/017/20-F/ase.inc.20f.2002.doc
ADVANCED SEMICONDUCTOR ENGINEERING, INC. AND SUBSIDIARIES
CONSOLIDATED STATEMENTS OF CHANGES IN SHAREHOLDERS’ EQUITY – (Continued) (In Thousands)
Capital Stock
Issued and Outstanding Retained Earnings
Authorized Shares Shares Amount Capital Surplus Legal Reserve
Unappropriated
Earnings
(Accumulated Losses) Total
Unrealized Loss on
Long-term
Investment in Shares
of Stock
Cumulative
Translation
Adjustments (Note 2) Treasury Stock
Total Shareholders’
Equity
— — — — —
— — — — — — — — —
— — — —
NT$ NT$ NT$ NT$ NT$ NT$ NT$ NT$ NT$
BALANCE, JANUARY 1, 2002..................... 4,150,000,000 3,254,800,000 937,983 197,450 83,940 (54,670) 29,270 (12,745) 56,870 — 1,208,828 Increase in authorized capital, June 21,
2002 ............................................................ 400,000,000 — — — — —Transfer of ASE Inc. shares held by
subsidiaries as treasury stock...................... — — — — — — — — — (76,076) (76,076) Reversal of prior years’ gain on disposal
of properties ................................................ — — — (666) 67 599 666Legal reserve offset against deficit .................. — — — — (54,071) 54,071 Reversal of unrealized loss on long-term
investment in share of stock ....................... — — — — — — — 537 — — 537 Adjustment of equity in subsidiary due to
change in percentage of ownership ............ — — — 3,011 — (46) (46) — — — 2,965 Adjustment of equity in subsidiary due to
reversal of prior years’ gain on disposal of properties.................................. — — — (212) — 212 212
Consolidated net income in 2002..................... — — — — — 3,719 3,719 — — — 3,719Cumulative translation adjustments (Note
2) ................................................................. — — — — — — — — (3,642) — (3,642)
Balance, December 31, 2002 ........................... 4,550,000,000 3,254,800,000 937,983 199,583 29,936 3,885 33,821 (12,208) 53,228 (76,076) 1,136,331
The accompanying notes are an integral part of the financial statements.

ADVANCED SEMICONDUCTOR ENGINEERING, INC. AND SUBSIDIARIES
CONSOLIDATED STATEMENTS OF CASH FLOWS (In Thousands)
Year Ended December 31,
2000 2001 2002
NT$ NT$ NT$ US$
CASH FLOWS FROM OPERATING ACTIVITIES Net income (loss)...................................................................................... 5,837,149 (2,142,219) 129,035 3,719 Adjustments to reconcile net income (loss) to net cash provided by
operating activities: Minority interest in net income (loss) of subsidiaries ........................ 1,500,643 (788,685) (1,733,029) (49,943) Depreciation ........................................................................................ 8,127,561 10,633,197 11,841,331 341,249 Amortization........................................................................................ 466,238 494,088 444,995 12,824 Exchange (gain) loss on:
Long-term foreign bonds payable.................................................... 628,058 640,171 (69,321) (1,998) Long-term foreign investment payable............................................ 170,351 223,599 (34,926) (1,007)
Accrued interest on convertible bonds................................................ 812,931 872,575 576,437 16,612 Provision for doubtful accounts and sales allowance ......................... 155,458 80,629 85,823 2,473 Gain on sale of investments ................................................................ (91,666) (50,666) (101,314) (2,920) Loss on early redemption of foreign convertible bonds ..................... — 144,565 46,151 1,330 Investment loss under equity method ................................................. 167,237 1,246,836 410,348 11,826 Cash dividends received from long-term stock investments .............. — 33,196 — — Reversal of accrued interest from long-term investment payable ...... — — (145,238) (4,186) Impairment loss on fixed assets .......................................................... — — 1,225,555 35,317 Gain (loss) on disposal of properties .................................................. 19,298 26,884 15,668 452 Provision for loss on long-term bonds investments............................ 284,301 29,822 — — Loss from idle assets ........................................................................... — 111,109 78,120 2,251 Amortization of consolidated debits ................................................... 559,807 692,919 815,573 23,504 Deferred income taxes......................................................................... (226,898) (401,745) (1,130,358) (32,575) Other .................................................................................................... (16,441) (3,251) — — Changes in operating assets and liabilities
Notes receivable ............................................................................... (18,599) 114,456 (7,482) (216) Accounts receivable ......................................................................... (1,933,977) 1,939,341 (1,950,738) (56,217) Inventories........................................................................................ (796,636) 477,891 (363,216) (10,467) Prepayments and other ..................................................................... (486,108) 199,912 (231,154) (6,661) Notes and accounts payable ............................................................. 707,556 (891,130) 1,078,392 31,078 Income tax payable .......................................................................... 642,539 (856,346) (72,165) (2,080) Accrued expenses and other............................................................. 1,574,097 (821,272) 217,222 6,260 Accrued pension cost ....................................................................... 59,236 46,013 122,233 3,523
Effect of exchange rate changes............................................................... (682,197) (473,515) 65,858 1,898 Net cash provided by (used in) operating activities................................. 17,459,938 11,578,374 11,313,800 326,046 CASH FLOWS FROM INVESTING ACTIVITIES Acquisition of fixed assets ....................................................................... (30,063,640) (11,565,689) (12,657,920) (364,781) (Increase) decrease in short-term investments ......................................... (1,471,248) (2,913,644) 2,664,466 76,786 Decrease (increase) in pledged time deposits .......................................... 158,351 128,837 (287,794) (8,294) Payments for long-term stock investments .............................................. (2,026,047) (216,444) (49,716) (1,433) Increase in other assets ............................................................................. (787,246) (214,772) (831,279) (23,956) Proceeds from sales of:
Properties............................................................................................. 697,126 685,776 77,142 2,223 Bonds................................................................................................... — 195,320 — — Others .................................................................................................. 100,666 51,639 — —
Purchase of ASE Material Inc. shares...................................................... — — (10,000) (288) Purchase of ASE Test Limited shares ...................................................... — (1,202,185) (317,004) (9,136) Purchase of ISE Labs, Inc. shares ............................................................ — — (1,755,133) (50,580) Net cash provided by (used in) investing activities (33,392,038) (15,051,162) (13,167,238) (379,459)
The accompanying notes are an integral part of the financial statements.
F-11

ADVANCED SEMICONDUCTOR ENGINEERING, INC. AND SUBSIDIARIES
CONSOLIDATED STATEMENTS OF CASH FLOWS – (Continued) (In Thousands)
Year Ended December 31,
2000 2001
NT$ NT$ US$
CASH FLOWS FROM FINANCING ACTIVITIES Proceeds from (repayments of):
. 4,151,300 — — — Long-term debts .................................................................................. 1,013,796 9,746,636 1,161,489 33,472 Investment payable.............................................................................. (1,453,603) (803,833) (249,250) (7,183) Commercial papers and bank acceptances payable ............................ 2,578,212 (837,491) (1,739,263) (50,123)
Proceeds from short-term borrowings...................................................... 1,614,950 944,148 2,375,322 68,453 Decrease in payable for fixed assets......................................................... — (2,250,855) — — Contribution to a sinking fund for convertible bonds .............................. — (1,568,057) — — Early redemption of foreign convertible bonds ....................................... — (6,066,042) (1,674,053) (48,244) Increase in minority interest ..................................................................... 9,854,500 1,552,601 656,246 18,912 Compensation to directors and supervisors and bonus to employees...... (151,869) (113,600) — — Net cash provided by (used in) financing activities ................................. 17,607,286 603,507 530,491 15,288 EFFECT OF EXCHANGE RATE CHANGES....................................... 682,197 473,515 (65,858) (1,898) NET INCREASE (DECREASE) IN CASH AND CASH
EQUIVALENTS.................................................................................. 2,357,383 (2,395,766) (1,388,805) (40,023) CASH AND CASH EQUIVALENTS, BEGINNING OF YEAR .......... 11,809,112 14,166,495 11,770,729 339,214 CASH AND CASH EQUIVALENTS, END OF YEAR......................... 14,166,495 11,770,729 10,381,924 299,191 SUPPLEMENTAL INFORMATION Interest paid .............................................................................................. 1,217,052 1,557,887 1,248,726 35,986 Income tax paid ........................................................................................ 497,882 1,024,286 88,884 2,569 Cash paid for acquisition of fixed assets
Acquisition of fixed assets .................................................................. 31,463,451 11,565,689 15,749,807 453,884 Increase in payable .............................................................................. (1,399,811) — (2,566,359) (73,958) Increase in obligation under capital losses.......................................... — — (525,528) (15,145)
30,063,640 11,565,689 12,657,920 364,781 Cash received from capital increase through the issuance of
American Depositary Shares Net proceeds ........................................................................................ 4,137,910 Increase in payable .............................................................................. 13,390 Net cash inflow.................................................................................... 4,151,300
Cash paid for redemption of foreign convertible bonds Redemption price for foreign convertible bonds ................................ 6,066,042 3,242,110 93,433 Cash paid from sinking fund ............................................................... — (1,568,057) (45,189)
6,066,042 1,674,053 48,244 Non-cash flow investing and financing activities
Reclassification of the Company’s shares which are held by consolidated subsidiaries from long-term investment to treasury stock .................................................................................. 2,639,826 76,076
2002
NT$
Capital increase through the issuance of American Depositary Shares.............................................................................................
The accompanying notes are an integral part of the financial statements.
F-12

ADVANCED SEMICONDUCTOR ENGINEERING, INC. AND SUBSIDIARIES
NOTES TO CONSOLIDATED FINANCIAL STATEMENTS December 31, 2000, 2001 and 2002
(Amounts in Thousands, Unless Otherwise Stated)
1. History and Organization
Overview
Advanced Semiconductor Engineering, Inc. (the “Company”), a corporation incorporated under the laws of the Republic of China (the “ROC”), is an independent provider of semiconductor packaging and testing services. The Company’s common shares are traded on the Taiwan Stock Exchange under the symbol “2311”. Since September 2000, the Company’s common shares in the form of American depositary shares (“ADS”) have been traded on the New York Stock Exchange under the symbol “ASX”. The Company and its consolidated subsidiaries and affiliates are together referred to as the “ASE Group”.
Set forth is a brief overview of the Company’s organization structure and its equity stakes in its consolidated subsidiaries.
The Company has six wholly-owned subsidiaries:
ASE Holding Limited (incorporated in Bermuda in April 1990), which holds shares in ASE Group companies; •
•
•
•
•
•
•
•
•
•
•
•
ASE Marketing Services Ltd. (incorporated in Hong Kong in February 1991), which engages in trading;
ASE Investment Inc. (“ASE Investment”) (incorporated in the ROC in March 1996), which holds shares in ASE Group companies;
J&R Holding Limited (incorporated in Bermuda in May 1996), which holds shares in ASE Group companies;
ASE Capital Inc. (“ASE Capital”) (incorporated in the ROC in November 1997), which holds shares in ASE Group companies; and
ASE Southwest, Inc. (incorporated in the United States in August 1999), which engages in trading.
As of December 31, 2002, the Company also held:
98.8% equity stake in ASE Technologies, Inc. (incorporated in the ROC in June 1991), which is engaged in the research and development, manufacture and sales of computers and related accessories;
90.0% equity stake in ASE Network Inc. (incorporated in the ROC in January 2000), which is engaged in investing in Taiwan Fixed Network Co., Ltd.;
70.0% equity stake in ASE (Chung Li) Inc. (“ASE Chung Li”) (incorporated in the ROC in April 1999), which is engaged in the packaging and testing of semiconductors. In addition, ASE Test Limited has a 30.0% equity stake in ASE Chung Li; and
56.6% equity stake in ASE Material Inc. (“ASE Material”) (incorporated in the ROC in December 1997), which is engaged in the design and production of leadframes and substrates used in the packaging of semiconductors. In addition, ASE Test, Inc. has a 4.0% equity stake in ASE Material.
ASE Holding Limited has the following wholly-owned or majority-owned subsidiaries:
ASEP Realty Corporation (incorporated in the Philippines in December 1995), which holds real estate of ASE Holding Electronics (Philippines);
ASE Holding Electronics (Philippines)(incorporated in the Philippines in December 1995), which manufactures electronic products, components and semiconductors; and
F-13

70.0% equity stake in ASE Investment (Labuan) Inc. (incorporated in Malaysia in June 1999), which holds shares of ASE Korea Inc. In addition, ASE Test Limited has a 30.0% equity stake in ASE Investment (Labuan) Inc.
•
•
•
•
•
•
•
A portion of the share capital of the Philippine subsidiaries is held by certain Filipino individuals due to local requirements.
J&R Holding Limited has two subsidiaries:
100.0% equity stake of J&R Industrial Inc. (incorporated in the ROC in April 1999), which is mainly engaged in the leasing of substrate, packaging and testing equipment; and
39.3% equity stake of ASE Test Limited (“ASE Test”) (incorporated in Singapore in May 1996), which holds shares in ASE Group companies.
In addition, as of December 31, 2002, ASE Holding Limited held an 11.2% equity stake in ASE Test. The shares of ASE Test have been listed on the NASDAQ National Market in the United States since June 1996.
ASE Test has four majority-owned subsidiaries:
ASE Test, Inc. (incorporated in ROC in December 1987), which is engaged in the testing of semiconductors;
ASE Holding (Singapore) Pte. Ltd. (incorporated in Singapore in December 1994), which holds shares in ASE Group companies;
ASE Test Holdings, Limited (“ASE Test Holdings”) (incorporated in Cayman Islands in April 1999), which mainly holds shares in ASE Group companies; and
ASE Test Finance Limited (incorporated in Mauritius in June 1999), which is engaged in financing activities.
ASE Test, Inc. has a wholly-owned subsidiary, ASE Test (USA) Inc. (incorporated in the United States in October 1995), which provides after-sales services relating to tested semiconductors.
ASE Holding (Singapore) Pte. Ltd. has a wholly-owned subsidiary, ASE Electronics (M) Sdn, Bhd. (“ASE Test Malaysia”) (incorporated in Malaysia in February 1991), which is engaged in the packaging and testing of semiconductors.
ASE Test Holdings has a wholly-owned subsidiary, ISE Labs, Inc. (“ISE Labs”) (incorporated in California, U.S.A. in November 1983), which is engaged in the front-end engineering testing and final testing of semiconductors.
ASE Chung Li has a wholly-owned subsidiary, Omniquest Industrial Limited (“Omniquest”) (incorporated in the British Virgin Islands in June 2001), which holds shares in ASE (Shanghai) Inc.
Omniquest has a wholly-owned subsidiary, ASE (Shanghai) Inc. (incorporated in the People’s Republic of China in 2002), which is currently in the pre-operating phase.
ASE Investment (Labuan) Inc. has a wholly-owned subsidiary, ASE Korea Inc. (“ASE Korea”) (incorporated in the Republic of Korea in 1999), which is engaged in the packaging and testing of semiconductors.
2. Significant Accounting Policies
The accompanying financial statements have been prepared in conformity with generally accepted accounting principles in the ROC (“ROC GAAP”). Significant accounting policies are summarized as follows:
Presentation of Consolidated Financial Statements
The Company prepares its consolidated financial statements using ROC GAAP with reconciliation to generally accepted accounting principles of the United States (“US GAAP”) (see Note 26). The accompanying consolidated balance sheets are presented for the two years ended as at December 31, 2001 and 2002, and the accompanying consolidated statements of income, changes in shareholders’ equity and cash flows are presented for the three years ended December 31, 2000, 2001 and 2002.
F-14

Unless otherwise stated, amounts presented are in thousands of NT dollars (NT$).
Consolidation
The consolidated financial statements include the accounts of the Company and all of the aforementioned companies.
All intercompany accounts and transactions have been eliminated and minority shareholders’ interests in the equity and earnings of the subsidiaries are presented separately in the consolidated financial statements. The differences between the costs of investments and the proportionate equity in each subsidiary when the stocks were acquired are recorded as consolidated credits or debits and are amortized on the straight-line method over ten years.
Use of Estimates
The preparation of consolidated financial statements in conformity with ROC GAAP and US GAAP requires management to make estimates and judgments that affect the recorded amounts of assets, liabilities, revenues and expenses of the Company. The Company continually evaluates these estimates, including those related to allowances for doubtful accounts, inventories, useful lives of properties, consolidated debits, income tax valuation allowances, pension plans and the fair value of financial instruments. The Company bases its estimates on historical experience and other assumptions, which it believes to be reasonable under the circumstances. Actual results may differ from these estimates under different assumptions and conditions.
Cash and Cash Equivalents
The Company considers all highly liquid investments within an original maturity from date of purchase of three months or less to be cash equivalents.
Short-term Investments
Short-term investments are carried at cost less allowance for decline in market value.
Allowance for Doubtful Accounts
Allowance for doubtful accounts is provided based on evaluation of the collectibility of receivables.
The total amount of the provision is determined based on the identification of customers that the Company determines to have a higher credit risk based on overdue accounts, past collection difficulties or their overall financial condition. An estimation is made based on the extent to which the customer will be able to meet its financial obligations to the Company and a provision is recorded to reduce the accounts receivable balance to the amount the Company reasonably believes will be collected. For all other customers, an allowance is equal to a percentage of the aggregate accounts receivable based on history of collection. An allowance for these other customers averages between 3% and 4%, on a consolidated basis, of the Company’s accounts receivable.
Inventories
Inventories are stated at the lower of weighted average cost or market value. Unbilled processing charges incurred are included in finished goods and work in process and are stated at actual cost. Market value represents net realizable value for finished goods and work in process, and replacement costs for raw materials, supplies and spare parts.
Materials received from customers for processing, mainly semiconductor wafers, are excluded from inventories as title and risk of loss remains with the customers.
Long-term Investments in Shares of Stock
Long-term investments of which the Company owns at least 20% of the outstanding voting shares and where the Company exercises significant influence over the investee company’s operations are accounted for by the equity method. Under the equity method, the investments are initially carried at cost and subsequently adjusted for the Company’s proportionate share in the net earnings or losses of the investee companies. Such proportionate share in the earnings or losses are recognized as investment income or losses while any cash dividends declared are reflected as a reduction in the carrying value of the investments. The goodwill
F-15

representing the excess of the investment cost over the Company’s proportionate equity in the fair value of the net assets of the investees at the time of investments or at the time the equity method of accounting is first applied to a particular investment, is amortized on the straight-line method over ten years. Changes in the Company’s ownership percentage of investees under the equity method are accounted for as adjustments to long-term investments and capital surplus.
Other long-term investments (including the Company’s common shares prior to January 1, 2002) in shares of stock are carried at cost or lower of cost or market value. Allowances for decline in market value and unrealized loss on long-term investments in shares of stock (a deduction account in shareholders’ equity) are made when the market value of an investment is lower than its carrying value. If decline in value of the stock investment is determined to be other than temporary, such decline in value is charged against current income. Cash dividends are recognized as income on the declaration date.
Unrealized profits or losses arising from transactions with equity investees or between equity investees are offset against investment income or loss from long-term investments, based on the percentage of ownership.
Effective January 1, 2002, the Company adopted ROC SFAS No. 30, “Accounting for Treasury Stock”. This adoption of ROC SFAS No. 30 resulted in the Company’s shares that are held by consolidated subsidiaries being reflected as treasury stock under shareholders’ equity. The capital gain (loss) from sales of treasury stock is added to or deducted from capital surplus. The above-mentioned unrealized loss on long-term investments in shares of stock as recorded from the decline in market value of the Company’s shares held by its consolidated subsidiaries will be recognized as realized loss in the period when such shares are disposed of after January 1, 2002.
Properties
Properties, except for leased equipment, are stated at cost. Equipment held under capital leases are recorded as an asset and an obligation at an amount equal to the lower of: (i) the present value at the beginning of the lease term of the minimum lease payments during the lease term (including the payment called for under any bargain purchase option); or (ii) fair value of the leased equipment at the inception of the lease. Machinery in transit, construction in progress and prepayments under construction are stated at cost. These include the cost of machinery, construction, down payments and other direct costs plus interest charges attributable to the borrowings used to finance the acquisitions of these assets. Major renewals and improvements are capitalized, while maintenance and repairs are expensed currently.
Depreciation is computed using the straight-line method over estimated service lives which range as follows: long-term land leasehold rights, 60 years (lease period); buildings and improvements, 3 to 55 years; machinery and equipment, 3 to 8 years; furniture and fixtures, 2 to 15 years; transportation equipment, 3 to 8 years; and leased assets and leasehold improvements, 3 to 5 years. In the event that an asset depreciated to its residual value is deemed to have a continual useful life, the residual value is depreciated over the remaining life, not to exceed 2 years.
Impairment losses on properties are recorded as an operating expense and included in general and administrative expenses.
When properties are retired or disposed of, their costs and accumulated depreciation are removed from the accounts and any gain or loss is credited or charged to income. Prior to January 1, 2001, the gain, after deducting applicable income tax, was reclassified to capital surplus at the end of the year.
Deferred Charges
Deferred charges are amortized using the straight-line method as follows: tools, 2 years; license fees, 2 years; telecommunications, electrical and computer network systems, 5 years; and others, 2 to 5 years.
Consolidated Debits
The consolidated debits as shown in the balance sheet represent goodwill arising from acquisitions or investments in the consolidated subsidiaries and are amortized on the straight-line method over 10 years.
F-16

Pension Cost
Pension cost is recorded based on actuarial calculations. Provisions for pension costs are accrued based on actuarially determined amounts which include service costs, interest, amortization of unrecognized net obligation and expected return on pension assets.
Convertible Bonds
Conversion of convertible bonds into common shares is accounted for by the book value method. Under this method, unamortized bond issuance cost, accrued interest no longer payable and the carrying value of the bond are written off. In addition, common shares are recorded at the par value of the shares issued and the excess is recorded as capital surplus.
Revenue Recognition
Revenues from semiconductor packaging services that the Company provides are recognized upon shipment. Revenues from semiconductor testing services that the Company provides are recognized upon completion of the services. The Company does not take ownership of: (i) bare semiconductor wafers received from customers that the Company packages into finished semiconductors, and (ii) packaged semiconductors received from customers that the Company tests as to whether they meet certain performance specifications. The title and risk of loss remains with the customer for those bare semiconductors and/or packaged semiconductors. Accordingly, the cost of customer-supplied semiconductors materials is not included in the accompanying consolidated financial statements. Other criteria that the Company uses to determine when to recognize revenue are: (i) existence of persuasive evidence of the services provided, (ii) the selling price is fixed or determinable and (iii) collectibility is reasonably assured. The Company does not provide warranties to its customers except only in cases of defects in the packaging services provided and deficiencies in testing services provided. An appropriate sales allowance, based on historical experience, is recognized in the period the sale is recognized.
Income Tax
Tax effects of deductible temporary differences, unused tax credits and operating loss carryforwards are recognized as deferred income tax assets, while those taxable temporary differences are recognized as deferred income tax liabilities. A valuation allowance is provided for deferred income tax assets based on the estimated realizability.
Adjustments of prior years’ income tax are added to or deducted from the current year’s tax provision.
Income taxes on undistributed earnings (10%) generated in 1998 and onwards for consolidated entities in the ROC are recorded as expense in the following year when the shareholders have resolved that the earnings shall be retained.
Foreign Currency Transactions and Translation of Foreign-currency Financial Statements
The Company and its subsidiaries maintain their accounts in the currency of their respective countries of incorporation (local currencies) and functional currencies.
Foreign currency transactions, other than foreign currency forward exchange contracts, are recorded in the local currencies at the rates of exchange in effect when the transactions occur. Gains or losses resulting from the application of different foreign exchange rates when foreign- currency assets and liabilities are settled, are credited or charged to income in the year of settlement. Year-end balances of foreign currency assets and liabilities are restated based on prevailing exchange rates and the resulting differences are credited or charged to income.
The financial statements of the foreign subsidiaries are translated into NT dollars at the following rates: Assets and liabilities, current rate; and income and expenses, average exchange rate during the year. The net resulting translation adjustment is reported as a separate component of shareholders’ equity.
Derivative Financial Instruments
Premiums or discounts on foreign currency forward exchange contracts which hedge foreign currency assets or liabilities arising from the difference between the forward rate and the spot rate at the date of each contract are deferred and amortized over the contract period. At year end, the balances of the forward exchange receivables or payables are restated based on prevailing exchange rates and the resulting gain or loss is credited or charged to income. Any exchange gain or loss when the contract is settled is also credited or
F-17

charged to income. The difference between receivable and payable balances arising from forward exchange contracts is accounted for as either current asset or current liability.
Written option contracts to purchase foreign currencies and cross currency swap contracts entered into for hedging purposes are not recorded as assets or liabilities on the contract dates. Gains or losses upon settlement are credited or charged to income. Amounts received or paid are amortized over each contract period. At year end, the outstanding written option contracts and cross currency swap contracts are marked to market with charges to current income.
Interest rate swap contracts to limit the impact of the variable interest rate of certain long-term debt are not recorded as assets or liabilities on the contract date. The differential between fixed and variable rates to be paid or received on swaps is accrued as interest rates change in accordance with the contracts and is included in current interest income or expense.
Earnings Per Share (“EPS”) and Earnings Per Equivalent ADS
Basic earnings per share is calculated by dividing net income by the weighted average number of shares outstanding during the period, adjusted retroactively for stock dividends and stock bonuses issued subsequently. Diluted earnings per share is calculated using the weighted average number of shares and dilutive equivalent shares outstanding during the period. Dilutive equivalent shares consist primarily of stock options and convertible bonds and are excluded from the calculation if they are anti-dilutive. Earnings per equivalent American depositary shares (“ADS”) are calculated by multiplying earnings per share by five (one ADS represents five common shares).
Effective January 1, 2002, the Company adopted ROC SFAS No. 30, and thus, the denominator used in calculating the EPS is adjusted to reflect the fact that the shares of the Company held by the consolidated subsidiaries are not considered to be outstanding for such purposes.
US Dollar Amount
The Company prepares its consolidated financial statements in NT dollars. Translations into US dollars for 2002 financial statements are included solely for the convenience of the reader, and are based on the US Federal Reserve Bank of New York noon buying rate of NT$34.70 to US$1.00 in effect as at December 31, 2002. The convenience translations should not be construed as representations that the NT dollar amounts have been, could have been, or could in the future be, converted into US dollars at this or any other rate of exchange.
3. Change in Accounting Policies and the Effects
Effective January 1, 2002, the Company adopted ROC SFAS No. 30. As a result of the adoption of ROC SFAS No. 30, shares of the Company held by consolidated subsidiaries were reclassified from long-term investments to treasury stock under shareholders’ equity. The adoption of ROC SFAS No. 30 resulted in the decrease in the balance of long-term investments by NT$2,649,484 and increase in the balance of treasury stock by NT$2,639,826 and decrease in the balance of minority interest in consolidated subsidiaries by NT$9,658 in the consolidated balance sheet as of December 31, 2002. However, there was no effect on consolidated net income for the year ended December 31, 2002.
4. Short-term Investments
December 31,
2001 2002
NT$ NT$ US$
Mutual funds ........................................................................... 4,583,958 2,025,957 58,385 Stocks...................................................................................... 5,337 5,305 153 Convertible bonds ................................................................... 11,877 10,000 288 4,601,172 2,041,262 58,826 Allowance for loss .................................................................. — (3,242) (93) 4,601,172 2,038,020 58,733
F-18

5. Accounts Receivable—Net
December 31,
2001 2002
NT$ NT$ US$
Accounts receivable................................................................. 7,361,066 9,229,641 265,984 Allowance for doubtful accounts (Note 2)............................... (286,476) (300,713) (8,666) Allowance for sales allowances ............................................... (53,626) (43,049) (1,241) 7,020,964 8,885,879 256,077
The change in allowance for doubtful accounts and sales allowances are as follows:
Doubtful Accounts
Sales Allowances
NT$ NT$
Balance, beginning of 2000 .................................................................................. 187,162 47,092 Additions............................................................................................................... 148,834 6,624 Deductions ............................................................................................................ (21,753) (15,040) Balance, end of 2000............................................................................................. 314,243 38,676 Additions............................................................................................................... 15,619 65,010 Deductions ............................................................................................................ (43,386) (50,060) Balance, end of 2001............................................................................................. 286,476 53,626 Additions............................................................................................................... 67,567 18,256 Deductions ............................................................................................................ (53,330) (28,833)
300,713 43,049 Balance, end of 2002.............................................................................................
Doubtful Accounts
Sales Allowances
US$ US$
Balance, beginning of 2002 ................................................................................. 8,256 1,546 Additions ............................................................................................................. 1,947 526 Deductions ........................................................................................................... (1,537) (831) Balance, end of 2002 ........................................................................................... 8,666 1,241 6. Inventories
December 31,
2001 2002
NT$ NT$ US$
57,615
Supplies in transit..................................................................
Raw materials ....................................................................... 1,613,458 1,999,267 General supplies and spare parts........................................... 665,598 508,736 14,661 Work in process .................................................................... 348,933 436,872 12,590 Finished goods ...................................................................... 297,355 333,427 9,609
63,640 66,107 1,905 3,344,409 96,380
Allowance for obsolescence ................................................. (220,548) (212,757) (6,131) 2,768,436 3,131,652 90,249
2,988,984
F-19

The movement of allowance for obsolescence is as follows:
NT$
Balance, beginning of 2000 ........... 176,205 Additions ....................................... 115,928 Deductions ..................................... (137,072) Balance, end of 2000 ..................... 155,061 Additions ....................................... 131,197 Deductions ..................................... (65,710) Balance, end of 2001 ..................... 220,548 Additions ....................................... 34,379 Deductions ..................................... (42,170) Balance, end of 2002 ..................... 212,757
US$
Balance, beginning of 2002 ........... 6,356 Additions........................................ 990 Deductions ..................................... (1,215) Balance, end of 2002 ..................... 6,131
7. Long-term Investments—Common Stocks
December 31,
2001 2002
NT$
% of Direct
Ownership NT$
1,140,427 32,865
27.3
Preferred stock
Taiwan Fixed Network Co., Ltd .......................................................
34,990 — 1,153
US$
% of Direct
Ownership
Equity method Common stock
Hung Ching Development & Construction Co. (“HCDC”) ............. 1,213,563 25.4 26.4 Hung Ching Kwan Co. (“HCKC”).................................................... 405,406 27.3 404,513 11,657 Universal Scientific Industrial Co., Ltd. (“USI”) ............................. 3,633,927 23.5 3,422,186 98,622 23.5 Universal Access Technology Inc. (“UAT”) .................................... 60,001 25.0 — — 25.0
Integrated Programmable Communication, Inc. (“IPC”) ................. 101,447 23.1 85,870 2,475 30.0
Cost method ASE shares held by subsidiaries ....................................................... 3,017,964 5.1 — — — InveStar Burgeon Venture Capital, Inc............................................. 161,749 13.0 160,732 4,632 13.0
1,500,000 1.6 1,500,000 43,228 1.6 Global Strategic Investment, Inc....................................................... 69,980 2.5 69,540 2,004 2.5 UC Fund II......................................................................................... 34,770 1,002 — Digital Communications Internal Inc. (“DCI”) ................................ — — 40,000 12.0 Crimson@Velocity Fund, L.P........................................................... — 8,845 255 —
10,199,027 6,866,883 197,893 Adjustment for decline in market value in ASE stock ......................... (368,480) — — Unrealized gain on sale of land............................................................. (300,149) (300,149) (8,650) 9,530,398 6,566,734 189,243
—
The Company acquired its 27.3% equity interest in Hung Ching Kwan Co. (“HCKC”) in 1992 by transferring to HCKC a parcel
of land as an investment in HCKC at an agreed value of NT$390,470. The resulting gain of NT$300,149, which represents the excess of such value over the cost of the land plus land value increment tax, has been deferred until the disposal of this investment. As of December 31, 2002, the Company has a 44.1% effective interest in HCKC, which consists of 27.3% interest directly owned by the Company, and 16.8% in 2002 interest indirectly owned through Hung Ching Development & Construction Co. (“HCDC”) (based on HCDC’s 63.5% interest in HCKC).
F-20
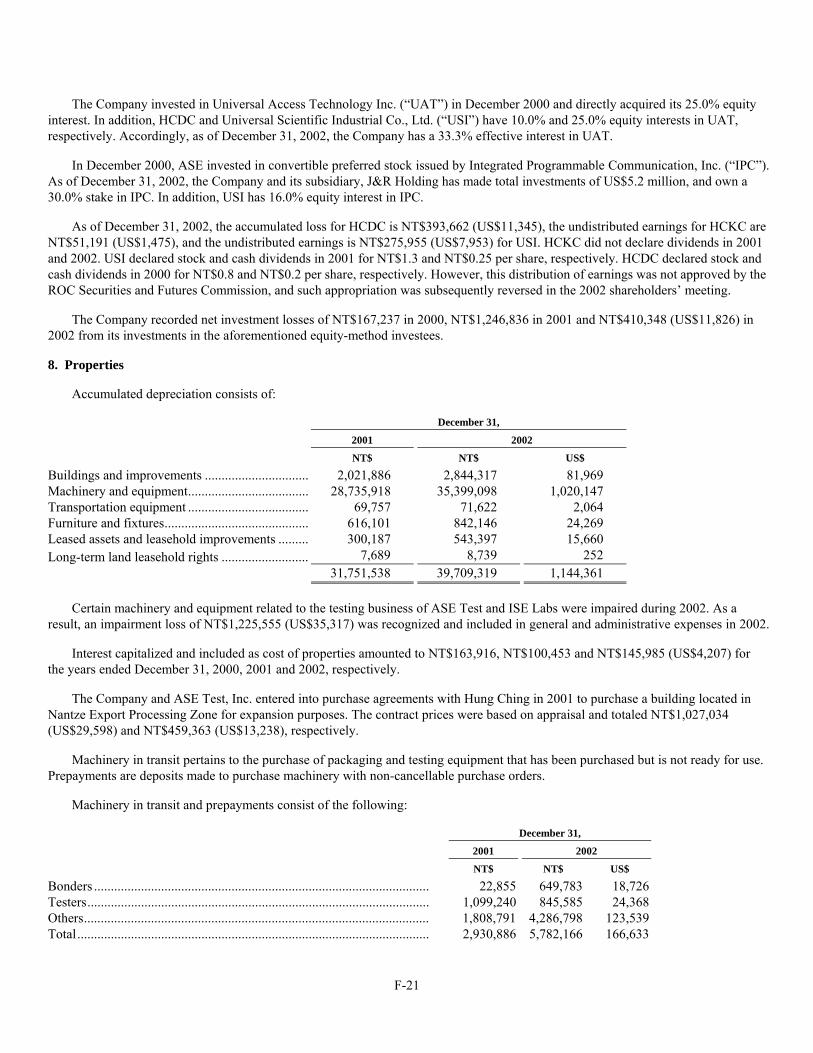
The Company invested in Universal Access Technology Inc. (“UAT”) in December 2000 and directly acquired its 25.0% equity interest. In addition, HCDC and Universal Scientific Industrial Co., Ltd. (“USI”) have 10.0% and 25.0% equity interests in UAT, respectively. Accordingly, as of December 31, 2002, the Company has a 33.3% effective interest in UAT.
In December 2000, ASE invested in convertible preferred stock issued by Integrated Programmable Communication, Inc. (“IPC”). As of December 31, 2002, the Company and its subsidiary, J&R Holding has made total investments of US$5.2 million, and own a 30.0% stake in IPC. In addition, USI has 16.0% equity interest in IPC.
As of December 31, 2002, the accumulated loss for HCDC is NT$393,662 (US$11,345), the undistributed earnings for HCKC are NT$51,191 (US$1,475), and the undistributed earnings is NT$275,955 (US$7,953) for USI. HCKC did not declare dividends in 2001 and 2002. USI declared stock and cash dividends in 2001 for NT$1.3 and NT$0.25 per share, respectively. HCDC declared stock and cash dividends in 2000 for NT$0.8 and NT$0.2 per share, respectively. However, this distribution of earnings was not approved by the ROC Securities and Futures Commission, and such appropriation was subsequently reversed in the 2002 shareholders’ meeting.
The Company recorded net investment losses of NT$167,237 in 2000, NT$1,246,836 in 2001 and NT$410,348 (US$11,826) in 2002 from its investments in the aforementioned equity-method investees.
8. Properties
Accumulated depreciation consists of:
December 31,
2001 2002
NT$ NT$ US$
Buildings and improvements ............................... 2,021,886 2,844,317 81,969 Machinery and equipment.................................... 28,735,918 35,399,098 1,020,147 Transportation equipment .................................... 69,757 71,622 2,064 Furniture and fixtures........................................... 616,101 842,146 24,269 Leased assets and leasehold improvements ......... 300,187 543,397 15,660 Long-term land leasehold rights .......................... 7,689 8,739 252 31,751,538 39,709,319 1,144,361
Certain machinery and equipment related to the testing business of ASE Test and ISE Labs were impaired during 2002. As a result, an impairment loss of NT$1,225,555 (US$35,317) was recognized and included in general and administrative expenses in 2002.
Interest capitalized and included as cost of properties amounted to NT$163,916, NT$100,453 and NT$145,985 (US$4,207) for the years ended December 31, 2000, 2001 and 2002, respectively.
The Company and ASE Test, Inc. entered into purchase agreements with Hung Ching in 2001 to purchase a building located in Nantze Export Processing Zone for expansion purposes. The contract prices were based on appraisal and totaled NT$1,027,034 (US$29,598) and NT$459,363 (US$13,238), respectively.
Machinery in transit pertains to the purchase of packaging and testing equipment that has been purchased but is not ready for use. Prepayments are deposits made to purchase machinery with non-cancellable purchase orders.
Machinery in transit and prepayments consist of the following:
December 31,
2001 2002
NT$ NT$ US$
Bonders .................................................................................................... 22,855 649,783 18,726 Testers...................................................................................................... 1,099,240 845,585 24,368 Others....................................................................................................... 1,808,791 4,286,798 123,539 Total......................................................................................................... 2,930,886 5,782,166 166,633
F-21

9. Other Assets
December 31,
2001 2002
NT$ NT$ US$
Deferred charges Tooling ................................................................................................... 48,479
93,722 11,976
122,048 3,517 Unamortized license fee ......................................................................... 86,997 2,701 Telecommunications, electrical and computer network systems............ 302,604 415,579 Other....................................................................................................... 284,621 423,990 12,219
722,701 1,055,339 30,413 Deferred income tax assets ......................................................................... 226,190 1,145,115 33,000 Guarantee deposits ...................................................................................... 185,162 170,064 4,901 Non-operating properties ............................................................................ 155,703 153,744 4,431 Other ........................................................................................................... 52,513 115,925 3,341 1,342,269 2,640,187 76,086 10. Consolidated Debits
Consolidated debits represent goodwill arising from the purchases of:
December 31,
2001 2002
NT$ NT$ US$
ASE Test shares ....................................................................... 2,992,676 2,701,189 77,844 ISE Labs shares........................................................................ 1,870,915 2,514,629 72,468 ASE Korea shares .................................................................... 377,382 325,990 9,394 Other ........................................................................................ 7,946 — —
5,248,919 5,541,808 159,706
Goodwill from the purchase of ASE Test shares included the purchase of 2,480,000 shares by ASE Holding at the prevailing market price from the Company’s directors in May 2001.
Amortization of goodwill is reflected in general and administrative expenses in the consolidated statement of income and was NT$559,807, NT$692,919 and NT$815,573 (US$23,504) for the years ended December 31, 2000, 2001 and 2002, respectively.
Equity level goodwill from investments in HCDC and USI is amortized over ten years through April 2006 for HCDC and July 2010 for USI.
In 2001, the Company amortized the remaining balance of goodwill for HCDC as a result of the significant decline in the market value of HCDC shares. As of December 31, 2001 and 2002, unamortized goodwill for USI was NT$1,651,742 and NT$1,431,142 (US$41,243), respectively.
11. Short-term Borrowings
December 31,
2001 2002
Interest Rate(%) NT$
50,381
Interest Rate(%) NT$ US$
Letters of credit................................ 0.85—6.75 803,156 0.88—5.45 1,748,209 Revolving ........................................ 2.65—7.30 2,652,993 2.00—7.00 2,155,785 62,126
3,456,149 3,903,994 112,507
F-22

As of December 31, 2002, unused credit lines for short-term borrowings, including commercial paper and bank acceptances, totaled approximately NT$6,476,000 (US$186,628).
12. Commercial Paper and Bank Acceptances Payable
Commercial paper and bank acceptances payable bore interest rates ranging from 1.80% to 6.30% in 2001 and 1.55% to 3.65% in 2002.
13. Long-term Bonds Payable
December 31,
2001 2002
NT$ NT$ US$
Foreign convertible bonds—issued by ASE 2,379,320 — — Foreign convertible notes—issued by ASE Test Finance
Limited ..................................................... 3,845,051 3,820,875 110,111 Accrued interest ........................................... 1,644,265 1,358,918 39,162 7,868,636 5,179,793 149,273 Less: Current portion ................................... 3,090,345 — 4,778,291 149,273
—5,179,793
Information on the long-term bonds payable is as follows:
Foreign convertible bonds—issued by the Company
In November 1997, the Company issued US$200.0 million of zero coupon convertible bonds due November 2002, consisting of 200 units with face values of US$1.0 million (NT$30.8 million) each. The bonds had an implied interest rate of 6.37%.
From December 1997 through October 2002, the bondholders had the right to convert the bonds into common shares at the specified conversion price. The conversion rate was based on the current market price at the time of sale. Except for US$1.0 million aggregate principal amount of convertible bonds that were converted into 355,086 common shares during 2001, the remaining US$199.0 million aggregate principal amount of the outstanding bonds were repurchased from the open market and cancelled in 2001 and 2002. During 2001, the Company repurchased US$131.0 million in aggregate principal amount of the outstanding bonds from the open market with payments of NT$6,066,042, which resulted in an extraordinary loss of NT$192,753 (net of income tax benefit of NT$48,188). During 2002, the Company repurchased US$68.0 million in aggregate principal amount of the outstanding bonds from the open market with payments of NT$3,242,110, which resulted in an extraordinary loss of NT$34,613 (net of income tax benefit of NT$11,538). Prior to the repurchase of all the outstanding bonds, the Company was required to contribute to a sinking fund for the outstanding bonds at the date of twelve months prior to maturity date. At December 31, 2001 and 2002, the balance of the sinking fund was NT$1,568,057 and NT$0, respectively.
Foreign convertible notes—issued by ASE Test Finance Limited
In June 1999, ASE Test, in connection with the acquisitions of ISE Labs and Motorola SPS Businesses, issued US$160.0 million (NT$5,552.0 million) of 1% guaranteed convertible notes (the “Convertible Notes”) due July 1, 2004 through its subsidiary, ASE Test Finance Limited (the “Issuer”). The Company subscribed US$50.0 million (NT$1,735.0 million) of the Convertible Notes and, accordingly, the net balance of US$110,111 (NT$3,820.9 million) is recorded in the accompanying balance sheet.
The holders may convert the Convertible Notes into ASE Test’s ordinary shares at the specified conversion price (currently US$24.75 per share, subject to adjustment) at any time between December 29, 1999 and July 1, 2004.
The Convertible Notes may be redeemed under the following circumstances:
a) Redemption for taxation reasons:
F-23

If the applicable tax law or treaty is unfavorably revised, the Issuer or ASE Test may redeem the Convertible Notes in whole at a specified early redemption price, at any time upon giving written notice not less than 30 days and not more than 60 days to the bondholders.
b) Redemption at the option of the Issuer:
On or at any time after July 1, 2002, the Issuer may redeem all or a part of the Convertible Notes at a specified early redemption price.
14. Long-term Debt
Long-term debts consist of the following:
December 31,
2001
NT$ NT$ US$
209,833 317,555
78,371
Mortgage bank loans for purchase of building and machinery............................................................................. 5,423,384 7,281,200
Revolving bank loans and acceptances payable....................... 11,280,825 11,019,162 Bank loans secured by assets ................................................... 1,367,634 1,724,760 49,705 Letters of credit loans for purchase of materials and
machinery............................................................................. 2,098,650 2,719,490 Loans for specified use ............................................................ 6,000,000 6,000,000 172,911 Obligation under capital leases (Note 21)................................ 106,525 467,374 13,469 26,277,018 29,211,986 841,844 Current portion......................................................................... 3,175,883 6,202,423 178,744 23,101,135 23,009,563 663,100
2002
Mortgage Bank Loans for Purchase of Building and Machinery
Mortgage bank loans obtained by the Company, ASE Test, Inc., ASE Chung Li, and ASE Material are repayable in monthly, quarterly or semi-annually installments. The loans bear interest at rates ranging from 0.88% to 6.95% in 2001 and 3.00% to 7.92% in 2002.
ASE Chung Li has a syndicated loan agreement with a total facility of NT$4,000,000, which will be repayable through May 2006. As of December 31, 2002, NT$1,600,000 (US$46,110) of the total facility had been drawn. The remaining NT$2,400,000 (US$69,164) available under the facility had not been drawn and, under the terms of the agreement, expired in November 2002. The agreement requires that, among other things, ASE Chung Li maintains certain financial ratios. As of December 31, 2002, ASE Chung Li was in compliance with the required covenants.
F-24

Revolving Bank Loans and Acceptance Payables
December 31,
2001 2002
NT$ US$
Five-year syndicated bank loans—interest at 2.91%-6.07% in 2001 and 2.14%-5.90% in 2002 ASE......................................................................................... 7,600,000 5,200,000 149,856 ASE Test Inc ........................................................................... 1,200,000 300,000 8,645
ASE......................................................................................... 2,173,000 4,920,030 141,788 Others ...................................................................................... 355,000 606,341 17,474
11,328,000 11,026,371 317,763 Unamortized discounts................................................................ (47,175) (7,209) (208) 11,280,825 11,019,162 317,555
NT$
Revolving credit lines due May 2003 to December 2005—interest at 2.05%-6.45% in 2001 and 1.85%-4.88% in 2002
The five-year syndicated bank loan of NT$5.2 billion of the Company is repayable semi-annually from June 2003 through June
2004. Revolving credit lines of NT$2.8 billion of the Company expire in 2003. In December 2002, the Company obtained two new long-term credit lines: a syndicated bank loan of NT$7.0 billion and a bank loan of NT$1.0 billion. The funds were drawn in January 2003 and were used to repay the syndicated bank loan of NT$5.2 billion and revolving credit lines of NT$2.8 billion.
The January 2003 syndicated bank loan of NT$7.0 billion is repayable in three semi-annual installments from December 2004 to December 2005. The agreement requires, among other things, the following:
1) Without the prior written consent from the majority of the banks, ASE may not:
(a) pledge its assets or assume liabilities or change the scope of its operations or dispose material assets; or
(b) merge or combine with any other entity or make investments or acquire major assets of any other entity.
2) The Company’s tangible net worth (as defined in a loan agreement) should not be less than NT$38.0 billion (US$1,319.0 million).
3) Maintenance by the Company of certain financial ratios.
The bank loan of NT$1.0 billion is repayable in March 2004.
The remaining syndicated bank loans were covered by several bank acceptance agreements made by the Company and ASE Test, Inc. which stipulate, among other things, the following:
1) Without prior written consent from the majority of the banks, the Company cannot pledge its assets or assume liabilities or change its operating items or merge with any other entity or dispose of more than 20% of total assets, or provide financing to other entity, or make such investment that will unfavorably affect its financial conditions.
2) The Company’s tangible net worth (as defined in the loan agreements) should not be less than NT$38.0 billion (US$1,319.0 million).
3) The Company is required to maintain certain financial ratios.
4) The Company is required to pay an annual commitment fee of 0.15% of the difference between the authorized and utilized credit line.
F-25

ASE Test provided a guaranty on the bank acceptance agreement entered into by ASE Test, Inc. Under the guaranty, ASE Test is required to maintain certain financial ratios and, without written consent of the majority banks, shall not:
1) Merge or consolidate with any other entity or take any action to dissolve, liquidate or reorganize.
2) Purchase or redeem its shares or reduce its share capital.
3) Reduce its ownership in ASE Test, Inc. to less than 51%.
4) Transfer, sell, lease or dispose of a substantial portion of its assets.
These also include various bank loans obtained by ASE Korea which are secured by ASE Korea’s buildings and improvements (see Note 20). The loans are repayable in July 2007 and bear interest from 4.40% to 6.10% in 2001 and 3.70% to 4.30% in 2002, respectively.
Letters of Credit
These represent various bank loans obtained by the Company or ASE Material with original terms of one year or less, due from January 2003 through September 2003 with interest rates ranging from 0.86% to 6.81% in 2001 and 0.88% to 5.45% in 2002. The Company and ASE Material have received permission from the relevant banks to refinance some of these loans on the same terms.
Bank Loans Secured by Assets
These include various bank loans obtained by ISE Labs which are secured by ISE Labs’ total assets (see Note 20). The loans are repayable in May 2009, and bear interest from 5.50% to 7.92% in 2001 and 4.75% to 7.75% in 2002, respectively. These agreements contain certain covenant and default provisions that require ISE Labs to maintain certain financial ratios, dividend and capital expenditure restrictions and maintenance of working capital requirements. ISE Labs was in violation of covenants under a US$10.0 million bank loan agreement to maintain certain monthly and quarterly financial ratios for the months from October 2002 through February 2003 and for the fourth quarter of 2002, respectively. These breaches constituted events of default and, as a result, the bank declared all of ISE Labs’ obligations under the agreement immediately due and payable. Accordingly, the long-term debt portion of US$10.0 million was included in the current portion of long-term debt at December 31, 2002. ISE Labs subsequently obtained a waiver of the aforementioned breaches from the bank, repaid all of the amounts owed under the loan and terminated the loan agreement.
Loans for Specified Use
This represents the loan which specified for use in the redemption of the Company’s convertible bonds in 2001. The loan is repayable in semi-annual installments starting June 2003 to December 2004 and bears interest of 5.95% in 2001 and 5.79% in 2002. The agreement requires, among other things, the following:
1) Without the prior written consent from the majority of the banks, the Company may not:
(a) pledge its assets or assume liabilities or change significantly its operating items or dispose material assets, or provide financing to other entity, or make lending to any other parties.
(b) merge or combine with any other entity or make investments or acquire major assets of other entity.
2) The Company’s tangible net worth (as defined in the loan agreement) should not be less than NT$38.0 billion (US$1,319.0 million).
3) Maintenance by the Company of certain financial ratios.
The abovementioned bank loan contracts have variable interest rates and are subject to adjustments by banks or changes in prime rate. In addition, several of the loan agreements have default provisions, whereby a default under one debt agreement may also trigger cross-defaults under other debt agreements.
As of December 31, 2002, unused long-term bank facilities approximated NT$3,311,000 (US$95,418).
F-26

As of December 31, 2002, the maturities of long-term debt (including long-term bonds payable) are as follows:
Amount
NT$ US$
Within the following year ...................................................................................... 6,202,423 178,744 During the second year .......................................................................................... 20,476,710 590,107 During the third year.............................................................................................. 6,618,418 190,732 During the fourth year............................................................................................ 967,365 27,878 During the fifth year and thereafter........................................................................ 126,863 3,656 34,391,779 991,117
Long-term debts (including long-term bonds payable) by currencies is detailed as follows:
December 31, 2002
New Taiwan Dollars ............................................... NT$ 12,128,557 NT$ 22,810,513 NT$ 24,122,910 US Dollars ..............................................................
¥
EUR
US$ 469,339 US$ 289,175 US$ 246,194 Deutsche Mark........................................................ DM 940 DM − DM − Japanese Yen........................................................... ¥ 5,069,552 ¥ 4,562,877 5,460,363 Singapore Dollars ................................................... SGD 7 SGD − SGD − British Pound .......................................................... GBP 91 GBP − GBP − European Currency Unit ......................................... EUR 4 EUR − 2,986
2000 2001
15. Pension Plans
The Company and its consolidated subsidiaries in the ROC have pension plans for their regular employees. Retirement benefits are based on the length of service and average salaries or wages of the last six months before retirement. ISE Labs has a defined contribution savings plan (“401k plan”) for eligible employees. This plan permits employees to make contributions up to the maximum limits allowable under Internal Revenue Code Section 401k. ASE Korea also has a pension plan where eligible employees and directors with more than one year of service are entitled to receive a lump-sum payment upon termination of their service with ASE Korea, based on their length of service and rate of pay at the time of termination. The consolidated entities in the ROC make monthly contributions, at 2.0% of salaries and wages, to pension funds which are in the name of, and are administered by, the employee pension plan committee of the respective entities. The changes in the retirement funds during the periods indicated are summarized as follows:
Year Ended December 31,
2001 2002
NT$ NT$ US$
Balance, beginning of year .............................................................. 339,500 440,746 12,702 Contributions ................................................................................... 86,615 83,996 2,420 Payments.......................................................................................... (145) (4) (3,654) Interest income................................................................................. 15,285 10,815 312 Balance, end of year......................................................................... 440,746 535,412 15,430
F-27

Pension costs for these entities during the periods indicated consist of:
Year Ended December 31,
2001 2002
NT$ NT$ US$
Service costs .................................................................................... 114,393 191,707 5,525 Interest ............................................................................................. 28,503 36,102 1,040 Projected return on pension assets ................................................... (21,611) (23,003) (663) Amortization of prior period service cost, gain or loss on plan
assets, etc...................................................................................... 6,933 4,176 120 128,218 208,982 6,022
Other pension information based on actuarial calculations of the plan during the periods indicated are as follows:
Year Ended December 31,
2001 2002
NT$ NT$ US$
a. Benefit obligations Vested benefit obligation ............................................ 18,677 21,347 615 Non-vested benefit obligation ..................................... 415,454 738,300 21,277 Accumulated benefit obligation .................................. 434,131 759,647 21,892 Additional benefits based on future salaries................ 278,587 486,056 14,007 Projected benefit obligation ........................................ 712,718 1,245,703 35,899 Fair value of assets ...................................................... (412,192) (507,098) (14,614)
300,526 738,605 21,285 Unrecognized net transition obligation ....................... (101,984) (104,105) (3,000) Unrecognized net actuarial gain .................................. 93,428 (210,955) (6,079) Portion in prepayments ............................................... 5,561 — — Portion in other current liabilities................................ (3,093) (6,874) (198) Accrued pension cost .................................................. 294,438 416,671 12,008
b. Vested obligation ........................................................ 22,177 23,858 688 c. Actuarial assumption
Discount rate ............................................................... 5.0% 3.5% Increase in future salary level 3.0%-4.0% 3.0% Expected rate of return on plan assets ......................... 5.0% 3.5%
Funded status...............................................................
16. Shareholders’ Equity
In July 1995, the Company issued 8,600,000 GDSs, representing 43,000,000 common shares. In September 2000, the Company issued 20,000,000 ADSs, representing 100,000,000 common shares. In connection with the ADS offering in 2000, the Company offered to exchange all outstanding GDSs for ADSs listed on the New York Stock Exchange. A total of 7,536,000 GDSs, representing an aggregate of 37,677,000 common shares, were exchanged for ADSs pursuant to the exchange offer.
During 2002, a portion of the outstanding ADSs were cancelled in exchange for approximately 198,599 thousand common shares of the Company, which represented 6.1% of the Company’s total outstanding common shares. As of December 31, 2002, the outstanding ADSs (including treasury stock) represented 1.7% of the Company’s total outstanding common shares.
Under the ROC Company Law, capital surplus from the paid-in capital in excess of par value can be used to offset against deficit. In addition, such capital surplus may be transferred to capital and is subject to a specified limit under relevant regulations.
Capital surplus from prior years’ gains on disposal of properties has been transferred to retained earnings after the 2002 general shareholders’ meeting.
F-28

Capital surplus from long-term investments in shares of stock which are accounted for by the equity method may not be used for any purpose.
The Company’s Articles of Incorporation provide that the annual net income shall be appropriated as follows:
a. offset against deficit, if any;
b. 10.0% of the remainder as legal reserve, until the accumulated amount equals paid-in capital;
c. an amount equal to the income from long-term investments in shares of stock accounted for by the equity method, excluding cash dividends, as special reserve;
d. not more than 2.0% of the remainder, as compensation to directors and supervisors;
e. between 5.0% to 7.0% of the remainder, as bonus to employees, of which 5.0% will be distributed in accordance with the employee bonus plan and the excess to be distributed to specific employees as decided by the board of directors; and
f. the remainder, as dividends to shareholders.
The aforementioned appropriations shall be approved by the shareholders in the following year and given effect in the consolidated financial statements of such year.
Under the ROC Company Law, the aforementioned legal reserve may be used to offset a deficit. Also, when the reserve has reached 50.0% of capital, up to 50.0% thereof may be transferred to capital.
In order to meet the needs of our present and future capital expenditures, the Company’s dividend distribution shall be primarily in the form of common shares. Cash dividends may also be distributed in certain circumstances. However, the percentage of cash dividends generally shall not exceed 20.0% in any dividend distribution, provided further that cash dividends shall not be paid if the dividend per share is less than NT$0.1.
With respect to the percentage of cash dividends to be paid referred to in the previous paragraph, the Company may decide the most suitable dividend distribution in accordance with its current operational status, and taking into consideration the budget plan for the following year. The board of directors shall draw up a profit distribution plan, which shall be submitted to the shareholders’ meeting for approval before implementation.
Under the Integrated Income Tax System which became effective on January 1, 1998, non-corporate resident shareholders are allowed a tax credit for the income tax paid or payable by the Company on earnings generated in 1998 and onwards. An Imputation Credit Account (“ICA”) is maintained by the Company for such income tax and the tax credit allocated to each shareholder. The maximum credit available for allocation to each shareholder cannot exceed the balance shown in the ICA on the date of distribution of dividends.
As of December 31, 2002 the creditable taxes aggregated NT$29,409 (US$848). The actual percentage for the distribution of 2000 net income was 10.3%.
As of December 31, 2002, the unappropriated earnings prior to 1998 (the year that Integrated Income Tax System became effective) amounted to NT$22,242 (US$641).
17. Employee Stock Option Plans
In order to attract, retain and incentivize employees, the Company adopted an employee stock option plan, which became effective on August 28, 2002. Under this plan, for a period of one year from August 28, 2002, the Company may issue up to 160,000,000 options on one or more occasions. Each option entitles the holder to purchase one common share of the Company at a price equal to the closing market price on the date of the option grant. Forty percent of the options originally granted vest upon the second anniversary of the grant date, and an additional 10% of the options originally granted vest every six months thereafter. Each option expires at the end of the 10th year following its issue date. As of December 31, 2002, a total of 145,989,000 units stock options have been granted to employees at an exercise price of NT$20.8 per share, which was equal to the closing price of the Company’s
F-29

common shares listed on the Taiwan Stock Exchange on the date of grant. The remaining 14,011,000 options will be granted to employees by August 28, 2003. The Company has reserved 300,000,000 common shares for issuance under the Plan.
ASE Test has five stock option plans, the 1996 Executive Management Option Plan (the “1996 Plan”), and the 1997, 1998, 1999 and 2000 Option Plans. Stock options granted under these plans are exercisable for ASE Test ordinary shares based on a vesting schedule over five years until the options expire.
18. Income Tax
a. Income tax expense (benefit) is determined as follows:
Year Ended December 31,
2000 2001 2002
NT$ NT$ NT$ US$
Current Tax (benefit) based on pre-tax accounting income
(loss) at statutory rate ............................................ 3,211,156 (579,651) (950,597) (27,395) Add (less) tax effects of:
Permanent differences Tax-exempt income
—Tax holiday ............................................... (700,749) (26,413) (52,126) (1,502) —Gain from sales of securities ..................... (51,415) (31,711) (16,798) (484)
Temporary differences Investment loss (income)................................... (523,941) 814,148 793,812 22,876 Unfunded pension cost ...................................... 12,214 7,842 24,239 699 Bond interest payable ........................................ 114,798 (189,164) (163,289) (4,706) Other ................................................................. 249,888 156,866 629,545 18,143
2,311,951 151,917 264,786 7,631 Income taxes on undistributed earnings......................... 147,379 335,065 54,598 1,573 Credits for investments and research and
development .............................................................. (1,231,247) (253,227) (331,255) (9,546) Net change in deferred income tax for the period.......... (152,138) (449,933) (1,130,358) (32,575) Adjustment of prior year’s income tax (10,177) 17,018 1,905 55
Income tax (benefit) expense......................................... 1,065,768 (199,160) (1,140,324) (32,862)
b. The above-mentioned taxes on pre-tax accounting income (loss) at the statutory rates for domestic and foreign entities are
shown below:
Year Ended December 31,
2000 2001 2002
NT$ NT$ NT$ US$
Domestic entities in ROC (25.0% statutory rate)............................................. 2,542,888 (501,553) (173,787) (5,008) Foreign entities
ASE Korea Inc. (30.8% statutory rate)............... 2,153 — — — ISE Labs, Inc. (federal tax rate 35.0% and state
tax rate 6.0%) ................................................. 439,169 (92,487) (725,744) (20,915) ASE Test Malaysia (30.0% statutory rate) ......... 226,946 14,389 (51,066) (1,472)
3,211,156 (579,651) (950,597) (27,395)
F-30

c. Deferred income tax assets and liabilities as of December 31, 2001 and 2002 are summarized as follows:
December 31,
2001 2002
NT$ NT$ US$
Current deferred income tax assets Unused tax credits ................................................................ 378,075 966,689 27,858 Provision for inventory obsolescence................................... 41,502 38,212 1,101 Accrued interest on convertible bonds ................................. 163,289 — — Provision for doubtful accounts and sales allowance........... 68,432 23,305 672 Unrealized foreign exchange loss......................................... 108,721 49,351 1,422 Loss carryforward ................................................................ 214,013 — — Other .................................................................................... 97,776 39,884 1,149
1,071,808 1,117,441 32,202 Valuation allowance............................................................. (161,800) (23,000) (663)
910,008 1,094,441 31,539 Current deferred income tax liabilities—unrealized
foreign exchange gain .......................................................... (37,000) (10,000) (287) 873,008 1,084,441 31,252 Non-current deferred income tax assets
Unused tax credits ................................................................ 1,648,956
Others ................................................................................... 97,472
2,324,529 66,990 Accrued pension costs.......................................................... 64,308 498,087 14,354 Loss carryforward ................................................................ — 455,589 13,129
112,092 3,230 1,810,736 3,390,297 97,703
Valuation allowance............................................................. (639,188) (1,765,860) (50,889) 1,171,548 1,624,437 46,814 Non-current deferred income tax liabilities
Investment income ............................................................... (636,815) (206,500) (5,951) Unrealized foreign exchange gain........................................ (7,185) — — Goodwill amortization ......................................................... (56,124) (35,658) (1,028) Others ................................................................................... (245,234) (237,164) (6,835)
(945,358) (479,322) (13,814) 226,190 1,145,115 33,000
In assessing the realizability of deferred income tax assets, the Company considers its future taxable earnings and expected timing for the reversal of temporary differences. In addition, in the event future taxable earnings do not materialize, the Company will consider executing certain tax planning strategies available to realize the deferred income tax assets. The valuation allowance is provided to reduce the gross deferred income tax assets to an amount which the Company believes will more likely than not be realized. Deferred income tax assets and liabilities are classified in the consolidated balance sheets based on the classification of the related assets or liabilities or the expected timing of the reversal of temporary differences.
The U.S. Federal and California State net operating loss carryforward of ISE Labs as of December 31, 2002 approximated US$15.0 million and US$7.8 million with expiration in 2021 and 2006, respectively.
A portion of the Company’s and ASE Test, Inc.’s income from the manufacturing, processing and testing of semiconductors is exempt from income tax for five years ending December 2005. ASE Test Malaysia has been granted approval of “hi-tech pioneer” status for an additional five years and is expected to commence the tax holiday retroactively from July 1, 1999 through June 30, 2004. The per share effect of tax holiday is NT$0.3 in 2000, NT$0.01 in 2001 and NT$0.02 in 2002.
F-31

d. As of December 31, 2002, unused tax credits of ROC subsidiaries which can be utilized to offset their future income tax are set forth below:
December 31, 2002
Year of Expiry ASE ASE
Chung Li ASE
Material ASE
Test, Inc. Total
NT$ NT$ NT$ NT$ NT$
2003............................................................... 115,750 4,176 27,252 191,821 338,999 2004............................................................... 297,057 123,727 14,981 306,975 742,740 2005............................................................... 624,821 — 25,332 109,809 759,962 2006............................................................... 516,372 71,897 635,210 226,038 1,449,517
1,554,000 199,800 702,775 834,643 3,291,218
In the ROC, tax credits may be utilized to reduce up to 50% of income tax payable each year. In the expiring year, any remainder of unused tax credits can be used entirely.
Income tax returns of the Company and its subsidiaries in the ROC have been examined by the ROC tax authorities through 1999.
19. Earnings Per Share and ADS
Since the Company incurred a loss from continuing operations for the year ended December 31, 2001, and the Company’s common share equivalents attributable to the employees’ stock options had no dilutive effect in 2002, the basic net income (loss) per share and per ADS are presented.
Diluted earnings per share for the year ended December 31, 2000 is calculated as follows:
The denominator is the weighted average number of outstanding shares of common stock of 2,677,602,508 shares in 2000. The numerator with consideration of the adjustment of ASE Test’s diluted EPS in 2000 is calculated as follows:
NT$
Net income............................................................................................................................................ 5,837,149 Less: net income contributed from ASE Test ....................................................................................... (1,816,985) Add: ASE Test’s diluted EPS multiplied by the number of shares of ASE Test owned by the
Company ........................................................................................................................................... 1,685,617 As adjusted............................................................................................................................................ 5,705,781
Diluted earnings per ADS for the year ended December 31, 2000 is calculated as follows:
The denominator is the above-mentioned weighted average outstanding shares divided by five (one ADS represents five common shares). The numerator is the same as mentioned in the above EPS calculation.
The number of shares to be issued upon conversion of the convertible bonds is as follows:
2000 2001 2002
Convertible bonds—issued by the Company........................... 95,400,000 38,537,822 —
F-32

20. Assets Pledged or Mortgaged
Except for those mentioned in Note 14, the assets pledged or mortgaged as first priority collateral are summarized as follows:
December 31,
2001 2002
NT$ NT$ US$
Buildings and improvements ................................................... 2,077,487 2,762,585 79,613 Machinery and equipment........................................................ 9,021,120 8,629,757 248,696 Long-term investments (including treasury stock)................... 1,790,961 — — Time deposits........................................................................... 140,949 428,743 12,356 Guarantee deposits—time deposits .......................................... 77,821 118,445 3,413 Short-term investment.............................................................. — 260,120 7,496 Commercial paper.................................................................... — 552,416 15,920 13,108,338 12,752,066 367,494
In addition, the total assets of ISE Labs amounting to NT$3,236,253 (US$93,264) as of December 31, 2002, have been pledged as collaterals for its long-term and short-term debts.
21. Commitments and Contingencies as of December 31, 2002
a. The Company, ASE Test, Inc. and ASE Material lease the land on which their buildings are situated under various operating lease agreements with the government which expire on various dates from September 2009 to 2012. The agreements grant these entities option to renew the leases and reserve the right for the lessor to adjust the lease charges upon an increase in the assessed value of the land and to terminate the leases under certain conditions. In addition, the Company, ASE Material and ISE Labs also lease equipment under non- cancellable capital lease agreements. The net book value as of December 31, 2001 and 2002 of the equipment acquired under the capital obligations amounted to NT$276,287 and NT$506,637 (US$14,600), respectively. The future minimum lease payments under the above-mentioned operating leases are as follows:
Operating Leases December 31, 2002
NT$ US$
2003 .................................................................................................................................. 317,426 9,148 2004 .................................................................................................................................. 278,496 8,026 2005 .................................................................................................................................. 276,170 7,959 2006 .................................................................................................................................. 255,656 7,367 Thereafter.......................................................................................................................... 580,162 16,719 Total minimum lease payments ........................................................................................ 1,707,910 49,219
The future minimum lease payments under above-mentioned capital leases as of December 31, 2002 are as follows:
December 31, 2002
NT$ US$
Within the following year ................................................................................................. 229,710 6,620 Within the second year...................................................................................................... 187,748 5,410 Within the third year ......................................................................................................... 110,031 3,171 Total minimum lease payments ........................................................................................ 527,489 15,201 Less: Imputed interest ....................................................................................................... 60,115 1,732 Present value of future lease obligations........................................................................... 467,374 13,469 Capital lease obligation, current........................................................................................ 193,714 5,583 Capital lease obligation, long-term ................................................................................... 273,660 7,886
b. The Company, ASE Test, Inc., ASE Test Malaysia and ASE Chung Li (starting 1999) engage outside sales agencies. Commissions and service fees were paid based on monthly incurred service-related costs and expenses plus 5%-10% in 2001 and
F-33

2002 (starting August 2001, there is limited amounts prescribed for costs and expenses incurred) or based on 0.48%-1% in 2001 and 2002 of net export sales. Commissions and service fees paid in 2000, 2001 and 2002 were approximately NT$762,159, NT$729,300 and NT$734,322 (US$21,162), respectively.
c. As of December 31, 2002, commitments to purchase machinery and equipment were approximately NT$3,462,610 (US$99,787).
d. As of December 31, 2002, commitments for construction of buildings were approximately NT$1,192,342 (US$34,361).
e. As of December 31, 2002, unused letters of credit were approximately NT$1,298,648 (US$37,317).
f. The Company entered into technology license agreements with foreign companies which will expire on various dates through 2016 for the licensing of technology used in the packaging of certain products. Pursuant to such agreements, the Company shall pay royalties at a specified percentage of sales quantities. Such royalties in 2000, 2001 and 2002 were approximately NT$199,836, NT$151,249 and NT$176,711 (US$5,093), respectively.
g. As of December 31, 2002, the Company has endorsed and guaranteed the promissory notes of its subsidiaries as follows:
Amount
NT$ US$
ASE (Labuan) .............................................................................................................. 2,777,289 80,037 ASE (Philippines) ........................................................................................................ 399,855 11,523 ASE Chung Li.............................................................................................................. 758,450 21,857 ASE Material ............................................................................................................... 1,638,790 47,227 ASE Capital ................................................................................................................. 160,000 4,611 ASE Investment ........................................................................................................... 597,000 17,205 ASE Technologies ....................................................................................................... 10,000 288 6,341,384 182,748 22. Derivative Financial Instruments
Information on derivative transactions are as follows:
a. Foreign Currency Option Contracts
Because the Company, ASE Test, ASE Material and ASE Chung Li expect to receive US dollars from export sales and to pay Japanese yen or NT dollars for long-term debts or short-term borrowings, these companies have occasionally entered into foreign currency option contracts to manage exposures to exchange rate fluctuations.
As of December 31, 2002, the outstanding contracts were as follows:
Contract Amount Strike Price
US$/NT$ Maturity Date
Buy US$ Call/NT$ Put US$5.0 million US$1:NT$30.787 January 29, 2003 Buy US$ Call/NT$ Put US$5.0 million US$1:NT$30.781 February 26, 2003 Sell US$ Call/NT$ Put US$10.0 million US$1:NT$35.180 January 9, 2003
The loss arising from such outstanding contracts based on mark-to-market valuation as at December 31, 2002 was approximately
NT$39,141 (US$1,128).
F-34

b. Forward Exchange Contracts
The Company entered into forward contracts to manage exposures of foreign exchange rate fluctuations associated with its long-term debt. As of December 31, 2002, the outstanding contracts were as follows:
Contract Amount Strike Price
US$/NT$ Maturity Date
Buy NT$/Sell US$ US$5.0 million US$1:NT$34.174 January 29, 2003 Buy NT$/Sell US$ US$5.0 million US$1:NT$34.167 February 26, 2003
c. Interest Rate Swap
In June 2002, the Company entered into two interest rate swap contracts with a foreign bank to manage exposures to interest rate fluctuations. These contracts would have expired in December 2004. In September 30, 2002, ASE settled these contracts and recorded net interest income of NT$107,910 (US$3,110).
d. Transaction Risk
1) Credit Risk
The Company is exposed to credit risk in the event of non-performance of the counter parties to forward contracts on maturity. In order to manage this risk, the Company transacts only with financial institutions with good credit ratings. As a result, no material losses resulting from counter party defaults are anticipated.
2) Market Risk
Market risk is the exposure created by potential exposures to changes of foreign exchange rate related to its foreign-currency-denominated assets and/or liabilities and changes on interest rates related to its obligations.
3) Liquidity Risk and Cash Flow Risk
The Company entered into European option contracts and forward exchange contracts to hedge its exposure to the effect of exchange rate fluctuations on net assets or net liabilities. As the Company has sufficient operating capital to meet cash requirements upon the maturity of these contracts, the Company believes there are no significant liquidity or cash flow risks.
F-35

23. Non-derivative and Derivative Financial Instruments
December 31,
2001 2002
Carrying
Values Fair Values Carrying
Values Fair Values Carrying
Values Fair
Values
NT$ NT$ NT$ NT$ US$ US$
Non-derivative Financial Instruments Assets
Cash and cash equivalents ............................ 11,770,729 11,770,729 10,381,924 10,381,924 299,191 299,191Short-term investments................................. 4,601,172 4,642,062 2,038,020 2,040,066 58,733 58,792Notes receivable............................................ 105,185 105,185 112,667 112,667 3,247 3,247Accounts receivable—net............................. 7,020,964 7,020,964 8,885,879 8,885,879 256,077 256,077Long-term investments ................................. 9,530,398 11,026,363 6,566,734 4,297,778 189,243 123,855Pledged time deposit..................................... 140,949 140,949 428,743 428,743 12,356 12,356Guarantee deposit ......................................... 77,821 77,821 118,445 118,445 3,413 3,413Sinking fund.................................................. 1,568,057 1,568,057 — — — —
Liabilities Short-term borrowings.................................. 3,456,149 3,456,149 3,903,994 3,903,994 112,507 112,507Commercial paper and bank acceptances
payable ..................................................... 3,444,314 3,444,314 2,384,577 2,384,577 68,720 68,720Accounts payable.......................................... 2,968,779 2,968,779 4,045,849 4,045,849 116,595 116,595Long-term bonds payable (included current
portion)..................................................... 7,868,636 7,424,031 5,179,793 4,646,184 149,274 133,896Long-term debts (included current
portion)..................................................... 26,277,018 26,277,018 29,211,986 29,211,986 841,844 841,844Long-term payable for investments
(included current portion) ........................ 3,611,294 3,611,294 3,327,118 3,327,118 95,882 95,882Derivative Financial Instruments Forward exchange contracts.............................. — — (5,781) (5,681) (167) (164)Foreign currency option contracts..................... (136,751) (136,751) (39,141) (39,141) (1,128) (1,128)Cross currency swap contracts .......................... 69,978 69,978 — — — —
The carrying values of cash and cash equivalents, notes receivable, accounts receivable, short-term borrowings, commercial paper and bank acceptance payables and notes and accounts payable approximate fair values because of the short maturity of these instruments. The fair values of short-term and long-term investments are determined based on market values or net equity values. The fair value for pledged time deposit, guarantee deposits and sinking fund is the book value. The fair values of long-term bonds and payables for investments are determined based on the market value or the estimated present value of future cash flows using the interest rates of similar long-term debt instruments which the Company is able to obtain as the discount rate. Fair value of long-term debts is carrying value because floating interest rates are applied. The fair values of derivative financial instruments are based on the information of mark-to-market valuation.
24. Segment and Geographical Information
a. Geographical Information
1) Net Revenue:
Year Ended December 31,
2000 2001 2002
NT$ % of Total Revenues NT$
% of Total Revenues NT$ US$
% of Total Revenues
North America ............. 33,089,214 65 24,930,813 65 26,922,752 775,872 59 Taiwan ......................... 12,639,373 25 10,222,723 27 11,342,210 326,865 25 Europe.......................... 1,905,646 4 1,508,919 4 2,766,981 79,740 6 Others........................... 3,259,144 6 1,705,371 4 4,554,895 131,264 10
50,893,377 100 38,367,826 100 45,586,838 1,313,741 100
F-36

2) Long-lived Assets:
December 31,
2001 2002
NT$
% of Total Long-lived
Assets NT$ US$
% of Total Long-lived
Assets
Taiwan ................................................................................... 43,724,466 72 47,958,294 1,382,083 76 Rest of Asia ........................................................................... 13,482,411 22 13,288,531 382,955 21 North America ....................................................................... 3,348,228 6 1,842,045 53,085 3
60,555,105 100 63,088,870 1,818,123 100
b. Major customers
Customers accounting for 10% or more of total revenues are shown below:
Year Ended December 31,
2000 2001 2002
NT$ % of Total Revenues NT$
% of Total Revenues NT$ US$
% of Total Revenues
Motorola, Inc ................................ 11,256,760 22 7,164,415 19 7,703,767 222,011 17 VIA Technologies Inc .................. 5,185,434 10 4,413,854 12 3,837,476 110,590 8
F-37

c. Segment Information
The Company has three reportable segments under ROC GAAP: packaging, testing and investing. The Company packages bare semiconductors into finished semiconductors with enhanced electrical and thermal characteristics; provides testing services, including front-end engineering testing, wafer probing and final testing services; and engages in investing activities. The accounting policies of the segments are the same as those described in Note 2. Segment information for the years ended December 31, 2000, 2001 and 2002 is as follows:
Packaging Investing All Other Total
NT$ NT$ NT$ NT$ NT$
2000 12,911,073 —
(1,739,276)
Expenditures for segment assets...........
Revenue from external customer........... 38,028,799 2,001,604 52,941,476 Inter-segment revenues.......................... — (142,712) — (1,905,387) (2,048,099) Interest revenue ..................................... 265,737 45,112 182,915 60,416 554,180 Interest expense ..................................... 1,200,236 375,257 461,791 54,954 2,092,238 Net interest revenue (expense) .............. (934,499) (330,145) (278,876) 5,462 (1,538,058) Depreciation and amortization .............. 4,423,814 3,815,237 59,704 295,044 8,593,799 Segment profit (loss) ............................. 6,191,070 3,541,102 (1,125,536) (203,076) 8,403,560 Segment asset ........................................ 53,385,822 31,155,426 16,810,253 6,989,663 108,341,164 Expenditures for segment assets ........... 12,412,225 14,720,913 — 4,330,313 31,463,451
2001 Revenue from external customer........... 28,928,185 9,637,615 — 2,684,736 41,250,536 Inter-segment revenues.......................... (30,000) (178,340) — (2,674,370) (2,882,710) Interest revenue ..................................... 283,733 36,138 172,866 10,866 503,603 Interest expense ..................................... 1,260,786 310,571 565,071 106,451 2,242,879 Net interest expense .............................. (977,053) (274,433) (392,205) (95,585) Depreciation and amortization .............. 5,186,067 5,466,435 24,489 450,294 11,127,285 Segment profit (loss) ............................. (2,786,577) (1,195,344) 800,266 196,156 (2,985,499) Segment asset ........................................ 51,397,373 32,968,822 11,508,993 10,451,144 106,326,332 Expenditures for segment assets ........... 5,879,357 4,415,168 — 1,271,164 11,565,689
2002 Revenue from external customer........... 35,814,644 10,060,635 — 3,299,756 49,175,035 Inter-segment revenues.......................... (14,291) (276,628) — (3,297,278) (3,588,197) Interest revenue ..................................... 277,096 12,619 90,127 12,751 392,593 Interest expense ..................................... 1,109,241 183,967 639,896 38,124 1,971,227 Net interest expense .............................. (832,145) (171,348) (549,769) (25,373) (1,578,634) Depreciation and amortization .............. 5,743,420 5,679,224 738 674,399 12,097,781 Segment profit (loss) ............................. 1,304,013 (2,797,405) (654,314) (561,999) (2,709,705) Segment asset ........................................ 53,667,786 31,338,672 8,099,495 11,763,405 104,869,358 Expenditures for segment assets ........... 9,054,519 4,393,023 — 2,297,079 15,744,621
2002 Revenue from external customer .......... 1,032,122 289,932 — 95,094 1,417,148 Inter-segment revenues......................... (412) (7,972) — (95,022) (103,406) Interest revenue..................................... 7,985 364 2,597 368 11,314 Interest expense .................................... 31,967 5,302 18,441 1,098 56,808 Net interest expense.............................. (23,981) (4,938) (15,844) (731) (45,494) Depreciation and amortization.............. 165,517 163,666 21 19,435 348,639 Segment profit (loss)............................. 38,573 (81,610) (18,856) (16,196) (78,089) Segment asset........................................ 1,546,622 903,132 233,415 339,003 3,022,172
260,937 126,600 — 66,198 453,735
Testing
25. Acquisitions
In May 1999, ASE Test acquired 70% equity of ISE Labs, which is engaged in the testing and packaging of semiconductors. The purchase price, including transaction costs, approximated US$100.1 million (NT$3,473.5 million), and was paid in May 1999. In 2000, ASE Test purchased additional shares of ISE Labs in connection with a capital increase of ISE Labs for US$70.0 million (NT$2,429.0 million), purchased ISE Labs’ shares from minority shareholders for US$0.9 million (NT$31.2 million), and consequently owned an 80.0% equity interest in ISE Labs. In January 2002, ASE Test purchased the remaining 20.0% equity interest in ISE Labs from minority shareholders for US$50.2 million (NT$1,741.9 million). At December 31, 2002, the total investment amount in ISE Labs was US$221.2 million (NT$7,675.6 million).
F-38

In July 1999, the Company and ASE Test purchased equity interests of 70.0% and 30.0%, respectively, in the Motorola SPS Businesses held through ASE Chung Li and ASE Korea, respectively. Both ASE Chung Li and ASE Korea are engaged in the packaging and testing of semiconductors. The total purchase price was approximately US$350.1 million (NT$12,148.5 million). ASE Test financed its portion of the purchase price with a US$160.0 million convertible notes offering completed in June 1999 by ASE Test Finance Limited (see Note 13), which was guaranteed by ASE Test. In addition, a portion of the purchase price would be paid by the Company in three annual installments ending in July 2002, contingent upon certain targets of revenue from packaging and testing services provided to Motorola being met. The Company was able to reasonably estimate the contingent amount and recorded US$70.0 million (NT$2,429.0 million) as a payable at the time of purchase. The contingent portion of US$23.3 million (NT$808.5 million) was due in July 2002. In 2002, the Company and Motorola re-negotiated the agreement for the payment of final installment to take place in three smaller installments ending in July 2004 contingent upon certain targets of revenue from packaging and testing services provided to Motorola being met.
As of December 31, 2002, US$254.3 million (NT$8,824.2 million) has been paid to Motorola and the remaining amount of US$95.8 million (NT$3,324.3 million) is to be paid as follows:
Amount
NT$ US$
Within this year............................................................................................................ 962,758 27,745 Within the following year and after ............................................................................. 2,364,360 68,137 3,327,118 95,882
The Company has provided a guarantee to Motorola for the above payments.
The acquisitions of the Motorola SPS Businesses and ISE Labs were accounted for by the purchase method. Assets acquired and liabilities assumed have been recorded at their estimated fair values as of the acquisition date. The purchase prices exceeded the fair value of the net tangible assets by approximately US$81.9 million for Motorola SPS Businesses and US$76.5 million for ISE Labs. The purchase price in excess of fair value of net tangible assets was allocated to various tangible and intangible assets, which will be amortized on a straight-line basis over 3 to 38 years.
The purchase prices, net book value and calculation of excess amount for those acquisitions described above are as follows:
Acquirees Purchase
Price Net Book
Value Excess
US$ US$ US$ (in millions)
ISE Labs.................................................................................................................... 100.1 23.6 76.5 Motorola SPS Businesses ......................................................................................... 350.1 268.2 81.9
The excess purchase price was allocated as follows:
Item ISE Labs Motorola SPS
Businesses
US$ US$ (in millions)
Write-up of land...................................................................................................................... 2.5 87.7 Write-up (write-down) buildings ............................................................................................ 2.7 (11.5) Write-up (write-down) machinery .......................................................................................... 9.0 (8.4) Deferred tax liability ............................................................................................................... (5.7) — Goodwill ................................................................................................................................. 68.0 14.1 76.5 81.9
F-39

In the first quarter of 2000, ASE Test adjusted its allocation of purchase price by reducing the allocation to land by US$0.2 million, buildings by US$2.3 million, machinery by US$2.3 million, deferred tax liabilities by US$1.9 million and increasing the allocation to goodwill by US$3.8 million because impairment loss incurred arising from the disposition of the packaging operation of ISE Labs, which was a pre-acquisition contingency at the date of acquisition.
The purchase prices for Motorola SPS Businesses and ISE Labs acquisitions, are respectively allocated as follows:
ISE Labs Motorola SPS
Businesses
US$ US$ (in millions)
Cash .................................................................................................................................. 4.3 45.2 Accounts receivable .......................................................................................................... 14.3 30.3 Other current assets........................................................................................................... 0.7 6.9 Fixed assets—net .............................................................................................................. 82.5 302.8 Other assets ....................................................................................................................... 3.5 2.6 Goodwill ........................................................................................................................... 68.0 14.1 Total liabilities .................................................................................................................. (59.4) (51.8) Minority interest ............................................................................................................... (13.8) — 100.1 350.1 26. Summary of Significant Differences Between Accounting Principles Followed by the Company and Accounting Principles Generally Accepted in the United States
The Company’s consolidated financial statements have been prepared in accordance with ROC GAAP, which differ in the following respects from US GAAP:
a. Pension Benefits
The Company adopted US Statement of Financial Accounting Standards (“US SFAS”) No. 87, “Accounting for Pensions”, on January 1, 1987. A portion of the unrecognized net transition obligation at the adoption date is to be allocated directly to equity. ROC SFAS No. 18, which is substantially similar in many aspects to US SFAS No. 87, was effective in 1996 for listed companies in Taiwan. Therefore, pension expense due to different adoption dates is adjusted.
b. Short-term Investments
Under ROC GAAP, marketable equity securities are carried at the lower of aggregate cost or market, and debt securities are carried at cost, with only unrealized losses recognized. Under US SFAS No. 115, “Accounting for Certain Investments in Debt and Equity Securities”, debt and equity securities that have readily determinable fair values are to be classified as either trading, available-for-sale or held-to-maturity securities. Debt securities that the Company has the positive intent and ability to hold to maturity are classified as held-to-maturity securities and reported at amortized cost. Debt and equity securities that are bought and traded for short-term profit are classified as trading securities and reported at fair value, with unrealized gains and losses included in earnings. Debt and equity securities not classified as either held-to-maturity or trading are classified as available-for-sale securities and reported at fair value, with unrealized gains and losses excluded from earnings and reported as a separate component of shareholders’ equity.
All of the Company’s short-term investments are classified as trading securities under US GAAP, with gains and losses recognized currently in income. The unrealized gain included in earnings under US GAAP was NT$5,952 thousand in 2001 and unrealized loss of NT$38,844 (US$1,119) in 2002. All of the Company’s short-term investments in mutual funds, stock and convertible debt are held principally for the purpose of selling them in the near term.
c. Bonuses to Employees, Directors and Supervisors
According to ROC regulations and the Articles of Incorporation of the Company, a portion of distributable earnings should be set aside as bonuses to employees, directors and supervisors. Bonuses to directors and supervisors are always paid in cash. However, bonuses to employees may be granted in cash or stock or both. All of these appropriations, including stock bonuses which are valued
F-40

at par value of NT$10, are charged against retained earnings under ROC GAAP after such appropriations are formally approved by the board of directors and resolved by the shareholders in the following year. Under US GAAP, such bonuses are charged against income currently in the year earned. Stock issued as part of these bonuses is recorded at fair market value. Since the amount and form of such bonuses are not finally determinable until the board of directors meeting in the subsequent year, the total amount of the aforementioned bonuses (“regular bonuses”) is initially accrued based on the management’s estimate regarding the amount to be paid based on the Company’s Articles of Incorporation. Any difference between the initially accrued amount and the fair market value of the bonuses settled by the issuance of shares is recognized in the year of approval by the board of directors. The management estimates that the regular annual bonuses from above appropriations, including cash and stock, will approximate three to four months’ salaries and wages.
Aside from the aforementioned regular bonus plan, the Company granted a special stock bonus to employees amounting to NT$1,536,396 in 1997 and NT$2,506,617 in 2000. Employees who received the special stock bonus are required to continue working for the Company for an additional three years. Accordingly, the amount of special stock bonuses is being allocated over three years as additional compensation expense in the consolidated statement of income under US GAAP.
d. Treasury Stock
The common shares of the Company that are held by consolidated subsidiaries are, under US GAAP, reflected as treasury stock in the consolidated balance sheet. Also, under US GAAP, the minority interest reflected in the statements of income is adjusted to reflect the equity of the minority shareholders on the subsidiary’s equity in the net income of the Company. The mutual or reciprocal holdings had no material effect on the minority interest reported in the consolidated statements of income. In addition, under US GAAP, the denominator used in calculating EPS is reduced by the number of the Company’s common shares held by the subsidiary as of the date the subsidiary acquired the shares. The adjustment to the denominator is 135,867,641 shares in 2000 and 164,441,865 shares in 2001, respectively. The capital gain (loss) from sales of treasury stock is deducted from or added to the consolidated balance of capital surplus.
Beginning January 1, 2002, the Company adopted ROC SFAS No. 30, “Accounting for Treasury Stock”, which requires shares of parent stock held by subsidiaries to be recorded as treasury stock. The effect is similar to US GAAP except the reduction of the minority share of treasury stock is required under ROC GAAP. Prior to 2002, common shares of the Company held by subsidiaries were presented as a long-term investment in the consolidated balance sheets with the gain or loss on the sale of the treasury stock reflected in the consolidated statements of income.
e. Depreciation of Buildings
Under ROC GAAP, the estimated life of a building can be as long as 40 years based on ROC practices. For US GAAP purposes, the useful lives of buildings is estimated to be 25 years.
f. Excess of Book Value on Transfer of Buildings Between Consolidated Subsidiaries
ASE Test, Inc., a consolidated subsidiary, purchased buildings and facilities from another consolidated subsidiary, ASE Technologies, in 1997. The purchase price from ASE Technologies was based on market value. Such additional payment for the excess of book value of NT$17,667 thousand was capitalized by ASE Test, Inc. as allowed under ROC GAAP. Under US GAAP, transfers of assets between related parties should not be recorded by the transferee at stepped-up values.
g. Gain on Sales of Subsidiary’s Stock
The carrying value of stock investments in ASE Test by J&R Holding under ROC GAAP is different from that under US GAAP mainly due to the differences in accounting for bonuses to employees, directors and supervisors.
h. Effects of US GAAP Adjustments on Equity-Method Investments
The carrying values of equity-method investments and the investment income (loss) accounted for by the equity method in HCDC, HCKC and USI are reflected in the consolidated financial statements under ROC GAAP. The financial statements of these equity investees prepared under ROC GAAP are different from the financial statements of such equity investees prepared under US GAAP mainly due to the differences in accounting for bonuses to employees, directors and supervisors and depreciation of buildings.
F-41

Therefore, the investment income (loss) has been adjusted to reflect the differences between ROC GAAP and US GAAP in the investees’ financial statements.
i. Impairment of Long-lived Assets
Under US GAAP, in accordance with US SFAS No. 144, “Accounting for the Impairment or Disposal of Long-Lived Assets”, long-lived assets held and used by the Corporation are reviewed for impairment whenever events or changes in circumstances indicate that the carrying amount of an asset may not be recoverable. For purposes of evaluating the recoverability of long-lived assets, the recoverability test is performed by comparing undiscounted net cash flows of the assets against the net book value of the assets. If the recoverability test indicates that an impairment has occurred, the impairment loss is the amount of the asset’s net book value in excess of the related fair value. As there are no requirements related to the evaluation of recoverability of impairment of long-lived assets under ROC GAAP, the Company has selected the same accounting for impairment of long-lived assets as US SFAS No. 144 for both ROC GAAP and US GAAP reporting.
j. Stock Dividends
Under ROC GAAP, stock dividends are recorded at par with a charge to retained earnings. Under US GAAP, if the ratio of distribution is less than 25 percent of the same class of shares outstanding, the fair value of the shares issued should be charged to retained earnings. The difference for 2001 stock dividends would be treated as an additional reduction to retained earnings and increase to capital surplus amounting to NT$3,181 million (US$92 million).
k. Stock Option Compensation
For US GAAP reporting, the Company has elected to follow Accounting Principles Board (“APB”) Opinion No. 25, “Accounting for Stock Issued to Employees”, which measures compensation expense based on the difference, if any, between the market price of the underlying common shares and the exercise price of the stock option on the date of the grant. The Corporation is required under US SFAS No. 123, “Accounting for Stock-based Compensation”, to disclose the pro forma information regarding option grants to its employees computed as if the fair value method had been applied.
In May 2001, ASE Test’s directors exercised their stock options for 2,480,000 shares at US$3.50 per share under the 1996 option plan. The Company decided, based on resolution of its Board of Directors, to purchase these shares from the directors at the prevailing market price of US$14.27 per share on the same day the options were exercised. Under ROC GAAP, such a share purchase is accounted for as additional investments of ASE Test’s shares by the Company. However, under US GAAP, the purchase of shares from employees within six months after exercise of a vested option creates a compensation expense equal to the difference between the market price of the share on the date of exercise and the market price on the date the options were granted. Consequently, compensation expense of NT$908,661 (US$26,186) was recorded by ASE Test.
l. Derivative Financial Instruments
There are no specific accounting standards under ROC GAAP which address measurement for derivative instruments, except for foreign-currency forward contracts. Under ROC GAAP, foreign-currency forward contracts are accounted for in a manner similar to that required under US SFAS No. 52. Under US GAAP, accounting for derivative instruments is covered under US SFAS No. 133, as amended by US SFAS No. 138, which requires that all entities recognize derivative instruments as assets and liabilities in the statement of financial position at fair value. If certain conditions are met, entities may elect to designate a derivative instrument as a hedge. Under US GAAP, the Company does not apply hedge accounting, and derivatives have historically been, and continue to be, recorded on the consolidated balance sheet at fair value, with the changes in fair values recorded through current period earnings.
m. Goodwill
Under ROC GAAP, the Company amortizes goodwill arising from acquisitions over five to twenty years. Under US GAAP, the Corporation adopted the provisions of US SFAS No. 142 on January 1, 2002. US SFAS No. 142 requires the Company to review for possible impairment of goodwill existing at the date of adoption and perform subsequent impairment tests on at least an annual basis. In addition, existing goodwill and intangible assets must be reassessed and classified consistently in accordance with the criteria set forth in US SFAS No. 141 and US SFAS No. 142. As a result, the Company will no longer amortize goodwill. Definite lived intangible assets will continue to be amortized over their estimated useful lives. The Company completed its transitional impairment
F-42

test on January 1, 2002 and found no impairment. The Company performed its annual impairment test during the fourth quarter and determined the goodwill related to the acquisition of ASE Test was impaired and recorded a charge of NT$2,213,045 (US$63,777). Total amortization expenses of goodwill under ROC GAAP in 2000, 2001 and 2002 are NT$559,807, NT$692,919 and NT$815,573 (US$23,504), respectively.
n. Undistributed Earnings Tax
Undistributed earnings generated after 1997 are subject to a 10% tax in compliance with the Income Tax Law of the ROC. Under ROC GAAP, the 10% tax on undistributed earnings is recorded as an expense at the time shareholders resolve that the Company’s earnings shall be retained. Under US GAAP, the Company measured its income tax expense, including the tax effects of temporary differences, using the rate that includes the tax on undistributed earnings.
o. Impairment of Long-term Investments
ROC GAAP and US GAAP require an assessment of impairment of long-term investments whenever events or circumstances indicate a decline in value may be other than temporary. The criteria for determination are similar under ROC GAAP and US GAAP; however, the methods to measure the amount of impairment may be based on different estimates of fair values depending on the circumstances. When impairment is determined to have occurred, US GAAP requires the market price to be used, if available, to determine the fair value of the long-term investment and measure the amount of impairment at the reporting date. Under ROC GAAP, if the market price is deemed to be a result of an inactive market, another measure of fair value may be used. As such, the Company determined an other-than-temporary impairment occurred in one of its long-term investments in an equity-method investee at December 31, 2002. The amount recorded for ROC GAAP was based on the difference between the carrying value and the net-asset value of the investee with adjustments made to significant assets of the investee as determined using appraised values and other appropriate information. The amount recorded for US GAAP was based on the market price of the stock of the investee at December 31, 2002. The difference resulted in an additional impairment charge for 2002 under US GAAP of NT$883.6 million (US$25.5 million).
The following reconciles net income (loss) and shareholders’ equity under ROC GAAP as reported in the consolidated financial statements to the approximate net income (loss) and shareholders’ equity amounts as determined under US GAAP, giving effect to adjustments for the differences listed above.
Year Ended December 31,
2000 2001 2002
NT$
NT$ NT$ US$
(In Thousands, Except Per Share and ADS Data)
Net income (loss) Net income (loss) based on ROC GAAP ............................ 5,837,149 (2,142,219) 129,035 3,719 Adjustments:
a. Pension benefits ......................................................... 5,635 2,755 2,619 75 b. Short-term investments .............................................. 22,354 5,952 (38,844) (1,119) c. Bonuses to employees, directors and
supervisors: Accrued regular bonuses............................................ (929,348) — — — Special stock bonuses ................................................ (929,901) (963,572) (835,539) (24,079)
e. Depreciation of building ............................................ (32,127) (48,803) (99,981) (2,881) f. Excess of book value of building transferred
between consolidated subsidiaries............................. 432 432 432 12 g. Restate carrying value and related capital gain
from sale of long-term investment............................. — 39,002 — —
(51,825) (33,785) 198,839 5,730 k. Stock option compensation........................................ — (908,661) — — m. Goodwill:
Amortization — — 815,573 23,504 Impairment loss.......................................................... — — (2,213,045) (63,777)
o. Impairment loss on equity-method investee.............. — — (883,620) (25,465) Effect of US GAAP adjustments on income tax................. 6,553 6,978 10,783 311
h. Effects for US GAAP adjustments on equity-method investees ........................................................
F-43

Year Ended December 31,
2000 2001 2002
NT$ NT$ NT$ US$
(In Thousands,
Except Per Share and ADS Data)
Effect of US GAAP adjustments on minority interest........ 1,074 (4,682) (160,517) (4,626) Net decrease in net income.................................................. (1,907,153) (3,203,300) (92,315)
Net income (loss) based on US GAAP ............................... 3,929,996 (4,046,603) (3,074,265) (88,596) Earnings (loss) per share
Basic................................................................................ 1.34 (1.32) (0.99) (0.03) Diluted 1.29 (1.32) (0.99) (0.03)
Earnings (loss) per ADS Basic................................................................................ 6.69 (6.59) (4.97) (0.14) Diluted ............................................................................ 6.47 (6.59) (4.97) (0.14)
Number of weighted average shares outstanding ............... 2,938,004,535 3,071,234,458 3,090,678,225 3,090,678,225 Number of ADS................................................................... 587,600,907 614,246,892 618,135,645 618,135,645
(1,904,384)
Year Ended December 31,
2000 2001 2002
NT$ NT$ NT$ US$
Shareholders’ equity 43,669,214
Shareholders’ equity based on ROC GAAP ....................... 41,946,321 39,430,666 1,136,331
a. Pension benefits ......................................................... (42,159) (39,404) (36,785) b. Restatement of short-term investments ..................... 34,938 40,890 59 c. Bonuses to employees, directors and supervisors ..... (113,600) — — d. Treasury stocks
487,752 367,662 367,662 10,595 Classification or adjustment of treasury stock........... (2,919,411) (3,017,964) (378,138) (10,897)
e. Effect of US GAAP adjustments on useful life......... (127,423) (176,226) (276,207) (7,960) f. Excess of book value of building transferred
between consolidated subsidiaries............................. (16,191) (15,759) (15,327) (442) g. Restate carrying value of subsidiaries’ long-term
investment .................................................................. (47,621) (8,619) (8,619) (248) h. Effects of US GAAP adjustments on equity-
method investments ................................................... (238,873) (272,658) (73,819) (2,127) k. Stock option compensation........................................ — (908,661) (908,661) (26,186) m. Goodwill:
Amortization .............................................................. — — 815,573 23,503 Impairment loss.......................................................... — — (2,213,045) (63,777)
o. Impairment loss on equity-method investee.............. — — (883,620) (25,465) Effect of US GAAP adjustments on income tax................. 21,723 28,701 39,484 1,138 Effect of US GAAP adjustments on minority interest........ 20,741 16,059 (144,458) (4,163) Net decrease in shareholders’ equity................................... (2,940,124) (3,985,979) (3,713,914)
Shareholders’ equity based on US GAAP .......................... 40,729,090 37,960,342 35,716,752 1,029,301 Changes in shareholders’ equity based on US
GAAP Balance, beginning of year.................................................. 26,569,687 40,729,090 37,960,342 1,093,958 Convertible bonds converted into common shares ............. 35,653 — — — Capital increase in cash through the Issuance of
American Depositary shares........................................... 4,137,910 — — — Net income (loss) for the year .............................................
1,811,607 963,572 894,255
3,405,909
3,929,996 (4,046,603) (3,074,265) (88,596) Adjustment for common shares issued as bonuses to
employees, directors and supervisors ............................. 835,539 24,079 Translation adjustment for subsidiaries .............................. 749,128 (126,378) (3,642) Adjustment from changes in ownership percentage of
investees.......................................................................... (320,785) 102,888 2,965 Unrealized loss on long-term investment in shares of
stock ................................................................................ (59,077) (15,508) 18,626 537 Effect of change in exchange rate ....................................... 3,150 — — — Purchase of treasury stock................................................... — (98,552) — —
Adjustments: (1,060)
2,046 —
Reversal of unrealized loss ........................................
(107,030)
F-44

Year Ended December 31,
2000 2001 2002
NT$ NT$ NT$ US$
Balance, end of year ............................................................ 40,729,090 37,960,342 35,716,752 1,029,301
A reconciliation of the significant balance sheet accounts under ROC GAAP to the amounts as determined under US GAAP is as
follows:
December 31,
2001 2002
NT$ NT$ US$
Short-term investments As reported............................................................... 4,601,172 2,038,020 58,733 US GAAP adjustments
Restatement of investments to fair value ............. 40,890 2,046 59 As adjusted............................................................... 4,642,062 2,040,066 58,792 Long-term investments As reported............................................................... 9,530,398 6,566,734 189,243 US GAAP adjustments
Treasury stock ...................................................... (2,649,484) — — Equity-method investments.................................. (272,658) (73,819) (2,127) Impairment loss.................................................... — (883,620) (25,464)
As adjusted............................................................... 6,608,256 5,609,295 161,652 Buildings and improvement As reported............................................................... 14,640,855 16,656,394 480,011 US GAAP adjustments
Effect of US GAAP adjustments on useful life..................................................................... (176,226) (276,207) (7,960)
Excess of book value of building transferred between consolidated subsidiaries.................... (15,759) (15,327) (442)
As adjusted............................................................... 14,448,870 16,364,860 471,609 Other assets As reported............................................................... 1,342,269 2,640,187 76,086 US GAAP adjustments
Effect of US GAAP adjustments on income tax ..................................................................... 28,701 39,484 1,138
As adjusted 1,370,970 2,679,671 77,224 Consolidated debits As reported............................................................... 5,248,919 5,541,808 159,706 US GAAP adjustments Restated carrying value of subsidiaries’ long-
term investment.................................................... (917,280) (917,280) (26,434) Goodwill amortization ......................................... — 815,573 23,503 Goodwill impairment loss .................................... — (63,777)
As adjusted............................................................... 4,331,639 92,998 Accrued pension cost As reported............................................................... 294,438 416,671 12,008 US GAAP adjustments
Pension benefits ................................................... 39,404 1,060 As adjusted............................................................... 333,842 453,456 13,068
(2,213,045) 3,227,056
36,785
F-45

As a result of the adjustments presented above, the amounts of total assets based on US GAAP were NT$102,364,516 and NT$101,347,163 (US$2,920,667) as of December 31, 2001 and 2002, respectively. Total liabilities based on US GAAP were NT$52,277,056 and NT$55,397,148 (US$1,596,459) as of December 31, 2001 and 2002, respectively.
27. Additional Disclosures Required by US GAAP
a. Recent accounting pronouncements
In June 2001, the FASB issued US SFAS No. 143, “Accounting for Asset Retirement Obligations”. The statement requires, among other provisions, retirement obligations to be recognized when they are incurred and displayed as liabilities, with a corresponding amount capitalized as part of the related long-lived asset. The capitalized element is required to be expensed using a systematic and rational method over its useful life. US SFAS No. 143 will be adopted by the Corporation on January 1, 2003 and is not expected to have a material impact on the Company’s US GAAP financial information.
In April 2002, the FASB issued US SFAS No. 145, “Rescission of FASB Statements No. 4, 44, and 64, Amendment of FASB Statement No. 13, and Technical Corrections”. Among other things, this statement rescinds FASB Statement No. 4, “Reporting Gains and Losses from Extinguishment of Debt”, which required all gains and losses from the early extinguishment of debt to be aggregated and, if material, classified as extraordinary. This statement now requires those gains and losses to be classified as unusual and infrequently occurring events and transactions. The statement was effective upon issuance in April 2002 for prospective transactions. The adoption of this statement would require the Company to reclassify the extraordinary loss recognized for ROC GAAP to unusual and unfrequent events for US GAAP. The Company’s management believes there is no impact to other financial information under US GAAP.
In June 2002, the FASB issued US SFAS No. 146, “Accounting for Costs Associated with Exit or Disposal Activities”. US SFAS No. 146 requires that a liability for a cost associated with an exit or disposal activity should be measured at fair value and recorded when it meets the definition of a liability in FASB Concepts Statement No. 6, “Elements of Financial Statements”. US SFAS No. 146 superceded EITF No. 94-3, “Liability Recognition for Certain Employee Termination Benefits and Other Costs to Exit and Activity (Including Certain Costs Incurred in Restructuring)”, which required recognition of a liability for costs associated with an exit or disposal activity when the company committed to an exit/disposal plan. US SFAS No. 146 is effective for exit or disposal activities initiated after December 31, 2002. Restatement of prior periods is not required. US SFAS No. 146 applies to future restructuring activities and the application of US SFAS No. 146 has no impact on the Company’s US GAAP financial information.
In December 2002, the FASB issued US SFAS No. 148, “Accounting for Stock-Based Compensation—Transition and Disclosure”, and amended US SFAS No. 123 “Accounting for Stock Based Compensation”. This statement provides alternative methods of transition for an entity that voluntarily changes to the fair value based method of accounting for stock-based employee compensation. It also amends the disclosure provisions of that statement to require prominent disclosure about the effects on reported net income of an entity’s accounting policy decisions with respect to stock-based employee compensation. This statement is effective January 1, 2003. The Company has elected not to account for stock-based employee compensation using the fair value based method of accounting set forth in US SFAS No. 123 and US SFAS No. 128, but to continue to provide the disclosure requirements under US SFAS No. 123. Accordingly, this statement will not affect the consolidated financial statement of the Company until the Company decides to adopt the fair value based method of accounting set forth in US SFAS No. 123 and US SFAS No. 128.
In November 2002, the FASB issued FASB Interpretation (“FIN”) No. 45, “Guarantor’s Accounting and Disclosure Requirements for Guarantees, Including Indirect Guarantees of Indebtedness of Others”. The interpretation elaborates on the existing disclosure requirements for most guarantees, including loan guarantees such as standby letters of credit. It also clarifies that at the time a company issues a guarantee, the company must recognize an initial liability for the fair value, or market value, of the obligations it assumes under the guarantee and must disclose that information on its interim and annual financial statements. The provisions related to recognizing a liability at inception of the guarantee for the fair value of the guarantor’s obligations does not apply to product warranties or to guarantees accounted for as derivatives. The initial recognition and initial measurement provisions apply on a prospective basis to guarantees issued or modified after December 31, 2002. The Company is in the process of assessing the impact and currently believes the adoption of recognition and initial measurement requirements of FIN No. 45 will not have a material impact on its financial position, cash flows or results of operations.
In January 2003, the FASB issued FIN No. 46, “Consolidation of Variable Interest Entities—an interpretation of Accounting Research Bulletin No. 51. FIN No. 46 requires a primary beneficiary to consolidate a variable interest entity (“VIE”) if it has a VIE
F-46

that will absorb a majority of the entity’s expected losses if they occur, receive a majority of the entity’s expected residual returns if they occur, or both. FIN No. 46 applies immediately to VIEs created after January 31, 2003, and to VIEs in which the entity obtains an interest after that date. For VIEs acquired before February 1, 2003, the effective date for compliance is July 1, 2003. The Company is currently in the process of determining the impact of this statement on its results of operations, financial position and cash flows.
In November 2002, the FASB Emerging Issues Task Force (“EITF”) reached a consensus on EITF 00-21, “Revenue Arrangements with Multiple Deliverables”, related to the timing of revenue recognition for arrangements in which goods or services or both are delivered separately in a bundled sales arrangement. The EITF requires that when the deliverables included in this type of arrangement meet certain criteria, they should be individually accounted for as separate units of accounting. This may result in a difference in the timing of revenue recognition but will not result in a change in the total amount of revenue recognized in a bundled sales arrangement. The allocation of revenue to the separate deliverables is based on the relative fair value of each item. If the fair value is not available for the delivered items, a residual method must then be used. This method requires the full fair value amount to be allocated to the undelivered items. This would result in a discount, if any, being allocated to the delivered items. This consensus is effective for arrangements entered into in fiscal periods beginning after June 15, 2003. The Company does not believe that the consensus will have a significant impact on its results of operations, financial position and cash flows.
b. Pension
Set forth below is pension information disclosed in accordance with US SFAS No. 132:
Year Ended December 31,
2000 2001 2002
NT$
Service cost ............................................................................
8
NT$ NT$ US$
Components of net periodic benefit cost 120,528 116,657 191,707 5,525
Interest cost ............................................................................ 30,241 28,968 36,102 1,040 Expected return on plan assets .............................................. (14,575) (21,630) (23,003) (663) Amortization of prior service cost ......................................... 1,468 1,557 45
Net periodic benefit cost............................................................. 136,202 125,463 206,363 5,947 Changes in benefit obligation Benefit obligation at beginning of year...................................... 465,674 650,032 722,024 20,808
Service cost ............................................................................ 120,528 116,657 191,707 5,525 Interest cost ............................................................................ 30,241 28,968 36,102 1,040 Actuarial (gain) loss............................................................... 34,025 (69,978) 288,441 8,312 Benefits paid .......................................................................... (436) (3,655) (145)
722,024 1,238,129
Fair value of plan assets at beginning of year ............................ 208,289 311,737 412,036 Actual return on plan assets................................................... 12,408 13,324 10,157 293 Employer contribution........................................................... 91,476 85,050 2,451 Benefits paid .......................................................................... (436) (3,493) (145) (4)
311,737 412,036 507,098 14,614 Funded Status ............................................................................. 338,295 309,988 731,031 21,067 Unrecognized actuarial gain (loss)............................................. (45,795) 26,947
336,935 460,390 13,268
(4) Benefit obligation at end of year ................................................ 650,032 35,681 Change in plan assets
11,874
90,468
(270,641) (7,799) Net amount recognized (recognized as accrued pension
cost)........................................................................................ 292,500
Actuarial assumptions:
2000 to 2002
Discount rate ................................................................................................................................. 3.5% to 6.0% Rate of compensation increase...................................................................................................... 3.0% to 4.0% Expected return on plan assets ...................................................................................................... 3.5% to 6.0%
The Company has no other post-retirement or post-employment benefit plans.
F-47

c. Short-term investments
At December 31, 2001 and 2002, certain investments carried at cost under ROC GAAP were restated under US SFAS No. 115:
December 31,
2001 2002
Carrying
Value
Unrealized Holding Gains
Carrying Value Fair Value
Unrealized Holding Gains
Carrying Value Fair Value
Unrealized Holding Gains
NT$ NT$ NT$ NT$ NT$ NT$ US$ US$ US$
Short-term investments........... 4,601,172 4,642,062 40,890 2,038,020 2,040,066
d. Income tax expense (benefit)
Year Ended December 31,
2,046 58,733 58,792 59
Fair Value
2000 2001 2002
NT$ NT$ NT$ US$
Income tax currently payable (tax benefit) .................................... 1,080,704 (101,310) (66,469) (1,915) Net change in deferred income tax assets (liabilities) for the
period ......................................................................................... (158,691) (456,911) (1,261,021) (36,341) Income tax on undistributed earnings ............................................ 147,379 335,065 174,478 5,028 Adjustment of prior years’ income taxes ....................................... (10,177) 17,018 1,905 55
1,059,215 (206,138) (1,151,107) (33,173)
Reconciliation between the income tax calculated on pretax financial statement income based on the statutory tax rate and the
income tax expense (benefit) which conforms to US GAAP is as follows:
Year Ended December 31,
2000 2001 2002
NT$ NT$ NT$ US$
Tax (benefit) based on pre-tax accounting income (loss) at statutory rate ................................................. 2,732,461 (830,326) (1,064,135) (30,667)
Add (less) tax effects of:
Tax-exempt income —Tax holiday .................................................... (700,749) (26,413) (52,126)
Tax credits
342,563 139,224
Permanent differences
(1,502) —Gain from sale of securities............................ (51,415) (31,711) (16,798) (484) Bonus to employee and directors ....................... 464,812 240,893 52,221 1,505 Other .................................................................. 7,368 — 65,259 1,881
Utilized....................................................................... (1,231,247) (253,227) (331,255) (9,546) Deferred...................................................................... (299,217) 4,012
Income taxes (10.0%) on undistributed earnings............ 147,379 335,065 54,598 1,573 Adjustment of prior year’s income tax ........................... (10,177) 17,018 1,905 55
Income tax expense (benefit).......................................... 1,059,215 (206,138) (1,151,107) (33,173)
The abovementioned taxes on pretax accounting income (loss) at the statutory rates for domestic and foreign entities are shown below:
Year Ended December 31,
2000 2001 2002
NT$ NT$ NT$ US$
Domestic entities in ROC (25.0% statutory rate)............ 2,064,193 (752,228) (282,713) (8,147) Foreign entities
ASE Korea (30.8% statutory rate).............................. 2,153 — — — ISE Labs (33.0% statutory rate) ................................. 439,169 (92,487) (725,744) (20,915)
F-48

Year Ended December 31,
2000 2001 2002
NT$ NT$ NT$ US$
ASE Test Malaysia (30.0% statutory rate) ................. 226,946 14,389 (55,678) (1,605)
2,732,461 (830,326) (1,064,135) (30,667)
Deferred income tax assets and liabilities as of December 31, 2001 and 2002 are summarized as follows:
December 31,
NT$
966,689
1,101
Unrealized foreign exchange loss........................214,013
39,884 32,202
Current deferred income tax liabilities—unrealized foreign exchange gain........................
873,008 Non-current deferred income tax assets
Unused tax credits ............................................... 1,648,956 2,324,529 66,990 Accrued pension costs......................................... 64,308 498,087 14,354 Loss carryforward ............................................... — 455,589 13,129 Others .................................................................. 126,173 151,576 4,368
1,839,437 3,429,781 98,841 Valuation allowance............................................ (639,188) (1,765,860) (50,889)
1,200,249 1,663,921 47,952 Non-current deferred income tax liabilities
Investment income .............................................. (636,815) (206,500) (5,951) Unrealized foreign exchange gain....................... (7,185) — — Goodwill amortization ........................................ (56,124) (35,658) (1,028) Others .................................................................. (245,234) (237,164) (6,835)
(945,358) (479,322) (13,814) 254,891 1,184,599 34,138
2001 2002
NT$ US$
Current deferred income tax assets Unused tax credits ............................................... 378,075 27,858 Provision for inventory obsolescence.................. 41,502 38,212 Accrued interest on convertible bonds ................ 163,289 — — Provision for doubtful accounts and sales
allowance......................................................... 68,432 23,305 672 108,721 49,351 1,422
Loss carryforward ............................................... — — Other ................................................................... 97,776 1,149
1,071,808 1,117,441 Valuation allowance............................................ (161,800) (23,000) (663)
910,008 1,094,441 31,539
(37,000) (10,000) (287) 1,084,441 31,252
e. Employee stock option plans
F-49

ASE Option Plan
Information regarding the Company’s employee stock option plan is as follows:
Outstanding Option Rights
Option Rights
Available Number of Option Weighted Average
Exercise
(In Thousands) (In Thousands) (NT$)
Option rights authorized .......................................................... 160,000 — — Options granted .................................................................... (145,989) 145,989 20.80 Options exercised ................................................................. — — — Options cancelled ................................................................. — — —
Balance, December 31, 2002 ................................................... 14,011 145,989 20.80 ASE Test Option Plan
ASE Test has five stock option plans, the 1996 Executive Management Option Plan (the “1996 Plan”), the 1997 Option Plan, the 1998 Option Plan, the 1999 Option Plan and the 2000 Option Plan. Up to 10,000,000 shares, 3,200,000 shares, 1,600,000 shares, 2,000,000 shares and 12,000,000 shares have been reserved for issuance under the 1996, 1997, 1998, 1999 and 2000 Option Plans, respectively.
The 1996, 1997, 1998, 1999 and 2000 Option Plans granted the following stock options to purchase the ASE Test shares which are exercisable based on a vesting schedule over a period of five years until the expiration of options, to directors, officers and key employees. If any granted shares are forfeited, the shares may be granted again, to the extent of any such forfeiture.
Each aforementioned option exercise price was equal to the stock’s market price on the date of grant. Options granted under the 1996, 1997 and 1998 Option Plans expire 5 years after grant. Options granted under the 1999 and 2000 Option Plan expire 10 years after grant.
Information regarding the option plans of ASE Test is presented below:
Number of Shares Weighted Average
Exercise Price Per ShareWeighted Average Grant
Date Fair Values
US$ US$
ASE Test Beginning balance—January 1, 2000 ................................... 12,624,374 9.07 Option granted...................................................................... 412,000 25.00 13.44 Option exercised................................................................... (1,263,041) 6.31 Option forfeited .................................................................... (287,184) 14.14 Ending balance—December 31, 2000 .................................. 11,486,149 9.82 Option granted...................................................................... 10,158,650 8.94 4.24 Option exercised................................................................... (5,221,508) 3.81 Option forfeited .................................................................... (114,706) 17.11 Ending balance—December 31, 2001 .................................. 16,308,585 11.15 Option granted...................................................................... 414,500 0.36 10.46 Option exercised................................................................... (2,420,591) 8.62 Option forfeited .................................................................... (882,051) 9.88 Option expired...................................................................... (89,080) 13.84 Ending balance—December 31, 2002 .................................. 13,331,363 11.55 Options exercisable at:
December 31, 2000........................................................... 6,902,529 6.13 December 31, 2001........................................................... 6,233,453 11.89 December 31, 2002........................................................... 5,199,349 13.50
F-50

Significant option groups outstanding at December 31, 2002 and the related weighted average exercise price and remaining contractual life information are as follows:
ASE Test Outstanding Exercisable
Shares Weighted
Average Price Shares Weighted
Average Price
Weighted Average
Remaining Life (Years)
US$ US$
Options with exercise price of: US$20.00-US$30.00......................................................... 2,833,440 20.70 1,904,200 20.52 5.3 US$11.00-US$16.50......................................................... 1,275,349 11.20 822,099 11.12 1.2 US$6.10-US$9.15............................................................. 9,222,574 8.79 2,473,050 8.88 8.1
Options outstanding at December 31, 2002.......................... 13,331,363 5,199,349
US SFAS No. 123, “Stock-Based Compensation”, effective in 1996, establishes accounting and disclosure requirements using a fair value-based method of accounting for stock-based employee compensation plans. Under US SFAS No. 123, the Company and ASE Test have elected to use the intrinsic value-based method and provide pro forma disclosures of net income and earnings per share as if the fair value accounting provisions of this statement had been adopted.
The Company and ASE Test have computed for pro forma disclosure purposes the fair value of each option grant, as defined by US SFAS No. 123, using the Black-Scholes option pricing model with the following assumptions:
ASE 2002
Risk-free interest rate............................................................................................................................... 3.88% Expected dividend yield........................................................................................................................... 0% Expected lives .......................................................................................................................................... 5 years Volatility .................................................................................................................................................. 58.76%
ASE Test 2000 2001 2002
Risk free interest rate ............................................................ 6.61-6.75% 3.62-4.66% 2.58-4.48%Expected dividend yield........................................................ 0% 0% 0% Expected lives ....................................................................... 3.4-5.0 years 3.4 years 5.0 years Volatility ............................................................................... 55.53% 62.14% 62.14%
For purposes of pro forma disclosure, the estimated fair value of the options are amortized to expense over the option rights vesting periods. Had the Company and ASE Test recorded compensation costs based on the estimated grant date fair value, as defined by US SFAS No. 123, the Company’s net income (loss) under US GAAP would have been reduced to the pro forma amounts below.
Year Ended December 31,
2000 2001 2002
NT$ NT$ NT$ US$
(In Thousands, Except Per Share and ADS Data)
Net income (loss) based on US GAAP .......................................... 3,929,996 (4,046,603) (3,074,265) (88,596) Stock-based compensation expense (net of related tax
effects) ....................................................................................... (247,800) (305,085) (331,872) (9,564)
Pro forma net income (loss) ........................................................... 3,682,196 (4,351,688) (3,406,137) (98,160) Reported EPS—Basic..................................................................... 1.34 (1.32) (0.99) (0.03)
—Diluted ................................................................................... 1.29 (1.32) (0.99) (0.03) Pro forma EPS—Basic ................................................................... 1.25 (1.42) (1.10) (0.03)
—Diluted ................................................................................... 1.21 (1.42) (1.10) (0.03) Reported EPS per ADS—Basic ..................................................... 6.69 (6.59) (4.97) (0.14)
—Diluted ................................................................................... 6.47 (6.59) (4.97) (0.14) Pro forma EPS per ADS—Basic.................................................... 6.27 (7.08) (5.51) (0.16)
—Diluted ................................................................................... 6.05 (7.08) (5.51) (0.16)
F-51

The pro forma amounts reflect compensation expense related to 1996, 1997, 1998, 1999 and 2000 option plans of ASE Test granted and vested only. In future years, the annual compensation expense may increase relative to the fair value of the options granted and vested in those future years.
f. According to US SFAS No. 130, the statement of comprehensive income (loss) for the years ended December 31, 2001 and 2002 are present below:
Year Ended December 31,
2000 2001 2002
NT$ NT$ NT$ US$
Net income (loss) based on US GAAP......................... 3,929,996 (4,046,603) (3,074,265) (88,596) Translation adjustment on subsidiaries—net of
income tax expense of NT$223,564 and NT$187,282 in 2000 and 2001 and income tax benefit of NT$31,595 in 2002, respectively ............. 670,691 561,846 (94,783) (2,731)
Comprehensive income (loss)....................................... 4,600,687 (3,484,757) (3,169,048) (91,327)
g. US GAAP cash flow information
The following represents the major caption of cash flow under US GAAP pursuant to US SFAS No. 95:
Year Ended December 31,
2000 2001 2002
NT$ NT$ NT$ US$
Cash flows Net cash provided by operating activities............. 17,308,069 10,595,115 11,313,800 326,046 Net cash used in investing activities..................... (33,392,038) (14,082,951) (13,167,238) (379,459) Net cash provided by financing activities............. 17,759,155 618,555 530,491 15,288 Net increase (decrease) in cash............................. 1,675,186 (2,869,281) (1,322,947) (38,125) Cash, beginning of year........................................ 11,809,112 14,166,495 11,770,729 339,214 Effect of exchange rate changes in cash............... 682,197 473,515 (65,858) (1,898)
14,166,495 11,770,729 10,381,924 299,191
The significant reclassifications for US GAAP cash flow statements pertain to the following:
1) the effect of exchange rate changes on cash is shown in the reconciliation of the beginning balance and ending balance of cash (as opposed to operating activities under ROC GAAP)
2) compensation to directors and supervisors and bonuses to employees is shown in the operating activity under US GAAP (as opposed to financing activities under ROC GAAP)
3) purchases of treasury stock is shown in the financing activities under US GAAP (as opposed to investing activities under ROC GAAP).
h. Goodwill
As of January 1, 2002, the Company adopted US SFAS No. 142, “Goodwill and Other Intangible Assets”, which requires that goodwill no longer be amortized, and instead, be tested for impairment on a periodic basis. In conjunction with the implementation of US SFAS No. 142, the Company completed a goodwill impairment review as of January 1, 2002 using a fair-value based approach in accordance with the provision of the standard and found no impairment. Based on acquisitions completed as of June 30, 2001, application of the goodwill non-amortization provisions resulted in a decrease in amortization of approximately NT$815.6 million (US$23.5 million) for 2002. The Company completed its annual goodwill impairment test at December 31, 2002 and determined impairment of NT$2,213.0 million (US$63.8 million) of the remaining goodwill associated with its acquisition of ASE Test. As of December 31, 2002, the Company had goodwill of NT$3,227.1 million (US$93.0 million), which was primarily in the reporting units of the testing operations.
F-52

The following pro forma information reconciles the net income (loss) and earnings (loss) per share reported for 2000 and 2001 to adjusted net income (loss) and earnings (loss) per share, which reflect the adoption of US SFAS No. 142 and compares the adjusted information to the current year results:
Year Ended December 31,
2000 2001 2002 2002
NT$ NT$ NT$ US$
(In Thousands, Except Per Share and ADS Data)
Net income (loss) based on US GAAP .......................................... 3,929,996 (4,046,603) (3,074,265) (88,596) Goodwill amortization.................................................................... 559,807 653,917 — —
Net income (loss), as adjusted........................................................ 4,489,803 (3,392,686) (3,074,265) (88,596) Earnings (loss) per share
Basic earnings (loss) per share, as reported .............................. 1.34 (1.32) (0.99) (0.03) Goodwill amortization............................................................... 0.19 0.21 — —
Basic earnings (loss) per share, as adjusted .............................. 1.53 (1.11) (0.99) (0.03) Diluted earnings (loss) per share, as reported ........................... 1.29 (1.32) (0.99) (0.03) Goodwill amortization............................................................... 0.19 0.21 — —
Diluted earnings (loss) per share, as adjusted ........................... 1.48 (1.11) (0.99) (0.03) Earnings (loss) per ADS
Basic earnings (loss) per share, as reported .............................. 6.69 (6.59) (4.97) (0.14) Goodwill amortization............................................................... 0.95 1.06 — —
Basic earnings (loss) per share, as adjusted .............................. 7.64 (5.53) (4.97) (0.14) Diluted earnings (loss) per share, as reported ........................... 6.47 (6.59) (4.97) (0.14) Goodwill amortization............................................................... 0.95 1.06 — —
Diluted earnings (loss) per share, as adjusted ........................... 7.42 (5.53) (4.97) (0.14)
Changes in the carrying amount of goodwill for the years ended December 31, 2002 and 2001, by reportable segment, are as
follows:
Packaging Testing Total
NT$ NT$ NT$ US$
Balance as of January 1, 2001 ........................................... 597,725 4,336,077 4,933,802 142,184 Goodwill amortized during the period........................... (84,214) (562,257) (646,471) (18,630) Translation adjustment .................................................. (3,898) 40,260 36,362 1,048
Balance as of December 31, 2001 ..................................... 509,613 3,814,080 4,323,693 124,602 Goodwill acquired during the period ............................. 24,169 1,140,009 1,164,178 33,550 Goodwill impairment..................................................... (354,280) (1,858,765) (2,213,045) (63,777) Translation adjustment .................................................. (7,461) (40,309) (47,770) (1,377)
Balance as of December 31, 2002 ..................................... 172,041 3,055,015 3,227,056 92,998
i. Earnings per share
The following table represents the computation of basic earnings per share for each of the years ended at December 31:
2000 2001 2002
NT$ NT$ NT$ US$
Net Income (loss) .............................................................. 3,929,996 (4,046,603) (3,074,265) (88,596)Weighted average shares outstanding:
Basic.............................................................................. 2,938,004,535 3,071,234,458 3,090,678,225 3,090,678,225Effective of dilutive securities ....................................... — — — —
Diluted........................................................................... 2,938,004,535 3,071,234,458 3,090,678,225 3,090,678,225
Diluted earnings per share for the year ended December 31, 2000 are calculated as follows:
F-53

The denominator is the weighted average number of outstanding shares of common stock of 2,938,004,535 shares in 2000. The numerator with consideration of the adjustment of ASE Test’s diluted EPS in 2000 is calculated as follows:
Amount
NT$
Net income 3,929,996 Less: net income contributed from ASE Test ................................................................................. (1,715,291) Add : ASE Test’s diluted EPS multiplied by the number of shares of ASE Test owned by the
Company ..................................................................................................................................... 1,588,821 As adjusted...................................................................................................................................... 3,803,526
Due to the Company’s net loss for 2001 and 2002 under US GAAP, all of the outstanding stock options of 145,989,000 shares in 2002 and shares potentially issued from convertible bonds of 38,537,822 shares in 2001 were anti-dilutive. Had the Company earned a profit for 2001 and 2002, the share equivalents of the convertible bonds of 38,537,822 shares and the stock option of 145,989,000 shares, respectively, would have been added to the basic weighted average shares outstanding to calculate the diluted weighted averages shares outstanding.
The average number of shares outstanding for EPS calculation has been adjusted retroactively for issuance of stock dividends. The retroactive adjustment caused the basic EPS before income tax and after income tax for the year ended December 31, 2000 to decrease from NT$1.99 to NT$1.56 and NT$1.70 to NT$1.34 and the diluted EPS before income tax and after income tax for the year ended December 31, 2000 to decrease from NT$1.94 to NT$1.51 and NT$1.66 to NT$1.29, respectively.
F-54

SIGNATURES
The registrant hereby certifies that it meets all of the requirements for filing on Form 20-F and that it has duly caused and authorized the undersigned to sign this annual report.
ADVANCED SEMICONDUCTOR ENGINEERING, INC.
By: /s/ Joseph Tung Joseph Tung Chief Financial Officer
Date: June 30, 2003
(HK) 01141/017/20-F/ase.inc.20f.2002.doc

Certification
I, Jason C.S. Chang, Chief Executive Officer of Advanced Semiconductor Engineering, Inc. (“ASE Inc.”), certify that:
1. I have reviewed this annual report on Form 20-F of ASE Inc.;
2. Based on my knowledge, this annual report does not contain any untrue statement of a material fact or omit to state a material fact necessary to make the statements made, in light of the circumstances under which such statements were made, not misleading with respect to the period covered by this annual report;
3. Based on my knowledge, the financial statements, and other financial information included in this annual report, fairly present in all material respects the financial condition, results of operations and cash flows of the registrant as of, and for, the periods presented in this annual report;
4. The registrant’s other certifying officer and I are responsible for establishing and maintaining disclosure controls and procedures (as defined in Exchange Act Rules 13a-14 and 15d-14) for the registrant and we have:
a) designed such disclosure controls and procedures to ensure that material information relating to the registrant, including its consolidated subsidiaries, is made known to us by others within those entities, particularly during the period in which this annual report is being prepared;
b) evaluated the effectiveness of the registrant’s disclosure controls and procedures as of a date within 90 days prior to the filing date of this annual report (the “Evaluation Date”); and
c) presented in this annual report our conclusions about the effectiveness of the disclosure controls and procedures based on our evaluation as of the Evaluation Date;
5. The registrant’s other certifying officer and I have disclosed, based on our most recent evaluation, to the registrant’s auditors and the audit committee of registrant’s board of directors (or persons performing the equivalent function):
a) all significant deficiencies in the design or operation of internal controls which could adversely affect the registrant’s ability to record, process, summarize and report financial data and have identified for the registrant’s auditors any material weaknesses in internal controls; and
b) any fraud, whether or not material, that involves management or other employees who have a significant role in the registrant’s internal controls; and
6. The registrant’s other certifying officer and I have indicated in this annual report whether or not there were significant changes in internal controls or in other factors that could significantly affect internal controls subsequent to the date of our most recent evaluation, including any corrective actions with regard to significant deficiencies and material weaknesses.
Date: June 30, 2003
/s/ Jason C.S. Chang Jason C.S. Chang Chief Executive Officer
(HK) 01141/017/20-F/ase.inc.20f.2002.doc

Certification
I, Joseph Tung, Chief Financial Officer of Advanced Semiconductor Engineering, Inc. (“ASE Inc.”), certify that:
1. I have reviewed this annual report on Form 20-F of ASE Inc.;
2. Based on my knowledge, this annual report does not contain any untrue statement of a material fact or omit to state a material fact necessary to make the statements made, in light of the circumstances under which such statements were made, not misleading with respect to the period covered by this annual report;
3. Based on my knowledge, the financial statements, and other financial information included in this annual report, fairly present in all material respects the financial condition, results of operations and cash flows of the registrant as of, and for, the periods presented in this annual report;
4. The registrant’s other certifying officer and I are responsible for establishing and maintaining disclosure controls and procedures (as defined in Exchange Act Rules 13a-14 and 15d-14) for the registrant and we have:
a) designed such disclosure controls and procedures to ensure that material information relating to the registrant, including its consolidated subsidiaries, is made known to us by others within those entities, particularly during the period in which this annual report is being prepared;
b) evaluated the effectiveness of the registrant’s disclosure controls and procedures as of a date within 90 days prior to the filing date of this annual report (the “Evaluation Date”); and
c) presented in this annual report our conclusions about the effectiveness of the disclosure controls and procedures based on our evaluation as of the Evaluation Date;
5. The registrant’s other certifying officer and I have disclosed, based on our most recent evaluation, to the registrant’s auditors and the audit committee of registrant’s board of directors (or persons performing the equivalent function):
a) all significant deficiencies in the design or operation of internal controls which could adversely affect the registrant’s ability to record, process, summarize and report financial data and have identified for the registrant’s auditors any material weaknesses in internal controls; and
b) any fraud, whether or not material, that involves management or other employees who have a significant role in the registrant’s internal controls; and
6. The registrant’s other certifying officer and I have indicated in this annual report whether or not there were significant changes in internal controls or in other factors that could significantly affect internal controls subsequent to the date of our most recent evaluation, including any corrective actions with regard to significant deficiencies and material weaknesses.
Date: June 30, 2003
/s/ Joseph Tung Joseph Tung Chief Financial Officer
(HK) 01141/017/20-F/ase.inc.20f.2002.doc

EXHIBITS INDEX
Exhibit Number Description Page
1. (a) Articles of Association of the Registrant (in Chinese with English translation) (incorporating all amendments as of June 21, 2002) (incorporated by reference to Exhibit 3.1 to the Company’s registration statement on Form F-3 (File No. 333-89428) (the “Form F-3”) filed on March 31, 2003).
2. (a) Amended and Restated Deposit Agreement dated as of September 29, 2000 among ASE Inc., Citibank N.A., as depositary, and Holders and Beneficial Holders of American Depositary Shares evidenced by American Depositary Shares evidenced by American Depositary Receipts issued thereunder, including the form of American Depositary Receipt (incorporated by reference to Exhibit 4.1 to the Form F-3 filed on March 31, 2003).
(b) Form of Underwriting Agreement (incorporated by reference to Exhibit 1.1 to the Form F-3 filed on April 24, 2003).
4. (a) Asset Purchase Agreement dated as of July 3, 1999 among ASE (Chung Li) Inc., ASE Inc., Motorola Electronics Taiwan, Ltd. and Motorola, Inc. (incorporated by reference to Exhibit 10.2 to ASE Test Limited’s registration statement on Form F-3 (File No. 333-10892) which was declared effective by the SEC on December 22, 1999 (the “ASE Test 1999 Registration Statement”).
(b) Agreement dated as of June 5, 2002 among ASE (Chung Li) Inc., ASE Inc., Motorola Electronics Taiwan, Ltd. and Motorola, Inc. amending certain earn-out arrangement provided for in Section 2.09(b)(ii)(D) of the Asset Purchase Agreement dated as of July 3, 1999 among the same parties.
E-1
(c) Stock Purchase Agreement dated as of July 3, 1999 among ASE Investment (Labuan) Inc., ASE Inc., Motorola Asia Ltd. and Motorola, Inc. relating to the purchase and sale of 100% of the Common Stock of Motorola Korea Ltd. (incorporated by reference to Exhibit 10.3 to the ASE Test 1999 Registration Statement).
(d)† Manufacturing Services Agreement dated as of July 3, 1999 among Motorola, Inc., ASE Inc. and ASE (Chung Li) Inc. (incorporated by reference to Exhibit 10.4 to the Company’s registration statement on Form F-1 (File No. 333-44622) (the “Form F-1”)).
(e)† Manufacturing Services Agreement dated as of July 3, 1999 among Motorola, Inc., ASE Inc. and ASE (Korea) Inc. (incorporated by reference to Exhibit 10.5 to the Form F-1).
(f)† BGA Immunity Agreement dated as of January 25, 1994 between ASE Inc. and Motorola, Inc. (incorporated by reference to Exhibit 10.6 to the Form F-1).
(g) Land Lease effective October 1, 1999 until September 30, 2009 between ASE Inc. and the Nantze Export Processing Zone (incorporated by reference to Exhibit 10.14 to the Form F-1).
(h) Land Lease effective September 1, 1999 until August 30, 2009 between ASE Inc. and the Nantze Export Processing Zone (incorporated by reference to Exhibit 10.15 to the Form F-1).
(i) Land Lease effective April 1, 1998 until March 31, 2008 between ASE Inc. and the Nantze Export Processing Zone (incorporated by reference to Exhibit 10.16 to the Form F-1).

Exhibit Number Description Page
Service Agreement dated as of August 1, 2002 between ASE Electronics (M) Sdn. Bhd. and ASE (U.S.) Inc. (incorporated by reference to Exhibit 10.21 to the Form F-3 filed on March 31, 2003).
(w)
(j) Land Lease effective October 1, 1997 until September 30, 2007 between ASE Inc. and the Nantze Export Processing Zone (incorporated by reference to Exhibit 10.17 to the Form F-1).
(k) Land Lease effective October 1, 1997 until September 30, 2007 between ASE Inc. and the Nantze Export Processing Zone (incorporated by reference to Exhibit 10.18 to the Form F-1).
(l) Land Lease effective August 1, 1997 until July 31, 2007 between ASE Inc. and the Nantze Export Processing Zone (incorporated by reference to Exhibit 10.19 to the Form F-1).
(m) Land Lease effective January 1, 1996 until December 31, 2005 between ASE Inc. and the Nantze Export Processing Zone (incorporated by reference to Exhibit 10.20 to the Form F-1).
(n) Land Lease effective January 1, 1995 until October 31, 2005 between ASE Inc. and the Nantze Export Processing Zone (incorporated by reference to Exhibit 10.21 to the Form F-1).
(o) Land Lease effective October 1, 1999 until September 30, 2009 between ASE Inc. and the Nantze Export Processing Zone (incorporated by reference to Exhibit 10.14 to the Form F-1).
(p) Land Lease effective July 1, 1995 until June 30, 2005 between ASE Inc. and the Nantze Export Processing Zone (incorporated by reference to Exhibit 10.22 to the Form F-1).
(q) Land Lease effective July 1, 1995 until June 30, 2005 between ASE Inc. and the Nantze Export Processing Zone (incorporated by reference to Exhibit 10.23 to the Form F-1).
(r) Land Lease effective August 1, 1994 until July 31, 2004 between ASE Inc. and the Nantze Export Processing Zone (incorporated by reference to Exhibit 10.24 to the Form F-1).
(s) Land Lease effective April 6, 1994 until April 5, 2004 between ASE Inc. and the Nantze Export Processing Zone (incorporated by reference to Exhibit 10.25 to the Form F-1).
(u) License Agreement dated as of January 16, 2001 between 1st Silicon (Malaysia) Sdn. Bhd. and ASE Electronics (M) Sdn. Bhd. (incorporated by reference to Exhibit 4(u) to the Annual Report on Form 20-F for the year 2000, filed on June 28, 2001 (the “2000 20-F”)).
(v)
Service Agreement dated as of August 1, 2002 between ASE Test Inc. and ASE (U.S.) Inc. (incorporated by reference to Exhibit 10.22 to the Form F-3 filed on March 31, 2003).
(x) Service Agreement dated as of August 1, 2002 between ASE (Korea) Inc. and ASE (U.S.) Inc. (incorporated by reference to Exhibit 10.23 to the Form F-3 filed on March 31, 2003).
(y) Service Agreement dated as of August 1, 2002 between ASE (Chung-Li) Inc. and ASE (U.S.) Inc. (incorporated by reference to Exhibit 10.24 to the Form F-3 filed

Exhibit Number Description Page
(aa) Commission Agreement dated as of August 1, 2002 between ASE Electronics (M) Sdn. Bhd. and Gardex International Limited. (incorporated by reference to Exhibit 10.26 to the Form F-3 filed on March 31, 2003).
ommission Agreement dated as of August 1, 2002 between ASE Test Inc. and Gardex International Limited. (incorporated by reference to Exhibit 10.27 to the Form F-3 filed on March 31, 2003).
on March 31, 2003).
(z) Service Agreement dated as of August 1, 2002 between Advanced Semiconductor Engineering, Inc. and ASE (U.S.) Inc. (incorporated by reference to Exhibit 10.25 to the Form F-3 filed on March 31, 2003).
(bb) C
(cc) Commission Agreement dated as of August 1, 2002 between ASE (Korea) Inc. and Gardex International Limited. (incorporated by reference to Exhibit 10.28 to the Form F-3 filed on March 31, 2003).
(dd) Commission Agreement dated as of August 1, 2002 between ASE (Chung Li) Inc. and Gardex International Limited. (incorporated by reference to Exhibit 10.29 to the Form F-3 filed on March 31, 2003).
(ee) Commission Agreement dated as of August 1, 2002 between Advanced Semiconductor Engineering, Inc. and Gardex International Limited. (incorporated by reference to Exhibit 10.30 to the Form F-3 filed on March 31, 2003).
(ff) Land Lease effective July 1, 2000 until June 30, 2010 between ASE Inc. and the Nantze Export Processing Zone. (incorporated by reference to Exhibit 4(ff) to the 2000 20-F).
(gg) Land Lease effective July 1, 2000 until June 30, 2010 between ASE Inc. and the Nantze Export Processing Zone. (incorporated by reference to Exhibit 4(ff) to the 2000 20-F).
(hh) Land Lease effective October 1, 2000 until September 30, 2010 between ASE Inc. and the Nantze Export Processing Zon0e. (incorporated by reference to Exhibit 4(hh) to the 2000 20-F).
(ii) Land Lease effective March 16, 2001 until March 15, 2011 between ASE Inc. and the Nantze Export Processing Zone. (incorporated by reference to Exhibit 4(ii) to the 2000 20-F).
(jj) Land Lease effective March 1, 2001 until February 28, 2011 between ASE Inc. and the Nantze Export Processing Zone. (incorporated by reference to Exhibit 4(jj) to the 2000 20-F).
(kk) First Amendment to Lease Agreement dated June 7, 2000 between ISE Labs, Inc. and RND Funding Company, Inc. (incorporated by reference to Exhibit 4(kk) to the 2000 20-F).
(ll) Sub-lease Agreement dated October 3, 2000 between ISE Labs Singapore Pte Ltd and Wan Tien Realty (Pte) Ltd. (incorporated by reference to Exhibit 4(ll) to the 2000 20-F).
(mm) Sub-lease Agreement dated June 3, 1999 between ISE Labs Singapore Pte Ltd and Wan Tien Realty (Pte) Ltd. (incorporated by reference to Exhibit 4(mm) to the 2000 20-F).
(nn) Sublease Agreement dated June 2000 between ISE Labs, Inc. and Cirrus Logic, Inc. (incorporated by reference to Exhibit 4(nn) to the 2000 20-F).

Exhibit Number Description Page
(oo) Sublease Agreement dated June 2000 between ISE Labs, Inc. and Cirrus Logic, Inc. (incorporated by reference to Exhibit 4(oo) to the 2000 20-F).
(pp) Tenancy Agreement dated April 1, 1999 between ISE Labs (HK) Limited and Hing Seng Plastic Factory Limited. (incorporated by reference to Exhibit 4(pp) to the 2000 20-F).
(qq) Lease dated September 28, 2000 between ISE Labs Hong Kong Limited and Shinano Kenshi (HK) Co., Ltd. (incorporated by reference to Exhibit 4(qq) to the 2000 20-F).
(rr) Lease dated October 20, 2000 between ISE Labs Hong Kong and Bless Silver Development Limited. (incorporated by reference to Exhibit 4(rr) to the 2000 20-F).
(ss) Lease Agreement between ASE Test Malaysia and Penang Development Corporation (incorporated by reference to Exhibit 2(c) to ASE Test Limited’s annual report on Form 20-F for the year ended December 31, 1997). (incorporated by reference to Exhibit 4(ss) to the 2000 20-F).
(tt) Sale and Purchase Agreement between Afasia Knitting Factory (Malaysia) Sdn. Bhd. and ASE Electronics (M) Sdn. Bhd. dated February 24, 1997. (incorporated by reference to Exhibit 4(tt) to the 2000 20-F).
(uu) Office Building Lease Agreement between ISE Labs, Inc. and JER/BRE Austin Tech L.P. dated October 4, 2001. (incorporated by reference to Exhibit 10.46 to the Form F-3 filed on May 30, 2002).
(vv) Plant Lease Agreement between ASE (Chung Li) Inc. and ASE Material Inc. dated October 31, 2001.
(ww) Plant Lease Agreement between ASE (Chung Li) Inc. and ASE Material Inc. dated October 31, 2001.
(xx) Plant Lease Agreement between ASE (Chung Li) Inc. and ASE Test Inc. dated October 5, 2001.
(iii) ASE Inc. Employee Bonus Plan in (Chinese with English language translation) (incorporated by reference to Exhibit 4(iii) to the Annual Report on Form 20-F for the year 2001, filed on June 28, 2002).
(iv) 2002 ASE Employee Stock Option Plan (in Chinese with English language translation) (incorporated by reference to Exhibit 10.50 to the Form F-3 filed on March 31, 2003).
8. List of Subsidiaries (incorporated by reference to Exhibit 21.1 to the Form F-3 filed on May 30, 2002).
12. (a) Co-Building and Sale Agreement dated as of January 27, 2000 between ASE (Chung Li) Inc. and Hung Ching Development & Construction Co. Ltd. (in Chinese with English language summary translation) (incorporated by reference to Exhibit 99.1 to the Form F-3 filed on May 27, 2003).
(b) Co-Building Agreement dated as of April 17, 2003 between ASE Inc. and Hung Ching Development & Construction Co. Ltd. (in Chinese with English language summary translation)(incorporated by reference to Exhibit 99.2 to the Form F-3 filed on May 27, 2003).

Exhibit Number Description Page
(c) Certification of the Chief Executive Officer and the Chief Financial Officer of Advanced Semiconductor Engineering, Inc. for the purpose of complying with Section 1350 of Chapter 63 of Title 18 of the United States Code.
E-6
_______________________ † Does not contain portions for which confidential treatment has been granted.

Exhibit 4(b)
Advanced Semiconductor Engineering, Inc. ASE (Chung Li), Inc.
June 5, 2002 Motorola, Inc. Motorola Electronics Taiwan, Ltd. c/c Motorola, Inc. MD: TX30/OE60 6501 William Cannon Drive West Austin, TX 78735 USA Attn: Gary Schlumpf Fax:(512) 996-6178 (followed by overnight courier) Ladies and Gentlemen: Reference is made to the Asset Purchase Agreement dated July 4, 1999, as amended, among ASE (Chung Li), Inc. (“Buyer”), Advanced Semiconductor Engineering, Inc. (“ASE”), Motorola Electronics Taiwan, Ltd. (“Seller”) and Motorola, Inc. (“Motorola”) (the “Asset Purchase Agreement”). Capitalized terms used without definition in this letter agreement will have the meaning assigned to them in the Asset Purchase Agreement. Pursuant to Section 2.09(b)(ii)(D) of the Asset Purchase Agreement, Seller was eligible to earn $23,333,333 plus interest as a result of meeting certain financial milestones for the period ending on the Third Anniversary. In the interest of strengthening the overall relationship between ASE and Motorola, and increasing the potential level of Motorola business with the Buyer and the other subsidiaries of ASE, including, without limitation, ASE (Korea) Ltd. (together with Buyer, collectively, the “ASE Group”), the Parties have agreed to substitute the following earn-out arrangement for the arrangement provided for in Section 2.09(b)(ii)(D) of the Asset Purchase Agreement: Seller shall be eligible to receive up to an additional US$23,333,333 for the Base Assets, payable as follows: (A) Third Year Period. If and only if the total purchase price of all products and services purchased by the
Motorola Group during the year commencing on the Second Anniversary and ending on the Third Anniversary (the “Third Year Period”) is at least $160,000,000 from the ASE Group and US$75,000,000 from Buyer, Buyer shall deliver to Seller within 30 days following the Third Anniversary an amount calculated as follows:
(1) If the total purchase price of all products and services purchased from the ASE Group during the
Third Year Period (the “Third Year ASE Group Total”) is more than $200,000,000 then the amount shall be $7,333,333;
(2) If the Third Year ASE Group Total is more than $185,000,000 but less than or equal to
$200,000,000 then the amount shall be calculated as follows: (Third Year ASE Group Total/ $600,000,000) x $23,333,333);
(3) If the Third Year ASE Group Total is more than $170,000,000 but less than or equal to
$185,000,000 then the amount shall be calculated as follows: ((Third Year ASE Group Total/ $600,000,000) x $23,333,333) x 87.5%; or
E-1

(4) If the Third Year ASE Group Total is more than $160,000,000 but less than or equal to $170,000,000 then the amount shall be calculated as follows: ((Third Year ASE Group Total/ $600,000) x $23,333,333) x 80%.
(B) Fourth Year Period. If and only if the total purchase price of all products and services purchased by the
Motorola Group during the year commencing on the Third Anniversary and ending on the fourth anniversary of the Closing Date (the “Fourth Anniversary”) (the “Fourth Year Period”) is at least $155,000,000 from the ASE Group and US$75,000,000 from Buyer, Buyer shall deliver to Seller within 30 days following the Fourth Anniversary an amount calculated as follows:
(1) If any portion of the $23,333,333 was paid for the Third Year Period: i. If the Third Year ASE Group Total plus the total purchase price of all products and
services purchased from the ASE Group during the Fourth Year Period (the “Fourth Year ASE Group Total”) is more than $375,000,000 then the amount shall be calculated as follows: (((Third Year ASE Group Total + Fourth Year ASE Group Total)/ $600,000,000) x $23,333,333)—the portion of the $23,333,333 paid for the Third Year Period (the “Third Year Payment”);
ii If the Third Year ASE Group Total plus the Fourth Year ASE Group Total is more than
$345,000,000 but less than or equal to $375,000,000 then the amount shall be calculated as follows: ((((Third Year ASE Group Total + Fourth Year ASE Group Total)/ $600,000,000) x $23,333,333) x 87.5%)—Third Year Payment; or
iii. If the Third Year ASE Group Total plus the Fourth Year ASE Group Total is more than
$315,000,000 but less than or equal to $345,000,000 then the amount shall be calculated as follows: ((((Third Year ASE Group Total + Fourth Year ASE Group Total)/ $600,000) x $23,300,000) x 80%)—Third Year Payment.
iv. In no event shall the total amount paid in the Third Year Period and the Fourth Year
Period combined exceed $15,333,333. (2) If no amount was paid for the Third Year Period: i. If the Fourth Year ASE Group Total is $200,000,000 or more then the amount shall be
$8,000,000; ii. If the Fourth Year ASE Group Total is more than $190,000,000 but less than
$200,000,000 then the amount shall be calculated as follows: ((Fourth Year ASE Group Total/ $400,000,000) x $16,000,000);
iii. If the Fourth Year ASE Group Total is more than $175,000,000 but less than or equal to
$190,000,000 then the amount shall be calculated as follows: ((Fourth Year ASE Group Total/ $400,000,000) x $16,000,000) x 87.5%; or
iv. If the Fourth Year ASE Group Total is more than $155,000,000 but less than or equal to
$175,000,000 then the amount shall be calculated as follows: ((Fourth Year ASE Group Total/ $400,000) x $16,000,000) x 80%.
(C) Fifth Year Period. If and only if the total purchase price of all products and services purchased by the
Motorola Group during the year commencing on the Fourth Anniversary and ending on the fifth anniversary of the Closing Date (the “Fifth Anniversary”) (the “Fifth Year Period”) is at least $155,000,000 from the ASE Group, Buyer shall deliver to Seller within 30 days following the Fifth Anniversary an amount calculated as follows:
E-2

(1) If any portion of the $23,333,333 was paid for both the Third Year Period and the Fourth Year Period:
i. if the Third Year ASE Group Total plus the Fourth Year ASE Group Total plus the total
purchase price of all products and services purchased from the ASE Group during the Fifth Year Period (the “Fifth Year ASE Group Total”) is more than $565,000,000 then the amount shall be calculated as follows: (((Third Year ASE Group Total + Fourth Year ASE Group Total + Fifth Year ASE Group Total)/ $600,000,000) x $23,333,333)—Third Year Payment—Fourth Year Payment;
ii. If the Third Year ASE Group Total plus the Fourth Year ASE Group Total plus the Fifth
Year ASE Group Total is more than $520,000,000 but less than or equal to $565,000,000 then the amount shall be calculated as follows: ((((Third Year ASE Group Total + Fourth Year ASE Group Total + Fifth Year ASE Group Total)/ $600,000,000) x $23,333,333) x 87.5%)—Third Year Payment—Fourth Year Payment); or
iii. If the Third Year ASE Group Total plus the Fourth Year ASE Group Total plus Fifth Year
ASE Group Total is more than $470,000,000 but less than or equal to $520,000,000 then the amount shall be calculated as follows: ((((Third Year ASE Group Total + Fourth Year ASE Group Total + Fifth Year ASE Group Total)/ $600,000) x $23,333,333) x 80%)—Third Year Payment—Fourth Year Payment).
(2) If any portion of the $23,333,333 was paid for the Third Year Period but not the Fourth Year
Period: i. If the Third Year ASE Group Total plus the Fifth Year ASE Group Total is more than
$375,000,000 then the amount shall he calculated as follows: (((Third Year ASE Group Total + Fifth Year ASE Group Total)/ $400,000,000) x $15,333,333)—the portion of the $23,333,333 paid for the Third Year Period (the “Third Year Payment”);
ii. If the Third Year ASE Group Total plus the Fifth Year ASE Group Total is more than
$345,000,000 but less than or equal to $375,000,000 then the amount shall be calculated as follows: ((((Third Year ASE Group Total + Fifth Year ASE Group Total)/ $400,000,000) x $15,333,333) x 87.5%)—the Third Year Payment; or
iii. If the Third Year ASE Group Total plus the Fifth Year ASE Group Total is more than
$315,000,000 but less than or equal to $345,000,000 then the amount shall be calculated as follows: ((((Third Year ASE Group Total + Fifth Year ASE Group Total)/ $400,000,000) x $15,333,333) x 80%)—the Third Year Payment.
iv. In no event shall the total amount paid in the Third Year Period and the Fifth Year Period
combined exceed $15,333,333. (3) If any portion of the $23,333,333 was paid for the Fourth Year Period but not the Third Year
Period: i. If the Fourth Year ASE Group Total plus the Fifth Year ASE Group Total is more than
$380,000,000 then the amount shall be calculated as follows: (((Fourth Year ASE Group Total + Fifth Year ASE Group Total)/ $400,000,000) x $16,000,000)—the portion of the $23,333,333 paid for the Fourth Year Period (the “Fourth Year Payment”);
ii. If the Fourth Year ASE Group Total plus the Fifth Year ASE Group Total is more than
$350,000,000 but less than or equal to $380,000,000 then the amount shall be calculated as follows: ((((Fourth Year ASE Group Total + Fifth Year ASE Group Total)/ $400,000,000) x $16,000,000) x 87.5%)—the Fourth Year Payment; or
E-3

iii. If the Fourth Year ASE Group Total plus the Fifth Year ASE Group Total is more than
$310,000,000 but less than or equal to $350,000,000 then the amount shall be calculated as follows: ((((Fourth Year ASE Group Total + Fifth Year ASE Group Total)/ $400,000,000) x $16,000,000) x 80%)—the Fourth Year Payment.
iv. In no event shall the total amount paid in the Fourth Year Period and the Fifth Year Period combined exceed $16,000,000.
(4) If no portion of the $23,333,333 was paid for the Third Year Period or the Fourth Year Period: i. If the Fifth Year ASE Group Total is more than $200,000,000 then the amount shall be
$8,000,000; ii If the Fifth Year ASE Group Total is more than $190,000,000 but less than $200,000,000
then the amount shall be calculated as follows: Fifth Year ASE Group Total/ $200,000,000 x $8,000,000;
iii. If the Fifth Year ASE Group Total is more than $175,000,000 but less than or equal to
$190,000,000 then the amount shall be calculated as follows: Fifth Year ASE Group Total/ $200,000,000 x $8,000,000 x 87.5%; or
iv. If the Fifth Year ASE Group Total is more than $155,000,000 but less than or equal to
$175,000,000 then the amount shall be calculated as follows: Fifth Year ASE Group Total/ $200,000,000 x $8,000,000 x 80%.
For purposes of clauses (A), (B) and (C) above, the total purchase price of all products and services shall be calculated using the purchase prices in effect for such products and services as of March 12, 2002. For any products or services not offered as of March 12, 2002 the purchase prices shall be those negotiated and agreed to by the Parties. The foregoing payments shall not be subject to interest from the Interest Commencement Date as was the amount provided for in Section 2.09(b)(ii)(D); provided, however, that if Buyer fails to pay any amounts required to be paid hereunder by the dates required herein, such unpaid amounts shall bear interest at the applicable rate in Section 2.09(b)(iv) of the Asset Purchase Agreement plus 3% per annum. Interest shall be calculated on the basis of a 360-day year for the actual number of days elapsed. In addition to the above, Motorola agrees to commence the qualification of substrates manufactured by ASE Materials’ facility located in Chung-Li, Taiwan. ASE acknowledges that Motorola has no obligation to qualify any such substrates unless Motorola’s qualification standards are met. This letter amendment shall not amend any other provisions of the Asset Purchase Agreement. Please indicate our acknowledgment and agreement of the foregoing by signing below. Very truly yours, ASE (Chung Li), Inc. Advanced Semiconductor Engineering, Inc.
By: /s/ Shih-Song Lee By: /s/ Joseph Tung Name: Shih-Son Lee Name: Joseph Tung Title: President, ASE (Chung Li) Title: Chief Financial Officer
E-4

ACKNOWLEDGED AND AGREED: Motorola, Inc. Motorola Electronics Taiwan, Inc. By: /s/ Tom Sun By: /s/ Tom Sum Name: Tom Sun Name: Tom Sum Title: Corporate Vice President Title: President cc: Motorola, Inc. 1301 E Algonquin Road Chicago, Illinois 60196 USA Attn: General Counsel Fax: (847) 576 3628
E-5

Exhibit 12(c)
906 Certification
June 30, 2003 Securities and Exchange Commission 450 Fifth Street, N.W Washington, D.C. 20549 Ladies and Gentlemen: The certification set forth below is being submitted to the Securities and Exchange Commission solely for the purpose of complying with Section 1350 of Chapter 63 of Title 18 of the United States Code. This certification is not to be deemed filed pursuant to the Securities Exchange Act of 1934 and does not constitute a part of the Annual Report on Form 20-F (the “Report”) accompanying this letter. Jason C.S. Chang, the Chief Executive Officer and Joseph Tung, the Chief Financial Officer of Advanced Semiconductor Engineering, Inc., each certifies that, to the best of his knowledge: 1. the Report fully complies with the requirements of Section 13(a) or 15(d) of the Securities Exchange Act
of 1934; and 2. the information contained in the Report fairly presents, in all material respects, the financial condition
and results of operations of Advanced Semiconductor Engineering, Inc.
/s/ Jason C.S. Chang Name: Jason C.S. Chang Title: Chief Executive Officer
/s/ Joseph Tung Name: Joseph Tung Title: Chief Financial Officer
A signed original of this written statement required by Section 906, or other document authenticating, acknowledging, or otherwise adopting the signatures that appear in typed form within the electronic version of this written statement required by Section 906, has been provided to Advanced Semiconductor Engineering , Inc. and will be retained by Advanced Semiconductor Engineering, Inc. and furnished to the Securities and Exchange Commission or its staff upon request.
E-6

Advanced Semiconductor Engineering, Inc.
Public Spokespersons
Joseph Tung, Chief Financial Officer
Email: [email protected]
Freddie Liu, Controller
Email: [email protected]
Company Website
http://www.aseglobal.com
Office
Room 1901, TWTC Int’l Trade Bldg.,
19F, No. 333, Keelung Road, Section 1,
Taipei, Taiwan
Tel: 886-2-8780-5489
Fax: 886-2-2757-6121
Plant
No. 26, Chin 3rd Road,
Nantze Export Processing Zone,
Kaohsiung, Taiwan
Tel: 886-7-361-7131
Fax: 886-7-361-3094
Subsidiaries
ASE Test Limited
No. 10, West 5th Street,
Nantze Export Processing Zone,
Kaohsiung, Taiwan
Tel: 886-7-363-6641
Fax: 886-7-361-6663
ASE Electronics (M) Sdn. Bhd.
Phase 4, Bayan Lepas Free Trade Zone,
11900 Penang, Malaysia
Tel: 60-4-644-8555
Fax: 60-4-644-8411
ISE Labs, Inc.
46800 Bayside Parkway
Fremont, CA 94538, USA
Tel: 510-687-2500
Fax: 510-687-2513
ASE (Korea) Inc.
494, Munbal-ri, Kyoha-myun, Paju-shi,
Kyunggi-do, Korea
Tel: 82-31-9400-535
Fax: 82-31-9400-621
ASE (Chungli) Inc.
550 Chung-Hwa Road, Section 1,
Chung-Li, Taiwan
Tel: 886-3-452-7121
Fax: 886-3-452-3512
ASE Holding Electronics (Philippines) Inc.
Lot 3&4, Blk. 7,
First Cavite Industrial Estate
Bo. Langkaan, Dasmarifias,
Cavite, Philippines
Tel: 63-46-402-0241
Fax: 63-46-402-0242
ASE Material Inc.
No. 73, Kai Fa Road,
Nantze Export Processing Zone,
Kaohsiung, Taiwan
Tel: 886-7-365-8500
Fax: 886-7-365-8460
Universal Scientific Industrial Co., Ltd.
No. 141, Lane 351, Taiping Road, Section 1,
Tsao Tuen, Nan-Tou, Taiwan
Tel: 886-49-232-5876
Fax: 886-49-233-2135
Board of Directors & Supervisors
Directors
Jason C.S. Chang
Richard P.H. Chang
Chin Ko-Chien
David Pan
Joseph Tung
Jeffrey Chen
Tien Wu
Supervisors
Mei-Jean Feng
Alan Chang
Yen Yi-Tseng
Raymond Lo
John Ho
Executive Officers
Jason C.S. Chang, Chairman and Chief Operating Officer
Richard P.H. Chang, Vice Chairman and Chief Executive Officer
Chin Ko-Chien, Executive Vice President and General Manager,
Kaohsiung Packaging Facility
David Pan, President, ASE Test Limited
Raymond Lo, President, ASE Test Taiwan
Kanapathi A/L Kuppusamy, President, ASE Test Malaysia
T.S. Chen, President, ASE (Chungli) Inc.
James Stilson, President, ASE (Korea) Inc.
J.J. Lee, President, ASE Material
Harvey Wu, President, Universal Scientific Industrial Co., Ltd.
Joseph Tung, Chief Financial Officer
Stockholder Information
Annual General Meeting of Shareholders was held
at 10:00 AM, June 19, 2003 at the Auditorium of
NEPZ Kaohsiung, Taiwan.
Stock Listing
The company’s common stock is listed on
TAIWAN STOCK EXCHANGE (TAIEX: 2311) and
NEW YORK STOCK EXCHANGE (NYSE: ASX).
Transfer Agent
President Securities Corp.
Shareholder Service Division,
B1, 8, Dungshin Road,
Taipei, Taiwan
Tel: 886-2-2746-3797
Fax: 886-2-2746-3695
http://www.pscnet.com.tw
Independent Certified Public Accountants
T N Soong & Co.
(Associate Member Firm of Deloitte Touche Tohmatsu
Effective April 22, 2002)
(Formerly a Member Firm of Andersen Worldwide, SC)
Taipei, Taiwan, Republic of China
7F, 168, Chung Cheng 4th Road,
Kaohsiung, Taiwan
Tel: 886-7-251 4311
Fax: 886-7-241 2577
http://www.tw.deloitte.com

Advanced Semiconductor Engineering, Inc.