advanced wec controls webinar june 2016
TRANSCRIPT

Photos placed in horizontal position with even amount
of white space between photos
and header
Photos placed in horizontal position with even amount of white space
between photos and header
Sandia National Laboratories is a multi-program laboratory managed and operated by Sandia Corporation, a
wholly owned subsidiary of Lockheed Martin Corporation, for the U.S. Department of Energy’s National Nuclear
Security Administration under contract DE-AC04-94AL85000.
Advanced WEC Dynamics and ControlsRyan Coe ([email protected])Giorgio Bacelli ([email protected])June 6, 2016

Outline1. Project overview/overall motivation2. Control comparison3. Control basics4. Testing overview5. Testing results6. Model validation7. Future work8. Questions/discussion
3
PROJECT OVERVIEWAdvanced WEC Dynamics and Controls

4
Project motivation
Numerous studies have shown large benefits of more advanced control of WECs (e.g., Hals et al. showed 330% absorption increase)
Most studies rely on significant simplifications and assumptions Availability of incoming wave
foreknowledge 1-DOF motion Linear or perfectly know
hydrodynamics No sensor noise Unlimited actuator performance
Project goal: accelerate/support usage of advanced WEC control by developers

5
Project objectives Use numerical modeling and novel laboratory testing
methods to quantitatively compare a variety of control strategies: advanced system identification methods for richer results (better numerical models and better controls)
Produce data, analyses and methodologies that assist developers in selecting and designing the best control system for their device: provide developers with the information needed to make informed decisions about their specific strategy on PTO control
Use numerical modeling and testing to determine the degree to which these control strategies are device agnostic: broadly applicable quantitative results, methods and best practices applicable to a wide range of devices
Develop strategies to reduce loads, address fatigue and to handle extreme conditions: reduce loads and high-frequency vibration in both operational and extreme conditions
Full wave-to-wire control: absorption, generation, power-electronics and transmission considered in control design
Develop novel control strategies and design methodologies: leverage Sandia’s control expertise from aerospace, defense and robotics to develop novel WEC control approaches

6
WEC CONTROLS COMPARISONAdvanced WEC Dynamics and Controls

7
Control strategy comparison
Initial comparison completed and published (METS and SAND report)• Multiple novel strategies applied to WECs• Relative power improvement offered by 8
control strategies• “Cost-to-implement” metrics• Roadmap to WEC control w/ in-depth
discussion/instructions for implementation
http://energy.sandia.gov/wordpress/../wp-content/uploads/dlm_uploads/2016/06/SAND2016-4293.pdf

Advanced WEC Control
What is the potential of control systems in WECs?

9
Buoy design
Final designAxisymmetric shapes
Absorption: comparison

10
Comparison of Control Strategies
Baseline (Resistive) Model Predictive Control (MPC) Dynamic Programming (DP) Shape Based (SB) Control Linear Quadratic (LQ) Control PDC3 Latching
11
Model Predictive Control
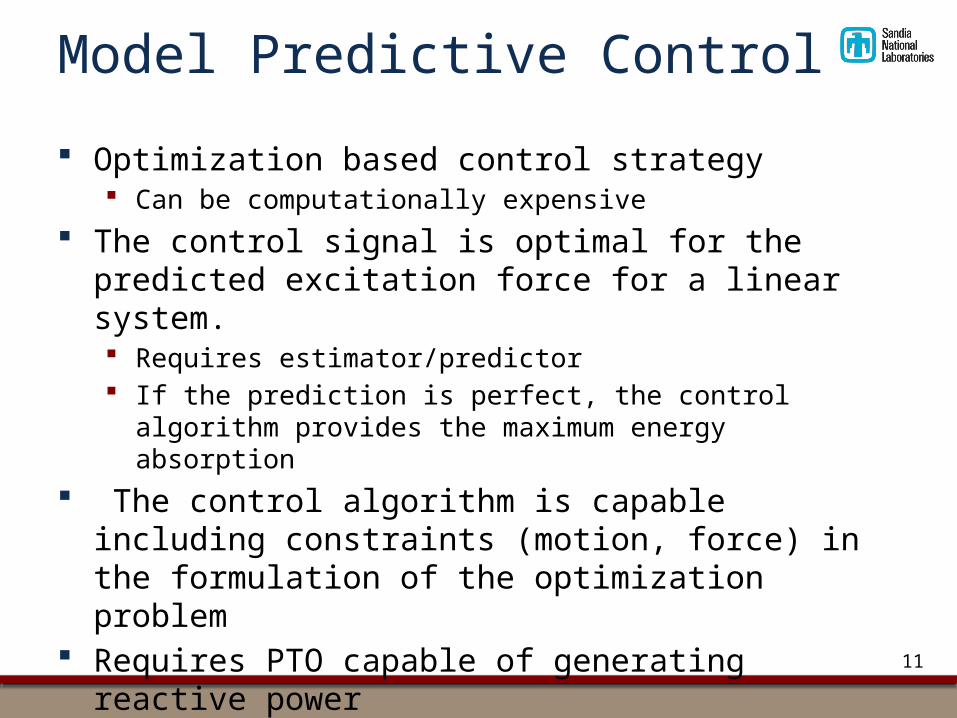
Optimization based control strategy Can be computationally expensive
The control signal is optimal for the predicted excitation force for a linear system. Requires estimator/predictor If the prediction is perfect, the control algorithm provides the
maximum energy absorption The control algorithm is capable including constraints
(motion, force) in the formulation of the optimization problem
Requires PTO capable of generating reactive power Requires energy storage

12
Dynamic Programming
It can be implemented for nonlinear systems Optimization based control strategy
Computationally very expensive The control signal is optimal for the predicted excitation force
for a linear system. Requires estimator/predictor If the prediction is perfect, the control algorithm provides the
maximum energy absorption The control algorithm is capable including constraints
(motion, force) in the formulation of the optimization problem
Requires PTO capable of generating reactive power Requires energy storage

13
Shape Based Control
It can be implemented for nonlinear systems Optimization based control strategy
Computationally very expensive, but more efficient than DP The control signal is optimal for the predicted excitation force
for a linear system. Requires estimator/predictor If the prediction is perfect, the control algorithm provides the
maximum energy absorption The control algorithm is capable including constraints
(motion, force) in the formulation of the optimization problem
Requires PTO capable of generating reactive power Requires energy storage

14
Linear Quadratic Control
Pure feedback control strategy Computationally inexpensive (matrix multiplication) Optimal feedback gain is obtained by offline optimization
Linear WEC model LQ feedback control is well known for good properties
(stability, robustness to parameters uncertainty,…) Requires PTO capable of generating reactive power
Requires energy storage NOT capable of dealing with constraints
15
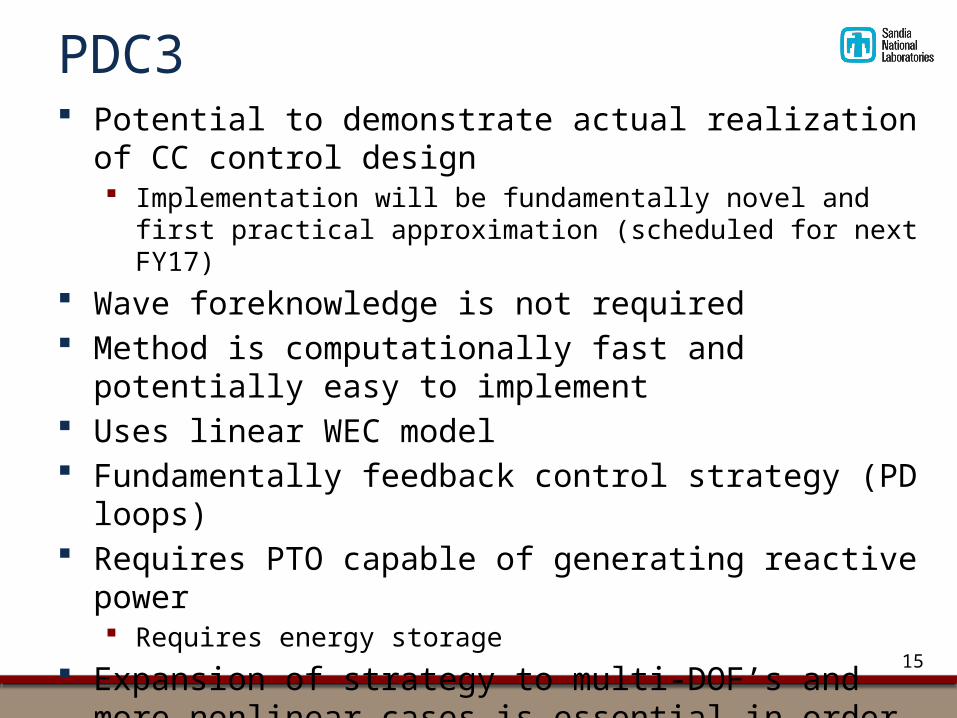
PDC3 Potential to demonstrate actual realization of CC control design
Implementation will be fundamentally novel and first practical approximation (scheduled for next FY17)
Wave foreknowledge is not required Method is computationally fast and potentially easy to
implement Uses linear WEC model Fundamentally feedback control strategy (PD loops) Requires PTO capable of generating reactive power
Requires energy storage Expansion of strategy to multi-DOF’s and more nonlinear cases
is essential in order to understand how well strategy can work on real world systems

16
Latching
It is a switching control strategy It does not require model of the WEC for the calculation for
the control signal (in its simplest form)
It can be used also for nonlinear systems It may require prediction of wave elevation/excitation force to
improve performance It does not require PTO capable of generating reactive power
Does not require energy storage NOT capable of dealing with constraints

17
Sea states
18
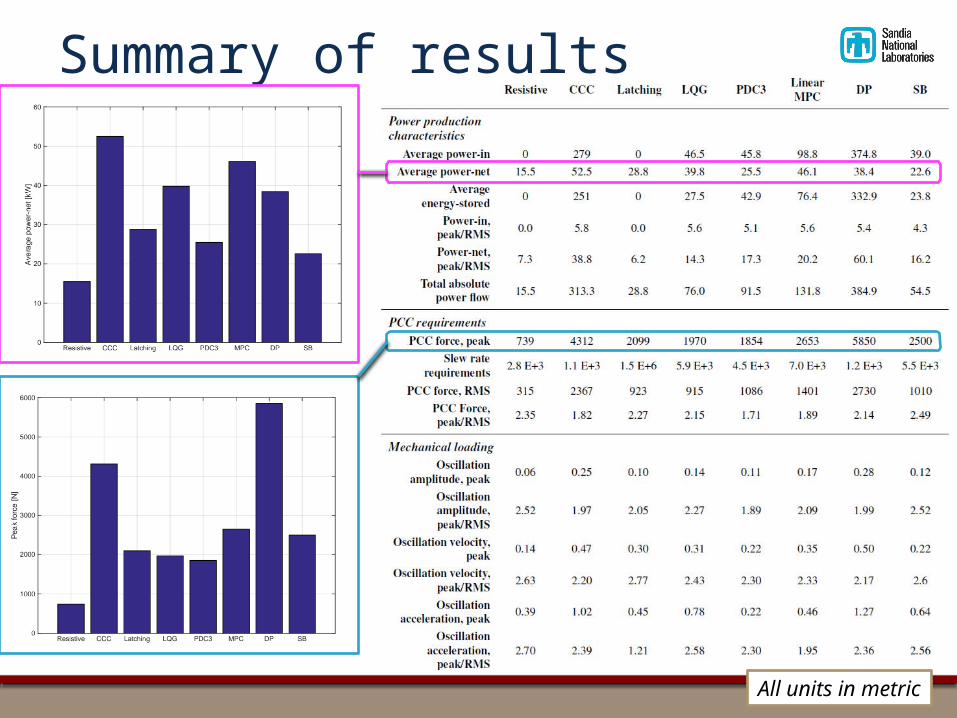
Summary of results
All units in metric

19
Summary of results (Sample time-series)
Velocity vs Excitation force

20
Summary of results (Sample time-series)
Actuator force vs Excitation force

21
Summary of results (Sample time-series)
Instantaneous absorbed power and excitation force
22
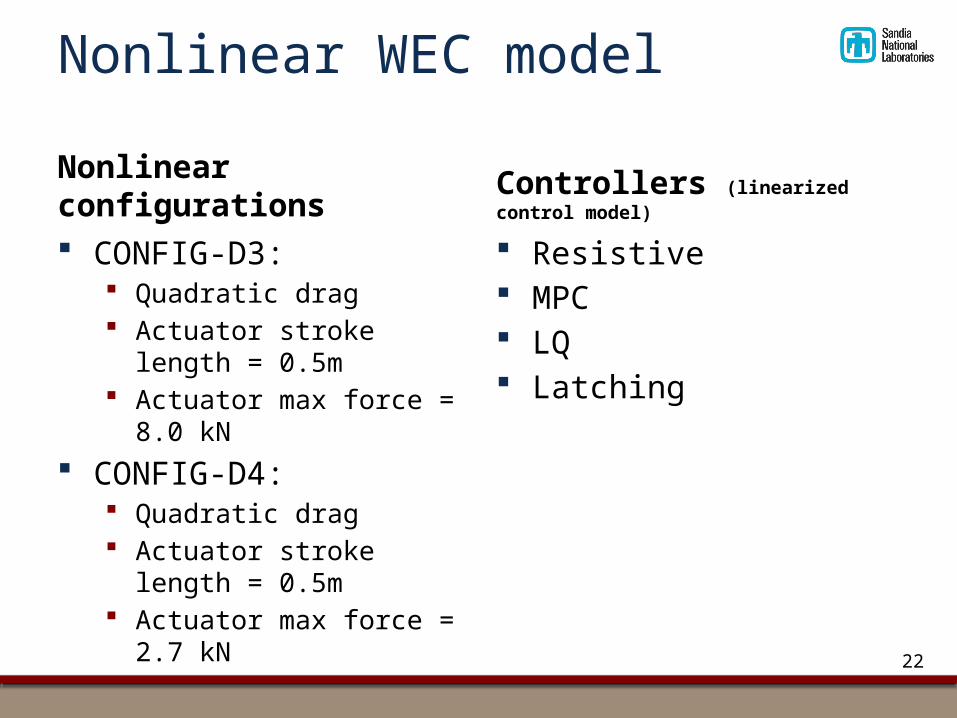
Nonlinear WEC model
Nonlinear configurations CONFIG-D3:
Quadratic drag Actuator stroke length = 0.5m Actuator max force = 8.0 kN
CONFIG-D4: Quadratic drag Actuator stroke length = 0.5m Actuator max force = 2.7 kN
Controllers (linearized control model)
Resistive MPC LQ Latching

23
Nonlinear WEC model
Note: Plant (WEC) models are nonlinear; control models are linear
Linear controllers perform well with (mild) nonlinear devices

24
CONTROL BASICSAdvanced WEC Dynamics and Controls

25
Control systems design
WEC
EXAMPLE: CC conjugate controlIdeal case (simulation)
Wave excitation force ()
ControllerReference velocity
𝑣𝑟𝑒𝑓 𝑣

26
Control systems design
WEC
EXAMPLE: CC conjugate controlA more “Realistic” situation
Wave excitation force () (Unknown)
Noise
Sensors
ControllerState estimator
Reference velocity
�̂� 𝑒 �̂�𝑟𝑒𝑓
𝑣Velocity calc.

27
Control systems design
Control model: If control algorithm is based on a model of the system
(i.e. model based control), then: First principle model --> from theory System identification --> from data
𝐹 𝑜𝑝𝑡=𝑍𝑖❑
❑∗=[𝑅 (𝜔 )+𝐵+𝑖 (𝜔 (𝑀+𝑀𝑎 (𝜔 ) )− 𝑘𝜔 )]
∗
EXAMPLE: CC conjugate control

28
Control systems design
Measurements: Available measurements
May not be possible to measure all the quantities we want (e.g. excitation force, velocity)
State estimator design Noise in the measurements
Filter Frequency domain control design

29
Control Structure Interaction (CSI)
What happens when you close the loop? Even with a simple linear damping, the closed loop system behaves
differently
Root locus example: when increasing the damping the poles moves towards RHP zeros -> system unstable
𝑦𝑢=
𝐺 (𝑠) 1+𝐺 (𝑠)𝐵
𝐺 (𝑠 )
𝐵
𝑦𝑢
-5 -4 -3 -2 -1 0 1 2 3 4 5
-1.5
-1
-0.5
0
0.5
1
1.5
Root Locus
Real Axis (seconds -1)
Imag
inar
y A
xis
(sec
onds
-1)

30
Control Structure Interaction (CSI) Example: WEC / bridge interaction
31
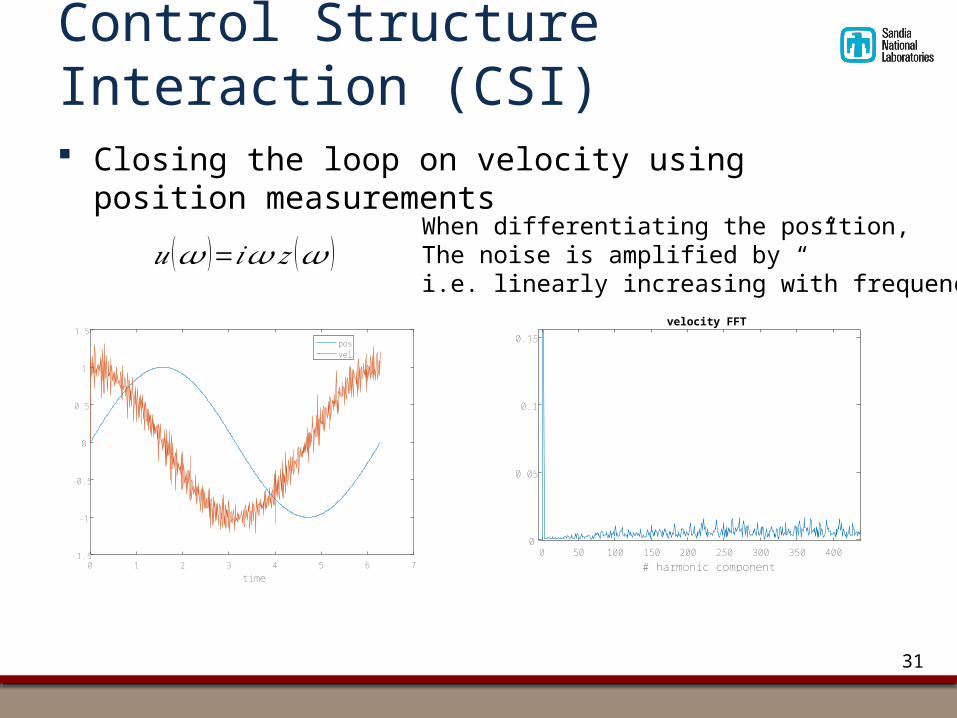
Control Structure Interaction (CSI)
Closing the loop on velocity using position measurements
0 1 2 3 4 5 6 7time
-1.5
-1
-0.5
0
0.5
1
1.5posvel
0 50 100 150 200 250 300 350 400# harmonic component
0
0.05
0.1
0.15
velocity FFT
𝑢 (𝜔 )=𝑖 𝜔 𝑧 (𝜔 )When differentiating the position,The noise is amplified by “”i.e. linearly increasing with frequency

32
Control Structure Interaction (CSI)
Sensitivity function and “waterbed effect”
Feedback Systems: An Introduction for Scientists and EngineersBy Karl Johan Aström, Richard M. Murray

33
Control Structure Interaction (CSI)
Bottom line: Even the implementation of a “simple” linear damping is not trivial
One simple approach Low-pass filter
CAREFUL ABOUT THE PHASE!
-40
-30
-20
-10
0
Mag
nitu
de (d
B)
10-2 10-1 100 101 102-90
-45
0
Pha
se (d
eg)
Bode Diagram
Frequency (rad/s)
𝐺 (𝑠 )= 11+𝑠
Cut-off frequency is 1rad/sPhase is ~5degree at 0.1rad/s

34
WAVE TANK TESTINGAdvanced WEC Dynamics and Controls

35
Test objectives
“Traditional” decoupled-system testing• Radiation/diffraction• Monochromatic waves
Multi-sine, multi-input testing• Excite system w/ both inputs (waves and actuator)• Band-width-limited multi-sine signals
“At-sea” testing• Excite system w/ both inputs (waves and actuator)• Idealized wave spectra

36
Test objectives
“Traditional” decoupled-system testing
Multi-sine, multi-input testing
“At-sea” testing
Can the approach used in other fields for system
identification provide better results for WECs?
Can tests that can be conducted at-sea (i.e. cannot control incoming waves) provide sufficient data to
model the dynamic system (e.g. to update the model intermittently)?
What subtleties specific to WECs need to be
considered for designing a better wave tank test?

37
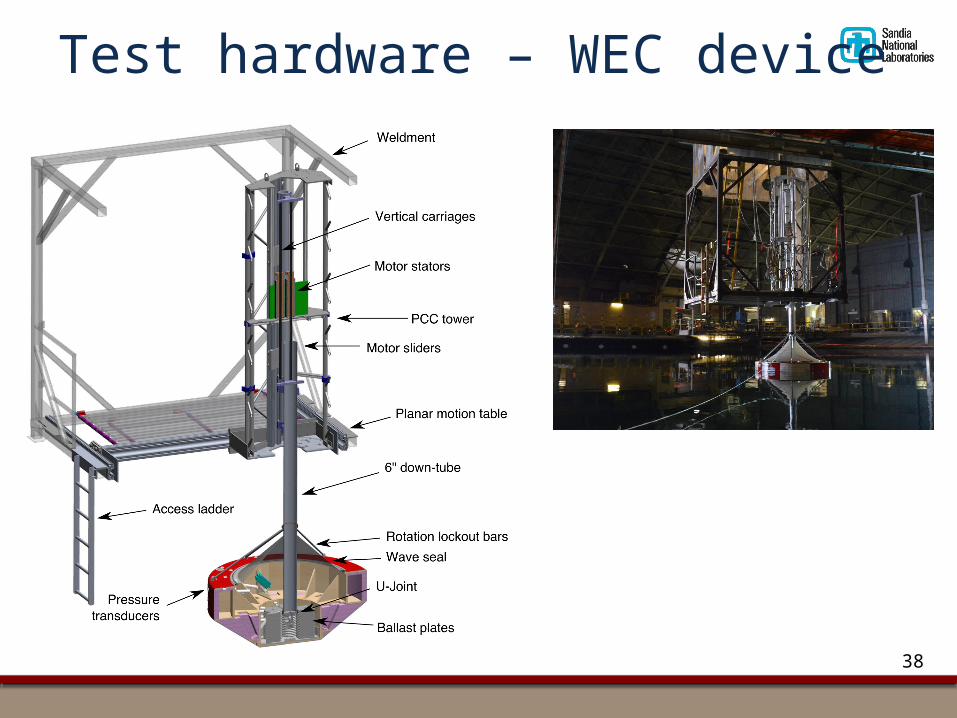
Test hardware – WEC device
• Designed as WEC controls test-bed
• Not intended for full-scale
• Platform to implement, validate
and assess control strategies
• Multiple configurations
• 1-DOF, 3-DOF, 5-DOF
• De-ballast for increased hydro
nonlinearity
• ~1/17th scale
• Displacement: 858 kg
38
Test hardware – WEC device

39
Test hardware – sensors
• Acquired at 50 Hz• NI cRIO system coupled to
separate wave probe systems via TTL trigger and GPS timestamping

40
Test hardware – wave basinManeuvering and Seakeeping (MASK) basinNaval Surface Warfare Center, Carderock Division (NSWCCD)• Built 1962• Dimensions: 106x76x6m deep• Updated wavemakers in 2013
• 216 individual flaps• Peak wave power is approximately 1MW

41
Test hardware – basin layout
𝝀
𝑥𝑦
𝑧
brid
ge
Design factors:• Advanced radiation modeling• Hardware-in-the-loop wave
propagation/prediction• Directional seas

42
Test hardware – wave probes
Sonic probes (green) Tough Senix TSPC-30S1 20 Hz
Capacitive probes (magenta) OSSI Wave Staffs 50 Hz
Resistive probes (red) EDL wave-wires 50 Hz

43
TESTING RESULTSAdvanced WEC Dynamics and Controls

44
Testing
Excitation force model Device locked;
Radiation force model No waves;
System identification 2 inputs / 1 output system
Multisine force on actuator / Multisine wave spectra Band limited white noise on actuator / Bretschneider wave spectra
Why did we use periodic signals? Leakage Better signal to noise ratio – averaging over periods Smoother spectrum (no dips) Nonlinearity detection
45
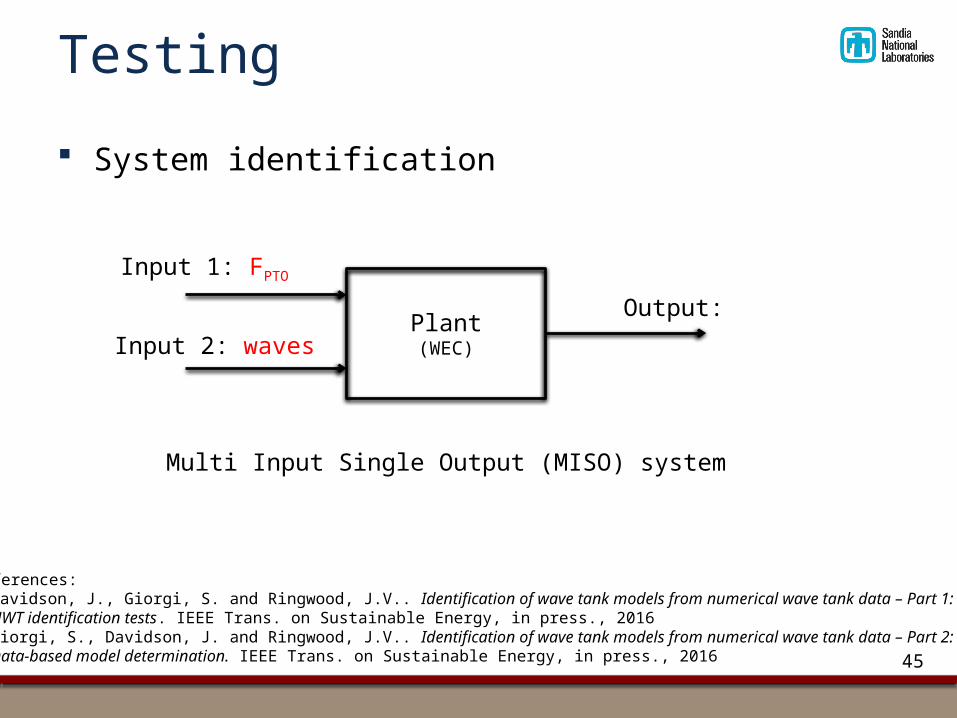
Testing
System identification
References:• Davidson, J., Giorgi, S. and Ringwood, J.V.. Identification of wave tank models from numerical wave tank data – Part 1:
NWT identification tests. IEEE Trans. on Sustainable Energy, in press., 2016• Giorgi, S., Davidson, J. and Ringwood, J.V.. Identification of wave tank models from numerical wave tank data – Part 2:
Data-based model determination. IEEE Trans. on Sustainable Energy, in press., 2016
Plant(WEC)
Multi Input Single Output (MISO) system
Output:
Input 1: FPTO
Input 2: waves

46
Testing Repeating vs non-repeating spectra
Water surface elevation: Bretschneider spectrum, repeat period Trep= 5minutes
0 5 10 15
time (min)
-4
-3
-2
-1
0
1
2
3
4
5
(in)
NOTE: Measurements from acapacitive wave probe 185 190 195 200 205 210 215 220 225
time (s)
-4
-3
-2
-1
0
1
2
3
4
(in)
first periodsecond periodthird period
Detailed view of the overlapped time series

47
Testing results Repeating vs non-repeating spectra
Bretschneider
No Spectrum leakage for period signals Detailed view
# harmonic component
Pow
er

48
Testing results Repeating vs non-repeating spectra
Period T=5min, total time 15 min
Period T=2hrs, total time 30 min
Bretschneider
“Smoother” spectrum (smaller dips in the spectral density) Better S/N ratio
• Measurements from a capacitive wave probe• spectra have not been smoothed, filtered, averaged, etc,..
NOTEs:
𝜔
𝑆(𝜔
)

49
Testing Excitation FRF:
�̂� (𝜔 )
𝜂 (𝑡 )
𝐹 𝑙𝑜𝑐𝑘(𝑡) �̂� 𝑙𝑜𝑐𝑘 (𝜔 )
�̂� (𝜔 )
DFT (FFT)
trimmed at integer multiple of period

500.3 0.4 0.5 0.6 0.7 0.8 0.9 1
Frequency (Hz)
0
0.5
1
1.5
2
2.5
3
|H(
)| (N
/m)
104
ExperimentalWAMIT
Testing Excitation FRF:

51
Testing Radiation FRF:
𝑍𝑟 (𝜔 )=�̂� (𝜔 )+𝑖 𝜔 �̂�𝑎 (𝜔 )=�̂� 𝑃𝑇𝑂 (𝜔 )�̂� (𝜔 )
−𝐵−𝑖(𝜔𝑀 − 𝐾𝜔 ) = Radiation damping = Added mass = velocity = PTO force= linear friction/dissipation= mass = hydrostatic restoring coeff
𝑍𝑟 (𝜔 )
𝑢 (𝑡 )
𝐹 𝑃𝑇𝑂(𝑡 ) �̂� 𝑃𝑇𝑂 (𝜔 )
�̂� (𝜔 )
DFT (FFT)
trimmed at integer multiple of period

52
Testing Radiation FRF:
0.3 0.4 0.5 0.6 0.7 0.8 0.9 1-1000
0
1000
2000
3000
Rad
iatio
n D
ampi
ng
Radiation
ExperimentalWAMIT
0.3 0.4 0.5 0.6 0.7 0.8 0.9 1frequency (Hz)
0
500
1000
1500
2000
Add
ed M
ass

53
Testing Models comparison from different experiments
�̂� 𝑃𝑇𝑂 (𝜔 )�̂� (𝜔 )
= �̂�𝑖=�̂� (𝜔 )+𝐵+𝑖(𝜔 (𝑀+ �̂�𝑎 (𝜔 ) )− 𝐾𝜔 )Intrinsic impedance
Experiments at different values of inputpower and spectra give same model
Sample Input force spectra

54
Testing
Pressure based frequency response functions Why use pressure?
Pressure relatively easy to measure Pressure sensors located on the device Excitation pressure to force TF is causal
12.3 12.4 12.5 12.6 12.7 12.8 12.9 13Time (min)
-0.8
-0.6
-0.4
-0.2
0
0.2
0.4
0.6
0.8
forcepressure
0.3 0.4 0.5 0.6 0.7 0.8 0.9 10
0.2
0.4
0.6
Mag
nitu
de
Radiation FRF (pressure/velocity)
0.3 0.4 0.5 0.6 0.7 0.8 0.9 1frequency (Hz)
-2
0
2
4
Pha
se
0.3 0.4 0.5 0.6 0.7 0.8 0.9 10
10
20
30
Mag
nitu
de
Excitation FRF (Force/Pressure)
0.3 0.4 0.5 0.6 0.7 0.8 0.9 1frequency (Hz)
-200
-100
0
100
200
Pha
se

55
Testing At sea system identification
It is not possible to use periodic waves at sea Still have control on the PTO force, depending on PTO capabilities
Band limited white noise BLWN Multisine Modulate PTO damping …
Plant(WEC)
Output:
Input 1: FPTO(Multisine, BLWN)
Input 2: (real) waves
BLWN = band limited white noise

56
Testing
Waterline in conical section nonlinear modeling: In progress
0 200 400 600 800 1000 1200 1400time (s)
-0.1
-0.08
-0.06
-0.04
-0.02
0
0.02
0.04
0.06
0.08
0.1
z (m
)
Radiation: stepped sine
𝑧
Asymmetric response:nonlinear

57
FUTURE WORKAdvanced WEC Dynamics and Controls

58
Testing results State estimator
Using wave tank experiments At sea
WEC
𝐺𝑟𝑃𝑒
𝐹 𝑒
𝑧
𝐺𝑒
𝐹𝑃𝑇𝑂+
+
+
+ 𝑃
Model set-up:
= excitation pressure = measured pressure = exc pressure to Force TF = rad velocity to pressure TF
= Unknown input

59
Out-years Real-time control Expand study to
Nonlinear modeling/control Additional degrees-of-freedom
Include power-electronics and structural modeling Dynamics and control of 2nd device (considering WEC-Sim
validation device, “FOSWEC)
60
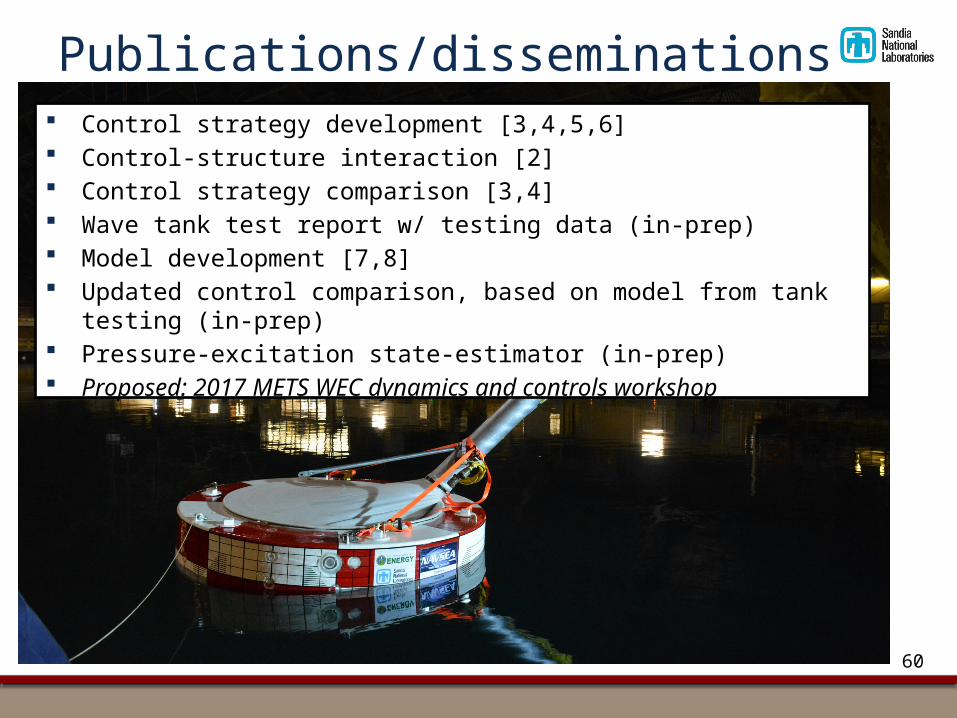
Publications/disseminations Control strategy development [3,4,5,6] Control-structure interaction [2] Control strategy comparison [3,4] Wave tank test report w/ testing data (in-prep) Model development [7,8] Updated control comparison, based on model from tank testing (in-prep) Pressure-excitation state-estimator (in-prep) Proposed: 2017 METS WEC dynamics and controls workshop

61
Thank youThis research was made possible by support from the Department of Energy’s Energy Efficiency and Renewable Energy Office’s Wind and Water Power Program.
Sandia National Laboratories is a multiprogram laboratory managed and operated by Sandia Corporation, a wholly owned subsidiary of Lockheed Martin Corporation, for the U.S. Department of Energy’s National Nuclear Security Administration under contract DE-AC04-94AL85000.
Project team:Alison LaBonte (DOE)Jeff Rieks (DOE)Giorgio Bacelli (SNL)Ryan Coe (SNL)Dave Wilson (SNL)David Patterson (SNL)Miguel Quintero (NSWCCD)Dave Newborn (NSWCCD)Calvin Krishen (NSWCCD)Mark Monda (SNL)Kevin Dullea (SNL)Dennis Wilder (SNL)
Steven Spencer (SNL)Tim Blada (SNL)Pat Barney (SNL)Mike Kuehl (SNL)Mike Salazar (SNL)Ossama Abdelkhalik (MTU)Rush Robinett (MTU)Umesh Korde (SNL)Diana Bull (SNL)Tim Crawford (SNL)

62
References[1] ——, “Estimation of excitation force on wave energy converters using pressure measurements,” in OCEANS2016, submitted. Monterey,
CA: IEEE, September 2016.
[2] D. Wilson, G. Bacelli, R. G. Coe, R. D. R. III, G. Thomas, D. Linehan, D. Newborn, and M. Quintero, “
WEC and support bridge control structural dynamic interaction analysis,” in METS2016, Washington, D.C., April 2016.
[3] D. Wilson, G. Bacelli, R. G. Coe, D. L. Bull, O. Abdelkhalik, U. A. Korde, and R. D. R. III, “A comparison of WEC control strategies,” Sandia
National Labs, Albuquerque, New Mexico, Tech. Rep. SAND2016-4293, April 2016 2016.
[4] G. Bacelli, R. G. Coe, D. Wilson, O. A. U. A. Korde, R. D. R. III, and D. L. Bull, “
A comparison of WEC control strategies for a linear WEC model,” in METS2016, Washington, D.C., April 2016.
[5] O. Abdelkhalik, R. Robinett, S. Zou, G. Bacelli, R. Coe, D. Bull, D. Wilson, and U. Korde, “
On the control design of wave energy converters with wave prediction,” Journal of Ocean Engineering and Marine Energy, pp. 1–11, 2016.
[6] ——, “A dynamic programming approach for control optimization of wave energy converters,” in Ocean Engineering, in review, 2016.
[7] D. L. Bull, R. G. Coe, M. Monda, K. Dullea, G. Bacelli, and D. Patterson, “
Design of a physical point-absorbing WEC model on which multiple control strategies will be tested at large scale in the MASK basin,” in
International Offshore and Polar Engineering Conference (ISOPE2015), Kona, HI, 2015.
[8] R. G. Coe and D. L. Bull, “Sensitivity of a wave energy converter dynamics model to nonlinear hydrostatic models,” in Proceedings of the
ASME 2015 34th International Conference on Ocean, Offshore and Arctic Engineering (OMAE2015). St. John’s, Newfoundland: ASME, 2015.
[9] D. Patterson, D. Bull, G. Bacelli, and R. Coe, “Instrumentation of a WEC device for controls testing,” in Proceedings of the 3rd Marine
Energy Technology Symposium (METS2015), Washington DC, Apr. 2015.
[10] R. G. Coe and D. L. Bull, “Nonlinear time-domain performance model for a wave energy converter in three dimensions,” in OCEANS2014.
St. John’s, Canada: IEEE, 2014.