advances in conformational analysis in … in conformational analysis in heterogeneous systems steve...
TRANSCRIPT

NCMH, Nottingham, UKhttp://www.nottingham.ac.uk/ncmh
Svedberg 125th anniversary
Advances in conformational analysisin heterogeneous systems
Steve Harding

Continuous:polysaccharidesmucins
Discrete:aggregated protein
Conformation in heterogeneous systems

Haug triangle and “scaling relations” or power law coeffs
[] ~ M0; s ~M0.67; Rg ~ M0.33
[] ~ M1.8; s ~M0.15; Rg ~ M1.0
[] ~ M0.5-0.8; s ~M0.4-0.5; Rg ~ M0.5-0.6
ks/[] ~ 1.6
ks/[] ~ 1.6ks/[] ~ 0.3
ks: Gralén coefficient

Power law plot - example
Galactomannansa=0.74+0.01
Picout, Ross-Murphy, Jumel & Harding (2002)Biomacromolecules 3, 761-767
[] ~ Ma

Rollings J (1992) in Laser Light Scattering inBiochemistry (Harding, Sattelle & Bloomfield eds)
Change in Conformation

Conformation Zoning Diagram
Pavlov, Rowe & Harding (1997). Trends inAnalytical Chemistry, 16, 401-405.
0.5 1.0 1.5 2.0 2.5-0.5
0.0
0.5
1.0
1.5
2.0
2.5
3.0
3.5lo
g(1
0-11 k sM
L)
log (1012
[s]/M L)
A
B
C
D
E
0.5 1.0 1.5 2.0 2.5-0.5
0.0
0.5
1.0
1.5
2.0
2.5
3.0
3.5lo
g(1
0-11 k sM
L)
log (1012
[s]/M L)
A
B
C
D
E
A: very stiff rod
B: with limitedflexibility
C: semi-flexible
D: random coil
E: globular orbranched

0.5 1.0 1.5 2.0 2.5-0.5
0.0
0.5
1.0
1.5
2.0
2.5
3.0
3.5
log
(10-1
1 k sML)
log (1012
[s]/ML)
A
B
C
D
E
Bovine glycogen ●
Pectins ■
Pullulans ▲
A: very stiff rod
B: with limitedflexibility
C: semi-flexible
D: random coil
E: globular orbranched
Conformation Zoning Diagram

HYDFIT plot – flexibility determination, Lp
“Bushin-Bohdanecky” relation
2/1
2/1
3/10
3/10
3/12 2w
L
p
Lw M
M
LBMA
M
“Yamakawa-Fujii” relation
....22
843.13
12/1
32
2/1
0
00
pL
w
pL
w
A
L
LM
MAA
LM
M
N
vMs
Garcia de la Torre & Ortega (2007), Biomacromolecules 8, 2462-2475
Konjac glucomannan, Lp ~ 13nm(Kok et al, 2009)

Continuous:polysaccharidesmucins
Discrete:aggregated protein
Conformation in heterogeneous systems

Structure and heterogeneity of
gliadin: a hydrodynamic evaluationS. Ang et al, Eur. Biophys. J. (2009)
ELLIPS1
www.nottingham.ac.uk/ncmh
Conformation analysis in a polydisperse protein system –gliadin

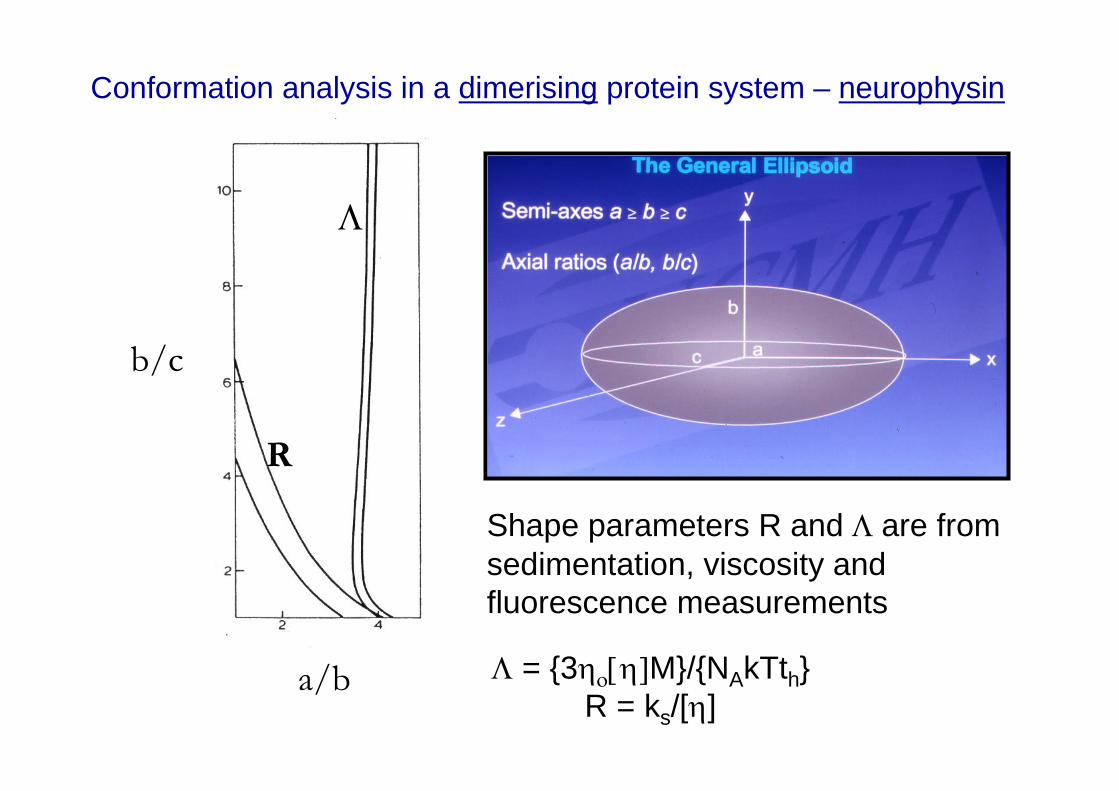
Conformation analysis in a dimerising protein system – neurophysin
or
?

Conformation analysis in a dimerising protein system – neurophysin
or
ELLIPS3
www.nottingham.ac.uk/ncmh
a/b
b/c
R
Shape parameters R and are fromsedimentation, viscosity andfluorescence measurements
Conformation analysis in a dimerising protein system – neurophysin
= {3M}/{NAkTth}R = ks/[]

dimersb/c b/c
a/b
a/b
(a/b)= 4, (b/c)= 1 (a/b)=2.5, (b/c)= 3
monomers
Neurophysin dimerises – here’s what happens
R
R
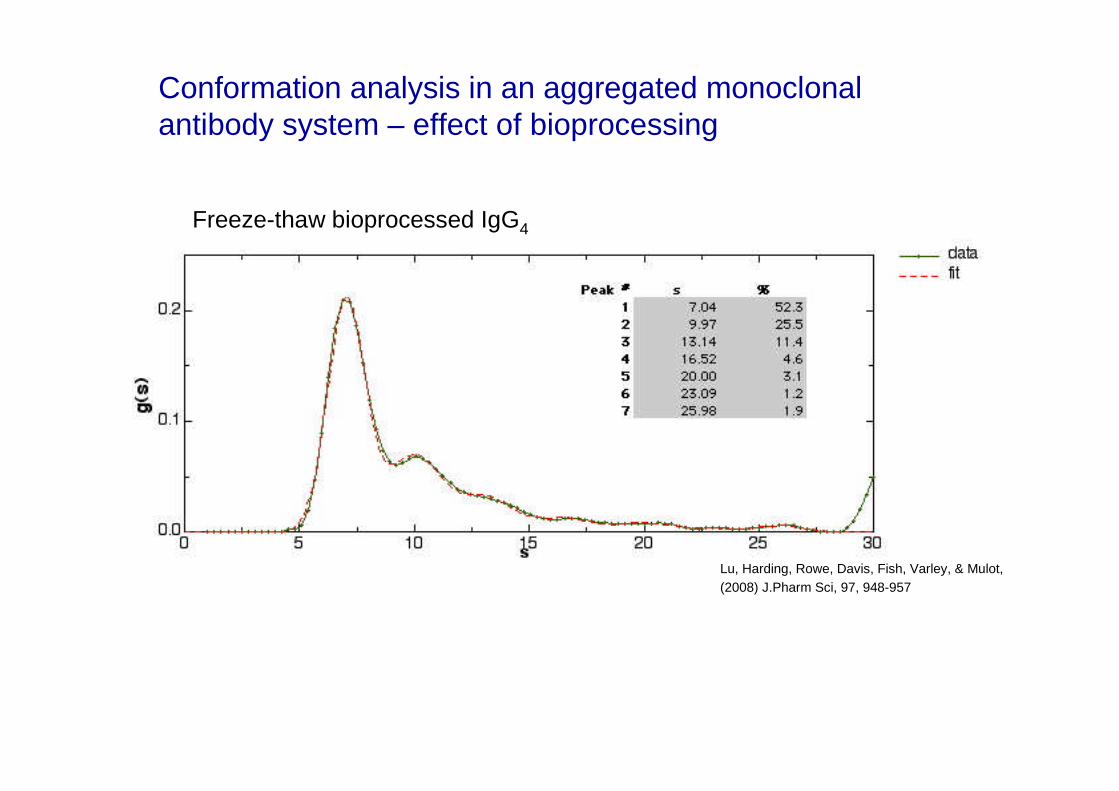
Conformation analysis in an aggregated monoclonalantibody system – effect of bioprocessing
Freeze-thaw bioprocessed IgG4
Lu, Harding, Rowe, Davis, Fish, Varley, & Mulot,
(2008) J.Pharm Sci, 97, 948-957
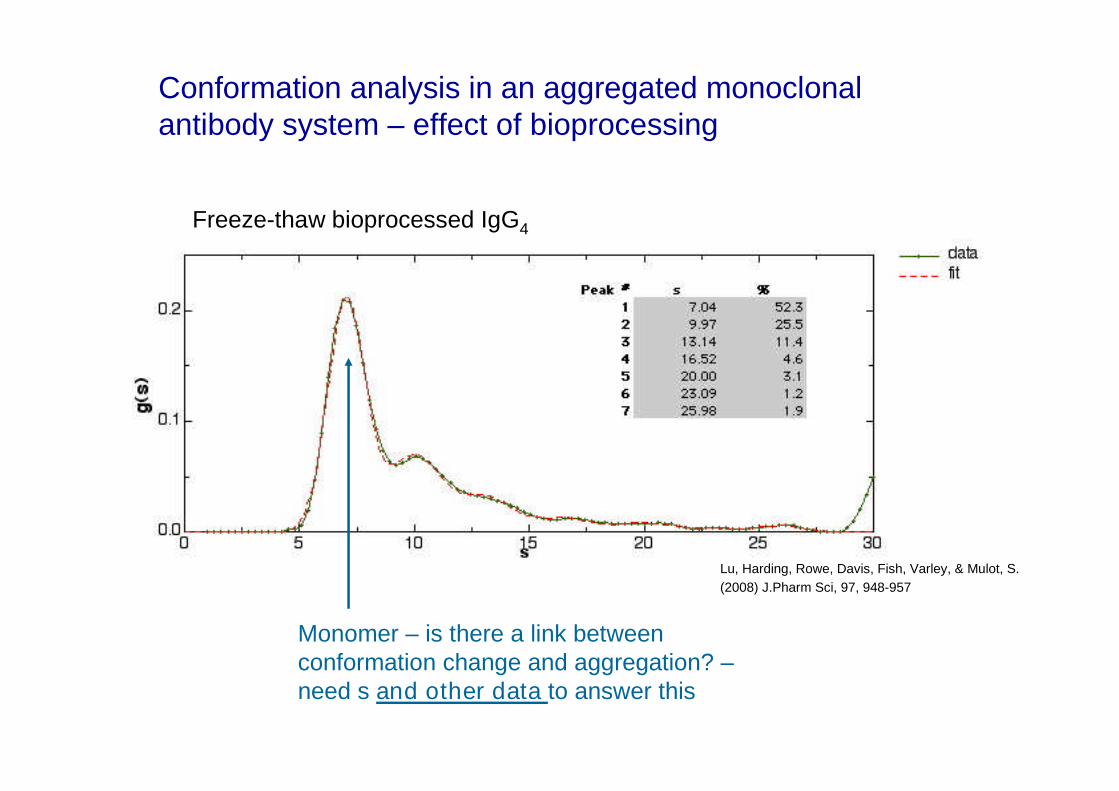
Monomer – is there a link betweenconformation change and aggregation? –need s and other data to answer this
Conformation analysis in an aggregated monoclonalantibody system – effect of bioprocessing
Freeze-thaw bioprocessed IgG4
Lu, Harding, Rowe, Davis, Fish, Varley, & Mulot, S.
(2008) J.Pharm Sci, 97, 948-957

Bead model – “cusp”shape for IgE, 1990
Modelled on s=7.26S,Rg= 6.8nm
.. and iterated from crystalstructure of a hinge deletedIgG mutant
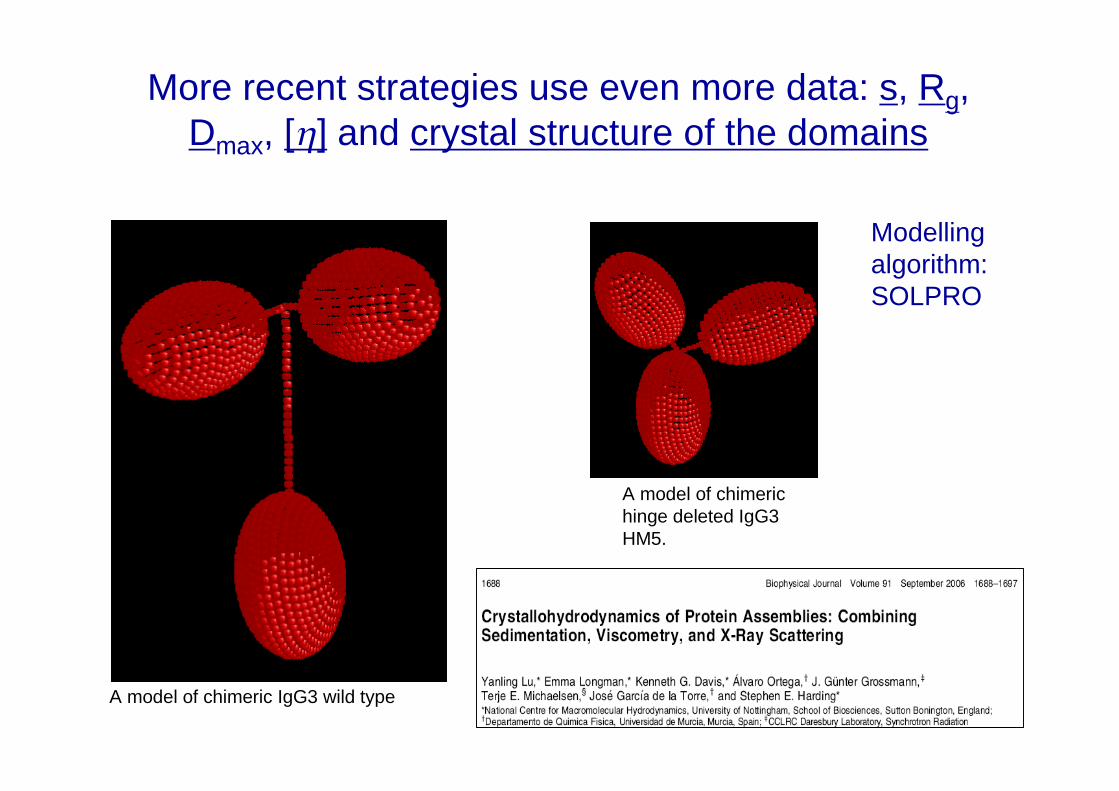
A model of chimeric IgG3 wild type
A model of chimerichinge deleted IgG3HM5.
More recent strategies use even more data: s, Rg,Dmax, [] and crystal structure of the domains
Modellingalgorithm:SOLPRO

Monomer – is there a link betweenconformation change and aggregation? –need s and other data to answer this
Conformation analysis in an aggregated monoclonalantibody system – effect of bioprocessing
Freeze-thaw bioprocessed IgG4
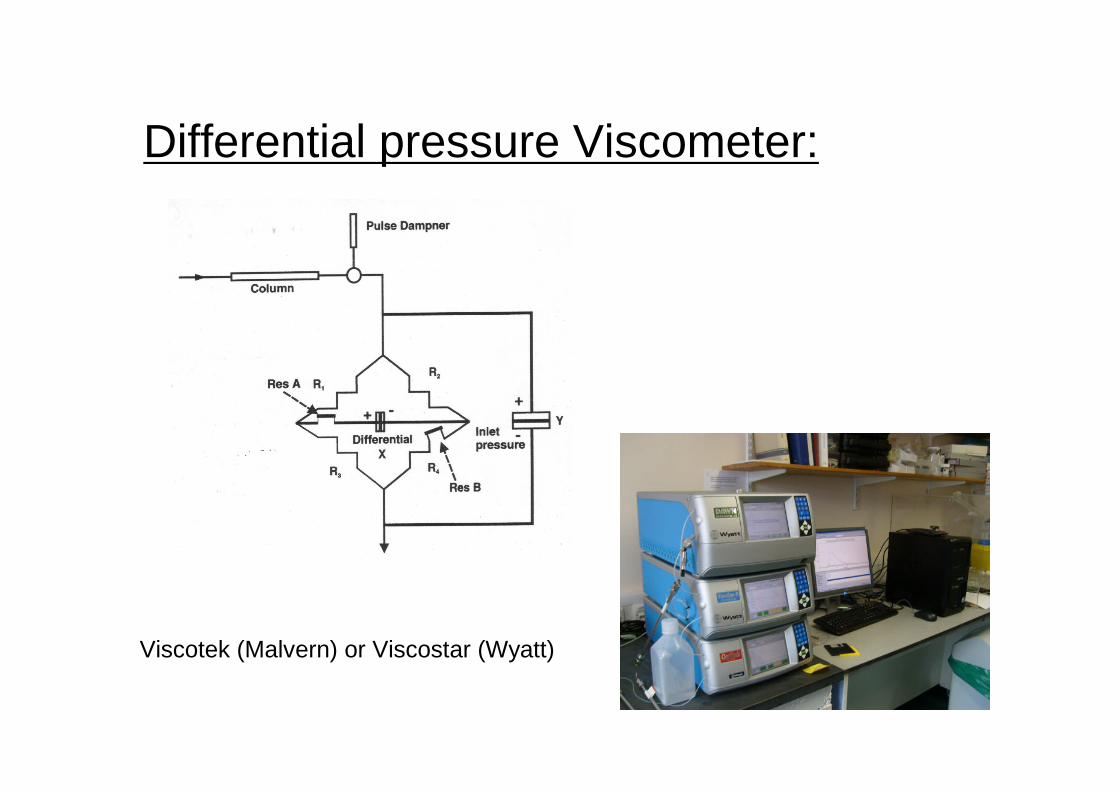
Differential pressure Viscometer:
Viscotek (Malvern) or Viscostar (Wyatt)

10 15 20 25
0.0
0.2
0.4
0.6
0.8
1.0N
orm
alis
edD
etec
tor
Res
po
nse
Elution Time (min)
LS 90o
DRIDPV
Chicken FibrinogenMw = 335000 g/mol (0.1 %)[] = 27.7 ml/g (0.3 %)
….on-line intrinsic viscosity measurement
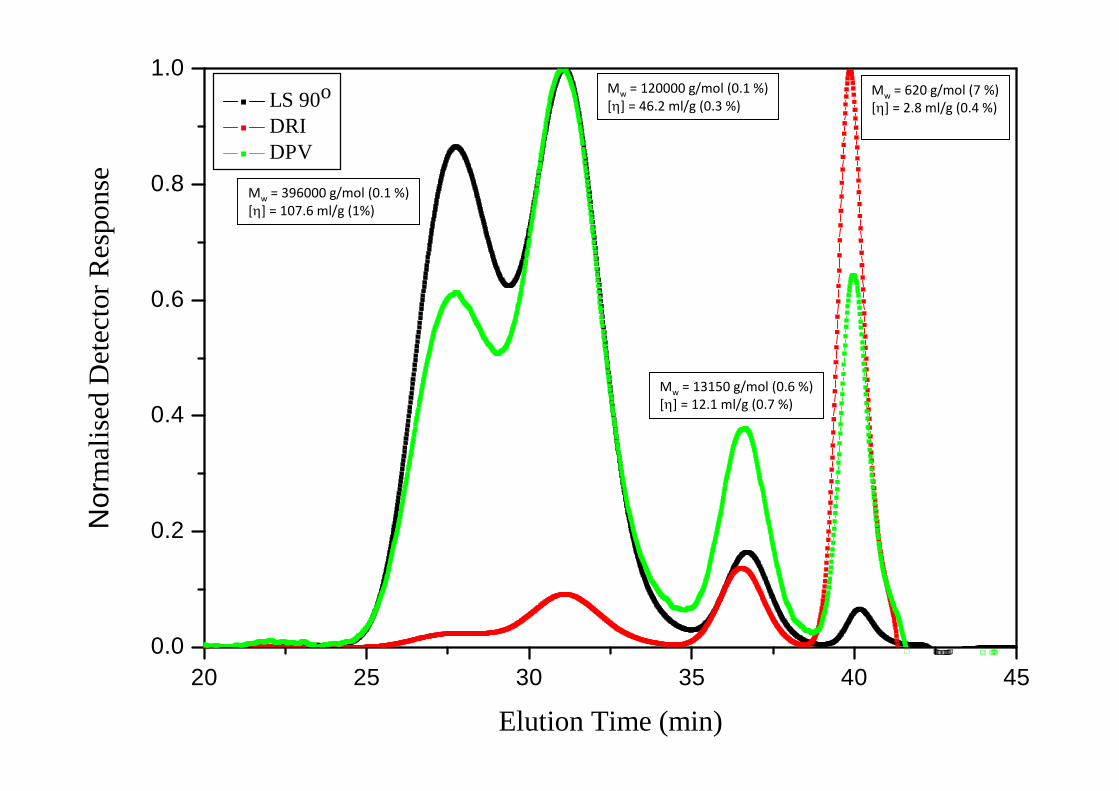
20 25 30 35 40 45
0.0
0.2
0.4
0.6
0.8
1.0
LS 90o
DRIDPV
Norm
alis
edD
etec
tor
Res
ponse
Elution Time (min)
Mw = 396000 g/mol (0.1 %)[] = 107.6 ml/g (1%)
Mw = 120000 g/mol (0.1 %)[] = 46.2 ml/g (0.3 %)
Mw = 13150 g/mol (0.6 %)[] = 12.1 ml/g (0.7 %)
Mw = 620 g/mol (7 %)[] = 2.8 ml/g (0.4 %)

Monomer – is there a link betweenconformation change and aggregation? –need s and other data to answer this
Conformation analysis in an aggregated monoclonalantibody system – effect of bioprocessing
Freeze-thaw bioprocessed IgG4

Thanks to:
Professors Arthur Rowe, JoseGarcia de la Torre, Simon Ross-Murphy, Georges Pavlov & Drs.Dave Scott & Gordon Morris