advances in small-scale map projection research
TRANSCRIPT
BelgeoRevue belge de géographie
1-2-3-4 | 2000Special issue: 29th International GeographicalCongress
Advances in small-scale map projection research
Frank Canters
Electronic versionURL: http://journals.openedition.org/belgeo/13883DOI: 10.4000/belgeo.13883ISSN: 2294-9135
Publisher:National Committee of Geography of Belgium, Société Royale Belge de Géographie
Printed versionDate of publication: 30 December 2000Number of pages: 47-64ISSN: 1377-2368
Electronic referenceFrank Canters, « Advances in small-scale map projection research », Belgeo [Online], 1-2-3-4 | 2000,Online since 12 July 2015, connection on 30 April 2019. URL : http://journals.openedition.org/belgeo/13883 ; DOI : 10.4000/belgeo.13883
This text was automatically generated on 30 April 2019.
Belgeo est mis à disposition selon les termes de la licence Creative Commons Attribution 4.0International.
Advances in small-scale map projectionresearch
Frank Canters
1 From the early days of map making to the present time, the challenge of representing the
round Earth or part of it on a flat piece of paper without introducing excessive distortion
has attracted the attention of many geographers, physicists, astronomers,
mathematicians, and mapmakers. Putting aside the Medieval period, when
representations of the Earth’s surface were influenced by religious ideology and loaded
with symbolic meaning (e.g. the famous East-oriented T-O maps that depict the Earth as a
round disk, subdivided in three continents by a T-shaped sea and surrounded by an O-
shaped ocean), the accurate representation of the Earth as it is known at a particular time
has always been an important objective of contemporary map making. This does not
imply that the subject of map projection has received an equal amount of interest from
the ancient Greek period, when Claudius Ptolemy wrote his famous Geography, all the
way up to the twentieth century. Major breakthroughs in the history of map projections
were prompted by various external factors like, for example, the increasing geographical
knowledge during the Renaissance, which led to modifications of earlier map projections
and the development of a whole series of new map projections suitable for displaying the
entire globe, or the development of the calculus (first applied to map projections by
Johann Heinrich Lambert in the late eighteenth century), which gave the cartographer or
mathematician the necessary tools for the development of new map projections that fulfil
certain general conditions, the most important of these being the preservation of angles
and area.
2 The introduction of modern computers marks a new era in the evolution of map
projection science. Being dominated for almost two centuries by the formulation of
analytical solutions to increasingly complex map projection problems, the computer
cleared the way for a numerical treatment of map projection. Numerical approaches have
been used to solve various practical problems related to map projection, including the
efficient transfer of data from one map projection to another (Doytsher and Shmutter,
Advances in small-scale map projection research
Belgeo, 1-2-3-4 | 2000
1

1981; Wu and Yang, 1981; Snyder, 1985; Kaltsikis, 1989; Canters, 1992) and the automated
identification of map projection type and/or map projection parameters for maps for
which this information is not known (Snyder, 1985). The computer has also been used to
evaluate and compare distortion on various map projections (Tobler, 1964; Francula,
1971; Peters, 1975; Canters and Decleir, 1989; Laskowski, 1998; Canters, 1999) and to
automatically determine the value of the parameters of standard map projections so that
overall scale error is reduced (Snyder, 1978; Snyder, 1985). One of the most stimulating
outcomes of computer-assisted map projection research so far has been the development
of new map projections with distortion patterns that are closely adapted to the shape of
the area to be mapped, guaranteeing minimum overall scale error within the
approximate boundaries of the area (Reilly, 1973; Lee, 1974; Snyder, 1984, 1986, 1988;
Canters and De Genst, 1997; González-López, 1997). Although the theoretical foundations
for the development of these projections, and the first simple applications of the
minimum-error principle, date from the pre-computer age (Laborde,1928; Miller, 1953), a
more complicated use of the technique requires extensive numerical processing, practical
only in a digital setting.
3 The digital revolution also had a large impact on the everyday use of map projections. As
computer-based mapping tools make it possible for an ever growing group of people
without any formal cartographic background to make their own maps, it also gives them
the freedom to become more creative with map projections. Complicated map projections
that are difficult to draw manually, and for that reason were seldom used in the past, can
now be plotted quickly using map projection software libraries or map projection tools
that come with standard GIS software. Projection parameters can easily be changed,
making it possible to experiment with alternative views of the same geographical area
with very little effort. Although this may lead to a greater awareness of the advantages
and disadvantages of using a particular map projection for a given purpose, it also creates
much opportunity for misuse. This author is not aware of the existence of any
commercially available map projection tool that offers the user some basic guidance in
choosing a proper map projection for a particular mapping task. The lack of such tools is
very unfortunate, especially in small-scale mapping where the user often has a large
number of potential map projections at his or her disposal, and the choice of projection
may determine to a large extent if data are portrayed adequately in relation to the
purpose of the map and, accordingly, if the map fulfils its role as a communicative device
or not (see e.g. American Cartographic Association, 1991). Examples of bad map design
are indeed quite common, in print journalism as well as in the electronic media
(Gilmartin, 1985; Monmonier, 1989). Offering the mapmaker some assistance in selecting
a proper map projection for a small-scale map is therefore recommended. A few attempts
have been made to automate (or partly automate) the map projection selection process
(Jankowski and Nyerges, 1989; Mekenkamp, 1990; De Genst and Canters, 1996). They will
be discussed in the last part of this paper.
4 The main objective of this paper is to review previous and current studies in small-scale
map projection research, and to discuss the research that has been done by this author in
relation to similar work by others. It is by no means this author’s intention to provide a
comprehensive review of all the work that has been done in the different research areas
that will be mentioned. Only some of the most significant contributions in each sub-area
of research will be discussed, in order to define a suitable framework for discussion. It is
hoped that this paper will give the reader a good impression of the marked evolution of
Advances in small-scale map projection research
Belgeo, 1-2-3-4 | 2000
2

map projection science over the last forty years, of changes in the way map projections
are used (or will be used in the near future), and of the important role the rapidly
increasing, widespread use of computers has played in this process.
Evaluation of map projection distortion
5 The projection of a curved surface on a plane map always introduces distortion. As a
result of this distortion map scale varies from one location to another and is generally
different in every direction. When trying to represent the Earth on a plane our primary
concern is to choose a map projection on which distortion is a minimum. Accomplishing
this necessitates an understanding of how map projection distortion takes place and how
it is distributed over the entire map area. Tissot (1881) demonstrated that at an
infinitesimal scale every map projection is an affine transformation. When applying a
map projection, each infinitesimal circle, centred around a point p on the sphere, is
transformed into an ellipse, which is called the indicatrix of Tissot (figure 1). The
indicatrix offers a complete description of the distortion characteristics of the projection
for a particular location on the map. Its semi-diameters a and b represent the maximum
and minimum value of the local scale factor in the immediate vicinity of the point. A scale
factor equal to one means no distortion, a scale factor smaller or larger than one points to
linear compression or linear stretching respectively. Once the semi-diameters a and b of
the ellipse and its orientation are known, various distortion measures can be calculated,
including the distortion of angles, the distortion of area and the local scale distortion in
an arbitrary direction. Distortion characteristics of a projection can be visualised by
mapping Tissot’s indicatrix for selected positions on the graticule (the framework of
meridians and parallels that determines the appearance of the projection), or by
calculating distortion measures for a large number of graticule intersections and
constructing isocols (lines of equal distortion) (figure 2).
Figure 1. Elementary circle in the tangent plane on the sphere (a), and corresponding ellipse ofdistortion in the mapping plane (b).
Advances in small-scale map projection research
Belgeo, 1-2-3-4 | 2000
3

Figure 2. Low-error polyconic projection with two-fold symmetry, equally spaced parallels and acorrect ratio of the axes (Canters projection) with lines of constant area scale (a), and lines ofconstant maximum angular distortion (b).
6 Although graphic representations of local distortion characteristics, as shown in figure 2,
offer a clear and detailed insight in the spatial distribution of map projection distortion,
they do not permit a quick comparative evaluation of distortion for a large set of map
projections. They also do not give us information about the optimal choice of parameter
values (e.g. the position of the centre of the projection, the latitude of the standard
parallel(s)) for a particular map. Both comparative evaluation and optimisation of map
projection parameter values require that distortion for the entire area of the map (or at
least one aspect of it, e.g. angular, area of distance distortion) is characterised by a single
value. While some authors have suggested to characterise the distortion of a map
projection by the maximum amount of distortion attained over the mapped area (Tissot,
1881; Bludau, 1891; Wagner, 1962), most studies are based on the use of average distortion
values. A large part of the work on the comparative evaluation of map projection
distortion concentrates on the mapping of the whole planisphere (see e.g. Francula, 1971;
Peters, 1975; Canters and Decleir, 1989; Laskowksi, 1998; Canters, 1999). The large variety
of map projections that is available for world maps has indeed tempted many
Advances in small-scale map projection research
Belgeo, 1-2-3-4 | 2000
4

cartographers to find an objective means of deciding which one of these projections can
be considered the best. Of course, the outcome of any study of this kind will depend on
how the average distortion value for a projection is calculated. Over the years a multitude
of distortion measures and algorithms for calculating average distortion values have been
proposed. A clear distinction should be made between two fundamentally different ways
of defining and characterising map projection distortion, i.e. at the local scale or at the
finite scale.
7 The most traditional way of calculating an average distortion value for a projection is to
divide the area to be mapped into a large number of small plots, calculate the value of a
local distortion measure for the midpoint of each plot, and average the obtained values,
using the area of each plot as a weight factor. This approach is entirely based upon the
classical theory of map projections, and the concept of Tissot’s indicatrix, which enables
us to describe the distortion characteristics of a projection for each individual location on
the map. One of the best-known early examples of the use of this technique is the study
by Behrmann (1909), in which he compares map projection distortion for different equal-
area projections by calculating the maximum distortion of angles for equal increments of
longitude and latitude, and deriving a mean angular distortion value for each projection.
For obvious reasons, however, it was only after the invention of modern computers that
the technique reached its full potential, and could be applied in a more systematic way to
analyse and compare distortion for a large number of map projections (see e.g. Francula,
1971; Canters and Decleir, 1989). The traditional method of calculating map projection
distortion in a point-wise manner, however, has its limitations when it comes to
characterising distortion for larger areas. This is especially true for world maps. A critical
evaluation of map projection rankings based on average local distortion values indicates
that, although in general map projections with well-balanced distortion patterns have the
lowest average distortion values, there are some notable examples of map projections
with less favourable distortion characteristics that score remarkably well (Canters, 1999).
This is particularly the case for cylindrical projections, which are known for their
extreme and visually disturbing rate of distortion away from the standard parallels, and
are usually not recommended for world maps (American Cartographic Association, 1989).
8 The major reason why an evaluation that is based on the point-wise calculation of local
distortion values does not produce map projection rankings as expected lies in the fact
that a simple averaging of distortion values for a discrete set of locations does not take
account of the spatial variation of distortion typical of each projection. Obviously it is the
cumulative effect of scale distortion over finite distances that will determine how well
large-size geographical features are represented on a small-scale map. One may therefore
expect to be more successful in evaluating the departure of a feature’s representation on
the map from its original representation on the globe by measuring map projection
distortion at the finite scale. One of the first attempts to quantify map distortion in the
large was by Fisher and Miller (1944). By defining twenty equilateral spherical triangles
on the globe and comparing these with their mapped versions, obtained by connecting
the projected vertices of the original triangles with straight lines, they calculated the
linear scale ratio (map distance over spherical distance) for each side, the areal scale ratio
(plane area over spherical area) for each triangle, and the angular difference (plane value
minus spherical value) for each pair of sides. From the calculated ratios the maximum,
minimum and mean value was derived, as well as the standard deviation. With the advent
of modern computers finite distortion measures could be calculated for much larger
Advances in small-scale map projection research
Belgeo, 1-2-3-4 | 2000
5

samples. In a study of 1964, Waldo Tobler, a pioneer in the development of numerical
solutions to map projection problems, adopted the approach described by Fisher and
Miller. However, instead of working with a small number of a priori defined spherical
triangles, Tobler calculated mean linear scale ratio, mean areal scale ratio and mean
angular difference for a variety of map projections and for areas of different size, using
samples of 300 to 500 randomly selected triplets of latitude and longitude, depending on
the size of the area (Tobler, 1964).
9 Other studies on finite map projection distortion that follow deal with the definition of
suitable measures and algorithms to quantify the average distortion of finite distance on
a map projection (Gilbert, 1974; Peters, 1975; Albinus, 1981; Canters, 1989). The idea
behind these studies is that all types of distortion that occur on a map can be considered
the result of a distortion of scale that changes continuously with location and direction.
As such the average distortion of finite distance will give a good indication of the extent
to which the plane map differs from the surface that is projected. In all four studies that
are listed above the average distortion of distance is calculated for a large number of
randomly selected pairs of points. Alternative solutions that are proposed differ in two
ways: (a) the definition of the index that is used to quantify the average distortion, (b) the
method (algorithm) that is used for the selection of the random pairs of points. Recently
Canters (1999) presented a new method to measure the deviation from true area
proportions and the distortion of shape on small-scale maps, and applied it to quantify
finite distortion for a large set of map projections that are commonly used for world
maps. The proposed method measures relative differences in area and shape for a
randomly selected set of spherical circles that are homogeneously distributed over the
area of interest, by comparing each circle on the globe with its representation on the
map, and averaging the obtained distortion values. The study indicates an inverse
relationship between the mean deviation from true area proportions and the mean
distortion of shape. Projections with a low distortion of finite distances prove to have
favourable distortion characteristics (a moderate distortion of shape and proportions),
which confirms that the average distortion of finite distance is an appropriate indicator
for the joint effect of the two most important aspects of map projection distortion at the
small scale, i.e. the distortion of correct area proportions and the distortion of shape.
10 Acknowledging that map projection distortion can present itself in many different ways
(local distortion of scale in a particular direction, distortion of distance, angles, azimuth,
shape, absolute area, relative area proportions,…), some authors have also proposed the
use of combined distortion measures, which provide a general assessment of the
combined impact of two, three or even more different aspects of distortion. Some of these
measures, especially those referring to various aspects of distortion at the local scale,
already have a long history (Airy, 1861; Jordan, 1896; Kavrayskiy, 1958), others have been
proposed more recently (Canters and Decleir, 1989; Laskowski, 1991; Bugayevskiy and
Snyder, 1995). One of the major difficulties in the definition of combined distortion
measures is that not all aspects of distortion are expressed in the same units, and
therefore cannot be directly compared. Overcoming this problem requires that
measurements of different aspects of distortion are properly calibrated. Only recently
Laskowski (1998) proposed a method for the standardisation of different distortion
measurements that offers a partial solution to the problem of unlike units. However, the
more fundamental problem of weighting different aspects of distortion equally is far from
solved and remains an interesting area for future research.
Advances in small-scale map projection research
Belgeo, 1-2-3-4 | 2000
6
Low-error map projections
11 Distortion measures that allow us to quantify one aspect of distortion (or the combined
effect of different types of distortion, see above) for a complete area, are not only useful
to compare distortion on different map projections. They can also be used to optimise the
parameters of one particular projection, so that minimum overall distortion is
guaranteed within the boundaries of the area to be mapped. In most studies on map
projection optimisation, optimal values for the parameters of the projection of interest
are obtained by minimising the sum of the squares of the errors in local scale along the
two axes of Tissot’s indicatrix (corresponding with the two directions along which local
scale reaches its maximum and minimum value respectively, see above). Projections that
are derived in this manner are usually referred to as minimum-error projections . The
majority of papers on minimum-error projections has been published between 1850 and
1950, before modern computers were available. In these studies the problem of
optimisation is necessarily limited to a small number of map projection parameters
(mostly one), and to map projections with simple mathematics (azimuthal, cylindrical and
conical projections) (Airy, 1861; Young, 1920; Tsinger, 1916; Kavrayskiy, 1934).
12 The introduction of computers created new opportunities for research into minimum-
error projections that before then had been impossible to think of. A good example of this
is the work that has been done on the development of new low-error conformal map
projections. In 1856 Chebyshev stated that a conformal projection has the least possible
overall distortion if the sum of the squares of local scale errors over the region is a
minimum, and that this results if the region is bounded by a line of constant scale.
Mathematical proof of this statement was given by Grave in 1896. Inspired by Chebyshev’s
theorem several authors have developed new low-error conformal graticules, with
sometimes very complicated patterns of isocols (lines of equal distortion), following the
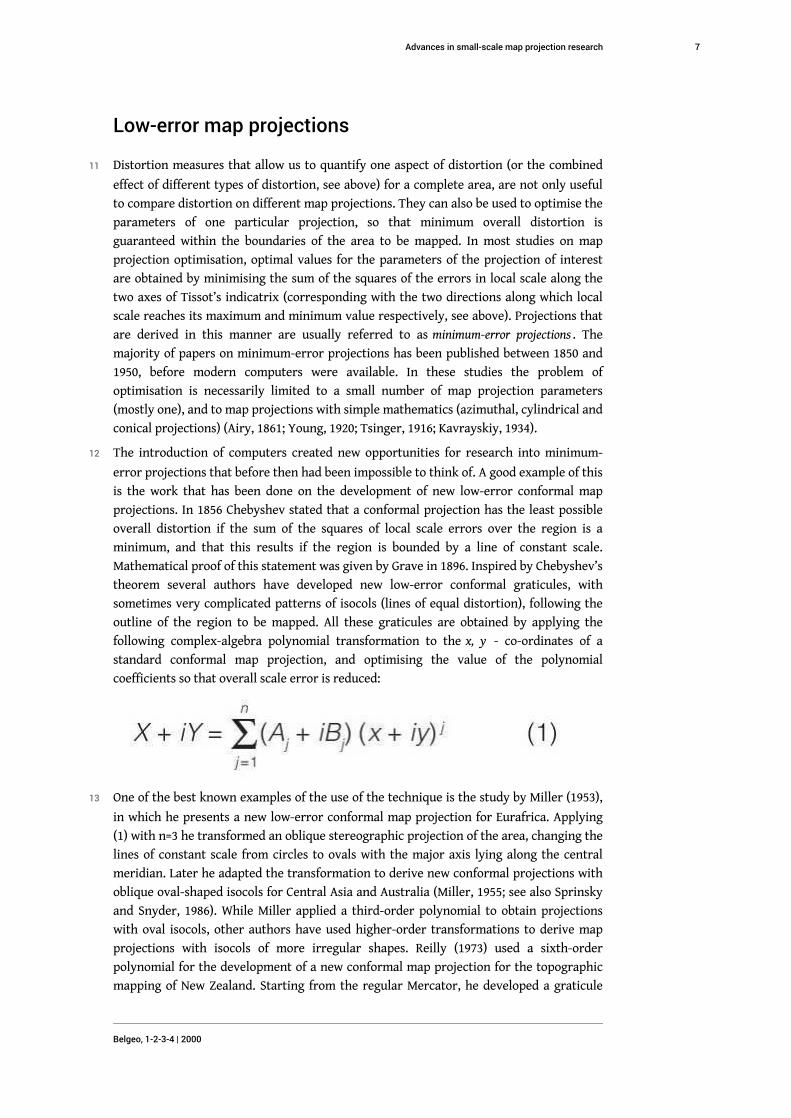
outline of the region to be mapped. All these graticules are obtained by applying the
following complex-algebra polynomial transformation to the x, y - co-ordinates of a
standard conformal map projection, and optimising the value of the polynomial
coefficients so that overall scale error is reduced:
13 One of the best known examples of the use of the technique is the study by Miller (1953),
in which he presents a new low-error conformal map projection for Eurafrica. Applying
(1) with n=3 he transformed an oblique stereographic projection of the area, changing the
lines of constant scale from circles to ovals with the major axis lying along the central
meridian. Later he adapted the transformation to derive new conformal projections with
oblique oval-shaped isocols for Central Asia and Australia (Miller, 1955; see also Sprinsky
and Snyder, 1986). While Miller applied a third-order polynomial to obtain projections
with oval isocols, other authors have used higher-order transformations to derive map
projections with isocols of more irregular shapes. Reilly (1973) used a sixth-order
polynomial for the development of a new conformal map projection for the topographic
mapping of New Zealand. Starting from the regular Mercator, he developed a graticule
Advances in small-scale map projection research
Belgeo, 1-2-3-4 | 2000
7

with lines of constant scale roughly following the outlines of the two main islands. Snyder
(1984) took a similar approach to develop a new low-error conformal projection for a 50-
state map of the United States, using a tenth-order polynomial. Optimal coefficients for
these more complex transformations are obtained by minimising overall scale error using
the method of least-squares. This requires iterative solution of a set of simultaneous
equations, the number of equations depending on the order of the polynomial (see
Snyder, 1985, pp. 86-90).
14 Instead of minimising the sum of the squares of the errors in local scale, some authors
preferred to work with finite distortion measures. In 1977 Waldo Tobler presented a new
low-error projection for the United States. The projection was obtained by minimising
the root-mean-square error for all great-circle distances between selected points on a
regular grid covering the area. It has no formulas in the usual sense, but is defined by
rectangular co-ordinates for the points used in the analysis. Peters (1978), also a pioneer
in the work on finite distortion, optimised parameter values for various world map
projections by minimising average distortion for 30,000 distances, connecting randomly
chosen pairs of points with uniform probability distribution over the continental surface.
In 1989 Canters presented a new method for the development of world map projections
with low distortion. Expressing the relationship between the co-ordinates in the map
plane and the co-ordinates on the globe by the following two polynomials:
15 with x, y the map projection co-ordinates λ and ϕ the geographical longitude and
latitude, and Cij and C’ij the polynomial coefficients defining the properties of the
graticule, he presented a whole set of new projections with intermediate distortion
characteristics (neither conformal, nor equal-area) that are suited for global mapping
purposes (see also Canters, 1999). All graticules were obtained by minimising the average
distortion of finite distances, using a modified version of Peters’ distortion measure, and
a well-considered strategy for the selection of distances. The attractiveness of the method
lies in its use of polynomial type equations, which makes it very easy to impose useful
restrictions on the geometry of the graticule (shape of the parallels and the meridians,
spacing of the parallels, ratio of the axes, length of the pole line,.…) Figure 2 shows an
example of a low-error polyconic projection with two-fold symmetry, equally spaced
parallels and a correct ratio of the axes, also referred to as the Canters projection, with
lines of constant area scale and lines of constant maximum angular distortion
superimposed. The Canters projection is used in Belgian geography textbooks and atlases,
and has also been adopted for the production of wall maps by Belgian organisations that
are active in development co-operation (ABOS, NCOS).
16 Just like the complex-algebra transformation described above (eq. (1)) is used to produce
low-error conformal projections, transformation functions can be defined that allow us to
Advances in small-scale map projection research
Belgeo, 1-2-3-4 | 2000
8

modify the distortion pattern of a standard equal-area projection so that it better fits the
shape and orientation of the area to be mapped. The easiest way to accomplish this is by a
simple linear stretch of the graticule along one of the co-ordinate axes, followed by a
compression of equal magnitude along the perpendicular axis to maintain the equal-area
property. Applied to Lambert’s oblique azimuthal equal-area projection it changes the
circular isocols into ovals, which can be given any arbitrary orientation by a simple
rotation of the co-ordinate axes prior to the transformation. A good choice of the affine
coefficient and a proper orientation of the axes will lead to less variation of scale and
angular distortion for elongated areas. Tobler (1974) presented examples of this simple
equal-area transformation for areas of different size. A more complicated transformation
of the oblique azimuthal equal-area projection that uses sine functions to alter the
spacing of the original graticule in the x- and y direction was proposed by Snyder (1988).
It allows the mapmaker to create equal-area graticules with oval, rectangular or rhombic
isocols that have less distortion of angles and scale for non-circular regions. Snyder
presented examples with oval isocols of different eccentricity for the mapping of the
Atlantic Ocean as well as a map of the conterminous United States with rectangular
isocols. Canters (1991) proposed two simple polynomial transformations, with
appropriate constraints on the value of the polynomial coefficients to make sure that the
general condition for an equal-area transformation in the plane is satisfied. Applied
separately or in combination these transformations make it possible to derive a variety of
low-error equal-area graticules with alternative geometry, starting from any standard
equal-area projection. The proposed transformations were used for the development of
various new equal-area graticules, useful for maps at the global as well as at the
continental scale. Special attention was paid to the development of a new low-error
equal-area projection for the fifteen member states of the European Union (Canters and
De Genst, 1997; Canters, 1999). Except for Rodos and the easternmost part of Finland,
scale error on this new projection is well below 1% for the entire EU (figure 3).
Figure 3. Fifth-order low-error transformation of the oblique azimuthal equal-area projection for theEuropean Union, with lines of constant maximum scale error (%).
Advances in small-scale map projection research
Belgeo, 1-2-3-4 | 2000
9

Map projection selection
17 The selection of a suitable map projection is an important issue in small-scale map design,
especially for the mapping of large areas, where map projection distortion exceeds the
threshold of visibility. Over the years a great number of map projections have been
proposed. Even for the skilled cartographer, who has a good knowledge of map projection
principles, choosing among this variety of existing projections is not an easy task. Map
projection selection interferes with several other variables in map design. As such it is
not possible to compile a magic table telling us unambiguously what type of map
projection is best for a given application. With the increasing use of geographical
information systems and the development of new mapping software for personal
computers cartographic tools are coming within the reach of an ever growing group of
users that are unfamiliar with the principles of cartographic design. This has led some
cartographers to determine what is currently known about map design from years of
theoretical and practical research and to try to translate this knowledge into a set of rules
that can be built into microcomputer-based software. A few researchers have addressed
the problem of automated (or semi-automated) map projection selection, taking into
account the limitations imposed by the digital medium, as well as the new opportunities
for map projection development that are offered by the computer (see above).
18 The choice of a map projection is strongly related to the purpose of the map. The area
that will be covered, the ways in which the map is going to be used and the intended
audience for whom the map is targeted are all major elements in the decision process.
Hence selection should start with the definition of a unique set of requirements that best
suits the purpose of the mapping, and that can be translated into a set of map projection
properties. Based on these properties a proper choice should be made. In spite of the
practical importance of map projection selection only very few authors have treated the
subject in any detail. Knowledge on map projection selection mostly appears as a
heterogeneous and partly inconsistent collection of rules, repeatedly found in general
textbooks on cartography or map projection. Many authors only provide a summary of
the map projections that are most frequently used for the mapping of various areas and
for different map purposes. These listings are of limited use to a novice cartographer,
since they do not provide any insight in the reasoning that brings the cartographer to
choose for a particular projection.
19 Snyder (1987, p. 34) is one of the few authors who treat the problem of map projection
selection in a systematic way. To facilitate the selection process, he presents a decision
tree that is based on: (a) size, shape, orientation and location of the region to be mapped,
(b) special distortion properties (conformal, equal-area, equidistant, correct scale along a
chosen great-circle), and (c) application-specific considerations (e.g. straight rhumb lines,
straight great-circle routes, interrupted designs). Snyder also recognises that world maps
cannot be satisfactorily represented by means of conic type projections, and that other
selection criteria may be involved in global mapping than in continental or regional
mapping (e.g. the decision to interrupt the graticule or not). He therefore makes a clear
distinction between world maps and maps of smaller areas. For world maps many types of
projections are listed, depending on the type of application. For smaller areas he
recommends the use of conic type projections (azimuthal, conical or cylindrical
Advances in small-scale map projection research
Belgeo, 1-2-3-4 | 2000
10

projections). Maps of a hemisphere, which usually have a circular outline, are also treated
as a separate class. For these maps Snyder recommends the use of azimuthal projections.
20 Nyerges and Jankowski (1989) adopted Snyder’s scheme to develop a knowledge base for
map projection selection. The formalised knowledge was implemented in a prototype
expert system for map projection selection, known as MaPKBS or Map Projection
Knowledge-Based System (Jankowski and Nyerges 1989). MaPKBS, as it was presented in
1989, cannot be regarded as a definite solution to the problem of automated map
projection selection. It takes into account only a fraction of the criteria that may be
involved in the selection process. However, the development of the system proves that
some of the trade-offs involved in map projection selection can be managed by an
automated system if appropriate heuristics are defined, with or without the use of AI
techniques. Two other attempts to develop expert systems for map projection selection
have been reported, one by Smith and Snyder (1989) and one by Kessler (1991). The first
attempt has not been described in sufficient detail to review it, the second has never been
officially published. According to Snyder (1993, p. 276) MaPKBS, as well as the other two
attempts, have been aborted in the research stage because the principals became
involved in other projects.
21 Mekenkamp (1990) presents a very simple procedure for automated map projection
selection that is based on a set of no more than eleven projections, all belonging to the
conic group. For Mekenkamp the selection process consists of answering two
fundamental questions: (a) what is the shape of the region to be mapped?, and (b) what is
the purpose of the map? He distinguishes between one-point (round), two-point
(rectangular) and three-point (triangular) regions, leading to the choice of an azimuthal, a
cylindrical and a conical projection respectively. Mekenkamp only considers oblique
aspects, since these produce the least distortion for a given area. By letting the position of
the meta-pole move without any restriction the general location of the area (near the
pole, near the equator, at mid-latitude), which is one of the main criteria in Snyder’s
scheme, becomes irrelevant to the selection. This strongly simplifies the selection
process. Mekenkamp also considers a functional argument in deciding on the type of
region. If attention has to be focused on one point (e.g. the location of an airport) or if the
relation between two points is to be emphasised (e.g. the traffic flow between two cities),
then the region to be mapped will be designated as a one-point region or a two-point
region respectively, and the projection class will be chosen accordingly.
22 Next to the type of region the user must select the map property that best suits the
purpose of the map (conformal, equal-area, equidistant, straight great-circles,
orthographic view). Mekenkamp’s procedure is straightforward, it can be easily
implemented, and it always produces a unique solution, which is not so for the decision
model proposed by Snyder. Still the method has some important restrictions. First, it is
not always easy to characterise the shape of a region as round, rectangular or triangular,
especially not for large and/or fragmented areas (e.g. different landmasses). Second, the
restriction to conic type projections makes that Mekenkamp’s approach cannot be used
for global mapping purposes without introducing excessive distortion. Finally, since the
choice is restricted to oblique aspects of conic projections, the user is not allowed to
specify geometric properties that dictate the position of the meta-pole and/or the type of
projection, e.g. a straight central meridian, a straight equator, straight parallels... While
geometric properties are seldom mentioned in connection with map projection selection,
they prove to be very important criteria that are often applied in cartographic practice,
Advances in small-scale map projection research
Belgeo, 1-2-3-4 | 2000
11
although mostly the mapmaker is not conscious of the fact that he or she is actually
applying them (see Canters, 1999, pp. 225-228).
23 Canters and De Genst propose a semi-automated strategy that allows the mapmaker to
interactively change the geometry and the properties of the projection until a satisfying
solution is obtained (Canters, 1995; De Genst and Canters, 1996; Canters, 1999). In their
view the selection process consists of two parts (figure 4). In the first part of the selection
process map projection requirements are formulated, and a list of candidate projections
is defined. To reduce the complexity of the decision process the total number of map
projections from which a choice can be made is kept to a strict minimum. Projections
included in the selection procedure are chosen in such a way that each possible
combination of map projection properties that can be set, is satisfied by at least one
projection. This guarantees that, once properties have been stated, the list of candidate
projections will be limited to one or maximally a few projections. If the list contains more
than one projection, all candidate projections are ranked by applying a simple set of
decision rules. The projection that gets the highest score is selected. In the second part of
the process the parameters of the projection that are free to choose are optimised, using
an appropriate technique for error reduction. Once the optimised projection is obtained
the result is evaluated by the mapmaker, who ultimately decides if the projection is
accepted or not. A quick visualisation of the graticule, with isocols showing the
distribution of distortion, as well as a brief error report, is essential to allow the
mapmaker to perform this evaluation. If parameter optimisation does not produce the
expected result, the mapmaker can decide to apply a polynomial transformation to the
obtained graticule to achieve a further reduction of distortion (see also section on low-
error projections). If this does not lead to a major improvement the original map
projection requirements are re-defined and the process is resumed. It is clear that in this
approach map projection selection is seen as a dynamic process that can only be partly
automated and still requires a great deal of human intervention.
Advances in small-scale map projection research
Belgeo, 1-2-3-4 | 2000
12

Figure 4. Semi-automated map projection selection (Canters, 1999).
24 Typical for all approaches that have been presented is that the specification of map
projection features forms the entry to the selection process. This is not always an easy
task. In an ideal situation, a procedure for map projection selection should be able to
identify the required features automatically from the type of application, or at least assist
the mapmaker in selecting the appropriate features. Unfortunately, knowledge about the
relationship between map application and map projection properties is sparse and very
often inconsistent. On the other hand no detailed taxonomy of map applications (map
function, map use) is available that could serve as a reference for a systematic study of
map projection requirements. Hence the few selection strategies that have been proposed
so far leave all the responsibility to the user, who is supposed to identify those features
that he or she thinks are most relevant to the application. More research on the
relationship between map application and map projection properties, including the
integration of already existing knowledge, is highly needed in order to develop methods
that can assist the non-experienced user in choosing a projection that fits the purpose of
the map.
Conclusion
25 While the importance of map projection is widely recognised in large-scale mapping, its
meaning in small-scale map design is less well understood. Most literature about map
projection is restricted to a purely mathematical treatment of the subject. In the majority
of textbooks on map projection the selection and use of map projections is given little or
no consideration. Even skilled cartographers often have limited notion of the role the
projection plays in map design and communication, and do not consider it as important
Advances in small-scale map projection research
Belgeo, 1-2-3-4 | 2000
13

as the other elements in map design. With this knowledge it should not surprise the
reader that one regularly comes across examples of non-appropriate use of map
projections in print journalism, in the electronic media, and even in scientific
publications. Present-day map projection software, with its virtually unlimited
possibilities for the selection and modification of map projections, merely increases the
risk of making improper decisions, especially if handled by people that lack a basic
understanding of map projections.
26 This paper discusses part of the work that has been carried out over the last forty years in
three important areas of small-scale map projection research: (a) evaluation of map
projection distortion, (b) development of low-error map projections, (c) automated (and
semi-automated) map projection selection. The first part of the paper concentrates on the
problems associated with the measurement of map projection distortion. Different
approaches for characterising map projection distortion at the local scale, and at the
finite scale, are reviewed and criticised. The second part focuses on the different methods
that have been proposed for the development of low-error map projections. Special
attention is paid to polynomial transformation methods, which allow the mapmaker to
derive low-error graticules from standard map projections without loss of the properties
of the latter. The last part of the paper deals with the selection of map projections, and
reviews recent work on the development of methods that assist the mapmaker in
choosing a projection that optimally fits the purpose of the map.
27 More efforts should be made to assure that cartographic practice benefits more from the
achievements of modern map projection research. Today it is still true to say that there is
a wide gap between theoretical research on map projections, which is seldom promoted
beyond scientific publication, and map projection use, which far too often relies on the
application of simple rules-of-thumb. Most of the topics that have been discussed in this
paper have direct implications for everyday map projection use. By embedding
techniques for the measurement of map projection distortion and for map projection
optimisation in practical tools for map projection selection, the objectivity of the
selection process will be increased. This will certainly lead to a more creative and well-
considered use of map projections. It is therefore hoped that future developers of map
projection tools will include techniques for distortion assessment and for map projection
optimisation in their products, and will offer the mapmaker at least some elementary
assistance in making a proper map projection choice.
BIBLIOGRAPHY
AIRY G.B. (1861), ‘Explanation of a projection by balance of errors for maps applying to a very
large extent of the earth’s surface, and comparison of this projection with other projections’,
London, Edinburgh and Dublin, Philosophical Magazine, 4th ser., 22 (149), pp. 409-421.
ALBINUS H.-J. (1981), ‘Anmerkungen und Kritik zur Entfernungsverzerrung’, Kartographische
Nachrichten, 31 (5), pp. 179-183.
Advances in small-scale map projection research
Belgeo, 1-2-3-4 | 2000
14
ACA (1989), ‘The case against rectangular world maps’, Cartographic Journal, 26, pp. 156-157.
ACA (ed.) (1991), Matching the map projection to the need, Bethesda, Maryland, American Congress
on Surveying and Mapping.
BEHRMANN W. (1909), ‘Zur Kritik der flächentreuen Projektionen der ganzen Erde und einer
Halbkugel’, Sitzungs-berichte der Königlich Bayerischen Akademie der Wissenschaften, Mathe-
matisch-physikalische Klasse, 13, pp. 19-48, München.
BLUDAU A. (1891), ‘Die flächentreue transversale Kegel-Projektion für die Karte von Afrika’,
Zeitschrift der Gesellschaft für Erdkunde, 26 (2), pp. 145-158, Berlin.
BUGAYEVSKIY L.M. and SNYDER J.P. (1995), Map projections, A reference manual, London, Taylor &
Francis.
CANTERS F. (1989), ‘New projections for world maps, a quantitative-perceptive approach’,
Cartographica, 26 (2), pp. 53-71.
CANTERS F. (1991), ‘Map projection in a GIS environment’, in RYBACZUK K. and BLAKEMORE M.
(eds.), Mapping the nations, Proceedings of the 15th Conference of the International Cartographic
Association, Bournemouth, 23 September - 1 October, vol. 2, pp. 595-604.
CANTERS F. (1992), The transformation of positional data for GIS applications, Proceedings of the Third
European Conference and Exhibition on Geographical Information Systems, Munich, Germany,
March 23-26, pp. 732-741.
CANTERS F. (1995), ‘A dynamic procedure for the selection of an appropriate GIS projection
framework’, in Space Scientific Research in Belgium, vol. III, Earth Observation, part 2, pp. 77-90,
Brussels, Federal Office for Scientific, Technical and Cultural Affairs.
CANTERS F. (1999), Semi-automated map projection design, New ways to facilitate and improve small-
scale map projection selection, Doctoral dissertation, Faculty of Sciences, Vrije Universiteit Brussel.
CANTERS F. and DECLEIR H. (1989), The world in perspective, A directory of world map projections,
Chichester, John Wiley & Sons.
CANTERS F. and DE GENST W. (1997), Development of a low-error equal-area map projection for the
European Union, Proceedings of the 18th ICA/ACI International Cartographic Conference,
Stockholm, Sweden, 23-27 June, pp. 775-782.
CHEBYSHEV P.L. (1856), ‘Sur la construction des cartes géographiques’, Bulletin de l’Académie
Impériale des Sciences, Classe Physico-Mathématique, 14, pp. 257-261, St. Petersburg.
DE GENST, W. and CANTERS F. (1996), ‘Development and implementation of a procedure for
automated map projection selection’, Cartography and Geographic Information Systems, 23 (3),
pp. 145-171.
DOYTSHER Y. and SHMUTTER B. (1981), ‘Transformation of conformal projections for graphical
purposes’, The Canadian Surveyor, 35 (4), pp. 395-404.
DRIENCOURT L. and LABORDE J. (1932), Traité des projections des cartes géographiques à l’usage des
carto-graphes et des géodésiens, 4 fascicules, Paris, Hermann et Cie.
FISHER I. and MILLER O.M. (1944), World maps and globes, New York, Essential Books.
FRANCULA N. (1971), Die vorteilhaftesten Abbildungen in der Atlas-kartographie, Dipl. Ing.
Dissertation, Bonn, Institut für Kartographie und Topographie.
GILBERT E.N. (1974), ‘Distortion in maps’, Society for Industrial and Applied Mathematics Review, 16
(1), 47-62.
Advances in small-scale map projection research
Belgeo, 1-2-3-4 | 2000
15

GILMARTIN P. (1985), ‘The design of journalistic maps: purposes, parameters and prospects’,
Cartographica, 22 (4), 1-18.
GONZALEZ-LOPEZ S. (1997), Map projections optimization using real-coded genetic algorithms,
Proceedings of the 18th ICA/ACI International Cartographic Conference, Stockholm, Sweden,
23-27 June, pp. 982-988.
GRAVE D.A. (1896), ‘Sur la construction des cartes géographiques’, Journal de Mathématiques Pures
et Appliquées, séries 5, 2, pp. 317-361.
JANKOWSKI P. and NYERGES T.L. (1989), ‘Design considerations for MaPKBS-map projection
knowledge-based system’, American Cartographer, 16 (2), pp. 85-95.
JORDAN W. (1896), ‘Der mittlere Verzer-rungsfehler’, Zeitschrift für Vermessungs-wesen, 25,
pp. 249-252.
KALTSIKIS C J. (1989), ‘Numerical treatment of conformal map projections’, The Cartographic
Journal, 26 (1), pp. 22-23.
KAVRAYSKIY V.V. (1934), Matema-ticheskaya kartografiya, Moscow-Leningrad.
KAVRAYSKIY V.V. (1958), Izbrannyye trudy, vol. II: Matematicheskaja kartografija, part 1: Obscaja
teorija kartograficheskih projekcij, Izdaniye Nachal’nika Upraveleniya, Gidrograficheskoy Sluzhby
Voyenno-morskoy Akademii.
KESSLER F.C. (1991), The development and implementation of MaPPS, An expert system designed to assist
in the selection of a suitable map projection, M.A. thesis, Geography Department, Penn State
University, State College, Pa.
LABORDE J. (1928), ‘La nouvelle projection du Service Géographique de Madagascar’, Cahiers du
Service Géographi-que de Madagascar, 1, Tananarive.
LASKOWSKI P. (1991), ‘On a mixed local-global error measure for a minimum distortion
projection’, Technical Papers, 2, pp. 181-186, American Congress on Surveying and Mapping.
LASKOWSKI P. (1998), ‘The distortion spectrum’, Cartographica, 34 (3), monograph 50.
LEE L.P. (1974), ‘A conformal projection for the map of the Pacific’, New Zealand Geographer, 30 (1),
pp. 75-77.
MEKENKAMP P.G.M. (1990), The need for projection parameters in a GIS environment, Proceedings of
the First European Conference on Geographical Information Systems, Amsterdam, The
Netherlands, April 10-13, pp. 762-769.
MILLER O.M. (1953), ‘A new conformal projection for Europe and Asia’ [sic; should read Africa],
Geographical Review, 43 (3), pp. 405-409.
MILLER O.M. (1955), Specifications for a projection system for mapping continuously Africa, Europe, Asia,
and Australasia on a scale of 1:5,000,000. Contract report to Army Map Service, May 1955, New York,
American Geographical Society.
MONMONIER M. (1989), Maps with the news, The development of American journalistic cartography,
Chicago and London, The University of Chicago Press.
NYERGES T.L. and JANKOWSKI P. (1989), ‘A knowledge base for map projection selection’,
American Cartographer, 16 (1), pp. 29-38.
PETERS A.B. (1975), ‘Wie man unsere Weltkarten der Erde ähnlicher machen kann’,
Kartographische Nachrichten, 25 (5), pp. 173-183.
Advances in small-scale map projection research
Belgeo, 1-2-3-4 | 2000
16

PETERS A.B. (1978), ‘Über Weltkarten-verzerrungen und Weltkartenmittel-punkte’,
Kartographische Nachrichten, 28 (3), pp. 106-113.
REILLY W.I. (1973), ‘A conformal mapping projection with minimum scale error’, Survey Review, 22
(168), pp. 57-71.
SMITH D.G. and SNYDER J.P. (1989), ‘Expert map projection selection system’, U.S. Geological
Survey Yearbook, Fiscal Year 1988, pp. 14-15.
SNYDER J.P. (1978), ‘Equidistant conic map projections’, Annals of the Association of American
Geographers, 68 (3), pp. 373-383.
SNYDER J.P. (1984), ‘A low-error conformal map projection for the 50 States’, American
Cartographer, 11 (1), pp. 27-39 [see correction in Snyder, 1987, 207].
SNYDER J.P. (1985), ‘Computer-assisted map projection research’, U.S. Geological Survey Bulletin
1629, Washington, United States Government Printing Office.
SNYDER J.P. (1986), A new low-error map projection for Alaska, Technical Papers, American Society for
Photogrammetry and Remote Sensing, American Congress on Surveying and Mapping, Fall
Convention, Anchorage, Alaska, pp. 307-314.
SNYDER J.P. (1987), ‘Map projections: a working manual’, U.S. Geological Survey Professional Paper
1395, Washington, United States Government Printing Office.
SNYDER J.P. (1988), ‘New equal-area map projections for non-circular regions’, American
Cartographer, 15 (4), pp. 341-355.
SNYDER J.P. (1993), Flattening the earth, Two thousand years of map projections, Chicago, The
University of Chicago Press.
SNYDER J.P. and VOXLAND P.M. (1988), ‘An album of map projections’, U.S. Geological Survey
Professional Paper 1453, Washington, United States Government Printing Office.
SPRINSKY W.H. and SNYDER J.P. (1986), ‘The Miller oblated stereographic projection for Africa,
Europe, Asia and Australasia’, American Cartographer, 13 (3), pp. 253-261.
TISSOT N.A. (1881), Mémoire sur la représentation des surfaces et les projections des cartes
géographiques, Paris, Gauthier Villars.
TOBLER W.R. (1964), ‘Geographical coordinate computations, Part II, Finite map projection
distortions’, Technical Report no. 3, ONR Task no. 389-137, University of Michigan, Department of
Geography, Ann Arbor, Michigan.
TOBLER W.R. (1974), ‘Local map projections’, American Cartographer, 1 (1), pp. 51-62.
TOBLER W.R. (1977), ‘Numerical approaches to map projections’, in KRETSCHMER I. (ed.), Beiträge
zur theoretischen Kartographie, pp. 51-64, Vienna, Franz Deuticke.
TSINGER N.Y. (1916), ‘O naivygod-neyskikh vidakh konicheskikh proyetsiy’, Izvestiya, ser. 6, 10 (17),
1693, St. Petersburg, Akademiya Nauk.
WAGNER K. (1962), Kartographische Netzentwürfe, 2nd edition, Mannheim, Bibliographisches
Institut.
WU Z. and YANG Q. (1981), ‘A research on the transformation of map projections in computer-
aided cartography’, Acta Geodetica et Cartographica Sinica, 10 (1), pp. 20-44 [Chinese with English
abstract].
YOUNG A.E. (1920), Some investigations in the theory of map projections, Royal Geographical Society,
Technical Series 1, London.
Advances in small-scale map projection research
Belgeo, 1-2-3-4 | 2000
17

ABSTRACTS
The main objective of this paper is to review previous and current trends in small-scale map
projection research, and to discuss the work that has been done by this author in relation to
similar work by others. Attention is focused on three issues: (a) evaluation of map projection
distortion, (b) development of low-error map projections, (c) automated (and semi-automated)
map projection selection. It is hoped that this paper will give the reader a good impression of the
marked evolution of map projection science over the last forty years, of changes in the way map
projections are used (or will be used in the near future), and of the important role the rapidly
increasing, widespread use of computers has played in this process.
Dit artikel geeft een overzicht van vroeger en recent onderzoek rond kaartprojecties in de
kleinschalige cartografie, en situeert het werk van de auteur binnen het geheel aan onderzoek
dat binnen dit domein plaatsvindt. De aandacht is toegespitst op drie thema’s : (a) evaluatie van
vervorming op kaartprojecties, (b) ontwikkeling van nieuwe projecties met een geringe
vervorming, (c) geautomatiseerde (en semi-geautomatiseerde) methoden voor het selecteren van
kaartprojecties. Hopelijk geeft dit artikel de lezer een goed beeld van de markante evolutie die
het onderzoek rond kaartprojecties in de laatste veertig jaar heeft doorgemaakt, van
veranderingen in de wijze waarop kaartprojecties gebruikt, of in de toekomst gebruikt zullen
worden, en van de belangrijke rol die het snel toegenomen gebruik van computers in deze
evolutie gespeeld heeft.
INDEX
Keywords: map projection research, distortion measures, low-error map projections, map
projection selection
motsclesnl onderzoek rond kaartprojecties, vervormingsmaten, projecties met een geringe
vervorming, selectie van kaartprojecties
AUTHOR
FRANK CANTERS
Centre for Cartography and GIS, Department of Geography, Vrije Universiteit Brussel, Pleinlaan 2
- B 1050 Brussel, Belgium, [email protected]
Advances in small-scale map projection research
Belgeo, 1-2-3-4 | 2000
18