advances in understanding the molecular composition of
TRANSCRIPT

Old Dominion UniversityODU Digital Commons
Chemistry & Biochemistry Theses & Dissertations Chemistry & Biochemistry
Winter 2014
Advances in Understanding the MolecularComposition of Dissolved Organic Matter and ItsReactivity in the EnvironmentRajaa MesfiouiOld Dominion University
Follow this and additional works at: https://digitalcommons.odu.edu/chemistry_etds
Part of the Environmental Chemistry Commons, and the Environmental Sciences Commons
This Dissertation is brought to you for free and open access by the Chemistry & Biochemistry at ODU Digital Commons. It has been accepted forinclusion in Chemistry & Biochemistry Theses & Dissertations by an authorized administrator of ODU Digital Commons. For more information,please contact [email protected].
Recommended CitationMesfioui, Rajaa. "Advances in Understanding the Molecular Composition of Dissolved Organic Matter and Its Reactivity in theEnvironment" (2014). Doctor of Philosophy (PhD), dissertation, Chemistry and Biochemistry, Old Dominion University, DOI:10.25777/mjmj-c689https://digitalcommons.odu.edu/chemistry_etds/38
ADVANCES IN UNDERSTANDING THE MOLECULAR COMPOSITION OF
DISSOLVED ORGANIC MATTER AND ITS REACTIVITY IN THE
M.S. May 2008, Old Dominion University
A Dissertation Submitted to the Faculty of Old Dominion University in Partial Fulfillment o f the
Requirements for the Degree of
DOCTOR OF PHILOSOPHY
CHEMISTRY
OLD DOMINION UNIVERSITY December 2014
ENVIRONMENT
by
Rajaa Mesfioui
.pproved by:
Patrick G Hatcher (Director)
Margaret R. Mulholland (Member)
James Lee (Member)

ABSTRACT
ADVANCES IN UNDERSTANDING THE MOLECULAR COMPOSITION OF DISSOLVED ORGANIC MATTER AND ITS REACTIVITY IN THE
ENVIRONMENT
Rajaa Mesfioui Old Dominion University, 2014 Director: Dr. Patrick G. Hatcher
Dissolved organic matter (DOM) is the ultimate product o f Earth’s systems
dynamics. DOM chemical signature is strongly shaped by the interaction among Earth’s
spheres, such as the atmosphere, the geosphere, the biosphere, and the hydrosphere, but
also life and human activity. DOM source, composition, photochemical alteration and
availability affect freshwater ecosystems, their carbon and nitrogen fluxes and, thus, the
global carbon and nitrogen cycles. The aim o f this thesis was to gain an understanding of
the molecular composition o f DOM and its photochemical and biological reactivity in an
environment impacted by anthropogenic disturbance. The York and James River systems
within the Cheasapeake Bay watershed provided an excellent study site for such studies.
The experiments included monitoring the alteration o f DOM and its subcomponents
dissolved organic nitrogen (DON) and carbon (DOC) from both natural and
anthropogenic sources during photochemical and biological processes. My combined
analytical and statistical approach identified the molecular signature o f the photolabile
and the photoproduced DOM and the biolabile and the bioproduced DOM during these
processes.
My approach depicted differences in DON assimilation by the York River biota
depending on the DOM source, where anthropogenic DON showed more bioavailability
than naturally derived DON. Furthermore, anthropogenically-derived DON showed an

intense bioavailability in the freshwater end member o f the James River, VA. These
findings suggest that anthropogenic DON is highly reactive in the natural environment
and that simple assays examining net consumption or production o f bulk DON pools are
inadequate for assessing its bioavailability.
The studied photochemical alterations of natural and anthropogenic DOM
induced production o f newly dissolved organic nitrogen (DON) even from natural
sources that are relatively N-poor. My experimental results demonstrated that
photochemistry transforms DON from complex structural entities to ammonia, aliphatic
molecules, and low carbon number molecules that might enhance microbial metabolism,
and eventually increases CO2 emissions and reduces DOM concentrations in stream
ecosystems.

This dissertation is dedicated to my amazing husband Aziz Matar for his encouragement and endless support.

ACKNOWLEDGMENTS
I would like to acknowledge colleagues, family and friends for their unconditional
support throughout my graduate career. My deepest gratitude is to my advisor Dr.
Patrick G. Hatcher for his optimism, enthusiasm, and faith in my ability to complete the
program. I have been amazingly fortunate to have such an advisor who gave me the
freedom to explore at large my capabilities, and to guide me to the right path whenever it
is needed. His patience and support helped me overcome many hurdles and finish this
dissertation. His mentoring, support, and understanding o f the different background and
personalities among our research group is the driving force for our groups’ harmony and
friendship that will last beyond this program.
I also appreciate the support o f my other committee members, Dr. Margaret R.
Mulholland’s insightful comments and constructive criticisms at different stages of my
research were very appreciated and they helped me focus my ideas, I am indebted to her
and to Dr. Kenneth Mopper for giving me full access to their Lab and for their continuous
encouragement and guidance. I would like to thank to Dr. James Lee for his constructive
criticisms and insightful discussions.
I must thank the current and former members of the Hatcher research group for
their friendship and support. I extend my special thanks to Dr. Hussain A. Abdulla for
his advise and wisdom in sciences and life matters.
I am also grateful to the following former or current staff at Old Dominion
University, for their various forms o f support during my graduate study—Dr. Rachel
Sleighter, Dr. Aron Stubbins, and Dr. Zhanfei Liu.

I also thank Susan Hatcher and Jarod Collard at the COSMIC (College of
Sciences Major Instrumentation Cluster) facility for their assistance with the FTICR-MS
analyses.
My friends have helped me stay focus through these difficult years. Their
friendship and support have helped me overcome setbacks and stay focused throughout
my graduate career. I greatly value their friendship and their belief in me. I am also
grateful to all my Moroccan friends that helped me adjust to a new country.
Most importantly, I would like to thank my family for their love, concern, support
and patience throughout this endeavor. I would like to express my heart-felt gratitude to
my husband Aziz Matar, none of this would have been possible without his love and
patience.
Finally, I appreciate the financial support from NSF (Grant No.0756475) and
NOAA (award No.NA12NOS4200081) that funded parts of the research discussed in this
dissertation.

TABLE OF CONTENTS
Page
LIST OF TABLES....................................................................................................................... ix
LIST OF FIGURES...................................................................................................................... x
Chapter
I. INTRODUCTION...............................................................................................1
II. REACTIVITY AND CHEMICAL CHARACTERIZATION OF EFFLUENT ORGANIC NITROGEN FROM WASTEWATER TREATMENT PLANTS DETERMINED BY FOURIER TRANSFORM ION CYCLOTRON RESONANCE MASS SPECTROMETRY 11
INTRODUCTION....................................................................................... 11EXPERIMENTAL PLAN...........................................................................14RESULTS AND DISCUSSION................................................................21CONCLUSIONS..........................................................................................38
III. PHOTOCHEMICAL ALTERATIONS OF NATURAL AND ANTHROPOGENIC DISSOLVED ORGANIC NITROGEN IN THE YORK RIVER.................................................................................................. 40
INTRODUCTION...................................................................................... 40EXPERIMENTAL PLAN.......................................................................... 43RESULTS AND DISCUSSION................................................................51
IV. THE BIOAVAILABILITY AND REACTIVITY OF DISSOLVED ORGANIC MATTER DERIVED FROM DIFFERENT SOURCES IN THE YORK RIVER, CHESAPEAKE BAY.................................................76
INTRODUCTION.......................................................................................76EXPERIMENTAL PLAN...........................................................................78RESULTS AND DISCUSSION................................................................89CONCLUSIONS........................................................................................ I l l
V. CONCLUSIONS AND FUTURE W ORK..................................................113CONCLUSIONS........................................................................................ 113FUTURE DIRECTIONS..........................................................................117
REFERENCES..........................................................................................................................119
APPENDICES...........................................................................................................................141A. COPYRIGHT PERMISSION........................................................................141B. ABBREVIATIONS AND ACRONYMS USED........................................142C. ESI-FTICR-MS PRINCIPLE AND DATA ANALYSES.........................146
VITA........................................................................................................................................... 152
LIST OF TABLES
Table Page
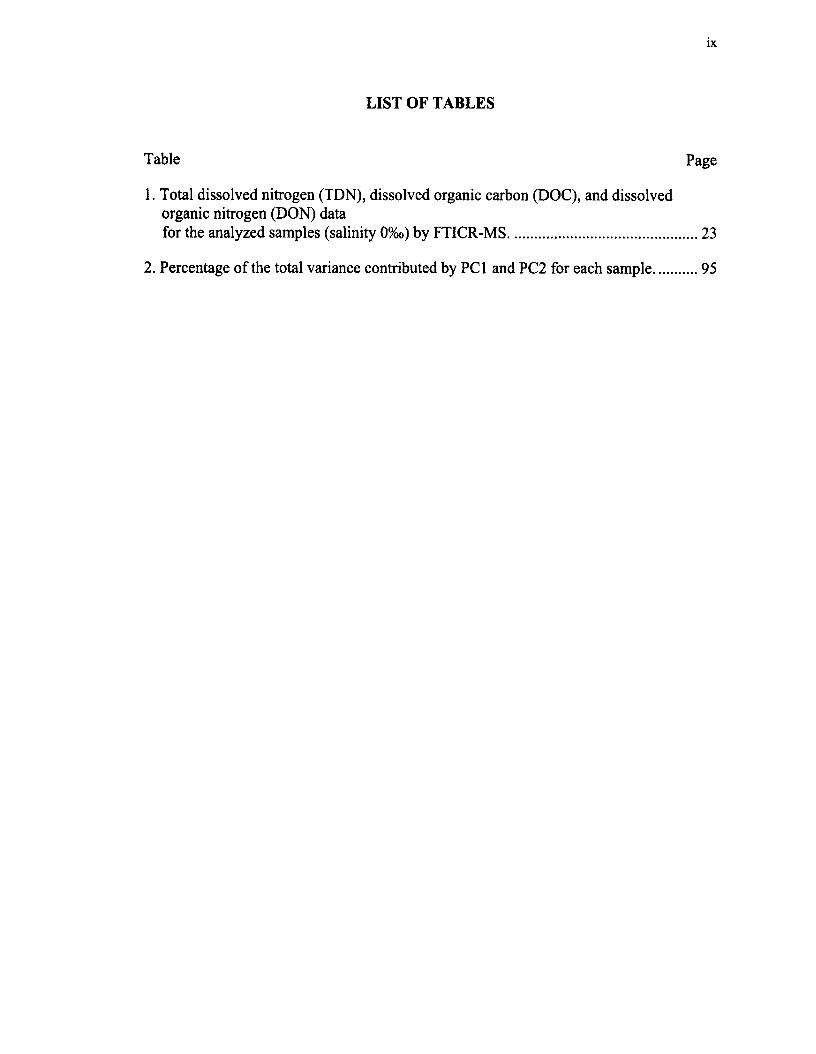
1. Total dissolved nitrogen (TDN), dissolved organic carbon (DOC), and dissolved organic nitrogen (DON) datafor the analyzed samples (salinity 0%o) by FTICR-MS.....................................................23
2. Percentage o f the total variance contributed by PCI and PC2 for each sample.............95

LIST OF FIGURES
Figure Page
1. Comparison o f (a) James River natural water, (b) EON5, and (c) EON4 reconstructed FTICR broadband mass spectra................................................................... 22
2. Comparison o f James River natural water, EON5, and EON4 compositions.................24
3. Reactivity o f the incubated EON5........................................................................................ 26
4. Three-dimensional van Krevelen diagrams of the incubated EON4 and EON5............28
5. van Krevelen diagrams o f the incubated EON5..................................................................30
6 . Chemical characterization o f the incubated EON5............................................................ 32
7. Reactivity o f the incubated EON4........................................................................................ 34
8 . VK diagrams o f the incubated EON4...................................................................................35
9. Chemical characterization o f the EON4.............................................................................. 37
10. The trends o f decreasing (a) specific UV absorbance (SUVA254), (c) magnitude averaged aromatic content, (d) magnitude averaged molecular weight,and increasing (b) slope ratio (Sr) with increasing irradiation time................................52
11. Total dissolved organic carbon concentrations (a) and total dissolvednitrogen (b) versus irradiation time for SHM, WP, and KW samples...........................54
12. Ammonia release versus irradiation time for WP, SHM, and KW samples.................55
13. Ammonia, NOx, and DON concentrations versus time for WP effluent...................... 56
14. van Krevelen diagrams of WP, SHM, and KW, color coded to highlightthe formulas aligning in the regions o f the major biomolecular classes o f DOM 59
15. Magnitude-weighted (a) carbon number, (b) DBE, (c) N/C, and (d) O/Cvalues for WP, SHM, and KW samples with irradiation time........................................60
16. PCA results using the relative magnitudes o f all WP-CHO formulas showing the biplot of the sample scores (a) and variable loadings (b), along with the van Krevelen diagrams of the CHO formulas includedin the colored boxed areas (c-e).......................................................................................... 62
17. PCA results using the relative magnitudes o f all SHM-CHO formulas showing the biplot o f the sample scores (a) and variable loadings (b),
xi
along with the van Krevelen diagrams of the CHO formulas includedin the colored boxed areas (c-e).......................................................................................... 63
18. PCA results using the relative magnitudes o f all KW-CHO formulas showing the biplot of the sample scores (a) and variable loadings (b), along with the van Krevelen diagrams of the CHO formulas includedin the colored boxed areas (c-e)..........................................................................................64
19. Bar diagrams showing the percent contribution of CRAM/lignin-like formulas (a), aromatic formulas (b), aliphatic formulas (c)and tannin formulas (d) in the 3 selected colored areas of the PCA biplotsshown in Figures 16-18 for the WP, KW, and SHM....................................................... 6 6
20. PCA results using the relative magnitudes of all WP N-containing formulas showing the biplot o f the sample scores (a) and variable loadings (b), along with the van Krevelen diagrams o f the N-containing formulasincluded in the colored boxed areas (c-e)..........................................................................67
21. PCA results using the relative magnitudes of all SHM N-containing formulas showing the biplot o f the sample scores (a) and variable loadings (b), along with the van Krevelen diagrams o f the N-containing formulasincluded in the colored boxed areas (c-e).......................................................................... 6 8
22. PCA results using the relative magnitudes of all KW N-containing formulas showing the biplot o f the sample scores (a) and variable loadings (b), along with the van Krevelen diagrams o f the N-containing formulasincluded in the colored boxed areas (c-e)......................................................................... 69
23. The H/C vs. H/C synchronous plots generated by applying 2D correlation on the a) SHM CHO formulas, b) WP CHO formulas, c) SHMN-containing formulas, and d) WP N-containing formulas ..................................... 71
24. The carbon number vs. carbon number synchronous plots generated by applying 2D correlation on the a) SHM CHO formulas,b) WP CHO formulas, c) SHM N-containing formulas,and d) WP N-containing formulas......................................................................................74
25. van Krevelen diagrams of Ctrl-S2, Ctrl-S3, TC, SHM, and YT,color coded to highlight the formulas aligning in the regions o f the major biomolecular classes of DOM............................................................................................. 87
26. a) Chla, b) NOx, and c) NH4 concentrations in controlsand treatment incubations with TC, SHM, and YT amendmentsin S3 bioassays (salinity 12.5%o) over time.......................................................................90
27. a) Chla, b) NOx, and c) NH4 concentrations in controls

and treatment incubations with TC, SHM, and YT amendmentsin S2 bioassays (salinity 5%o) over time............................................................................ 92
28. Total dissolved organic carbon (DOC) and dissolved organic nitrogen (DON) concentrations averaged for each time pointfor the control and each amended sample for S2 (a-b) and S3 (c-d) salinities 92
29. PCA results using the relative magnitudes o f all Ctrl-S2 CHOformulas showing the biplot of the sample scores (a) and variable loadings (b), along with the van Krevelen diagrams of the CHO formulasincluded in the colored boxed areas (c-e).......................................................................... 96
30. PCA results using the relative magnitudes o f all TC-S2 CHOformulas showing the biplot of the sample scores (a) and variable loadings (b), along with the van Krevelen diagrams of the CHO formulasincluded in the colored boxed areas (c-e).......................................................................... 97
31. PCA results using the relative magnitudes o f all SHM-S2 CHOformulas showing the biplot of the sample scores (a) and variable loadings (b), along with the van Krevelen diagrams of the CHO formulasincluded in the colored boxed areas (c-e).......................................................................... 98
32. PCA results using the relative magnitudes o f all YT-S2 CHOformulas showing the biplot of the sample scores (a) and variable loadings (b), along with the van Krevelen diagrams o f the CHO formulasincluded in the colored boxed areas (c-e).......................................................................... 99
33. PCA results using the relative magnitudes o f all Ctrl-S3 CHOformulas showing the biplot of the sample scores (a) and variable loadings (b), alongwith the van Krevelen diagrams o f the CHO formulasincluded in the colored boxed areas (c-e)........................................................... 100
34. PCA results using the relative magnitudes o f all TC-S3 CHOformulas showing the biplot of the sample scores (a) and variable loadings (b), along with the van Krevelen diagrams o f the CHO formulasincluded in the colored boxed areas (c-e)........................................................................ 101
35. PCA results using the relative magnitudes of all SHM-S3 CHOformulas showing the biplot of the sample scores (a) and variable loadings (b), along with the van Krevelen diagrams of the CHOformulas included in the colored boxed areas (c-e)........................................................102
36. PCA results using the relative magnitudes o f all YT-S3 CHOformulas showing the biplot of the sample scores (a) and variable loadings (b), along with the van Krevelen diagrams of the CHOformulas included in the colored boxed areas (c-e)........................................................103

xiii
37. Bar diagrams showing the percent contribution o f aliphatic formulas (a, c) and aromatic formulas (b, d) in the 3 selected colored areas o f the PCA biplots shownin figures 29-36 for the controls and amended samplesat both salinities (S2 and S3)............................................................................................. 106
38. The H/C vs. H/C synchronous plots generated by applying 2D correlation on the N-containing formulas o f a) Ctrl-S2, b) TC-S2,c) SHM-S2, and d) YT-S2................................................................................................. 108
39. The H/C vs. H/C synchronous plots generated by applying 2D correlation on the N-containing formulas o f a) Ctrl-S3, b) TC-S3,c) SHM-S3, and d) YT-S3............................................................................................... I l l
40. Cyclotron motion o f ions in a magnetic field. Fz (centrifugal force),FL (Lorentz force), B (magnetic field), vxy (ion velocity), r = orbital radius 147
41. Method to determine full width at half maximum Am50%............................................ 148
42. van Krevelen diagram of EON5 sample.......................................................................... 151

1
CHAPTER I
INTRODUCTION
Over the past century, human activity has dramatically changed the global
nutrient cycles, resulting in detrimental effects on human health and the Earth’s dynamics
(Rockstrom and Karlberg, 2010). In particular, the Carbon (C), Nitrogen (N), and
Phosphorus (P) biogeochemical cycles have been altered significantly due to nutrient
overload in a variety o f marine, freshwater, terrestrial, and atmospheric ecosystems
(Canfield et al., 2010; Dolman et al., 2010; Howarth et al., 2011; Lerman et al., 2004;
Vitousek et al., 1997). The sources o f this nutrient over-enrichment include, but are not
limited to, fossil fuel emissions, exhaustive land use, excessive use o f chemical
fertilizers, and the increasing discharge o f municipal sewage associated with widespread
urbanization (Canadell et al., 2007).
While land use practices and fossil fuel emissions constitute the main
perturbations to the C cycle (Morel et al., 2009), poor management o f agricultural
activities, in particular, and land use, in general, represent the main perturbations to both
N and P cycles (Han et al., 2011; Howarth et al., 1995; Schlesinger, 2009). Moreover,
improper practices of land use are increasingly facilitating organic C, N, and P discharge
from soil and sediments to aquatic systems (Van Kessel et al., 2009; Zhang et al., 2011),
especially to the oceanic coastal zone where most of the oceanic biological primary
production (PP) takes place (Chavez et al., 2011). As the interface between land and
ocean, the oceanic coastal zone plays a key role in mediating C, N, and P dynamics.
However, by being the downstream recipient o f improper land use, this role has been
greatly jeopardized, resulting in a shift from a balanced, productive ecosystem into an

2
impaired and degraded ecosystem (Burak, 2004; Howarth, 2008). In fact, 60% of US
estuaries have been reported degraded or impaired due to nutrient overload, which leads
to hypoxia, anoxia, harmful algae blooms, and resulting losses o f ecological biodiversity
(Dodds et al., 2008; Howarth, 2008).
Given the pressing need for mitigating and predicting human impact on Earth
dynamics, it is of critical importance to intensify research on the coupling between C, N,
and P cycles in the different environmental reservoirs, and especially, in the oceanic
coastal zone that represents the fringe between these different ecosystems and constitutes
the primary sink of the global organic C production (Chen and Borges, 2009; Mackenzie
et al., 1998). Dissolved organic matter (DOM) and its measured surrogates, dissolved
organic carbon (DOC), and dissolved organic nitrogen (DON), form the main links
between the C and N cycles. DOM plays a critical role in supplying labile organic
carbon (Hedges et al., 1997; Wetzel, 1992) and nitrogen (Wiegner et al., 2006) to
microbial communities in coastal areas. Recent evidence suggests that terrigenous DOM
is utilized within streams and rivers, as well as within estuaries and coastal waters, on
timescales comparable to water transport and mixing (Benner et al., 1995). This evidence
is supported by budgets showing that the amount o f carbon delivered to the oceans from
rivers is actually only a small portion of the amount of carbon entering rivers from the
terrestrial environment (Aufdenkampe et al., 2011). Indeed, rivers and estuaries are the
highest emitters o f CO2 per unit area (Cole et al., 2001), indicative o f the high rates of
respiration and processing of terrigenous DOM within them. Once exported from
watersheds, DOM components may be recycled by bacteria and respired or incorporated
into microbial and higher organism food webs (Dagg et al., 2008; Del Giorgio and Pace,

3
2008; Nakagawa et al., 2007) serving as C, N, and P sources. Alternatively, DOM may
either be altered by abiotic processes such as photochemical transformation (Amon and
Benner, 1996; Asmala et al., 2013; Bertilsson et al., 1999), flocculation (Chen et al.,
2014), and sorption (Shank et al., 2005) before its residual and most refractory portion is
discharged into the oceans (Hedges et al., 1997). Moreover, the lability o f DOC and
DON has been shown recently to vary largely according to the biochemical composition
and source of their constituent DOM (Benner, 2003; Lu et al., 2013; Wiegner et al.,
2006).
Land use practices are starting to influence the quantity, and the quality, o f the
DOM discharged into rivers and streams, and ultimately its fate and dynamics in aquatic
systems (Aufdenkampe et al., 2011; Kaushal et al., 2014). These changes are predicted
to lead to alterations in DOM processing and metabolism in aquatic systems, o f which
photochemical and microbial transformations are two essential components. In fact, an
increase in microbial activity is being observed in human impacted watersheds relative to
those with less anthropogenic input (Hosen et al., 2014; Rabalais et al., 2002; Williams et
al., 2010; Wilson and Xenopoulos, 2013). Therefore, understanding the transformation
and utilization o f DOC and DON in aquatic ecosystems by natural biota and abiotic
phenomena is a crucial step in deciphering the interrelationships between C and N cycles
and source materials, and ultimately gaining a better understanding for processes
associated with downstream eutrophication.
While the lability o f dissolved inorganic N (DIN, e.g., NH4 and NOx) and its role
as a pollution indicator are well established (Galloway et al., 2008; Howarth and Marino,
2006), the role o f anthropogenic DON has regularly been overlooked by the scientific

4
community (Bronk et al., 2007). The view that DON in marine environments forms a
persistently stable pool of N, compared to the constantly depleted DIN pool, is
responsible for the traditional belief that DON is mostly bio-refractory, cannot be taken
up by phytoplankton, and hence does not contribute to eutrophication. While
anthropogenic DIN (e.g., NOJ) export from disturbed watersheds to the oceans has been
the focus of widespread international research, DON pollution has received less attention.
Lately, however, Pellerin et al. (2006) compiled N data for 348 disturbed watersheds,
reporting that DON represents, on average, 49% of TDN concentrations in mixed
watersheds and that DON concentrations are, on average, 2.5-4 times higher in surface
waters from disturbed watersheds than in forested watersheds, suggesting that DON
concentrations are highly influenced by N loads in human impacted catchments.
Therefore, the dominant form of N in human-impacted watersheds has been overlooked
as a potential source o f bioavailable N and its reactivity has been neglected for almost a
century.
Recently, the preconceived view that DON is bio-refractory has been challenged
in the literature with emerging evidence for its bioavailability and its role in fueling
primary production(Bronk et al., 2007; Mulholland and Lomas, 2008a; Seitzinger et al.,
2002). While these studies have shed some light on the importance o f DON in both C
and N cycles, they lacked the ability to investigate its structural complexity in order to
draw a conclusive picture on the dynamics o f natural and anthropogenic DON from
landscapes to receiving waters. Most studies of DON dynamics are limited to examining
the net changes in concentrations of particular nitrogen species over time and/or
quantifying the net change of DON using bulk analysis (Bronk et al., 2010; Filippino et

5
al., 2011; Seitzinger et al., 2002). Unfortunately, this approach has only addressed bulk
measurements o f DON, and we know little about how the molecular composition o f DON
changes in response to biodegradation or photodegradation processes. To date, there is
no standard method to accurately assess DON reactivity at the molecular level in natural
systems. Further, the high polarity and complexity o f this material, along with the
analytical challenges encountered by the presence of inorganic salts, some o f which are
N-containing salts, make it difficult to obtain molecular level information using standard
techniques (McCarthy and Bronk, 2008). In fact, bulk spectroscopic techniques, such as
ultraviolet/visible absorbance, infrared, and nuclear magnetic resonance, have provided
functional group information on complex mixtures such as wastewater effluents (Dignac
et al., 2001) but lacked the ability to provide molecular level information. Furthermore,
by being a Lewis base, N in DON can be easily protonated making its isolation difficult
when using conventional extraction methods. Up till now, approximately 50% of the
DON pool is still uncharacterized. This is especially true for anthropogenic DON,
considering that it is typically, and likely incorrectly, considered to be recalcitrant
without direct evidence, and that there are limitations to methods for its characterization
(Vahatalo and Zepp, 2005).
DOM and its subcomponents delivered from the surrounding watershed to the
estuary may fuel eutrophication and hypoxia in several ways, including: (1)
remineralization to inorganic forms, which subsequently stimulate primary production
and lead to excess organic matter accumulation in the estuary, and (2) respiration or
decomposition o f DOM, which consumes dissolved oxygen. Thus, understanding the
factors that control DOM dynamics and composition, including the effect of

6
photochemistry, changes in salinity, and differences in source material is necessary for
developing sound management practices. However, despite the recognized importance of
DOM to the estuarine ecosystem it is often difficult to predict how DOM dynamics will
impact downstream waters, since its composition is highly variable thereby influencing
its chemical properties and biological availability (Fellman et al., 2010; Yamashita et al.,
2010)
This thesis is a compilation o f work that addresses these gaps in knowledge by
examining the reactivity o f DOM from different sources under biological, photochemical,
and salinity change stressors. I demonstrate in this thesis that true reactivity can be
readily masked by examination o f bulk changes in DOM, mainly because degradative
losses can be offset by new production in a metabolically and photochemically active
system. We show that molecular-level geochemistry capable o f distinguishing between
new production and degradative loss is essential to evaluate the extent of DOM
transformations. Such specificity is afforded by use o f electrospray ionization coupled to
Fourier transform ion cyclotron resonance mass spectrometry (ESI-FTICR-MS), a
technique that provides the ability to obtain unique elemental formulas for components of
DOM in aquatic environments including marine waters (Reemtsma et al., 2006; Sleighter
and Hatcher, 2008b) and freshwaters (Kim et al., 2006). Moreover, this technique has
been shown to be an excellent tool for the study o f DOM biodegradation (Kim et al.,
2006). In this thesis, I advance this concept and further demonstrate that both
biodegradation and photodegradation can be examined at the molecular level by this
approach.
The overall objectives of this research are to probe the dynamics o f DOC and

7
DON from a variety of sources (natural and anthropogenic) using new analytical
techniques in order to assess its potential reactivity in the York and James Rivers o f the
Chesapeake Bay watershed. The specific objectives and hypotheses are:
Chapter II: In biologically productive systems, such as the James River, the
uptake and production of the DON and DOC component molecules can occur at similar
rates with no net change in bulk measurements. This can mask the true reactivity of
DOM if only bulk chemical analysis are examined. I hypothesized that I could resolve
this problem by investigating molecular level biotransformation of wastewater treatment
plant (WWTP) effluents spiked into waters o f the James River, Virginia using ESI-
FTICR-MS. This chapter, published in Water Research, is the first to demonstrate the
power o f FTICR-MS to discern molecular level changes that discount the claim of
biorecalcitrance for DON. My advanced chemical analysis demonstrated that DON in
both examined effluents from two very different treatment processes were more reactive
than was predicted from the net changes in bulk DON concentrations in the incubation
bottles. My findings have important implications for management and suggest that it
may not be appropriate to discount DON from WWTP nutrient loading estimates; rather,
it should be counted towards the nutrient allocations for wastewater plant discharges to
aquatic systems
Chapter III: Photochemistry is considered one of the main processes that governs
the abiotic fate and turnover of DOM along the land-to-river-to-ocean continuum (Opsahl
and Benner, 1998; Smith and Benner, 2005; Stubbins et al., 2010; Wiegner and
Seitzinger, 2001). In contrast to the numerous studies published on DOC photochemistry
(Amon and Benner, 1996; Mopper et al., 1991; Stubbins et al., 2010), little is known

8
about the response of DON and inorganic N to photochemical transformation. With
access to water samples with different ranges o f DOM sources, I hypothesize that I could
use ESI-FTICR-MS to investigate the structural transformation of both DOM and its
component DON from natural and anthropogenic sources under the influence o f long
term photoirradiation, to better understand the ecological significance o f DOM in
disturbed watersheds and to elucidate the impact of land-use changes on the reactivity
and the transfer of DOM from sources to receiving waters o f the York River System in
southeastern Virginia. To the best o f my knowledge, this is the first study to molecularly
investigate long-term photoirradiation o f anthropogenic DOM and DON while, at the
same time, comparing them with natural sources o f DOM and DON using ESI-FTICR-
MS, and while still employing conventional bulk analysis approaches. My approach
depicted an intense photoproduction o f new DON even from the natural source that is
relatively N-poor. I was able to demonstrate that photochemistry transforms DON from
complex structural entities to ammonia, aliphatic molecules, and low carbon number
molecules that might be easily digested by biota. Furthermore, we validate that
photochemistry is one o f the main processes that shapes the DON quality in aquatic
systems regardless o f its original source.
Chapter IV: Once exported from watersheds, DOM components may be recycled
by bacteria and respired or incorporated into microbial and higher organism food webs
(Dagg et al., 2008; Del Giorgio and Pace, 2008; Nakagawa et al., 2007) serving as C, N,
and P sources. Moreover, the lability of DOC and DON has been shown recently to vary
largely according to the biochemical composition and source o f their constituent DOM
(Benner, 2003; Lu et al., 2013; Wiegner et al., 2006). I hypothesize that anthropogenic

9
DOM is functionally different than naturally derived DOM, and that this difference is
predicted to affect DOM processing and metabolism as it is transported downstream the
mesohaline section of the York River. I substantiated my hypothesis by using inoculum
from two different stations on the York River to perform bioassays on samples from both
natural and anthropogenic sources. I used a combination o f multi-analytical and
statistical approaches to detect intrinsic changes in the DOM pertinent to each source
while being subjected to different salinities. My results demonstrate that DOM from
these different sources exhibited differences in the degree o f biodegradation and type of
bioproduced compounds, which can be related to the dramatic differences o f their DOM
source and structural signature. These findings suggest that anthropogenic DON is
highly reactive in the natural environment in comparison to the naturally derived DON
and that change in salinity enhances DOM biodegradation. I was able to ascertain that
simple assays examining net consumption or production o f bulk dissolved organic N
pools are inadequate for assessing the bioavailability o f DON from these different
sources.
Findings from this research will enhance scientific understanding o f non-point
source pollution effects and/or nutrient dynamics on coastal ecosystems. This research
will i) characterize the variability, at the molecular level, of the DOC and the DON from
natural and anthropogenic sources, one that has a critical effect on the functioning of
coastal ecosystems such as variation in energy sources to higher food webs, and ii) assess
factors affecting the reactivity o f natural versus anthropogenic DOC, and DON as it is
transported from source areas downstream to the mouth o f the York River. The latter
information is essential for coastal planning, as changes in the materials supporting food

webs is critical for sustenance o f estuarine ecosystems and prevention of eutrophication.
Finally, the proposed work is of global interest, as it will provide a critical understanding
of how changes in DON and DOC composition impact the reactivity of DOM delivered
to riverine and estuarine systems. Furthermore, the results o f these studies allows us to
further demonstrate that ESI-FTICR-MS shows a unique potential for elucidating the
dynamics o f DOM in aquatic systems.

11
CHAPTER II
REACTIVITY AND CHEMICAL CHARACTERIZATION OF EFFLUENT
ORGANIC NITROGEN FROM WASTEWATER TREATMENT PLANTS
DETERMINED BY FOURIER TRANSFORM ION CYCLOTRON RESONANCE
MASS SPECTROMETRY
PREFACE
The content o f this CHAPTER was published in 2012 in the Water Research Journal, and
below is the full citation. See Appendix A for the copyright permission.
Mesfioui, R.; Love, N. G.; Bronk, D. A.; Mulholland, M. R.; Hatcher, P. G.,
Reactivity and chemical characterization of effluent organic nitrogen from
wastewater treatment plants determined by Fourier transform ion cyclotron
resonance mass spectrometry. Water Research, 2012,46, (3), 622-634.
1. INTRODUCTION
Over the past century, human activity has dramatically changed global nutrient
cycles, resulting in detrimental effects on human health and Earth system dynamics
(Gruber and Galloway, 2008; Schlesinger, 2009). In particular, eutrophication has
resulted from the high nitrogen (N) flux to coastal marine systems from both natural
(Inglett et al., 2011; Perakis and Hedin, 2002) and anthropogenic sources (Howarth et al.,
2011; Howarth, 2008). The impact o f nutrient over-enrichment is seen most dramatically
in estuarine regions, such as Chesapeake Bay where the estimated cost o f rehabilitation is
estimated at nearly $18 billion (The Chesapeake Bay commission, 2010).
Wastewater treatment plants (WWTPs) are an important point source for N
loading in many aquatic environments, including Chesapeake Bay. Wastewater-derived

12
N currently contributes approximately 19% of the total N load to the Bay (The
Chesapeake Bay resource library, 2009). In N-sensitive estuaries such as Chesapeake
Bay, WWTPs are required to implement more advanced treatment methods in order to
meet increasingly stringent effluent guidelines for total N (TN); in some cases this will
require effluent TN concentrations to be below 3 mg N/L. In advanced N removal
treatment systems, the percentage o f N that is organic in the final effluent can be as much
as one-third o f the TN (Urgun-Demirtas et al., 2008).
While we now know that many phytoplankton take up organic N (Mulholland and
Lomas, 2008), there are relatively few data on the bioavailability of EON. Some studies
have investigated EON in defined cultures or seed cultures (Pehlivanoglu and Sedlak,
2004; Sattayatewa et al., 2009). Other studies examined the bioavailability o f EON by
monitoring changes in concentrations o f particular nutrient elements over time in
incubations with microbial communities in natural waters (Bronk et al., 2010; Filippino et
al., 2011) or by treatment plant microbes (Parkin and McCarty, 1981). While bioassays
can quantify the net changes in the organic N pool, they cannot rigorously characterize
true bioavailability o f specific compounds in the environment because organic
compounds are both taken up and released during bottle incubations and because the
diversity o f microbes in natural systems is great such that what is bioavailable to one
community might not be to another.
Currently, we know little about the molecular composition o f EON and dissolved
organic nitrogen (DON) in general. The high polarity and complexity o f this material,
along with the analytical challenges encountered due to the presence o f inorganic salts,
some of which are N salts (McCarthy and Bronk, 2008), make it difficult to obtain

13
molecular level information using standard techniques. In fact, bulk spectroscopy
techniques, such as ultraviolet/visible, infrared, and nuclear magnetic resonance, which
have provided functional group information on complex mixtures such as wastewater
effluents (Dignac et al., 2001; Pehlivanoglu-Mantas and Sedlak, 2006) lack the ability to
provide molecular level information.
Electrospray ionization (ESI) coupled to Fourier transform ion cyclotron
resonance mass spectrometry (FT-ICR-MS) at high magnetic field (>9 Tesla) has
provided a major breakthrough for molecular studies of environmental samples (Marshall
et al., 1998; Sleighter and Hatcher, 2008b). Because o f its ultrahigh resolving power
(>200,000) and high mass accuracy (<lppm), ESI-FT-ICR-MS is capable o f determining
the exact mass for the thousands o f molecules in a single complex sample o f DOM (Kim
et al., 2003; Kujawinski et al., 2002). The mass accuracy is sufficiently high to allow for
the assignment o f a unique molecular formula to each constituent (Stenson et al., 2003).
Recently, ESI-FTICR-MS has been used to characterize DOM in aquatic environments
including marine waters (Reemtsma et al., 2006; Sleighter et al., 2008b) and ffeshwaters
(Kim et al., 2006). Moreover, this technique has been shown to be an excellent tool for
the study of DOM biodegradation (Kim et al., 2006). Currently, ESI-FTICR-MS is the
most powerful analytical tool for elucidating the detailed molecular characterization of
DOM, which can be accomplished by assigning unambiguously single formula to each
peak in the mass spectrum.
As part o f a comprehensive study to evaluate the utility of bioassays to assess the
reactivity o f EON from wastewater treatment plant effluents (Bronk et al., 2010;
Filippino et al., 2011), ESI-FTICR-MS was used to determine the molecular (i.e.,

14
formula) composition of DOM isolated from two biological reactor effluents obtained
from WWTPs employing different treatment processes. The results, coupled with
bioassay data published elsewhere (Bronk et al., 2010), allowed us to better understand
the biological lability of the EON samples tested.
The results of this study demonstrate that bioassay data is best interpreted in
conjunction with advanced chemical analysis to assess the true bioavailability o f EON.
The outcomes of this study will offer new insight into our understanding o f the fate of
EON in receiving waters and may influence management decisions regarding how we
determine allowable N loads from WWTPs to aquatic systems.
2. EXPERIMENTAL PLAN
2.1. Source o f effluents
The biological reactor effluents used in this study were from two WWTPs that
employ enhanced nutrient removal technologies (ENR facilities). These plants were
selected because their final effluents were expected to contain high concentrations of
DON relative to DIN (Pagilla et al., 2006); high concentrations o f DIN are known to
stimulate growth in natural microbial communities (Mulholland and Lomas, 2008) and
can also reduce the sensitivity o f the bioassay to the organic N component (Bronk et al.,
2010). The effluents are designated EON4 and EON5 (Bronk et al., 2010). EON4 was
collected from a small WWTP equipped with a membrane bioreactor system (<0.05
million gallons per day) and has a solids residence time of 20-30 days prior to discharges
within the Chesapeake Bay watershed. The plant receives a variable influent containing
both sewage and septage discharges, and uses a biological TN removal process with
influent equalization prior to a four stages Bardenpho process followed by UV

15
disinfection process. EON5 was isolated from a large domestic WWTP (40 million
gallons per day) located in the arid Western US. This facility uses a sophisticated
multistage system that has a solid retention time of 3 days. The system includes an
anaerobic/oxic (A/O) biological phosphorus removal process, a
nitrification/denitrification process, and a final chlorination disinfection process. EON4
samples were collected, placed in a cooler with ice, and transported to Old Dominion
University (ODU, Norfolk, VA) the same day. Effluents were collected prior to the
disinfection step, because treatment plants are increasingly turning to UV disinfection
and we wanted the results to be representative for non-chlorinated effluents. Because the
EON5 sampling point still contained large amounts o f microbial biomass from the
treatment system itself, the samples were filtered with a 1 pm pleated sediment cartridge
(Safe Water Technologies, Inc., Elgin, IL) prior to packaging and shipping overnight on
ice to ODU. Upon arrival to ODU, both effluents were filtered through a 0.2 pm
polysulfone cartridge filter (conditioned for 5 min with the effluent) then concentrated
from 13 L to 270 mL for EON4 and from 19L to 450 mL for EON5 using a rotary
evaporator system that was maintained at low temperatures ( < 3 5 °C) in order to
minimize DOM degradation. Furthermore, most volatile substances generally have m/z
values less than 200, and are below the mass range that the FTICR-MS can analyze.
Effluents were concentrated to allow addition o f a small volume o f EONs concentrates to
JR water, thus avoid “diluting” the natural population of microorganisms and to allow
detection o f the added DON. This process makes the total N o f both EON additions
about equal.

16
2.2. Sampling sites and bioassay experiments
Water containing microbiota for the bioassays was collected from the James River
(southeastern VA, USA) at a salinity o f 0.9 (considered freshwater), as described
previously in Bronk et al. (2010). Briefly, the field samples were collected in Niskin
bottles, and transferred to 0.5 L acid washed polyethylene terephthalate glycol bottles
once in the lab. The bottles were divided into three sets. The first set did not receive any
effluent (Ctrl). The second set was amended with 369 pg N L ' 1 (final concentration) of
concentrated EON5 (where DON represents 97.5% of the TDN), and the third set
received 427 pg N L ' 1 (final concentration) o f concentrated EON4 (where DON
represents 56% of the TDN). All samples were incubated in an environmental chamber
at the Virginia Institute o f Marine Sciences (VIMS, Gloucester Point, VA) supplied with
a 13.5/10.5 hour light/dark cycle and maintained at a constant temperature of 25°C. At
time initial (To) and after a 48-hr incubation period (Tf), aliquots o f 20 mL from
experimental treatments were filtered through pre-combusted glass fiber filters (nominal
pore size 0.7 pm, GF/F), then dispensed into precombusted borosilicate glass bottles and
were frozen for MS analysis.
Dissolved organic carbon (DOC) and TDN concentrations were measured in
triplicate on the filtered samples at VIMS using the high temperature catalytic
combustion method (Shimadzu TOC-5000) and the persulfate oxidation method,
respectively. DON concentrations were calculated by subtracting the concentrations of
ammonium ion (N H /), nitrate ion (NO3 ), and nitrite ion (NO2 ), from the TDN (Table
1).

17
2.3. Desalting protocol
Salts can interfere with MS analysis by either clogging the ESI-FICR-MS
skimmer, which mitigates ionization, or by forming unwanted peaks that compete for the
charge, thereby suppressing signals from organic constituents in the sample. Therefore,
sample desalting is mandatory before MS analysis. As mainly a Lewis base, N in DON
can be easily protonated, making its isolation nearly impossible when using conventional
extraction methods, which rely upon acidification to render acidic DOM molecules
neutral. Up until now, approximately 50% of the DON pool is still uncharacterized.
Recently, efforts are being earnestly employed to find the most effective method in
isolating DON. Solid phase extraction (Cjg, PPL), XAD resins, and ultrafiltration have
been successfully used for isolating DOM but yielded either low or no recovery for DON
(Mopper et al., 2007; Simjouw et al., 2005). So far, the most effective technique seems
to be electrodialysis (ED); which has been successfully employed in isola FWHM ting
DOM with the highest percent recovery (>85%) from both fresh and marine waters and
without any contamination or fractionation (Koprivnjak et al., 2006; Koprivnjak et al.,
2009; Vetter et al., 2007). After defrosting, samples were concentrated 5-fold using
rotary evaporator and then desalted using a small-scale electrodialysis (ED) system
(Harvard apparatus, hereafter referred to as a mini-ED. Each sample was charged into a
Teflon sample compartment (1.5 mL) between two cellulose acetate membranes
(molecular weight cut-off of 500 Da). This sample compartment was inserted into the
mini-ED chamber where it was subsequently completely surrounded by fresh ultrapure
water in order to maintain a salt gradient between the sample and chamber. Salt removal
occurs by transfer of salts through the membrane driven by the electric field and requires

18
several days to two weeks. This technique promotes the removal o f the vast majority of
salts while the sample compartment retains -55% of the DOC within the sample
compartment. The measurement o f DON recovery efficiency is not practical at this point
because reliable methods are not readily available to measure the amounts o f organic N in
our sample volume (-1.5 mL). We make the assumption that DON recovery is similar to
DOC recovery. In a study in our laboratory (Chen et al., 2011) we were able to
demonstrate that this mini-ED performs reasonably well and does not selectively
fractionate the DOM but recoveries are lower than observed for larger-scale ED systems
where values o f above 75% have been reported (Koprivnjak et al., 2009). Our use o f 500
Da membranes probably contributed to lower recoveries. The reproducibility o f this
technique was assessed using replicates of EON5 where the two replicates were desalted
then analyzed under the same conditions using the same MS parameters as the remainder
of bioassays samples. This technique showed a high level o f reproducibility. The MS
spectra o f both replicates were virtually identical when salt derived peaks were removed
from consideration. Approximately 83% o f all the DOM peaks were observed in both
replicates and their relative magnitude accounted for 97% of total summed peak
magnitude in both replicates. Most o f the mismatch between replicates was due to the
integration and non-integration of small peaks, which was dictated by signal-to-noise
settings. This excellent reproducibility gives us great confidence that single MS
measurements are sufficient to describe the distribution of peaks.
2.4. Instrumentation
All MS analyses were performed at the College o f Sciences Major
Instrumentation Cluster (COSMIC) at Old Dominion University using an Apollo II ESI
ion source coupled to a Bruker Daltonics 12 Tesla Apex Qe FTICR-MS. Prior to
analysis, the instrument was externally calibrated using polyethylene glycol. Samples
were first diluted with LC-MS grade methanol to 50:50 (v/v) methanol:water, then spiked
with 0.1% ammonium hydroxide (increasing pH to 8 ) right before introduction to the ESI
to increase the ionization efficiency. Sample flow rate was maintained using a syringe
pump set at 120 pL/hr and the ESI voltages for each sample were maintained at 3.4 kV
on the spray shield and 4.1 kV on the capillary under 200 °C in order to maintain a
consistent ion current entering the capillary to the MS.
All samples were analyzed in negative ion mode to minimize complications due
to sodium adduct formation. By using the negative ion mode, the multi-functional part of
the EON analyte that is attached to N can be effectively ionized without giving
complicated adduct signals. Furthermore, cyanide and nitrate/nitrite functionalities can
best be ionized in negative ion mode (Sleighter and Hatcher, 2011). Electrospray
voltages and mass spectrometer parameters were held constant throughout all
experiments. Ions were accumulated in a hexapole for a period o f 3 s before transfer to
the ICR cell. This accumulation time was found to be optimal; because shorter ion
accumulation times resulted in fewer peaks with lower S/N, while longer times led to
poor resolution. For each sample, 300 time-domain transients were acquired (at 4M
Word), zero-filled once, sine-bell apodized, and then Fourier transformed in the Bruker
data analysis software, resulting in an overall analysis time o f approximately 40 min.
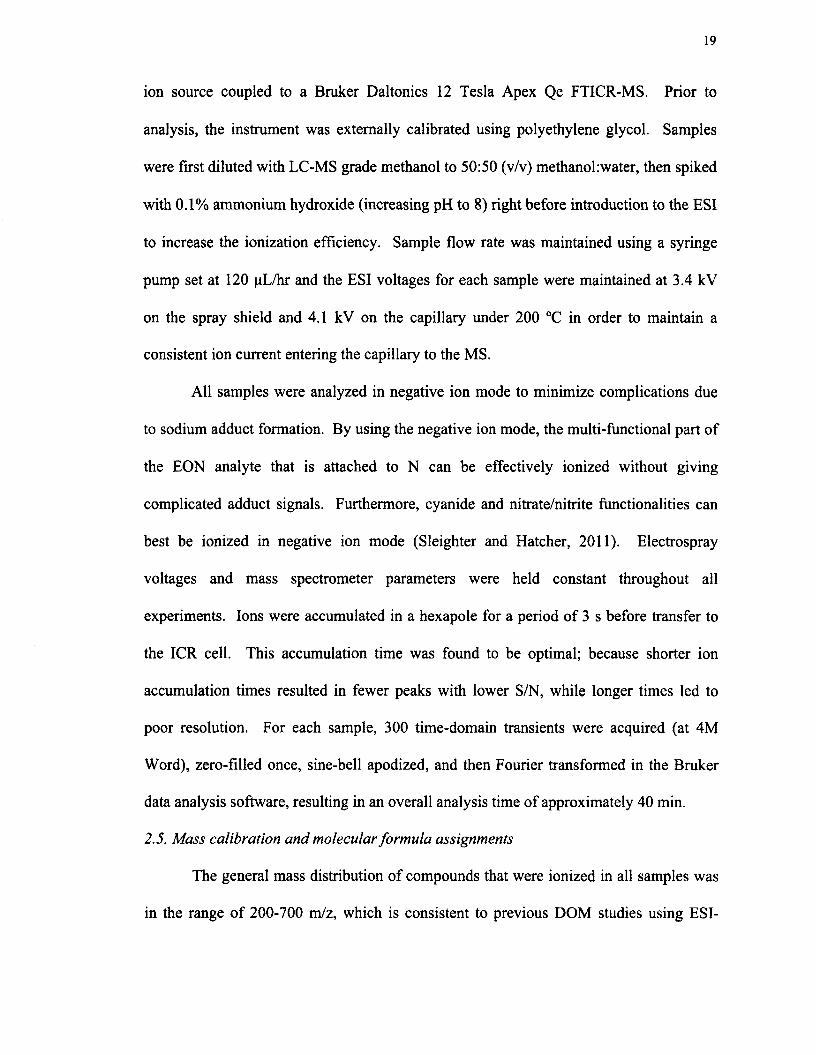
2.5. Mass calibration and molecular formula assignments
The general mass distribution o f compounds that were ionized in all samples was
in the range of 200-700 m/z, which is consistent to previous DOM studies using ESI-

20
FTICR-MS (Koch et al., 2005; Sleighter and Hatcher, 2008b). Because low m/z peaks
(<2 0 0 ) have very high excitation frequencies, the excitation required to increase the ion
radius to sufficient amplitude be detected by the detection plates is more difficult to
generate. Furthermore ions below 200 are discriminated against in the quadrupole, where
ions of a broad specified m/z range are allowed to pass through before being accumulated
in the hexapole, and then transferred to the ICR cell (see Appendix C for more detailed
information on the principle o f FTICR-MS). Our samples were analyzed in broadband
mode, meaning we used a very wide m/z range (m/z 1 0 0 -2 0 0 0 ) however peaks were only
detected and observed in the range of 200-700 m/z. The eventual loss o f peaks above
700 m/z can be attributed to space charge effects within the ICR cell that can result in a
decrease of high molecular weight signals (Kujawinski et al., 2002).
All acquired spectra were internally calibrated with indigenous fatty acids
(Sleighter et al., 2008a), providing a mass accuracy of 1 ppm or less throughout the mass
range of interest. Molecular formulae were assigned to peaks with a signal to noise (S/N)
ratio > 3 in the mass range o f 200-700 m/z by means o f a Formula Calculator Program
(v.1.0 © 1998 NHMFL) that was developed at the National High Magnetic Field
Laboratory in Tallahassee, FL. In our study, the vast majority o f formulas were
unambiguously assigned below m/z 500, because we only allow up to 0.5 ppm error in
assigning correct molecular formulas. When multiple assignments existed for a single
m/z value, then the correct formula was assigned based on elemental rules, functional
group relationships, and patterns and homologous series, as described in detail previously
in the literature (Koch et al., 2007; Koch et al., 2005).

3. RESULTS AND DISCUSSION
3.1. Chemical characterization o f EONS and EON4
Consistent with the pattern observed from other DOM studies using FTICR-MS
(Sleighter and Hatcher, 2008b), the spectra obtained for each desalted sample set
contained the routinely-observed complex pattern o f multiple peaks at each nominal mass
over the studied range (m/z 200-700). Included in this set o f peaks are extraneous peaks
related to residual salts, many of which are rather intense and have a distinct mass defect
that separates them from the DOM peaks. Electrodialysis is not 100% effective at salt
removal, so we do not show a comparison o f the raw spectral data over the mass range
where salt-derived peaks may predominate. Instead we focus here on the spectral data
that are reconstructed histograms for the DOM peaks that have been assigned molecular
formulae after data processing. Essentially this is a reconstituted mass spectrum from
which extraneous salt-derived peaks have been removed. Reconstructed mass spectra of
natural James River (JR) water, concentrated EON5, and concentrated EON4 are shown
in Figure 1. Both JR and EON5 reconstructed mass spectra show a pattern consistent
with previous DOM studies (Sleighter and Hatcher, 2008b), where peaks are generally
distributed over the mass range of 200-700 m/z with a maximum in the range o f 420-450
m/z; excluding the intense peaks that are predominantly fatty acids. However, the EON4
spectrum shows a distinct pattern where peak intensities are equally distributed over the
range of 200-700 m/z. Differences between effluents are likely due to a combination of
factors, including: the different treatment processes used at the two WWTPs; the unique
mixed liquor ecologies o f each plant; and different influent wastewater characteristics.

22
a) James River (JR) w ater
200 m/z 700
Figure 1. Comparison of (a) James River natural water, (b) E0N 5, and (c) E0N 4
reconstructed FTICR broadband mass spectra.
Most peaks are assigned a unique molecular formula (84%-92% of the peaks in
each spectrum, data shown in Table 1). These formulae will help examine the elemental
relationships among peaks within the same sample and between different samples. These
formulae can be sub-categorized according to their elemental make up. Thus, all
formulae can be grouped into CHO-containing molecules, CHNO-containing molecules,
and CHSO-containing molecules (Figure 2). Formulae containing only C, H, and O
dominated the three spectra, yet E0N5 and E0N4 samples include more CHNO

23
compounds (19% and 9%, respectively) than JR water (2%), which is consistent with the
fact that effluents are rich in N-bearing organic compounds.
Table 1
Total dissolved nitrogen (TDN), dissolved organic carbon (DOC), and dissolved organic
nitrogen (DON) data for the analyzed samples (salinity 0%o) by FTICR-M S. Percentage
of assigned formulae are determined in the studied range o f 200-700 m/z.
Sample [DOC](pM C) [TDNKpM N) [DON](|iM N) Percentage o f assigned formulas
JRa water To 362.6+ 1.6 28.8 + 0 . 1 21.3 + 0.1 8 6 %JR water Tf 372.2 + 2.5 22.6 + 0.4 22.4 + 0.4 89%
(EON5b+JR) To 604.3 + 3.4 55.5+ 0.7 47.6 + 0.7 92%(EON5 + JR) Tf 600.0 + 3.7 43 .1+ 0 .6 42.7 + 0.6 92%(EON4°+ JR) To 528.9 + 2.9 59.6 + 0.6 38.5 + 0.6 84%(EON4+ JR) Tf 547.5 + 2.4 38.6+ 0.6 38 .1+ 0 .6 92%
3 James River water, concentrated effluent from EON5 plant, 0 concentrated effluent from EON4 plant, To: time zero, Tf: after 48-hr incubation.
Van Krevelen (VK) plots (Kim et al., 2003), which display the molar H/C and
O/C ratios for individual peaks, cluster elemental formulae according to their functional
group compositions into major biochemical compounds classes that have characteristic
H/C and O/C ratios (Figure 2; compound classes indicated with black circles). It is well
known that the location of a point on the VK diagram relates to specific compound
classes in DOM, and interested readers are referred to the literature for more details
(Hockaday et al., 2009; Ohno et al., 2010; Reemtsma, 2009; Sleighter and Hatcher, 2011;
Van Krevelen, 1950). These compound classes include aliphatic structures (region I),
carboxyl-rich alicyclic molecule-like structures [CRAM (Hertkom et al., 2006)] or lignin-
like structures (region II), condensed aromatic structures [(Koch and Dittmar, 2006)

24
(region III)], tannin (region IV), carbohydrate-like structures (region V), and lipids
(region VI). EON5 appears more diverse in composition than both EON4 and JR natural
water, For example, EON5 encompasses more formulas in all regions o f the VK diagram
especially more nitrogenous species in the aliphatic and the CRAM- or Lignin-like
regions compared to EON4 and JR natural water (Figure 2).
a) Jam es River (JR) natural w ater JC. b) SONS
I: \K pbalk
s V: ( i r b o h o d r a tn
II I : A ro m a t ic
100X
• CHSO formulae
a CHNO formulae
• CHO formulae
Other formulae
IR water EONS EON4( ) ( '
Figure 2. Comparison o f James River natural water, EON5, and EON4 compositions,
van Krevelen diagram o f (a) James River natural water (b) EON5, and (c) EON4 color
coded to emphasize the type of compounds existing in each sample: green for CHO, blue
for CHSO, dark red for CHNO, and yellow for other formulae. The overlain black circles
correspond to major biochemical classes o f compounds that can be expected in dissolved
organic matter (DOM). Bar diagrams show the contribution o f the major subcategories
(CHNO, CHO, and CHSO) in the three samples.

25
3.2. Biodegradation o f effluent-amended James River water
3.2.1. EONS effluent amendment
3.2.1.1. Reactivity o f EONS
After a 48-hr incubation period, the peaks observed to be added to JR water with
the EON5 amendments (denoted by solid triangles * ) either disappeared completely or
their relative intensities changed compared to the peaks that originated mainly from the
JR water (denoted by solid stars * ), presumably as the result o f biotic and abiotic
alterations that occurred during the 48-hr incubation (Figure 3c,d). This disappearance or
diminution in relative intensity indicates a decrease in relative concentration o f these
compounds, suggesting they were labile.

26
*10 1.0 0.8 0.6 0.4
0.2 7 0.0
xlO 1.0 0.8
a) JR water at T0
367.139871367.103475
367.176306*
• u .
£5)g
367.139871367.103506 (* 367.176112 367.212663
b) EON5 only
367.358220
1 L L| xIO 1.0 £ 0.8 367.139853
tar367.103544 ^ 367J76339 367.2^1324
> Hn W / i f iH r / la m utif*'
c) EON5+JR T0
367.358302
i367.139854xlO 1.0
367.176206 Ir 367.231333
n|i ffcip♦ *■ ti ~T~~f J i J-ip~
d) EON5+JR T(
367.358270
367.10 367.15 367.20 367.25i
367.30 367.35 m/z
Figure 3. Reactivity o f the incubated EON5. Negative ion mass spectra expanded at
nominal mass 339 of (a) James River (JR) water at To, (b) EON5, (c) EON5+JR at To,
and (d) EON5+JR at Tf. Peaks added by the James River water are shown with solid
stars, peaks added by the effluent are shown with solid triangles, and peaks produced
upon incubation are shown with solid circles.
As an example o f what was observed throughout the mass range examined, we
show an expanded mass region o f the spectra obtained for JR water (Ctrl), EON5, and
EON5+JR samples before (T0) and after the 48-hr incubation (Tf) in Figure 3. In this
narrow spectra window, the major peak added by the effluent (m/z~339.127) disappears
after incubation while a new peak (m/z~ 339.093) emerges (denoted by a solid circle).

27
To identify changes throughout the mass range (200 to 700 m/z), the assigned formulae
for peaks in the EON5+JR sample before and after incubation were parsed into 3 groups
according to their heteroatom contents, and then each was plotted in a three dimensional
VK diagram (Figure 4a,b). These 3D VK plots highlight changes occurring to N- and S-
containing molecules separately from those molecules containing only C, H, and O. The
relative contributions (based simply on total number of formulae) o f each elemental class
to the general composition are also calculated and listed in a bar diagram (Figure 4),
There was a major removal o f CHNO and CHSO compounds over the 48-hr incubation.
The removal o f these effluent-derived compounds suggests that they were bioavailable or
degradable (but not necessarily mineralized) when introduced to natural water samples.
There was also removal of CHO compounds but this information was not readily
discemable from this type of diagram because we also observed production o f new CHO
compounds that offset the molecules lost during degradation.
28
a) E0N5+JR at To b) EON5+JR at Tf
0 06o 2 0 0.
0 02
100%90% 180%
70%
60%
40% i
0.02
10%" 1.0
' 0 8
0.20.0
c) E0N4+JR at To
X CHO formula* X CHSO formula*X CHNO formula*
Oth*r formula* d) E0N4+JR at Tf
y o.i2
- 0 .4 ‘ 0.2 0.0
1 S0%40%
i i.a 30%
. o i # 20%°*<$P 10%
0%
2 0.10.0.00
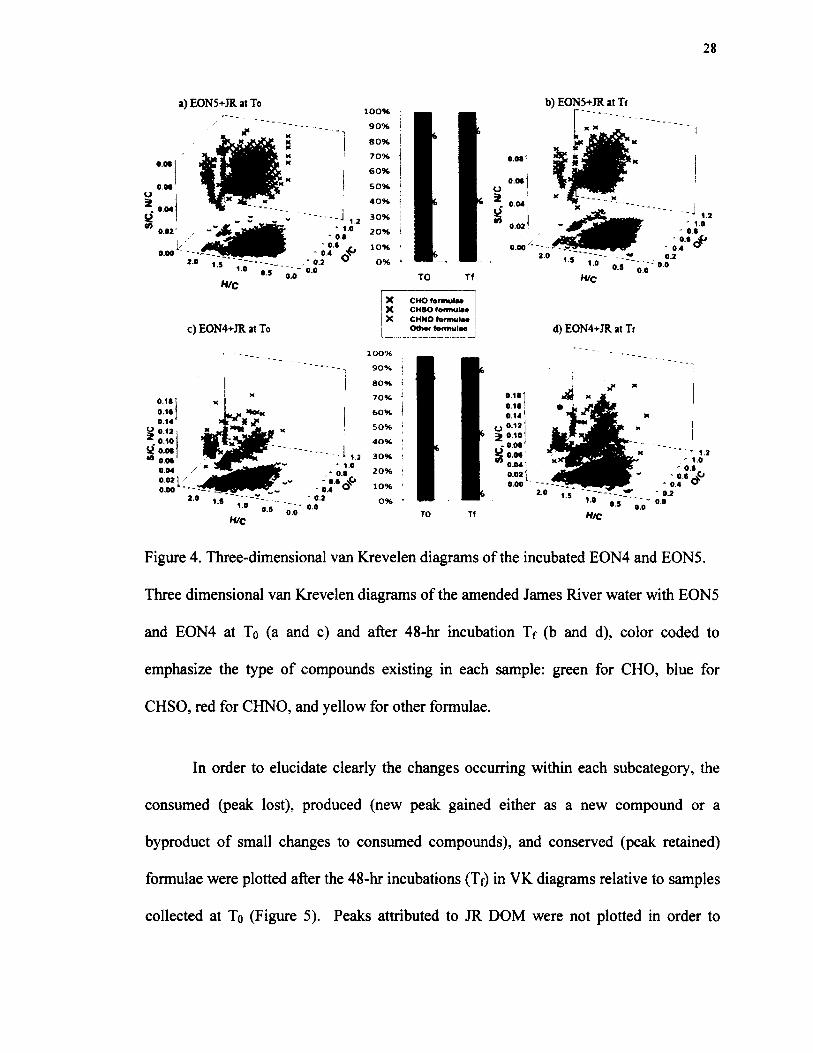
Figure 4. Three-dimensional van Krevelen diagrams o f the incubated E0N 4 and E0N5.
Three dimensional van Krevelen diagrams o f the amended James River water with E0N5
and E0N 4 at To (a and c) and after 48-hr incubation Tf (b and d), color coded to
emphasize the type o f compounds existing in each sample: green for CHO, blue for
CHSO, red for CHNO, and yellow for other formulae.
In order to elucidate clearly the changes occurring within each subcategory, the
consumed (peak lost), produced (new peak gained either as a new compound or a
byproduct o f small changes to consumed compounds), and conserved (peak retained)
formulae were plotted after the 48-hr incubations (Tf) in VK diagrams relative to samples
collected at To (Figure 5). Peaks attributed to JR DOM were not plotted in order to

29
highlight the effects due to changes in effluent DOM only during the 48-hr incubation.
Approximately 79%, 36%, and 39% of CHNO, CHO, and CHSO formulae of EON5,
respectively, were consumed (Figure 5, bar diagrams). However, about 54%, 42%, and
33% of CHNO, CHO, and CHSO formulae, respectively, were produced during the 48-hr
incubations. These results confirm that, while some components o f EON5 were labile,
production o f new chemical compounds during the bioassay can confound assessments of
bioavailability based on net changes in DON concentrations (Bronk et al., 2010).
Production of new compounds may be due to partial digestion of the consumed DOM or
to production of new compounds as a result o f microbial or abiotic transformations. It is
important to note that the above estimates o f alterations are conservative estimates
because they do not include peaks with diminished intensities or peaks that increased
during the bioassay. Only peaks that disappeared completely and new ones that emerged
after the 48-hr incubation period were considered in this analysis.

30
2.5
2.0
Composition of the amended James River water with EON5 (EON5+JR) at Tq
CHNO CHO CHSO
X t.
0.5
0.00.0
2.5
1.5U
0.5
100%100%
80% -
40% -
100%
40% -X Produced formulaeX Consumed formulae X Resistant formulae
0.2 0.4 0.6 0.8 1.0 1.2 0.0 0.2 0.4 0.6 0.8 1.0 1.2 0.0 0.2 0.4 0.6 0.8 1.0 1.2O/C O/C O/C
Composition of the amended James River water with EON5 (EON5+JR) at TfCHNO CHO CHSO
„ X X „ X
0 .0—
0.0
100%
80%
60%
40%
20% -
0% -
100%
80%
60%
40%
20%
0%0.2 0.4 0.6 0.8 1.0 1.2 0.0 0.2 0.4 0.6 0.8 1.0 1.2 0.0 0.2 0.4 0.6 0.8 1.0 1.2
QIC QIC 0 /c
y 100%
Figure 5. van Krevelen diagrams o f the incubated E O N 5. VK diagrams showing the
consumed, resistant, and produced formulae of the initial and final (C H N O , CHO, and
C H SO ) formulae in E O N 5+JR sample. Points in dark green represent EO N 5 peaks that
disappeared upon incubation (consumed), points in red represent E O N 5 peaks that were
unchanged (resistant), and points in blue denote new peaks that appeared during
incubation (produced). Bar diagrams show the percent contribution o f the consumed,
resistant, and produced formulae in EO N 5 at time zero (To) and after incubation (Tf).
3.2.1.2. Chemical characterization o f incubated EON5
3.2.1.2.1. Consumed DOM compared to the produced DOM
Consumed, newly produced, and resistant molecules were segregated according to
the major groups o f biochemical compounds present in the DOM (Figure 6). These

31
groups include: I) aliphatics, II) CRAM or lignin-like molecules, III) aromatics, and IV)
molecules from other regions of the VK diagram. EON5-CHO formulae were sorted into
these different groups using previously established rules (Hertkom et al., 2006; Koch and
Dittmar, 2006; Perdue, 1984). We extended these rules to apply to CHNO and CHSO
formulae. Finding CHNO or CHSO peaks in these four regions means that the
compounds defined by these regions were N-substituted or sulfurized. In general, EON5
showed a high level o f reactivity (compounds were consumed) for both CHO and CHSO
molecules, mainly from region I (31%; 54%), and region II (16%; 29%), respectively
(Figure 6). In contrast, the consumption o f CHNO molecules was mainly from region II
(23%) and region III (52 %). The newly produced compounds were mainly attributed to
region II, where 92%, 57%, and 25% of the produced CHNO, CHO, and CHSO
molecules are CRAM or lignin-like molecules.

32
CHNO formulaeE 0 N 5 chem ical characterization
1 0 0
i u
100
I I I O thers
CHsjo formulae
HO formulae
■■■■ C on su m ed form ulae ■■■■ R esistan t form ulae ■■■■ P rod uced form ulae I : A liphatic region I I : CRAM-like region I I I : A rom atic region O thers: O ther reg ion s
™ O thers
Figure 6. Chemical characterization of the incubated EON5. EON5+JR bar diagrams
showing the chemical characterization o f the consumed, resistant, and produced
molecules in the three major subgroups (CHNO, CHO, and CHSO) upon incubation.
3.2.1.2.2. Refractory DOM
A fraction of EON5, about 21%, 64%, and 61% of CHNO, CHO, and CHSO
formulae, respectively, was not degraded over the course o f our incubation experiment
(Figure 5, bar diagrams). The refractory portion o f EON5 plotted mainly in the CRAM
or lignin-like structural region, where about 56%, 51%, and 38% of the resistant CHNO,
CHO, and CHSO molecules, respectively, were attributed to region II (Figure 6). These

33
results are consistent with the proposed refractory nature o f CRAM and lignin molecules
(Hertkom et al., 2006; Opsahl and Benner, 1997).
3.2.2. EON4 effluent
3.2.2.1. Reactivity o f EON4
Incubations amended with EON4 showed a remarkable production o f new
compounds compared to EON5 incubation bottles over the 48-hr bioassay experiment.
When similar nominal mass regions o f the JR water, EON4 and EON4+JR samples are
compared before (To) and after incubation (Tf), a significant production o f new peaks
(denoted by solid circles •) was observed at nearly every nominal mass (Figure 7).
Additionally, EON4 was significantly degraded; the peaks from the mass spectrum
attributed to the EON4 addition (* ) either disappeared completely or significantly
decreased in relative intensity compared to JR indigenous DOM (*).

34
353.200354353 . 24220353.160602
■ r n t f t t / t r r
b) EON4353.200393 3 53.215607
353.124167353.160675 3 53.179241
c) EON4+JR at TO353.200358 653.215585 \A
353.160574 V I V353.142839 *1 353.179239
<U x 10 0.8353.124194
d) E0N4+JR at Tf353.200405 353.215611
353.160615353.124183
353.175913353.103029 353.139422
353. 8 569
353.10 353.12 353.14 353.16 353.18 353.20
Figure 7. Reactivity of the incubated EON4. Negative ion mass spectra expanded at
nominal mass 353 o f (a) Control at T0, (b) EON4, (c) EON4+JR at T0, and (d) EON4+JR
at Tf. Peaks added by the James River water are shown with solid stars, peaks added by
the effluent are shown with solid triangles, and peaks produced upon incubation are
shown with solid circles.
A 3-dimensional VK plot for the EON4+JR before and after the 48-hr incubation
shows a significant production o f compounds in all the subcategories (CHO, CHNO, and
CHSO molecules) (Figure 4c,d). Approximately 100%, 86%, and 66% of CHNO, CHO,
and CHSO formulae, respectively, were compounds produced during the incubations
(Figure 8). About 100%, 77%, and 58% of the initial CHNO, CHO, and CHSO
molecules, respectively, disappeared completely after the 48-h incubation (Figure 8).
Overall, EON4 and EON5 mass spectra were dissimilar and incubations o f natural water

35
amended with E0N 4 versus E0N5 produced distinct results with net production o f new
compounds in the EON4-amended incubations.
2.6
2.0
1.6
«Z1.0
0.6
0.0
Composition of the amended James River water with EON4 (EON4+JR) at To
CHNO CHO CHSOW W X R M X
* * \ *M **»** * ,x| | x x _« y* «100% -
40% -
100%
80%
60% -
40%
20%
0%
X Produced formulaeX Consumed formulaeX Resistant formulae
100%
80%
60%
40%
20%
0%
0.6
0.0
0.0 0.2 0.4 0.6 0.8 1.0 1.2 0.0 0.2 0.4 0.6 0.8 1.0 1.2 0.0 0.2 0.4 0.6 0.8 1.0 1.2O/C O/C O/C
Composition of the amended James River water with EON4 (EON4+JR) at Tf
CHNO CHO CHSO
XX * * M X X
* X
w/ a v a > / o -i mm k x
80%
60%
40%
2.6
»2.0
* «-»*X X* x \ - - *
1.6
” *
1*“ 100%
80% -
60%
40% -
20%
0%
’C* * « 100%100% ,
80% \60% \40% -j
20% i
0% J0.0 0.2 0.4 0.6 0.8 1.0 1.2 0.0 0.2 0.4 0.6 0.8 1.0 1.2 0.0 0.2 0.4 0.6 0.8 1.0 1.2
O/C O/C O/C
20%
0%
Figure 8. VK diagrams o f the incubated EON4. VK diagrams showing the consumed,
resistant, and produced formulae o f the initial and final (CHNO, CHO, and CHSO)
formulae in EON4+JR sample. Points in dark green represent EON4 peaks that
disappeared upon incubation (consumed), points in red represent EON4 peaks that were
unchanged (resistant), and points in blue denote new peaks that appeared during
incubation (produced). Bar diagrams show the percent contribution o f the consumed,
resistant, and produced formulae in EON4 at time zero (To) and after incubation (Tf).

36
3.2.2.2. Chemical characterization o f incubated EON4
3.2.2.2.1. Newly produced DOM
In the case o f E0N4, the newly produced CHNO formulae clustered mainly in
region II (29%), and region III (36%), whereas the new CHO and CHSO molecules were
mainly assembled in region I (35%), and region II (45%), respectively. Overall, EON4
exhibited production in all the major biochemical classes plotted in the VK diagram.
3.2.2.2.2. Refractory DOM compared to the consumed DOM
EON4 showed little resistance to degradation during incubations and a large
percentage of the peaks observed in the spectrum of the incubated EON4+JR disappeared
during the incubation period. Only about 0%, 30%, and 42% of CHNO, CHO, and
CHSO molecules in the initial effluent, respectively, persisted through the incubation
period (Figure 8, bar diagrams). These resistant molecules belonged mainly to region II
(Figure 9). As in the case of EON5, these results are consistent with the belief that
CRAM- and lignin-like compounds are refractory (Hertkom et al., 2006; Opsahl and
Benner, 1997). The consumed formulae were attributed mainly to region I.
Approximately 33%, 82%, and 68% of the consumed CHNO, CHO, and CHSO
formulae, respectively, were aliphatic (Figure 9). This preferential consumption of
aliphatic molecules was more prominent in EON4 compared to EON5, where only 9%,
31%, and 54% of the consumed CHNO, CHO, and CHSO, respectively, were aliphatic.
This difference in the degree o f degradation and type of degradation is probably related
both to differences in processes employed in the two WWTPs and the dramatic
differences in influent (sewage from a collection system to EON5 versus some collection
system sewage and frequently trucked septage with widely varying composition in

37
E0N4). While the specific attributes that contribute to the differences in EON lability
observed cannot be concluded here, the differences measured suggest that further
evaluation of contributing factors is warranted.
EON4 Chem ical characterizationCHO formulae
1 11 O thers
C on su m ed R esistan t
h P rod uced
I : A liphatic region I I : CRAM-like or Lignin region I I I : Arom atic region O thers: O ther reg ion s
1 11 I I I ~Other*T
Figure 9. Chemical characterization o f the EON4. EON4+JR bar diagrams showing the
chemical characterization of the consumed, resistant, and produced molecules in the three
major subgroups (CHNO, CHO, and CHSO) upon incubation.

38
4. CONCLUSIONS
EON from wastewater treatment plants that discharge into N-sensitive regions has
the potential to be a significant contributor to the overall N load to a watershed. For this
reason, it is important to develop methods that allow the lability o f EON in natural waters
to be determined. Although bioassay approaches have been used to understand the
impact o f effluents on microbial growth in receiving streams and estuaries (Bronk et al.,
2010; Filippino et al., 2011), we demonstrate that advanced chemical analysis can
demonstrate reactivity even under conditions where standard bioassays do not. Bulk
chemical analyses o f DON in effluents and in bioassays suggest that the net consumption
o f organic N in bioassays is variable (Bronk et al., 2010; Filippino et al., 2011), and that
there can even be net production of DON (this study). However, the molecular-level
chemical showed that many compounds are consumed and others produced during
incubations with natural microbial communities and that the recalcitrant fraction of EON
is low, ranging from 0-21%. Production and consumption of DON compounds within
incubation bottles and natural systems masks the true bioavailability o f EON in the
environment. The nature o f organic N varies based on the treatment processes employed
and the wastewater received by those treatment plants, and this affects its reactivity in the
environment. Here we examined just two treatment processes as a point of demonstration
about how vulnerable bioassays are to misinterpretation in the absence of parallel
chemical molecular analysis. At the same time, our advanced chemical analysis
demonstrated that both the treated effluents examined here from two very different
treatment processes were more reactive than was predicted from the net changes in bulk
DON concentrations in the incubation bottles.
Our findings have important implications for management and suggest that it may
not be appropriate to discount EON from nutrient loading estimates; rather, it should be
counted towards the nutrient allocations for WWTP discharges to aquatic systems.
Additional WWTP effluents should be screened to determine how labile EON is across a
range o f treatment plants that employ different treatment processes. Furthermore, it is
not known if changes in treatment plant technologies, origin o f the influent, or operation
can be used to either reduce the amount o f organic N contained in effluents or change its
composition so that it is more recalcitrant to the environment into which it is discharged.
Further studies on remediation strategies that address these questions are justified.
40
CHAPTER III
PHOTOCHEMICAL ALTERATIONS OF NATURAL AND ANTHROPOGENIC
DISSOLVED ORGANIC NITROGEN IN THE YORK RIVER
PREFACE
The content o f this chapter was submitted to the Environmental Science & Technology
journal August 2014, and it is now in review.
Contributions: Rajaa Mesfioui developed experimental design with assistance from Dr.
Patrick G. Hatcher. Dr. Abdulla is an expert on the two-dimensional correlation statistical
analysis and provided assistance in displaying FTICR-MS results in the two dimensional
correlation maps.
1. INTRODUCTION
Because they represent the interface between land and ocean, estuaries play a key
role in mediating the Carbon (C), Nitrogen (N), and Phosphorus (P) biogeochemical
cycles (Hedges, 1992; Howarth et al., 2011; Mackenzie et al., 2002), and in modulating
the transfer o f dissolved organic matter (DOM) from land to coastal ecosystems
(Aufdenkampe et al., 2011; Hedges et al., 1997; Schlesinger and Melack, 1981).
However, by being the downstream recipients o f anthropogenic land use and
urbanization, this role has been greatly impacted resulting in a shift from balanced,
productive ecosystems into impaired and degraded ecosystems (Canfield et al., 2010;
Dodds et al., 2008; Howarth, 2008). While land use practices and fossil fuel emissions
constitute the main perturbations to the C cycle (Canadell et al., 2007; Le Quere et al.,
2009), poor management o f agricultural activities and widespread urbanization represent
the main perturbations to the N cycle (Galloway et al., 2004; Schlesinger and Bernhardt,
41
2013; Vitousek et al., 1997). Since DON is one o f the main components o f DOM, the
above perturbations are the suspected culprits that alter DON biogeochemistry in coastal
ecosystems (Altieri et al., 2009b; Lu et al., 2013; Meng et al., 2013; Williams et al.,
2010).
While the lability o f dissolved inorganic N (DIN, e.g., NOx and N H 4) and its role
as a pollution indicator are well established (Galloway et al., 2008; Howarth and Marino,
2006), the role o f anthropogenic DON has regularly been overlooked by the scientific
community (Bronk et al., 2007). The view that DON in marine environments forms a
persistently stable pool o f N, compared to the constantly depleted DIN pool, is
responsible for the traditional belief that DON is mostly bio-refractory, cannot be taken
up by phytoplankton, and hence does not contribute to eutrophication. While
anthropogenic DIN export from disturbed watersheds to the oceans has been the focus of
widespread international research, DON pollution has received less attention. Lately,
however, Pellerin et al. (2006) compiled N data for 348 disturbed watersheds reporting
that DON represents, on average, 49% of TDN concentrations in mixed watersheds and
that DON concentrations are, on average, 2.5-4 times higher in surface waters from
disturbed watersheds than in forested watersheds, suggesting that DON concentrations
are highly influenced by N loads in human impacted catchments. Therefore, the dominant
form of N in human-impacted watersheds has been overlooked as a potential source of
bioavailable N and its reactivity has been neglected for almost a century.
Recently, the preconceived view that DON is bio-refractory has been challenged
in the literature with emerging evidence for its bioavailability and its role in fueling
primary production (Bronk et al., 2007; Mulholland and Lomas, 2008; Seitzinger et al.,
42
2002). While these studies have shed some light on the importance o f DON in both C
and N cycles, they lacked the ability to investigate its structural complexity in order to
draw a conclusive picture on the dynamics of natural and anthropogenic DON from
landscapes to receiving waters. Most studies of DON dynamics are limited to examining
the net changes in concentrations o f particular nitrogen species over time and/or
quantifying the net change of DON using bulk analysis (Bronk et al., 2010; Filippino et
al., 2011; Seitzinger et al., 2002). Mesfioui et al. (2012) demonstrated that true reactivity
can be readily masked by examination o f bulk changes in DON, mainly because
degradative losses can be offset by new production in a metabolically and
photochemically active system. They showed that molecular-level geochemistry capable
o f distinguishing between new production and degradative loss is needed to evaluate the
extent o f DON transformations. Such specificity is afforded by use o f electrospray
ionization coupled to Fourier transform ion cyclotron resonance mass spectrometry (ESI-
FTICR-MS), a technique that provides the ability to obtain unique elemental formulas for
components o f DOM and DON. It is also of critical importance to investigate whether
DON is generated in situ via the conversion of inorganic N or exported as DON from
point and non-point sources within disturbed watersheds.
Photochemistry is considered one o f the main processes that governs the fate and
turnover of DOM along the land-to-river-to-ocean continuum (Opsahl and Benner, 1998)
(Smith and Benner, 2005; Stubbins et al., 2010; Wiegner and Seitzinger, 2001). In
contrast to the numerous studies published on DOM photochemistry (Amon and Benner,
1996; Mopper et al., 1991; Stubbins et al., 2010), little is known about the response of
DON and inorganic N to photochemical transformation. This is especially true for

43
anthropogenic DON, considering that it is dogmatically considered to be recalcitrant and
that there are limitations to methods for its characterization (Vdhatalo and Zepp, 2005).
In the current study special attention is paid to assess quantitative and qualitative
similarities/differences of three types o f DOM and its component DON from natural and
anthropogenic sources under the influence o f long-term photoirradiation to better
understand the ecological significance o f DON in disturbed watersheds and to elucidate
the impact o f land-use changes on the reactivity and the transfer o f DOM from sources to
receiving waters o f the York River System in southeastern Virginia. To the best o f our
knowledge, this is the first study to molecularly investigate long-term photoirradiation of
anthropogenic DOM and DON while, at the same time, comparing them with natural
sources o f DOM and DON using ESI-FTICR-MS.
2. EXPERIMENTAL PLAN
2.1. DOM sample collection, handling, and irradiation
A total of three different types of samples were collected. The first sample was
obtained from Sweet Hall Marsh (SHM) associated with the Pamunkey River, a major
tributary of the York River estuary in March 2012. SHM represents a typical source of
naturally derived DOM from marshes and tidal swamps that line the banks of the York
River-estuary System. The other two DOM samples were collected November 2011
from anthropogenically-impacted areas of the York River System. The King William
sample (KW) is a grab sample from the Pamunkey River, collected at a site impacted by
agricultural runoff from the Old Town Farm located in King William County. This
sample combines both natural and anthropogenic DOM. The other site is the effluent of
the West Point (WP) wastewater treatment facility o f the Hampton Roads Sanitation

44
District, a plant that is relatively small (-0.40 million gallons o f effluent per day). The
plant receives a variable influent containing both domestic and commercial discharges
and uses primary clarifiers, trickling filters, aerobic digesters, hypochlorite disinfection
and dechlorination processes. The average total nitrogen (TN) of WP effluent is around
17.1 mg-N/L (Bott, 2014).
Samples were collected using acid-cleaned and pre-conditioned polypropylene
buckets and were passed through 0.2 pm filters on site, then transported to Old Dominion
University on ice. Upon arrival, samples were filtered 0.1 pm to remove any residual
bacteria and/or particulate matter. To better track molecular changes o f extensively
photodegraded DOM from these different sources, and to provide an understanding of its
optical properties without going below instrument detection limits, long-term
photoirradiation exposure was needed, and hence sample concentration was required.
Furthermore, to prevent DOM remineralization in a short time period, and to minimize
any difference in light shielding between samples, SHM, WP, and KW samples were
concentrated approximately 20, 9, and 16 fold, respectively, to reach similar final DOC
concentrations o f about 95 ppm, using a rotary evaporator system that was maintained at
35 °C. Sub-samples o f the concentrated samples were retained for nutrient and chemical
analysis. After concentration, samples were subdivided into three equal volumes (330
mL) and were transferred to -550 mL quartz round bottom flasks and exposed to
irradiation for 50 days inside a solar simulator containing 12 Q-Panel ultraviolet UVA-
340 bulbs (approximate integrated irradiance 25 W m“2) which provides a spectral shape
similar to that o f natural sunlight from 295 nm to 365 nm (Minor et al., 2007). These
wavelengths are responsible for nearly all photochemical reactions in the natural

environment (Mopper et al., 1991). The solar simulator provided 127% of the
photobleaching that occurs under winter midday sunlight in the lower Chesapeake Bay
(36.9° N latitude)(Minor et al., 2007). Knowing that integrated light-dose, and not light
intensity, is entirely responsible for the generated photochemical reactions (Jankowski et
al., 1999), we choose this continuous light-exposure approach to allow for reproducible
irradiation conditions, which can ease the comparison between the different sources of
DOM. The flasks were covered with combusted glass lids to avoid bacterial
contamination. All flasks were opened and agitated twice a day to assure saturation of
dissolved oxygen. Temperature was monitored during the entire photo-irradiation time
and was found to be constant at 26.5-28.5 °C. Because o f limitation on sample volume
and solar simulator space, dark controls o f the studied samples were not used. However,
a dark control o f terrestrial DOM subjected to the same experimental conditions showed
no detectable carbon losses throughout a 60 days light-exposure (Chen et al., 2014).
Aliquots o f 10 mL were retrieved at the frequency o f 2d from each flask and were sub
sampled for UV-visible absorbance spectroscopy, NH4 , NOx, DOC, and TDN analyses.
Sub-aliquots (5mL) of 13-selected time point were saved for ESI-FTICR-MS analyses
(discussed bellow).
2.2. Bulk analysis
Dissolved organic carbon (TOC) and total dissolved nitrogen (TDN)
concentrations were measured for each aliquot using the high temperature combustion
(720°C) catalytic oxidation method (Shimadzu TOC/TN-5000) (Peltzer et al., 1996).
Ammonia ( NH 4) concentrations were analyzed using the phenol hypochlorite
colorimetric method (Hansen and Koroleff, 2007). We were able to measure NOx
46
concentrations using a Lachat QuikChem 8500 autoanalyzer of WP aliquots only
(Parsons et al., 1984); the sub-samples from KW and SHM were exhausted by another
unreliable NOx method employed initially and later abandoned. DON concentrations
were determined by subtracting the concentrations of NOx and NH4 from TDN
concentrations (Bronk et al., 2000).
2.3. UV-visible absorption spectroscopy
UV-visible absorption spectra (190-900 nm) were measured for the irradiated
samples using an Agilent 8453 diode array spectrophotometer with a 1 cm quartz cuvette.
Samples were diluted 10 times before measurements. Ultrapure water (Millipore) was
used as the blank. Absorbance values were corrected to account for instrument baseline
drift, refractive index, and temperature variation according to Green and Blough (1994)
and converted to Napierian absorbance coefficients using the following formula:
a = 2.303A//
where a= absorbance coefficient (m '1), A= absorbance, and / = path length (m). Spectral
slope ratios (Sr) and specific UV absorbance (SUVA) were calculated using the approach
o f Helms et al. (2008) and Weishaar et al. (2003).
2.4. Mass spectral analyses
Sub-aliquots (5ml) o f each selected time point at 0, 3, 5, 7, 11, 16, 18, 23, 25, 28,
33, 42, and 50 days were prepared for mass spectral analysis by passing the samples
through PPL solid phase extraction cartridges (Agilent, Bond Elut PPL) following the
procedure recommended by Dittmar et al. (2008). The whole cartridge was kept at low
temperature (4°C) 1-2 weeks before MS analyses.
All MS analyses were performed at the College of Sciences Major

47
Instrumentation Cluster (COSMIC) at Old Dominion University using an Apollo II ESI
ion source coupled to a Bruker Daltonics 12 Tesla Apex Qe FTICR-MS. Prior to
analysis, the instrument was externally calibrated using polyethylene glycol. Right
before introduction to the ESI, each sample was eluted from the PPL cartridge using 4
mL of LC-MS grade methanol and later diluted with LC-MS grade water to a uniform
TOC concentration (-10 ppm). Samples were then spiked with 0.1% ammonium
hydroxide (increasing the pH to 8 ) to increase the ionization efficiency. Sample flow rate
was maintained using a syringe pump and the ESI voltages for each sample were
maintained at 3.4 kV on the spray shield and 4.1 kV on the capillary under 200 °C in
order to maintain a consistent ion current entering the capillary to the MS.
All samples were analyzed in negative ion mode to minimize complications due
to sodium adduct formation. Electrospray voltages and mass spectrometer parameters
were held constant throughout all experiments. Ions were accumulated in a hexapole for
a period o f 2s before transfer to the ICR cell. This accumulation time was found to be
optimal; because shorter ion accumulation times resulted in fewer peaks with lower S/N,
while longer times led to poor resolution. For each sample, 300 time-domain transients
were acquired (at 4M Word), zero-filled once, sine-bell apodized, and then Fourier
transformed in the Bruker data analysis software, resulting in an overall analysis time of
approximately 30 minutes per sample.
2.5. Mass calibration and molecular formula assignments
The general mass distribution o f compounds that were ionized in all samples was
in the range o f 200-700 m/z, which is consistent with previous DOM studies using ESI-
FTICR-MS (Koch et al., 2005; Sleighter et al., 2008b). Because low m/z peaks (<200)
48
have very high frequencies, the excitation required to increase the ion radius to a
sufficient amplitude in order to induce enough current to be detected by the detection
plates is more difficult. Furthermore ions below 200 are discriminated against in the
quadrupole, where ions o f a broad specified m/z range are allowed to pass through before
being accumulated in the hexapole, and then transferred to the ICR cell. Our samples
were analyzed in broadband mode, meaning we used a wide m/z range ( 1 0 0 -2 0 0 0 )
however peaks were only detected and observed in the range of 200-700 m/z. The
eventual loss o f peaks above 700 m/z can be attributed to space charge effects within the
ICR cell that can result in a decrease of high molecular weight signals (Kujawinski et al.,
2002). All acquired spectra were internally calibrated with indigenous fatty acids
providing a mass accuracy of 1 ppm or less throughout the mass range of interest
(Sleighter et al., 2008a). Molecular formulae were assigned to peaks with a signal to
noise (S/N) ratio > 3 in the mass range of 200-700 m/z by means o f a Formula Calculator
Program (v.1.0 © 1998 NHMFL) that was developed at the National High Magnetic
Field Laboratory in Tallahassee, FL. In our study, the vast majority o f formulas were
unambiguously assigned below m/z 500, because we only allow up to 0.5 ppm error in
assigning correct molecular formulas. When multiple assignments existed for a single
m/z value, the correct formula was assigned based on elemental rules, on elemental rules,
functional group relationships, and patterns and homologous series, as described in detail
previously in the literature (Koch et al., 2007; Koch et al., 2005; Stubbins et al., 2010)
and in appendix C in this thesis.
2.6. Statistical analysis and 2D Correlation
To visualize and highlight geochemical differences in the large data set generated
49
by FTICR-MS, we applied two statistical approaches, principal component analysis
(PCA) and two-dimensional correlation analysis as described by Sleighter et al. (2010)
and Abdulla et al. (2013b), respectively.
2.6.1. Principal component analysis (PCA)
PCA compresses a multidimensional sample space into fewer dimensions by
seeking out the directions with most variability and then projecting the information onto
these dimensions. The first dimension, PCI, is aligned with the direction o f maximum
variance. The second dimension, PC2, in the next direction contributes to most o f the
residual variance, and so on. The scores represent the projection o f the original data onto
each PC. The loadings, however, decipher the relation between original variables and PC
dimensions by plotting each variable contribution to the data variability along each PC.
For each sample (WP, SHM, and KW), formulas from each category (CHO or N-
containing elemental formulas) o f all sub-samples (i.e., day 0, day 3) were compiled in
one data sheet and then condensed by removing duplicate formulas in order to make a
master list that comprises formulas existing in each sub-sample spectrum, resulting in 6
individual data matrices. Relative magnitude of each corresponding peak in each sub
sample spectrum was then calculated. When a formula from the master list is not present
in the sub-sample spectrum, zero is then assigned. Herein, we choose to plot our data
onto a two-dimensional PCA projection (biplots) since most variances in our datasets
(50%-88%), o f the total variance, were explained by PCI and PC2.
Even with its great usefulness in depicting the differences and similarities
between FTICR mass spectra and simplifying the comparison between highly
complicated formula lists, PCA is geometrically oriented and lacks the ability to examine

50
the correlation between formulas and to illustrate their responses under different external
perturbations. Therefore, we are also applying 2D correlation analysis to our datasets.
2.6.2. Two-dimensional correlation spectroscopy
This technique examines the changes between individual spectral variables (i.e.,
number o f molecular formulas) under specific perturbations (i.e., photoirradiation
exposure time) and displays the results in two kinds o f two-dimensional maps: the
synchronous and asynchronous maps. Herein, the 2D correlations are applied to the
FTICR-MS datasets in two different ways: first, by using the H/C ratio to investigate the
changes in the molecular formulas based on presence or absence o f formulas; second, by
correlating the changes in the carbon number o f individual formulas with each other.
Only synchronous data and maps were utilized.
For the H/C ratio, the CHO-containing formulas in each sample were classified
according to their H/C ratio in the range from 0.00 to 2.50 with increments o f 0.01. The
synchronous 2D correlation was conducted to examine changes in number o f formulas at
specific H/C ratios along the photoirradiation exposure time (n=13 samples).
To investigate the changes in carbon structure backbone o f the CHO formulas, the
molecular formulas were grouped based on their number o f carbon atoms, ranging from 4
to 60 carbon atoms at increments o f one carbon atom. Synchronous 2D correlation
analysis was applied to each dataset using photoirradiation exposure time as the
perturbation. In a similar manner, 2D-correlation analysis was applied on both the H/C
ratio and carbon number for nitrogen-containing formulas. These 2D correlation analyses
were conducted on SHM and WP samples.

51
3. RESULTS AND DISCUSSION
S. 1. Slope ratio and DOC
Upon irradiation Sr increases while SUVA254 and DOC concentrations decrease
(Figure 10a,b and Figure 11a). The extent o f photodegradation, based on the DOC
concentrations, is similar for the three samples, where we observe 59%, 55%, and 53% of
DOC loss in KW, SHM, and WP, respectively, after 50 days irradiation time. Sr shows
the highest increase, in the first 25 days, for WP and SHM (from 1.07 to 3.5 and from
0.98 to 3.34, respectively) in comparison to KW, which exhibits shallower increase (from
0.91 to 1.98, respectively). Helms et al. (2008) suggested that photobleaching destroys
chromophores associated with high MW CDOM, causing CDOM to partially shift from
the high MW to the low MW fraction. Their study demonstrates that Sr relate inversely
to chromophoric DOM average molecular weight. Our FTICR-MS results confirm this
relationship where changes in the magnitude weighted (Mw) MW (Figure Id) o f each
sample correlate significantly with Sr. Our results show a steady decrease o f each
sample MW in the first 25 days o f irradiation time. After 25 days Sr starts decreasing in
the WP case, while continues increasing in both SHM and KW cases. This shift from
high to low Sr in the WP cases, which is parallel to a shift from low to high MW
compounds, can be attributed to WP system shifting from photobleaching to
photohumification process (Kieber et al., 1997).
Wastewater effluents represent ideal liquors for photohumification to take place.
Their distinctive organic composition (~50% proteins, 40% carbohydrates, and 10% fats
and oils, besides trace amounts of priority pollutants (Shon et al., 2006)) and their high
DIN content can promote photoinduced DIN incorporation to produce newly formed
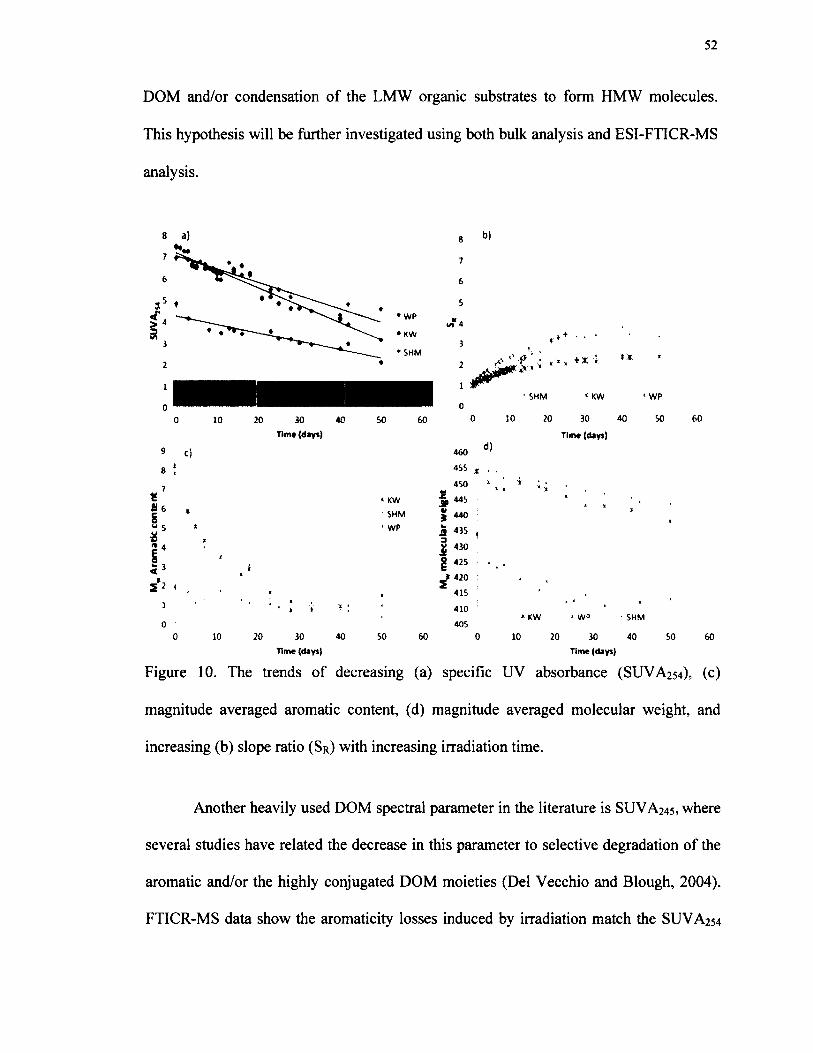
52
DOM and/or condensation o f the LMW organic substrates to form HMW molecules.
This hypothesis will be further investigated using both bulk analysis and ESI-FTICR-MS
analysis.
8 a)
7
6
a.f
9
8
7£a e SS*2 4
&10
10 20 30 40
Time (days)
Time (day*)
SO
8
7
6
S* WP
i/T 4* KW
3•SHM
2
1
0
60
b)
c) 460*< 4S5 t
4S0
* KW £&
44S1 SHM 41
3 440* 1 WP
a 435 ,X a
*430
t
1 I 42S
<> 420
• * 41S, 1 11 V 410
4050 10 20 30 40 50 60 0
0 10
d)
SHM < KW
I f
20 30 40
Time (day?)
' WP
SO
10 20 30
Time (days)
60
SHM
40 SO 60
Figure 10. The trends o f decreasing (a) specific UV absorbance (SUVA25 4), (c)
magnitude averaged aromatic content, (d) magnitude averaged molecular weight, and
increasing (b) slope ratio ( S r ) with increasing irradiation time.
Another heavily used DOM spectral parameter in the literature is SUVA2 4 5 , where
several studies have related the decrease in this parameter to selective degradation of the
aromatic and/or the highly conjugated DOM moieties (Del Vecchio and Blough, 2004).
FTICR-MS data show the aromaticity losses induced by irradiation match the SUVA2S4
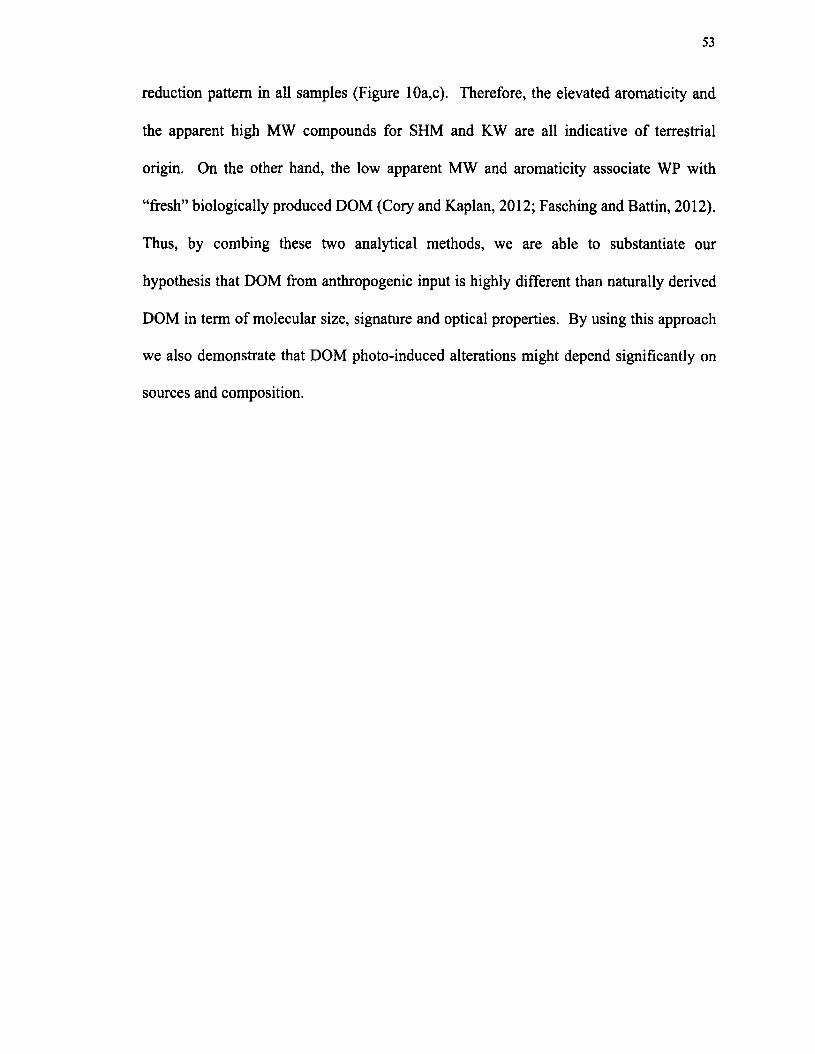
53
reduction pattern in all samples (Figure 10a,c). Therefore, the elevated aromaticity and
the apparent high MW compounds for SHM and KW are all indicative o f terrestrial
origin. On the other hand, the low apparent MW and aromaticity associate WP with
“fresh” biologically produced DOM (Cory and Kaplan, 2012; Fasching and Battin, 2012).
Thus, by combing these two analytical methods, we are able to substantiate our
hypothesis that DOM from anthropogenic input is highly different than naturally derived
DOM in term of molecular size, signature and optical properties. By using this approach
we also demonstrate that DOM photo-induced alterations might depend significantly on
sources and composition.

54
a)DOC
9000
8000
7000
6000
5000
4000
3000
2000
1000
0
fFinal DOC
41% ♦ K W 47% ♦ W P 45% ♦ S H M
10 20 30 40
b ) T D N
2 2000 Aejj 1500
** *
10 20 30 40 50 60
T im e (d a y s )
Figure 11. Total dissolved organic carbon concentrations (a) and total dissolved nitrogen
(b) versus irradiation time for SHM, WP, and KW samples.
3.2. Inorganic N species and DON
Light exposure has little to no effect on the TDN concentrations, that are similar
before and after light exposure (Figure lib ) , in agreement with previous studies by
Simsek et al. (2013). The fact that TDN remains constant is important from a mass
balance perspective because it indicates that the system remains a closed system with no
possible bacterial contamination throughout the experiment. While TDN remains
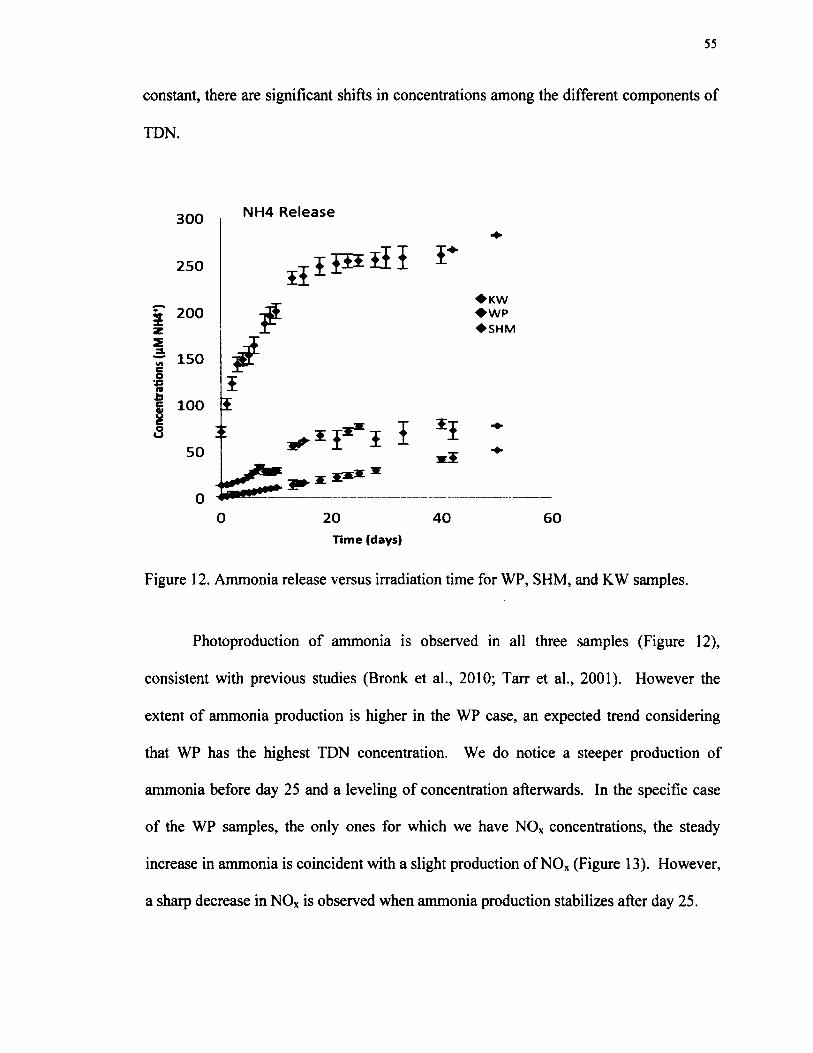
55
constant, there are significant shifts in concentrations among the different components of
TDN.
19
Ou
300
250
200
150 £
100 I
50►
H0 1
NH4 Release
5 1♦ k w♦ w p♦ SHM
20 40Tim e (days)
60
Figure 12. Ammonia release versus irradiation time for WP, SHM, and KW samples.
Photoproduction o f ammonia is observed in all three samples (Figure 12),
consistent with previous studies (Bronk et al., 2010; Tarr et al., 2001). However the
extent o f ammonia production is higher in the WP case, an expected trend considering
that WP has the highest TDN concentration. We do notice a steeper production of
ammonia before day 25 and a leveling o f concentration afterwards. In the specific case
o f the WP samples, the only ones for which we have NOx concentrations, the steady
increase in ammonia is coincident with a slight production o f NOx (Figure 13). However,
a sharp decrease in NOx is observed when ammonia production stabilizes after day 25.

56
300 I I* 1 t i i i I 2000 5s ! ! } i ! i *
I I 1 n t 1 ; !200
Q1500
? - . ' - . s£
100NH4+
50
• NOx* 500
' DON
o oO 5 10 15 20 25 30 35 40 45 50
T im « (d a y s )
Figure 13. Ammonia, NOx, and DON concentrations versus time for WP effluent.
Upon photodegradation, DON initially declines due to significant mineralization
o f the organic matter in the samples. This trend is observed before day 25 and coincides
with the buildup o f ammonia and N 0 X (Figure 13). After day 25, however, DON
concentrations show a reversal and start increasing while N 0 X concentrations decrease.
This can be explained by the reaction of either N 0 X or ammonia with DOM to produce
newly formed DON. While this explanation has been suggested previously by Helms et
al. (2013), it is additionally supported by state-of-the-art analytical and statistical
methods discussed below. Although, bulk analyses may show a significant
mineralization o f DON into bioavailable DIN, under light exposure, they lack the ability
to draw a clear picture o f the DON molecular changes when exposed to a long-term
photoirradiation. We used ESI-FTICR mass spectrometry along with PCA and the 2D

57
correlation statistical tools to elucidate theses changes more accurately where bulk
analyses do not.
3.4. ESI-FTICR-MS analysis
All obtained ultra-high resolution mass spectra o f DOM contain the routinely
observed complex pattern o f multiple peaks at each nominal mass over the studied range
(m/z 200-700) (Kim et al., 2003; Kujawinski et al., 2004; Sleighter and Hatcher, 2008b;
Stenson et al., 2003). We extracted exact formula assignments for the thousands o f peaks
in each sample and sub-categorized them according to their elemental make up as being
those o f DOC (formulas containing C, H, and O only) or DON (formulas containing N).
For WP, KW, and SHM, respectively, the initial percent contribution to total peaks, based
on numbers o f peaks, is 55%, 74%, and 74%, for CHO formulas and 16%, 19.7%, and
22.8% for N-containing formulas. Furthermore, the percent based on peak relative
magnitudes is 52%, 91%, and 90%, for CHO formulas, and 21%, 6%, and 9%, for N-
containing formulas for WP, KW, and SHM, respectively. This data shows a clear
difference between the wastewater effluent WP and the two other samples KW and SHM,
where the magnitude-weighted percentages for WP N-containing formulas are higher
than their corresponding number percentages, signifying that these formulas are for peaks
present at higher magnitudes in the FTICR mass spectra. Whether this indicates that their
corresponding molecules exist at higher concentrations in the original sample is
impossible to assess due to the unknown ionization responses o f these molecules and it is
beyond the scope o f our current ability to differentiate.
The assigned formulas can also be subcategorized into specific compound classes
in DOM using van Krevelen (VK) plots, two-dimensional plots o f O/C ratio versus H/C

58
ratio (Kim et al., 2003; Stubbins et al., 2010). The VK diagrams of the three initial
samples including all types of formulas before irradiation are shown in Figure 14. The
VK diagram shows WP comprising mainly aliphatic-like structures where 45% of the
assigned formulas plot in the aliphatic region o f the VK diagram (Perdue, 1984). On the
other hand, KW and SHM largely comprise molecules that are lignin-like or carboxylic-
rich alicyclic molecules (CRAM/lignin-like), where 60% and 58% of their formulas fall,
respectively, in this region o f the diagram (Hertkom et al., 2006). Moreover, changes in
carbon number, double bound equivalent (DBE), N/C, and O/C molar ratio confirm the
distinctive characteristics o f WP in comparison to SHM and KW (Figure 15). In fact,
while SHM and KW molecular patterns demonstrate extensive photobleaching indicated
by carbon backbone cleavage and loss of aromaticity (decrease in C number and DBE),
WP shows a shift from photobleaching to photohumification denoted by an increase in
carbon number and DBE after day 25, implying condensation o f LMW molecules to form
HMW molecules. Furthermore, the sharp increase in N/C molar ratio, in the WP case
after day 25, substantiates the photoinduced DIN incorporation hypothesis (Figure 15c).
Hence, our findings suggest that anthropogenic input will drive substantial variation in
riverine DOM, and, thus, estuarine optics and photochemistry and therefore
bioavailability (Fasching and Battin, 2012; Hopkinson et al., 1998; Ortega-Retuerta et al.,
2007).

59
v an Kreveton d iagram SHM
van K revalan d iagram KW
♦A liphatics♦ CR A M /lignin ♦ A ro m atic s ♦T ann in♦ O th e rs
Figure 14. van Krevelen diagrams o f WP, SHM, and KW, color coded to highlight the
formulas aligning in the regions o f the major biomolecular classes o f DOM. Pie charts
show the percent composition of each compound class for each sample.

60
a | ’ KW 10 b) , KW24 1 WP n i9.5 | « wpt
*O21
20
19
18
' SHM23 * , , ' 9 * * * ’ SHM
" * * * , ■ 8 S * ’ ?• „22 t * * „ * * *8
cJCD 7 5
6.5 , .6 * • « » «
5 Ss
0 10 20 30 40 SO 60T.me (days) T,me (days)
10 20 30 40 SO 60
0.03S c) OSS d )
0 03
0.02S I, 0 02 ' , ‘ , • » KW' * * •! 0 015
OS
0.4S
04• SHM (
00 1 tI ■ ........................................ • • • 1 ' 0.35
0 005< KW • WP SHM
0 0 30 10 20 30 40 50 60 0 10 20 30 40 SO 60
Time (days) Time (days)
Figure 15. Magnitude-weighted (a) carbon number, (b) DBE, (c) N/C, and (d) O/C values
for WP, SHM, and KW samples with irradiation time.
3.5. Statistical analysis
3.5.1. Principal component analysis
Molecular changes occurring during irradiation are recorded by measuring the
disappearance and appearance o f specific molecular formulas in the FTICR-MS data set
for each sample. By individually applying PCA analysis to each o f the 13-time series of
each sample using CHO formulas or the N-containing formulas as the variables, we can
identify molecules associated with the photo-labile and photo-produced pool o f DOM
from each source while photoirradiation progresses. The resulting PCA biplots, using
CHO formulas as variables, are shown in figures 16-18. The biplots o f the scores (i.e.,
61
Figures 16a-18a) represent the projections of the original samples onto each principal
component (PC). However, the variables’ loadings (i.e., Figures 16b-18b) signify the
projections of all the chosen variables (i.e., the relative magnitude of the WP-CHO
formulas) against each PC (i.e., PCI and PC2), which explains the variable’s contribution
to samples variability along each PC. PCI and PC2 explain -53% and 16% of the
variance for WP-CHO and 63% and 25% for SHM-CHO compounds, and 62% and 12%
for KW-CHO. The high values o f PCI and PC2, for the three samples, imply a linear
relationship between the two PC components, and suggest that the majority o f the
photoirradiated sub-samples can be included in a two dimensional space (Sleighter et al.,
2010). According to the three samples’ scores (Figures 16a-18a), the PCA analysis
separated the irradiated subsamples along PCI, where the initial sample (0) had a very
high positive PCI score and the final sample (50) had the lowest PCI score. It is also
clear that the sub-samples can be grouped into three area clusters, area 1 (A l) denotes
sub-samples at early stages o f photodegradation including the untreated sample, area 2
(A2) represents sub-samples at the middle stages o f the photodegradation experiment,
and area 3 (A3) characterizes sub-samples at the end o f the experiment. By relating the
location o f the scores o f the samples (Figures 16a-18a) and the juxtaposed formulas from
the variables’ loading (Figures 16b-18b), corresponding to A l, A2, and A3 in each
sample, we can extract formulas that are enriched in samples o f each area cluster, and by
plotting theses formulas on VK diagrams, we can extrapolate changes occurring at the
molecular level as the photodegradation progresses. By plotting formulas contained in
each boxed area cluster, the resulting VK diagrams (panels (c-e) in Figures 16-18) show
clusters in specific regions o f the diagram associated with each area. Thus, the clusters

62
indicate which type o f formulas explains most o f the variance in PCA.
i0.8
b)
£ *i------- 1 W= l l ! -0.5_ I
II. J
0.2
0 ■ - 0.2 0
-0.4
- 0.6 - 0.8
0.99
-0.04
B
0.04
A-0iW ♦ *I ♦ • ’ *♦ « I «* ♦*. ♦
PC2(I6%)
c) van Krevelen diagram of WP CHO formulas
2 5
-0.06PC2|I6%|
enriched in A1 samplesdi van Krevelen diagram of WPCHO
formulas enriched in A1 and A2 2 5 samples
cl 2 5
van Krevelen diagram of WP CHO formulas ennched in Al, A2 and A3
samples
1.5
0 5
0
2
1.5
1
0.5I* .
0.5
♦A l ♦Al *A2
Oxidation
♦A l «A2 *A3
0 2 0 4 0 6 0 8 1 0 0.2 0 4 0.6 Of0/C o/c
1 0 0 2 0.4 0 6 Of
O/c
Figure 16. PCA results using the relative magnitudes o f all WP-CHO formulas showing
the biplot o f the sample scores (a) and variable loadings (b), along with the van Krevelen
diagrams o f the CHO formulas included in the colored boxed areas (c-e).
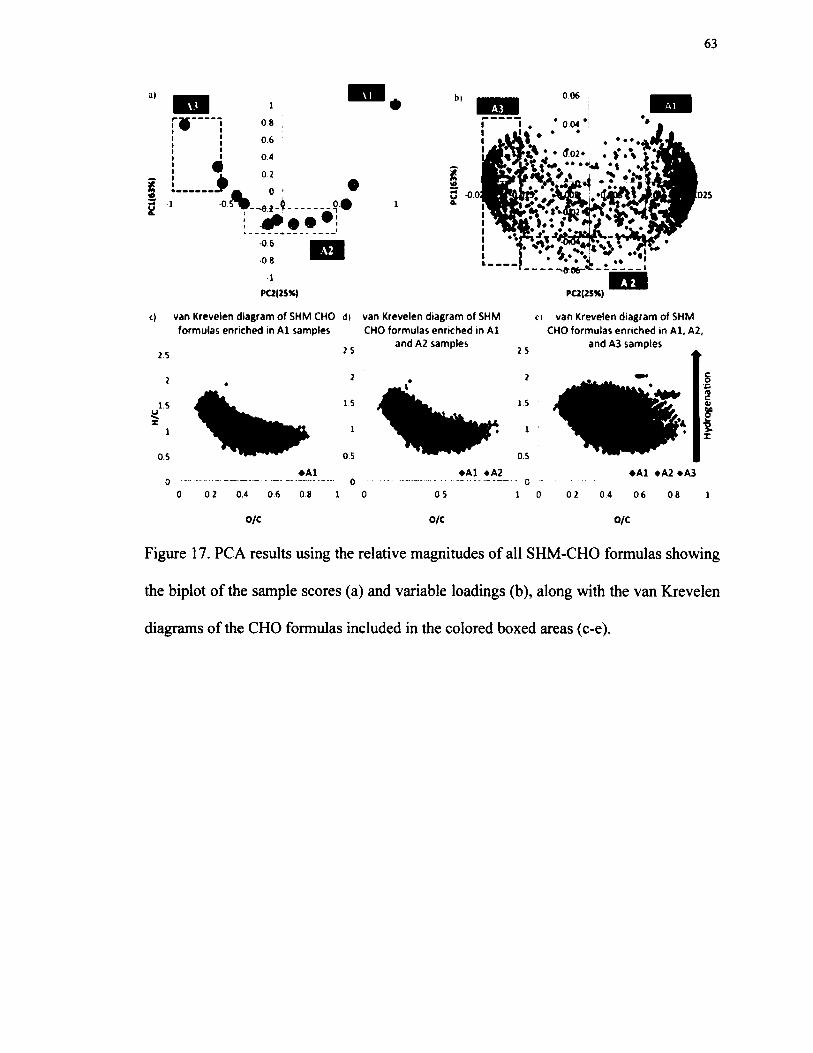
PC2(2S%) PC2(2SK)
c) van Krevelen diagram of SHM CHO di van Krevelen diagram of SHM c> van Krevelen diagram of SHMform ulas enriched in A l sam ples CHO form ulas enriched in A l CHO form ulas enriched in A l, A2,
and A2 sam ples and A3 sam ples2.5 2 5 2 5
w w * *0.5 '* " • 0 5 0.5
♦A l ♦ A l *A2 ♦ A l »A2 PA30 - — - 0 - - - - 0 - ............................
0 0.2 0.4 0 6 0.8 1 0 0 5 1 0 0 2 0 4 0 6 0 8 1
O/C o/c o/c
Figure 17. PCA results using the relative magnitudes o f all SHM-CHO formulas showing
the biplot o f the sample scores (a) and variable loadings (b), along with the van Krevelen
diagrams o f the CHO formulas included in the colored boxed areas (c-e).
Hyd
roge
natio
n
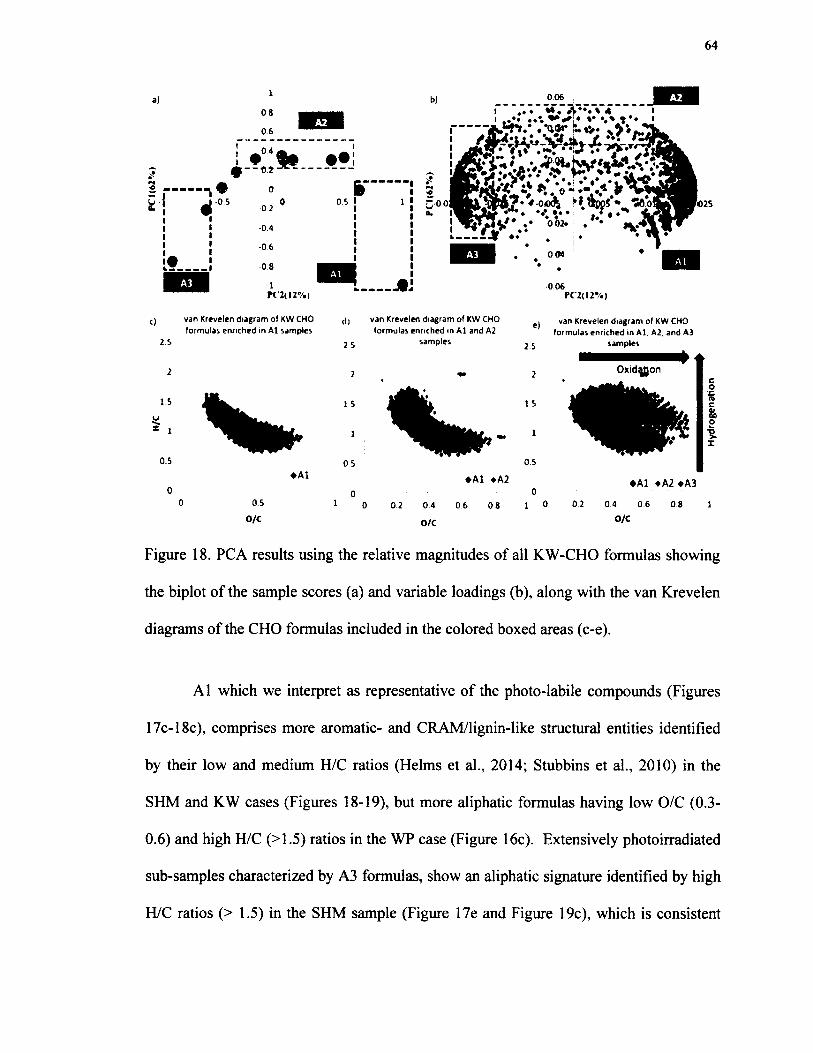
64
006I ”, ' *» .” A’*r.V 4 1 .V . ’ * * • * * * ' * . * » * • .
i— ■*#'*•* ♦>sr
£ !- j #. o s
-0.2
-0.4
-06
- 0.8
-1PC2(I2%)
van Krevelen diagram of KW CHO formulas enriched in Al samples
0 5 025
2.5
1.5
0.5
di
2 5
van Krevelen diagram of KW CHO formulas enriched <n Al and A2
samples
V. Ve)
2.5
15
0 0 6P('2(12% )
wan Krewelen diagram of KW CHO formulas enriched in Al. A2, and A3
samples
»• *
Oxidatjon
♦ A l
05O/c
0 5
01 0
0 5
♦Al «A2 ♦A l *A2^A3o0.2 0 4 0 6 0 8 1 0 0 2 0 4 0 6 0 8 1
o/c ° /c
Figure 18. PCA results using the relative magnitudes o f all KW-CHO formulas showing
the biplot o f the sample scores (a) and variable loadings (b), along with the van Krevelen
diagrams of the CHO formulas included in the colored boxed areas (c-e).
A l which we interpret as representative o f the photo-labile compounds (Figures
17c-18c), comprises more aromatic- and CRAM/lignin-like structural entities identified
by their low and medium H/C ratios (Helms et al., 2014; Stubbins et al., 2010) in the
SHM and KW cases (Figures 18-19), but more aliphatic formulas having low O/C (0.3-
0.6) and high H/C (>1.5) ratios in the WP case (Figure 16c). Extensively photoirradiated
sub-samples characterized by A3 formulas, show an aliphatic signature identified by high
H/C ratios (> 1.5) in the SHM sample (Figure 17e and Figure 19c), which is consistent

65
with recent observations from wetland-derived DOM subjected to photo-irradiation
(Rossel et al., 2013). In contrast, the WP sample reacts quite differently under photo
irradiation with most o f the A3 formulas trending to higher O/C (Figure 16e and Figure
19d). Such a trend indicates that photooxidation is rendering the DOM in the WP more
oxygenated. The KW sample, however, shows A3 enclosing both more aliphatic and
more oxygenated formulas, influenced by the presence o f both anthropogenic and natural
DOM. The trend towards higher O/C appears to be less pronounced in the SHM case and
it probably indicates that photooxidation o f natural DOM from SHM is not as extensive
as in the WP and the KW cases that contain more anthropogenic DOM. We suggest that
the DOM from these two samples is more prone to photooxidation because it contains
molecules that are photo-labile and are more readily oxidized due to their anthropogenic
nature. The SHM sample has already undergone some photooxidation prior to sampling
and may be less prone to further photooxidation. What we do observe is an apparent
hydrogenation trend in the SHM case, an oxidation trend in the WP case, and the
combination o f both trends in the KW cases (Figures 16e-18e), as the photoirradiation
progresses. These two trendlines might define some important transformations o f the
DOM from complex structural entities to aliphatic molecules in the SHM and the KW
cases or extensively oxidized molecules that could be easily digested by biota in the WP
and the KW cases. Area 2 (A2), which is confined between A l and A3 in both VK
diagrams, comprises formulas that have H/C and O/C ratios intermediate between the
photo-labile entities and the photo-produced entities

66
a)
# 20
CHO form ulas b)
CHO form ulas
b
■ W P ■SHM ■ KW d>
% *
CHO form ulas
CHO form ulas
LFigure 19. Bar diagrams showing the percent contribution o f CRAM/lignin-like formulas
(a), aromatic formulas (b), aliphatic formulas (c) and tannin formulas (d) in the 3 selected
colored areas o f the PCA biplots shown in Figures 16-18 for the WP, KW, and SHM.
The PCA plots o f N-containing formulas, for both WP and SHM samples, show
similar trends as those o f the CHO formulas, where the inferred oxidation trend prevails
in the WP case and the hydrogenation trend dominates the changes in the SHM sample
(Figures 20e-22e). However, A2, which characterizes the transition between
photodegradation and photoproduction shows a high density o f formulas, for both WP
and SHM, in comparison to A l and A3 areas (panels (c-e) in Figures 20-22). The CHO
formulas do not show this similar phenomenon. This is an indication that photochemistry
plays a role in mediating DIN reactions and incorporating DON into the DOM (as shown
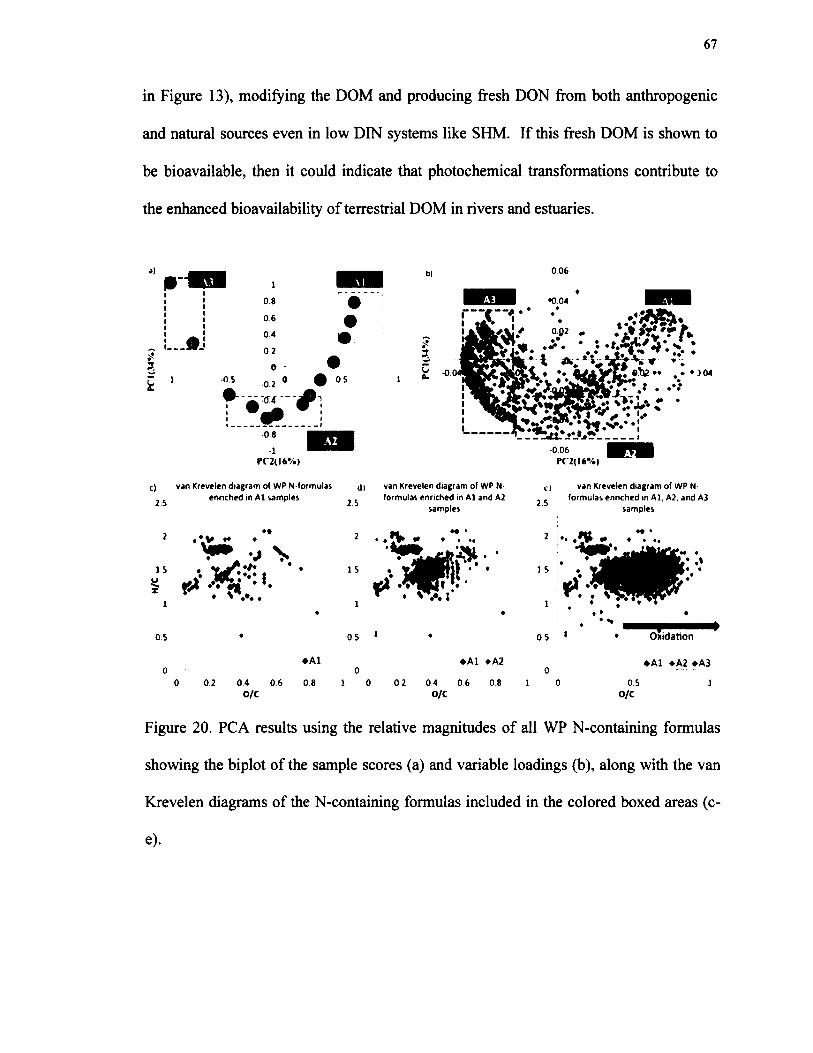
67
in Figure 13), modifying the DOM and producing fresh DON from both anthropogenic
and natural sources even in low DIN systems like SHM. If this fresh DOM is shown to
be bioavailable, then it could indicate that photochemical transformations contribute to
the enhanced bioavailability o f terrestrial DOM in rivers and estuaries.
-OS
*
10.8
0.6
0.4
0.2
0 -0 2
. -CT4 '
0 0 6
% 05
PC'2(16%)
c) van Krevelen diagram of WP N-formulas dl van Krevelen diagram of WP N
•0.04
! 1
P('2(I6% )
2 5 ennched in Al samples
1 .tV •• *a S .
,s •. 'U L 'v i • • •% *
0.5
2 5
15
0.5
formulas enriched in Al and A2 samples
•1 H *• «• ♦ ♦ ••
v j i g p - '•t o ,'-
2.5
van Krevelen diagram of WP N formulas enriched in Al. A2. and A3
samples
♦A l
0 2 0 4 0 6 0 8O/c
01 0
♦A l «A2
0 2 0 4 0 6 0 8 1O/C
V"Oxidation
♦ A l *A 2*A 3
0.5O/c
Figure 20. PCA results using the relative magnitudes o f all WP N-containing formulas
showing the biplot o f the sample scores (a) and variable loadings (b), along with the van
Krevelen diagrams o f the N-containing formulas included in the colored boxed areas (c-
e).

68
006
- »~ i?3!
k 1■05
1 08 0 6
0.4
0.2
O -0.2 1
: tss'
%t o
rn• 0.5
-0.8
PC 2(I6% )
[ r j
PC 2(I6% )
c ; *<• * • . ..v r * • .
• 0 0 4
c) van Krevelen diagram of SHM N formulas enriched in Al samples
2 5
M '15u
0 5
0♦Al
0.2 0.4 0.6 0 .8
O/C
d)
2 5
*2
15yz1
0 5
0 1 0
va n Krevelen diagram of SHM N e , van Krevelen diagram of SHM Nformulas enriched in Al and A2 samples formulas enriched in Al, A2. and A3
2 5 samples
0.2
♦Al eA2
0.4 0 6 0 8
O/c
♦A l *A2 *A3
1 0 0 2 0.4 0.6 0 8 1
O/c
Figure 21. PCA results using the relative magnitudes o f all SHM N-containing formulas
showing the biplot o f the sample scores (a) and variable loadings (b), along with the van
Krevelen diagrams o f the N-containing formulas included in the colored boxed areas (c-
e).
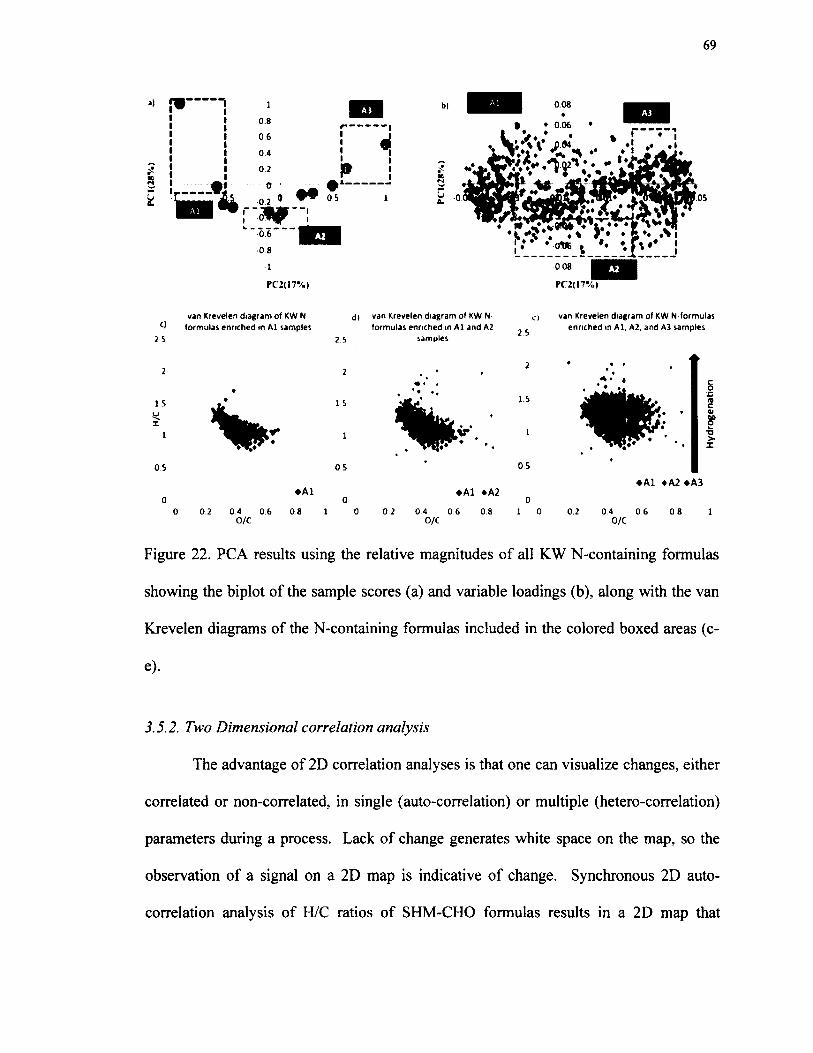
van Krevelen diagram of KW N formulas enriched in Al samples
d» van Krevelen diagram of KW N formulas enriched in Al and A2
samples 2.5
van Krevelen diagram of KW N formulas enriched in Al, A2, and A3 samples
2 5 2 5
ViI
IS 1 5
OS 0 5 0.5
♦ A l *A2 eA3♦ A l eA20 0 0
0 0 2 0.4 0 6 0.8O/C
0 0 2 0 4 0.6O/C
0.8 0 0.2 0.4 0.6 0 8O/C
Figure 22. PCA results using the relative magnitudes o f all KW N-containing formulas
showing the biplot of the sample scores (a) and variable loadings (b), along with the van
Krevelen diagrams of the N-containing formulas included in the colored boxed areas (c-
e).
3.5.2. Two Dimensional correlation analysis
The advantage o f 2D correlation analyses is that one can visualize changes, either
correlated or non-correlated, in single (auto-correlation) or multiple (hetero-correlation)
parameters during a process. Lack of change generates white space on the map, so the
observation o f a signal on a 2D map is indicative o f change. Synchronous 2D auto
correlation analysis o f H/C ratios o f SHM-CHO formulas results in a 2D map that

70
highlights the major changes in the H/C ratios of formulas for SHM samples induced by
increasing photoirradiation exposure time (Figure 23). The intensity along the diagonal
line represents the auto-correlation at each H/C ratio with itself. In this case intensity
measures the number of formulas measured and is not the intensity o f the individual mass
spectral peaks. The off-diagonal cross peaks represent the cross correlation intensity
(number o f formulas) between the different H/C ratios. Cross peaks are color-coded to
indicate positive (red color) or negative correlation (green color). The intensity along the
diagonal line o f Figure 23a is greatest at H/C ratios of 0.50-1.25 and at H/C 1.60-1.80,
indicating that most o f the changes occur in these regions upon irradiation. The cross
correlation (off-diagonal) signals reveal that the formulas that fall in the region of H/C
0.50-1.25 have positive correlations (red color) with other peaks in this region. Upon
closer inspection of the FTICR-MS data for each sub-sample, it is clear that the number
o f molecular formulas in this region actually decreases with photoirradiation exposure
time. On the other hand, the formulas in the H/C 0.50-1.25 region shows a negative
correlation (green color) with the changes in number of formulas at H/C 1.60-1.80, which
suggests that as compounds with H/C ratios of 0.5-1.25 are photodegraded, new
compounds with higher H/C ratios are photoproduced. Furthermore the lack of intensity
at the diagonal and off-diagonals at H/C ratios of 1.25-1.50 implies that these formulas do
not display significant changes in number of formulas during photoirradition. A close
look at the VK diagrams of the SHM sample verifies the presence o f these formulas in all
the SHM sub-samples. This indicates the formulas at H/C 1.25-1.50 belong to a
photoresistant pool of compounds. We do not know whether there are diminutions in
peak intensities caused by photoirradiation because the correlation is not based on peak

71
intensity but numbers o f formulas.
2 3 0 ,
2.25
200
1.7$
I JO gl.2$j
IjOO
0.7$
0.S0 00$
a) SHM CHO Form ulas
=2:25 : 1::* : *. .
•ttr
2 3 0
20$
2JOO
i.7$|
1J0
g 10$
100 0.7$;
o.so;
0 0 5
b) WP CHO F orm ulas
• i i $ i ~ti*. «
2.50ri
20$;
200| 1.7$!
1.00
jj 105
100 0.7$; 0.50'
0051
00$ OJO 0.7$ 100 10$ 1J0 1.75 200 205 2.50 HC
00$ OJO 0.7$ 100 10$ 1J0 1.7$ 200 205 2JOh*C
c) SHM N -conta in ing Form ulas2.90
20$
200
1.7$
1.50
| 10$
100 0.75
OJO
005
d) W P N -conta in ing F orm ulas
I
005 OJO 0.7$ 100 109 1J0 1.7$ 200 205 2JO MIC
005 0.90 O il too l o t 1.90 17* 200 2 i$ 2.90
Figure 23. The H/C vs. H/C synchronous plots generated by applying 2D correlation on
the a) SHM CHO formulas, b) WP CHO formulas, c) SHM N-containing formulas, and
d) WP N-containing formulas. The correlation was based on the presence/absence of
each individual formula as the irradiation time progresses. Red indicates a positive
correlation, while green indicates a negative correlation.
In the case o f WP CHO formulas (Figure 23b), the change in number o f formulas
at H/C 1.75-2.00 shows the highest auto-correlation, followed by H/C 0.80-1.25, then at
H/C 1.50-1.75. The cross correlation signals and the FTICR-MS data sets reveal that
while formulas with the highest and lowest H/C ratios are photodegraded, formulas with

H/C ratios at 1.50-1.75 are photoproduced. Similar to SHM samples, the lack o f the
diagonal peaks at H/C ratios 1.25-1.50 implies that these CHO formulas are likely to be
the photoresistant pool of compounds in the DOM. These maps also suggest that while
the photodegradation o f CHO formulas is intense (the intensity o f the diagonal peak is
high indicating a high loss of formulas in this range), the photoproduction indicated by
negative cross peaks is weak. However, when we apply the 2D correlation to the N-
containing formulas (Figure 23c,d), an opposite trend is observed, where the
photoproduction o f N-containing formulas is intense even in the SHM case, where SHM
is relatively N-poor compared to the WP effluent. The intensity along the diagonal line
o f figures 23c,d indicates that most o f the changes in the number o f SHM and WP N-
containing formulas occur at H/C 1.25-1.75. In contrast to the changes noted above for
CHO formulas, the FT-ICR-MS data for each subsample reveals that the number of
molecular formulas in this region increases with photoirradiation time. A negative
correlation is observed at H/C 0.80-1.20 and at 1.75-2.00 with the change in the number
o f formulas for SHM and WP, respectively. This is an indication that photochemistry is
altering the molecular structure o f DOM in almost a similar fashion regardless o f the
source. Furthermore, photochemistry plays a key role in producing new DON
compounds, some of which might be bioavailable when released in rivers and estuaries.
In the case o f wastewater effluent DOM like WP, photochemical alteration o f the
released DOM is producing new compounds. If the latter are utilized as food sources for
organisms, then one can argue that the released DON cannot be considered refractory N.
Another synchronous 2D correlation analysis was employed to examine the auto
correlation between the number of carbons in each formula, examining both CHO and N-

containing formulas for both SHM and WP datasets using the photoirradiation exposure
time as the external perturbation parameter. The 2D correlation clearly classifies the
SHM CHO formulas into three regions (Figure 24a). The first region includes the
formulas that have a carbon number between 10-13. The number of such formulas
increases as photoirradiation progresses. In the opposite direction, there is a decrease in
the number o f formulas with carbon number between 16-35. At the same time, the
number o f formulas that fall into the third region (carbon number between 14-16) shows
no significant changes with photoirradiation, which implies a pool o f photoresistant
compounds.

74
alSHM CHO F orm ulas b W P CHO F orm ulas
rNo 01 Cartoon
41
40
15
rO 25 *| 20
15
10
5
c)SHM N -conta in ing Form ulas d)W P N -conta in ing F o rm ulas
40
II2025
[ 20
IS10
5
I I
1 1 Q 1 S 20 2 S 3 0 K 40 4 5 S ONo. of Cartoopn
S 1 1 1 S 2 0 2 S J 0 1 S 4 0 4 S S 0No of Carbon
Figure 24. The carbon number vs. carbon number synchronous plots generated by
applying 2D correlation on the a) SHM CHO formulas, b) WP CHO formulas, c) SHM
N-containing formulas, and d) WP N-containing formulas. The correlation was based on
the presence/absence of each individual formula as the irradiation time progresses. Red
indicates a positive correlation, while green indicates a negative correlation.
The WP CHO formula map shows four distinct regions (Figure 24b); the first
region with carbon numbers between 10-13 shows an increase in number o f formulas,
while the second and the third regions with carbon numbers between 17-33 and carbon
number 35 exhibit a decrease in number o f formulas as photoirradiation progresses. The
fourth region with carbon numbers between 39-45 displays little to no change in number

75
of formulas. Likewise, formulas with carbon numbers between 14-16 exist in all the FT-
ICR-MS data sets of WP CHO compounds but are missing in the 2D correlation maps,
which imply a resistant pool. These maps suggest an aggressive photodegradation of
CHO formulas with carbon number between 17-33 for both samples, which is indicated
by the highly intense diagonal peaks in both maps.
In the same fashion, WP N-containing formulas with carbon number between 11-
23 show an intense rate o f photoproduction while the photodegradation o f the higher
carbon number formulas (>35) is either weak or missing (Figure 24d). In comparison,
SHM N-containing formulas show a moderate photoproduction o f formulas with carbon
numbers between 12-28 while the photodegradation of formulas with carbon numbers
between 29-31 is more intense. This difference in the photoproduction rate o f new DON,
between SHM and WP, is probably due to the difference in their DIN contents (Figure
lib ) . It is likely that photochemistry plays a significant role in producing new DON
from SHM, which is a relatively N-poor sample, a fact that is hardly observed when
using classical bulk analytical and statistical measurements (e.g., nutrient analysis and
cluster analysis). By using state-of-the-art analytical and statistical tools, we are able to
demonstrate that photochemistry is a continuum process that transforms DOM and DON
from complex structural entities to aliphatic molecules in some instances and more
oxygenated molecules in other instances. We speculate that these transformed molecules
may be more readily digested by biota. Therefore, we are able to validate that
photochemistry is one o f the main processes that shapes the DON quality in aquatic
systems.

76
CHAPTER IV
THE BIOAVAILABILITY AND REACTIVITY OF DISSOLVED ORGANIC
MATTER DERIVED FROM DIFFERENT SOURCES IN THE YORK RIVER,
CHESAPEAKE BAY
PREFACE
The content of this chapter is in preparation to be submitted to Water journal
Contributions: Rajaa Mesfioui developed experimental design with assistance from Dr.
Margaret Mulholland and Dr. Patrick G. Hatcher. Dr. Hussain Abdulla is an expert on the
two-dimensional correlation statistical analysis and provided assistance in displaying FT-
ICR-MS results in 2D correlation maps. Dr. Thais Bittar performed flow cytometric
analysis. Wastewater effluent was collected with the assistance o f Dr. Charles Bott of
Hampton Road Sanitation District. Nitrites+Nitrates wet analysis were measured with the
generous help o f the Dr. Kenneth Moore o f Virginia Institute o f Marine Science. All
samples were prepared, processed, and analyzed by Rajaa Mesfioui. The paper is written
by Rajaa Mesfioui and is in preparation pending comments by the co-authors.
1. INTRODUCTION
Dissolved organic matter (DOM) can be a source of labile organic carbon
(Hedges et al., 1997; Wetzel, 1992) and nitrogen (Wiegner et al., 2006) for microbial
communities in coastal areas. Terrestrially derived DOM undergoes various biological
and photochemical transformations in riverine ecosystems before its residual, and most
refractory portion, is discharged into the oceans (Amon and Benner, 1996; Asmala et al.,
2013; Bertilsson et al., 1999). Recent evidence suggests that terrestrial DOM is utilized
within streams and rivers, as well as within the estuarine and coastal receiving waters
77
(Benner et al., 1995). Consistent with this, budgets show that the amount o f carbon
delivered to the oceans from rivers is only a small portion o f the amount o f carbon that
enters rivers from terrestrial environment and watersheds (Aufdenkampe et al., 2011;
Seitzinger et al., 2005a). Because of the high rates o f respiration and processing of
terrestrial DOM, rivers and estuaries are among the highest emitters o f CO2 per unit area
(Cole et al., 2001). DOM components may be respired by bacteria or incorporated into
microbial and higher organism food webs (Dagg et al., 2008; Del Giorgio and Pace,
2008; Nakagawa et al., 2007) serving as C, N, and P sources. However, the lability of
DOM and its subcomponents dissolved organic carbon (DOC) and nitrogen (DON), has
been shown to vary largely according to the biochemical composition (quality) and
source of constituent DOM (Benner, 2003; Lu et al., 2013; Wiegner et al., 2006). The
quantity and quality of DOM discharged into rivers and streams, and ultimately its fate
and dynamics in aquatic systems is greatly affected by land-use (Aufdenkampe et al.,
2011; Kaushal et al., 2014), and an increase in microbial activity has been observed in
human impacted watersheds relative to those with less anthropogenic input (Hosen et al.,
2014; Rabalais et al., 2002; Williams et al., 2010; Wilson and Xenopoulos, 2013).
Understanding microbial transformation and utilization of DOC and DON in aquatic
ecosystems is a crucial step in deciphering the interrelationships between dissolved
organic C and N cycles, and how they vary among different DOM source materials, and
ultimately in gaining a better understanding of processes contributing to eutrophication
and poor water quality. Bulk analyses of the DOM pool do not afford a molecular level
understanding o f DOC and DON and its reactivity (Bronk et al., 2010; Filippino et al.,
2011). In addition, land-use and salinity affect the chemical composition o f the DOM

78
such that the quality o f the DOM and its biological reactivity are different or altered.
Mesfioui et al. (2012) showed that DOM reactivity in two wastewater effluents (one of
which discharges into the nearby James River) can be masked if only bulk chemical
analyses are examined, mainly because the uptake and production o f DON and DOC
compounds can occur at similar rates with no net change in DOM concentrations;
molecular-level characterization of DOM was necessary to evaluate the extent of
transformations, consumption and production of specific compounds. Molecular-level
characterization of DOM can be done using electrospray ionization coupled to Fourier
transform ion cyclotron resonance mass spectrometry (ESI-FTICR-MS) (Mesfioui et al.,
2012; Sleighter et al., 2014). In the present study, we examined molecular-level chemical
transformation o f three natural and anthropogenic sources of DOM found in the York
River watershed in natural York River water samples and their resident microbial
communities. Bulk measurements and molecular-level characterization (using ESI-
FTICR-MS) o f DOC and DON were combined to identify shifts in DOC and DON
associated with biological degradation. Findings from this research will enhance our
understanding o f the DOM biodegradation and chemical reactivity to better assess the
effects o f DOM on coastal ecosystems and water quality.
2. EXPERIMENTAL PLAN
2.1. DOM sample collection and handling
DOM was collected from three distinct DOM sources o f the York River watershed,
Virginia, USA; the Sweet Hall Marsh (SHM), Taskinas Creek (TC) and the effluent from
a wastewater facility in Yorktown (YT). The SHM is a representative o f the typical
marshes and tidal swamps that surround the Pamunkey River, a major tributary o f the

York River. TC is also a tributary o f the York River and receives runoff from an oak-
hickory forested site, maple-gum-ash swamps, and freshwater marshes in York River
state park. The wastewater treatment facility o f YT is a relatively large plant (~13
million gallons per day) located in the Hampton Roads Sanitation District. The plant
receives variable domestic and commercial wastewater and uses primary clarifiers,
conventional plug flow nitrifying activated sludge, deep bed denitrifying filters with
methanol addition, gravity thickening for primary sludge, dissolved air flotation for
waste-activated sludge thickening, anaerobic digestion, centrifuge dewatering, and
hypochlorite disinfection and de-chlorination processes. The average total nitrogen (TN)
o f YT effluent is around 5.9 mgN/L (Bott, 2014).
Samples from TC and SHM, were collected on August 12, 2012. The sample from
YT was collected downstream of the biological process but before disinfection, and was
integrated over 24h period on N ovem ber 9, 2011. All samples were filter-sterilized on
site using 0.2 pm polysulfone cartridges (pre-conditioned for 5 min with each sample) to
remove cells and most colloidal material. All samples were placed into high-density
polyethylene carboys, packed into coolers chilled with ice packs, and transported to Old
Dominion University within 2 hours. Upon arrival to the laboratory, samples were
concentrated from 40L to 1 L for TC, from 35L to 1 L for SHM, and from 30L to 1 L for
YT, using a rotary evaporator system at T< 35 °C. Samples were concentrated to achieve
amendments o f about 10 pMN in natural water samples with less than 10% dilution of
the natural water. After concentration, samples were frozen at - 20°C until bioassay
initiation.
80
2.2. Bioassays
2.2.1. Natural water samples
Natural water was collected from the York River on May 26, 2013, from two
stations, within the mesohaline section o f the York River (S2= 5%o, and S3= 12.5%o).
Approximately 120 L o f whole water were collected from each station, and was screened
with a 20pm acid cleaned nylon mesh to remove large organisms. The mesohaline
section o f the York River was selected because it is often subjected to an annual
summertime hypoxia and anoxia directly related to salinity-based stratification o f the
water column in combination with high levels of autochthonous DOM and a very high
abundance o f metabolically active bacteria.
York River water was diluted with 0.2 pm filtered from the same site to reach
chlorophyll a (Chla) concentration o f 8-10 pg/L. The dilution was performed to prevent
nutrient limitation o f microbial community growth and prevent excessive accumulation
o f biomass over the 7 days experiment.
2.2.2. Treatment and control incubation
Controls contained diluted York River water medium from stations S2 or S3
(Ctrl-S2 and Ctrl-S3) without any added DOM. Concentrated DOM from YT, SHM, and
TC (2.3, 5.2 and 5.2 mL, respectively) was added to 500 mL of the diluted York River
water medium to achieve a TN addition o f lOpM in each incubation bottle. Duplicate
Ctrls and DOM-amended bioassays were incubated for 7 days at in situ light and
temperature conditions, in a floating cage tethered to a dock in the Lafayette River near
Old Dominion University.

81
2.2.4.Bioassay sampling
The Ctrls and each DOM-amended bioassay were sampled twice on the first day
o f incubation, at time zero (To) and after 4 hours (Ti), and once daily (at 10:00 AM) for 6
consecutive days. At each time point, samples were collected for measurements o f Chla,
TDN, DOC, nitrate and nitrite (NOx), and ammonia (N H 4) concentrations and for
qualitative analysis o f DOM by ESI-FTICR-MS (described below).
2.3. Bulk analysis
2.3.1. Nutrients analysis
Bulk DOC and TDN concentrations were measured in duplicate on the filtered
samples using the high temperature combustion catalytic oxidation method (Shimadzu
TOC/TN-5000) (Peltzer et al., 1996). N H 4 concentrations were analyzed using the
phenol hypochlorite colorimetric method (Hansen and Koroleff, 2007). NOx
concentrations were measured using the diazotization and the cadmium reduction
spectrophotometric method (Parsons et al., 1984) using the SKALAR SAN plus System
at the Analytical Service Center o f the Virginia Institute o f Marine Science (Gloucester,
VA). DON concentrations were determined by subtracting the concentrations of NOx
and N H 4 from TDN concentrations (Bronk et al., 2000). All analyses were performed on
0.2 pm-filtered aliquots.
2.3.2. Chla and bacteria abundance
To measure Chla concentrations, cells were collected onto 25 mm Whatman GF/F
filters under low (< 15psi) vacuum pressure. The filters were immediately immersed in
10 ml o f 90% acetone and placed in darkness at 4°C to extract the pigments. After 24 h,
the tubes were vortexed and the fluorescence of the acetone extract was measured in

82
duplicate on a Turner Design Model 10-AU fluorometer (Welschmeyer, 1994).
Samples collected to enumerate heterotrophic bacteria cell abundance (cell/mL) were
preserved with 0.125% glutaraldehyde (final concentration) and then frozen at -80°C for
flow cytometric analyses (Vaulot et al., 1989). Samples were shipped overnight to the
Skidaway Institute o f Oceanography for analysis. Prior to analysis, samples were thawed
in ice and stained for 30 min with SYBR Green I (lOOx final concentration), which is a
dye that binds specifically to nucleic acids and can be excited by blue light (488 nm
wavelength) (Marie et al., 1997). Standard fluorescent polystyrene beads (1.0 pm
diameter) were added to each sample as internal standards and was used to access run
reproducibility. Flow cytometric analyses were performed on a Becton Dickinson
FACSCalibur flow cytometer, equipped with a 15 mW air-cooled argon-ion laser tuned
for blue excitation (488 nm). Data were collected in list mode with CellQuest Pro and
post-run analyses were done with Flowing software.
2.4. ESI-FTICR-MS Analyses
DOM samples for ESI-FTICR-MS were desalted prior to analysis using solid
phase extraction cartridges (Agilent, Bond Elut PPL) Dittmar et al. (2008). The cartridge
(after desalting but before DOM elution) was kept at -20 °C for 1-2 weeks before
analyses. All MS analyses were performed at the College o f Sciences Major
Instrumentation Cluster (COSMIC) at Old Dominion University using an Apollo II ESI
ion source coupled to a Bruker Daltonics 12 Tesla Apex Qe FTICR-MS. Prior to analysis,
the instrument was externally calibrated using polyethylene glycol. Right before
introduction to the ESI, each sample was eluted from the PPL cartridge using 4 mL of
LC-MS grade methanol and then diluted with LC-MS grade water to a uniform TOC

83
concentration (-10 mg/L C). Samples were then spiked with 0.1% ammonium hydroxide
(increasing the pH to 8) to increase the ionization efficiency. Sample flow rate (2
mL/min) was maintained using a syringe pump and the ESI voltages for each sample
were maintained at 3.4 kV on the spray shield and 4.1 kV on the capillary at 200 °C in
order to maintain a consistent ion current entering the capillary to the MS.
All samples were analyzed in negative ionization mode to minimize
complications due to sodium adduct formation. Electrospray voltages and MS parameters
were held constant throughout all experiments. Ions were accumulated in a hexapole for
a period of 2 s before transfer to the ICR cell. This accumulation time was found to be
optimal; because shorter ion accumulation times resulted in fewer peaks with lower S/N,
while longer times led to poor resolution. For each sample, 300 time-domain transients
were acquired (at 4M Word), co-added, zero-filled once, sine-bell apodized, and then
Fourier transformed using the Bruker data analysis software, resulting in an overall
analysis time o f approximately 30 minutes per sample.
2.5. Mass calibration and molecular formula assignments
The general mass distribution of compounds that were ionized in all samples was
in the range of 200-700 m/z, which is consistent with previous DOM studies using ESI-
FTICR-MS (Koch et al., 2005; Sleighter et al., 2008b). Because low m/z peaks (<200)
have very high frequencies, the excitation required to increase the ion radius to a
sufficient amplitude in order to induce enough current to be detected by the detection
plates is more difficult. Furthermore ions below 200 are discriminated against in the
quadrupole, where ions of a broad specified m/z range are allowed to pass through before
being accumulated in the hexapole, and then transferred to the ICR cell. Our samples

were analyzed in broadband mode, meaning we used a very wide m/z range (100-2000)
however peaks were only detected and observed in the range o f 200-700 m/z. The
eventual loss o f peaks above 700 m/z can be partially attributed to space charge effects
within the ICR cell that can result in a decrease o f high molecular weight signal
(Kujawinski et al., 2002). All acquired spectra were internally calibrated with indigenous
fatty acids providing a mass accuracy of 1 ppm or less throughout the mass range of
interest (Sleighter et al., 2008a). Molecular formulas were assigned to peaks with a signal
to noise (S/N) ratio > 3 in the mass range o f 200-700 m/z by means o f a Formula
Calculator Program (v.1.0 © 1998 NHMFL) that was developed at the National High
Magnetic Field Laboratory in Tallahassee, FL. In our study, the vast majority of
formulas were unambiguously assigned below m/z 500, because we only allow up to 0.5
ppm error in assigning correct molecular formulas. When multiple assignments existed
for a single m/z value, then the correct formula was assigned based on elemental rules,
functional group relationships, and patterns and homologous series, as described in detail
previously in the literature (Koch et al., 2007; Koch et al., 2005).
The three main parameters used herein for the comparative analysis o f the huge
data set generated by FTICR-MS are the double bond equivalents (DBE), aromaticity
index (Al), and the van Krevelen diagram (VK), which are obtained from the accurately
assigned molecular formulas o f each peak (Kendrick, 1963; Kim et al., 2003; Koch and
Dittmar, 2006).
2.5.1. Double bound equivalent (DBE)
DBE is a measure of the hydrogen saturation; it provides the number o f double
bonds and/ or rings in an organic molecule based on C, H, and N and P elemental ratios:
85
DBE = 1 + #C - (H /2) + (N /2) + (P /2)
This parameter is calculated for each assigned formula and accounts for all doubly bound
carbon contributions, including the double bonds of carboxyl groups.
2.5.2. Aromaticity index (Al)
Similar to DBE values, Al values are calculated for every assigned molecular
formula in a sample as follows:
1 + C - O - S - 0 . 5 HAT _ _____________________C - O - S - N - P
Al was first proposed by Koch and Dittmar (Koch and Dittmar, 2006) to distinguish
unambiguously between aromatic (Al > 0.5) and condensed aromatic structures (Al >=
0.67) in DOM. The latter values are indicative o f thermogenic sources o f condensed
aromatics or “ black carbon, which have also been identified using the following rules
(Hockaday et al., 2006; Kim et al., 2004)
0.3 < ° / c < 0 , 6 and 0.5 < H/ c < 0.8 and DBE/ C = 0.67
However, the amount of condensed aromatic might be overestimated when applying this
rule only. On the other hand, If only half o f the oxygen in DOM is considered being
present in carbonyl functional groups, as it is the case in this study, then Al is calculated
as follow:
1 + C - 0.5 O - S - 0.5 H AImod “ C — 0.5 0 — S — N — P
2.5.3. Van Krevelen diagram (VK)
VK plots the molar H/C ratios o f each assigned molecular formula on the y-axis
and its molar O/C ratios on the x-axis. VK plots cluster elemental formulas according to
their functional group compositions into major biochemical compounds classes that have
86
characteristic H/C and O/C ratios. These clusters help elucidate changes in the chemical
composition; such as changes in oxidation state, degree o f methylation, and condensation
reactions to form large molecules o f samples. Figure 25 shows VK diagrams o f the two
controls and the three types o f DOM samples used in this study. The different colored
regions show major compound classes identified in DOM. It is well known that the
location of a point on the VK diagram relates to specific compound classes in DOM, and
interested readers are referred to the literature for more details (Hockaday et al., 2009;
Ohno et al., 2010; Reemtsma, 2009; Sleighter and Hatcher, 2011; Van Krevelen, 1950).
These compound classes include:
(1) Aliphatic structures (Perdue, 1984), which include lipids (H/C:1.5-2 and O/C: 0-
0.3), proteins (H/C: 1.5-2.2 and O/C: 0.3-0.67), and carbohydrate-like (H/C: 1.5-
2.4 and O/C: 0.67-1.2) formulas, are denoted with red color (Ohno et al., 2010).
(2) Carboxyl-rich alicyclic molecule- (CRAM) or lignin-like formulas (Hertkom et
al., 2006; Hockaday et al., 2009) are represented with green color and are defined
as:
CRAM:
o. 3 < DBE/ C < 0.68, and o. 2 < DBE/ H < 0.95, and o. 77 < D B E / 0 < 1.75
and lignin: 0.1 < < 0.67 and 0.7 < < 1 . 5
(3) Aromatic (AImo<j> 0.5) and condensed aromatic structures (AImod >= 0.67) are
represented with black color.
(4) Tannin indicated with blue color and are defined as peaks having:
0.35 < ° / c < 0.85 and 0.75 < H/ c < 1.4

87
2 5 a) van Krevelen d ia g ra m of Ctrl-S2 2 5 b) van Krevelen d ia g ra m o f Ctrl-S3
1.5
UX
100%
OS ♦ *
0 0.2 0.4 0.6
2-5 c) TC van Krevelen diagram
1.5
1 ♦
100%
0.5
00 0.2 0.4 0.6
2 ^ ; e) YT van Krevelen diagram
1.5yX
0.5
100%
. * * 100%
• 50%
1.5
1
0.5
00 0.2 0.4 0.6 0.8
2 5 d) SHM van Krevelen diagram
15
100%
0.5
♦Aliphatic♦ CRAM/lignin ♦A rom atic♦ Tannin♦ Other formulas
ICHO formulas N containing formulas
IS containing formulas
0 0.2 0.4 ° / c 0.6 0 .8 1
Figure 25. van Krevelen diagrams o f Ctrl-S2, Ctrl-S3, TC, SHM, and YT, color coded to
highlight the formulas aligning in the regions o f the major biomolecular classes o f DOM.
Pie charts show the percent composition o f each compound class for each sample, and the
bar charts show the percentage o f CHO, nitrogen containing and sulfur containing
formulas in each sample.

88
2.6. Statistical analysis and two-dimensional correlation spectroscopy
To visualize and highlight geochemical differences in the large data set generated
by FTICR-MS, we applied two statistical approaches, principal component analysis
(PCA) and 2D correlation analysis as described in details by Sleighter et al. (2010) and
Abdulla et al. (2013b), respectively.
2.6.1. Principal component analysis (PCA)
PC A was conducted on the assigned CHO formulas o f the Ctrl-S2, Ctrl-S3, TC-
S2, TC-S3, SHM-S2, SHM-S3, YT-S2 or YT-S3 samples at each time point, giving 8
individual data matrices. A data matrix was created for each sample time series using the
relative magnitude of all CHO formulas assigned in those 9 samples. When a formula is
not present in the sample, zero value is then assigned in the data matrix. Herein, we plot
our data onto a two-dimensional PCA projection (biplots) since 57-72% o f the total
variance was explained by PCI and PC2 for each PCA. However, the variance explained
by PCI and PC2 using CHNO formulas was very low. Therefore, we used 2D
Correlation analysis to investigate any behavioral changes among CHNO formulas in all
amended samples (Section 3.4).
2.6.2. Two-dimensional correlation spectroscopy
Synchronous 2D correlations are applied to the assigned N-containing formulas
by using the H/C ratio to investigate the changes in the formulas based on their presence
or absence. The synchronous 2D correlation is conducted to examine changes in number
o f formulas at specific H/C ratios along the incubation time (n = 9 time series samples)
for Ctrl-S2, Ctrl-S3, TC-S2, TC-S3, SHM-S2, SHM-S3, YT-S2, and YT-S3.

89
3. RESULTS AND DISCUSSION
3.1. Bioassays and bulk analyses
In all bioassays, major changes were observed in bulk analyses for both the low-
salinity (S2) and high salinity (S3) bioassays, reflecting the time course o f biological
activity. Following bioassays preparations and deployment in to the Lafayette River, we
observed a peek in Chla concentrations for S3 samples with the highest peek showing at
day2 for the YT amendment, and at dayl for the other treatments (Figure 26a). The
highest increase in Chla concentrations were observed in samples receiving the YT
amendment, while the other S3 bioassays exhibited less pronounced increase in Chla.
The reason for this difference might be attributed to the presence o f higher NOx and NH4
concentrations in YT compared to the other amendments (Figure 26b,c), which have
stimulated phytoplankton communities leading to increases in Chla concentrations. Our
results confirmed this DIN-Chla relationship where DIN concentrations decreased in
parallel with the increase in Chla concentrations.

90
30 b) NOX-S3
25
| 20
35a) Chla-S3
-Ctrl-53
TC S3
SHM S3
-♦ •Y T S3
30
Time (days)
Ctrl S3
“ ♦ “ TC S3
— "SHM S3
c) NH4-S3
x2
•YT S3s1g 103
5
050 2 3 4 6 71
Time (days)Time (days)
* ♦"Ctrl-53
♦ -T C -S 3
-— SHM S3
YT S3
b2
1
00 1 2 3 4 5 6 7
Figure 26. a) Chla, b) NOx, and c) NH4 concentrations in controls and treatment
incubations with TC, SH M , and YT amendments in S3 bioassays (salinity 12.5%o) over
time.
In S2 amendments we observed a lag in both phytoplankton biomass and bacterial
abundance in response to experimental treatments (Figure 27a,b). This lag period might
be due to a difference in physiological status o f bacterial and phytoplankton communities
between the two salinity regimes. We observed a sharp decrease in DIN (NOx and N H 4)
concentrations on the first day o f the incubation experiment (Figure 27c,d), which
continued until the entire DIN was exhausted by day 4. This trend was likely due to DIN
assimilation by phytoplankton, as Chla concentrations increased as DIN concentrations
were drawn down. After day 4 Chla concentrations decreased, as did bacterial
abundance. Chla and bacterial abundance have been shown to b tightly coupled
(Ducklow et al., 2001). The secondary peek in Chla at day 6 was concomitant to a
decrease in both DON and DOC concentrations (Figure 28a,b). DOC concentrations
decreased in the first 4hrs of incubation in all samples (S2 and S3) with the exception of
TC amendment (Figure 28a,c). Likewise, DON concentrations for YT amendments
decreased over the first day of the bioassays experiment (Figure 28b,d). This might be
due to the assimilation o f these two DOM components by microbes present in the
community. After day 1, DOC concentrations increased (Figure 28c) likely due to
microbial productivity (Figure 27b). Similarly, DON increased in treatments incubation
but not in controls. This increase in both DON and DOC was likely due to in situ
biological activity. Overall, the biological response and nutrient drawdown were more
rapid in S2 incubations than S3 amendments. The different results observed with the two
salinities in regard to phytoplankton biomass changes and nutrients assimilation might be
attributed to differences in microbial and phytoplankton communities in water with
different salinities (from salinities o f 5%o to 12.5 %o).

92
a ) C h lo -S 2 b ) B a c te r ia l a b u n d a n c e S2
4 0
35
3 0
25
2 0
IS
1050
O 1 2 3 4 6 7 8
c) N O x-S2
*.
IS
110 wS
0o 1 2 3 4 S 6 7 8
d ) NM4-S2
szt*
3
2
1
O2 3O 1 4 6 7 8
Figure 27. a) Chla, b) NOx, and c) NH4 concentrations in controls and treatment
incubations with TC, SHM, and YT amendments in S2 bioassays (salinity 5%o) over time.
a) D0N-S2 b) DOC-S2
40
20
IS
u io
5 0
“ Ctfl-S2 TC-S2 - SHM S2 - * “ YT S2
c) D0N-S3
30
! 25 g 20
I IS
— TC-S3
3 4 S
Times (days)
r r 900
I 800
C trl S2
d) D0C-S3
700
600
SOO
400
100
0'"•"•Ctrl S3
1 2—TC S3 - ♦ “ SHM S3
3 4 S
Tlme(dsy)
— YT S3
6 7
Figure 28. Total dissolved organic carbon (DOC) and dissolved organic nitrogen (DON)
concentrations averaged for each time point for the control and each amended sample for
S2 (a-b) and S3 (c-d) salinities.
93
3.2. ESI-FTICR-MS analysis
All obtained ultra-high resolution mass spectra of DOM contain the routinely
observed complex pattern o f multiple peaks at each nominal mass over the studied range
(m/z 200-700) (Kim et al., 2003; Kujawinski et al., 2004; Sleighter and Hatcher, 2008b;
Stenson et al., 2003). We extracted exact formula assignments for the thousands o f peaks
in each sample and sub-categorized them according to their elemental make up as being
those o f DOC (formulas containing C, H, and O only) or DON (formulas containing N).
For Ctrl-S2, Ctrl-S3, TC, SHM and YT, respectively, the initial percent contribution to
total peaks, based on numbers o f peaks, is 70%, 68%, 89%, 74%, and 58%, for CHO
formulas and 21%, 26%, 6%, 23%, and 30% for N-containing formulas. Furthermore,
the percent based on peak relative magnitudes (Figure 25, bar diagram) is 90%, 88%,
96%, 90%, and 72%, for CHO formulas, and 7%, 10%, 1%, 9%, and 15%, for N-
containing formulas for Ctrl-S2, Ctrl-S3, TC, SHM and YT, respectively. This data
shows a clear difference between the anthropogenic sample and natural and riverine
DOM compositions, where the percentages for N-containing formulas are highest in the
anthropogenically-derived DOM (YT) and lowest in the forest-derived DOM (TC), both
in number and magnitudes relative percentages, in comparison to the other samples.
The VK diagrams of both controls and the three DOM sources added to York
River waters before the incubation was initiated are shown in figure 25. The VK diagram
shows riverine DOM (Ctrl-S2 and Ctrl-S3) along with naturally-derived DOM (TC and
SHM) largely comprise molecules that are lignin-like or CRAM-like situated in the
central region of the diagram, where 74%, 70%, 53% and 58% of their formulas plot,
respectively, in this region of the diagram (Figure 25a,c, green). YT, on the other hand,

94
comprises the highest aliphatic-like molecules content (red), where 28% of the assigned
formulas plot in the aliphatic region of the VK diagram, which is remarkably different
than both natural and riverine DOM. Moreover, TC and SHM encompass more aromatic
formulas in comparison to all the other samples (Figure 25, black). These results agree
with the general trend of terrestrial DOM in the literature (Sleighter and Hatcher, 2008b)
where natural DOM generally plots in the central region of the VK diagram.
Furthermore, our results show that YT comprises higher N-containing molecules, where
30% of the assigned formulas are N-containing formulas, whereas TC and SHM contain
approximately 6% and 9%, respectively (Figure 25, bar diagrams). These findings
confirm our hypothesis that DOM displays compositional diversity from anthropogenic
and natural sources, which might affect their bioavailability potential.
3.3. Principal component analysis
To further our knowledge about the DOM turnover from these different sources,
molecular changes occurring during incubation will be recorded by investigating the
disappearance and appearance of specific molecular formulas in the FTICR-MS data set
for each source materials. PCA analysis individually applied to each o f the 8 time series
o f the two Ctrls and all amended samples using the CHO formulas, as the variables,
enables the identification of molecules associated with the bio-labile and bio-produced
pool of DOM from each source as the incubation experiment proceeds. The PCA biplots,
using CHO formulas, for the incubated samples are shown in figures 29-36. The biplots
o f the scores (Figures 29a-36a) represent the projections o f the samples onto each
principal component (PC). The biplots o f the loadings (Figures 29b-36b) signify the
projections o f all the variables (i.e., the relative magnitudes o f the CHO formulas) onto

95
each PC, which explains the variable’s contribution to the data variability along each PC.
Table 2 reports the variance explained by each PC for each sample set. The high amount
of variance explained by the sum of PCI and PC2 suggests that the majority o f the
variability in the DOM of the incubated samples can be described in two dimensional
space (Sleighter et al., 2010).
Table 2
Percentage o f the total variance contributed by PCI and PC2 for each sample.
PCI PC2
Ctrl-S2 63% 9%
TC-S2 36% 21%
SHM-S2 39% 25%
YT-S2 35% 22%
Ctrl-S3 30% 21%
TC-S3 29% 20%
SHM-S3 28% 20%
YT-S3 30% 21%
To fully understand why samples cluster or scatter in that space, the variables’
locations in the corresponding loading biplots are further examined. It should be noted
that variables (i.e., formulas) whose loadings are remote from the origin are the ones
most responsible for explaining the samples’ variance, dictating their scores along PCI
and PC2. In fact, variable loadings and sample scores that plot in similar areas o f the
biplots indicate that these specific samples have those corresponding formulas in high
relative magnitude.

PC2|9K)\ I
PC2(9K)
c) Ctrl-S2 CHO formulas enriched in Al samples
d) Ctrl-S2 CHO formulas enriched in A l and A2 samples
e) Ctrl-S2 CHO formulas enriched in Al, A2, and A3 samples
i s ;
* . V «
u* i
$ 8j V M0 5 ' * . * ™
00 0 2 0 4
♦Al ♦Al *A2
0 2 0 4 0 6 0 801 0
♦Al *A24A3
0.2 0 4 0 6 0 8 1
0 /C o / c 0 /C
Figure 29. PCA results using the relative magnitudes o f all Ctrl-S2 CHO formulas
showing the biplot o f the sample scores (a) and variable loadings (b), along with the van
Krevelen diagrams of the CHO formulas included in the colored boxed areas (c-e).

PC2(21K) -005PC2(21%)
c) TC-S2 CHO formulas enriched in Al samples
d) TC-S2 CHO compounds formulas e) TC-S2 CHO formulas enriched in enriched in A l and A2 samples Al, A2, and A3 samples
♦Al ♦A l *A2 ♦A l «A2 *A3
0 0 2 0 4 0 6 0 8 ] 0 0 2 0 4 0 6 OS 1 0 0 2 0 4 0 6 0 8 1
o /c 0 / C 0/C
Figure 30. PCA results using the relative magnitudes o f all TC-S2 CHO formulas
showing the biplot o f the sample scores (a) and variable loadings (b), along with the van
Krevelen diagrams o f the CHO formulas included in the colored boxed areas (c-e).

98
a) 1
0 8
0 6
0 4
0.2
0 - 0
I■0 4
-0 6
-08
•1
PC2(2S%)
#os
b)
1 ^ -oc U f tMm
c OS
PC2I2SK)
c) SHM-S2 CHO formulas enriched in Al samples
d) SHM-S2 CHO formulas enriched in Al and A2 samples
e) SHM-S2 CHO formulas enriched in Al, A2, and A3 samples
os
0 ♦ A l ♦ A l *A2 ♦ A l «A2 *A3
OJ 0 4 0 6 0 8 1 0 0 2 0 4 0 6 0 8 1 0 0 2 0 4 0 6 0 8
0/C 0/C 0/C
Figure 31. PCA results using the relative magnitudes o f all SHM-S2 CHO formulas
showing the biplot o f the sample scores (a) and variable loadings (b), along with the van
Krevelen diagrams o f the CHO formulas included in the colored boxed areas (c-e).
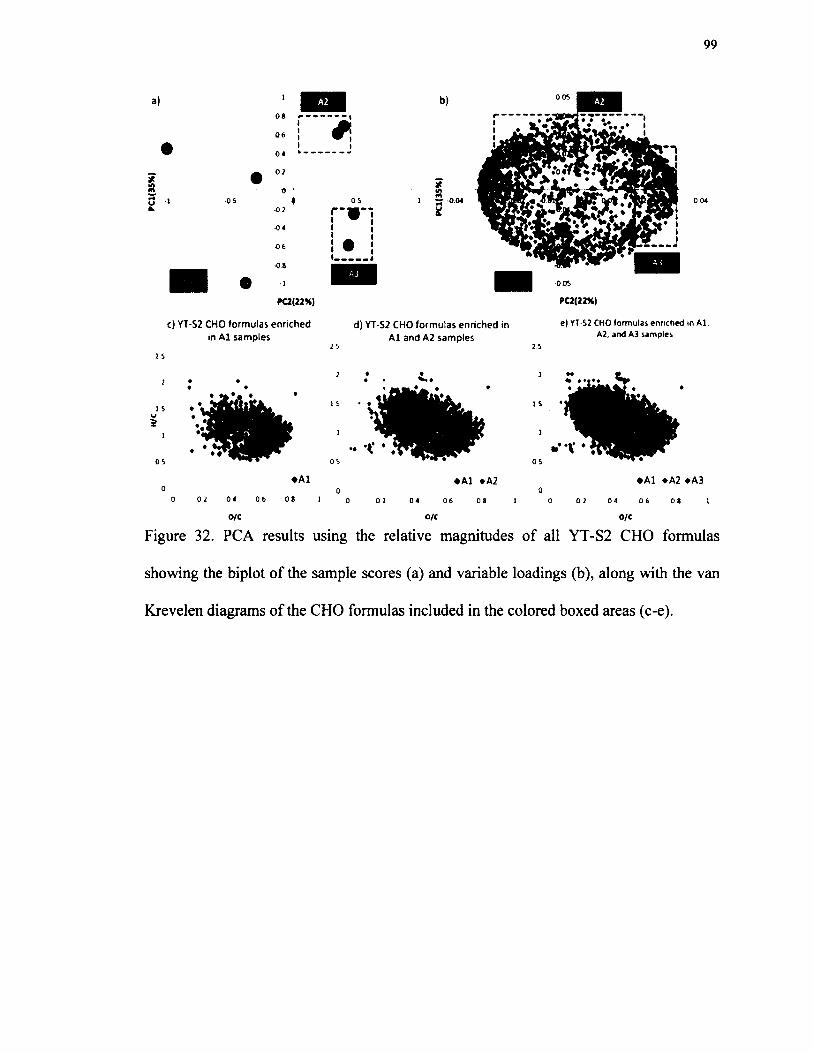
99
a)
*£5 ia.
1
0 8
0 6
b)
04 6 ------
020 •
*-02
04■06
-08
1PC2(22K)
c) YT-S2 CHO formulas enriched in Al samples
1 S -0 04
K
pa 22%
d) YT-S2 CHO formulas enriched in Al and A2 samples
e | YT S2 CHO formulas enriched in Al, A2. and A3 samples
** ♦
. . V ♦ «
♦Al0 2 0 4 0 6 0 8 1
♦Al #A2
0 2 0 4 0 6 0 8
- V ' *
♦Al *A2PA3
0 2 0 4 0 6 0 8 1
0/C 0/C 0/C
Figure 32. PCA results using the relative magnitudes o f all YT-S2 CHO formulas
showing the biplot o f the sample scores (a) and variable loadings (b), along with the van
Krevelen diagrams o f the CHO formulas included in the colored boxed areas (c-e).

100
f - -I
—I I
l ! ~ iw4
a •»
1 • IOs |0 6 j
os :0.2
© 4-OS 0
-02
• : •® <16
-08 :
ipa(2i% )
c) Ctrl-S3 CHO formulas enriched 2i in A l samples
d) Ctrl-S3 CHO formulas enriched j 5 in A l and A2 samples
os
-oos PC2(21K)
e) Ctrl-S3 CHO formulas enriched in Al, A2, and A3 samples
• •« m m
%
♦A l OA1 *A2 #A1 *A2 eA30 0 0
0 0 2 0 4 0 6 0 8 1 0 0 2 0 4 0 6 0 8 1 0 0 2 0 4 0 6 0 8 1
o/c o/c O/c
Figure 33. PCA results using the relative magnitudes o f all Ctrl-S3 CHO formulas
showing the biplot o f the sample scores (a) and variable loadings (b), along with the van
Krevelen diagrams of the CHO formulas included in the colored boxed areas (c-e).

101
a)
V i
10 8
0 6
0 4
0 7
-02
-04 '
y
♦ * •
L J
b)
pa(20%)
-os-lPa(20N)
c) TC-S3 CHO formulas enriched in d) TC-S3 CHO formulas enriched in e) TC-S3 CHO formulas enriched in A l samples Al and A2 samples Al, A2, and A3 samples
2 5 2 5 25
/ *• <
♦A l ♦ A l *A2 ♦ A l *A2 sA3
0 0 2 0 4 0 6 0 8 1 0 0 2 0 4 0 6 0 8 1 0 0 2 0 4 0 6 0 8 1
o/c o/c o/c
Figure 34. PCA results using the relative magnitudes o f all TC-S3 CHO formulas
showing the biplot o f the sample scores (a) and variable loadings (b), along with the van
Krevelen diagrams o f the CHO formulas included in the colored boxed areas (c-e).
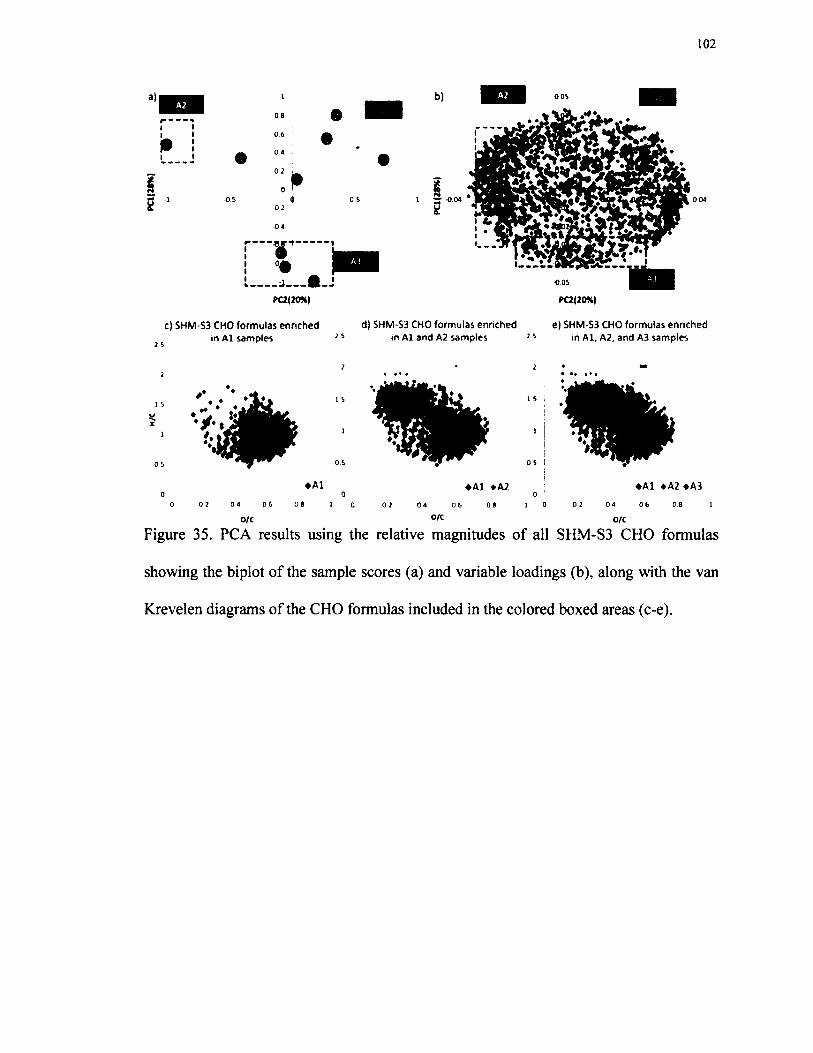
PC2(20%)
0 05
pa(20%)c) SHM-S3 CHO formulas enriched d) SHM-S3 CHO formulas enriched e) SHM-S3 CHO formulas enriched
in Al samples 25 in Al and A2 samples 25 in Al, A2, and A3 samples
♦A l ♦A l *A2 ♦A l eA2 eA3
0 0 2 0 4 0 6 OB 1 0 0 2 0 4 0 6 0 8 1 0 0 2 0 4 0 6 0.8 1
o/c °lc o/c
Figure 35. PCA results using the relative magnitudes o f all SHM-S3 CHO formulas
showing the biplot o f the sample scores (a) and variable loadings (b), along with the van
Krevelen diagrams o f the CHO formulas included in the colored boxed areas (c-e).

103
a) ; •1
b)11t ______
r ---------------
i0 1 • a. | w
If— - .
0 6
0 4
0 20 *
0-0.2
0 4
-0 6
•08
-1
pa{2i%)
c) YT-S3 CHO formulas enriched in Al samples
____ j
3
PC2UK)
d) YT-S3 CHO formulas enriched in Al and A2 samples
e) YT-S3 CHO formulas enriched in Al, A2, and A3 samples
♦A l
0 2 0 4 0.6 0.8
O/C
♦A l «A2
0 2 0 4 0 6 OS
O/C
m •♦ ♦ ♦ ♦ ♦
Hi0
1 0
♦ A l *A2 ^A3
0 2 0 4 0 6 0 8 1
O/C
Figure 36. PCA results using the relative magnitudes o f all YT-S3 CHO formulas
showing the biplot of the sample scores (a) and variable loadings (b), along with the van
Krevelen diagrams o f the CHO formulas included in the colored boxed areas (c-e).
To better understand the changes occurring at the molecular level in the studied
samples upon incubation, we assign cluster areas A l, A2, and A3 to samples at early (To,
Ti, or T2), middle (T 3, T4, or T 5), and final (T 6, T7 , or Tg) stages o f incubation,
respectively. The juxtaposed formulas from the loading biplots, corresponding to A l,
A2, and A3 in the sample score biplots highlight the changes occurring at the molecular
level as the incubation progresses. By plotting formulas contained in each o f these areas
in VK space (panels (c-e) in Figures 29-36), we can show how clusters aligning in
specific regions o f the diagram are associated with each stage o f the biodegradation

104
process. These clusters indicate which types o f formulas explain most o f the variance in
the PCA between the incubated samples. VK diagrams for all samples showing area A l
(Figures 29c-36c), representative o f the bio-labile DOM, comprising formulas enriched in
aromatic molecules and lignin-like or CRAM-like structures that fall in the central region
o f VK space. We assign biolability to this cluster o f formulas (A l) because they
represent the formulas enriched in T0-2 samples (initial and first day o f incubation).
Similar to observations made by (Sleighter et al., 2014), we further define molecules
enclosed in A2 having an intermediate lability. When comparing A l to A2, the
percentage o f the aliphatic molecules identified by high H/C ratios (> 1.5) increases in all
cases, except for Ctrl-S3, which shows a decrease in the aliphatic content at the middle
stages (A2) o f the incubation process (Figures 29d-36d and Figure 37a,b). In contrast,
the number of aromatic formulas decreased in all samples as biodegradation proceeds
(Figures 29d-36d and Figure 37c,d). One can hypothesize that biota first degrade
aromatic and CRAM/lignin-like molecules to aliphatic molecules, which might render the
DOM a more attractive food source for other species in the water column and/or these
newly produced aliphatic molecules are o f autochthonous nature that is know to be highly
labile (Attermeyer et al., 2014; Sun et al., 1997). In fact, when comparing A2 and A3, we
witness an increase in the aromatic and the CRAM/lignin content at the expense of the
aliphatic content in all samples except for Ctrl-S3 and YT amendments (Figures 29e-36e
and Figure 37), which might confirm the susceptibility o f these newly formed
autochthonous DOM to an in situ turnover. Ctrl-S3 and YT amendments sustain the
increase in the aliphatic content at the final stages of incubation, while the aromatic
continues to decline. This different trend might be due to either the production rate o f the

105
newly formed DOM being high than its consumption rate, or that the presence o f high
DIN concentrations (in YT) might have shifted bacterial community composition and
therefore the DOM turnover.
Contrary to Ctrl-S3, Ctrl-S2 behaves in a similar fashion as the natural amended
samples. This can be attributed to the mixed background input to station S2 from
surrounding swampy areas. YT amendments exhibited the highest aliphatic content at
the final stages o f the incubation experiment in both S2 and S3. The reason for this
possible difference might be attributed to the anthropogenic nature o f YT in comparison
to the natural input from both SHM and TC. The high DIN concentrations (Figures 26-
27) and N content in YT (Figure 25), along with its aliphatic signature in comparison to
SHM and TC, may have triggered the different response from the microbial and
phytoplankton communities in stimulating production o f newly produced DOM with
higher aliphatic content. The latter can be transported to higher salinities and fuel more
biomass production downstream causing the unexplained algae blooms at higher
salinities.
When comparing the behavior o f each amended sample between S2 and S3, we
noticed that the bio-produced DOM has a high density o f aliphatic formulas in A3, more
so for S3 in comparison to S2 (Figure 37a,b). This is also shown in panel (e) o f each VK
diagram (Figures 29-36) where the red dots are denser in the aliphatic region for S3
amendments than for S2 amendments. This difference might be attributed to the
variation in phytoplankton and bacterial communities in relation to salinity. In fact,
Schultz et al. (2003) were able to distinguish four distinct bacterial communities in the
York River separated by temperature and salinity and suggest that bacterial community at

106
higher salinities ( > 1 2 % o ) may be more dependent upon phytoplankton as their carbon
source in comparison to their low salinity counterparts. Therefore, this high production
o f aliphatic molecules at S3 might be a result o f this dependency relationship between
phytoplankton and bacteria where the former are intensively producing new
autochthonous DOC to meet bacterial demand. Therefore, one can postulate that changes
in salinity can affect the dynamics o f both natural and anthropogenic DOM in rivers.
a)60
so
- 4 0
10 i
20
1° ;
o
b)
»Ctrl-S2
■TC S2
■SHM-S2
■ VT-S2
60
SO
— 40
10
20
10
■Ctrl SI
>TC SI
■ SHMS1
■ YT SI
Al A2 Al Al A2 Al
c) a)so so4S 45 :
40 40
IS ! IS2 JO ■Ctrl-52 * 30 ■Ctrl Si
$ 2 S "TC-S2 $ 2 5 * TC-S1
S 20 • SHM-S2 I 20_________ __ "SHM SI< 4
15 — ■ YT-S2 15 ■ YT-S110 — 10
s ■ ■ J h . W LAl A2 A3 Al A2 A3
Figure 37. Bar diagrams showing the percent contribution of aliphatic formulas (a, c) and
aromatic formulas (b, d) in the 3 selected colored areas o f the PCA biplots shown in
figures 29-36 for the controls and amended samples at both salinities (S2 and S3).

107
3.4. Two-dimensional correlation analysis
When examining the presence and absence o f individual N-containing formulas
throughout the incubation period by PCA analysis, we observe that the total number of
these types o f formulas decreases considerably with incubation time for all sample cases.
Rather than presenting the PCA data we choose to employ 2D correlation analysis for the
N-containing formulas data sets to further our understanding on what areas of the VK
diagram this change is occurring most readily and how these areas correlate among
themselves.
3.4.1. S2 (low salinity)
The advantage of 2D correlation analyses is that one can visualize changes, either
correlated or non-correlated, using single (auto-correlation) or multiple (hetero
correlation) parameters during a process (Abdulla et al., 2013a). Lack of change
generates white space on the map, so the observation o f a signal on a 2D map is
indicative o f change.
We choose, herein, to implement the synchronous 2D auto-correlation analysis
using H/C ratios o f all N-containing formulas, which results in higher resolution 2D maps
in comparison to the ones generated using O/C ratios (Sleighter et al., 2014). The 2D
maps highlight the major changes in the number o f formulas with H/C ratios induced by
increasing incubation time in all incubated samples (Figure 38). The intensity along the
diagonal line represents the auto-correlation at each H/C ratio among the formulas. In
this case, intensity measures the number o f formulas measured and is not the intensity of
the individual mass spectral peaks. The off-diagonal cross peaks represent the cross
correlation intensities (i.e., number of formulas) between the different H/C ratios. Cross

108
peaks are color-coded to indicate positive (red) or negative (green) correlations.
2.2S 2.25a) Ctrl-S2 b) TC-S2
2.00 2.00
1.75 1.75
1.50 1.50
1.25 1.25
1.00 1.00
0.75 0.75
0.50
0.25 0.25
0.25 0.50 0.75 1.00 1.25 1.50 1.75 2.00 2.25 0.25 0.50 0.75 1.00 1.25 1.50 1.75 2.00 2.25
2.25
2.00
1.75
1.50
1.25
1.00
0.75
0.50
0.25
H /C
c) SHM-S2
......... i< »- i—« | $Jsr-i
; -11“ : i i l T ' '■ ’|!- '
M :i ri. : I
2.25
2.00
1.75
1.50
1.25
1.00
0.75
0.50
0.25
H /C
d) YT-S2
1
■ j f _* i r •-
illiir, .!! i !; 1 1
0.25 0.50 0.75 1.00 1.25 1.50 1.75 2 00 2.25
H /C00 5 0.50 0.75 1.00 1.25 1.50 1.75 2.00 2.25
H /C
Figure 38. The H/C vs. H/C synchronous plots generated by applying 2D correlation on
the N-containing formulas o f a) Ctrl-S2, b) TC-S2, c) SHM-S2, and d) YT-S2. The
correlation was based on the presence/absence o f each individual formula as the
incubation time progresses. Red indicates a positive correlation, while green indicates a
negative correlation.
The intensity along the diagonal line o f the Ctrl-S2 and YT-S2 samples is greatest
at H/C ratios o f 0.75-1.25. On the other hand, high diagonal intensity is shown at H/C
ratios o f 0.75-1.50 and at H/C 1.75-2.00 for TC-S2 and SHM-S2 samples, respectively,
indicating that most o f the changes for these samples occur in these regions upon
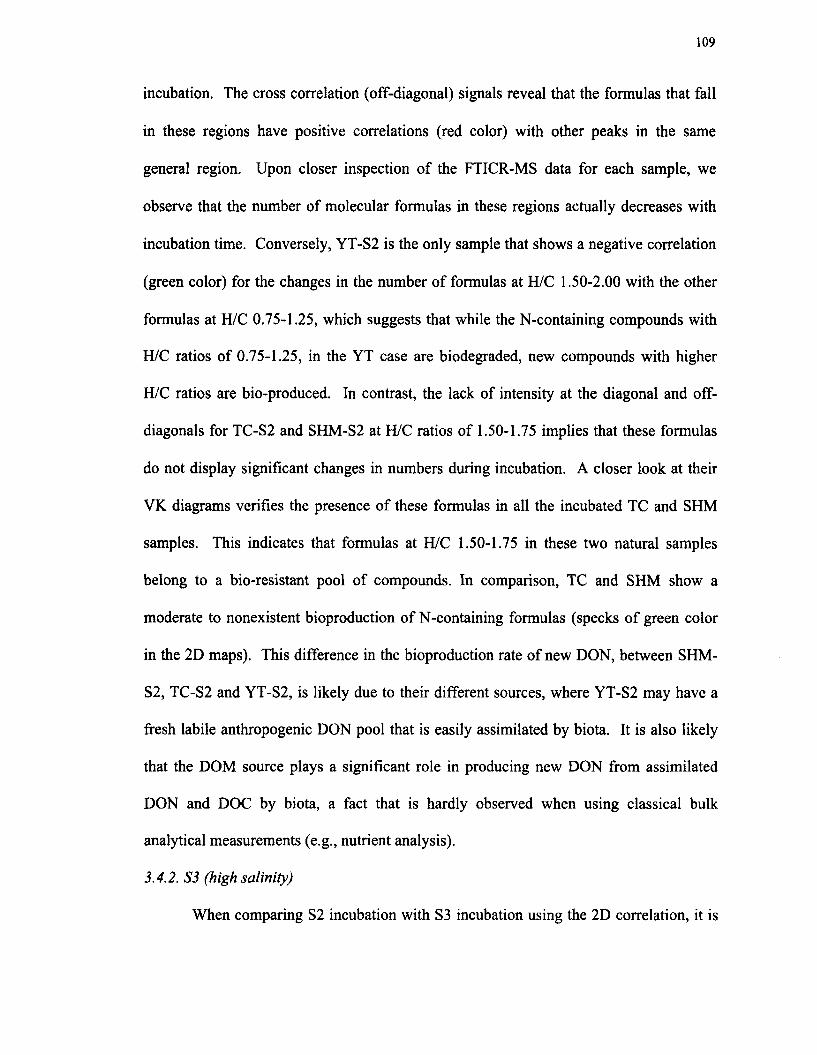
109
incubation. The cross correlation (off-diagonal) signals reveal that the formulas that fall
in these regions have positive correlations (red color) with other peaks in the same
general region. Upon closer inspection o f the FTICR-MS data for each sample, we
observe that the number o f molecular formulas in these regions actually decreases with
incubation time. Conversely, YT-S2 is the only sample that shows a negative correlation
(green color) for the changes in the number o f formulas at H/C 1.50-2.00 with the other
formulas at H/C 0.75-1.25, which suggests that while the N-containing compounds with
H/C ratios o f 0.75-1.25, in the YT case are biodegraded, new compounds with higher
H/C ratios are bio-produced. In contrast, the lack of intensity at the diagonal and off-
diagonals for TC-S2 and SHM-S2 at H/C ratios of 1.50-1.75 implies that these formulas
do not display significant changes in numbers during incubation. A closer look at their
VK diagrams verifies the presence o f these formulas in all the incubated TC and SHM
samples. This indicates that formulas at H/C 1.50-1.75 in these two natural samples
belong to a bio-resistant pool of compounds. In comparison, TC and SHM show a
moderate to nonexistent bioproduction o f N-containing formulas (specks o f green color
in the 2D maps). This difference in the bioproduction rate o f new DON, between SHM-
S2, TC-S2 and YT-S2, is likely due to their different sources, where YT-S2 may have a
fresh labile anthropogenic DON pool that is easily assimilated by biota. It is also likely
that the DOM source plays a significant role in producing new DON from assimilated
DON and DOC by biota, a fact that is hardly observed when using classical bulk
analytical measurements (e.g., nutrient analysis).
3.4.2. S3 (high salinity)
When comparing S2 incubation with S3 incubation using the 2D correlation, it is
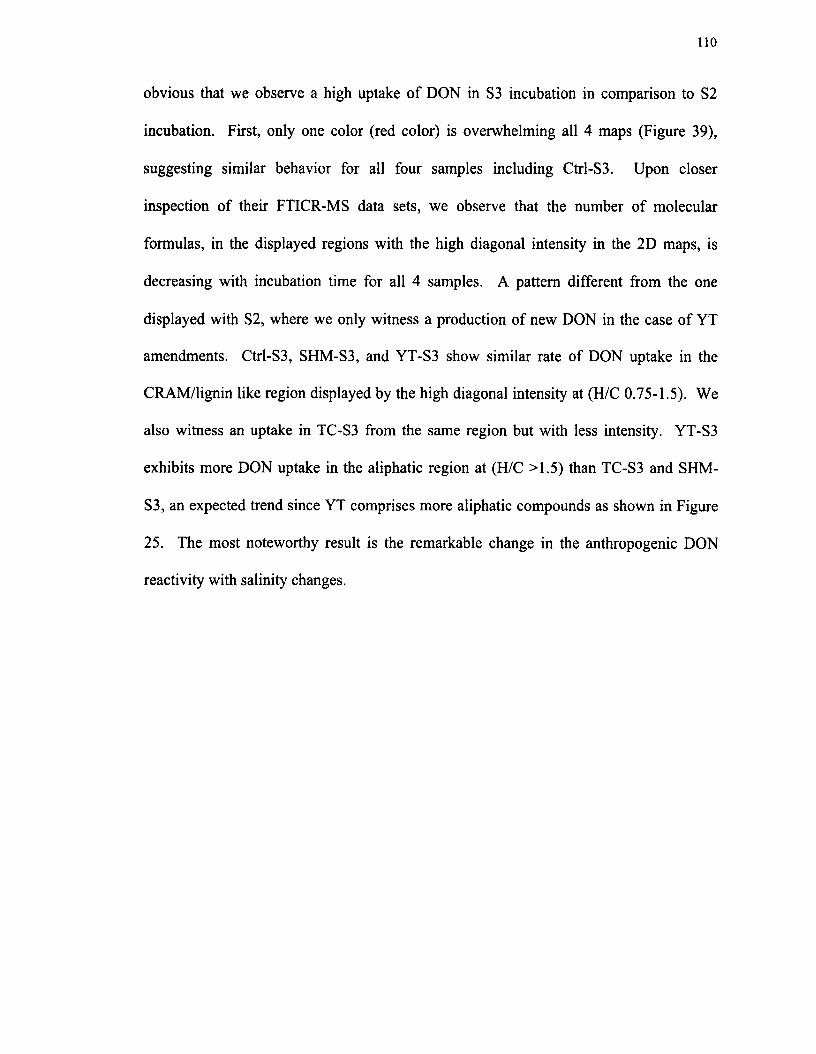
110
obvious that we observe a high uptake o f DON in S3 incubation in comparison to S2
incubation. First, only one color (red color) is overwhelming all 4 maps (Figure 39),
suggesting similar behavior for all four samples including Ctrl-S3. Upon closer
inspection of their FTICR-MS data sets, we observe that the number of molecular
formulas, in the displayed regions with the high diagonal intensity in the 2D maps, is
decreasing with incubation time for all 4 samples. A pattern different from the one
displayed with S2, where we only witness a production of new DON in the case of YT
amendments. Ctrl-S3, SHM-S3, and YT-S3 show similar rate of DON uptake in the
CRAM/lignin like region displayed by the high diagonal intensity at (H/C 0.75-1.5). We
also witness an uptake in TC-S3 from the same region but with less intensity. YT-S3
exhibits more DON uptake in the aliphatic region at (H/C >1.5) than TC-S3 and SHM-
S3, an expected trend since YT comprises more aliphatic compounds as shown in Figure
25. The most noteworthy result is the remarkable change in the anthropogenic DON
reactivity with salinity changes.

Figure 39. The H/C vs. H/C synchronous plots generated by applying 2D correlation on
the N-containing formulas o f a) Ctrl-S3, b) TC-S3, c) SHM-S3, and d) YT-S3. The
correlation was based on the presence/absence o f each individual formula as the
incubation time progresses. Red indicates a positive correlation, while green indicates a
negative correlation.
4. CONCLUSIONS
Our results demonstrate that DOM from the studied samples exhibits differences
in the degree of biodegradation and type o f bio-produced compounds, which can be
related to the dramatic difference in DOM source and molecular formula signatures. We
find that biomass production is higher with anthropogenic DOM amendments in
comparison the naturally derived DOM, and that change in salinity enhances DOM
112
biodegradation, where the removal o f N-containing formulas and production o f new
aliphatic formulas increases in high salinity incubation. Furthermore, the bio-produced
DOM from the anthropogenic source exhibits a higher aliphatic signature in comparison
to the one produced from natural amendments. Moreover, our findings suggest that
anthropogenic DOM is highly reactive in the natural environment in comparison to the
naturally derived DOM and that simple assays examining net consumption or production
o f bulk dissolved organic N pools are inadequate for assessing the bioavailability of
DOM from these different sources. Bioavailability information is essential for coastal
planning, as changes in the materials supporting food webs is decisive for sustaining
estuarine ecosystems and preventing eutrophication.

113
CHAPTER V
CONCLUSIONS AND FUTURE DIRECTIONS
1. CONCLUSIONS
This thesis addresses two main areas of research with the unifying theme being
the chemical characterization of DOM and its subcomponents DON and DOC in the
James and York River systems of the Chesapeake Bay. The focus o f this research is to
study how DOM reactivity relates to its chemical composition, and therefore, its source
material. The topics include the assessment o f DOM reactivity from different source
materials, in natural receiving waters, under photochemical, biological, and salinity
change stressors. These studies are important for deciphering the interrelationships
between C and N cycles and source material and for gaining better understanding of
processes associated with downstream eutrophication.
It has been long understood that future climate change will have the highest
impact on the global coastal zone, where 60% of the world population lives, a number
that could reach 75% in the 2030s (Cosgrove and Cosgrove, 2012). Together with rising
urbanization and land uses changes, climate change is predicted to change the physical,
chemical, and biological properties of the water bodies at the fringe o f the global coastal
zones.
For instance, wastewater treatment plants (WWTPs) are considered an important
point source for N loading in many aquatic environments. While we now know that
many phytoplankton take up natural organic N (Mulholland and Lomas, 2008), there are
relatively few data on the bioavailability o f anthropogenic organic N. Likewise, despite
its relevance to the terrestrial C budget, little is known o f the nature o f the organic C

114
decomposed and ultimately respired in aquatic systems. In particular, we do not know
how this role may change in the future due to the interrelation between DOM dynamics
and human impact. Furthermore, it is unclear how biological and photochemical
processes would alter the dynamics o f these various sources of DOM (natural and
anthropogenic) in aquatic systems. Understanding the chemical composition and
reactivity o f both natural and anthropogenic DOM in natural receiving waters should be
an important aspect o f determining water quality standards. The analytical approach
presented in this thesis would allow more detailed characterization of the DOM and its
transformation from sources to receiving waters.
The conclusions o f these research topics are discussed below.
Chapter 2 describes the use o f ESI-FTICR-MS for the assessment o f organic N
reactivity from WWTP effluent, confirming the hypothesis that this technique could be
applied to the characterization of DON from anthropogenic sources. Bioassays were
performed on samples collected at the end o f the biological process from two wastewater
treatment plants achieving advanced N removal. The samples were concentrated, and
then added to natural water samples collected from the oligohaline James River, a major
tributary o f the Chesapeake Bay. My results demonstrate that while the lignin-like
fraction o f the effluent DOM (some o f which contains N) was conserved, a large portion
o f aliphatic and aromatic compounds containing N was removed (79-100%) during
incubations, while other compounds were produced. Furthermore, the two effluents
exhibited differences in the degree o f degradation and type o f degradation, which can be
related both to the various processes employed in the two different WWTPs and the
dramatic differences in the type o f influent they receive. These findings suggest that this
115
type of anthropogenic DON is highly reactive in the natural environment and that simple
assays examining net consumption or production o f bulk dissolved organic N pools are
inadequate for assessing its true reactivity.
I would anticipate that this information would be extremely valuable to regulatory
agencies whose role is to evaluate the impact that wastewater has on DON dynamics in
estuaries. Often impacts are evaluated on the basis of bulk DON measurements and I
show that such measurements are not particularly effective in describing DON
bioavailability. Accordingly, it is imperative that these regulatory agencies demand the
use of tests that would allow for more accurate assessments than are in current use.
Admittedly, implementation o f ESI-FTICR-MS protocols for evaluation of DON
reactivity is far from standard testing, but it behooves the agencies to seek such
capabilities if there is a desire to conduct meaningful evaluations o f impact.
Chapter 3 addressed the effects o f photoirradiation on the turnover o f DOM from
both natural and anthropogenic sources at the molecular level. Analysis o f long-term
photoirradiated samples via Fourier-transform ion cyclotron resonance mass spectrometry
(FT-ICR-MS) identified both the photolabile and the photoproduced DON from both
natural and anthropogenic sources. While photoproduction o f DON was prominent with
natural dissolved organic matter (DOM) sources, even in low nitrogen environment, the
anthropogenic source shows a shift from photobleaching to photohumification denoted by
an increase in the average molecular weight (MW) and the double bound equivalent
(DBE) after 25 days of a continuous exposure to UV light, implying condensation o f low
MW molecules (LMW) to form high MW (HMW) molecules. Furthermore, the sharp
increase in N/C molar ratio, in the anthropogenic source, substantiates the photoinduced

116
dissolved inorganic nitrogen (DIN) incorporation hypothesis. My experimental results
demonstrated that photochemistry transforms DON from complex structural entities to
ammonia, aliphatic molecules, and low carbon number molecules that might enhance
microbial metabolism, and eventually increases CO2 emissions and reduces DOM
concentrations in stream ecosystems. Hence, driving substantial variation in riverine
DOM, and, thus, estuarine optics and photochemistry and bioavailability. Furthermore,
we validate that photochemistry is one o f the main processes that shapes the DON quality
in aquatic systems regardless o f its original source.
Chapter 4 examined the potential bioavailability of DOM and its subcomponents
DOC and DON from different sources in natural receiving waters o f the York River. My
approach combined the use of classical bulk analysis and ultrahigh resolution mass
spectrometry to detect intrinsic changes in the DOM pertinent to each source upon
incubation. My results demonstrate that DOM from the studied samples exhibited
differences in the degree of biodegradation and type o f compounds biologically
produced, which can be related to the dramatic differences o f their DOM source and
structural signature. I found that biomass production is higher with anthropogenic DOM
amendments in comparison the naturally derived DOM, and that change in salinity
enhances DOM biodegradation. Furthermore, the bio-produced DOM exhibited higher
aliphatic signature in comparison to the one produced from natural amendments.
Moreover, my findings suggest that anthropogenic DOM is highly reactive in the natural%
environment in comparison to the naturally derived DOM and that simple assays
examining net consumption or production o f bulk dissolved organic N pools are
inadequate for assessing the bioavailability o f DOM from these different sources. This

117
information is essential for coastal planning, as changes in the materials supporting food
webs is decisive for sustaining estuarine ecosystems and preventing eutrophication.
2. FUTURE DIRECTIONS
The new scientific developments described in this thesis highlight the crucial role
o f DOM as a link between terrestrial and aquatic systems. My new approach with respect
to molecular characterization enables a more profound understanding o f the intricate
interrelation between differences in DOM sources and its behavioral variability in
receiving waters. However, to fully understand the exceptionally complicated dynamics
o f DOM and to utterly grasp how land use changes affect its role as a link between
terrestrial and aquatic systems, further research is undeniably needed, in particular,
research pursuing DOM molecular variation on spatial and temporal scales, along
climate, nutrient, hydrologic, and land use gradients.
Storm events can account for 71-90% of the total DOM released from streams
annually (Dalzell et al., 2007; Fellman et al., 2009; Raymond and Saiers, 2010).
However, DOM variability due to these events are not well understood since antecedent
hydrologic regimes govern the changes in DOM quality and quantity released to stream
waters (Easthouse et al., 1992; Vidon et al., 2008). It is of critical importance to
understand how these storm events influence the delivery o f organic matter to estuaries,
since variability o f wet seasons and tropical cyclones frequency are expected to increase
due to the global climate change (Lozano et al., 2004; Najjar et al., 2010). An
understanding o f the changes in DOM concentration, composition, and reactivity during
storm events compared to baseflow conditions is needed in order to predict DOM
biogeochemical response in aquatic systems. Furthermore, additional research is needed

118
to tackle the impact o f watershed characteristics (topography) on the composition and
reactivity o f DOM. Finally, relationships between analytical approach and DOM optical
parameters (i.e., Sr and SUVA) need to be investigated for a simpler assessment o f DOM
reactivity during different periods or seasons in different ecological systems.

119
REFERENCES
Abdulla, H.A.N, Minor, E.C., Dias, R.F., Hatcher, P.G., 2013a. Transformations of the
chemical compositions o f high molecular weight DOM along a salinity transect:
Using two dimensional correlation spectroscopy and principal component analysis
approaches. Geochim. Cosmochim. Acta 118, 231-246.
Abdulla, H.A.N, Sleighter, R.L., Hatcher, P.G., 2013b. Two Dimensional Correlation
Analysis of Fourier Transform Ion Cyclotron Resonance Mass Spectra of
Dissolved Organic Matter: A New Graphical Analysis o f Trends. Anal. Chem. 85
(8), 3895-3902.
Altieri, K., Turpin, B., Seitzinger, S., 2009a. Oligomers, organosulfates, and nitrooxy
organosulfates in rainwater identified by ultra-high resolution electrospray
ionization FT-ICR mass spectrometry. Atmos. Chem. Phys. 9 (7), 2533-2542.
Altieri, K., Turpin, B., Seitzinger, S., 2009b. Composition of dissolved organic nitrogen
in continental precipitation investigated by ultra-high resolution FT-ICR mass
spectrometry. Environ. Sci. Technol. 43 (18), 6950-6955.
Amon, R.M.W., Benner, R., 1996. Photochemical and microbial consumption of
dissolved organic carbon and dissolved oxygen in the Amazon River system.
Geochim. Cosmochim. Acta 60 (10), 1783-1792.
Asmala, E., Autio, R., Kaartokallio, H., Pitkanen, L., Stedmon, C.A., Thomas, D.N.,
2013. Bioavailability o f riverine dissolved organic matter in three Baltic Sea
estuaries and the effect o f catchment land use. Biogeosciences 10 (11), 6969-
6986.
Attermeyer, K., Homick, T., Kayler, Z.E., Bahr, A., Zwimmann, E., Grossart, H.P.,
Premke, K., 2014. Enhanced bacterial decomposition with increasing addition of
autochthonous to allochthonous carbon without any effect on bacterial community
composition. Biogeosciences 11 (6), 1479-1489.
Aufdenkampe, A.K., Mayorga, E., Raymond, P.E., Melack, J.M., Doney, S.C., Alin,
S.R., Aalto, R., Kyungsoo, Y., 2011. Riverine coupling o f biogeochemical cycles
between land, oceans, and atmosphere. Front. Ecol. Environ. 9 (1), 53-60.
Benner, R., Opsahl, S., Chin-Leo, G., Richey, J.E., Forsberg, B.R., 1995. Bacterial
carbon metabolism in the Amazon River system. Limnol. Oceanogr. 40 (7), 1262-
1270.
Benner, R., 2003. Molecular indicators of the bioavailability o f dissolved organic matter.
In: Sinsabaugh R.L., Findley S. (Eds.), Aquatic ecosystem: interactivity of
dissolved organic matter. Academic Press, San Diego, pp. 509-546.
Bertilsson, S. et al., Stepanauskas, R., Cuadros-Hansson, R., Graneli, W., Wikner, J.,
Tranvik, L., 1999. Photochemically induced changes in bioavailable carbon and
nitrogen pools in a boreal watershed. Aquat. Microb. Ecol. 19(1), 47-56.
Bott, C., 2014. Hampton Road Sanitation District, Washington, D.C. Personal
Communication.
Bronk, D.A., Lomas, M.W., Glibert, P.M., Schukert, K.J., Sanderson, M.P., 2000. Total
dissolved nitrogen analysis: comparisons between the persulfate, UV and high
temperature oxidation methods. Mar. Chem. 69 (1), 163-178.
Bronk, D., See, J., Bradley, P., Killberg, L., 2007. DON as a source o f bioavailable
nitrogen for phytoplankton. Biogeosciences 4 (3), 283-296.

Bronk, D.A., Roberts, Q.N., Sanderson, M.P., Canuel, E.A., Hatcher, P.G., Mesfioui, R.,
Filippino, K.C., Mulholland, M.R., Love, N.G., 2010. Effluent organic nitrogen
(EON): bioavailability and photochemical and salinity-mediated release. Environ.
Sci. Technol. 44 (15), 5830-5835.
Burak, S., Dogan, E., Gazioglu., 2004. Impact o f urbanization and tourism on coastal
environment. Ocean. Coast. Manage. 47 (9-10), 515-527.
Canadell, J.G., Le Quere, C., Raupach, M.R., Field, C. B., Buitenhuis, E.T., Ciais, P.,
Conway, T.J., Gillett, N.P., Houghton, R.A., Marland, G., 2007. Contributions to
accelerating atmospheric C 02 growth from economic activity, carbon intensity,
and efficiency of natural sinks. P. Natl. A. Sci. 104 (47), 18866-18870.
Canfield, D.E., Glazer, A.N., Falkowski, P.G., 2010. The evolution and future of Earth’s
nitrogen cycle. Science 330 (6001), 192-196.
Chavez, F.P., Messie, M., Pennington, J.T., 2011. Marine primary production in relation
to climate variability and change. Ann. Rev. Mar. Sci. 3,227-260.
Chen, C.T.A., Borges, A.V., 2009. Reconciling opposing views on carbon cycling in the
coastal ocean: Continental shelves as sinks and near-shore ecosystems as sources
o f atmospheric C02. Deep-Sea. Res. II 56 (8-10), 578-590.
Chen, H., Stubbins, A., Hatcher, P.G., 2011. A mini-electrodialysis system for desalting
small volume saline samples for Fourier transform ion cyclotron resonance mass
spectrometry. Limnol. Oceanogr. Methods 9, 582-592.
Chen, H., Abdulla H.A., Sanders R. L., Myneni S.C.B., Mopper K., Hatcher, P.G., 2014.
Production o f Black Carbon-like and Aliphatic Molecules from Terrestrial
Dissolved Organic Matter in the Presence o f Sunlight and Iron. Environ.
Sci.Technol. Lett. 1 (10), 399-404
Cole, J.J., Cole, J.J., Caraco, N.F., Caraco, N.F., 2001. Carbon in catchments: connecting
terrestrial carbon losses with aquatic metabolism. Mar. Freshwater Res. 52 (1),
101- 110.
Cory, R.M., Kaplan, L.A., 2012. Biological lability of streamwater fluorescent dissolved
organic matter. Limnol. Oceanogr. 57 (5), 1347.
Cosgrove, W.J., Rijsberman, F.R., 2014. World water vision: making water everybody's
business. Eearthscan, New York.
Dagg, M., Sato, R., Liu, H., Bianchi, T.S., Green, R., Powell, R., 2008. Microbial food
web contributions to bottom water hypoxia in the northern Gulf o f Mexico. Cont.
Shelf. Res. 28 (9), 1127-1137.
Dalzell, B.J., Filley, T.R., Harbor, J.M., 2007. The role o f hydrology in annual organic
carbon loads and terrestrial organic matter export from a midwestem agricultural
watershed. Geochim. Cosmochim. Acta 71 (6), 1448-1462.
Del Giorgio, P.A., Pace, M.L., 2008. Relative independence o f dissolved organic carbon
transport and processing in a large temperate river: the Hudson River as both pipe
and reactor. Limnol. Oceanogr. 53 (1), 185-197.
Del Vecchio, R., Blough, N.V., 2004. On the origin o f the optical properties o f humic
substances. Environ. Sci. Technol. 38 (14), 3885-3891.
Dignac, M.F., Ginestel, P., Bruchet, A., Audic, J.M., Derenne, S., Largeau, C., 2001.
Changes in the organic composition of wastewater during biological treatment as
studied by NMR and IR spectroscopies. Water. Sci. Technol. 43 (2), 51-58.
Dittmar, T., Koch, B., Hertkom, N., Kattner, G., 2008. A simple and efficient method for
the solid phase extraction of dissolved organic matter (SPE-DOM) from seawater.
Limnol. Oceanogr. Methods 6,230-235.
Dodds, W.K., Bouska, W.W., Eitzmann, J.L., Pilger, T.J., Pitts, K.L., Riley, A.J.,
Schloesser, J.T., Thombrugh, D.J., 2008. Eutrophication o f US freshwaters:
analysis o f potential economic damages. Environ. Sci. Technol. 43 (1), 12-19.
Dolman, A.J., van der Werf, G.R., van der Molen, M.K., Ganssen, G., Erisman, J.-W. and
Strengers, B., 2010. A Carbon cycle science update since IPCC AR-4. AMBIO 39
(5/6), 402-412.
Ducklow, H., Carlson, C., Church, M., Kirchman, D., Smith, D., Steward, G., 2001. The
seasonal development of the bacterioplankton bloom in the Ross Sea, Antarctica,
1994-1997. Deep-Sea. Res. I I 48 (19-20), 4199-4221.
Easthouse, K.B., Mulder, J., Christophersen, N., Seip, H.M., 1992. Dissolved organic
carbon fractions in soil and stream water during variable hydrological conditions
at Birkenes, southern Norway. Water. Resour. Res. 28 (6), 1585-1596.
Fasching, C., Battin, T., 2012. Exposure of dissolved organic matter to UV-radiation
increases bacterial growth efficiency in a clear-water Alpine stream and its
adjacent groundwater. Aquat. Sci. 74 (1), 143-153.
Fellman, J.B., Hood, E., Edwards, R.T., D'Amore, D.V., 2009. Changes in the
concentration, biodegradability, and fluorescent properties o f dissolved organic
matter during stormflows in coastal temperate watersheds. J. Geophys. Res-
Biogeo. 114 (G l), 2005-2012.

Fellman, J.B., Hood, E., Spencer, R.G., 2010. Fluorescence spectroscopy opens new
windows into dissolved organic matter dynamics in freshwater ecosystems: A
review. Limnol. Oceanogr. 55 (6), 2452-2462.
Filippino, K.C., Mulholland, M.R., Bernhardt, P.W., Boneillo, G.E., Morse, R.E.,
Semcheski, M., Marshall, H., Love, N.G., Roberts, Q., Bronk, D.A., 2011. The
bioavailability of effluent-derived organic nitrogen along an estuarine salinity
gradient. Estuar. Coast. 34 (2), 269-280.
Galloway, J.N., Dentener, F.J., Capone, D.G., Boyer, E.W., Howarth, R.W., Seitzinger,
S.P., Asner, G.P., Cleveland, C., Green, P., Holland, E., 2004. Nitrogen cycles:
past, present, and future. Biogeochemistry 70 (2), 153-226.
Galloway, J.N., Townsend, A.R., Erisman, J.W., Bekunda, M., Cai, Z., Freney, J.R.,
Martinelli, L.A., Seitzinger, S.P., Sutton, M., 2008. Transformation of the
nitrogen cycle: recent trends, questions, and potential solutions. Science 320
(5878), 889-892.
Green, S.A., Blough, N.V., 1994. Optical absorption and fluorescence properties of
chromophoric dissolved organic matter in natural waters. Limnol. Oceanogr. 39
(8), 1903-1916.
Gruber, N., Galloway, J.N., 2008. An Earth-system perspective o f the global nitrogen
cycle. Nature 451 (7176), 293-296.
Han, Y., Li, X., Nan, Z., 2011. Net anthropogenic nitrogen accumulation in the Beijing
metropolitan region. Environ. Sci. Pollut. R. 18, 485-496.
125
Hansen, K. and Koroleff, F. F., 1992. Determination o f nutrients. In: GrasshofF, K.,
Kremling, K., Ehrhardt, M., (Eds.), Methods of Seawater Analysis. John Wiley,
Hoboken, pp. 159-228.
Hedges, J.I., 1992. Global biogeochemical cycles: progress and problems. Mar. Chem. 39
(1-3), 67-93.
Hedges, J.I., Keil, R.G., Benner, R., 1997. What happens to terrestrial organic matter in
the ocean? Org. Geochem. 27 (5-6), 195-212.
Helms, J. R., Stubbins, A., Ritchie, J. D., Minor, E. C., Kieber, D. J., Mopper, K., 2008.
Absorption spectral slopes and slope ratios as indicators o f molecular weight,
source, and photobleaching o f chromophoric dissolved organic matter. Limnol.
Oceanogr. 53 (3), 955-969.
Helms, J.R., Mao, J., Schmidt-Rohr, K., Abdulla, H., Mopper, K., 2013. Photochemical
flocculation o f terrestrial dissolved organic matter and iron. Geochim.
Cosmochim. Acta 121,398-413.
Helms, J.R., Mao, J., Stubbins, A., Schmidt-Rohr, K., Spencer, R.G.M., Hemes, P.J.,
Mopper, K., 2014. Loss o f optical and molecular indicators o f terrigenous
dissolved organic matter during long-term photobleaching. Aquat. Sci. 76, 353-
373.
Hertkom, N., Benner, R., Frommberger, M., Schmitt-Kopplin, P., Witt, M., Kaiser, K.,
Kettrup, A., Hedges, J. I., 2006. Characterization o f a major refractory component
o f marine dissolved organic matter. Geochim. Cosmochim. Acta 70 (12), 2990-
3010.

Hertkom, N., Harir, M., Koch, B., Michalke, B., Schmitt-Kopplin, P., 2013. High-field
NMR spectroscopy and FTICR mass spectrometry: powerful discovery tools for
the molecular level characterization o f marine dissolved organic matter.
Biogeosciences 10, 1583-1624.
Hockaday, W.C., Grannas, A.M., Kim, S., Hatcher, P.G., 2006. Direct molecular
evidence for the degradation and mobility o f black carbon in soils from ultrahigh-
resolution mass spectral analysis o f dissolved organic matter from a fire-impacted
forest soil. Org. Geochem. 37 (4), 501-510.
Hockaday, W.C., Purcell, J.M., Marshall, A.G., Baldock, J.A., Hatcher, P.G., 2009.
Electrospray and photoionization mass spectrometry for the characterization of
organic matter in natural waters: a qualitative assessment. Limnol. Oceanogr.
Methods 7, 81-95.
Hopkinson, C.S., Buffam, I., Hobbie, J., Vallino, J., Perdue, M., Eversmeyer, B., Prahl,
F., Cover, J., Hodson, R., Moran, M.A., Smith., E., Baross, J., Crump, B.,
Findlay, S., Foreman, K., 1998. Terrestrial inputs o f organic matter to coastal
ecosystems: An intercomparison o f chemical characteristics and bioavailability.
Biogeochemistry 43 (3), 211-234.
Hosen, J.D., McDonough, O.T., Febria, C.M. and Palmer, M.A., 2014. Dissolved
Organic Matter Quality and Bioavailability Changes across an Urbanization
Gradient in Headwater Streams. Environ. Sci. Technol. 48 (14), 7817-7824.
Howarth, R., Jensen, H., Marino, R., Postma, H., 1995. Transport to and processing o f
phosphorus in near-shore and oceanic waters. In: phosphorus in the global
environment. Tiessen, H. (Ed.), John Wiley, New York, pp. 323-345.

Howarth, R.W. and Marino, R., 2006. Nitrogen as the limiting nutrient for eutrophication
in coastal marine ecosystems: evolving views over three decades. Limnol.
Oceanogr. 51 (1), 364-376.
Howarth, R.W., 2008. Coastal nitrogen pollution: a review o f sources and trends globally
and regionally. Harmful Algae 8(1), 14-20.
Howarth, R., Chan, F., Conley, D.J., Gamier, J., Doney, S.C., Marino, R., Billen, G.,
2011. Coupled biogeochemical cycles: eutrophication and hypoxia in temperate
estuaries and coastal marine ecosystems. Front. Ecol. Environ. 9(1), 18-26.
Inglett, P., Rivera-Monroy, V. and Wozniak, J., 2011. Biogeochemistry o f Nitrogen
Across the Everglades Landscape. Crit. Rev. Env. Sci. Tec. 41 (1), 187-216.
Jankowski, J.J., Kieber, D.J., Mopper, K., 1999. Nitrate and nitrite ultraviolet
actinometers. Photochem. Photobiol. 70 (3), 319-328.
Kaushal, S.S., Mayer, P.M., Vidon, P.G., Smith, R.M., Pennino, M.J., Newcomer, T.A.,
Duan, S., Welty, C., Belt, K.T., 2014. Land use and climate variability amplify
carbon, nutrient, and contaminant pulses: a review with management implications.
J. Am. Water. Resour. As. 50 (3), 585-614.
Kendrick, E., 1963. A Mass Scale Based on CH2=14.0000 for High Resolution Mass
Spectrometry of Organic Compounds. Anal. Chem. 35 (13), 2146-2154.
Kieber, R.J., Hydro, L.H., Seaton, P.J., 1997. Photooxidation o f triglycerides and fatty
acids in seawater: Implication toward the formation of marine humic substances.
Limnol. Oceanogr. 42 (6 ), 1454-1462.
Kim, S., Kramer, R.W., Hatcher, P.G., 2003. Graphical method for analysis o f ultrahigh-
resolution broadband mass spectra o f natural organic matter, the van Krevelen
diagram. Anal. Chem. 75 (20), 5336-5344.
Kim, S., Kaplan, L.A., Benner, R., Hatcher, P.G., 2004. Hydrogen-deficient molecules in
natural riverine water samples evidence for the existence of black carbon in
DOM. Mar. Chem. 92 (1), 225-234.
Kim, S., Kaplan, L.A., Hatcher, P.G., 2006. Biodegradable dissolved organic matter in a
temperate and a tropical stream determined from ultra-high resolution mass
spectrometry. Limnol. Oceanogr. 51 (2), 1054-1063.
Koch, B.P., Witt, M., Engbrodt, R., Dittmar, T., Kattner, G., 2005. Molecular formulae of
marine and terrigenous dissolved organic matter detected by electrospray
ionization Fourier transform ion cyclotron resonance mass spectrometry.
Geochim. Cosmochim. Acta 69 (13), 3299-3308
Koch, B.P., Dittmar, T., 2006. From mass to structure: an aromaticity index for high-
resolution mass data o f natural organic matter. Rapid Commun. Mass Spectrom.
20 (5), 926-932.
Koch, B.P., Dittmar, T., Witt, M., Kattner, G., 2007. Fundamentals o f molecular formula
assignment to ultrahigh resolution mass data o f natural organic matter. Anal.
Chem. 79(4), 1758-1763.
Koprivnjak, J.F., Perdue, E.M., Pffomm, P.H., 2006. Coupling reverse osmosis with
electrodialysis to isolate natural organic matter from fresh waters. Water Res. 40
(18), 3385-3392.

Kujawinski, E.B., Del Vecchio, R., Blough, N.V., Klein, G.C., Marshall, A.G., 2004.
Probing molecular-level transformations o f dissolved organic matter: insights on
photochemical degradation and protozoan modification o f DOM from
electrospray ionization Fourier transform ion cyclotron resonance mass
spectrometry. Mar. Chem. 92 (1), 23-37.
Koprivnjak, J.F., Pffomm, P.H., Ingall, E., Vetter, T.A., Schmitt-Kopplin, P., Hertkom,
N., Frommberger, M., Knicker, H., Perdue, E.M. 2009. Chemical and
spectroscopic characterization of marine dissolved organic matter isolated using
coupled reverse osmosis-electrodialysis. Geochim. Cosmochim. Acta 73 (14),
4215-4231.
Kujawinski, E.B., Hatcher, P.G., Freitas, M.A., 2002. High-resolution Fourier transform
ion cyclotron resonance mass spectrometry o f humic and fulvic acids:
improvements and comparisons. Anal. Chem. 74 (2), 413-419.
Kujawinski, E.B., Longnecker, K., Blough, N.V., Del Vecchio, R., Finlay, L., Kitner,
J.B., Giovannoni, S.J., 2009. Identification o f possible source markers in marine
dissolved organic matter using ultrahigh resolution mass spectrometry. Geochim.
Cosmochim. Acta 73 (15), 4384-4399.
Le Quere, C., Raupach, M.R., Canadell, J.G., Marland, G., 2009. Trends in the sources
and sinks o f carbon dioxide. Nat. Geosci. 2 (12), 831-836.
Lerman, A., Mackenzie, F.T., May, V.L., 2004. Coupling o f the Perturbed C-N-P Cycles
in Industrial Time. Aquat. Geochem. 10 (1-2), 3-32.
Lozano, I., Devoy, R., May, W., Andersen, U., 2004. Storminess and vulnerability along
the Atlantic coastlines of Europe: analysis o f storm records and of a greenhouse
gases induced climate scenario. Mar. Geol. 210(1), 205-225.
Lu, Y., Bauer, J.E., Canuel, E.A., Yamashita, Y., Chambers, R.M., Jaffe, R., 2013.
Photochemical and microbial alteration of dissolved organic matter in temperate
headwater streams associated with different land use. J. Geophys. Res-Biogeo.
118(2), 566-580.
Mackenzie, F.T., Lerman, A., Ver, L.M.B., 1998. Role o f the continental margin in the
global carbon balance during the past three centuries. Geology 26 (5), 423-426.
Mackenzie, F.T., Ver, L.M., Lerman, A., 2002. Century-scale nitrogen and phosphorus
controls of the carbon cycle. Chem. Geol. 190 (1), 13-32.
Marie, D., Partensky, F., Jacquet, S., Vaulot, D., 1997. Enumeration and cell cycle
analysis o f natural populations o f marine picoplankton by flow cytometry using
the nucleic acid stain SYBR Green I. Appl. Environ. Microbiol. 63 (1), 186-193.
Marshall, A.G., Hendrickson, C.L., Jackson, G.S., 1998. Fourier transform ion cyclotron
resonance mass spectrometry: a primer. Mass Spectrom. Rev. 17 (1), 1-35.
Mazzoleni, L.R., Ehrmann, B.M., Shen, X., Marshall, A.G., Collett Jr, J.L., 2010. Water-
soluble atmospheric organic matter in fog: exact masses and chemical formula
identification by ultrahigh-resolution Fourier transform ion cyclotron resonance
mass spectrometry. Environ. Sci. Technol. 44 (10), 3690-3697.
Mazzoleni, L.R., Saranjampour, P., Dalbec, M.M., Samburova, V., Hallar, A.G.,
Zielinska, B., Lowenthal, D.H., Kohl, S., 2012. Identification o f water-soluble

organic carbon in non-urban aerosols using ultrahigh-resolution FT-ICR mass
spectrometry: organic anions. Environ. Chem. 9 (3), 285-297.
McCarthy, M.D. and Bronk, D.A., 2008. Analytical methods for the study of nitrogen. In:
Capone D., Bronk D., Mulholland M., Carpenter E., (Eds), Nitrogen in the Marine
Environment. Elsevier, San Diego, pp. 1220-1275.
Meng, F., Huang, G., Yang, X., Li, Z., Li, J., Cao, J., Wang, Z., Sun, L., 2013.
Identifying the sources and fate of anthropogenically impacted dissolved organic
matter (DOM) in urbanized rivers. Water Res. 47 (14), 5027-5039.
Mesfioui, R., Love, N.G., Bronk, D.A., Mulholland, M.R., Hatcher, P.G., 2012.
Reactivity and chemical characterization of effluent organic nitrogen from
wastewater treatment plants determined by Fourier transform ion cyclotron
resonance mass spectrometry. Water Res. 46 (3), 622-634.
Minor, E., Dalzell, B., Stubbins, A., Mopper, K., 2007. Evaluating the photoalteration of
estuarine dissolved organic matter using direct temperature-resolved mass
spectrometry and UV-visible spectroscopy. Aquat. Sci. 69 (4), 440-455.
Mopper, K., Zhou, X., Kieber, R.J., Kieber, D.J., Sikorski, R.J., Jones, R.D., 1991.
Photochemical degradation o f dissolved organic carbon and its impact on the
oceanic carbon cycle. Nature 353, 60-62.
Mopper, K., Stubbins, A., Ritchie, J.D., Bialk, H.M., Hatcher, P.G., 2007. Advanced
instrumental approaches for characterization of marine dissolved organic matter:
extraction techniques, mass spectrometry, and nuclear magnetic resonance
spectroscopy. Chem. Rev. 107 (2), 419-442.
Morel, B., Durand, P., Jaffrezic, A., Gruau, G., Molenat, J., 2009. Sources of dissolved
organic carbon during stormflow in a headwater agricultural catchment. Hydrol.
Process. 23 (20), 2888-2901.
Mulholland, M.R., Lomas, M.W., 2008. Nitrogen uptake and assimilation. In: Capone D.,
Bronk D., Mulholland M., Carpenter E., (Eds), Nitrogen in the marine
environment. Academic Press, Massachusetts, pp. 303-384.
Najjar, R.G., Pyke, C.R., Adams, M.B., Breitburg, D., Hershner, C., Kemp, M., Howarth,
R., Mulholland, M.R., Paolisso, M., Secor., D., Sellner, K., Wardrop., D., Wood,
R., 2010. Potential climate-change impacts on the Chesapeake Bay. Estuar. Coast.
Shelf Sci. 86(1), 1-20.
Nakagawa, Y., Eguchi, M., Miyashita, S., 2007. Pacific bluefin tuna, Thunnus orientalis,
larvae utilize energy and nutrients of microbial loop. Aquaculture 267 (1), 83-93.
Nizkorodov, S.A., Laskin, J., Laskin, A., 2011. Molecular chemistry o f organic aerosols
through the application of high resolution mass spectrometry. Phys. Chem. Chem.
Phys. 13 (9), 3612-3629.
Ohno, T., He, Z., Sleighter, R.L., Honeycutt, C.W., Hatcher, P.G., 2010. Ultrahigh
Resolution Mass Spectrometry and Indicator Species Analysis to Identify Marker
Components o f Soil-and Plant Biomass-Derived Organic Matter Fractions.
Environ. Sci. Technol. 44 (22), 8594-8600.
Opsahl, S., Benner, R., 1997. Distribution and cycling o f terrigenous dissolved organic
matter in the ocean. Nature 386: 480-482.
Opsahl, S., Benner, R., 1998. Photochemical reactivity o f dissolved lignin in river and
ocean waters. Limnol. Oceanogr. 43 (6 ), 1297-1304.
Ortega-Retuerta, E., Pulido-Villena, E., Reche, I., 2007. Effects o f dissolved organic
matter photoproducts and mineral nutrient supply on bacterial growth in
Mediterranean inland waters. Microb. Ecol. 54 (1), 161-169.
Pagilla, K.R., Urgun-Demirtas, M., Ramani, R., 2006. Low effluent nutrient technologies
for wastewater treatment. Water Sci. Technol. 53 (3), 165-172.
Parkin, G., McCarty, P., 1981. Sources o f soluble organic nitrogen in activated sludge
effluents. Res. J. Water Pollut. C. 53 (1), 89-98.
Parsons, T.R., Maita, Y., Lalli, C.M., 1984. A manual o f biological and chemical
methods for seawater analysis. Pergamon Press, New York, NY.
Pehlivanoglu, E., Sedlak, D.L., 2004. Bioavailability o f wastewater-derived organic
nitrogen to the alga selenastrum capricomutum. Water Res. 38 (14-15), 3189-
3196.
Pehlivanoglu-Mantas, E., Sedlak, D., 2006. Wastewater-Derived Dissolved Organic
Nitrogen: Analytical Methods, Characterization, and Effects: a Review. Crit. Rev.
Env. Sci. Tec. 36 (3), 261-285.
Pellerin, B.A., Kaushal, S.S., McDowell, W.H., 2006. Does anthropogenic nitrogen
enrichment increase organic nitrogen concentrations in runoff from forested and
human-dominated watersheds? Ecosystems 9 (5), 852-864.
Peltzer, E.T., Fry, B., Doering, P.H., McKenna, J.H., Norrman, B. and Zweifel, U.L.,
1996. A comparison of methods for the measurement o f dissolved organic carbon
in natural waters. Mar. Chem. 54 (1), 85-96.
Perakis, S.S., Hedin, L.O., 2002. Nitrogen loss from unpolluted south american forests
mainly via dissolved organic compounds. Nature 415,416-419.
Perdue, E., 1984. Analytical constraints on the structural features of humic substances.
Geochim. Cosmochim. Acta 48 (7), 1435-1442.
Rabalais, N.N., Turner, R.E., Wiseman Jr, W.J., 2002. Gulf o f Mexico hypoxia, AKA"
The dead zone". Annu. Rev. Ecol. Sys. 33, 235-263.
Raymond, P.A., Saiers, J.E., 2010. Event controlled DOC export from forested
watersheds. Biogeochemistry 100 (1-3), 197-209.
Reemtsma, T., These, A., Springer, A., Linscheid, M., 2006. Fulvic acids as transition
state of organic matter: Indications from high resolution mass spectrometry.
Environ. Sci. Technol. 40 (19), 5839-5845.
Reemtsma, T., 2009. Determination o f molecular formulas of natural organic matter
molecules by ultra-high-resolution mass spectrometry: Status and needs. J.
Chromatogr. A 1216 (18), 3687-3701.
Rockstrom, J., Karlberg, L., 2010. The Quadruple Squeeze: Defining the safe operating
space for freshwater use to achieve a triply green revolution in the Anthropocene.
AMBIO 39 (3), 257-265.
Rossel, P.E., Vahatalo, A.V., Witt, M., Dittmar, T., 2013. Molecular composition of
dissolved organic matter from a wetland plant Juncus effusus after photochemical
and microbial decomposition (1.25 yr): Common features with deep sea dissolved
organic matter. Org. Geochem. 60, 62-71.
Sattayatewa, C., Pagilla, K., Pitt, P., Selock, K., Bruton, T., 2009. Organic nitrogen
transformations in a 4-stage Bardenpho nitrogen removal plant and
bioavailability/biodegradability o f effluent DON. Water Res. 43 (18), 4507-4516.

Schlesinger, W.H., Melack, J.M., 1981. Transport o f organic carbon in the world's rivers.
Tellus 33 (2), 172-187.
Schlesinger, W.H., 2009. On the fate of anthropogenic nitrogen. P. Natl. A. Sci. USA 106
(1), 203-208.
Schlesinger, W.H., Bernhardt, E.S., 2013. Biogeochemistry: an analysis o f global change.
Academic press. Waltham, MA, USA.
Schmid, D.G., Grosche, P., Bandel, H., Jung, G., 2000. FTICR-mass spectrometry for
high-resolution analysis in combinatorial chemistry. Biotechnol. Bioeng. 71 (2),
2001 .
Schultz, G.E., White, E.D., Ducklow, H.W., 2003. Bacterioplankton dynamics in the
York River estuary: primary influence of temperature and freshwater inputs.
Aquat. Microb. Ecolo. 30 (2), 135-148.
Seitzinger, S.P., Sanders, R., Styles, R., 2002. Bioavailability o f DON from natural and
anthropogenic sources to estuarine plankton. Limnol. Oceanogr. 47 (2), 353-366.
Seitzinger, S., Harrison, J.A., Dumont, E., Beusen, A.H., Bouwman, A.F., 2005a. Sources
and delivery o f carbon, nitrogen, and phosphorus to the coastal zone: An
overview o f Global Nutrient Export from Watersheds (NEWS) models and their
application. Global Biogeochem. Cy. 19 (4), 1-11.
Seitzinger, S.P., Hartnett, H., Lauck, R., Mazurek, M., Minegishi, T., Spyres, G., Styles,
R., 2005b. Molecular-level chemical characterization and bioavailability of
dissolved organic matter in stream water using electrospray-ionization mass
spectrometry. Limnol. Oceanogr. 50 (1), 1-12.

Shank, G.C., Zepp, R.G., Whitehead, R.F., Moran, M.A., 2005. Variations in the spectral
properties of freshwater and estuarine CDOM caused by partitioning onto river
and estuarine sediments. Estuar. Coast. Shelf Sci. 65 (1), 289-301.
Shon, H., Vigneswaran, S. and Snyder, S., 2006. Effluent organic matter (EfOM) in
wastewater: constituents, effects, and treatment. Critical Reviews in Environ. Sci.
Technol. 36 (4), 327-374.
Simjouw, J.P., Minor, E.C., Mopper, K., 2005. Isolation and characterization of estuarine
dissolved organic matter: Comparison of ultrafiltration and C18 solid-phase
extraction techniques. Mar. Chem. 96 (3-4), 219-235.
Simsek, H., Wadhawan, T., Khan, E., 2013. Overlapping Photodegradable and
Biodegradable Organic Nitrogen in Wastewater Effluents. Environ. Sci. Technol.
47 (13), 7163-7170.
Sleighter, R.L., Hatcher, P.G., 2007. The application of electrospray ionization coupled to
ultrahigh resolution mass spectrometry for the molecular characterization of
natural organic matter. J. Mass Spectrom. 42 (5), 559-574.
Sleighter, R.L., McKee, G.A., Liu, Z., Hatcher, P.G., 2008a. Naturally present fatty acids
as internal calibrants for Fourier transform mass spectra o f dissolved organic
matter. Limnol. Oceanogr. Methods 6 , 246-253.
Sleighter, R.L., Hatcher, P.G., 2008b. Molecular characterization o f dissolved organic
matter (DOM) along a river to ocean transect o f the lower Chesapeake Bay by
ultrahigh resolution electrospray ionization Fourier transform ion cyclotron
resonance mass spectrometry. Mar. Chem. 110 (3-4), 140-152.

Sleighter, R.L., Liu, Z., Xue, J., Hatcher, P.G., 2010. Multivariate Statistical Approaches
for the Characterization o f Dissolved Organic Matter Analyzed by Ultrahigh
Resolution Mass Spectrometry. Environ. Sci. Technol. 44 (19), 7576-7582.
Sleighter, R.L., Hatcher, P.G., 2011. Transform mass spectrometry for the molecular
level characterization o f natural organic matter: Instrument capabilities,
applications, and limitations. In: Nikolic G., (Ed.), Fourier transforms approach
to scientific principles. Tech, Vienna, pp. 295-320
Sleighter, R.L., Cory, R.M., Kaplan, L.A., Abdulla, H.A., Hatcher, P.G., 2014. A coupled
geochemical and biogeochemical approach to characterize the bioreactivity of
dissolved organic matter from a headwater stream. J. Geophys. Res-Biogeo. 119
(8 ), 1520-1537.
Smith, E.M., Benner, R., 2005. Photochemical transformations o f riverine dissolved
organic matter: effects on estuarine bacterial metabolism and nutrient demand.
Aquat. Microb. Ecol. 40 (1), 37-50.
Stenson, A.C., Landing, W.M., Marshall, A.G., Cooper, W.T., 2002. Ionization and
fragmentation of humic substances in electrospray ionization Fourier transform-
ion cyclotron resonance mass spectrometry. Anal. Chem. 74 (17), 4397-4409.
Stenson, A.C., Marshall, A.G., Cooper, W.T., 2003. Exact masses and chemical formulas
o f individual Suwannee River fulvic acids from ultrahigh resolution electrospray
ionization Fourier transform ion cyclotron resonance mass spectra. Anal. Chem.
75(6), 1275-1284.
Stubbins, A., Spencer, R.G.M., Chen, H., Hatcher, P.G., Mopper, K., Hemes, P.J.,
Mwamba, V.L., Mangangu, A.M., Wabakanghanzi, J.N., Six, J., 2010.
Illuminated darkness: Molecular signatures of Congo River dissolved organic
matter and its photochemical alteration as revealed by ultrahigh precision mass
spectrometry. Limnol. Oceanogr. 55 (4), 1467-1477.
Sun, L., Perdue, E., Meyer, J., Weis, J., 1997. Use of elemental composition to predict
bioavailability of dissolved organic matter in a Georgia river. Limnol. Oceanogr.
42 (4), 714-721.
Tarr, M.A., Wang, W., Bianchi, T.S., Engelhaupt, E., 2001. Mechanisms of ammonia and
amino acid photoproduction from aquatic humic and colloidal matter. Water Res.
35 (15), 3688-3696.
Urgun-Demirtas, M., Sattayatewa, C., Pagilla, K.R., 2008. Bioavailability o f dissolved
organic nitrogen in treated effluents. Water Environ. Res. 80(5), 397-406.
Vahatalo, A.V., Zepp, R.G., 2005. Photochemical mineralization o f dissolved organic
nitrogen to ammonium in the Baltic Sea. Environ. Sci. Technol. 39 (18), 6985-
6992.
Van Kessel, C., Clough, T.J., Van Groenigen, J.W., 2009. Dissolved organic nitrogen: an
overlooked pathway o f nitrogen loss from agricultural systems? J. Environ. Qual.
38(2), 393-401.
Van Krevelen, D., 1950. Graphical-statistical method for the study o f structure and
reaction processes of coal. Fuel 29 (12), 269-2.
Vaulot, D., Courties, C., Partensky, F., 1989. A simple method to preserve oceanic
phytoplankton for flow cytometric analyses. Cytometry 10 (5), 629-635.

Vetter, T.A., Perdue, E.M., Ingall, E., Koprivnjak, J.F., Pfromm, P.H., 2007. Combining
reverse osmosis and electrodialysis for more complete recovery o f dissolved
organic matter from seawater. Sep. Purif. Technol. 56 (3), 383-387.
Vidon, P., Wagner, L.E., Soyeux, E., 2008. Changes in the character o f DOC in streams
during storms in two Midwestern watersheds with contrasting land uses.
Biogeochemistry 8 8 (3), 257-270.
Vitousek, P.M., Aber, J.D., Howarth, R.W., Likens, G.E., Matson, P. A., Schindler,
D.W., Schlesinger, W.H., Tilman, D.G., 1997. Human alteration o f the global
nitrogen cycle: sources and consequences. Ecol. Appl. 7 (3), 737-750.
Weishaar, J.L., Aiken, G.R., Bergamaschi, B.A., Fram, M.S., Fujii, R., Mopper, K., 2003.
Evaluation of specific ultraviolet absorbance as an indicator of the chemical
composition and reactivity o f dissolved organic carbon. Environ. Sci. Technol. 37
(20), 4702-4708.
Welschmeyer, N.A., 1994. Fluorometric analysis of chlorophyll a in the presence of
chlorophyll b and pheopigments. Limnol. Oceanogr. 39 (8 ), 1985-1992.
Wetzel, R.G., 1992. Gradient-dominated ecosystems: sources and regulatory functions of
dissolved organic matter in freshwater ecosystems. Hydrobiologia 229,181-198.
Wiegner, T.N., Seitzinger, S.P., 2001. Photochemical and microbial degradation of
external dissolved organic matter inputs to rivers. Aquat. Microb. Ecol. 24 (1),
27-40.
Wiegner, T.N., Seitzinger, S.P., Glibert, P.M., Bronk, D.A., 2006. Bioavailability of
dissolved organic nitrogen and carbon from nine rivers in the eastern United
States. Aquat. Microb. Ecol. 43 (3), 277-287.

140
Williams, C.J., Yamashita, Y., Wilson, H.F., Jaffe, R., Xenopoulos, M.A., 2010.
Unraveling the role o f land use and microbial activity in shaping dissolved
organic matter characteristics in stream ecosystems. Limnol. Oceanogr. 55 (3),
1159.
Wilson, H., Xenopoulos, M., 2013. Diel changes o f dissolved organic matter in streams
o f varying watershed land use. River Res. Appl. 29 (10), 1330-1339.
Yamashita, Y., Maie, N., Briceno, H., Jaffe, R., 2010. Optical characterization of
dissolved organic matter in tropical rivers o f the Guayana Shield, Venezuela. J.
Geophys. Res-Biogeo. 115 (G l), 2005-2012.
Zhang, C., Li, G., Lin, Q., Cao, A., Zhao, X., 2011. The dynamics o f dissolved organic N
in the fumigated soils. Biol. Fert. Soils 47, 833-837.
141
APPENDIX A
COPYRIGHT PERMISSION
Permission fo r Chapter II, which contains Water Research article published by Elsevier
Articles that are published in Elsevier journals do not need to seek Elsevier's permission to include
them in your thesis (including being placed on your university website), as it is part o f the rights that an
author retains (see http://www.elsevier.com/wps/find/authorsview.authors/copyright below).
What rights do I retain as a journal author*?
As a journal author, you retain rights for large number o f author uses, including use by your employing institute or company. These rights are retained and permitted without the need to obtain specific permission from Elsevier. These include:
• the right to make copies (print or electric) o f the journal article for their own personal use, including for their own classroom teaching use;
• the right to make copies and distribute copies (including via e-m ail) o f the journal article to research colleagues, for personal use by such colleagues (but not for Commercial Purposes**, as listed below);
• the right to post a pre-print version o f the journal article on Internet web sites including electronic pre-print servers, and to retain indefinitely such version on such servers or sites (see also our information on electronic preprints for a more detailed discussion on these points); the right to post a revised personal version o f the text o f the final journal article (to reflect changes made in the peer review process) on the author's personal or institutional w eb site or server, incorporating the complete citation and with a link to the Digital Object Identifier (DOI) o f the article;
• the right to present the journal article at a m eeting or conference and to distribute copies o f such paper or article to the delegates attending the meeting;
• for the author’s employer, i f the journal article is a ‘work for hire’, made within the scope o f the author’s employment, the right to use all or part o f the information in (any version of) the journal article for other intra-company use (e.g. training), including by posting the article on secure, internal corporate intranets;
• patent and trademark rights and rights to any process or procedure described in the journal article;
• the right to include the journal article, in full or in part, in a thesis or dissertation;• the right to use the journal article or any part thereof in a printed compilation o f works o f
the author, such as collected writings or lecture notes (subsequent to publication o f the article in the journal);
• and the right to prepare other derivative works, to extend the journal article into book- length form, or to otherwise re-use portions or excerpts in other works, with full acknowledgem ent o f its original publication in the journal.

142
APPENDIX B
ABBREVIATIONS AND ACRONYMS USED
A l: area 1
A2: area 2
A3: area 3
A: absorbance
a: absorbance coefficient
C: carbon
°C: Celsius
COSMIC: College of Sciences Major Instrumentation Cluster
CRAM: carboxyl-rich alicyclic molecules
Ctrl: control
C hla : chlorophyll a
2D: two-dimensional
Da: Dalton
DBE: double bond equivalents
DIN: dissolved inorganic nitrogen
DOC: dissolved organic carbon
DOM: dissolved organic matter
DON: dissolved organic nitrogen
ED: electrodialysis
EON: effluent organic nitrogen
EON4: effluent from King William county, VA wastewater plant

143
E0N5: effluent from Reno, NV wastewater plant
ESI: electrospray ionization
ESI-FTICR-MS: electrospray ionization Fourier transform ion cyclotron resonance mass
spectrometry
FTICR-MS: Fourier transform ion cyclotron resonance mass spectrometry
GF/F: 0.7 pm glass fiber filters
H: hydrogen
JR: James River
KW: King William
1 :path length
LC-MS: liquid chromatography- mass spectrometry
m/z: mass to charge
pm: micron
M: molarity
mL: milliliter
MS: mass spectrometry
MW: molecular weight
Mw: magnitude weighted
N: nitrogen
N H f : ammonia
NHMFL: national high magnetic field laboratory
NMR: nuclear magnetic resonance
NOM: natural organic matter
144
NO2 : nitrite
N O J: nitrate
NOx: Nitrite+Nitrate
O: oxygen
P: phosphorus
PC: principal component
PC A: principal component analysis
PPL: styrene-divinyllbenzene polymer for solid phase extraction
ppm: parts per million
RO/ED: reverse osmosis/ electrodialysis
S: slope
S2: Salinity 2 (5%o)
S3: Salinity 3 (12.5%)
SHM: Sweet Hall marsh
S/N: signal to noise
Sr: slope ratio
SUVA: specific Ultraviolet AbsorbanceT: tesla
To: time initial
Tf: time final
TC: Taskinas creek
TOC: total organic carbon
TOF: time o f flight
TDN: total dissolved nitrogen

TN: total nitrogen
UV-Vis: Ultraviolet / Visible Spectroscopy
YR: York River
YT: York Town
WWTP: wastewater treatment plant
VK: van Krevelen
VIMS: Virginia Institute o f Marine Sciences
WP: West Point
WW: whole water
XAD: Registered Trade Name for Amberlite Hydrophobic Resins

146
APPENDIX C
ESI-FTICR-MS PRINCIPLE AND DATA ANALYSES
1. DOM ESI-FTICR-MS analyses
The potential of FTICR-MS to play a major role in the characterization of DOM
in aerosols (Mazzoleni et al., 2010; Mazzoleni et al., 2012; Nizkorodov et a l , 2011),
rainwater (Altieri et al., 2009a), marine (Chen et al., 2011; Hertkom et al., 2013;
Kujawinski et al., 2009), and fresh water systems (Seitzinger et al., 2005b; Sleighter and
Hatcher, 2007; Stubbins et al., 2010) has recently been recognized. This technique allows
the exact elemental composition of ions to be calculated offering a major breakthrough
for the characterization o f DOM and its subcomponents DOC and DON (Mesfioui et al.,
2012; Stenson et al., 2002). Because o f its ultrahigh resolving power (>200,000) and high
mass accuracy (<lppm), ESI-FTICR-MS is capable of determining the exact mass for the
thousands of molecules in a single complex sample o f DOM (Kim et al., 2003;
Kujawinski et al., 2002). The mass accuracy is sufficiently high to allow for the
assignment o f a unique molecular formula to each constituent (Stenson et al., 2003).
Currently, ESI-FT-ICR-MS is the most powerful analytical tool for elucidating the
detailed molecular characterization o f DOM, which can be accomplished by assigning
unambiguously single formula to each peak in the mass spectrum.
2. FTICR-MS Cyclotron Motion
The power of FT-ICR-MS comes from the precise measurement o f the ion cyclotron
frequency that is independent from the ion velocity, and therefore its kinetic energy. The
measured signal results from induced charge on the FTICR trap detection plates caused
by the cyclotron motion o f ions in a static magnetic field. After a sweep with a radio

147
frequency, “ion-packet” of the same mass m and charge (q or z) oscillates
perpendicularly to the magnetic field (B) at a frequency dependent on their mass to
charge ratio (m/z) (Figure 40). The forces on the ions are the Lorenz force (FL = q. v. B )
771 V and the centrifugal force (Fz = —^ L). When Fz = FL the characteristic cyclotron
frequency vc for each ion-packet is expressed as: (y c = hence, the cyclotron
frequency depends only upon the ion’s charge q, its mass m and the magnetic field B,
which is, in general, constant. The resulting signal is a free induction decay and the data
is extracted by a Fourier transform to generate the mass spectrum.
*v
Figure 40. Cyclotron motion of ions in a magnetic field. Fz (centrifugal force), FL
(Lorentz force), B (magnetic field), vxy (ion velocity), r = orbital radius. Ions (+) are
separated on the basis o f their cyclotron frequency, adapted from Schmid et al. (2000).

148
3. Mass spectrometry resolutions and mass accuracy
The performance of mass analyzers is typically quantitated in terms of resolution
and mass accuracy. In fact, Fourier transform ion cyclotron resonance mass spectrometer
is capable o f extremely high mass resolution (R), which is the degree of separation of
neighboring peaks. Mass resolutions o f up to 600,000 can be achieved for low m/z
values. The resolution or resolving power is defined as R = •— — , where m is the m/z atAm50%
which the signal is observed and Am50% denotes the full width at half maximum
(FWHM) of the measured peak, which is nowadays accepted as a general definition of
mass spectrometric resolution.
m/z
Figure 41. Method to determine full width at half maximum Am;o%.
The second most important parameter to FT-ICR mass spectrometry is the mass
accuracy, which is defined as the ratio o f the difference between the measured m exp mass
and the theoretical mass m theo, expressed in ppm and calculated using the following
equation:

149
W-exp W-theom ass accuracy = ----- ------— 7—
mtheo-1 0
4. ESI-FTICR mass spectrometry data analysis
The ultrahigh resolving power o f FTICR-MS (> 400,000) and mass accuracy o f (< 1
ppm) provides the ability to assign unique molecular formulas to thousands of
components in a single DOM sample.
The three main parameters for the comparative analysis o f the huge data set
generated by FT-ICR-MS are the double bond equivalents (DBE), van Krevelen diagram
(VK), and the aromaticity index (Al), which are calculated from the accurately assigned
molecular formulas for each peak (Kendrick, 1963; Kim et al., 2003; Koch and Dittmar,
2006).
4.1 Double bound equivalent
DBE is a measure of the H saturation; it provides the number o f double bonds
and/ or rings in an organic molecule based on C, H, and N and P elemental ratios:
DBE = 1 + #C - ( H / 2) + ( N / 2) + (P /2)
This parameter accounts for all doubly bound carbon contributions, including the double
bonds of carboxyl groups.
4.2 Aromaticity index
Similar to O/C, H/C, and DBE values, Al values are calculated for every assigned
molecular formula in a sample as follows:
1 + C - O - S - 0.5 HA I — ______________________
C - O - S - N - P
Al was first proposed by Koch and Dittmar (Kim et al., 2006; Koch and Dittmar, 2006)
to distinguish unambiguously between aromatic (Al > 0.5) and condensed aromatic

150
structures (Al >= 0.67) in NOM. The latter values are indicative o f thermogenic sources
o f condensed aromatics or “ black carbon, which have also been identified using the
following rules (Hockaday et al., 2006; Kim et al., 2004)
0.3 < ° / c < 0 , 6 and 0.5 < H/ c < 0.8 and DBE/ C = 0.67
However, the amount of condensed aromatic might be overestimated when applying this
rule only.
If only half of the oxygen in DOM is considered being present in carbonyl
functional groups, as it is the case in our study, then Al should be calculated as follow:
1 + C - 0.5 O - S - 0.5 H Almod ~ C - O . S O - S - N - P
4.3 Van Krevelen diagram
van Krevelen diagram (VK) plots the molar H/C ratios o f each assigned elemental
formula on the y-axis and its molar O/C ratios on the x-axis. VK plots cluster elemental
formulae according to their functional group compositions into major biochemical
compounds classes that have characteristic H/C and O/C ratios. These clusters help
elucidate changes in the chemical composition such as changes in oxidation state, degree
of methylation, and condensation reactions to form large molecules o f samples. Figure 42
shows van Krevelen diagram of EON5, a wastewater effluent studied in Chapter 2, the
overlain black circles show major compound classes identified in DOM. It is well known
that the location o f a point on the VK diagram relates to specific compound classes in
DOM, and interested readers are referred to the literature for more details (Hockaday et
al., 2009; Ohno et al., 2010; Reemtsma, 2009; Sleighter and Hatcher, 2011; Van
Krevelen, 1950). These compound classes include:

151
> Aliphatic structures (Perdue, 1984) defined as peaks with
DBE/ C < 0.3 and 1.0 < H/ C < 3.0
> Carboxyl-rich alicyclic molecule-like structures [CRAM (Hertkom et al., 2006)]
defined as:
o. 3 < DBE/ C < 0.68, and o. 2 < DBE/ H < 0.95, and o. 77 < DBE/ 0 < 1.75
or Lignin-like structures defined as :
0.1 < ®/q < 0.6 and 0.6 < b / q < 1.7 and A lmod < 0.6
> Aromatic and condensed aromatic structures defined above in section 4.2.
> Tannin defined as peaks having:
0.35 < ° / c < 0.85 and 0.75 < H/ C < 1.4
> Carbohydrate-like structures defined as formulas with
0.7 < ° / c < 1 and 1.6 < H/ Q < 2
I: Aliphatic
II: Llgnln or CRAM Ilka structure*
VI: Amino sugara / Cartoohydrataa
IV: Tannin
0.2 0.4 0.6
O /C0.8 1.2
Figure 42. van Krevelen diagram of EON5 sample. The overlain black circles show
major compound classes identified in DOM.

152
VITA
Rajaa Mesfioui
January 27,1978...............................................................................Bom-Beni Mellal, Morocco.
May 2001................................................................B.S. Chemistry, University o f Cady AyadBeni Mellal, Morocco
June 2006-May 2008...................... Chemistry Graduate Student, Old Dominion UniversityNorfolk, Virginia
May 2008..............................................................M.S. Chemistry, Old Dominion UniversityNorfolk, Virginia
June 2008-present...........................Chemistry Graduate Student, Old Dominion UniversityNorfolk, Virginia
December 2014......................................................Ph.D. Chemistry, Old Dominion UniversityNorfolk, Virginia