advances in water treatment and pollution prevention
TRANSCRIPT


Advances in Water Treatment and PollutionPrevention


Sanjay K. Sharma • Rashmi SanghiEditors
Advances in Water Treatmentand Pollution Prevention
123

EditorsSanjay K. SharmaJaipur Engineering College & Research
CentreJECRC FoundationJaipurIndia
Rashmi SanghiIndian Institute of Technology KanpurUPIndia
ISBN 978-94-007-4203-1 ISBN 978-94-007-4204-8 (eBook)DOI 10.1007/978-94-007-4204-8Springer Dordrecht Heidelberg New York London
Library of Congress Control Number: 2012942032
© Springer Science+Business Media Dordrecht 2012This work is subject to copyright. All rights are reserved by the Publisher, whether the whole or part ofthe material is concerned, specifically the rights of translation, reprinting, reuse of illustrations, recitation,broadcasting, reproduction on microfilms or in any other physical way, and transmission or informationstorage and retrieval, electronic adaptation, computer software, or by similar or dissimilar methodologynow known or hereafter developed. Exempted from this legal reservation are brief excerpts in connectionwith reviews or scholarly analysis or material supplied specifically for the purpose of being enteredand executed on a computer system, for exclusive use by the purchaser of the work. Duplication ofthis publication or parts thereof is permitted only under the provisions of the Copyright Law of thePublisher’s location, in its current version, and permission for use must always be obtained from Springer.Permissions for use may be obtained through RightsLink at the Copyright Clearance Center. Violationsare liable to prosecution under the respective Copyright Law.The use of general descriptive names, registered names, trademarks, service marks, etc. in this publicationdoes not imply, even in the absence of a specific statement, that such names are exempt from the relevantprotective laws and regulations and therefore free for general use.While the advice and information in this book are believed to be true and accurate at the date ofpublication, neither the authors nor the editors nor the publisher can accept any legal responsibility forany errors or omissions that may be made. The publisher makes no warranty, express or implied, withrespect to the material contained herein.
Printed on acid-free paper
Springer is part of Springer Science+Business Media (www.springer.com)

This book is for the coming generations, tomake them aware about the ‘cost’ of water.
– Sanjay K. Sharma and Rashmi Sanghi


Preface
Anyone who can solve the problems of water will be worthy oftwo Nobel prizes – one for peace and one for science.
John F. Kennedy
When the well is dry, we learn the worth of water.
Benjamin Franklin
The mighty words of John F. Kennedy and Benjamin Franklin underline quitesimply, and yet very powerfully, how important water is for the survival of our planetand its species and invite us to take measure against the dramatic consequences ofwater shortage.
Editing this book has been a very special experience for us because it has meantposing ourselves a crucial question: ‘how could we live without water?’
Nowadays, the world water crisis has assumed alarming proportions and certainlytwo causes in particular have played a crucial role in its intensification:
• The World’s growing population, and the consequent increase in water consump-tion and sanitation problems
• The fast-growing process of industrialization and development activities, whichhas led to water shortage and water pollution
The latter has been especially challenging because of its tangible and dramaticimpact on ecosystems, human well-being and economies. And it is on the effectsof water pollution that this book focuses its attention, examining what preventivemeasures can be taken against water pollution and stressing the need to implementgreener water treatments.
The high quality chapters gathered in this volume make Advances in WaterTreatment and Pollution Prevention a valuable resource to academic researchers,students, institutions, environmentalists, and anyone interested in environmentalpolicies aimed at safeguarding both the quality and the quantity of water. We are
vii

viii Preface
positive that the book will provide an insightful analysis of Water Pollution andof its treatments as well as of the processes that have been studied, optimized anddeveloped so far to sustain our environment.
We sincerely welcome feedback from our valuable readers and critics.
Jaipur, India Sanjay K. SharmaKanpur, India Rashmi Sanghi

About the Editors
Prof. (Dr.) Sanjay K. Sharma is a very wellknown author and Editor of many books, re-search journals and hundreds of articles fromlast 20 years. His recently published booksare Green Corrosion Chemistry and Engineering(From Wiley-VCH, Germany), Green Chemistryfor Environmental Sustainability, Handbook onApplications of Ultrasound: Sonochemistry andSustainability (both from CRC Taylor & Fran-cis Group, LLC, Florida, Boca Raton, USA) andHandbook of Applied Biopolymer Technology:Synthesis, Degradation and Applications (FromRoyal Society of Chemistry, UK). He has also been
appointed as Series Editor by Springer UK for their prestigious book series GreenChemistry for Sustainability. His work in the field of Green Corrosion Inhibitors isvery well recognized and praised by the international research community. Otherthan this, he is known as a person who is dedicated to educate people aboutenvironmental awareness, especially for Rain Water Harvesting.
Dr. Sharma has 13 books of Chemistry from National-International Publishersand over 48 research papers of National and International repute to his credit.Dr. Sharma is also serving as Editor-in-Chief for four international research journalsRASAYAN Journal of Chemistry, International Journal of Chemical, Environmentaland Pharmaceutical Research, International Journal of Water Treatment and GreenChemistry and Water: Research and Development. He is also a reviewer for manyother international journals including the prestigious Green Chemistry Letters andReviews.
Presently he is working as Professor of Chemistry at Jaipur Engineering Collegeand Research Centre, JECRC Foundation, Jaipur (Rajasthan) India, where heis teaching Engineering Chemistry and Environmental Engineering Courses toB. Tech. students, Spectroscopy courses to PG students and pursuing his researchinterests. He is a member of American Chemical Society (USA), International
ix

x About the Editors
Society for Environmental Information Sciences (ISEIS, Canada) and GreenChemistry Network (Royal Society of Chemists, UK) and is also life memberof various international professional societies including International Societyof Analytical Scientists, Indian Council of Chemists, International Congress ofChemistry and Environment, Indian Chemical Society, etc.E-mail: [email protected]
Dr. Rashmi Sanghi is currently working as aResearch Consultant at the Indian Institute of Tech-nology Kanpur and guest faculty at the LNM Instituteof Information Technology, Jaipur. After obtainingher D.Phil degree from Chemistry Department, Uni-versity of Allahabad, India, in 1994, she has beenworking at the Indian Institute of Technology Kanpur,India, as a Research Scientist. She was a Visiting Sci-entist at Chemistry Department, Rutgers University,Piscataway, NJ, USA in 1997 and worked with Prof.Alan S. Goldman.
She is passionate about environmental green chemistry and her major researchinterests are bioremediation, biopolymers and biosynthesis of nanomaterials usingmicrobes and/or polysaccharides. Her research mainly focuses on the developmentof methods that can help in minimizing or eliminating the hazardous substances inthe environment. Some of this work related to the green environmental chemistry isnothing but outstanding. She has traveled worldwide for various academic activitiesand/or professional talks. Her work on design and application of biopolymers inwastewater remediation shows great promise as evident by her patents A methodfor preparing auto capped nano particles such as CdS in continuous flow columnsusing fungus and Poly(acryl amide) grafted Cassia grandis-silica hybrid: efficientmetal ion adsorbent. She has over 90 international journal publications to her credit.She has published three books on green chemistry: Green Chemistry: Environ-ment Friendly Alternatives (2003), Green Chemistry and Sustainable Development(2005) and Green Chemistry for Environmental Remediation (2011). She is amember of many academic societies and reviewer of many international journals.E-mail: [email protected]; [email protected]

Acknowledgements
The time has come to express our sincere gratitude to all our friends, supportersand well wishers. We are heartily obliged for the support they have shown us whilewriting Advances in Water Treatment and Pollution Prevention.
First of all, we would like to thank all the esteemed contributors of this book.Without their contribution none of this would have been possible.
Professor Sharma would like to start by expressing his sincere gratitude to histeachers, Dr. R.K. Bansal, Dr. R.V. Singh, Dr. R.K. Bhardwaj, and Dr. SaraswatiMittal, the Gurus behind all his academic achievements and publications.
He then acknowledges Ackmez Mudhoo, Dr. Nabuk Eddy, Dr. Dong Chen,Dr. V.K. Garg, and all his friends and colleagues at the Jaipur Engineering Collegeand Research Centre (JECRC) for their active interest and moral support.
Finally, he praises his family. His parents, Dr. M.P. Sharma and Mrs. Parmesh-wari Devi, his wife Dr. Pratima Sharma, and all his family members for their neverending encouragement, moral support and patience over the months spent writingthis book. A special thank you goes to his children, Kunal and Kritika: valuablemoments of their lives have been missed because of his busy schedule.
Professor Sanghi would like to thank her family, who supported her all along.Her children, Surabhi and Udit, for their admirable patience and understanding thatgave her the strength to face this challenging project. Her husband, Dheeraj Sanghi,whose encouragement and optimism at every stage have been precious. Her familyfriend, Prof. Sudhir Jain, for her support, insights and critical comments. Thank youalso to her group of friends at IIT Kanpur for the relaxing walks they took together.Last but not least, a big thank you goes to Dr. Sanjay Sharma, editor of this bookwho ‘dragged’ her into this amazing project.
We are beholden to many other people whose names we have not been able tomention here but whose guidance has been very valuable. Finally, we would like tothank you our valuable readers and critics for encouraging us to do more and moreresearch on this issue.
Save Water! Think Green!Sanjay K. Sharma
Rashmi Sanghi(Editors)
xi


Abbreviations
Alum Aluminum SulfateAOT Advanced oxidation technologyAR88 Acid red 88BDD Boron-doped diamondBEA-SECT Background electrolyte-assisted sonoelectrochemical treatmentBOD Biological oxygen demandCl-MBE Mass balance error based on chlorine atoms, %CNTs Carbon nanotubesCOD Chemical oxygen demandDBS DodecylbenzenesulfonateDCE DichloroethyleneDE Degradation efficiency, %DF DiclofenacDLVO Derjaguin, Landau, Verwey and OverbeekDNOC 4,6-Dinitro-o-cresolDOE Department of EnvironmentECT Electrochemical treatmentEDTA Ethylenediaminetetraacetic acidf FrequencyF Faraday constant, C mol�1
FC Fractional conversion, %GC Gaseous chromatographyGO Graphene oxideHPLC High performance liquid chromatographyIa Ultrasound intensityIBP IbuprofenIC Ion chromatographyMB Methylene blue
xiii

xiv Abbreviations
MCP MonocrotophosMDB Meldola blueMG Malachite greenMO Methylene orangeMTBE Methyl tert-butyl etherMWCNT Multi-walled carbon nanotubeNBB Naphthol blue backNPE Nonylphenol ethoxylateODE Ordinary differential equationOG Orange GPAC Polyaluminum chloridePBM Population Balance Modelp-CBA p-Chlorobenzoic acidPCE PerchloroethylenePCP PentachlorophenolPOMB Palm oil mill boilerPOME Palm oil mill effluentPZT Lead ziconate titanateRB5 Reactive black 5SCE Saturated calomel electrodeSCl Chloride ion selectivitySCT Sonochemical treatmentSECT Sonoelectrochemical treatment without background electrolyte
additionSEF Sonoelectro-FentonSERS Surface-enhanced Raman spectroscopyTCE TrichloroethyleneTEM Transmission electron microscopyTOC Total organic carbonUV UltravioletVA-C Cathode-anode voltagezpc Zero point charge

Contents
1 Green Practices to Save Our Precious “Water Resource” . . . . . . . . . . . . . 1Sanjay K. Sharma, Rashmi Sanghi, and Ackmez Mudhoo
2 Water Pathways Through the Ages: From EarlyAqueducts to Next Generation of Wastewater Treatment Plants . . . . . 37Giusy Lofrano Ph.D., Jeanette Brown, and Giovanni De Feo
3 The Removal of Illicit Drugs and Metabolites DuringWastewater and Drinking Water Treatment . . . . . . . . . . . . . . . . . . . . . . . . . . . . 55Alexander L.N. van Nuijs and Adrian Covaci
4 Removal of Dyes and Pigments from Industrial Effluents . . . . . . . . . . . . . 65Tjoon Tow Teng and Ling Wei Low
5 Heavy Metal Removal Through Biosorptive Pathways . . . . . . . . . . . . . . . . 95Jinsheng Sun, Yulan Ji, Fang Cai, and Jing Li
6 Mesoporous-Assembled Nanocrystal Photocatalystsfor Degradation of Azo Dyes . . . . . . . . . . . . . . . . . . . . . . . . . . . . . . . . . . . . . . . . . . . . . . 147Thammanoon Sreethawong
7 Microwave-Assisted Organic Pollutants Degradation . . . . . . . . . . . . . . . . . . 177Ackmez Mudhoo
8 Direct Flocculation Process for Wastewater Treatment . . . . . . . . . . . . . . . . 201Mei Fong Chong
9 Combined Macromolecular Adsorption and Coagulationfor Improvement of Membrane Separation in Water Treatment . . . . . 231Mohammed Al-Abri, Chedly Tizaoui, and Nidal Hilal
xv

xvi Contents
10 Hybrid Sonochemical Treatment of ContaminatedWastewater: Sonophotochemical and SonoelectrochemicalApproaches. Part I: Description of the Techniques . . . . . . . . . . . . . . . . . . . . . 267B. Neppolian, M. Ashokkumar, I. Tudela,and J. Gonzalez-Garcıa
11 Hybrid Sonochemical Treatments of Wastewater:Sonophotochemical and Sonoelectrochemical Approaches.Part II: Sonophotocatalytic and SonoelectrochemicalDegradation of Organic Pollutants . . . . . . . . . . . . . . . . . . . . . . . . . . . . . . . . . . . . . . . 303B. Neppolian, M. Ashokkumar, V. Saez, M.D. Esclapez,and P. Bonete
12 Nature Is the Answer: Water and Wastewater Treatmentby New Natural-Based Agents . . . . . . . . . . . . . . . . . . . . . . . . . . . . . . . . . . . . . . . . . . . . 337Jesus Sanchez-Martın and Jesus Beltran-Heredia
13 Polysaccharide-Based Macromolecular Materialsfor Decolorization of Textile Effluents . . . . . . . . . . . . . . . . . . . . . . . . . . . . . . . . . . . . 377Vandana Singh, Tulika Malviya, and Rashmi Sanghi
14 Wastewater Treatment with Concomitant BioenergyProduction Using Microbial Fuel Cells. . . . . . . . . . . . . . . . . . . . . . . . . . . . . . . . . . . 405Liping Huang, Shaoan Cheng, Daniel J. Hassett,and Tingyue Gu
Index . . . . . . . . . . . . . . . . . . . . . . . . . . . . . . . . . . . . . . . . . . . . . . . . . . . . . . . . . . . . . . . . . . . . . . . . . . . . . . . 453

Contributors
Mohammed Al-Abri Petroleum and Chemical Engineering Department, Collegeof Engineering, Sultan Qaboos University, Muscat, Oman
M. Ashokkumar School of Chemistry, University of Melbourne, Melbourne,Australia
Jesus Beltran-Heredia Department of Chemical Engineering and PhysicalChemistry, University of Extremadura, Badajoz, Spain
P. Bonete Grupo de Nuevos Desarrollos Tecnologicos en Electroquımica: Sono-electroquımica y Bioelectroquımica, Grupo de Fotoquımicay Electroquımica desemiconductores, Departamento de Quımica Fısica e Instituto de Electroquımica,Universidad de Alicante, Alicante, Spain
Jeanette Brown Manhattan College, Riverdale, NY, USA
Fang Cai School of Chemical Engineering and Technology, Tianjin University,Tianjin, People’s Republic of China
Shaoan Cheng State Key Laboratory of Clean Energy Utilization, Departmentof Energy Engineering, Zhejiang University, Hangzhou, China
Mei Fong Chong Department of Chemical and Environmental Engineering,Faculty of Engineering, The University of Nottingham, Semenyih, Selangor,Malaysia
Adrian Covaci Toxicological Centre, University of Antwerp, Antwerp, Belgium
Giovanni De Feo Department of Industrial Engineering, University of Salerno,Salerno, Italy
M.D. Esclapez Grupo de Nuevos Desarrollos Tecnologicos en Electroquımica:Sonoelectroquımica y Bioelectroquımica, Grupo de Fotoquımicay Electroquımicade semiconductores, Departamento de Quımica Fısica e Instituto de Electroquımica,Universidad de Alicante, Alicante, Spain
xvii

xviii Contributors
J. Gonzalez-Garcıa Grupo de Nuevos Desarrollos Tecnologicos enElectroquımica: Sonoelectroquımica y Bioelectroquımica, Departamento deQuımica Fısica e Instituto de Electroquımica, Universidad de Alicante, Alicante,Spain
Tingyue Gu Department of Chemical and Biomolecular Engineering,Ohio University, Athens, OH, USA
Daniel J. Hassett Department of Molecular Genetics, Biochemistry and Micro-biology, University of Cincinnati College of Medicine, Cincinnati, OH, USA
Nidal Hilal Centre for Water Advanced Technologies and Environmental Research(CWATER), College of Engineering, Swansea University, Swansea, UnitedKingdom
Liping Huang Key Laboratory of Industrial Ecology and EnvironmentalEngineering, Ministry of Education (MOE), School of Environmental Science andTechnology, Dalian University of Technology, Dalian, China
Yulan Ji School of Chemical Engineering and Technology, Tianjin University,Tianjin, People’s Republic of China
Jing Li Engineering Department, China Tianjin Chemical Engineering DesignInstitute, Tianjin University, Tianjin, People’s Republic of China
Giusy Lofrano Civil and Environmental Engineer, Salerno, Italy
Ling Wei Low School of Industrial Technology, Universiti Sains Malaysia,Penang, Malaysia
Tulika Malviya University of Allahabad, Allahabad, India
Ackmez Mudhoo Department of Chemical and Environmental Engineering,Faculty of Engineering, University of Mauritius, Mauritius
B. Neppolian SRM Research Institute, SRM University, Kattankulathur, Chennai,India
V. Saez Grupo de Nuevos Desarrollos Tecnologicos en Electroquımica:Sonoelectroquımica y Bioelectroquımica, Grupo de Fotoquımicay Electroquımicade semiconductores, Departamento de Quımica Fısica e Instituto de Electroquımica,Universidad de Alicante, Alicante, Spain
Jesus Sanchez-Martın Department of Chemical Engineering and PhysicalChemistry, University of Extremadura, Badajoz, Spain
Rashmi Sanghi Indian Institute of Technology Kanpur, UP, India
Sanjay K. Sharma Jaipur Engineering College & Research Centre, JECRCFoundation, Jaipur, India
Vandana Singh University of Allahabad, Allahabad, India

Contributors xix
Thammanoon Sreethawong Baan Klangmuang Luzern, Suanluang, Bangkok,Thailand
Jinsheng Sun School of Chemical Engineering and Technology, TianjinUniversity, Tianjin, People’s Republic of China
Tjoon Tow Teng School of Industrial Technology, Universiti Sains Malaysia,Penang, Malaysia
Chedly Tizaoui Centre for Water Advanced Technologies and EnvironmentalResearch (CWATER), College of Engineering, Swansea University, Swansea,United Kingdom
I. Tudela Grupo de Nuevos Desarrollos Tecnologicos en Electroquımica:Sonoelectroquımica y Bioelectroquımica, Departamento de Quımica Fısica eInstituto de Electroquımica, Universidad de Alicante, Alicante, Spain
Alexander L.N. van Nuijs Toxicological Centre, University of Antwerp, Antwerp,Belgium


Chapter 1Green Practices to Save Our Precious“Water Resource”
Sanjay K. Sharma, Rashmi Sanghi, and Ackmez Mudhoo
Water is H2O, hydrogen two parts, oxygen one but there isalso a third thing, that makes it water and nobody knowswhat that is.
–D.H. Lawrence (1885–1930)
1.1 Introduction
Water is one of the world’s most precious resources without which life is notpossible on Earth. It is equally important for agriculture and industry. We cannotimagine any “crop” or any “product” without the involvement of water. Apart fromits necessity for life, it has many unusual properties. Water is the only elementknown to man that exists naturally in all three states of matter. For example, it hasexceptional ability to store heat and can modify the earth’s temperature. In its solidform as ice, it has the ability to float on water allowing aquatic life to survive inwinter. Water has a very significant role in chemistry as an excellent solvent thatcan dissolve many ionic and polar substances. That is why it is an effective mediumfor carrying nutrients to plants as well as to animals. Water in its liquid state can beclassed as “strange” and “eccentric.”
S.K. Sharma (�)Jaipur Engineering College & Research Centre, JECRC Foundation, Jaipur, Indiae-mail: [email protected]
R. SanghiIndian Institute of Technology Kanpur, UP 208016, Indiae-mail: [email protected]; [email protected]
A. MudhooDepartment of Chemical and Environmental Engineering, Faculty of Engineering,University of Mauritius, Mauritiuse-mail: [email protected]; [email protected]
S.K. Sharma and R. Sanghi (eds.), Advances in Water Treatment and PollutionPrevention, DOI 10.1007/978-94-007-4204-8 1,© Springer ScienceCBusiness Media Dordrecht 2012
1

2 S.K. Sharma et al.
Water makes up more than 70% of every adult human body and 50–90% of allplants and animals, and without water, we would die in a few days. The humanbody is comprised mostly of water: the brain is made up of 95% water, blood 82%water, and lungs 90% water, and furthermore our blood mineral content is strikinglysimilar to saltwater. A mere 2% drop in our body’s water supply can trigger signsof dehydration. Water is also the major component of all living things, available inthe form of surface water, underground water, rainwater, and seawater. However,the total quantity of water on our planet Earth is very nearly constant and it keepscirculating through the hydrologic cycle. So, the water strictly is a fixed resource andthe total quantity of water on our planet is estimated at 1.36 � 109 km3. Water fromland and sea evaporates into the atmosphere, forms clouds, falls back to earth asrain or snow, and then into rivers and streams and back to the sea and air. The totalavailability of water on earth can be understood by the fact that 97.4% of earth’swater is available as seawater and rest includes 1.98% ice caps and glaciers, 0.59%groundwater, 0.014% freshwater lakes and other forms of water [1]. Roughly 99%of water available on earth is not useful for us. Only 1% water is available as Earth’sfreshwater for all our day-to-day uses and out of this more than one-third of it is usedfor agricultural, industrial, and domestic uses [2].
Our earth initially had clean water. Crystal clean water bubbled forth from everyspring. Since ancient times, people settled near sources of water and thus most of thecultures and communities grew along rivers and lakes in the area where some watersource in the form of spring or well was available. People often drank the water fromthe same lake or river in which they disposed of their wastes. In the same water, theywashed themselves and their animals. Consequently, they often became ill becauseof the water contaminated with dangerous microbes from the waste of human andanimals. Centuries later, as water became more contaminated, people took stepsto ensure they were drinking clean water. The ancient Greeks and Romans linedtheir drinking pottery with silver, believing that would ensure clean water. Later,they used boiling to ensure clean water. As recently as 1905, people used coppervessels exposed to sunlight as holding tanks that led to charcoal filters that producedfairly clean water. Although, the waterborne diseases have been controlled up to asatisfactory level, they are still very common in less developed and underdevelopedcountries due to inadequate waste disposal systems. Major problems that humanityis facing in the twenty-first century are related to water quantity and/or water qualityissues [2, 3] and will be more critical in future with issues such as global warming,climate change [4] resulting in floods and droughts [5]. Today, quality and pollutionof surface water is a not only an issue for scientists, but also for policymakers,politicians, and the public in general.
Many reviews have appeared in the scientific literature that covers various aspectsof waterborne diseases arising due to chemical pollution [6]. Pollutants have beenpresent since time immemorial, and life on the earth has always evolved amidstthem. Chemical pollutants construct a wide range of pollutants including nutrientssuch as nitrogen [7] and phosphorous compounds [8] and organic pollutants [9].Industrialization and intensive use of chemical substances such as petroleum oil,hydrocarbons (e.g., aliphatic, aromatic, polycyclic aromatic hydrocarbons (PAHs),

1 Green Practices to Save Our Precious “Water Resource” 3
BTEX (benzene, toluene, ethylbenzene, and xylenes), chlorinated hydrocarbons likepolychlorinated biphenyls (PCBs), trichloroethylene (TCE), and perchloroethylene,nitroaromatic compounds, organophosphorus compounds), solvents, pesticides, andheavy metals are contributing to environmental pollution. Presently, large-scalepollution due to man-made chemical substances and to some extent by naturalsubstances is of global concern. Seepage and run-offs due to the mobile nature andcontinuous cycling of volatilization and condensation of many organic chemicalssuch as pesticides have even led to their presence in rain, fog, and snow [10].The thousands of inorganic and organic trace pollutants occurring at the nanogramto microgram per liter concentration are called “micropollutants.” The sources ofsuch micropollutants are diverse ranging from industries and municipalities [11]to agriculture [12, 13]. Though people are very much aware about their increasingconcentration, designing sustainable treatment technologies is still a challenge forscientists worldwide [14–18].
Water is the oil of the 21st century.
–Andrew Liveris, CEO Dow Chemical, cited in “Running Dry,”The Economist, 21 Aug 08
1.2 Some Common Pollutants
1.2.1 Persistent Organic Pollutants (POPs)
POPs have been and continue to be of greatest environmental concern worldwide.Some prominent POPs (“legacy POPs” or “the dirty dozen”) have been listed in theAarhus Protocol and the Stockhome Convention [19]. They are highly chlorinatedcompounds like DDT (dichlorodiphenyltrichloroethane) and polycyclic aromatichydrocarbons (PAHs). The list of POPs is much longer [20] and allows newadditions to it. The recent additions are polybrominated diphenyl ethers (PBDEs)used as flame retardants [21, 22] and perfluoroalkyl chemicals (PFCs) used inseveral industrial applications [23, 24]. These additional POPs are called “emergingPOPs” [25]. While many POPs have been present in the atmosphere for decades,they could not be detected due to analytical limitations [26, 27]. POPs are dangerousfor health because of their bioaccumulation and biomagnification potential inaquatic food web [28–31].
1.2.2 Pollutants from Agricultural Sector
Agriculture is also a common pollution source [32], because several million tons ofchemicals and pesticides are being used for it globally. Use of such chemicals toincrease the crop production causes numerous health hazards to biota and humanbeings [33–36]. Acute poisoning from direct exposure to pesticides is risky for

4 S.K. Sharma et al.
agricultural workers, resulting in at least 20,000 deaths per year [37]. This is morefrequent in developing countries [38–40] as monitoring and assessing practices areoften limited [41] and enforcement of regulations are neglected [42]. The bannedPOPs like DDT and HCHs (hexachlorocyclohexanes) are used extensively indeveloping countries in agriculture and sanitation, because of their low cost andhigher effectivity [43, 44].
1.2.3 Arsenic
Arsenic is a naturally occurring element that can be found in atmospheric, marine,mining, freshwater, groundwater [45], and terrestrial environments [46]. It is mobi-lized by dissolution in water and emission into the atmosphere. This is accomplishednaturally through weathering of minerals and igneous rock, biological processes[47], and volcanic activities (including submarine volcanism). Human activitiesalso introduce arsenic into the environment via agriculture, and through aerial andwastewater discharge from mining and industry.
In Bangladesh, over 35 million of 130 million inhabitants are at increased riskfor cancer, cardiovascular, neurologic, and other diseases due to naturally occurringarsenic in drinking water [48]. The Bangladesh government and international aidorganizations, spearheaded by United Nations Children’s Fund (UNICEF), thenbegan installing tube wells that tapped into pathogen-free aquifers as an alternativewater source. The convenience and low cost of installing tube wells led millionsof people to install their own private well [49]. This access to groundwater, aswell as the introduction of oral rehydration therapy, was apparently effective indecreasing mortality rates. The unintended consequence, an epidemic of arsenicosisdue to chronic arsenic exposure, became apparent in the 1990s. The DhakaCommunity Hospital (DCH) and the School of Environmental Studies (SOES),Jadavpur University, Kolkata, India, monitored water quality from 0.1 million tubewells covering 64 districts of Bangladesh. The results showed that water samplesfrom 53 districts had arsenic concentration above the maximum permissible limit(0.05 mg L�1). The arsenic situation in the Chandipur village (7.2 km2 and 7,430inhabitants) for 1998–2004 showed that the situation had deteriorated. Out of 628hand tube wells samples analyzed, 537 (85.5%) samples had arsenic in excessof 0.01 mg L�1 and 73.9% of the samples had arsenic in concentrations morethan 0.05 mg L�1. Also, the severity of the arsenic pollution in groundwater wasconfirmed when 93% of the 970 people surveyed on a preliminary basis showedarsenic levels more than the normally accepted levels in hair, nail, and urine samples.
Arsenic concentrations in natural water and wastewater are a worldwide problemand often referred to as a calamity of the twentieth and twenty-first centuries. Today,the chronic exposure to arsenic is also known to have an adverse effect on humanhealth. Chronic arsenic ingestion from drinking water has been found to causecarcinogenic and noncarcinogenic health effects in humans [50]. An example ofvascular effects of arsenic exposure is the so-called blackfoot disease which was

1 Green Practices to Save Our Precious “Water Resource” 5
found to be endemic in the southwestern coast of Taiwan associated with arsenicexposure form drinking water [51]. The primary exposure route of inorganic arsenicis ingestion from drinking water due to natural contamination in groundwater fromdissolution of natural mineral deposits, industrial effluents and drainage problems[52], and of geogenic origin and caused by natural anoxic conditions in the aquifers[53]. While being a highly toxic element, arsenic has been studied to a lesserdegree than other toxic elements such as lead, cadmium, or mercury. Despite itsapplication in complete leukemia treatment, arsenic is constantly seen as a potentialenvironmental pollution source on a large scale. As of now, ongoing researchstrongly evokes the polluting nature of arsenic. The pressing need for environmentalprotection from excessive levels of arsenic has led to the development of arsenicremoval processes all over the world [54]. Existing arsenic removal technologiesreported in the literature range from oxidation, precipitation, coagulation, membraneseparation, ion exchange, biological treatment and removal systems, chemisorp-tions, filtration, to adsorption. Most of the established technologies for arsenicremoval make use of several of these processes, either at the same time or insequence. All of the removal technologies have the added benefit of removing otherundesirable compounds along with arsenic – depending on the technology, bacteria,turbidity, color, odor, hardness, phosphate, fluoride, nitrate, iron, manganese, andother metals can be removed [55].
1.2.4 Heavy Metals
Rapid industrialization and urbanization have resulted in elevated emission oftoxic heavy metals entering the biosphere. Various anthropogenic activities suchas mining and agriculture have polluted extensive areas throughout the world[56]. The release of heavy metals in biologically available forms may damage oralter both natural and man-made ecosystems [57]. Although some heavy metalsions are essential micronutrients for plant metabolism but if present in excessconcentration in soil, groundwater, and some aqueous waste streams can becomeextremely toxic to the receiving living micro and macro environments. Wastewaterfrom various industries, such as metal finishing, electroplating, plastics, and pigmentmining, contain several heavy metals of health and environmental concern, suchas cadmium, copper, chromium, zinc, and nickel [58]. The term “heavy metals”refers to metals and metalloids having densities greater than 5 gcm�3 and is usuallyassociated with pollution and toxicity although some of these elements (essentialmetals) are required by organisms at low concentrations [59]. Heavy metal toxicityand the danger of their bioaccumulation in the food chain represent one of themajor environmental and health problems of our modern society. Primary sources ofpollution is from the burning of fossil fuels, mining, and melting of metallic ferrousores, municipal wastes, fertilizers, pesticides, and sewage sludge [60]. The mostcommon heavy metals contaminants are: Cadmium (Cd), chromium (Cr), copper(Cu), lead (Pb), nickel (Ni), and zinc (Zn).

6 S.K. Sharma et al.
1.2.4.1 Cadmium
Cadmium (Cd) is one of the most toxic heavy metals and is considered nonessentialfor living organisms. Cadmium has been recognized for its negative effect on theenvironment where it accumulates throughout the food chain posing a serious threatto human health. Cadmium pollution has induced extremely severe effects on plants[61]. Cadmium, which is widely used and extremely toxic in relatively low dosages,is one of the principal heavy metals responsible for causing kidney damage, renaldisorder, high blood pressure, bone fraction, and destruction of red blood cells [62].
1.2.4.2 Chromium
Chromium (Cr) is one of the most important chemical contaminants of concern. Itexists in a series of oxidation states from �2 to C6 valence; the most importantstable states are 0 (element metal), C3 (trivalent), and C6 (hexavalent). Cr3C andCr6C are released to the environment primary from stationary point sources resultingfrom human activities. Acute and chronic adverse effects of chromium to warm-blooded organisms are caused mainly by Cr6C compounds. Most investigators agreethat chromium in biological materials is probably always in the trivalent state, thatgreatest exposures of Cr3C in the general human population are through the diet,and that no organic trivalent chromium complexes of toxicological importancehave been described. Hexavalent chromium is present in the effluents producedduring the electroplating, leather tanning, cement, mining, dyeing, fertilizer, andphotography industries and causes severe environmental and public health problems[63]. Its concentrations in industrial wastewater range from 0.5 to 270 mg/L and thetolerance limit for Cr6C for discharge into inland surface water is 0.1 mg/L and inpotable water is 0.05 mg/L.
1.2.4.3 Copper
Copper, one of the most widely used heavy metals, is mainly employed in electricaland electroplating industries, and in larger amounts is extremely toxic to livingorganisms. The presence of copper (II) ions causes serious toxicological concerns; itis usually known to deposit in brain, skin, liver, pancreas, and myocardium. Coppertoxicity is a much overlooked contributor to many health problems, includinganorexia, fatigue, premenstrual syndrome, depression, anxiety, migraine headaches,allergies, childhood hyperactivity, and learning disorders.
1.2.4.4 Nickel
Nickel is a naturally occurring element that exists in various mineral forms. It is usedin a wide variety of applications including metallurgical processes and electrical
1 Green Practices to Save Our Precious “Water Resource” 7
components such as batteries. Nickel contamination of the environment occurslocally from emissions of metal mining, smelting, and refining operations; fromcombustion of fossil fuels; from industrial activities, such as nickel plating and alloymanufacturing; from land disposal of sludges, solids, and slags; and from disposal aseffluents. Nickel toxicity reduces photosynthesis, growth, and nitrogenase activityof algae; fermentative activity of a mixed rumen microbiota; growth rate of marinebacteria; metabolism of soil bacteria; and mycelial growth, spore germination, andsporulation of fungi. Toxic effects of nickel to humans and laboratory mammalsare documented for respiratory, cardiovascular, gastrointestinal, hematological,musculoskeletal, hepatic, renal, dermal, ocular, immunological, developmental,neurological, and reproductive systems.
1.2.4.5 Lead
Lead is one of the most dangerous contaminants which is released to the environ-ment by various anthropogenic activities [64]. Lead poisoning is a medical conditioncaused by increased levels of the metallic lead in the blood. Lead may causeirreversible neurological damage as well as renal disease, cardiovascular effects,and reproductive toxicity. Humans have been mining and using this heavy metalfor thousands of years, poisoning themselves in the process due to accumulation,exposure, and direct contact.
1.2.4.6 Zinc
Zinc is an essential and beneficial element for human bodies and plants. Completeexclusion of Zn is not possible due to its dual role, an essential microelementon the one hand and a toxic environmental factor on the other [65]. However,Zn can cause nonfatal fume fever, pneumonitis, and is a potential hazard as anenvironmental pollutant. Zinc is an essential nutrient in humans and animals thatis necessary for the function of a large number of metalloenzymes.
1.2.5 Dyes
Dyes are highly dispersible aesthetic pollutants contributing to aquatic toxicity.Reminiscent or unspent dye materials are mainly responsible for the coloredeffluents from industries and its removal is therefore a necessary and inevitablestep for the recycling and disposal of the textile industrial effluents prior to itbeing discharged into sewers. Dyes can be classified according to the proceduresused in the dying processes or on the basis of the chromophoric groups (seeChap. 9). Synthetic dyes classified by their chromophores have different and stablechemical structures to meet various coloring requirements. Color removal from

8 S.K. Sharma et al.
wastewater is as important as the removal of soluble colorless organic substances,which contribute the major function of chemical oxygen demand. Synthetic dyescontaining various substituents like nitro and sulfonic groups are not uniformlysusceptible to decomposition by activated sludge in a conventional aerobic process.
Water is the basis of life and the blue arteries of the earth!Everything in the non-marine environment depends onfreshwater to survive.
–Sandra Postel, “Sandra Postel, Global Water Policy Project,”Grist Magazine 26 Apr 04
1.3 Green Practices to Save the “Precious Water Resource”
Remediation, whether by biological, chemical, or a combination of both means,is an effective technology for combating water pollution. Remediation of thepolluted sites by conventional approaches based on physicochemical methods canbe both technically and economically challenging in terms of time and cost.Besides, it is very important not to cause further secondary pollution. There is aneed to come up with eco-friendly and sustainable treatment technologies usingrenewable resources. Most of the organic pollutants are degraded or detoxificatedby physical, chemical, and biological treatments before being released into theenvironment. Although the biological treatments are a removal process for someorganic compounds, their products of biodegradation may also be hazardous. Thischapter selectively examines and provides a critical view on the knowledge gaps andlimitations in utilizing greener technologies as a viable solution to the problem ofpollution without transferring secondary pollution to the future. It discusses the fieldapplication strategies, approaches such as biosorption, bioremediation, microwave,and ultrasonic technology for monitoring and testing the efficacy of remediation ofpolluted sites.
1.3.1 Biosorption of Heavy Metals
Industrial wastewater containing heavy metals is a threat to public health becauseof the accumulation of the heavy metals in the aquatic life, which is transferredto human bodies through the food chain. All the more, nowadays, an increasingnumber of hazardous organic compounds together with variable levels of heavymetals ions are also being discharged into the environment [66]. Conventionalmethods for the removal of the heavy metals ions from wastewater include chemicalprecipitation, electrofloatation, ion exchange, reverse osmosis, and adsorption ontoactivated carbon. But due to operational demerits, high cost of the treatment, and thegeneration of toxic chemical sludges, some new technologies have been tried for along time. Recently attention has been diverted toward the biomaterials which areby-products or the wastes from large-scale industrial operations and agricultural

1 Green Practices to Save Our Precious “Water Resource” 9
waste materials. Among them, less expensive, nonconventional adsorbents likeapple waste, peanut hull carbon, agricultural wastes, and red mud are beinginvestigated for the removal of ions like the Cd and Ni ions. Adsorption of heavymetals onto suspended particles has been studied as a model of transportation ofmetals in rivers and sea. The effects of chemical composition and particle size onadsorption by suspended particles has also been studied. Attention had mostly beenon carbon as adsorption materials.
Biosorption is the binding and concentration of adsorbate(s) from aqueoussolutions (even very dilute ones) by certain types of inactive, dead, microbialbiomass. Some biosorbents can bind and collect a wide range of heavy metalswith no specific priority, whereas others are specific for certain types of metals.In the concept of biosorption, several chemical processes may be involved, suchas bioaccumulation, bioadsorption, precipitation by H2S production, ion exchange,and covalent binding with the biosorptive sites, including carboxyl, hydroxyl,sulphydryl, amino, and phosphate groups of the microorganisms. Research onbiosorption shows that it is sometimes a complex phenomenon where the metallicspecies could be deposited in the solid biosorbent through various sorption processessuch as complexation, chelation, microprecipitation, and oxidation/reduction. Thereis a significant research and practical interest to develop the methods that caneffectively remove the heavy metals and at the same time recover them in theirpure form for the potential reuse to avoid the secondary pollution problems of theseheavy metals. The major advantages of biosorption over conventional treatmentmethods include low cost, high efficiency, minimization of chemical or biologicalsludge, regeneration of biosorbents, and possibility of metal recovery. Anotherpowerful technology is adsorption of heavy metals by activated carbon for treatingdomestic and industrial wastewater. Active research on biosorption of heavy metals,intrinsically guided by the emerging concept of Green Chemistry, has led to theidentification of a number of microbial biomass types that are extremely effectivein concentrating metals. Green chemistry (environmentally benign chemistry) isthe utilization of set of principles that reduces or eliminates the use or generationof hazardous substances in the design, manufacture, and application of chemicalproducts [67]. The sections to follow highlight the pollution and toxicity character-istics of some selected heavy metals (Cd, Cr, Cu, Ni, Pb, and Zn) and summarizesome selected biosorbents studied for their ability to remove heavy metal ionsfrom synthetic and/or natural contaminated aqueous media (Table 1.1). Heavy metalremoval through biosorptive pathways is also discussed in Chap. 7.
1.3.2 Bioremediation
Bioremediation, which is defined as a process that uses microorganisms, greenplants, or their enzymes to treat the polluted sites for regaining their originalcondition has considerable strength and certain limitations. Bioremediation thatinvolves the capabilities of microorganisms in the removal of pollutants is themost promising, relatively efficient and cost-effective, economic, versatile, andenvironmentally sound solution [83] technology.

10 S.K. Sharma et al.
Tab
le1.
1B
ioso
rben
tsus
edfo
rhe
avy
met
alre
mov
alfr
omw
aste
wat
eran
dsy
nthe
tic
solu
tion
s
Met
alB
ioso
rben
t(s)
Bio
sorp
tion
perf
orm
ance
Ref
eren
ce
Cd
Bla
ckgr
amhu
sk(C
icer
arie
tinu
m)
Wit
h99
.99%
sorp
tion
effic
ienc
yfr
om10
mg/
Lca
dmiu
mso
luti
on,t
hebi
omas
sre
quir
edat
satu
rati
onw
as0.
8g/
mg
cadm
ium
.Bio
sorp
tion
was
rapi
dan
deq
uili
briu
mw
asac
hiev
edin
30m
in
[68]
Cd
Ric
epo
lish
agri
cult
ural
was
teT
hem
axim
umre
mov
alof
Cd2C
was
foun
dto
be9.
72m
g/g
atpH
8.6,
init
ial
Cd2C
conc
entr
atio
nof
125
mg/
L(2
0ıC
)[6
9]
Cd
Ora
nge
was
tes
from
oran
geju
ice
prod
ucti
onpr
oces
ses
Ads
orpt
ion
proc
ess
was
quic
kan
dth
eeq
uili
briu
mw
asat
tain
edw
ithi
n3
h.T
hem
axim
umad
sorp
tion
capa
city
ofor
ange
was
tew
asfo
und
tobe
0.40
,0.4
1,an
d0.
43m
mol
/gat
pH4–
6,re
spec
tivel
y
[70]
Cd
Eth
anol
-tre
ated
was
teba
ker’
sye
ast
biom
ass
Hig
hest
met
alup
take
of15
.63
mg
Cd2C
/g[7
1]
Cd
Red
alga
e(C
eram
ium
virg
atum
)B
ioso
rpti
onca
paci
tyfo
rC
d2Cio
nsw
as39
.7m
g/g
[72]
Cr
Neu
rosp
ora
cras
safu
ngal
biom
ass
Bio
sorp
tion
capa
city
ofac
etic
acid
-pre
trea
ted
biom
ass
was
foun
dto
be15
.85
˙0.
94m
g/g
biom
ass
unde
rop
timum
cond
ition
s.T
head
sorp
tion
cons
tant
sw
ere
foun
dfr
omth
eFr
eund
lich
isot
herm
mod
elat
25ı
C.T
hebi
osor
bent
was
rege
nera
ted
usin
g10
mM
NaO
Hso
luti
onw
ith
upto
95%
reco
very
and
reus
edfiv
eti
mes
inbi
osor
ptio
n–de
sorp
tion
cycl
essu
cces
sive
ly
[73]
Cr
Muc
ilag
inou
sse
eds
ofO
cim
umba
sili
cum
Seed
sbo
iled
inw
ater
wer
efo
und
tobe
supe
rior
inte
rms
ofm
echa
nica
lsta
bili
tyan
dex
hibi
ted
fair
lyop
tim
alC
r6Cup
take
kine
tics
.Max
imum
adso
rpti
onca
paci
tyfr
omL
angm
uir
isot
herm
was
205
mg
Cr/
gdr
yse
eds
[74]
Cr
Palm
flow
er(B
oras
sus
aeth
iopu
m)
For
Cr3C
,max
imum
adso
rpti
onca
paci
tyw
as6.
24m
g/g
byra
wad
sorb
ent
and
1.41
mg/
gby
acid
-tre
ated
adso
rben
t.Fo
rC
r6C,r
awad
sorb
ent
exhi
bite
da
max
imum
adso
rpti
onca
paci
tyof
4.9
mg/
g,w
here
asth
em
axim
umad
sorp
tion
capa
city
for
acid
-tre
ated
adso
rben
tw
as7.
13m
g/g.
The
rew
asa
sign
ifica
ntdi
ffer
ence
inth
eco
ncen
trat
ions
ofC
r6Can
dto
talc
hrom
ium
rem
oved
bypa
lmflo
wer
[75]

1 Green Practices to Save Our Precious “Water Resource” 11
Cr
Shel
lsof
wal
nut(
WN
S)(J
ugla
nsre
gia)
,ha
zeln
ut(H
NS)
(Cor
ylus
avel
lana
)an
dal
mon
d(A
S)(P
runu
sdu
lcis
)
Lan
gmui
ris
othe
rmw
ith
max
imum
Cr6C
ion
sorp
tion
capa
citi
esof
8.01
,8.2
8,an
d3.
40m
gg�
1fo
rW
NS,
HN
S,an
dA
S,re
spec
tivel
y.Pe
rcen
tage
rem
oval
byW
NS,
HN
S,an
dA
Sw
as85
.32%
,88.
46%
,and
55.0
0%,r
espe
ctiv
ely,
ata
conc
entr
atio
nof
0.5
mm
ol/L
[76]
Cr
Turb
inar
iaor
nata
seaw
eed
Bro
wn
seaw
eed
(Tur
bina
ria
spp.
)w
aspr
etre
ated
wit
hsu
lfur
icac
id,c
alci
umch
lori
de,a
ndm
agne
sium
chlo
ride
and
test
edfo
rit
sab
ilit
yto
rem
ove
chro
miu
mfr
omta
nner
yw
aste
wat
er.U
rbin
aria
wee
dex
hibi
ted
max
imum
upta
keof
abou
t31
mg
ofch
rom
ium
for
1g
ofse
awee
dat
anin
itia
lco
ncen
trat
ion
of1,
000
mg/
Lof
chro
miu
m.F
reun
dlic
han
dL
angm
uir
adso
rpti
onis
othe
rmm
odel
sw
ere
used
tode
scri
beth
ebi
osor
ptio
nof
Cr3C
byTu
rbin
aria
spp.
[77]
Cr
Hel
iant
hus
annu
us(s
unflo
wer
)st
emw
aste
Max
imum
met
alre
mov
alw
asob
serv
edat
pH2.
0.T
heef
ficie
ncie
sof
boil
edsu
nflow
erst
emab
sorb
ent
and
form
alde
hyde
-tre
ated
sunfl
ower
stem
abso
rben
tfo
rth
ere
mov
alof
Cr6C
wer
e81
.7%
and
76.5
%,r
espe
ctiv
ely,
for
dilu
teso
luti
ons
at4.
0g/
Lad
sorb
ent
dose
[78]
Cu
Neu
rosp
ora
cras
safu
ngal
biom
ass
Bio
sorp
tion
capa
city
ofac
etic
acid
pret
reat
edbi
omas
sw
asfo
und
tobe
15.8
5˙
0.94
mg/
gbi
omas
sun
der
optim
umco
nditi
ons.
The
adso
rptio
nco
nsta
nts
wer
efo
und
from
the
Freu
ndli
chis
othe
rmm
odel
at25
ıC
.The
bios
orbe
ntw
asre
gene
rate
dus
ing
10m
MN
aOH
solu
tion
wit
hup
to95
%re
cove
ryan
dre
used
five
tim
esin
bios
orpt
ion–
deso
rpti
oncy
cles
succ
essi
vely
[73]
Cu
Muc
ilag
inou
sse
eds
ofO
cim
umba
sili
cum
Seed
sbo
iled
inw
ater
wer
efo
und
tobe
supe
rior
inte
rms
ofm
echa
nica
lsta
bili
tyan
dex
hibi
ted
fair
lyop
tim
alC
r6Cup
take
kine
tics
.Max
imum
adso
rpti
onca
paci
tyfr
omL
angm
uir
isot
herm
was
205
mg
Cr/
gdr
yse
eds
[74]
Cu
Palm
flow
er(B
oras
sus
aeth
iopu
m)
For
Cr3C
,max
imum
adso
rpti
onca
paci
tyw
as6.
24m
g/g
byra
wad
sorb
ent
and
1.41
mg/
gby
acid
-tre
ated
adso
rben
t.Fo
rC
r6C,r
awad
sorb
ent
exhi
bite
da
max
imum
adso
rpti
onca
paci
tyof
4.9
mg/
g,w
here
asth
em
axim
umad
sorp
tion
capa
city
for
acid
-tre
ated
adso
rben
tw
as7.
13m
g/g.
The
rew
asa
sign
ifica
ntdi
ffer
ence
inth
eco
ncen
trat
ions
ofC
r6Can
dto
talc
hrom
ium
rem
oved
bypa
lmflo
wer
[75]
(con
tinu
ed)

12 S.K. Sharma et al.
Tab
le1.
1(c
onti
nued
)
Met
alB
ioso
rben
t(s)
Bio
sorp
tion
perf
orm
ance
Ref
eren
ce
Cu
Shel
lsof
wal
nut(
WN
S)(J
ugla
nsre
gia)
,ha
zeln
ut(H
NS)
(Cor
ylus
avel
lana
)an
dal
mon
d(A
S)(P
runu
sdu
lcis
)
Lan
gmui
ris
othe
rmw
ith
max
imum
Cr6C
ion
sorp
tion
capa
citi
esof
8.01
,8.2
8,an
d3.
40m
gg�
1fo
rW
NS,
HN
S,an
dA
S,re
spec
tivel
y.Pe
rcen
tage
rem
oval
byW
NS,
HN
S,an
dA
Sw
as85
.32%
,88.
46%
,and
55.0
0%,r
espe
ctiv
ely,
ata
conc
entr
atio
nof
0.5
mm
ol/L
[76]
Cu
Turb
inar
iaor
nata
seaw
eed
Bro
wn
seaw
eed
(Tur
bina
ria
spp.
)w
aspr
etre
ated
wit
hsu
lfur
icac
id,c
alci
umch
lori
de,a
ndm
agne
sium
chlo
ride
and
test
edfo
rit
sab
ilit
yto
rem
ove
chro
miu
mfr
omta
nner
yw
aste
wat
er.T
urbi
nari
aw
eed
exhi
bite
dm
axim
umup
take
ofab
out3
1m
gof
chro
miu
mfo
ron
egr
amof
seaw
eed
atan
init
ial
conc
entr
atio
nof
1,00
0m
g/L
ofch
rom
ium
.Fre
undl
ich
and
Lan
gmui
rad
sorp
tion
isot
herm
mod
els
wer
eus
edto
desc
ribe
the
bios
orpt
ion
ofC
r3Cby
Turb
inar
iasp
p.
[77]
Cu
Hel
iant
hus
annu
us(s
unflo
wer
)st
emw
aste
Max
imum
met
alre
mov
alw
asob
serv
edat
pH2.
0.T
heef
ficie
ncie
sof
boil
edsu
nflow
erst
emab
sorb
ent
and
form
alde
hyde
-tre
ated
sunfl
ower
stem
abso
rben
tfo
rth
ere
mov
alof
Cr6C
wer
e81
.7%
and
76.5
%,r
espe
ctiv
ely,
for
dilu
teso
luti
ons
at4.
0g/
Lad
sorb
ent
dose
[78]
PbPo
ly(2
-oct
adec
yl-b
utan
edio
icac
id),
prep
ared
from
poly
anhy
drid
ePA
-18
Ads
orpt
ion
capa
city
ofth
isw
ater
-ins
olub
lepo
lym
erfo
rle
ad(I
I)w
assu
bsta
ntia
lly
high
erth
anot
her
hete
roge
neou
sad
sorb
ants
and
iseq
uiva
lent
toth
ose
obta
ined
wit
hho
mog
eneo
usso
rben
ts
[79]
PbC
lay/
poly
(met
hoxy
ethy
l)ac
ryla
mid
e(P
ME
A)
com
posi
teM
axim
umad
sorp
tion
capa
city
81.0
2m
g/g
[80]
PbD
ieth
ylen
etri
amin
e–ba
cter
ialc
ellu
lose
Stud
ypr
ovid
esth
ere
lativ
ely
com
preh
ensi
veda
tafo
rth
eE
AB
Cap
plic
atio
nto
the
rem
oval
ofm
etal
ion
inth
ew
aste
wat
er[8
1]
PbN
ativ
ean
dac
idic
ally
mod
ified
Cic
erar
ient
inum
pod
biom
ass
171.
28m
g/g
for
acid
-tre
ated
biom
ass
[82]

1 Green Practices to Save Our Precious “Water Resource” 13
1.3.2.1 Microbial Remediation
The use of microbial biomass for the removal of toxic pollutants like heavy metalions from wastewater has emerged as an alternative to the existing conventionalmethods as a result of the search of low-cost, innovative methods. The disadvantagesof conventional methods such as incomplete removal, high cost due to high reagentand energy requirements, and generate toxic sludge or other waste products thatrequires disposal can be eliminated by the microbial remediation green methods.Microorganisms, which are capable of transforming metals from one oxidation stateto another, facilitate detoxification and/or the removal of metal ion, and have thusreceived recognition.
Because of the ubiquitous nature of microorganisms, their numbers and largebiomass, wider diversity and capabilities in their catalytic mechanisms [84], andtheir ability to function even in the absence of oxygen and other extreme conditions,the search for pollutant-degrading microorganisms like bacteria and fungus, anddeveloping methods for their application in the field have become an importanthuman endeavor. Their capabilities to degrade organic chemical compounds canbe used to attenuate the polluted sites. Many biomaterials such as seaweed micro-algae fungi and various other plant materials [85, 86] have been studied for theirmetal binding abilities. Among these, fungi have the advantage of producing smallresidual volume, fast removal, and easy installation of the process and possibility ofvalorization of fungal waste biomasses from industrial fermentations. Particularly,fungal biomass can be cheaply and easily procured in rather substantial quantities,as a by-product from established industrial fermentation processes. Live or deadmicrobial cells can be used as an adsorbent material for the removal of toxic metalions from aqueous solutions. The efficiency of dead cells in biosorbing metal ionsmay be greater, equivalent to, or less than that of living cells and may depend onfactors such as the microbe under consideration, pretreatment method used, andtype of metal ion being studied.
Many azo dyes, constituting the largest dye groups may be decomposed intopotential carcinogenic amines under anaerobic conditions in the environment.Attempts to develop suitable biological methods to decolorize these effluents havenot been very successful.
Because synthetic dyestuffs are resistant to biological degradation, color removalby bioprocessing is difficult. Moreover, the frequently high volumetric rate ofindustrial effluent discharge in combination with increasingly stringent legislationmakes the search for appropriate treatment technologies an important priority. Byfar, the class of microorganisms most efficient in breaking down synthetic dyesare the bacteria and fungus. Bacterial anaerobic reduction of azo dyes generatescolorless, dead end, and aromatic amine, which can be more toxic than the parentdye. Bacterial aerobic dye degradation has been confined to chemostat-enrichedcultures adapted to a single dye. Besides, decolorization by aerobic bacteria occursmainly by adsorption of dyestuff on the cell surface rather than biodegradation;therefore, low color removal efficiencies have been obtained by conventionalaerobic biological treatment systems. Expensive chemical or physical steps prior

14 S.K. Sharma et al.
to aerobic biological treatment are currently used. Abiotic means of reduction ofazo and other dyes exist but require highly expensive catalysts and reagents [87]. Anumber of biotechnological approaches have been suggested by recent research as ofpotential interest toward combating this pollution source in an eco-efficient manner,including the use of bacteria or fungi, often in combination with physicochemicalprocesses [88–91].
The White-rot fungi (WRF) constitute a diverse ecophysiological group com-prising mostly basidiomycetous (and, to a lesser extent, litter-decomposing) fungicapable of extensive aerobic lignin depolymerisation and mineralization. Thisproperty is based on the WRF’s capacity to produce one or more extracellular lignin-modifying enzymes (LME), which, thanks to their lack of substrate specificity, arealso capable of degrading a wide range of xenobiotics. White-rot fungi (WRF) candegrade a wide variety of recalcitrant compounds like lignin by their extracellularlignolytic enzyme system. The enzymes which allow WRF to degrade ligninalso allows them to degrade a wide range of hazardous xenobiotics [92] rangingfrom polycyclic aromatic hydrocarbons (PAHs) [93], chlorophenols polychlorinatedbiphenyls [94], organochlorine pesticides [95], nitrotoluenes, fuel additives [96],and dyes. WRF offer significant advantages as the ligninolytic enzymes producedby them are substrate nonspecific, and therefore can degrade a wide variety ofrecalcitrant compounds, especially complex aromatic pollutants like Creosote andAroclor all the way to carbon dioxide. WRF do not require preconditioning toparticular pollutants, because enzyme secretion depends on nutrient limitationnitrogen or carbon rather than the presence of a pollutant. In addition, becausethe enzymes are extracellular, the substrate diffusion limitation into the cell,generally observed in bacteria, is not encountered and also they enable the WRFto tolerate higher concentration of pollutants such as cyanide. Besides, the fungican even degrade very insoluble chemicals and hazardous environmental pollutants.WRF have a remarkable ability to degrade lignin, the complex three-dimensionalstructural polymer found in woody plants. The stereo irregularity of lignin makesit very resistant to attack by enzymes. The chiral carbons existing in both L andD configurations in lignin make it impossible for lignin to be absorbed and/ordegraded by intracellular enzymes. White rot fungi produce oxidase enzymes thatutilize glucose, glyoxal, methyl glyoxal, and other products of cellulose and lignindegradation as substrates for the production of hydrogen peroxide from molecularoxygen. Interestingly, white rot fungi do not use lignin as a carbon source forgrowth, but degrade the lignin to obtain the cellulose found in the wood fiber.Very inexpensive growth substrates such as corn cobs or other crop residues, woodchips, or surplus grains can be used to cultivate WRF in soil. White rot fungi can beeasily grown in liquid culture too. Wastewater treatment with concomitant bioenergyproduction using microbial fuel cells has been discussed in more detail in Chap. 18of this book.

1 Green Practices to Save Our Precious “Water Resource” 15
1.3.2.2 Phytoremediation
Phytoremediation has been suggested as an effective and low-cost method to cleanup contaminated soils and aquifers. The term phytoremediation (“phyto” meaningplant, and the Latin suffix “remedium” meaning to clean or restore) refers to adiverse collection of plant-based technologies that use either naturally occurring,or genetically engineered, plants to clean contaminated environments. Some plantswhich grow on metalliferous soils have developed the ability to accumulate massiveamounts of indigenous metals in their tissues without symptoms of toxicity [97, 98].The idea of using plants to extract metals from contaminated soil was reintroduced.Several comprehensive reviews have been written, summarizing many importantaspects of this novel plant-based technology [99–105]. The use of plants for reme-diation of metals offers an attractive alternative because it is solar-driven and canbe carried out in situ, minimizing cost and human exposure. Phytoremediation pro-motes the use of plants for environmental cleanup. Phytoremediation is a relativelynew approach to the cost-effective treatment of wastewater, groundwater, and soilscontaminated by organic xenobiotics, heavy metals, and radionuclides. Phytoreme-diation uses the green plants and their associated microbiota, soil amendments,and agronomic techniques to remove, contain, or render harmless environmentalcontaminants. It is an emerging technology which offers a potentially cost-effectiveand environmentally sound alternative to the environmentally destructive physicalmethods which are currently practiced for the cleanup of contaminated groundwater,terrestrial soils, sediments, and sludge.
Phytoremediation can be used to improve the quality of the secondary effluentdepending on plant species. The interested plant species characteristics shouldbe the native-salt resistance species and easy to find in the area. In addition, itwill be very beneficial if these plant species can be used as raw materials forlocal handicraft (www.chaipat.or.th) and for enhancing landscape managementof the factories for recreation area. Operation of phytoremediation is simple,uncomplicated, with low maintenancecost. The phytoremediation process consistsof four steps: soil physical properties conditioning, soil chemical and biologicalproperties conditioning, sustainable soil property improvement by using plants, andmonitoring of contaminant migration. The mechanisms and effectiveness of thesystem can be evaluated from the effluent, groundwater discharges from the areaand soil properties. In addition, a mathematical model to predict the contaminanttransport in the system can be developed to enhance the theoretical knowledge ofthe process.
Constructed Wetland Treatment Technology
Constructed wetlands are artificial wastewater technology (CWs) consisting ofshallow ponds or and energy savings, CWs have other features related to channelswhich have been planted with aquatic plants the environmental protection such as

16 S.K. Sharma et al.
promoting and which rely upon natural microbial, biological, physical biodiversity,providing habitat for wetland organisms and chemical process to treat wastewater.
Phytoremediation is marginally different from the constructed wetland treatmenttechnology, as it involves the use of living green plants for in situ risk reductionof contaminated soil, sludge, sediment, and groundwater through contaminantremoval, degradation, limited to in situ cleanup areas that have been contaminatedby past use. In contrast, the constructed wetland treatment technology is the involve-ment of living plants for ex situ cleanup of a steady flow of wastewater. In a broadersense, however, wetland treatment technology also falls under phytoremediation,since both technologies take advantage of primary producers (i.e., photosyntheticplants or other autotrophic organisms in either terrestrial or aquatic forms) toclean up and manage hazardous and nonhazardous contaminants, regardless of thefashion (i.e., in situ or ex situ) of application. Actually, the first documented plant-based system installed in Germany over 300 years ago was designed to removecontaminants from municipal wastewater. Since then, common designs such as reed-bed filters, natural and constructed wetlands, and floating plant treatment systemshave been actively developed; these designs were primarily intended for purifyingmunicipal sewage. In the past two decades, the initial concept of using plantsin wastewater treatment has been expanded to remediate contaminated shallowgroundwater, air, soil, and more recently, sediment and sludge. Phytoremediationintegrated with Wetland treatment has been also proposed to remove total dissolvedsolids contaminated in the effluent discharged from the pulp and paper millwastewater treatment plant.
Use of Macrophytes in Water Purification
Macrophytes are potent tools in the abatement of heavy metal pollution in aquaticecosystems receiving industrial effluents and municipal wastewater. They arepreferred over other bio-agents due to low cost, frequent abundance in aquaticecosystems, and easy handling. Some aquatic plants (macrophytes) includingEichhornia crassipes, Ludwigia sp., Salvinia, Hydrilla sp., Egeria, Typha sp., andPhragmtes are very useful in the purification of the water and may be used as aneco-friendly alternate because they have excellent capacity of absorbing nutrientsand other substances from the water [106]. Aquatic macrophytes in natural andconstructed wetlands proved to be a potent tool for the treatment of heavy metalsfrom industrial effluents. Several studies had been conducted globally by manyresearchers using the same fundamental [107–113]. Many of them experimentallyproved the use of plants to remove organic contamination from water. Macrophytesare very useful in nutrient and heavy metal recycling of various ecosystems [114]and they are present in water bodies globally. Roots and leaves of aquatic plants takepart in removing heavy metals and nutrients from water and wastewater. Eichhorniacrassipes (a free-floating microphyte) is present in a great abundance throughoutthe world and one of the worst types of weeds. It is quite reliable for removingheavy metals and nutrients from water and wastewater [115–120] by reducing BOD,

1 Green Practices to Save Our Precious “Water Resource” 17
removing heavy metals like Pb, Cr, Cu, Cd, and Zn. Its roots act like filters removingsuspended particles from water and decreasing turbidity [121–124].
Both live and dead biomass of macrophytes may be used in phytoremediation,though dead biomass is generally preferred in the treatment of industrial effluentsdue to reduced cost, easy disposal, and lack of active biochemical machinery leadingto metal toxicity and death of plants. Biomass disposal problem and seasonal growthof aquatic macrophytes are some of the limitations in the transfer of phytoremedia-tion technology from the lab to the field. Disposed biomass of macrophytes may beused for many fruitful applications. Genetic engineering, biodiversity prospecting,and X-ray diffraction spectroscopy are promising future prospects regarding theuse of macrophytes in phytoremediation studies. A multidisciplinary and integratedapproach may enable this embryonic technology to become the new frontier inenvironmental science and technology [125].
1.3.3 Photocatalytic Water Treatment Technology
Rural wastewater or treated municipal water may be used for agricultural andindustrial activities [126, 127]. But, recycled wastewater is normally infectedby the presence of suspended solids, dangerous coloforms, and soluble organiccompounds that are expensive and tedious job to treat [128]. Current water treatmenttechnologies like adsorption and coagulation are not useful for complete eliminationof the pollutants [129], and sedimentation, filteration, membrane technology, etc. areexpensive and generate toxic secondary pollutants to the water bodies [130]. On theother hand, the disinfection by-products generated in chlorination are mutagenic andcarciogenic to human being [131–133]. This scenario has led to the promotion ofadvanced oxidation processes (AOPs) as innovative water-treatment technologies.In this connection, semiconductor photocatalytic process has proved itself a greatmean as a low-cost, eco-friendly, and sustainable treatment technology producingzero waste in water/wastewater treatment science by employing semiconductorcatalysts like TiO2, ZnO, Fe2O3, CdS, GaP, and ZnS. Producing zero wasteproves this technique as the greenest technology. To date, the most widely usedphotocatalyst in the water treatment is the Degussa P–25 TiO2 catalyst [134].
1.3.4 Ultrasound Technology for Pollutant Degradation
Ultrasound is an attractive technology used in water and wastewater treatment fordegradation of recalcitrant anthropogenic organic contaminants and natural organicmatter, disinfection, and control of membrane fouling in water-filtration processes.The effects of ultrasound are combinations of both sonochemical and sonophysicaleffects. For sonochemical effects, cavitational bubble collapse produced hot spotscan thermolyze contaminants along water vapor and generate •OH radicals to

18 S.K. Sharma et al.
oxidize contaminants. For sonophysical effects, the turbulence produced by soundwaves (acoustic streaming and vibration), cavitational bubbles (microstreaming andmicrostreamers), and bubble collapse (shock waves and microjets) can enhancemixing, cleaning, and break down particles and macromolecules. The mechanismsof ultrasound make it unique compared with other physical and chemical processes.The advantages of ultrasound include potential chemical-free and simultaneousoxidation, thermolysis, shear degradation, and enhanced mass transfer processestogether.
Ultrasound is a longitudinal wave with a frequency typically between 16 kHzand 500 MHz [135, 136]. When ultrasound is introduced into liquid (e.g., water),it creates oscillating regions of positive and negative pressure. Correspondingly,the liquid molecules experience periodic compression and expansion cycles. Whenthe pressure amplitude exceeds the tensile strength of liquid during the rarefactionof ultrasonic waves, cavitational bubbles are formed. Cavitational bubbles col-lapse during the compression cycle of ultrasonic wave. Localized hot spots areformed which reach temperatures and pressures around 5,000 K and 500 atm,respectively [137], depending on factors such as ultrasonic power, frequency,hydrostatic pressure, temperature, solvent property, and dissolved gas. Accordingto the temperature profile, there are three zones associated with a cavitationalbubble: (i) Thermolytic center, which is the core of the bubble with localizedhot temperature (�5,000 K) and high pressure (�500 atm) during final collapseof cavitation. The high temperature results in thermolysis of volatile chemicalcompounds and water vapor producing radical species including •OH and •Hradical. The reactions between volatile chemical compounds and •OH radicalsin gaseous phase also happen in this region. (ii) Interfacial region between thecavitational bubble and bulk liquid. In this region, the thickness of the liquid isestimated about 200 nm from the bubble surface to the bulk and a lifetime is lessthan 2 �s. The temperature is about 2,000 K at the final cavitational collapse [138].There are vast gradients of temperature and pressure. Thermolysis and oxidationby •OH radicals of hydrophobic, nonvolatile, and hydrophilic compounds occur inthe region. In this interfacial region, hydrophobic compounds are more concentratedthan bulk solution, and hydrophilic compounds have the same concentration as thebulk solution. (iii) The bulk region with ambient temperature and pressure. The self-combination of •OH radicals produces hydrogen peroxide in the solution (reactiongiven below) along with a small amount of •OH radicals that react with hydrophiliccompounds including ionic compounds in bulk region.
2 � OH ! H2O2
•OH radicals can oxidize broad organic pollutants in water, similar to advancedoxidation processes (AOPs). Since •OH radicals are produced as a result ofcavitational collapse, they spatially concentrate inside the bubble and in the regionof bubble�bulk interface during collapse. Consequently, volatile and hydrophobiccompounds or parts are exposed to more •OH radicals in addition to thermolysis

1 Green Practices to Save Our Precious “Water Resource” 19
than hydrophilic ones and thus subject to more rapid degradation, because they tendto accumulate in these two regions.
Recently, more research has been directed toward ultrasound application in or-ganic pollutant remediation at a laboratory scale and the results are very promising.Degradation kinetics, reaction rate, concentration range, pollution composition,reactor configuration, tested frequency, temperature, pressure, intensity, bubblinggas, chemical used, conversion path way, treatment time, and achieved removalefficiency have been reported for many pollutants. Table 1.2 presents the degradationperformance of certain selected organic pollutants under ultrasonic enhanceddegradation. It clearly shows that almost a large variety of organic pollutants can beremediated by using ultrasound at the laboratory scale under various experimentallyimposed degradation conditions.
Perfluorinated chemicals such as perfluorooctane sulfonate (PFOS) and per-fluorooctanoate (PFOA) are globally distributed, bioaccumulative, metabolicallyand photochemically inert, and oxidatively recalcitrant [145, 146]. In the researchconducted, 200 kHz sonication cleaved the perfluorocarbon chains [145]. Thehalf-life of PFOS and PFOA degradations was 43 and 22 min, respectively,under the atmosphere of argon. Because PFOS and PFOA molecules have bothhydrophobic (perfluoroalkyl group) and hydrophilic group (acid group), they behavelike an anionic surfactant: The hydrophobic groups migrate and accumulate inthe bubble � bulk interfacial region and are subject to pyrolysis (or thermolysis)and •OH radical attack. Since PFOS and PFOA are nonvolatile, the pyrolysis inthe gaseous phase of cavitation should be ruled out. A faster degradation rate ofCCl4 occurred at 500 kHz than 20 kHz [147]. Sonication led to almost completemineralization of CCl4 for a relatively short irradiation time. Radical trap additiondid not change the reaction rate, since thermolysis is the mechanism of sonolyticdegradation. Similarly, [148] confirmed addition of t � BuOH, a hydroxyl radicalscavenger did not affect the degradation rate of carbon tetrachloride.
Ultrasound can also be used to degrade environmental emerging contaminants,such as pharmaceutical and personal care products, especially endocrine disruptorcompounds. The conventional microbiological processes used in municipal wastew-ater treatment plants are not designed or capable to remove these contaminants.The sonolytic destruction of estrogen hormones in aqueous solution, including 17’-estradiol, 17“-estradiol, estrone, estriol, equilin, 17’-dihydroequilin, 17’-ethinylestradiol, and norgestrel was investigated [149]. The results showed that 20 kHzsonolysis destructed 80–90% of individual estrogens at an initial concentration of10 �g L�1 within 40–60 min of reaction. The first-order degradation rate constantof individual estrogen increased with higher power intensity. However, the energyefficiency of the reactor was higher at lower power density. As a result, the choiceof reactor and ultrasonic power were important to achieve optimized kinetics andenergy efficiency.
The sonolysis of pharmaceutical compounds of levodopa and paracetamol inaqueous solutions was investigated [150]. In a study, the degradation kinetics andintermediate by-products of MTBE degradation were investigated with 20 kHzultrasound [151]. The observed pseudo first-order rate constant decreased from

20 S.K. Sharma et al.
Tab
le1.
2D
egra
dati
onpe
rfor
man
ceof
cert
ain
sele
cted
orga
nic
poll
utan
tsun
der
ultr
ason
icen
hanc
edde
grad
atio
n
Con
tam
inan
tE
xper
imen
talc
ondi
tion
sD
egra
dati
onef
ficie
ncy/
othe
rre
sult
/rem
arks
Ref
eren
ce
4–C
hlor
ophe
nol
28,5
0,10
0,20
0,an
d60
0kH
zdi
skfit
ted
onbo
ttom
ofth
e1
l50
Wca
lori
met
ric
pow
er,1
26.7
3,12
6.73
,50.
3,50
.3,a
nd50
.3cm
2ar
eth
era
diat
ing
face
,re
spec
tivel
y,re
acto
rja
cket
edat
20–3
0ıC
Rem
oval
effic
ienc
y(1
)60
0kH
z>
200
kHz>
50kH
z>
28kH
z(2
)10
0m
g/L
ofH
2O
2gi
ves
high
erde
grad
atio
nra
te(3
)1
gL
�1
iron
pow
der
wit
hsm
alle
rpa
rtic
lesi
zegi
ves
good
perf
orm
ance
(4)
pHD
3w
ith
6�
mol
L�
1pa
rtic
lesi
zean
d10
0m
gL
�1
H2O
2
give
sbe
stre
sult
[139
]
Pent
achl
orop
heno
l(P
CP)
500
Hz,
20kW
,3L
,wat
erja
cket
edto
avoi
dva
riat
ion
ofte
mp
belo
w3ı
C,0
.165
Wm
L�
1
(1)
Soni
cati
onhe
lps
todi
ssol
vem
ore
O3
than
non-
soni
cati
onan
dst
irri
ng(2
)O
zona
tion
wit
hso
nica
tion
enha
nce
the
degr
adat
ion
rate
ofPC
P(3
)A
udib
lefr
eque
ncy
incr
ease
sth
era
teco
nsta
ntth
anul
tras
onic
atio
nbe
caus
eau
dibl
efr
eque
ncy
prod
uces
stro
ngtu
rbul
ence
.90
%PC
Pof
100
mg
L�
1de
grad
ein
2m
inun
der
24m
gm
in�
1oz
one
feed
,pH
9.4
and
soni
cati
on
[140
]
Tetr
achl
orid
etr
ichl
oroe
thyl
ene
(TC
E)
1,2,
3-tr
i-ch
loro
prop
ane
20kH
zho
rn,6
0W
,1.3
278
cm2
radi
atin
gar
ea,3
50m
Lw
ater
-jac
kete
dre
acto
r
For
TC
E,
(1)
Whe
nth
ete
mp
incr
ease
s,ra
teco
nsta
ntre
duce
san
dha
lf-l
ife
incr
ease
s(2
)A
t10ı
C,h
alf-
life
is60
min
(3)
Whe
nth
epo
wer
inte
nsit
yin
crea
ses,
the
rate
cons
tant
incr
ease
san
dha
lf-l
ife
redu
ces
(4)
Ar>
air>
N2
The
mai
nm
echa
nism
ispy
roly
sis
inth
ebu
bble
[141
]

1 Green Practices to Save Our Precious “Water Resource” 21
CH
Cl 3
CC
l 4C
HB
rCl 2
CH
BrC
l
20kH
zho
rn,5
00W
,55
Wca
lori
met
ric
pow
er,0
.282
8cm
2
vibr
atin
gar
ea,5
0m
Lw
ater
-jac
kete
dre
acto
rat
25ı
C
Rem
oval
effic
ienc
yin
1h
is,c
ompo
nent
(rem
oval
effic
ienc
y),
CH
Cl 3
(48.
2%),
CC
l 4(6
4.6%
),C
HC
l 2B
r(58
.3)
and
CH
ClB
r 2(5
4.6)
degr
adat
ion
rate
from
am
ixtu
reis
CC
l 4>
CH
Cl 2
Br>
CH
ClB
r 2>
CH
Cl 3
[142
]
Am
mon
ia(a
)1.
7M
Hz
plat
etr
ansd
ucer
fitte
don
the
bott
omof
the
400
mL
reac
tor,
9.5
W,3
.142
8cm
2
vibr
atin
gar
ea,n
ote
mpe
ratu
reco
ntro
l(18
–33ı
C)
(b)
2.4
MH
zpl
ate
tran
sduc
erfit
ted
onth
ebo
ttom
ofth
e40
0m
Lre
acto
r,9.
5W
,3.1
428
cm2
vibr
atin
gar
ea,n
ote
mp
cont
rol
(1)
Am
mon
iare
mov
alef
ficie
ncy
was
high
erat
2.4
MH
zth
an1.
7M
Hz
for
allc
once
ntra
tion
(2)
Rem
oval
effic
ienc
yre
duce
sw
ith
liqu
idle
veli
ncre
men
tand
also
wit
hin
crem
enti
nam
mon
iaco
ncen
trat
ion
(3)
In2
hso
nica
tion
,the
max
imum
amm
onia
rem
oval
effic
ienc
yob
tain
edw
as32
%by
usin
g2.
4M
Hz
US
wit
h5%
amm
onia
conc
entr
atio
n.
[143
]
DD
T&
PCB
20K
Hz
horn
,170
W,1
.23
cm2
vibr
atin
gfa
ce,5
0%sa
ndsl
urry
of40
0m
L10
0H
z,75
kW,
50%
sand
slur
ry
(a)
20kH
z(1
)In
10m
in,D
DT
drop
ped
by70
%fr
om25
0m
gL
�1
ofD
DT
from
50%
sand
slur
ry(2
)In
60m
in,P
CB
drop
ped
by90
%fr
om25
0m
gL
�1
ofPC
Bfr
om50
%sa
ndsl
urry
(3)
In5
min
,PA
Hdr
oppe
dby
80%
from
400
mg
L�
1of
PAH
from
50%
soil
slur
ry(b
)10
0H
z70
0m
gL
�1
ofPC
Bdr
oppe
dto<
2m
gL
�1
in10
5m
inan
dth
epo
wer
was
0.2
kWL
�1
[144
]

22 S.K. Sharma et al.
1.25 � 10�4 to 5.32 � 10�5 s�1 as the concentration of MTBE increased from2.84 � 10�2 to 2.84 � 10�1 mmol L�1. The rate of degradation of MTBE increasedwith increasing power density of ultrasound and also with the rise in system tem-perature. In the presence of an oxidizing agent, potassium persulpfate, the sonolyticdegradation rate of MTBE was accelerated substantially. Tert-butyl formate andacetone were found to be the major intermediates of the degradation of MTBE.It was also found that the ultrasound coupled with Fenton reagent (Fe2C/H2O2)effectively degraded more than 95% of MTBE (2.84 � 10�2 mmol L�1) along withits intermediate products in 5 h, which was much more efficient than sonolysis alone.
Ultrasonic irradiation involves generation of intense ultraviolet wavelength lightwhich can cause the transition of an electron from the valence band into the conduc-tion band in the TiO2 semiconductor, leaving a positive hole charge responsibleof dissociation of water molecules to form hydroxyl free radicals. Addition ofhydrogen peroxide to the US/TiO2 system could promote further benefits to thedegradation efficiency. It was proposed that under ultrasonic irradiation, hydrogenperoxide can modify the TiO2 surface promoting the formation of titanium peroxide(TiO3) into the solution, which is active for oxidation reactions [152]. It wasdemonstrated that the degradation of methylene blue by an US/TiO2 system occursby hydroxyl radicals generated in the process and the addition of H2O2 acceleratedthe degradation of the dye for the TiO2-containing system up to an optimum value[153]. Recently, Abdullah and Ling [154] found that anatase TiO2 with certainamount of rutile phase exhibited better sonocatalytic performance than pure anatase.It was attributed to the role of rutile to avoid hole–electron recombination. Authorsalso remarked that the physical effect of ultrasound for the disintegration of the TiO2
particles might reduce the micro and mesoporosity leading to lower surface area.On the other hand, the above-mentioned reactivation of the sonocatalyst particlesdue to the cleaning effect of the ultrasonic streams enhances the efficiency of thedegradation. The net effect of both is accounted for the activity of the US/TiO2
system [154].Most of the oxidation technologies for wastewater degradation is barely used
individually for cost-effective operations, and this also includes sonocatalysis.Although photocatalysis and sonolysis have been extensively employed individuallyfor the degradation of several organic species in water, their combined use (i.e.,sonophotocatalysis) has received noticeably less attention. This combination isespecially attractive as ultrasound irradiation seems to overcome some drawbacksassociated to photocatalysis such as the mass transfer limitations and fouling ofthe solid catalyst. Promising results of synergistic effects of the integrated US–UV processes have been obtained in the degradation of model pollutant, suchas salicylic acid, 2–chlorophenol, acid formic, methyl tert-butyl ether, and diazodyes. As previously mentioned, the action of US toward UV is summarized by theincrement of the catalyst surface area due to the de-aggregation action of US, theimprovement of mass transfer of organic compounds between the liquid phase andthe catalysis surface, and the promotion of additional hydroxyl radicals due to theresidual hydrogen peroxide generated.

1 Green Practices to Save Our Precious “Water Resource” 23
1.3.5 Microwave Technology for Pollutant Degradation
Microwaves (frequencies of 0.3–300 GHz and wavelengths of 1 m to 1 mm) liebetween radio wave frequencies and infrared frequencies in the electromagneticspectrum. Microwaves can be reflected, transmitted, and/or absorbed. The absorbedMW energy is converted into heat within the material, resulting in an increase intemperature. Gases, liquids, and solids can interact with microwaves and be heated.An important characteristic of microwave heating is the phenomenon of “hotspot”formation, whereby regions of very high temperature form due to nonuniformheating [155]. The formation of standing waves within the microwave cavityresults in some regions being exposed to higher energy than others. This resultsin an increased rate of heating in these higher energy areas due to the nonlineardependence.
Microwave energy has been widely used in several domestic, industrial, andmedical applications such as food sterilization, organic/inorganic syntheses, poly-merization, dehydration, analyses and extraction, and biological destruction [156].The potential applications of microwave energy as remedial alternatives for varioustypes of wastes and diverse contamination of soils, sludge, or wastewater have alsobeen a growing field of research during the last decade [157]. The application ofmicrowave energy has proven to be superior to the use of conventional heating onaccelerating rates of biochemical/chemical reactions, improving yields, selectivelyactivating or suppressing reaction pathways, allowing for greater control of the heat-ing or drying process, and reducing equipment size and wastes and environmentalremediation [158].
Microwave power has been applied widely in the remediation of contaminatedsoils, treatment of wastes, oil and water separation, reduction of nitrogen oxidesand sulfur dioxide, polymer synthesis, organic reactions, and regeneration ofactivated carbon. Research carried out so far in this respect and with regard to theapplicability of microwave irradiation has shown that microwave technology maybe effective in treating wastewater at the various stages of the treatment processand hence improving the degradation of a variety of organic pollutants. A survey ofthe literature shows that there are three major types of research areas in the use ofmicrowave irradiation for the degradation of organic pollutants. These are stand-alone microwave-assisted degradation processes, combined microwave-assisteddegradation processes, and microwave-assisted catalytic degradation processes. Instand-alone processes, the microwave irradiation is the only kind of treatmentconditions imposed on the contaminants. In the combined process (hybrid process),microwave irradiation is coupled or performed in the presence of other degradationprocesses like ozonation, electrokinetic remediation, advanced oxidation, ultravioletillumination, or sonolysis [159]. In the microwave-assisted catalytic degradationprocesses, the contaminants are degraded in the presence of a catalyst, eitherhetereogeneous or homogeneous. Most of the studies in this category have reportedthe use of hetereogeous catalysts coupled with photocatalysis. Other researchershave also reported some salient findings and inferences on the advantages and

24 S.K. Sharma et al.
possible mechanisms involved in the use of microwave irradiation for organicpollutant degradation. More elaborate discussions on the application of microwavein the degradation of pollutants in wastewater are presented in Chap. 10.
1.3.6 Nanotechnology and Wastewater Treatment
Nanotechnology, the engineering and art of manipulating matter at the nanoscale(1–100 nm), offers the potential of novel nanomaterials for treatment of surfacewater, groundwater, and wastewater contaminated by toxic metal ions, organicand inorganic solutes, and microorganisms. Due to their unique activity towardrecalcitrant contaminants and application flexibility, many nanomaterials are un-der active research and development [160]. In the environmental technologyindustry alone, nanomaterials (nanostructured catalytic membranes, nanosorbents,nanocatalysts, and bioactive nanoparticles) will enable new means of reducing theproduction of industrial wastes, using resources more sparingly, and remediatingindustrial contamination, providing potable water, and improving the efficiencyof energy production [161]. Nanoscale control of membrane architecture mayyield membranes of greater selectivity and lower cost in both water treatmentand water fabrication. Fullerene-based oxidant nanomaterials such as C60 have ahigh electron affinity and reactivity, and are capable of producing reactive oxygenspecies such as singlet oxygen and superoxides. Fullerenes might be used inengineered systems to photocatalytically oxidize organic contaminants, or inhibit orinactivate microbes. As nanochemistry emerges as an important force behind newenvironmental technologies, the responsibility of considering the environmentalimplications of an emerging technology at its inception and taking every precautionto ensure that these technologies develop as tools of sustainability rather thanbecoming future liabilities are of major concern.
Sorbents are widely used in water treatment and purification to remove organicand inorganic contaminants. Examples are activated carbon and ion-exchangeresins. The use of nanoparticles may have advantages over conventional materialsdue to the much larger surface area of nanoparticles on a mass basis. In addition,the unique structure and electronic properties of some nanoparticles can make themespecially powerful adsorbents. Many materials have properties that are dependenton size. Hematite particles with a diameter of 7 nm, for example, adsorbed Cuions at lower pH values than particles of 25 or 88 nm diameter, indicating theuniqueness of surface reactivity for iron oxides particles with decreasing diameter.However, another study found that normalized to the surface area, the nanoparticleshad a lower adsorption capacity than bulk TiO2. Several types of nanoparticles havebeen investigated as adsorbents: metal-containing particles, mainly oxides, carbonnanotubes (CNTs) and fullerenes, organic nanomaterials, and zeolites.

1 Green Practices to Save Our Precious “Water Resource” 25
1.3.6.1 Carbon Nanotubes
Carbon nanotubes (CNTs) have attracted a lot of attention as very powerfuladsorbents for a wide variety of organic compounds from water. Examples includedioxin, polynuclear aromatic hydrocarbons (PAHs), DDT and its metabolites,chlorobenzenes and chlorophenols, phthalate esters, dyes, pesticides, and herbicidessuch as atrazine. Cross-linked nanoporous polymers that have been copolymerizedwith functionalized CNTs have been demonstrated to have a very high sorptioncapacity for a variety of organic compounds such as trichloroethylene. Carbonnanotubes and nanofibers exhibit extraordinary mechanical strength, electrical,chemical, and thermal characteristics, allowing for several potential applications[162]. Among all these applications, the use of carbon nanotubes and nanofibersas a catalyst or as a support seems to be most promising. The results publishedto date confirm that nanostructured carbon can represent a new class of advancedmaterials for catalytic applications due to specific metal support interactions givenby their graphitic structure [163]. The small size of these carbon nanostructuredmaterials, characterized by high specific surface areas of mesoporous nature,significantly contribute to the final catalytic performance of the system, since manycatalytic heterogeneous reactions are governed by mass and heat transfer phenom-ena between the catalyst particles and the bulk medium [164]. When comparedwith the traditional activated carbons, characterized by very high specific surfaceareas, the mesoporous nature of the nanostructured materials is advantageous andencourages further exploration in applications that typically are well establishedwith activated carbon catalysts. Multi-walled carbon nanotubes (MWCNT) can beefficiently used as support of ruthenium catalysts for the catalytic wet air oxidationof high-strength wastewater containing aniline. Garcia et al. [165] prepared catalystsusing different ruthenium precursors, ruthenocene [Ru(�5–C5H5)2], ruthenium (1,5-cyclooctadiene, 1,3,5-cyclooctatriene) [Ru(cod)(cot)], and ruthenium trichloride(RuCl3�xH2O), different impregnation methods (excess solution and incipient wet-ness impregnation), and different MWCNT support surface chemistry (nitric acid-oxidized MWCNT–COOH and Na2CO3 ion-exchanged MWCNT–COONa). Theefficiency of the aniline removal obtained with the catalysts prepared with differentprecursors decreases in the order [Ru(cod)(cot)]>RuCl3�xH2O> [Ru(�5–C5H5)2],100% aniline conversion being obtained after 45 min of reaction with the catalystprepared with [Ru(cod)(cot)]. ZnO nanocrystals were prepared by precipitationmethod [166]. After aging, washing, and drying, solids were calcined at 300ıCand examined as photocatalyst for UV-induced degradation of organophosphorusinsecticide, diazinon in aqueous solution. The effects of some operational parame-ters such as pH value, nanocatalyst loading, and initial insecticide concentration onthe degradation efficiency were discussed through the photocatalytic experimentsusing prepared ZnO nanocrystals as the photocatalyst. Daneshvar et al. [166]observed that the diazinon photodegradation quantum yield in UV/ZnO processincreased with decreasing the diameter size of ZnO from 33 to 14 nm, and the

26 S.K. Sharma et al.
quantum of results showed that the photocatalysis process in the presence of ZnOwith mean size of 14 nm offered the best energy efficiency. Accordingly, 80%removal of the insecticide, after selecting desired operational parameters couldbe achieved in a relatively short time. The batch removal of dye from textiledyeing wastewater by using nanooxide-decorated multiwalled carbon nanotubesunder electron beam conditions has recently been studied [167]. The effect ofdifferent nanooxide-decorated multiwalled carbon nanotubes content and irradiationdosage was also investigated. The color removal efficiency was 94.9% in dose of17.5 kGy. The color removal efficiency with Fe2O3-decorated multiwalled carbonnanotubes was similar to TiO2-decorated multiwalled carbon nanotubues. The CODremoval efficiency was 52.5% in the dose of 14.0 kGy. With the irradiation dose of17.5 kGy, the COD removal efficiency was 98.2% with TiO2-decorated multiwalledcarbon nanotubes. It was concluded that nanooxide-decorated multiwalled carbonnanotubes could effectively remove color and COD from aqueous solution underirradiation [167].
1.3.6.2 Nanocrystals
Chemically modified nanomaterials have also attracted a lot of attention, especiallynanoporous materials due to their exceptionally high surface area. The particlesize of such materials is, however, not in the nanorange but normally 10–100 mm.Another option is to modify chemically the nanoparticle itself. TiO2 functionalizedwith ethylenediamine was, for example, tested for its ability to remove anionicmetals from groundwater. Hierarchical CeO2 nanocrystal microspheres were syn-thesized [168] with a nonaqueous sol-gel method at a low temperature of 120ıC andtested with the batch removals of typical pollutants of Cr(VI) and rhodamine B fromsimulated wastewater. It was found that the nanostructured CeO2 could effectivelyremove Cr(VI) without pH preadjustment. Moreover, these nonaqueous sol-gel syn-thesized hierarchical CeO2 nanocrystal microspheres exhibited remarkable abilityto remove rhodamine B, suggesting they are promising absorbents for wastewatertreatment.
1.3.6.3 Magnetic Nanomaterials
With the latest developments in nanotechnology, various types of magnetic nanopar-ticles have also been successfully synthesized and have received considerableattention to solve environmental problems, such as accelerating the coagulationof sewage, removing radionuclides, adsorption of organic dyes, and remediationof contaminated soils. Apparently, the magnetic nanoparticles possess the ad-vantages of large surface area, high number of surface active sites, and highmagnetic properties, which lead to high adsorption efficiency, high removal rateof contaminants, and easy and rapid separation of adsorbent from solution viamagnetic field. In addition, it is possible that after magnetic separation by the

1 Green Practices to Save Our Precious “Water Resource” 27
external magnetic field, the harmful components can be removed from the magneticparticles, which can be reused [169]. This study investigated the applicabilityof maghemite (”-Fe2O3) nanoparticles for the selective removal of toxic heavymetals from electroplating wastewater. The maghemite nanoparticles of 10 nmwere synthesized using a sol-gel method and characterized by X-ray diffractionand transmission electron microscopy. The surface area of the nanoparticles wasdetermined to be 198 m2/g using the Brunauer–Emmett–Teller method. Batchexperiments were carried out to determine the adsorption kinetics and mechanismsof Cr(VI), Cu(II), and Ni(II) by maghemite nanoparticles. The adsorption processwas found to be highly pH dependent, which made the nanoparticles selectivelyadsorb these three metals from wastewater. The adsorption of heavy metals reachedequilibrium rapidly within 10 min and the adsorption data were well fitted with theLangmuir isotherm. Regeneration studies indicated that the maghemite nanoparti-cles undergoing successive adsorption–desorption processes retained original metalremoval capacity. Mesoporous carbon capsules have been prepared and encapsu-lated with Fe3O4 nanoparticles by the successive coating of a silica layer and asubsequent mesoporous silica/carbon layer on the surface of Fe3O4 nanoparticlesfollowed by chemical etching with NaOH solution [170]. These nanocompositeswere superparamagnetic at room temperature with a saturation magnetization of5.5 emu g�1, which provided the prerequisite for the fast magnetic separation inwastewater treatment application. Water treatment experiments indicated that theas prepared samples exhibited higher adsorption rates and more effective removalcapacity of organic pollutants compared with commercial activated carbon (AC),and their maximum adsorption capabilities for methylene blue (MB), congo red(CR), and phenol reached 608.04, 1656.9, and 108.38 mg g�1, respectively. It wasthus inferred that the multifunctional nanocomposites could hence be potentiallyused as absorbents for fast, convenient, and highly efficient removal of pollutantsfrom the wastewater, which would play important roles in the purification ordesalination of natural water and industrial effluents [170].
1.3.6.4 Nanofiltration Membranes
Nanofiltration membranes (NF membranes) are used in water treatment for drinkingwater production or wastewater treatment [171]. NF membranes are pressure-drivenmembranes with properties between those of reverse osmosis and ultrafiltrationmembranes and have pore sizes between 0.2 and 4 nm. NF membranes havebeen shown to remove turbidity, microorganisms, and inorganic ions. They areused for softening of groundwater (reduction in water hardness), for removal ofdissolved organic matter and trace pollutants from surface water, for wastewatertreatment (removal of organic and inorganic pollutants and organic carbon), and forpretreatment in seawater desalination.
A submerged nanofiltration membrane bioreactor (NF MBR) has been tested[172] using cellulose acetate membranes for 240 days to examine the performanceof the NF membrane in domestic wastewater treatment. The workers observed that

28 S.K. Sharma et al.
degradation of each water quality parameter over operation time could be attributedto the qualitative deterioration of the NF membrane caused by the hydrolysisof cellulose acetate, which leads to an increase in pore size and porosity, anddecrease in surface charge and hydrophobicity of cellulose acetate membranes.Five different kinds of dye aqueous solutions (Direct Red 75, 80, and 81, andDirect Yellow 8 and 27) were treated [173] with nanofiltration (NF) polyamide(PA) composite membranes to obtain basic information on the dyeing wastewaterreuse. The separation of dyes by the NF PA membrane appeared to be a goodprocess for the effective removal of dyes from dyeing wastewater. The extent ofthe separation of dyes by the membrane was almost 100% for all of the dyes used,producing colorless water. When artificial dyeing wastewater containing DirectRed 75, PVA, NaCl, and Na2SO4 was used as a feed solution for the membraneseparation process, it was observed [173] that separation efficiency turned out tobe good, especially when one of the chemical coagulants, alum, was used forthe pretreatment of the artificial dyeing wastewater. An integrated nanofiltration–membrane crystallization (NF-MC) system has been tested [174] for the removalof sodium sulfate from aqueous wastes originated by the production processof base raw materials (Ni–H) for special rechargeable batteries. Nanofiltrationexperiments on NF90–2540 FilmTec™ modules showed high rejection values tosodium sulfate (>99%) when operated at a pressure of 3.45 � 106 Pa; it was possibleto achieve a maximum permeate recovery factor of 50% when starting from 60 g L�1
Na2SO4 feed solution. The membrane crystallizer, operated downstream to the pre-concentrated NF unit, was able to produce thenardite crystals (the anhydrous formof sodium sulfate) grown from slurry with density up to 21 kg m�3; the solid productexhibited narrow size distribution (coefficient of variation 30%). Polypropylenehollow fiber membranes showed a hydrophobic character stable over 2 days ofcontinuous operation.
1.4 Concluding Remarks
Water is the element most essential to sustain human life; therefore, it is necessaryto create better understanding of water resources and foster public understandingthrough water education. Water education should not be only about water types,sources, uses, treatment, management, and its associated problems. It must includepeople’s perceptions of water, the level of their consciousness toward water usage,awareness of their civic responsibilities toward water, and cultural beliefs andpractices in relation to water [175]. Awareness should also be raised among peopleby taking the help of media and NGOs regarding conservation of water. Formationof new policies for sustainable development of water resources, regulating waterprices for water conservation, conservation education, pollution prevention, as wellas effective information management will help in satisfying the demand [175].

1 Green Practices to Save Our Precious “Water Resource” 29
References
1. Speidel EDH, Ruedisili LC, Agnew AF (1988) Perspectives on water: uses and abuses. OxfordUniversity Press, New York
2. Schwarzenbach RP, Escher BI, Fenner K, Hofstetter TB, Johnson CA (2006) The challengeof micropollutants in aquatic systems. Science 313:1072–1077
3. UNESCO (2009) UN Educ, Sci Cult, Organ. The United Nations World Water DevelopmentReport 3: Water in a changing world. UNESCO/Berghahn Books, Paris/New York
4. Huntington TG (2006) Evidence for intensification of the global water cycle review andsynthesis. J Hydrol 319:83–95
5. Oki T, Kanae S (2006) Global hydrological cycles and world water resources. Science313:1068–1072
6. Fenwick A (2006) Waterborne infectious diseases—could they be consigned to history?Science 313:1077–1081
7. Gruber N, Galloway JN (2008) An earth–system perspective of the global nitrogen cycle.Nature 451:293–296
8. Filippelli GM (2008) The global phosphorus cycle: past, present, future. Elements 4:89–959. Jorgenson AK (2009) Foreign direct investment the environment, the mitigating influence
of institutional and civil society factors, and relationships between industrial pollution andhuman health: a panel study of less-developed countries. Organ Environ 22 (2)L:135–157
10. Dubus IG, Hollis JM, Brown CD (2000) Pesticides in rainfall in Europe. Environ Pollut110(2):331–344
11. Cosgrove WJ, Rijsberman FR (2000) World water vision: making water everybody’s business.WorldWater Council, London
12. Bockstaller C, Guichard L, Keichinger O, Girardin P, Galan MB, Gaillard G (2009)Comparison of methods to assess the sustainability of agricultural systems. A review. AgronSustain Dev 29:223–235
13. Eliopoulou E, Papanikolaou A (2007) Casualty analysis of large tankers. J Mar Sci Technol12:240–250
14. Larsen TA, Maurer M, Udert KM, Lienert J (2007) Nutrient cycles and resource management:implications for the choice of wastewater treatment technology. Wat Sci Technol 56:229–237
15. Lohse KA, Brooks PD, McIntosh JC, Meixner T, Huxman TE (2009) Interactions betweenbiogeochemistry hydrologic systems. Annu Rev Environ Resour 34:65–96
16. Heisler J, Glibert PM, Burkholder JM, Anderson DM, Cochlan W (2008) Eutrophication andharmful algal blooms: a scientific consensus. Harmful Algae 8:3–13
17. Kaushal SS, Groffman PM, Likens GE, Belt KT, Stack WP (2005) Increased salinization offresh water in the northeastern United States. Proc Natl Acad Sci U S A 102:13517–13520
18. Post VEA (2005) Fresh and saline groundwater interaction in coastal aquifers: is ourtechnology ready for the problems ahead? Hydrogeol J 13:120–123
19. Lohmann R, Breivik K, Dachs J, Muir D (2007) Global fate of POPs current and futureresearch directions. Environ Pollut 150:150–165
20. Muir DCG, Howard PH (2006) Are there other persistent organic pollutants? A challenge forenvironmental chemists. Environ Sci Technol 40:7157–7166
21. Vonderheide AP, Mueller KE, Meija J, Welsh GL (2008) Polybrominated diphenyl etherscauses for concern and knowledge gaps regarding environmental distribution, fate toxicity.Sci Total Environ 400:425–436
22. Yogui GT, Sericano JL (2009) Polybrominated diphenyl ether flame retardants in the USmarine environment: a review. Environ Int 35:655–666
23. Goss KU, Bronner G (2006) What is so special about the sorption behavior of highlyfluorinated compounds? J Phys Chem A 110:9518–9522
24. Prevedouros K, Cousins IT, Buck RC, Korzeniowski SH (2006) Sources fate and transport ofperfluorocarboxylates. Environ Sci Technol 40:32–44

30 S.K. Sharma et al.
25. Schwarzenbach RP, Egli T, Hofstetter TB, Von Gunten U, Wehrli B (2010) Global waterpollution and human health. Annu Rev Environ Resour 35:109–136
26. Giger W (2009) Hydrophilic and amphiphilic water pollutants: using advanced analyticalmethods for classic and emerging contaminants. Anal Bioanal Chem 393:37–44
27. Richardson SD (2009) Water analysis emerging contaminants and current issues. Anal Chem81:4645–4677
28. Kelly BC, Ikonomou MG, Blair JD, Morin AE, Gobas F (2007) Food web–specific biomag-nification of persistent organic pollutants. Science 317:236–239
29. Kelly BC, Ikonomou MG, Blair JD, Surridge B, Hoover D (2009) Perfluoroalkyl contami-nants in an Arctic marine food web trophic magnification and wildlife exposure. Environ SciTechnol 43:4037–4043
30. Porta M, Puigdomenech E, Ballester F, Selva J, Ribas–Fito N (2008) Monitoring concentra-tions of persistent organic pollutants in the general population the international experience.Environ Int 34:546–561
31. Brown TN, Wania F (2008) Screening chemicals for the potential to the persistent organicpollutants: a case study of Arctic contaminants. Environ Sci Technol 42:5202–5209
32. Atapattu SS, Kodituwakku DC (2009) Agriculture in South Asia and its implications ondownstream health and sustainability: a review. Agric Wat Manag 96:361–373
33. FAO (2008) UN Food Agric Organ FAOSTAT statistical database. http://faostat.fao.org/site/424/default.aspx
34. USEPA (2008) Environ Prot Agency Pesticides. http://www.epa.gov/pesticides/35. Galt RE (2008) Beyond the circle of poison: significant shifts in the global pesticide complex
1976–2008. Glob Environ Change 18:786–79936. Reus J, Leendertse P, Bockstaller C, Fomsgaard I, Gutsche V (2002) Comparison and
evaluation of eight pesticide environmental risk indicators developed in Europe and recom-mendations for future use. Agric Ecosyst Environ 90:177–187
37. UNEP (2007) UN Environment Programme. Global Environment Outlook GEO4. Environ-ment for Development
38. Tilman D, Fargione J, Wolff B, D’Antonio C, Dobson A (2001) Forecasting agriculturallydriven global environmental change. Science 292:281–284
39. Oluwole O, Cheke RA (2009) Health and environmental impacts of pesticide use practices acase study of farmers in Ekiti State Nigeria. Int J Agric Sustain 7:153–163
40. Williamson S, Ball A, Pretty J (2008) Trends in pesticide use and drivers for safer pestmanagement in four African countries. Crop Prot 27:1327–1334
41. Menezes CT, Heller L (2008) A method for prioritization of areas for pesticides surveillanceon surface waters a study in Minas Gerais Brazil. Wat Sci Technol 57:1693–1698
42. Agrawal GD (1999) Diffuse agricultural water pollution in India. Wat Sci Technol 39:33–4743. Sarkar SK, Bhattacharya BD, Bhattacharya A, Chatterjee M, Alam A (2008) Occurrence
distribution and possible sources of organochlorine pesticide residues in tropical coastalenvironment of India an overview. Environ Int 34:1062–1071
44. Shi LL, Shan ZJ, Kong DY, Cai DJ (2006) The health and ecological impacts of organochlo-rine pesticide pollution in China bioaccumulation of organochlorine pesticides in human andfish fats. Hum Ecol Risk Assess 12:402–407
45. van Geen A, Protus T, Cheng Z, Horneman A, Seddique AA, Hoque MA, Ahmed KM (2004)Testing groundwater for arsenic in Bangladesh before installing a well. Environ Sci Technol38:6783–6789
46. Lafferty B (2008) Kinetics of Arsenic transformations in the soil environment. The 2008 JointAnnual Meeting
47. Smith PG (2007) Arsenic biotransformation in terrestrial organisms, A study of the transportand transformation of arsenic in plants fungi fur and feathers using conventional speciationanalysis and X–ray absorption spectroscopy. PhD Thesis, Queen’s University Canada
48. Smith AH, Lingas EO, Rahman M (2000) Contamination of drinking water by arsenic inBangladesh a public health emergency. Bull World Health Organ 78:1093–1103

1 Green Practices to Save Our Precious “Water Resource” 31
49. Opar A, Pfaff A, Seddique AA, Ahmed KM, Graziano JH, van Geen A (2007) Responses of6500 households to arsenic mitigation in Araihazar Bangladesh. Health Place 13:164–172
50. Steinmaus C, Yuan Y, Bates MN, Smith AH (2003) Case control study of bladder cancer anddrinking water arsenic in the Western United States. Am J Epidemiol 158:1193–1201
51. Tseng CH (2005) Blackfoot disease and arsenic: a never ending story. J Environ Sci Health C23:55–74
52. Mandal BK, Suzuki KT (2002) Arsenic round the world: a review. Talanta 58:2–23553. Buschmann J, Berg M, Stengel C, Winkel L, Sampson MK, Trang PTK, Viet PH (2008)
Contamination of drinking water resources in the Mekong delta floodplains arsenic and othertrace metals pose serious health risks to population. Environ Int 34:756–764
54. Chen YN, Chai LY, Shu YD (2008) Study of arsenic (V) adsorption on bone char fromaqueous solution. J Hazard Mater 160:168–172
55. Johnston R, Heijnen H (2001) Safe water technology for arsenic removal. Technologies forarsenic removal from drinking water 1–22. http://www.bvsde.opsoms.org/bvsacd/arsenico/technologies/Han.pdf. Accessed July 2008
56. Lu X, Kruatrachue M, Pokethitiyook P, Homyok K (2004) Removal of cadmium and zinc bywater hyacinth Eichhornia crassipes. ScienceAsia 30:93–103
57. Tyler G, Pahlsson AM, Bengtsson G, Baath E, Tranvik L (1989) Heavy metal ecology andterrestrial plants microorganisms and invertebrates a review. Wat Air Soil Pollut 47:189–215
58. Dang VBH, Doan HD, Dang–Vu T, Lohi A (2009) Equilibrium and kinetics of biosorption ofcadmium(II) and copper(II) ions by wheat straw. Bioresour Technol 100:211–219
59. Adriano DC (2001) Trace elements in terrestrial environments biochemistry bioavailabilityand risks of metals. Springer Verlag, New York
60. Peng K, Li X, Luo C, Shen Z (2006) Vegetation composition and heavy metal uptake bywild plants at three contaminated sites in Xiangxi area China. J Environ Sci Health Part A40:65–76
61. Baszynski T (1986) Interference of Cd2C in functioning of the photosynthetic apparatus ofhigher plants. Acta Soc Bot Pol 99:291–304
62. Drasch GA (1993) Increase of cadmium body burden for this century. Sci Tot Environ67:75–89
63. Demirbas E, Kobya M, Senturk E, Ozkan T (2004) Adsorption kinetics for the removal ofchromium (VI) from aqueous solutions on the activated carbons prepared from agriculturalwastes. Wat SA 30:533–539
64. Carrasquero Duran A, Flores I, Perozo C, Pernalete Z (2006) Immobilization of lead by avermicompost and its effect on white bean (Vigna Sinenis var Apure) uptake. Int J EnvironSci Technol 3:203–212
65. Brune A, Urbach W, Dietz KJ (1994) Compartmentation and transport of zinc in barley pri-mary leaves as basis mechanisms involved in zinc tolerance. Plant Cell Environ 17:153–162
66. Aksu Z (2005) Application of biosorption for the removal of organic pollutants a review.Process Biochem 40:997–1026
67. Kidwai M, Mohan R (2005) Green chemistry: an innovative technology. Foundations Chem7:269–287
68. Saeed A, Iqbal M (2003) Bioremoval of cadmium from aqueous solution by black gram husk(Cicer arientinum). Wat Res 37:3472–3480
69. Singh KK, Rastogi R, Hasan SH (2005) Removal of cadmium from wastewater usingagricultural waste rice polish. J Hazard Mater 121:51–58
70. Perez–Marın AB, Meseguer Zapata V, Ortuno JF, Aguilar M, Saez J, Llorens M (2007)Removal of cadmium from aqueous solutions by adsorption onto orange waste. J HazardMater 139:122–131
71. Goksungur Y, Uren S, Guvenc U (2005) Biosorption of cadmium and lead ions by ethanoltreated waste baker’s yeast biomass. Bioresour Technol 99:103–109
72. Sar{ A, Tuzen M (2008) Biosorption of cadmium(II) from aqueous solution by red algae(Ceramium virgatum) Equilibrium kinetic and thermodynamic studies. J Hazard Mater157:448–454

32 S.K. Sharma et al.
73. Tunali S, Kiran I, Akar T (2005) Chromium(VI) biosorption characteristics of Neurosporacrassa fungal biomass. Miner Eng 18:681–689
74. Melo JS, D’Souza SF (2004) Removal of chromium by mucilaginous seeds of Ocimumbasilicum. Bioresour Technol 92:151–155
75. Elangovan R, Philip L, Chandraraj K (2008) Biosorption of hexavalent and trivalentchromium by palm flower (Borassus aethiopum). Chem Eng J 141:99–111
76. Pehlivan E, Altun T (2008) Biosorption of chromium(VI) ion from aqueous solutions usingwalnut hazelnut and almond shell. J Hazard Mater 155:378–384
77. Aravindhan R, Madhan B, Raghava Rao J, Unni Nair B (2004) Recovery and reuse ofchromium from tannery wastewaters using Turbinaria ornata seaweed. J Chem TechnolBiotechnol 79:1251–1258
78. Jain M, Garg VK, Kadirvelu K (2009) Chromium(VI) removal from aqueous system usingHelianthus annuus (sunflower) stem waste. J Hazard Mater 162:365–372
79. Laurino JP (2008) Removal of Lead (II) Ions by poly 2 octadecyl butanedioic acid isothermaland kinetic studies. J Macromol Sci A Pur Appl Chem 45:612–619
80. Solener M, Tunali S, Safa Ozcan A, Ozcan A, Gedikbey T (2008) Adsorption characteristicsof lead (II) ions onto the clay poly (methoxyethyl) acrylamide (PMEA) composite fromaqueous solutions. Desalination 223:308–322
81. Shen W, Chen S, Shi S, Li X, Zhang X, Hu W, Wang H (2009) Adsorption of Cu (II) and Pb(II) onto diethylenetriamine bacterial cellulose. Carbohydr Polym 75:110–114
82. Nadeem R, Nasir MH, Hanif MS (2009) Pb (II) sorption by acidically modified Cicerarientinum biomass. Chem Eng J 150:40–48
83. Margesin R, Schinner F (2001) Bioremediation (natural attenuation and biostimulation)of diesel oil contaminated soil in an Alpine glacier skiing area. Appl Environ Microbiol67(7):3127–3133
84. Paul JF, McDonald ME (2005) Development of empirical geographically specific waterquality criteria A conditional probability analysis approach. J Am Wat Resour Assoc 41(5)art. no. 04095:1211–1223
85. Raji C, Anirudhan TS (1998) Copper-impregnated sawdust carbon for the treatment of as (III)rich water. J Sci Ind Res 57(1):10–15
86. Gardea-Torresdey JL, Tiemann KJ, Armendariz V, Bess-Oberto L, Chianelli RR, Rios J,Parsons JG, Gamez G (2000) Characterization of Cr (VI) binding and reduction to Cr (III) bythe agricultural byproducts of Avena monida (Oat) biomass. J Hazard Mater 80(1–3):175–188
87. Robinson T, McMullan G, Marchant R, Nigam P (2001) Remediation of dyes in textileeffluent a critical review on current treatment technologies with a proposed alternative. BioresTechnol 77:247–255
88. Willmott N, Guthrie J, Nelson G (1998) The biotechnology approach to colour removal fromtextile effluent. J Soc Dyers Colour 114:38–41
89. Borchert M, Libra JA (2001) Decolorization of reactive dyes by the white rot fungus Trametesversicolor in sequencing batch reactors. Biotechnol Bioeng 75(3):313–321
90. Beydilli MI, Pavlostathis SG, Tincher WC (1998) Decolorization and toxicity screeningof selected reactive azo dyes under methanogenic conditions. Wat Sci Technol 38(4–5 -54):225–232
91. Zissi U, Lyberatos G (2001) Improvement in bioreactor productivities using free radicalsHOCl induced overproduction of xanthan gum from Xanthomonas campestris and itsmechanism. Biotechnol Bioeng 72(1):62–68
92. Pointing SB (2001) Feasibility of bioremediation by white-rot fungi. Appl MicrobiolBiotechnol 57(1–2):20–33
93. Field JA, Barber LB II, Thurman EM, Moore BL, Lawrence DL, Peake DA (1992) Fateof alkylbenzenesulfonates and dialkyltetralinsulfonates in sewage contaminated groundwater.Environ Sci Technol 26(6):1140–1147
94. Novotny V, Witte JW (1997) Ascertaining aquatic ecological risks of urban stormwaterdischarges. Water Res 31(10):2573–2585

1 Green Practices to Save Our Precious “Water Resource” 33
95. Bumpus John A, Aust Steven D (1985) Studies on the biodegradation of organopollutants bya white rot fungus. United States Environmental Protection Agency, Office of Research andDevelopment, (Report) EPA, 404–410
96. Yadav JS, Reddy CA (1993) Degradation of benzene toluene ethylbenzene and xylenes(BTEX) by the lignin degrading basidiomycete Phanerochaete chrysosporium. Appl EnvironMicrobiol 59(3):756–762
97. Baker JA (1989) Case studies in organic contaminant hydrogeology. Environ Geol Wat Sci14(1):17–33
98. Entry JA, Watrud LS, Reeves M (1999) Accumulation of 137Cs and 90Sr from contaminatedsoil by three grass species inoculated with mycorrhizal fungi. Environ Pollut 104(3):449–457
99. Raskin I, Smith RD, Salt DE (1997) Phytoremediation of metals: using plants to removepollutants from the environment. Curr Opin Biotechnol 8(2):221–226
100. Meagher RB (2000) Phytoremediation of toxic elemental and organic pollutants. CurrentOpin Plant Biol 3(2):153–162
101. Lasat MM (2002) Phytoextraction of toxic metals: a review of biological mechanisms.J Environ Qual 31(1):109–120
102. McGrath RJ, Styles P, Thomas E, Neale S (2002) Integrated high-resolution geophysicalinvestigations as potential tools for water resource investigations in karst terrain. EnvironGeol 42(5):552–557
103. Garbisu C, Alkorta I (2001) Phytoextraction A cost-effective plant based technology for theremoval of metals from the environment. Bioresour Technol 77(3):229–236
104. Ghosh M, Singh SP (2005) A review on phytoremediation of heavy metals and utilization ofits byproducts. Appl Ecol Environ Res 3(1):1–18
105. Pilon-Smits E (2005) Phytoremediation. Annu Rev Plant Biol 56:15–39106. Boyd CE (1970) Vascular aquatic plants for mineral nutrient removal from polluted waters.
Econ Bot 24:95–103107. Cornwell DA, Zoltek J Jr, Patrinely CD, Furman TS, Kim JI (1977) Nutrient removal by water
hyacinths. J Wat Pollut Contr Fed 49:57–65108. Stewart KK (1970) Nutrient removal potential of various aquatic plants. Hyacinth Contr
J 8:34–35109. Wooten JW, Dodd JD (1976) Growth of water hyacinth in treated sewage effluent. Econ Bot
30:29–37110. Scheffield CW (1967) Water hyacinth for nutrient removal. Hyacinth Contr J 6:27–30111. Yount JL (1964) Aquatic nutrient reduction and possible methods. Report of the 35th
Anniversary Meeting, FL Anti–mosquito Association, pp 83–85112. Wolverton BC, Mckown MM (1976) Water hyacinth for removal of phenols from polluted
waters. Aquatic Bot 30:29–37113. Seidal K (1976) Macrophytes and water purification. In: Tourbier J, Pierson RW (eds)
Biological control for water pollution. Pennsylvania University Press, Pennsylvania, pp109–121
114. Pip E, Stepaniuk J (1992) Cadmium, copper and lead in sediments. Arch fur Hydrobilogie124:337–355
115. Holm LG, Plucknett DL, Pancho V, Herberger JP (1977) The world’s worstweeds: distributionand biology.University Press of Hawaii, Honolulu, 609 p
116. Mitchell DS (1976) The growth and management of Eichhornia crassipes and Salvinia spp.in their native environment and in alien situations. In: Varshney CK, Rzoska J (eds) Aquaticweeds in Southeast Asia 396. Dr. W. Junk, The Hague
117. Salati E (1987) Edaphic–phytodepuration: a new approach to waste water treatment. In:Reddy KR, Smith WH (eds) Aquatic plants for water treatment and resource recovery.Magnolia, Orlando, pp 199–208
118. Nor YM (1990) The absorption of metal ions by Eichhornia crassipes. Chem SpeciationBioavailability 2:85–91
119. Tiwari S, Dixit S, Verma N (2007) An effective means of bio–filtration of heavy metalcontaminated water bodies using aquatic weed Eichhornia crassipes. Environ Monit Assess129:253–256

34 S.K. Sharma et al.
120. Pinto CLR, Caconia A, Souza MM (1987) Utilization of water hyacinth for removal andrecovery of silver from industrial waste water. Wat Sci Technol 19(10):89–101
121. Wolverton BC (1989) Aquatic plant/microbial filters for treating septic tank effluent inwastewater treatment. In: Hammer DA (ed) Municipal industrial and agricultural waste.Lewis, Chelsea
122. Brix H (1993) Macrophytes–mediated oxygen transfer in wetlands: transport mechanism andrate. In: Moshiri GA (ed) Constructed wetlands for water quality improvement. Lewis, AnnArbor/London
123. Johnston CA (1993) Mechanism of water wetland water quality interaction. In: Moshiri GA(ed) Constructed wetland for water quality improvement. Lewis, Ann Arbor, pp 293–299
124. Stowell R, Ludwig R, Colt J, Tchobanoglous T (1981) Concepts in aquatic treatment design.J Environ Eng 112:885–894
125. Rai PK (2009) Heavy metal phytoremediation from aquatic ecosystems with special referenceto macrophytes. Crit Rev Environ Sci Technol 39(9):697–753
126. Bradley BR, Daigger GT, Rubin R, Tchobanoglous G (2002) Evaluation of onsite wastewatertreatment technologies using sustainable development criteria. Clean Technol Environ Policy4:87–99
127. Lapena L, Cerezo M, Garcia–Augustin P (1995) Possible reuse of treated municipal wastew-ater for Citrus spp. plant irrigation. Bull Environ Contam Toxicol 55:697–703
128. Viessman W Jr, Hammer MJ (1998) Water supply and pollution control, 6th edn. AddisonWesley Longman Inc, Menlo Park
129. Padmanabhan PVA, Sreekumar KP, Thiyagarajan TK, Satpute RU, Bhanumurthy K, SenguptaP, Dey GK, Warrier KGK (2006) Nano–crystalline titanium dioxide formed by reactiveplasma synthesis. Vacuum 80:11–12
130. Gaya UI, Abdullah AH (2008) Heterogeneous photocatalytic degradation of organic contam-inants over titanium dioxide: a review of fundamentals, progress and problems. J PhotochemPhotobiol C: Photochem Rev 9:1–12
131. Yang H, Cheng H (2007) Controlling nitrite level in drinking water by chlorination andchloramination. Sep Purif Technol 56:392–396
132. Lu J, Zhang T, Ma J, Chen Z (2009) Evaluation of disinfection by–products formation duringchlorination and chloramination of dissolved natural organic matter fractions isolated from afiltered river water. J Hazard Mater 162:140–145
133. Coleman HM, Marquis CP, Scott JA, Chin SS, Amal R (2005) Bactericidal effects of titaniumdioxide–based photocatalysts. Chem Eng J 113:55–63
134. Serpone N, Sauve G, Koch R, Tahiri H, Pichat P, Piccinini P, Pelizetti E, Hidaka H (1996)Standardization protocol of process efficiencies and activation parameters in heterogeneousphotocatalysis: relative photonic efficiencies. J Photochem Photobiol A: Chem 94:191–203
135. Ensminger D (1973) Ultrasonics: the low� and high�intensity applications. Marcel Dekker,New York
136. Thompson LH, Doraiswamy LK (1999) Sonochemistry: science and engineering. Ind EngChem Res 38:1215–1249
137. Suslick KS (1990) Sonochemistry. Science 247:1439–1445138. Riesz P, Berdahl D, Christman CL (1985) Free radical generation by ultrasound in aqueous
and nonaqueous solutions. Environ Health Perspect 64:233–252139. Liang J, Komarov S, Hayashi N, Kasai E (2007) Improvement in sonochemical degradation of
4�chlorophenol by combined use of Fenton�like reagents. Ultrason Sonochem 14:201–207140. Zeng L, McKinley JW (2006) Degradation of pentachlorophenol in aqueous solution by
audible–frequency sonolytic ozonation. J Hazard Mater 135:218–225141. Lim MH, Kim SH, Kim YU, Khim J (2007) Sonolysis of chlorinated compounds in aqueous
solution. Ultrason Sonochem 14:93–98142. Guo Z, Gu C, Zheng Z, Feng R, Jiang F, Gao G, Zheng Y (2006) Sonodegradation of
halomethane mixtures in chlorinated drinking water. Ultrason Sonochem 13:487–492143. Matouq MA-D, Al-Anber ZA (2007) The application of high frequency ultrasound waves to
remove ammonia from simulated industrial wastewater. Ultrason Sonochem 14(3):393–397

1 Green Practices to Save Our Precious “Water Resource” 35
144. Mason TJ, Collings A, Sumel A (2004) Sonic and ultrasonic removal of chemicalcontaminants from soil in the laboratory and on a large scale. Ultrason Sonochem 11:205–210
145. Moriwaki H, Takagi Y, Tanaka M, Tsuruho K, Okitsu K, Maeda Y (2005) Sonochemicaldecomposition of perfluorooctane sulfonate and perfluorooctanoic acid. Environ Sci Technol39:3388–3392
146. Vecitis CD, Wang Y, Cheng J, Park H, Mader BT, Hoffmann MR (2010) Sonochemicaldegradation of perfluorooctane sulfonate in aqueous film�forming foams. Environ SciTechnol 44:432–438
147. Francony A, Petrier C (1996) Sonochemical degradation of carbon tetrachloride in aqueoussolution at two frequencies: 20 kHz and 500 kHz. Ultrason Sonochem 3:77–82
148. Lee M, Oh J (2010) Sonolysis of trichloroethylene and carbon tetrachloride in aqueoussolution. Ultrason Sonochem 17:207–212
149. Suri RPS, Nayak M, Devaiah U, Helmig E (2007) Ultrasound assisted destruction ofestrogen hormones in aqueous solution: effect of power density, power intensity and reactorconfiguration. J Hazard Mater 146:472–478
150. Isariebel QP, Carine JL, Ulises � Javier JH, Anne � Marie W, Henri D (2009) Sonolysis oflevodopa and paracetamol in aqueous solutions. Ultrason Sonochem 16:610–616
151. Neppolian B, Jung H, Choi H, Lee JH, Kang J-W (2002) Sonolytic degradation of methyl tert-butyl ether: the role of coupled Fenton process and persulphate ion. Water Res 19:4699–4708
152. Tuziuti T, Yasui K, Iida Y et al (2004) Effect of particle addition on sonochemical reaction.Ultrasonics 42:597–601
153. Shimizu K, Matsuda Y, Nonomura T, Ikeda H, Tamura N, Kusakari S, Kimbara J, ToyodaH (2007) Dual protection of hydroponic tomatoes from rhizosphere pathogens Ralstoniasolanacearum and Fusarium oxysporum f.sp. radicis lycopersici and airborne conidia ofOidium neolycopersici with an ozone-generative electrostatic spore precipitator. Plant Pathol56:987–997
154. Abdullah AZ, Ling PY (2010) Heat treatment effects on the characteristics and sonocatalyticperformance of TiO2 in the degradation of organic dyes in aqueous solution. J Hazard Mater173:159–167
155. Hill JM, Marchant TR (1996) Modelling microwave heating. Appl Math Model 20:3–15156. Wu T-N (2008) Environmental perspectives of microwave applications as remedial alterna-
tives: review. Pract Periodical Hazard Toxic Radioactive Waste Manag 12:102–115157. Nuchter M, Ondruschka B, Bonrath W, Gum A (2004) Microwave assisted synthesis – a
critical technology overview. Green Chem 6:128–141158. Jones DA, Lelyveld TP, Mavrofidis SD (2002) Microwave heating applications in environ-
mental engineering—a review. Resour Conserv Recycl 34:75–90159. Cravotto G, Di Carlo S, Tumiatti V (2005) Degradation of persistent organic pollutants by
Fenton’s reagent facilitated by microwave or high–intensity ultrasound. Environ Technol26:721–724
160. Theron J, Walker JA, Cloete TE (2008) Nanotechnology and water treatment: applicationsand emerging opportunities. Crit Rev Microbiol 34(1):43–69
161. Bottero JY, Rose J, Wiesner MR (2006) Nanotechnologies: tools for sustainability in a newwave of water treatment processes. Integr Environ Assess Manag 4(2):391–395
162. Terrones M (2003) Science and technology of the twenty-first century: synthesis, propertiesand applications of carbon nanotubes. Ann Rev Mater Res 33:419–501
163. Tribolet P, Kiwi–Minsker L (2005) Carbon nanofibers grown on metallic filters as novelcatalytic materials. Catal Today 102:15–22
164. Sato S, Takahashi R, Sodesawa T, Nozaki F, Jin XZ, Suzuki S (2000) Mass–transfer limitationin mesopores of Ni–MgO catalyst in liquid–phase hydrogenation. J Catal 191(2):261–270
165. Garcia J, Gomes HT, Serp Ph, Kalck Ph, Figueiredo JL, Faria JL (2006) Carbon nanotubesupported ruthenium catalysts for the treatment of high strength wastewater with aniline usingwet air oxidation. Carbon 44:2384–2391
166. Daneshvar N, Aber S, Seyed Dorraji MS, Khataee AR, Rasoulifard MH (2007) Photocatalyticdegradation of the insecticide diazinon in the presence of prepared nanocrystalline ZnOpowders under irradiation of UV–C light. Sep Purif Technol 58:91–98

36 S.K. Sharma et al.
167. Shi WY, Gu JZ, Wu WJ (2011) Removal of dye from textile dyeing wastewater by usingoxidized multiwalled carbon nanotubes. Adv Mater Res 193:343–344
168. Xiao H, Ai Z, Zhang L (2009) Nonaqueous sol � gel synthesized hierarchical CeO2
nanocrystal microspheres as novel adsorbents for wastewater treatment. J Phys Chem C113(38):16625–16630
169. Hu J, Chen G, Lo IMC (2006) Selective removal of heavy metals from industrial wastewaterusing maghemite nanoparticle: performance and mechanisms. J Environ Eng 132(7):709–715
170. Zhang Y, Xu S, Luo Y, Pan S, Ding H, Li G (2011) Synthesis of mesoporous carbon capsulesencapsulated with magnetite nanoparticles and their application in wastewater treatment. JMater Chem 21:3664–3671
171. Lau WJ, Ismail AF (2009) Polymeric nanofiltration membranes for textile dye wastewatertreatment: preparation, performance evaluation, transport modelling, and fouling controls —a review. Desalination 245:321–348
172. Choi JH, Fukushi K, Yamamoto K (2007) A submerged nanofiltration membrane bioreactorfor domestic wastewater treatment: the performance of cellulose acetate nanofiltrationmembranes for long–term operation. Sep Purif Technol 52:470–477
173. Mo JH, Lee YH, Kim J (2008) Treatment of dye aqueous solutions using nanofil-tration polyamide composite membranes for the dye wastewater reuse. Dyes Pigments76(2):429–434
174. Curcio E, Ji X, Quazi AM, Barghi S (2010) Hybrid nanofiltration–membrane crystallizationsystem for the treatment of sulfate wastes. J Membrane Sci 360:493–498
175. Misra AK (2011) Impact of urbanization on the hydrology of Ganga Basin (India). WaterResour Manag 25:705–719

Chapter 2Water Pathways Through the Ages: From EarlyAqueducts to Next Generation of WastewaterTreatment Plants
Giusy Lofrano Ph.D., Jeanette Brown, and Giovanni De Feo
2.1 Introduction
As stated by philosopher Thales from Miletus (ca. 636–546 B.C.), “Hydor (Water)is the beginning of everything”. Thales understood that water is life and withoutwater no living thing will survive.
The availability of high-quality water as well as management of wastewateris a prerequisite for every urban development in every part of the world. Peoplehave always had to deal with the need of having enough water for their use andsubsequently manage wastewater for the protection of public health and theenvironment [1].
Over the centuries, civilizations developed structures to bring drinking water tothe population centers, especially through the use of aqueducts. There are manyhistorical records on the purpose and design of aqueducts. Many of these aqueducts,though thousands of years old, are still standing. But, there is limited historicalinformation on how wastewater was removed from population centers. This issurprising since the lack of sanitation affects human development to the same oreven greater extent as the lack of clean water. Although there is typically a stigmato discussing waste treatment, in reality as sanitation improved so did public health,economic conditions, and the evolution of man [2].
G. Lofrano Ph.D. (�)Civil and Environmental Engineer, via Asiago, 1-84132 Salerno, Italye-mail: [email protected]
J. BrownManhattan College, Riverdale, NY, USAe-mail: [email protected]
G. De FeoDepartment of Industrial Engineering, University of Salerno, 1-84084 Fisciano, Salerno, Italye-mail: [email protected]
S.K. Sharma and R. Sanghi (eds.), Advances in Water Treatment and PollutionPrevention, DOI 10.1007/978-94-007-4204-8 2,© Springer ScienceCBusiness Media Dordrecht 2012
37

38 G. Lofrano et al.
For centuries, wastewater management was not given much, if any, consideration.The importance of proper sanitation for the protection of public health was notunderstood by cities until the nineteenth century [3–5]. However, some earlycultures did understand that wastewater had to be managed and furthermore couldbe used beneficially. For example, the early civilizations of Syria and Palestine hadwater filtering techniques and channels which conveyed wastewater to farm fieldsfor use as a fertilizer.
In most early cultures, wastewater was disposed of in the streets and nearpopulation centers creating serious impacts on public health and the environment.Numerous epidemics occurred throughout Europe until the nineteenth century[3, 6–8]. Sadly, when it came to waste management and sanitation, even countriesthose that suffered epidemics, tended to have short memories.
Throughout history, wastewater management has presented people and gov-ernments with far-reaching technical and political challenges. The story of waterand wastewater management is at once a story of human ingenuity and humanfrailty [7, 9].
A number of keystone events defined the speed at which environmental man-agement evolved through the ages. Some of these events were scientific, such asstream purification models, while others were socioeconomic such as two worldwars [4, 10, 11]. However, according to the recent Human Development Report [7],the lesson from the past is that progress in wastewater management and sanitationwas driven above all by political coalitions uniting industrialists, municipalities, andsocial reformers. This means that if on one side developing new technologies as wellas appropriate strategies for wastewater management is required, on the other sidethere must be an urgent need to overcome the stigma of a polluted environment [2].
Although several historians and economists have described the evolution ofwastewater management through the ages [9, 12–15], they, as it is normal, oftenlack an engineering perspective. Several studies have reconstructed traces of ancientdams, aqueducts, and pipes [16], which provided water for human consumptionbut archaeological research has largely neglected the difficulty of wastewatermanagement [17]. Sewers and primitive treatment is omitted from archaeology andhistorical research and forgotten. This chapter intends to highlight those sanitationsystems as well as wastewater management strategies that were developed indifferent periods and cultures, why they were developed and where we are today.As stated by Walker (1971, cit. in [18]): “Analysis of many problems is generallysimplified by putting them into historical perspective”.
2.2 Water Pathways from Aqueducts to Sewer
2.2.1 Aqueducts
Today, the most popular image of aqueducts is associated with those designed bythe Romans who elevated them throughout their entire length on lines of arches.However, the Romans were not the first to construct aqueducts. In Persia, India,

2 Water Pathways Through the Ages: From Early Aqueducts to Next. . . 39
Egypt, and other areas of the Middle East, there were systems to convey waterhundreds of years before the Romans began building them [19]. For example,around 691 B.C., the Assyrians built an 80 km long limestone aqueduct 10 m highand 30 m wide that brought fresh water to the city of Nineveh.
Aqueducts were also built by Greeks before the Romans since Minoan Era [20].One of the most famous aqueducts in ancient Greece is the tunnel (undergroundaqueduct) of Eupalinos for the water supply of Samos [21].
2.2.1.1 Aqueducts During Minoan Era
Angelakis and coworkers [21–23] published studies carried out on aqueductsbuilt during the Minoan era. Their studies date a systematic evolution of watermanagement in Crete to early in the Bronze Age, i.e., the Early Minoan period(ca. 3500–2150 B.C.). Usually, aqueducts were used to collect water from springslocated apart from settlements [22]. Water was transported through aqueducts byclosed or opened terracotta pipes and/or opened or covered channels of variousdimensions and sections. Remains of aqueducts can be seen in Gournia, Karfi,Knossos (Mavrokolympos), Malia, Mochlos, Minoa, and Tylissos. Minoan hydrol-ogists and engineers were aware of some of the basic principles and practices ofwater sciences which are still used today. With their knowledge, they emphasizedconstruction and operation of aqueducts as a means to supply water to thepeople [21].
Most knowledge of how Minoan cities were supplied with potable water ismainly acquired from the Palace of Knossos. The water distribution system atKnossos, as well as the mountainous terrain and available springs, made aqueductspossible [24, 25]. According to studies by Angelakis et al. [23] and Mays et al.[25], the Minoan inhabitants of Knossos depended partially on wells, but mostly onwater provided by the Kairatos River to the east of the low hill of the palace, andon springs. Indications suggest that the water supply system of the Knossos palaceinitially relied on the spring of Mavrokolybos, a limestone spring located 450 msouthwest of the palace [26]. Due to growth in population, it was necessary to usesprings from longer distances to meet the increased demand. Thus, an aqueductmade of terracotta pipe provided a conduit to convey water from a perennial springon the Gypsadhes hill to meet the needs of the community [24, 27] as well as theaqueduct of Tylissos and the aqueduct of Manlia. The remnants of the aqueduct ofTylissos, which was 1.4 km long and extended from the spring Saint Mamas locatednorthwest of the palace, suggests that part of the aqueduct was constructed fromclosed pipes and part of it was a curved channel [23]. At the end of the conduits,a stone-made tank was used for water pretreatment, mainly to remove sedimentsand/or suspended solids, perhaps the first water treatment plant on record. Theaqueduct of Manlia was 2.4 km long and probably fed by a spring located west of thehilly area of Profitis Elias “Holly Hillock.” This aqueduct was also a combinationof closed terracotta pipes and opened channels [23].

40 G. Lofrano et al.
1 2 3 4 5 6 7 8 9 1110
Fig. 2.1 Flow sheet and components of a Roman aqueduct: (1) source – caput aquae; (2) steepchutes (dropshafts); (3) settling tank; (4) tunnel and shafts; (5) covered trench; (6) aqueductbridge; (7) inverted siphon; (8) substruction; (9) arcade; (10) distribution basin/castellum aquaedivisorium; (11) water distribution system (Reprinted from De Feo and Napoli [15] with kindpermission of © IWA Publishing)
2.2.1.2 Romans Aqueducts
The Romans were brilliant managers and engineers, and their systems rivaledmodern technology [2]. Rome’s water system is one of the marvels of the ancientworld. The aqueducts represented an outward symbol of all that Rome stood for andall that Rome had to offer [28]. Regarding it, Pliny wrote in the Naturalis Historia,“the greatest wonder the world has ever seen” (XXXVI, 24, 123). Figure 2.1 is adiagram showing the components of a typical Roman aqueduct.
One of the largest Roman aqueducts is the Augustan Aqueduct Serino-Naples-Miseno (Serino aqueduct) in the Campania Region, Southern Italy, which wasoriginally 96 km long [16]. However, about 49 km of branches were added makingthe total length of the Serino aqueduct complex around 145 km. After two millennia,the Fontis Augustei still continues to supply clear and freshwater for the inhabitantsof Naples using the headwaters from Acquaro-Pelosi at 380 m above sea leveland the Urciuoli at 330 m. De Feo and Napoli [16] investigated the historicaldevelopment of “Serino Aqueduct,” dating its construction between 33 and 12 B.C.,when Marcus Vipsanius Agrippa was curator aquarum in Rome. Its principal usewas to furnish the Roman fleet of Misenum with freshwater and also to supply waterfor the increasing demand of the important commercial harbor of Puteoli as well asdrinking water for big cities such as Cumae and Neapolis.
The Aegean island Lesvos preserves one of the most impressive Roman aque-ducts in Roman Greece dating to about the second or third century A.D. It was usedas the water supply of Mytilene, the capital of the island, and for water supply andirrigation for the south eastern area of the island. The aqueduct was fed by the lake ofMegali Limni (big lake), at the Olympus Mountain, and by other secondary springs,such as in the Agiassou area (i.e., Karini). The aqueduct passed through a variedlandscape; thus, it includes sections built on the soil surface, as well as, tunnels,and bridges [26]. The Lesvos aqueduct was 22 km long, with a uniform slope of0.0096 m/m, 0.65–1.10 m deep and 0.35–0.64 m wide (Karakostantinou 2006 cit.in [26]). It had a maximum capacity of about 127,000 m3 per day. A 170 m sectionof the aqueduct still remains at the village of Moria. The section is 27 m high and

2 Water Pathways Through the Ages: From Early Aqueducts to Next. . . 41
Fig. 2.2 (a) Remains of the Roman aqueduct in Moria, a Lesvian village at 6 km from Mytilenetown; (b) Pillars and the arcs of the arches
consists of 17 arches, also called “Kamares” laying on their column (Fig. 2.2a). Eachof the openings is comprised of three arches which are supported by a pillar. Thetops of the pillars each have cymatium and abacus architectural details. The walls arebuilt in the “emplekton” system, with two parallel rows of stone filled with rubble.The pillars and the arcs of the arches (Fig. 2.2b) are built of local marble which wasreadily available (Karakostantinou 2006 cit. in [26]).
One of the most complex and least studied aspects of Roman water supply isthe urban distribution system. The study of the ruins of Pompeii gives a clearerunderstanding of a typical Roman urban water distribution and treatment system.

42 G. Lofrano et al.
Publicfountains
Privatehouses
Baths andTheatres
Gates
Fine
a b
screen
Coarsescreen
Calices
Leadtank
5-7
m
Supply
House N.
1
2
3
4
5
6
Brickpier
Fig. 2.3 (a) Plan of distribution arrangements inside castellum divisorium (or castellum dividicu-lum) at Porta Vesuvii: plan et elevation; (b) Pompeii water tower or castellum secondarium(Source: Refs. [25, 29])
A branch of Serino aqueduct ran from Sarno to Pompeii, terminating in thecastellum divisorium, a large water tower at the highest point of the town near PortaVesuvii.
The entire castellum divisorium was housed inside a large brick building andconsisted of a shallow circular basin (Fig. 2.3a). After passing two coarse and finescreens to remove the worst impurities, the water then flowed through three parallelexit distribution channels; the entrance to each was regulated by wooden gates whichwould control water supply in case of drought [28]. The high water pressure wasalleviated by smaller secondary water towers called castellum secondarium througha series of lead pipes (Fig. 2.3b). The water towers were lead tanks positioned ontop of brick masonry pillars and were 6 m high.

2 Water Pathways Through the Ages: From Early Aqueducts to Next. . . 43
2.2.2 Ancient Sewers
The water that was collected from springs, conveyed by aqueducts and used byhumans was now contaminated with various impurities thus becoming wastewater.Wastewater caused odor, disease, attracted pests, and polluted the environment. Inmost places, wastewater just flowed into the streets or in ditches, but some culturesactually developed a system of sewers.
2.2.2.1 Roman Sewers
As stated above, much is known and has been written about Rome’s water supply[4, 16, 28]. Much less has been said of the impact of wastewater managementon Roman lifestyle. Although sewer and water pipes were not inventions of theRomans, since they were already present in other Eastern civilizations, they werecertainly perfected by the Romans. The Romans resumed the engineering works ofthe Assyrians and turned their concepts into major infrastructure to serve all thecitizens [2]. In addition to the famous aqueducts for supply of freshwater, ancientRome had an impressive sewage system. The most famous as well the largest knownancient sewer is the Cloaca Maxima.
Cloaca Maxima
The Cloaca Maxima was built during the dynasty of Tarquin (VI century B.C.),nearly three centuries before the first aqueduct (Aqua Appia 312 B.C.). Initiallyconstructed to drain the marsh on which Rome was later built, it originally stretchedmore than 100 m through the center of the Forum Romanum, between the BasilicaAemilia and Julia. It was 4.5 m wide and 3.3 m high, and was about 12 m below thepresent ground elevation [30]. It was built so solidly and with such foresight that itwas used by the Romans for over 2,500 years and a section close to the “Torre deiConti” is still working today [2].
The Cloaca Maxima spread throughout the city center. New shafts drained eachof the imperial fora, the area around the Carcer, Temples of Saturn and Castor, anda large duct running alongside the Via Sacra fed into the main channel in front ofthe Basilica Aemilia [31].
West Colosseum Drainage Channel
As is often the case, drainage channels and sewer systems were found by accidentat the archaeological excavation of the West Collector’s Colosseum. The super-intendent of Antiquities and the Fine Arts in Rome had ordered the cleaning ofthe floor below the arena of the Colosseum, as part of routine maintenance work.

44 G. Lofrano et al.
Fig. 2.4 West Collector in the architectonic system of the Coliseum
Superintendent Gianfilippo Carettoni invested funds to excavate the West Collectorand found it completely blocked. Archaeologists determined the duct was 130 cmacross and made of brick paving stones which dated to the time of Domitian, firstemperor of the Flavian Dynasty (81–96 B.C.). The walls of the duct were originallybuilt in oak planks wedged between the floor and the foundations, which werelater covered with concrete. The position of the West Collector in the architectonicsystem of the Colosseum is shown in Fig. 2.4.
2.2.3 After the Fall of Roman Empire
The end of the Roman Empire led to the deterioration of the aqueducts and sanitationsystems. Drainage and water supplies as well as the coastal road were no longerusable [2]. When the Roman Empire collapsed, the sanitary dark ages began andlasted for over 1,000 years (476–1800). People would toss waste into the streets,wastewater would run in open trenches along the walkways, and chamber pots

2 Water Pathways Through the Ages: From Early Aqueducts to Next. . . 45
would be emptied out of windows A few medieval cities, particularly in central andnorthern Italy including Milan, Arezzo, Bologna, and Florence had well intentionedprograms using municipal statutes to control environmental conditions to improvecity life and some cities in England also practiced good sanitation but these werethe exceptions.
2.2.3.1 Black Plague
During the middle age, epidemics raged through the majority of European cities.Waste leached into the groundwater and wells. Rivers in London and Paris wereopen sewers. Waste provided food for rats and although the Black Plague in 1349was not directly caused by poor sanitation, it had to be an indirect cause. Wherethere was good sanitation, such as at the Christchurch Monastery in Canterbury,England, no one contracted the Black Plague.
After the plague, scientists in England began to understand the connectionbetween disease and sanitation practices and convinced the leaders of the countrythey must control the random disposal of waste products. In 1372, Edward IIIforbade throwing waste into the Thames River. In 1388, there was an act ofParliament which “forbade the throwing of waste into ditches, rivers, and watercourses.” During the fifteenth century, Henry VI established a Commission ofSewers. The word “sewer” comes from old English and means seaward from thefact that the drains in London were open ditches which pitched toward the ThamesRiver and then to the sea.
2.2.3.2 Sewers of Paris
Around 1200, Phillipe Auguste had Parisian streets paved, incorporating a drain forwastewater in the middle. The first underground sewers were built in Paris in 1370beneath Rue Montmartre and drained to a tributary of the Seine River. During thereign of Napoleon, 130 km of vaulted sewers were constructed and by 1805 therewere over 182 miles of sewers. In 1850, the prefect for the Seine Baron Haussmannand the engineer Eugene Belgrand designed the present Parisian sewer and watersupply networks. They built a double water supply network (one for drinking waterand one for non-drinking water) and a sewer network which was 600 km long by1878 [2].
2.3 Wastewater Treatment Technology Evolution
Today, wastewater treatment is performed through a series of processes whichinclude preliminary treatment, primary treatment, secondary (biological treatment),and advanced treatment. Preliminary treatment removes rags, pieces of wood, grit,
46 G. Lofrano et al.
and other items which cannot be treated and will cause problems with furtherdownstream units. Primary treatment is a physical separation of solid and liquidswith heavier solids settling to the bottom of a tank and removed for further treat-ment. Secondary treatment is a biological treatment used to remove carbonaceouspollutants, and advanced treatment is used primarily to remove nutrients and traceorganics.
In the nineteenth century, there were outbreaks of cholera which brought aboutthe first centralized wastewater treatment technology which were early versions ofprimary treatment such as:
• 1860 – Septic Tank• 1868 – Trickling sand filter• 1893 – Septic tanks effluent treated with sand filters
2.3.1 Septic Tanks and Primary Treatment
The septic tank system is believed to have originated in France. In 1860, L.H.Mouras of Vesoul designed a cesspool in which the inlet and outlet pipes dippedbelow the water surface thus forming a water seal. Successively, Donald Cameronin 1895 patented septic tanks. The process gained great popularity and one observercommented, “Since the septic tank idea gained favor, every designer of sewage tankshas used the name septic for his tank, and apparently with good reason, for originallythe word septic meant simply bacterial, just as the word anti-septic means anti-bacterial” (Melosi 2000 cit. [4]).
One problem connected with the settling methods for wastewater treatment rightfrom the beginning was the disposal of the resulting sludge. The solution to thisproblem was the Imhoff Tank, patented in 1906, which consisted of a cylindricalsettling tank and a digestion tank directly underneath. The Imhoff Tank, beingthe model for other so-called two-storied facilities, introduced anaerobic sludgedigestion as the most commonly used method of sludge treatment in Germany. Inthe process of sludge treatment, digestion was followed by dewatering on dryingbeds and transportation for agricultural purposes [10]. In the United States, primarytreatment was the most common form of wastewater treatment until 1972 when thepassage of the Clean Water Act mandated secondary treatment.
2.3.2 Trickling Sand Filter
Up to 1900, virtually all sewage treatment, where it existed, was carried out byland treatment (irrigation). As the population continued to expand, it became moreand more difficult to find sufficient areas of land on the fringes of the towns andcities [4]. The idea that there was a way to purify wastewater through the use

2 Water Pathways Through the Ages: From Early Aqueducts to Next. . . 47
of microorganisms gradually began to emerge around the end of the nineteenthcentury [2]. The first experiments carried out by Frankland in 1870 on filtrationthrough soil, led to the concept of the tricking filter which is an attached growth(biofilm) process. In one of his experimental filters containing coarse porous gravelat Beddington Sewage Farm in Croydon, south of London, it was found that thewastewater loading rate of 0.045 m3/m3 of bed per day produced a well-nitrified(conversion of ammonia to nitrate) effluent and that the “filter” showed no signs ofclogging after 4 months of operation (Stanbridge 1976 cit. in [4]). These early formsof attached growth secondary treatment were never patented but were commonlyused throughout the United Kingdom. Around the turn of the century, trickling filterswere introduced as the first artificial biological treatment method. Compared withirrigation fields, they were characterized by a much smaller need of space.
2.3.3 Activated Sludge Processes
Wastewater treatment has significantly evolved since early in the twentieth century.We have progressed from simply removing solids to producing high-quality effluentfor direct water reuse. In 1900, Wigand patented a type of attached growth process,and in 1916, Poujoulat developed a second patent which was the predecessor toRotating Biological Contactors (RBCs) [32].
In November 1912, Dr. Gilbert Fowler of the University of Manchester visitedthe United States in connection with the pollution of New York harbor [4]. Comingback to England, he described to his colleagues, Edward Ardern and WilliamLockett, some experiments that he had seen at the Lawrence Experimental Stationof the Massachusetts State Board of Health, in which sewage was aerated in abottle which had been internally coated with green algae. Ardern and Lockettpublished the results of their studies in 1914 on Journal of the Society of ChemicalIndustry [33]. Since that time, suspended growth (activated sludge) processes weredeveloped in England and then brought to the United States. As secondary treatmentbecame common, public health and the environment improved significantly. By themid-1980s, almost every treatment plant in the United States used some form ofbiological treatment.
2.3.4 Advances in Treatment: Submerged AeratedBiofilters (BAFs)
Submerged aerated biofilters capable of removing solids and organic matter withoutrequiring additional sedimentation did not appear until the end of the 1980s [34, 35].The origins of BAFs can be tracked back to contact aerators, which have been usedfor more than 50 years [36]. Mendoza and Stephenson [37] dated the first report ofthese reactor types to 1913, where aerated tanks containing layers of slate supporting

48 G. Lofrano et al.
a biofilm were employed for sewage treatment. In the 1930s, work was carried outusing the tank filter, otherwise known as the “Emscher Filter”. These reactors usedcoarse slag instead of slate layers as the support medium, which led to an increasein dissolved oxygen content of the sewage and hence better treatment. The firstsubmerged contact aeration process was developed in 1939 (Wilford and Conlon1957 cit. in [37]). This introduced the concept of using two stages of biologicaltreatment with rock and media. Griffith [38] reported that by 1943, submergedcontact aeration units with sedimentation tanks were capable of achieving greaterthan 80% removal of BOD5 at 74 plants treating domestic sewage in the UnitedStates. Modality and process conditions of submerged biological aerated filters areshown in Fig. 2.5.
2.3.5 Alternatives to Mechanical Treatment Processes
Capital investments and maintenance costs have been the most common constraintsto wastewater treatment plant installation in small communities and in developingcountries. This situation gave rise to widespread interest worldwide in using “naturalsystems” for wastewater treatment. The U.S. EPA established the Small FlowsResearch Program in 1973 to help support viable alternative wastewater treatmentsystems in areas where site conditions precluded the use of conventional systems.Among them, constructed wetlands represent a very promising technology. Fromthe technical point of view, constructed wetlands consist of low deep basins, withlong Hydraulic Retention Time (HRT), filled up with sand, gravel, and earth ona protective coating of waterproof sheath and planted with macrophytes [39, 40].Constructed wetlands are usually classified according to the different types ofmacrophytes and hydraulic regime (Fig. 2.6).
First studies were carried out at pilot scale at the Max Planck Institute, Germany,in 1952. Today, constructed wetlands are found commonly in Great Britain, Canada,the United States, Mexico, India, South Africa, Brazil, Australia, Italy, and manyEuropean countries ranging in size from small single-family residential systemsto major facilities treating up to 12 million gallons per day of wastewater. Thesesystems are becoming more acceptable to local and regional regulators as the dataon their performance continue to prove the cost-effective nature of their operation.
2.3.6 Advanced Wastewater Treatment
With greater understanding of the impact of wastewater on the environment andmore sophisticated analytical methods, advanced treatment is becoming morecommon in developed countries, primarily for the removal of nitrogen, phosphorus,or both. In 1962, Lutdzack and Ettinger put forward the use of an anoxic zoneto achieve biological denitrification in an activated sludge process, introducing a

2 Water Pathways Through the Ages: From Early Aqueducts to Next. . . 49
Influ
ent
Effl
uent Bac
kwas
hing
wat
er s
torin
gta
nkB
ackw
ashi
ngflo
w
reci
rcul
atio
n
Pro
cess
air
Sed
imen
tatio
n
a cdb
Bac
kwas
hing
wat
er s
torin
g
Bac
kwas
hing
air
Influ
ent
Effl
uent Bac
kwas
hing
wat
er s
torin
gta
nk
Bac
kwas
hing
flo
w
reci
rcul
atio
n
Pro
cess
air
Sed
imen
tatio
n
Bac
kwas
hing
wat
erB
ackw
ashi
ngai
r
Bac
kwas
hing
wat
er s
torin
gta
nk
Fig
.2.5
Mod
alit
ies
and
proc
ess
cond
ition
sof
subm
erge
dbi
olog
ical
aera
ted
filte
rs:
(a)
dow
n-flo
wm
odal
ity,
proc
ess
cond
ition
;(b
)do
wn-
flow
mod
alit
y,ba
ckw
ashi
ngco
ndit
ion;
(c)
up-fl
owm
odal
ity,
proc
ess
cond
itio
n;(d
)up
-flow
mod
alit
y,ba
ckw
ashi
ngco
ndit
ion
(Sou
rce:
Ref
.[14
])

50 G. Lofrano et al.
Fig. 2.6 (a) Aquaculture; (b) Free water surface (FWS); (c) Subsurface flow system-horizontal(SFS-H); (d) Subsurface flow system-vertical (SFS-V)
practice that is now commonly applied [41]. Studies carried out by Downing et al.[18] are now incorporated into design methods of biological nitrification. Ten yearslater, James Barnard developed and patented the biological removal of nitrogen andphosphorous in a single sludge system [8–10]. The MLE (modified Lutdzack andEttinger) process and the five-stage Bardenpho process are widely used throughoutthe world for both nitrogen and phosphorus removal and can achieve effluent totalnitrogen less than 4 mg/L and effluent total phosphorus of less than 0.1 mg/L.
2.3.7 Disinfection Practices, Nineteenth Centuryand Twentieth Century
In the nineteenth century, many scientists believed that odor was the cause ofdisease, so chemicals such as chlorine were used as deodorants [21]. In 1854,chloride of lime was used to deodorize London’s sewage. In 1859, the MetropolitanBoard of Works, London, showed that a dosage of 400 lbs/MG of Calcium Chloridecould delay purification of raw sewage for as much as 4 days. By 1880, scientistsbegan to understand pathogenic bacteria and their association with specific disease.For example, calcium chloride was used to treat feces from typhoid patients beforedisposal to sewers.
In 1893, in Hamburg, Germany, chlorine was first used on a plant scale fordisinfection of wastewater and in 1906, ozone was used in France as a disinfectionagent. In 1909, compressed, liquefied chlorine was commercially available andby 1914, equipment had been designed for metering and applying chlorine gas towastewater. The first recorded use of ultraviolet light for disinfection was in Francein 1916. By the early twenty-first century, ultraviolet disinfection has become themost common disinfection process in use.

2 Water Pathways Through the Ages: From Early Aqueducts to Next. . . 51
2.3.8 Next Generation of Wastewater Treatment
2.3.8.1 Advanced Oxidation Processes
Once advanced treatment and the reduction of nitrogen and phosphorous as wellas the prevention of eutrophication was employed at most treatment plants, theremoval of biorecalcitrant and emerging contaminants became the next goal forwastewater treatment and reuse. Although biological treatment processes are, atpresent, the cheapest and the most environmental friendly, their potential forremoval of nonbiodegradable COD and micro-pollutants is limited. Thereforethere is an increasing need to focus on new treatment technologies. Advancedoxidation processes (AOPs) are promising methods for wastewater contaminatedby biorecalcitrant compounds. AOPs are based on the generation of highly reactivehydroxyl radicals (HO•) which are powerful oxidants (E D 2.8 V) that are able tomineralize quickly and unselectively a broad range of organic compounds.
They are produced on-site most commonly by combinations of ultraviolet irradia-tion (UV), ozone, hydrogen peroxide, and (photo) catalysts (mainly transition metalsalts) forming rather compact, homogenous oxidation systems. The heterogeneoustype of AOPs particularly involve TiO2-mediated semiconductor (photo) catalyticprocesses.
2.3.8.2 Decentralized Systems
Decentralized systems are also being developed and include urine source separation[27, 41], although this practice is rather ancient considering that Romans usuallyseparate urine for laundry (fullonica), wool laundry (officinal lanifricatoria), dyeing(officina infectoria), and tannery (officina coriariorum) [1].
Decentralized systems have both advantages and disadvantages in cost andperformance, but they have their place in the overall management of wastes [50].
2.4 Evolution of Pollutant Identificationand Characterization
Since 1880, scientists began to understand pathogenic bacteria and their associationwith specific disease and to understand that waterborne pathogens had a significanteffect on public health. Once bacterial pollution of water was understood, there alsobecame an understanding that there were other pollutants in wastewater but unableto measure those pollutants.
A milestone in pollution control was the concept of biochemical oxygendemand (BOD). This test is used globally to determine the carbonaceous andnitrogenous demand on a system for oxygen and is the universal measure of

52 G. Lofrano et al.
pollution. The significance and use of this test has evolved over many years.According to Baird and Smith [18], the history of BOD can be subdivided inthree main periods. The first is characterized by the discovery and description ofoxygen utilization in wastewater treatment. Pasteur’s pioneering microbiology andWinkler’s development of dissolved oxygen measurement in water afforded earlysanitary scientists an understanding and ability to measure the relationship betweenorganic substances and dissolved oxygen in receiving water bodies. In 1912, theEighth Report of the Royal Commission on Sewage Disposal of London establishedthe first standards and tests for BOD analysis to be applied to sewage and sewageeffluents. These standards were copied by many other countries [2]. The secondperiod was characterized by the development and refinement of the measurements ofdissolved oxygen and BOD and the third period began in 1972 and is characterizedby the use of BOD5 test for regulatory compliance and process control.
Since the development and refinement of the BOD test, other tests have beendeveloped which allow for much more detailed characterization of wastewaterpollutants. Atomic absorption, gas chromatography, mass spectroscopy, liquidchromatography, and other techniques allow determination of metals, organic com-pounds, and nutrients at very low concentrations [20]. There is currently technologyavailable to examine DNA of various microorganisms used in the treatment processand will allow for better process optimization. With instrumentation, pollutants canbe determined in very low concentrations (nanogram); therefore, their impact onreceiving waters can better be defined and treatment technologies developed. Thisis especially important for those pollutants that are endocrine disruptors such aspharmaceutical and hormones.
2.5 Conclusion
In 2005, the British Medical Association and the American Medical Associationdeclared modern wastewater treatment as having the greatest positive impact onpublic health and longevity. Without modern wastewater treatment technologies,life expectancy would be less than 40 years. By reviewing the history and evolutionof waste treatment, it is easy to understand its importance. But as we developtechnology to better analyze for pollutants, we must also continue to developtechnology to manage those pollutants.
This history will continue to evolve as long as there are human beings onEarth. “And so this process must continue in a never-ending cycle” (Aristotle,Metereologica II, 3).
Acknowledgment The authors wish to thank Dr. Anna Carrafiello for the redaction of Fig. 2.3.

2 Water Pathways Through the Ages: From Early Aqueducts to Next. . . 53
References
1. De Feo G, Laureano P, Drusiani R, Angelakis AN (2010) Water and wastewater managementtechnologies through the centuries. Water Sci Technol: Water Supply 10(3):337–349
2. Lofrano G, Brown J (2010) Wastewater management through the ages: a history of mankind.Sci Total Environ 408:5254–5264
3. Brown J (2005) The early history of wastewater treatment and disinfection. In: World watercongress 2005: impacts of global climate change – proceedings of the 2005 world water andenvironmental resources congress, Anchorage, AK, 15–19 May 2005
4. Cooper PF (2007) Historical aspects of wastewater treatment. In: Lens P, Zeeman G, LettingaG (eds) Decentralised sanitation and reuse: concepts, systems and implementation. IWAPublishing, London
5. Vuorinen HS, Juuti PS, Katko TS (2007) History of water and health from ancient civilizationsto modern times. Water Sci Technol 7:49–57
6. Aiello AE, Larson MS, Sedlak R (2008) Hidden heroes of the health revolution sanitation andpersonal hygiene. Am J Infect Control 36:128–151
7. HDR (Human Development Report) (2006) Beyond scarcity: power, poverty and the globalwater crisis. United Nations Development Programme, New York
8. Lucking B (1984) Evaluating the sanitary revolution: typhus and typhoid in London1851–1900. In: Woods R, Woodward J (eds) Urban Disease and Mortality in NineteenthCentury England. Batsford, London/New York, pp 102–119
9. Sorcinelli P (1998) Storia sociale dell’acqua. Riti e Culture. Mondadori, Milano10. Seeger H (1999) The history of German wastewater treatment. Eur Water Manag 2:51–5611. Shifrin NS (2005) Pollution management in twentieth century. J Environ Eng Asce
131:676–69112. Maneglier H (1994) Storia dell’acqua. SugarCo, Milano13. Neri Serneri S (2007) The construction of the modern city and the management of water
resources in Italy, 1880–1920. J Urban Hist 33:813–82714. Sori E (2001) La citta e i rifiuti - Ecologia urbana dal Medioevo al primo Novecento. Il Mulino,
Saggi, Bologna, Italy15. Tarr JA (1985) Historical perspectives on hazardous wastes in the United States. Waste Manag
Res 3:95–11316. De Feo G, Napoli RMA (2007) Historical development of the Augustan aqueduct in Southern
Italy: twenty centuries of works from Serino to Naples. Water Sci Technol 7:131–13817. Tolle-Kastenbein R (2005) Archeologia dell’Acqua (Water archaeology). Longanesi, Roma18. Baird BR, Smith RK (2002) Third century of biochemical oxygen demand. Water Environment
Federation, Alexandria19. Breasted JH (1906) Ancient records of Egypt: historical documents from the earliest times to
the Persian conquest, vol 5. University of Chicago Press, Chicago20. Adam JP (1988) L’Arte di Costruire presso i Romani. Materiali e Tecniche (Roman building:
materials and techniques). Longanesi, Milano21. Angelakis AN, Koutsoyiannis D, Tchobanoglous G (2005) Urban wastewater and stormwater
technologies in ancient Greece. Water Res 39:210–22022. Angelakis AN, Spyridakis SV (1996) The status of water resources in Minoan times: a
preliminary study. In: Angelakis AN, Issar AS (eds) Diachronic climatic impacts on waterresources with emphasis on Mediterranean region. Springer, Heidelberg, pp 161–191
23. Angelakis AN, Savvakis YM, Charalampakis G (2007) Aqueducts during the Minoan era.Water Sci Technol 7:95–101
24. Mays LW (2007) Ancient urban water supply systems in arid and semi-arid regions. In:Proceedings of international symposium on new directions in urban water management.UNESCO, Paris, France, 12–14 Sept 2007. Korea Water Resources Association. http://www.kwra.or.kr. Accessed Feb 2010

54 G. Lofrano et al.
25. Mays LW, Koutsoyiannis D, Angelakis AN (2007) A brief history of urban water supply inantiquity. Water Sci Technol: Water Supply 7(1):1–12
26. De Feo G, Mays LW, Angelakis AN (2011) Water and wastewater management technologiesin the ancient Greek and Roman civilizations. In: Wilderer P (ed) Treatise on water science,vol 4. Academic, Oxford, pp 3–22
27. Graham JW (1987) The palaces of Crete. Princeton University Press, Princeton28. Hodge AT (2002) Roman aqueducts & water supply, 2nd edn. Gerald Duckworth & Co. Ltd,
London29. Kretzschmer F (1966) La technique romaine (trans. Breur J, Ulrix F). La Renaissance du Livre,
Brussels30. Hopkins J (2007) The cloaca maxima and the monumental manipulation of water in archaic
Rome. The Water Rome 4:1–1531. Narducci P (1889) Sulla fognatura della citta di Roma. Descrizione tecnica. Forzani, Roma32. Patwardhan AW (2003) Rotating biological contactors: a review. Ind Eng Chem Res
42:2035–205133. Ardern E, Lockett WT (1914) Experiments in the oxidation of sewage without the aid of filters.
J Soc Chem Ind 33:52434. De Feo G (2004) Wastewater treatment with submerged biological aerated filters (Trattamento
delle acque reflue mediante biofiltri aerati a letto sommerso). PhD thesis in Civil Engineeringfor the environment and territory, Cycle II, new series, University of Salerno, Faculty ofEngineering, BNI 2005–6275 T, Bibl. National Central Florence Location: TDR.2004.5510,Inventory: CF20045510 (manual request), in Italian
35. Pujol R, Hamon M, Kandel X, Lemmel H (1994) Biofilters: flexible, reliable biologicalreactors. Water Sci Technol 11:33–38
36. Rusten B (1984) Wastewater treatment with aerated submerged biological filters. J Water PollutControl F56:424–431
37. Mendoza-Espinosa L, Stephenson T (1999) A review of biological aerated filters (BAFs) forwastewater treatment. Environ Eng Sci 16(3):201–216
38. Griffith LB (1943) Contact aeration for sewage treatment. Eng News Rec 28:60–6439. EPA Manual (2000) Constructed wetlands treatment of municipal wastewater. United States
Environmental Protection Agency, Office of Research and Development, Cincinnati40. Kadlec RH, Knight RL (1996) Treatment wetlands. Lewis Publishers, Boca Raton/New York41. Lutdzack FT, Ettinger MB (1962) Controlling operation to minimize activated sludge effluent
nitrogen. J Water Pollut Control F 34:124–13842. Downing AL, Painter HA, Knowles G (1964) Nitrification in the activated sludge process.
J Inst Sew Purif 2:13043. Barnard JL (1973) Biological denitrification. Water Pollut Control 72:705–72044. Barnard JL (1974) Cut P and N without chemicals. Water Waste Eng 11:41–4445. Barnard JL (1975) Biological nutrients removal without the addition of chemicals. Water Res
9:485–49046. Gayman M (2008) Glimpse into London’s early sewers. Cleaner Magazine. www.swopnet.
com/engr/londonsewers47. Jonsson H, Stenstrom TA, Svensson J, Sundin A (1997) Source separated urine-nutrient and
heavy metal content, water saving and faecal contamination. Original research article. WaterSci Technol 35(9):145–152
48. Rossi L, Lienert J, Larsen TA (2009) Real-life efficiency of urine source separation. Originalresearch article. J Environ Manage 90(5):1909–1917
49. Wilderer PA, Schreff D (2000) Decentralized and centralized wastewater management: achallenge for technology developers. Water Sci Technol 41(1):1–8
50. Ettinger MB (1965) Developments in detection of trace organic contaminants. J Am WaterWork Assoc 57:453–457

Chapter 3The Removal of Illicit Drugs and MetabolitesDuring Wastewater and Drinking WaterTreatment
Alexander L.N. van Nuijs and Adrian Covaci
3.1 Introduction
An increasing concern has been raised in recent years about the occurrence ofpharmaceutically active compounds in the aquatic environment. Since they havebeen detected in a wide variety of water samples (drinking water, groundwater,surface water, influent and effluent wastewater) in concentrations ranging fromthe ng/L to the �g/L level, these compounds have been recognized as emergingcontaminants [1]. For some compounds, an association has been made with theirenvironmental concentration and negative effects on aquatic organisms [2], butfor most compounds, little is known about the long-term effects derived fromsimultaneous exposure of these compounds on the aquatic environment.
While the occurrence, removal, and fate of pharmaceuticals was investigated inseveral papers, the presence of illicit drugs and their metabolites in water sampleshas not been intensively investigated. However, these substances are widely usedworldwide and as a consequence, it is likely that, comparable with pharmaceuticals,these compounds are present in the water cycle. In general, municipal WWTPs havenot been designed to remove residues of pharmaceutically active compounds andthe ability of such compounds to pass through WWTPs depends on various factors,including the chemical and biological persistence of the individual compound, itssorption behavior, its evaporation via water vapor, and the technology used forsewage purification.
The presence of illicit drugs and their metabolites has been evidenced in (influentand effluent) wastewater, surface water, and drinking water in concentrations
A.L.N. van Nuijs • A. Covaci (�)Toxicological Centre, University of Antwerp, Universiteitsplein 1, 2610 Antwerp, Belgiume-mail: [email protected]; [email protected]
S.K. Sharma and R. Sanghi (eds.), Advances in Water Treatment and PollutionPrevention, DOI 10.1007/978-94-007-4204-8 3,© Springer ScienceCBusiness Media Dordrecht 2012
55

56 A.L.N. van Nuijs and A. Covaci
up to �g/L levels, with the highest concentrations observed for cocaine (COC)and its most important metabolite benzoylecgonine (BE) [3]. In analogy withpharmaceuticals, illicit drugs and their metabolites enter the aquatic cycle mainlythrough excretion after human consumption in wastewater. If an incomplete removalof these compounds during wastewater treatment and drinking water treatment isobtained, they may reenter surface water (via effluents) and drinking water (viasurface or ground water), respectively.
Since illicit drugs (and their metabolites) are often highly pharmaceuticallyactive, their presence in the aquatic environment can lead to risks comparable withpharmaceuticals. However, until now, this has not been investigated for illicit drugs.To decrease the risk of negative effects on the aquatic environment, research couldalso be oriented to optimize wastewater and drinking water treatment proceduresfor the removal of these substances. Consequently, the concentrations of thesecompounds in surface and drinking water will be low or negligible, leading to lowerexposure levels.
In this chapter, an overview of the current knowledge of the removal of illicitdrugs and their metabolites during wastewater and drinking water treatment is giventogether with a critical discussion regarding future research needs in this field.
3.2 Removal of Illicit Drugs and Metabolites DuringWastewater Treatment
3.2.1 Cocaine and Metabolites
For this group of illicit drugs, the removal during wastewater treatment of thetwo compounds that are in the highest concentrations measured in surface water,COC and BE, was investigated by several research groups. Different wastewatertreatment technologies, conventional activated sludge (CAS), trickling filters, andbiological filtration have been investigated together with wastewater treatmentplants (WWTPs) applying just primary treatment [4–10].
The majority of the removal experiments were done in WWTPs working withthe CAS technique. The results of these studies showed that the application of CASallowed an average removal percentage higher than 90% for COC and BE. Only inCroatia, decreased removal efficiencies (�50%) were observed [9], probably due toa short residence time in this WWTP. A high removal of cocainics (>93%) was alsoobserved in one Spanish WWTP [8] (Fig. 3.1). Overall, we can conclude that theCAS technique works efficient in removing COC and BE from influent wastewater.
Metcalfe et al. compared the working of the CAS technology for the removal ofCOC and BE with a WWTP that applies only primary treatment [7]. Their resultsshowed that in the case of only primary treatment, removal efficiencies were lowerthan 40% for COC and BE compared with the earlier mentioned values of>90% for

3 The Removal of Illicit Drugs and Metabolites During Wastewater. . . 57
120
%
100
80
60
40
20
Cocainics93%
Amphetamine like57%
Opioids88%
Lysergics33%
Cannabinoids79%
N/AN/AN/A0
CO BE CE AM MA
6ACMHER
LSDNor-LSD
O-H-LSD
OH-THC
THCTHC-COOH
EPHM
DMA
MOR
Fig. 3.1 Average removal of illicit drugs during CAS wastewater treatment (Reproduced fromPostigo et al. with kind permission of © Elsevier [8])
the CAS technique. It has to be pointed out that the residence time in the WWTPworking only with primary treatment is five times lower which can also contributeto lower removal efficiencies.
In two studies, the CAS technology was compared with a treatment based onbiological filters [5, 8]. Both experiments concluded that the removal efficienciesin the WWTPs working with biological filters were lower than the CAS-basedWWTPs, but no absolute values were given. Karolak et al. did not conclude if thelower removal of COC and BE with biological filters is due to the technology itselfor due to the lower residence time in the WWTP that is accompanied with this kindof treatment [5].
Kasprzyk-Hordern et al. evaluated the use of trickling filters for the removalof COC and BE from wastewater. With observed removal efficiencies lower than25%, and for BE even higher concentrations in effluent than in influent, this kind ofwastewater treatment technology seems not efficient for removing both compoundsfrom wastewater [6].
In conclusion, the most applied CAS technique is efficient in removing COCand BE from wastewater (>90% removal). Other techniques, such as biologicalfilters and trickling filters, show removal efficiencies lower than 50% and as a resultrelatively high loads of COC and BE can be released in surface water througheffluents.

58 A.L.N. van Nuijs and A. Covaci
3.2.2 Amphetamine-like Stimulants
In the amphetamine-like stimulant (ALS) group, removal experiments wereexecuted for the following compounds: amphetamine (AMP), methamphetamine(METH), methylenedioxymethamphetamine (MDMA), methylenedioxyamphet-amine (MDA), and methylenedioxyethylamphetamine (MDEA) [4–9, 11, 12].Following wastewater treatment technologies were evaluated: CAS, biologicalfilters, trickling filters, reverse osmosis, return activated sludge (RAS), and justprimary treatment.
Highly variable removal rates for all ALS compounds were observed for WWTPsapplying the CAS technology (Fig. 3.1). In general, removal efficiencies were thehighest for AMP, in most cases higher than 90%. For MDMA, METH, and MDA,the average removal was lower (on average 50%). However, it has to be pointed outthat high ranges for removal rates were reported and that in some cases even higherconcentrations in effluent than in influent were observed. A possible explanationfor this phenomenon is the transformation from one compound into another duringwastewater treatment together with deconjugation processes.
Three studies concluded that the use of the biological filters or just a primarytreatment significantly decreased the removal efficiency for the ALS [5, 7, 8].Loganathan and coworkers briefly mention in their paper that the use of RAS isefficient in removing METH from wastewater [12]. However, no numbers are givenand as a consequence it is difficult to compare RAS with other techniques. Theuse of trickling filters in the treatment of wastewater containing AMP seems asefficient as CAS, as was observed by Kasprzyk-Hordern and colleagues. For bothtechnologies, removal efficiencies higher than 90% were observed [6].
Boleda et al. [11] evaluated the use of reverse osmosis for the removal of ALSfrom wastewater. They observed that for MDMA, AMP, and METH this techniqueworks well with removal >80%. Moreover, they observed less variability in theremoval compared with the CAS technology. For MDA and MDEA, the removalwas lower (between 50% and 60%), but the variability was again low.
Except for biological filters, all techniques that were evaluated for the removal ofALS showed rather high removal rates. Important to point out is that for CAS, highlyvariable removal rates were observed, probably related to transformation processfrom one compound to another during this treatment. The application of reverseosmosis seems to overcome this problem and is the most efficient technique for theremoval of ALS from wastewater.
Only a limited number of papers have reported on the occurrence of ALS insewage sludge and biosolids resulting from WWTPs. Kaleta et al. [13] measuredconcentrations of AMP ranging between 5 and 300 ng/g dry weight in Austrian rawand treated sewage sludge. In US sludge, Jones-Lepp and Stevens [14] have detectedand quantified METH at lower levels up to 4 ng/g dry weight.

3 The Removal of Illicit Drugs and Metabolites During Wastewater. . . 59
3.2.3 Opiates and Related Compounds
Experiments show that morphine (MOR) and 6-monoacetylmorphine (6-MAM) arefairly well removed during CAS wastewater treatment, with an average removalrate of 80% for MOR and 90% for 6-MAM [8, 9, 15] (Fig. 3.1). For MOR, largevariations in removal efficiencies were observed which can be related with thecleavage of morphine conjugates during the treatment process. Biological filtersshowed less efficient removal of the two compounds in comparison with CAS [8].
Methadone (MTD) and its major metabolite 2-ethylidene-1,5-dimethyl-3,3-diphenylpyrrolidine (EDDP) were not well removed during wastewater treatmentbased on CAS. Only 30% and 2% were removed for MTD and EDDP, respectively[9, 15]. These two compounds fairly withstand CAS wastewater treatment and as aresult they can easily enter surface water.
For codeine (COD), a similar removal as for MTD was observed, with only33% retained during CAS treatment [15]. Also for this compound, an importantinput in surface water can be expected. However, Boleda also evaluated the use ofreverse osmosis for the removal of COD from wastewater and they concluded thatthis technique is highly efficient in removing this compound from wastewater [11].
3.2.4 Cannabinoids
In this group, the removal of tetrahydrocannabinol (THC), 11-hydroxytetrahydro-cannabinol (OH-THC), and 11-nor-9-carboxytetrahydrocannabinol (THC–COOH)during wastewater treatment were investigated [8, 15] (Fig. 3.1). Similar resultswere found in both studies with an excellent removal of THC (>97%) and OH–THC (90%), but low removal rates (40% on average) for THC–COOH. A possibleexplanation for this is the cleavage of conjugates (glucuronides and/or sulfates)of this metabolite during wastewater treatment, similarly with what was earliermentioned for the opiates.
3.2.5 Other Compounds
One study investigated the removal of ketamine during wastewater treatment basedon the CAS technique and found removal rates higher than 80%, concluding that itis efficiently removed [4].
N-desmethyl lysergic acid diethylamide (nor-LSD) showed very low or noremoval during CAS wastewater treatment, as was observed by Postigo et al. [8].

60 A.L.N. van Nuijs and A. Covaci
3.3 Removal of Illicit Drugs and Metabolites DuringDrinking Water Treatment
3.3.1 Cocaine and Metabolites
The behavior of COC and BE during different drinking water treatment stepswas evaluated [16] (Fig. 3.2). In the first step consisting of prechlorination,coagulation/flocculation, and sand filtration, COC and BE were only removed at13% and 9% from the source water (being surface water). The low observed valuescan be explained by the low reactivity of both analytes to chlorine. The followingozonation step had removal rates of 24% and 43% for COC and BE. These ratherlow values can be due to the absence of active sites (e.g., double of triple carbonbonds) on both compounds that are reactive to ozone. The next treatment withgranulated activated carbon filters (GAC) resulted in high removal rates, mostprobably to efficient adsorption. For COC, a complete removal was observed, whilefor BE 72% was removed in this step. In the last postchlorination step, another 27%of the BE was removed. The total removal percentages were 100% for COC and90% for BE, and as a result concentrations of BE up to 130 ng/L were found in theprocessed drinking water.
3.3.2 Amphetamine-like Stimulants
AMP, MDMA, METH, and MDA were followed through the treatment processof surface water to drinking water [16] (Fig. 3.2). AMP, METH, and MDA werecompletely removed in the first step of the treatment (prechlorination, coagu-lation/flocculation, sand filtration), because of their high reactivity to chlorine.MDMA was only removed in small amounts (23%) in this step. Future researchis needed to investigate why this compound is behaving different compared to theother strongly related compounds. MDMA is removed in the next steps (ozonation,GAC filtration, and postchlorination) for 28%, 88%, and 100% respectively. As aresult, no ALS compound could be detected in the processed drinking water.
3.3.3 Opiates and Related Compounds
The behavior of MOR, COD, MTD, and EDDP was investigated during drinkingwater treatment [15]. The drinking water treatment plant treats surface water infour steps: (1) Prechlorination, flocculation/coagulation, and sand filtration, (2)ozonation, (3) GAC filtration, and (4) postchlorination. In the first step, MORand COD were efficiently removed with removal percentages of 96% and 88%,

3 The Removal of Illicit Drugs and Metabolites During Wastewater. . . 61
Raw
wat
er
Pre
chlo
rinat
ion+
Cla
rific
atio
n+S
and
Filt
ratio
n
Ozo
ne
GA
C
Fin
ishe
d w
ater
(P
ostc
hlor
inat
ed)
1800
1600
1400
1200
30 25 20 15
Concentration (ng/L)
10 5
ME
TH
(10
0%)
MD
A (
100%
)0
1000 80
0
Concentration (ng/L)
600
400
200
Nic
otin
e(1
00%
)
39%5%
15%
38%
100%
100%
100%
76%
18%
20%
100%
23%
28%
88%
13%
24%
100%
9%
43%
72%
27%
100%
16%
63%
0%
5%
100%
Cot
inin
e(7
4%)
Caf
fein
e(9
0%)
Par
axan
thin
e(1
00%
)A
mph
etam
ine
(100
%)
MD
MA
(100
%)
Coc
aine
(100
%)
BE
(90%
)
0
Fig
.3.2
The
rem
oval
ofil
lici
tdru
gsdu
ring
drin
king
wat
ertr
eatm
ent.
The
elim
inat
ion
perc
enta
ges
ofth
eco
mpo
unds
afte
rea
chtr
eatm
enta
rein
clud
edon
each
bar
and
the
tota
lrem
oval
perc
enta
ges
are
incl
uded
inpa
rent
hese
s.N
icot
ine,
coti
nine
,caf
fein
e,an
dpa
raxa
nthi
near
eno
tdis
cuss
edin
this
chap
ter
(Rep
rodu
ced
from
Hue
rta-
Font
ela
etal
.[16
]w
ith
kind
perm
issi
onof
©T
heA
mer
ican
Che
mic
alSo
ciet
y(2
008)
)
62 A.L.N. van Nuijs and A. Covaci
respectively. For MTD and EDDP, lower removal rates were observed (54% and28%), resulting from a different reactivity for chlorine. The following ozonationstep resulted in a complete removal of MOR. COD, MTD, and EDDP were onlyremoved for 56%, 44%, and 37%. The GAC filtration then completely removedCOD, while MTD and EDDP surprisingly resisted during this treatment step (59%and 52% removal). In the last postchlorination step, 54% of the MTD concentrationsand 28% of the EDDP concentrations were removed. This elimination resulted inthe absence of COD and MOR in the finished drinking water (100% removal), whileMTD and EDDP could be identified in drinking water (91% and 88% removal).
3.3.4 Cannabinoids
THC and THC–COOH were already completely removed in the first drinking watertreatment step (prechlorination, flocculation/coagulation, and sand filtration), and asa result these compounds were not detected in finished drinking water [15].
3.4 Conclusions and Future Research
This chapter documents that experiments have been carried out to investigate theremoval of a wide range of illicit drugs during wastewater and drinking watertreatment. For wastewater treatment, the application of the CAS technology revealedin most experiments high removal percentages for some compounds (COC, BE,MOR, 6-MAM, ketamine, THC, OH–THC), while for other compounds (THC–COOH, COD, MTD, EDDP, nor-LSD) low removal rates were observed. In the ALSgroup, highly variable removal was seen. Other wastewater treatment techniquesthan CAS were also investigated, including reverse osmosis, trickling filters,biological filters, and RAS. Only reverse osmosis showed a better performance thanCAS for ALS and COD; other techniques showed to be less or equally efficient. Theremoval of illicit drugs during drinking water treatment was only investigated inone drinking water treatment plant and showed complete removal of all compoundsexcept BE, MTD, and EDDP. However, the concentrations of these compoundsfound in finished drinking water were low, up to 130 ng/L for BE. Yet it is notknown if such concentrations can affect human health during prolonged and chronicexposure through drinking water.
Future research in the removal of illicit drugs is however still needed. Allstudies executed until now were only based on simple experiments comparinginfluent and effluent concentrations. However, in order to better understand theprocesses occurring during wastewater treatment, biodegradation studies should beconducted under laboratory-controlled conditions simulating WWTPs and DWTPs.The following processes should be investigated more in detail: (1) The disposal ofillicit drugs and metabolites onto sludge, (2) deconjugation reactions of conjugates
3 The Removal of Illicit Drugs and Metabolites During Wastewater. . . 63
to parent compound or metabolite which could lead to higher effluent concen-trations, (3) transformation reactions of metabolites and parent compounds. Tofurther decrease the input of illicit drugs and metabolites into surface water anddrinking water, alternative and new treatment techniques should also be investigated,such as membrane bioreactors, ozonation and photocatalytic processes, constructedwetlands, advanced sorbents, and nanotechnology.
Acknowledgments Alexander van Nuijs and Dr. Adrian Covaci are grateful to the FlandersScientific Funds for Research (FWO) for financial support. We also acknowledge the funding of aFWO project on pharmaceuticals and illicit drugs in wastewater (G. 0177.09 N).
References
1. Richardson SD (2009) Water analysis: emerging contaminants and current issues. Anal Chem81:4645–4677
2. Khetan SK, Collins TJ (2007) Human pharmaceuticals in the aquatic environment: a challengeto green chemistry. Chem Rev 107:2319–2364
3. Zuccato E, Castiglioni S (2009) Illicit drugs in the environment. Philos Trans R Soc A 367:3965–3978
4. Huerta-Fontela M, Galceran MT, Martin-Alonso J, Ventura F (2008) Occurrence of psychoac-tive stimulatory drugs in wastewaters in north-eastern Spain. Sci Total Environ 397:31–40
5. Karolak S, Nefau T, Bailly E, Solgadi A, Levi Y (2010) Estimation of illicit drugs consumptionby wastewater analysis in Paris area (France). Forensic Sci Int 200:153–160
6. Kasprzyk-Hordern B, Dinsdale RM, Guwy AJ (2009) The removal of pharmaceuticals,personal care products, endocrine disruptors and illicit drugs during wastewater treatment andits impact on the quality of receiving waters. Water Res 43:363–380
7. Metcalfe C, Tindale K, Li H, Rodayan A, Yargeau V (2010) Illicit drugs in Canadian municipalwastewater and estimates of community drug use. Environ Pollut 158:3179–3185
8. Postigo C, Lopez de Alda MJ, Barcelo D (2010) Drugs of abuse and their metabolites in theEbro River bassin: occurrence in sewage and surface water, sewage treatment plants removalefficiency, and collective drug usage estimation. Environ Int 36:75–84
9. Terzic S, Senta I, Ahel M (2010) Illicit drugs in wastewater of the city of Zagreb (Croatia) –estimation of drug abuse in a transition country. Environ Pollut 158:2686–2693
10. van Nuijs ALN, Pecceu B, Theunis L, Dubois N, Charlier C, Jorens PG, Bervoets L, Blust R,Neels H, Covaci A (2009) Spatial and temporal variations in the occurrence of cocaine andbenzoylecgonine in waste- and surface water from Belgium and removal during wastewatertreatment. Water Res 43:1341–1349
11. Boleda R, Majamaa K, Aerts P, Gomez V, Galceran T, Ventura F (2010) Removal of drugsof abuse from municipal wastewater using reverse osmosis membranes. Desalin Water Treat21:122–130
12. Loganathan B, Phillips M, Mowery H, Jones-Lepp TL (2009) Contamination profiles and massloadings of macrolide antibiotics and illicit drugs from a small urban wastewater treatmentplant. Chemosphere 75:70–77
13. Kaleta A, Ferdig M, Buchberger W (2006) Semiquantitative determination of residues ofamphetamine in sewage sludge samples. J Sep Sci 29:1662–1666
14. Jones-Lepp TL, Stevens R (2007) Pharmaceuticals and personal care products inbiosolids/sewage sludge: the interface between analytical chemistry and regulation. AnalBioanal Chem 387:1173–1183

64 A.L.N. van Nuijs and A. Covaci
15. Boleda R, Galceran T, Ventura F (2009) Monitoring of opiates and cannabinoids and theirmetabolites in wastewater, surface water and finished water in Catalonia, Spain. Water Res43:1126–1136
16. Huerta-Fontela M, Galceran MT, Ventura F (2008) Stimulatory drugs of abuse in surfacewaters and their removal in a conventional drinking water treatment plant. Environ Sci Technol42:6809–6916

Chapter 4Removal of Dyes and Pigments from IndustrialEffluents
Tjoon Tow Teng and Ling Wei Low
4.1 Introduction
4.1.1 Dyes and Pigments
Colour is introduced into dyeing materials using substances known as dyes andpigments [1]. Dyes can be defined as soluble coloured substances which can beapplied mainly to textile materials from solution in water, whereas, pigments areinsoluble compounds integrated by a dispersion process into products such as paints,printing inks, and plastics [1].
Dye molecules comprises of two main components: chromophores and aux-ochromes. Chromophores are known as group of atoms principally responsible forthe colour of dye. The most important chromophores are the azo (–NDN–), carbonyl(CDO), methine (–CHD), and nitro (–NO2) groups. Auxochromes are useful inproviding an essential “enhancement” of the colour [1]. Common auxochromegroups (include hydroxyl (OH) and amino (NR2) groups) normally increase theintensity of the colour and shift the absorption to longer wavelengths of light [1, 2].
According to Bogacki et al. [3], pigments can be classified into two categories:homogenous pigments and mixtures. Homogenous pigments contain similar type ofpigments particles, e.g., colourful metal oxides and metallic powders. On the otherhand, mixtures are obtained by chemical coating the stain of a suitable carrier suchas the active, highly dispersed silica, precipitated calcium carbonate. Mixtures canalso be obtained by mechanical mixing of intensely staining pigment with filler.
T.T. Teng (�) • L.W. LowSchool of Industrial Technology, Universiti Sains Malaysia, Penang 11800, Malaysiae-mail: [email protected]; low [email protected]
S.K. Sharma and R. Sanghi (eds.), Advances in Water Treatment and PollutionPrevention, DOI 10.1007/978-94-007-4204-8 4,© Springer ScienceCBusiness Media Dordrecht 2012
65

66 T.T. Teng and L.W. Low
4.1.2 Application of Dyes and Pigments
Mankind has used dyes for thousands of years. About 180,000 years ago, Nean-derthal man was believed to be the earliest mankind to use colourant. In 1856,the world’s first commercially successful synthetic dye was discovered by WilliamHenry Perkin and by the end of the nineteenth century, 10,000 new synthetic dyeshad been developed and manufactured [1].
Synthetic dyes are solely recalcitrant organic compounds that are extensivelyused in various branches of textile industries [4–9], pulp and paper industries[10, 11], leather tanning industries [12–14], food industries [15–18], agriculturalresearch [19, 20], hair colourings [21], light-harvesting arrays [22], etc. Syntheticdyes have been used to control the efficacy of sewage [23], groundwater tracing[24], and determination of surface area of activated sludge [25].
The chemical classes of dyes used more frequently at industrial scale are the azo,anthraquinone, sulphur, indigoid, triphenylmethyl, and phthalocyanine derivatives[26]. All dyes used in industries are designed to resist fading upon exposureto sweat, water, light, and chemicals including oxidizing agents, and microbialattack [27].
There are more than 100,000 commercial dyes with a rough estimated productionof 7 � 105 to 1 � 106 tons per year [28–30]. The exact data on the quantity of dyesdischarged to the environment are unknown. A loss of 1–2% in production and1–10% loss in use are assumed [26]. From the statistics, extensive application ofsynthetic dyes can cause considerable environmental pollution and are dangerous tothe health of living organisms.
The impact and toxicity of dyes containing wastewater have been extensivelystudied. The dye classes, dye description, and typical pollutants associated withvarious dyes are listed in Table 4.1.
From Table 4.1, types of pollutants associated with various dyes are colour,organic acids, and unfixed dyes. Most of the dyes are water soluble, exceptdisperse dye.
Dyeing effluents are hardly decolourised by conventional wastewater treatmentmethods [27, 33]. In addition to their visual effect and their adverse impact interms of chemical oxygen demand (COD), biochemical oxygen demand (BOD), andtotal organic carbon (TOC), many synthetic dyes may cause the formation of toxiccarcinogenic metabolites (high concentration of nutrients, presence of chlorinatedphenolic compounds, sulphur, and lignin derivatives).
High volumetric rate of industrial effluent discharge and increasing stringentlegislation make the search for appropriate treatment technologies. This is animportant task for a greener tomorrow [34].

4 Removal of Dyes and Pigments from Industrial Effluents 67
Table 4.1 Typical characteristics of dyes used in textile dyeing process
Dye class DescriptionTypes of pollutants associatedwith various dyes Reference
Acid Anionic compounds with highwater solubility
Colour; organic acids; unfixed dyes [31]
Basic Very bright dyes, water-solublecationic dyes, applied inweakly acidic dyebaths
Colour; organic acids; unfixed dyes [31]
Direct Water-soluble, anionic compoundscan be applied directly tocellulosics without mordants(a substance that will form acoordination complex with thedye. Useful in setting dyes onfabrics)
Colour; salt; unfixed dye; cationicfixing agents; surfactant;defoamer; leveling andretarding agents; finish; diluents
[31, 32]
Disperse Water insoluble Colour; organic acids; carriers;leveling agents; phosphates;defoamers; lubricants;dispersants; diluents
[32]
Mordant Final colour largely dependent onthe choice of mordant. Anexample of mordant ispotassium dichromate
Mordants (particularly in heavymetals categories) will causehazardous to health
[31]
Reactive Water-soluble, anionic compounds,largest dye class
Colour; salt; alkali; unfixed dye;surfactants; defoamer; diluents;finish
[31]
Sulphur Organic compounds containingsulphur or sodium sulphide
Colour; alkali; oxidizing agents;reducing agent; unfixed dye
[32]
Vat Oldest dyes, more chemicallycomplex, water insoluble
Colour; alkali; oxidizing agents;reducing agent
[31, 32]
4.2 Technologies Available for Colour Removal
Industrial wastewater treatment consists of four processes [35], namely, pretreat-ment, primary treatment, secondary treatment, and tertiary treatment. Pretreatmentprocess includes equalization and neutralization where industrial wastewater ispretreated with equalization and neutralization before being discharged to municipalsewerage systems or to a central industrial sewerage system [36]. After pretreatmentstep, physical or chemical separation techniques (primary treatment) are applied toremove suspended solids in the wastewater [36], followed by a secondary treatment.Secondary treatment/biological treatment uses microorganisms to stabilize thewaste components before going to tertiary treatment. The tertiary treatment (phys-ical chemical treatment) processes include adsorption, ion-exchange, stripping,chemical oxidation, and membrane separations. The final steps for the wastewatertreatment process are the sludge processing and disposal steps.
Generally, the methodologies adopted to treat dye wastewater can be clas-sified into three categories: (1) physical (2) physicochemical or chemical, and

68 T.T. Teng and L.W. Low
(3) biological. These methods can be used either singularly or together in variouscombinations. Many treatment processes combine two or more treatment technolo-gies to provide a better or more efficient treatment.
4.2.1 Physical Methods
Physical treatment involves particle separation processes; no gross chemical orbiological changes are involved. Examples of physical treatment processes areadsorption and ion exchange. These processes are particle size dependent [37].
4.2.1.1 Adsorption
Adsorption process has been widely used in industrial dye wastewater treatment,because adsorption is a well-known equilibrium separation process and is effectivein wastewater treatment [38–40]. The term adsorption refers to a process wheremolecules of gas, liquid, or dissolved solids (adsorbate) adhere to a surface (ad-sorbent) [41]. There are two types of adsorption processes, namely, physisorptionand chemisorption. Physisorption involves the attraction between the solid surfaceand the adsorbed molecules via weak van der Waals forces. It is a readily reversibleprocess and includes both mono and multilayer coverage of adsorbate moleculeson the adsorbent’s surface [42]. Chemisorption involves higher strength chemicalbonding which is difficult for the removal of chemisorbed species from the solidsurface [36]. It is an irreversible reaction and includes monolayer coverage ofadsorbate molecules on the adsorbent’s surface [43].
Transportation of adsorbate to the porous media adsorbent usually occurs throughfour main steps [44, 45], namely, bulk solution transport, external diffusion,intraparticle diffusion, and adsorption. Bulk solution transport process involvestransportation of the adsorbate from bulk solution to hydrodynamic boundary layer(liquid–solid interphase) surrounding the adsorbent [45]. After the transportationof adsorbate to the hydrodynamic boundary layer surrounding the adsorbent, theadsorbate must then pass through the layer to the adsorbent surface (external diffu-sion). This transportation process is caused by molecular diffusion. The distancethe adsorbate travels is largely dependent on the velocity of the bulk solution.The thickness of the boundary layer affects the rate of transportation. The thickerthe boundary layer, the lower the rate of transportation becomes [44, 45]. Afterthe adsorbate has passed through the boundary layer to the active site, intraparticlediffusion takes place. There are two types of diffusion that affect the intraparticletransportation, namely, pore diffusion and surface diffusion. Pore diffusion takesplace when molecules diffuse from the solution into the pores of the adsorbate,whereas surface diffusion takes place along the adsorbent surface [45]. Lastly, theadsorbate is attached onto the available active sites on the adsorbent surface. Thisstep occurs very fast; therefore, one of the preceding diffusion steps controls the rateof mass transfer.
4 Removal of Dyes and Pigments from Industrial Effluents 69
Few years ago, use of activated carbon as adsorbent in adsorption process wasfound to be effective in wastewater treatment, but the cost of activated carbon istoo high. Therefore, there is a need to search for cheaper and effective adsorbents.Recently, a number of studies have focused on low-cost adsorbent that is capablein degrading and adsorbing dyes from wastewater. A material could be assumed tobe low cost if it is abundant in nature, inexpensive, requires little processing, and iseffective in the treatment process [46, 47]. Low-cost adsorbents could be obtainedfrom any agriculture and industry by-products, natural materials, and biosorbentsthat contain high surface area and porosity [47]. Adsorption of dyes onto low-costadsorbents is largely dependent on dye properties such as molecular structure andtype, number and position of substituent in the dye molecule [48], source of rawmaterials used, preparation and treatment conditions such as pyrolysis temperatureand activation time, surface chemistry, surface charge, pore structure, and surfacearea of the adsorbent [49].
Non-conventional Low-Cost Adsorbents
Non-conventional low-cost adsorbents can be divided into three different categories,i.e., agriculture and industry waste, natural materials, and bioadsorbents.
Agriculture and Industry Waste Materials
Agriculture and industry waste materials are assumed to be low-cost adsorbentsbecause they are abundant and require less processing [49]. Bagasse, a by-productof sugar milling process, is the crushed remnant of sugarcane stalks left after theextraction of juice. Bagasse consists of three components namely, pith, fibre, andrind mixed in different proportions [50]. Low et al. [51, 52] studied the adsorptionof a basic dye (methylene blue (MB)) on various acid-modified bagasses. A novelbagasse pretreatment method was used that could effectively remove organiccompounds from the bagasse that contribute to chemical oxygen demand (COD)in the dye aqueous solution. Pretreatment with thorough washing of adsorbentusing boiling distilled water was performed instead of conventional washing usingdistilled water at room temperature. The highest percentage of colour removal was99.45% and COD reduction was 99.36% using sulphuric acid-modified bagasseat pH 9.0. The results showed the removal and reduction efficiency of the colourand COD, respectively, were almost the same. This is because the dye species thatcontributes to the COD has been completely removed. It can be concluded that theadsorption efficiency of low-cost adsorbent is largely dependent on the adsorbentpretreatment steps. This adsorption process followed pseudo-second order, andLangmuir as well as Freundlich isotherms, and was endothermic in nature.
Ofomaja and Ho [53] used palm kernel fibre as adsorbent for the removal ofanionic dye (4-bromoaniline-1,8-dihydronaphthalene-3,6-disodiumsulphate) fromaqueous solutions. The results obtained were well described by Langmuir isotherm.The equilibrium monolayer capacity of palm kernel fibre for the adsorption of this

70 T.T. Teng and L.W. Low
Table 4.2 Adsorption capacities for some agriculture and industry waste materials
Dye Adsorbent
Adsorptioncapacity(mg/g) Working isotherm Reference
Basic dyeMB Teak wood bark 914.59 Langmuir isotherm [54]MB Papaya seeds 555.55 Langmuir isotherm;
pseudo-second-orderkinetic model
[55]
Basic Red-22 Sugar industry mud 519.00 Langmuir isotherm [56]MB Grass waste 457.64 Langmuir isotherm;
pseudo-second-orderkinetic model
[57]
MB Pomelo peel 344.83 Langmuir isotherm;pseudo-second-orderkinetic model
[58]
MB Jackfruit peel 285.71 Langmuir isotherm;pseudo-second-orderkinetic model
[59]
MB Banana stalk waste 243.90 Langmuir isotherm;pseudo-second-orderkinetic model
[60]
MB Garlic peel 82.64 Freundlich isotherm;pseudo-second-orderkinetic model
[61]
MB Rubber seed shell 82.64 Freundlich isotherm;pseudo-second-orderkinetic model
[62]
Reactive dyeReactive Blue
171Fly ash 1.860 Freundlich isotherm;
pseudo-second-orderkinetic model
[63]
Reactive Red Coconut tree flowercarbon (CFC); Jutefibre carbon (JFC)
CFC D 181.9 Langmuir isotherm;pseudo-second-orderkinetic model
[64]JFC D 200
Acid dyeAcid Red 1 Coal fly ash 92.59–103.09 Langmuir isotherm;
pseudo-second-orderkinetic model
[65]
Acid Black 1;Acid Blue193
Fly ash Acid Blue193 D 10.937
Freundlich isotherm;pseudo-second-orderkinetic model
[63]
Acid Black1 D 10.331
anionic dye was 0.0705 mmol/g at 297 K and palm kernel dosage of 5 g/dm3. Thethermodynamic analysis showed that the system was exothermic in nature. Up to66.44% of the dye adsorbed could be desorbed by using distilled water.
The adsorption capacities for some agriculture and industry waste materials arelisted in Table 4.2.

4 Removal of Dyes and Pigments from Industrial Effluents 71
Table 4.3 Adsorption capacities for some natural materials
Dye AdsorbentAdsorption capacity(mg/g) Working isotherm Reference
Basic dyeMB Montmorillonite
clay289.12 Langmuir isotherm;
pseudo-second-orderkinetic model
[68]
MB Bentonite 151.00–175.00 Langmuir andRedlich-Petersonisotherms
[69]
MB Fibrous clayminerals
85.00 Langmuir isotherm;pseudo-first-orderkinetic model
[70]
MB Palygorskite 50.80 Pseudo-second-orderkinetic model
[71]
MB Glass wool 2.24 Langmuir and Freundlichisotherms
[72]
Reactive dyeRY-145;
RB-BSorel’s cement RY-145 D 107.67 Langmuir isotherm [73]
RB-B D 103.14Direct dyeCongo red Australian
kaolinMore than 85%
colour removalLangmuir isotherm;
pseudo-first-orderkinetic model
[74]
Natural Materials
Recently, there has been a growing interest in utilizing natural materials suchas clay, zeolites, and other siliceous materials as adsorbents. Alpat et al. [66]studied the adsorption of basic dye, Toluidine Blue O from aqueous solution usingTurkish zeolite (clinoptilolite) as adsorbent. Kinetic studies showed that adsorptionof Toluidine Blue O on clinoptilolite was well fitted to pseudo-second-order kineticmodel. The maximum adsorption capacity of clinoptilolite was 2.1 � 10�4 mol/gat solution pH 11.0. The results showed the adsorption process fitted to both theLangmuir and Freundlich models. Other than Turkish zeolite, researchers have alsoused other natural materials as adsorbents such as calcined clay materials and lime.They were used as adsorbents to remove diazo direct dye (congo red) from aqueoussolutions [67]. The results showed that the removal efficiency of congo red dyeusing calcined clay materials and lime was more than 94%. The dye removal wasgoverned by combined physico-chemical reactions of adsorption, ion-exchange,and precipitation. The adsorption process was well described by pseudo-second-order kinetic model and Freundlich isotherm mode. Table 4.3 shows the adsorptioncapacities of a few natural materials.

72 T.T. Teng and L.W. Low
Biomass
The use of biological materials as adsorbents in wastewater treatment is known asbioadsorption or biosorption. Use of bioadsorbent in adsorption process can reducedye concentration to parts-per-billion (ppb) levels. Bioadsorption is a novel, cheap,and effective process [49].
Recently, the use of dead or living biomass, fungi, and other microbial cul-tures as bioadsorbents is increasing because bioadsorbents are available in largequantities and low cost. Yu et al. [75] studied the polymethacrylic acid andpolyamic acid-modified biomass of baker’s yeast to remove MB from aqueoussolution. The results showed the effect of pH and ionic strength on adsorptioncapacity of the modified biomass was not significant. The adsorption processfollows Langmuir isotherm with maximum MB uptake capacities of 869.6 mg/gof polymethacrylic acid-modified biomass of baker’s yeast and 680.3 mg/g ofpolyamic acid-modified biomass of baker’s yeast. Table 4.4 shows adsorptioncapacities for some bioadsorbents.
Agriculture and industry waste materials (Table 4.2), natural materials(Table 4.3), and biomass (Table 4.4) have shown to be good alternatives toexpensive commercial activated carbon. Most of the adsorption processes followpseudo-second-order kinetic and Langmuir isotherm. In some cases, the adsorptionprocess follows both Langmuir isotherm as well as Freundlich isotherm, wherethe adsorbents contain heterogeneous moieties which are uniformly distributedon the surface of the adsorbents [52]. Adsorbate concentration, pH, contact time,adsorbent dosage, shaking speed, and temperature play an important role in theadsorption process. With the use of these low-cost adsorbents, wastewater treatmentprocess can become relatively economical. However, the usage of these low-costadsorbents is still in the developing stage; more work is needed to investigate onthe mechanisms of the adsorption process. Ion exchange may play an importantrole in the uptake of dyes. Comparison on the cost of using activated carbon andvarious non-conventional, low-cost adsorbents are strongly recommended in orderto promote the use of low-cost adsorbents in industrial scale. Undoubtedly, low-costadsorbents offer a lot of promising benefits for commercial use in future.
4.2.1.2 Ion Exchange
Ion exchange is a process where wastewater is passed over the ion exchange resinwhere a constituent in the wastewater exchanges an ion in the resin until theavailable exchange sites are saturated. Employing this technique, both cationic andanionic dyes can be removed from the effluent successfully [86]. The advantage ofion-exchange resin catalysts over other commonly used solid acid catalysts is theirrelatively high concentration of active sites, and it is this factor that makes themsuch effective catalysts for facile reaction [87]. The main drawback of ion-exchangemethod is that ion exchange cannot accommodate a wide range of dyes [86].

4 Removal of Dyes and Pigments from Industrial Effluents 73
Table 4.4 Adsorption capacities for some bioadsorbents
Dye Adsorbent
Adsorptioncapacity(mg/g) Working isotherm Reference
Basic dyeMB Caulerpa
lentillifera417.00 Langmuir isotherm;
pseudo-second-orderkinetic model
[76]
Basic Red 18 Activated sludgebiomass
285.71 Langmuir and Freundlichisotherm; pseudo-second-order kineticmodel
[77]
MB Alga Sargassummuticumseaweed
279.20 Langmuir and Freundlichisotherm; pseudo-first-order kineticmodel
[78]
MB Dead macrofungi
232.73 Langmuir isotherm [79]
MB Green alga Ulvalactuca
40.20 Langmuir and Freundlichisotherm; pseudo-second-order kineticmodel
[80]
MB The brown algaCystoseirabarbatulaKutzing
38.61 Langmuir isotherm;pseudo-second-orderkinetic model
[81]
MB Posidoniaoceanica (L)fibres
5.56 Langmuir isotherm [82]
Reactive dyeReactive Black 8;
Brown 9;Green 19;Blue 38
Rhizopusnigricans
90–96%adsorp-tion oftheselecteddyes
Langmuir and Freundlichisotherm
[83]
Reactive Black 5 Klebsiella sp.UAP-b5
N/A Pseudo-second-orderkinetic model
[84]
Acid dyeAcid Blue 40 Thuja orientalis 97.06 Langmuir isotherm;
pseudo-second-orderkinetic model
[85]
4.2.2 Physicochemical and Chemical Methods
Physicochemical methods and chemical methods are hard to differentiate. Bothmethods involve chemical reactions to improve water quality. Coagulation,membrane filtration, and advance oxidation process (AOP) such as ozonation,

74 T.T. Teng and L.W. Low
H2O2/pyridine/Cu system, Fenton’s process, photocatalysis, and ultrasonicirradiation are some examples of physicochemical or chemical treatment processes.Generally, physico-chemical and chemical treatment processes are economicallyfeasible but are sometimes costly due to the cost of chemicals. Large quantities ofconcentrated sludge produced and pH dependence are the main drawbacks of theseprocesses [88, 89].
4.2.2.1 Advance Oxidation Processes (AOP)
Colour dye effluents are more resistant to mild oxidation conditions. There is a needto use more powerful oxidizing agents in order to achieve higher removal efficiency[90]. Advance oxidation processes (AOP) are technologies based on intermediacyof hydroxyl and other radicals to oxidize toxic and non-biodegradable compoundsto various by-products [91].
H2O2/Pyridine/Cu(II) System
H2O2/pyridine/Cu(II) system is one of the AOP that uses a chelating ligand anda transition metal forming the transition metal complex to produce superoxideanions (�O2). These anions function in the degradation of wide ranges of polycyclicaromatic hydrocarbons [92]. Pyridine coordinates with copper to form cupriccomplex [93]:
Cu.II/pyridine����! Cu.II/complex (4.1)
Cupric complex with H2O2 is reduced to cuprous complex [93]:
Cu.II/complex C H2O2 �! Cu.II/.O2H/� C HC (4.2)
Cu.II/.O2H/� �! Cu.I/�O2H (4.3)
Cuprous complex then reacts with excess H2O2 degrading them to generatereactive radicals such as superoxide anions and hydroxyl radicals [93].
Cu.I/�O2H C H2O2 �! Cu.I/C �O2 C �OH C H2O (4.4)
Lim et al. [94] studied the treatment of disperse dye (Terasil Red R) wastewaterusing H2O2/pyridine/Cu(II) system. Ninety-nine percent colour removal at theoptimal concentration of 5.5 mM H2O2, 38 mM pyridine, and 1.68 mM Cu(II)was obtained. The COD reduction of the dye solution was up to 90%. Thistreatment system shows good potential in decolourising and reducing COD of thedye effluents. The main drawback is the sludge production (170 mg/L). Higheramount of sludge produced would generally mean higher costs for disposal.

4 Removal of Dyes and Pigments from Industrial Effluents 75
Ozonation
Ozonation is an effective oxidation process which has been widely used to de-colourise synthetic dyes. Ozone can selectively oxidize molecules with unsaturatedbonds (–CDC– or –NDN–) and aromatic structures [95]. Oxidation using ozoneleads to degradation of chlorinated hydrocarbons, phenols, pesticides, and aromatichydrocarbons [96]. Ozone can react in two pathways: direct and indirect. Directpathway involves the ozone molecule itself acting as electron acceptor [90]. Tehrani-Bagha et al. [97] studied the decolourisation of Reactive Blue 19 using ozone.The most important decomposition products are sulphate, nitrate, formate, andacetate. Complete decolourisation of RB 19 was achieved. The lower COD reduc-tion (55.00%) compared with 100% colour removal was attributed to incompleteoxidation of organic materials [97, 98]. The effect of ozonation on the toxicityof wastewater effluents has also been determined using nematode Caenorhabditiselegans. The data showed that the toxicity highly depended on the type of dye to bedecomposed [99].
Ozonation can therefore effectively decolourise dye containing wastewater viaoxidative cleavage of the conjugated system of the dye molecule. This treatmentsystem does not form any residual or sludge [100] and it leaves the effluent with nocolour and low COD. Another advantage is that ozone can be used as an oxidant inits gaseous state; this does not increase the volume of wastewater and sludge [96].The disadvantage of ozonation process is its short half-life, making it an expensiveprocess [96].
Fenton’s Process
Fenton’s process uses hydrogen peroxide and ferrous ions as Fenton’s reagent forthe oxidation of toxicants present in wastewater. The Fenton system uses ferrousions to react with hydrogen peroxide to produce hydroxyl radicals (OH*) withpowerful oxidizing abilities to degrade certain toxic contaminants [101]. Fenton’sprocess performs best with high initial dye concentrations and at low initial pH[102]. Advantages of this process include high ability to remove colour, reduceCOD and toxicity of dye containing wastewater. Since the mechanism involvesflocculation, impurities are transferred from the wastewater to the sludge which isecologically questionable. It has conventionally been incinerated to produce power,but such disposal is far from environment friendly [90].
The Fenton’s process is dependent on the final floc formation and its settingquality [103]. Cationic dyes do not coagulate at all [103]; acid, direct, vat,mordant, and reactive dyes usually coagulate, but the resulting floc is of poorquality and does not settle well [2]. To overcome this problem, Fenton sludgerecycling system was developed, where Fe (III) sludge deposition is eliminated[90]. A comparative study of the oxidation of disperse dyes by an electrochemicalprocess, ozone, hypochlorite, and Fenton’s process showed that Fenton’s processwas the best among the oxidation processes in terms of high colour removal andCOD reduction [104].

76 T.T. Teng and L.W. Low
Ultrasonic Irradiation
Ultrasonic irradiation has proven to be an effective method for degrading organiceffluents into less toxic compounds [105]. High-power ultrasound produces strongcavitation in the aqueous solution causing shock wave and reactive free radicalsby the violent collapse of the cavitation bubble [106]. Singla et al. [107] studied thesonolytic degradation of acid dye (acid orange 24) at various initial concentrations inwater. Pang et al. [108] and Wang et al. [109] studied the sonocatalytic degradationof organic dyes in the aqueous solutions. The degradation of the dye occurredthrough hydroxyl radical attack at the bubble/solution interface.
Photocatalysis
Photocatalysis using TiO2 as the photocatalyst is an emerging technology. Thisprocess could be operated at ambient conditions and the catalyst itself is cheap,non-toxic, and commercially available at various crystalline forms [110]. Lin andLee [111] coated TiO2 powder onto the surface of a dendritic silver (Ag) carrierto synthesize TiO2/Ag for decolourising Procion Red MX-5B. The photocatalyticdegradation of organic dyes in the presence of nanostructured TiO2 has beenreviewed by Khataee and Kasiri [112].
4.2.2.2 Liquid–Liquid Extraction
Liquid–liquid extraction (LLE) is a process that involves the transport of a solutefrom an aqueous phase to an organic phase [113]. LLE is based on the principle thata solute in the immiscible solvents can distribute itself in a certain ratio between twoimmiscible solvents, one of which is usually aqueous phase (water) and the other anorganic phase (organic solvent). Extraction process largely depends on mass transferrate [114]. Muthuraman et al. [115] studied the extraction and recovery of MB fromindustrial wastewater using LLE. Benzoic acid served as the extractant. Ninety-ninepercent of the dye was extracted from the aqueous solution and the extracted dye inthe organic phase was back extracted into sulphuric acid solutions. Muthuraman andTeng [116] also studied the recovery of an acid dye, methyl red, from an aqueoussolution by LLE where xylene was used as an extractant (carrier). The extractionof methyl red from aqueous solution was dependent on initial dye concentration.Under optimum conditions, dye extraction efficiency varied from 97% to 90% in5 min at the aqueous to organic phase volume ratio (A/O) from 1 to 10. NaOH wasfound to be a suitable medium for the stripping process. It is sometimes not easyto find a suitable solvent with specific characteristics such as low-cost, non-toxic,non-flammable, chemically stable, and inert toward other components of the system.
One of the other prominent LLE techniques is supported liquid membrane(SLM). SLM requires less energy and is simpler to operate compared with LLE,which involves multi-shaking and solvent recovery steps [115]. SLM is a separation

4 Removal of Dyes and Pigments from Industrial Effluents 77
Carrier
Membrane Phase
Feed Phase Strip Phase
DyeOH− Dye+ Dye+ H+
Carrier-Dye
Fig. 4.1 Schematicdescription of transport ofdye through liquid membrane
process that uses a thin layer of organic solution absorbed in the pores of a polymericsupport [117]. This membrane acts as an intermediary, separating the feed phasecontaining dye species from the strip phase. The dye was then transported to andrecovered from the strip solution. Muthuraman and Teng [117] studied the removaland recovery of Rhodamine B (basic dye) from an aqueous solution using SLM.Vegetable oil was used as the liquid membrane. The results showed that vegetableoil can effectively recover Rhodamine B dye from aqueous solution under optimizedconditions.
The transportation of dyes across the SLM system can be explained in threesuggested mechanisms [117]:
1. In an alkaline medium, the cationic dye remains as unionized dye molecule(neutral).
2. Diffusion of the unionized dye into the organic phase takes place due to the likenature of dye and the organic phase (hydrophobic).
3. At the membrane-strip solution interface under acidic condition, unionized dyemolecule is converted into ionized molecule (i.e., stripping of the dye takesplace).
Figure 4.1 shows the schematic description of transport of dye through liquidmembrane.
Other than SLM, emulsion liquid membrane process (ELM) is known to beone of the effective methods for separation when the material being extractedis present in very low concentration [118]. Three advantages of ELM are: (1)relatively low-energy consumption when compared to other separation processes[119], (2) high efficiency because larger surface area is available for mass transferto take place [120], and (3) high selectivity when carrier agents are used in themembrane phase that bind with target compounds [120]. ELM consists of a strippingphase encapsulated by an organic phase (membrane), which in turn contains theextractant and surfactant in organic diluents to stabilize the emulsion droplet. There-fore, ELM process involves simultaneous extraction and stripping in one step [121].

78 T.T. Teng and L.W. Low
4.2.2.3 Coagulation-Flocculation and Chemical Precipitation Method
Coagulation-flocculation process can be applied as a pretreatment, a posttreatment,or even as a main treatment [31]. Basically, coagulation is a chemical addition andmixing process. Coagulation achieves charge neutralization or particles destabi-lization through addition of different charge of ion which allows the particles toagglomerate and subsequently to be removed [37]. Flocculation is always used inconjunction with coagulation. Flocculation bridges the stabilized particles togetherand forms bigger aggregates (flocs) in size. This process is normally accomplishedby slow mixing because slow mixing allows particles to collide and adhere witheach other until it is heavy enough to settle [122].
The most commonly used coagulant in wastewater treatment is ferric chloride(FeCl3), ferric sulphate (Fe2(SO4)3), aluminium sulphate (Al(SO4)3), ferrous sul-phate (FeSO4) and calcium hydroxide (Ca(OH)2), polyaluminium chloride (PACl),lime, and alum [122, 123]. Flocculants that are used for wastewater treatment canbe classified into three categories [124]:
1. Inorganic flocculants2. Organic synthetic flocculants3. Natural flocculants
Short detention time and low capital cost make chemical coagulation a widelyused technique in wastewater treatment [90]. A comparison of the colour removalefficiency and settling properties among three coagulants, namely, aluminiumsulphate (alum), polyaluminium chloride (PACl), and magnesium chloride (MgCl2)had been reported by Tan et al. [125]. Flocs formed by MgCl2 treatment were foundto give shorter settling time than the alum and PACl treatment. The presence ofmagnesium in the aqueous solution enhances the removal of pollutants. The effec-tive pH range for the treatment of textile dye wastewater using magnesium chlorideas coagulant is between 10.5 and 11.0. The highest percentage of colour removaland COD reduction are 97.90% and 88.40%, respectively. Liao and Randtke [126],Folkman and Wachs [127], and Black and Christman [128] reported that with thepresence of Mg2C ion, good coagulation could be achieved. This treatment processis pH dependent.
Recently, increasing demand for environmental-friendly technologies has ledto the search for natural, available, and cheap materials to be used as coagulantsin wastewater treatment. The use of inorganic salts such as aluminium chloride,aluminium sulphate, magnesium chloride, lime, and ferric chloride have receivedattention for their potential health impacts [129]. Using these materials as coagulantsmay result in several environmental consequences: (1) an increase in metal concen-tration in water which may cause severe impact to human health; (2) productionof toxic sludge; and (3) dispersion of arylamide oligomers which may also be ahealth hazard. Hence, alternative coagulants and flocculants have been consideredfor environmental applications [130]. Examples of natural coagulants which can beapplied in dye wastewater treatment are listed in Table 4.5.

4 Removal of Dyes and Pigments from Industrial Effluents 79
Table 4.5 Alternative coagulants to be used in dye wastewater treatment by coagulation-flocculation method
Natural coagulant Dye Efficiency Reference
Chitosan Acid Blue 92 99.00% colour removal [131]Sludge Acid Red 119 96.53% colour removal [132]Moringa oleifera seed Alizarin Violet 3R 95.00% colour removal [133]Steel industrial
wastewaterDisperse Blue 79 99.00% colour removal and
94.00% COD reduction[134]
Table 4.5 clearly indicates that the performance of natural coagulants in dyewastewater treatment is good; more than 90% of colour removal and COD reductionof dyes were achieved using some natural coagulants. Their non-toxicity and theirbiodegradability make them effective and environmental-friendly coagulants for theremoval of dye containing wastewater.
Coagulation-flocculation process is effective, though in some cases it produceslarge amount of sludge. More research is needed to search for highly available, low-cost, non-toxic, and efficient coagulants.
4.2.3 Biological Methods
Biological treatment methods use microorganisms, mostly bacteria to decomposeorganic matters in wastewater. This treatment method is relatively inexpensive,having low running costs and the end products of complete mineralization are nottoxic and stable [36]. Compared to chemical and physical treatments, biologicaltreatments require less energy and chemicals. Generally, biological treatmentmethods can be divided into aerobic (involving oxygen) and anaerobic (withoutoxygen) methods. The former involves the usage of free or dissolved oxygenby microorganisms (aerobes). The microorganisms convert the organic wastes tobiomass and carbon dioxide. The latter involves the degradation process in theabsence of oxygen where complex organic wastes are degraded into carbon dioxide,methane, and water through three basic steps namely hydrolysis, acidogenesis(including acetogenesis), and methanogenesis [135].
Aerobic treatment methods are commonly used in the treatment of organicwastewaters for achieving high degree of treatment efficiency and are suitablefor the treatment of low strength wastewater (biodegradable COD concentrationsless than 1,000 mg/L), while anaerobic treatment is used in waste treatment basedon the concept of resource recovery and utilization. Anaerobic treatment methodsare suitable for the treatment of high strength wastewaters (biodegradable CODconcentrations over 4,000 mg/L) [136]. A comparison of aerobic and anaerobictreatment systems is shown in Table 4.6.
Table 4.6 shows that both aerobic and anaerobic treatments are able to removeorganic matters in water bodies. However, sludge production in aerobic treatment

80 T.T. Teng and L.W. Low
Table 4.6 Comparison of some characteristics of aerobic and anaerobic treatments
Feature Aerobic Anaerobic Reference
Organic removal High efficiency High efficiency [135]Quality of effluent Good Modest to poor [137]Sludge production High Low [138]Nutrient requirement High Low [135]Alkalinity requirement Low High for certain
industrial waste[137]
Energy requirement High Low to moderate [135]Temperature dependent Low High [137]Start-up time 2–4 weeks 2–4 months [135]Odour Less opportunity
for odoursPotential odour
problems[138]
Bioenergy and nutrientrecovery
No Yes [137]
Organic loading rate Modest High [135]
is higher than anaerobic treatment. The combinations of different anaerobic andaerobic processes have been applied to treat a broad range of industrial wastewaterincluding textile industry wastewater. For wastewater containing high COD between25,000 and 100,000 mg/L, the usage of anaerobic-aerobic processes might besuitable where the processes result in high organic matter removal efficiency, smalleramount of aerobic sludge produced, and no pH adjustment is needed [139].
4.2.3.1 Aerobic Treatment
Bacterial Treatment
The use of bacteria to degrade azo dyes started in 1970s with reports of Bacillussubtilis, followed by Aeromonas hydrophila, and Bacillus cereus [90]. A detailedlist of bacteria used by different researchers for decolourisation of industrial effluentcontaining azo dye is given in Table 4.7.
Aerobic treatment using bacteria are shown to be effective in decolourising morethan 80% of industrial effluents containing azo dyes.
Fungal Treatment
The main aim of using fungi in wastewater treatment is to purify the effluent byconsumption of organic substances, thus reducing wastewater COD and BOD. Theother aim is to obtain some valuable product, such as fungal biomass for protein-rich animal feed or some specific fungal metabolite [146]. A few researchers havestudied the capability of fungal strains in decolourising azo and triphenyl methane

4 Removal of Dyes and Pigments from Industrial Effluents 81
Table 4.7 Bacteria employed for the decolourisation of industry effluents containing azo dyes
Dye Organisms used Efficiency/Conditions Reference
Reactive dyeHydrolysed Remazol
Brilliant Violet 5RSequencing batch
reactor (SBR)inoculated withsludge collected in afull-scale,continuous activatedsludge plant
90% of colour removal24 h cycle with a sludge
retention time of 15 daysand an aerated reactionphase of 10 h
[140]
Remazol Black B Paenibacillusazoreducens sp. nov
98% Remazol Black Bremoved
[141]
24 h at a dye concentrationof 100 mgdm�3 and atemperature of 37ıC
Reactive azo dyes Pseudomonas luteola 59–99% of colour removal [142]28ıC static incubator at a
dye concentration of100 mg/L
Reactive Black 5 Newly isolatedthermophilicmicroorganisms
>80% colour removal in lessthan 12 h
[143]
Remazol Blue andReactive Black B
Immobilizedthermophiliccyanobacterial strainPhormidium sp.
Remazol Blue: the highestdye removal was 50.3%
[144]
Reactive Black B: the highestdye removal was 60%
Acid dyeAcid Black 172 Pseudomonas sp. DYI Optimal condition for
decolourisation: pH 6.23,30ıC, 8.0 mM of Fe3C,and 10.0 g/L of NaH2PO4
[145]
dyes [147–149]. Many genera either in living or dead form of fungi have beenemployed for the removal of dye in the aqueous solutions as shown in Table 4.8.
Three possible mechanisms are involved in decolourisation of dye aqueoussolution using fungi [161]: biosorption, biodegradation, and bioaccumulation.Biosorption does not involve metabolic energy in the binding of solutes to thebiomass [162]. Biodegradation is an energy-dependent process. This process in-volves breakdown of dyes into various by-products through the action of variousenzymes. Bioaccumulation can be defined as accumulation of pollutants by activelygrowing cells by metabolism [163]. Fungi have advantages over bacteria becausefungi are able to degrade more complex and a variety of substrates. The advantagesof fungal treatment are cost-effectiveness, environmental-friendly, toxic compoundremoval, and sludge reduction [164].

82 T.T. Teng and L.W. Low
Table 4.8 Fungi employed for the decolourisation of industrial effluent
Dye Organism Mechanism Reference
Reactive dyeRemazol Blue, Remazol Black
B, Remazol Red RBSaccharomyces
cerevisiaeBioaccumulation [150]
Everzol Turquoise Blue G Coriolus versicolor Biodegradation [151]Reactive Brilliant Red X-3B Penicillium sp. QQ Biosorption [152]Reactive Red 2 Modified fungal
biomassBiosorption [153]
Gemazol Turquoise Blue-G Rhizopus arrhizus Biosorption [154]Gray Lanaset G Trametes versicolor Biodegradation [155]Synozol Red HF6N, Synazol
Yellow HF2GRAspergillus niger Biosorption [156]
Drimarene Red, DrimareneBlue
Aspergillus foetidus Biosorption [157]
Basic dyeAstrazon Red Funalia trogii Biosorption and
Biodegradation[158]
Malachite Green Fomes scerodermeus Biodegradation [159]
Disperse dyeDisperse Orange 3, Disperse
Yellow 3Pleurotus ostreatus Biodegradation [160]
4.2.3.2 Anaerobic Treatment
The use of anaerobic process in dye wastewater treatment has been investigatedsince the early 1970s. This treatment process could be a cheap alternative comparedto aerobic systems as expensive aeration is omitted and problems with bulkingsludge are avoided [36]. This treatment system helps in decolourisation of dyes,by rendering them amenable to further aerobic treatment and degradation [165].Typically, anaerobic breakdown yields methane and hydrogen sulphide [166].
Experiments indicated that the decolourisation of reactive water-soluble azo dyeswas achieved under anaerobic conditions using glucose as carbon source [166].The synthetic dye, tartrazine was found to be readily decolourised in an anaerobicbaffled reactor [167, 168]. Wijetunga et al. [169] reported the effect of organic loadon decolourisation of textile wastewater containing acid dyes in upflow anaerobicsludge blanket reactor (UASB). Over 85% of colour removal was observed for AcidRed 131, Acid Yellow 79, and Acid Blue 204. Acid Red 131 and Acid Yellow 79were decolourised through biodegradation while Acid Blue 204 was decolouriseddue to adsorption onto anaerobic granules. Decolourisation of Congo Red (CR)and real textile wastewater was measured in one-and two-stage anaerobic treatmentsystem. Two-stage anaerobic treatment system is more stable compared to one-stageanaerobic treatment. The results also showed that HRT reduction did not affect thedecolourisation of dye. Thus, electron transfer was not a concern in the study [4].

4 Removal of Dyes and Pigments from Industrial Effluents 83
4.2.4 Thermal Methods
4.2.4.1 Wet Air Oxidation
Wet air oxidation uses high temperature (at 300ıC) and high pressure (>10 MPa) forthe treatment of textile industry effluents that contain high chemical oxygen demandconcentration of 10,000–100,000 mg/L [170–173]. Wet air oxidation converts allorganic contaminants to carbon dioxide and water. This process can also removeoxidizable inorganic components such as cyanides and ammonia. For industrialeffluent with COD concentration less than 5,000 mg/L, this treatment process is notrecommended, because this process is not cost-effective compared to other chemicalor biological processes.
4.2.4.2 Thermolysis
Thermolysis (catalytic/uncatalytic) is a chemical process where heat is used to de-compose a substance to another substance which is stable and usable. This process isreported to have improved the biogasification of biomass due to breakdown of lowermolecular weight compounds [174]. Thermolysis process can be used followed bycoagulation-flocculation-filtration, catalytic wet air oxidation, or aerobic biologicaloxidation [170, 171, 175–177].
4.2.5 Combined Treatment Methods
In order to treat dye wastewater that contains high chemical oxygen demandvalues and high organic compounds such as phenols, dyes, tensioactives with goodeconomics and high degree of energy efficiency, a few combined physical, chemical,and biological processes have been studied and listed in Table 4.9.
4.3 Conclusions
Although a number of successful physical, chemical, and biological processes havebeen applied, cost-effective removal of colour from effluents remains a challengein industrial dye wastewater treatment. Wide ranges of pH, salt concentrations, andchemical structure of dye often add to the complication of dye wastewater treatment.Most of the industrial wastewaters containing anionic and cationic dyes are treatedusing adsorption process. Inexpensive, locally available, and effective materials canbe used as adsorbents to replace expensive commercial-activated carbon for theremoval of dyes from aqueous solution. Low-cost adsorbents offer a lot of promising

84 T.T. Teng and L.W. Low
Table 4.9 Combination of various treatment methods
Combination method Process Reference
Physical/chemical or chemical/physicalCoagulation/adsorption Coagulation was used as a main treatment
process followed by adsorption for theremoval of reactive dyes (C.I. ReactiveRed 45 and C.I. Reactive Green 8) fromsynthetic wastewater
[178]
99.9% of colour removal and 90% of CODreduction were achieved for both dyes
Coagulation-flocculation/adsorption
Removal of Black 5 and Orange 16 wasinvestigated using combinedcoagulation-flocculation/ adsorptionmethod
[179]
The removal efficiencies were 90% for Black5 and 84% for Orange 16
Coagulation-flocculation/nanofiltration
FeCl3 was used as coagulant agent for theremoval of Remazol Black 133 B, ProcionCrimson H-EXL, Procion Navy H-EXL,Procion Yellow H-EXL, Procion BlueH-EXL
[180]
98% of colour removal for all dyes wasachieved for all dyes except RemazolBlack 133 B that achieved a 90%
Fenton’s process/nanofiltration
Three combinations of Fenton’s process andnanofiltration are studied using a syntheticsolution of eosin dye: Scheme 1 isFenton’s process followed bynanofiltration; Scheme 2 is nanofiltrationfollowed by Fenton’s process; Scheme 3 istwo steps of nanofiltration
[181]
The results showed: Scheme 1 is foundsuitable for eosin removal for dyeconcentration up to 70 mg/L; Scheme 2 isnot suitable for dye removal; Scheme 3 isthe most suitable among all the threeschemes. It reduces eosin concentration toless than 1 mg/L
Chemical/biological or biological/chemicalPhotocataytic/anaerobic Photocatalytic process based on immobilized
titanium dioxide was used as pre/post-treatment method to biological anaerobictreatment for the treatment of azo,anthraquinone, and phthalocyanine textiledyes
[182]
Photocatalysis was able to decolourise morethan 90% of dye from the solutions
The end products of this treatment processwere non-toxic toward methanogenicbacteria
(continued)

4 Removal of Dyes and Pigments from Industrial Effluents 85
Table 4.9 (continued)
Combination method Process Reference
Ozonation/biologicaldegradation withbiofilm
Treatment of dye wastewater using ozonationproduces toxic and carcinogenicby-products
[183]
Therefore, combined treatment of ozonationand subsequent biological degradationwith a biofilm for colour removal andCOD reduction was investigated. 96% ofcolour removal for Remazol Black B dyewas obtained
There is an increase in toxicity level afterozonation but after submitting theozonized synthetic wastewater tobiological treatment with a biofilm thetoxicity level decreases
Thermal/chemicalThermolysis/coagulation Thermolysis alone resulted in 92.85% of
colour removal and 77.9% of CODreduction at pH 12
[174]
Coagulation of fresh composite waste usingaluminium potassium sulphate resulted in95.4% and 88.62% of colour removal andCOD reduction, respectively, at pH 8
Coagulation of the supernatant obtained aftertreatment by catalytic thermolysis resultedin close to 100% colour removal and97.3% of COD reduction
benefits for commercial use in future. Chemical treatment methods such as advanceoxidation processes (AOP), and coagulation-flocculation are effective in treating awide range of dye aqueous solutions, but sludge disposal still remains a problem.Ozonation, photocatalytic, and sonocatalytic degradation methods are increasinglyused in wastewater treatment because they do not increase the volume of wastewaterand sludge, but production of toxicity by-products prevents its wide acceptance.Use of combination methods for the removal of dyes containing wastewaters hasreceived increasing attention.
References
1. Christie RM (2001) Colour chemistry. The Royal Society of Chemistry, Cambridge, UK,pp 1–200
2. Raghavacharya C (1997) Color removal from industrial effluents – a comparative review ofavailable technologies. Chem Eng World 32:53–54
3. Bogacki MB, Iwona M, Andrzej K (2004) Application of experimental design for optimiza-tion of physicochemical properties of the inorganic pigment, iron (III) silicate. Dyes Pigments61:149–164

86 T.T. Teng and L.W. Low
4. Firmino PIM, Da Silva MER, Cervantes FJ, Dos Santos AB (2010) Colour removal ofdyes from synthetic and real textile wastewaters in one- and two-stage anaerobic systems.Bioresour Technol 101:7773–7779
5. Gupta GS, Shukla SP, Prasad G, Singh VN (1992) China clay as an adsorbent for dye housewastewaters. Environ Technol 13:925–936
6. Moises TP, Patricia BH, Barrera-Diaz CE, Gabriela RM, Reyna NR (2010) Treatment ofindustrial effluents by a continuous system: eletrocoagulation-activated sludge. BioresourTechnol 101:7761–7766
7. Shukla SP, Gupta GS (1992) Toxic effects of omega chrome red ME and its treatment byadsorption. Ecotoxicol Environ Staf 24:155–163
8. Sokolowska-Gajda J, Freeman HS, Reife A (1996) Synthetic dyes based on environmentalconsiderations: 2. Iron complexed formazan dyes. Dyes Pigments 30:1–20
9. Srinivasan A, Viraraghavan T (2010) Decolorization of dye wastewaters by biosorbents: areview. J Environ Manag 91:1915–1929
10. Jain CK, Kumar A, Hayssam Izazy M (2009) Color removal from paper mill effluent throughadsorption technology. Environ Monit Assess 149:343–348
11. Kalyani KSP, Balasubramanian N, Srinivasakannan C (2009) Decolorization and CODreduction of paper industrial effluent using electro-coagulation. Chem Eng J 151:97–104
12. Kabadasil I, Tunay O, Orhon D (1999) Wastewater control and management in a leathertanning district. Water Sci Technol 40:261–267
13. Kanth SV, Venba R, Madhan B, Chandrababu NK, Sadulla S (2008) Studies on the influenceof bacterial collagenase in leather dyeing. Dyes Pigments 76:338–347
14. Paschoal FMM, Anderson MA, Zanoni MVB (2009) Simultaneous removal of chromium andleather dye from simulated tannery. J Hazard Mater 166:531–537
15. Bhat RV, Mathur P (1998) Changing scenario of food colours in India. Curr Sci 74:198–20216. Doehlert DC, Simsek S, Wise ML (2009) The green oat story: possible mechanisms of green
color formation in oat products during cooking. J Food Sci 74:226–23117. Meimaridou A, Haasnoot W, Noteboom L, Mintzas D, Pulkrabova J, Hajslova J, Nielen
MWF (2010) Color encoded microbeads-based flow cytometric immunoassay for polycyclicaromatic hydrocarbons in food. Anal Chim Acta 672:9–14
18. Slampova A, Smela D, Vondrackova A, Jancarova I, Kuban V (2001) Determination ofsynthetic colorants in foodstuffs. Chem List 95:163–168
19. Cook SMF, Linden DR (1997) Use of rhodamine WT to facilitate dilution and analysis ofatrazine samples in short-term transport studies. J Environ Qual 26:1438–1441
20. Kross BC, Nicholson HF, Ogilvie LK (1996) Methods development study for measuringpesticide exposure to golf course workers using video imaging techniques. Appl OccupEnviron Hyg 11:1346–1351
21. Scarpi C, Ninci F, Centini M, Anselmi C (1998) High-performance liquid chromatographydetermination of direct and temporary dyes in natural hair colourings. J Chromatogr A796:319–325
22. Wagner RW, Lindsey JS (1996) Boron-dipyrromethane dyes for incorporation in syntheticmulti-pigment light-harvesting arrays. Pure Appl Chem 68:1373–1380
23. Morgan-Sagastume JM, Jimenez B, Noyola A (1997) Tracerstudies in a laboratory and pilotscale UASB reactor. Environ Technol 18:817–826
24. Field MS, Wilhelm RG, Quinlan JF, Aley TJ (1995) An assessment of the potential adverseproperties of fluorescent tracer dyes used for groundwater tracing. Environ Monit Assess38:75–97
25. Sorensen BL, Wakeman RJ (1996) Filtration characterization and specific surface areameasurement of activated sludge by rhodamine B adsorption. Water Res 30:115–121
26. Forgacs E, Cserhati T, Oros G (2004) Removal of synthetic dyes from wastewaters: a review.Environ Int 30:953–971
27. Wesenberg D, Kyriakides I, Agathos SN (2003) White-rot fungi and their enzymes for thetreatment of industrial dye effluents. Biotechnol Adv 22:161–187

4 Removal of Dyes and Pigments from Industrial Effluents 87
28. Christie RM (2007) Environmental aspects of textile dyeing. Woodhead, Boca Raton/Cambridge
29. Hunger K (2003) Industrial dyes: chemistry, properties, applications. Wiley-VCH, Weinheim/Cambridge
30. Husain Q (2006) Potential applications of the oxidoreductive enzymes in the decolorizationand detoxification of textile and other synthetic dyes from polluted water: a review. Crit RevBiotechnol 26:201–221
31. Dos Santos AB, Cervantes FJ, Van Lier JB (2007) Review paper on current technologies fordecolourisation of textile wastewaters: perspectives for anaerobic biotechnology. BioresourTechnol 98:2369–2385
32. Kirk O (1993) Encyclopedia of chemical technology, vol 8. Wiley, New York33. Shaul GM, Holdsworth TJ, Dempsey CR, Dostal KA (1991) Fate of water soluble azo dyes
in the activated sludge process. Chemosphere 22:107–11934. O’Neill C, Hawkes FR, Hawkes DL, Lourenco ND, Pinheiro HM, Delee W (1999) Colour in
textile effluents—sources, measurement, discharge consents and simulation: a review. J ChemTechnol Biotech 74:1009–1018
35. Perry RH, Green DW, Maloney JO (1997) Perry’s chemical engineers’ handbook, 7th edn.McGraw-Hill, New York
36. Gupta VK, Suhas (2009) Application of low-cost adsorbents for dye removal – a review.J Environ Manag 90:2313–2342
37. Fitzpatrick CSB, Gregory J (2003) Coagulation and filtration. In: Mara D, Horan NJ (eds)The handbook of water and wastewater microbiology. Academic, London
38. Bansal RC, Goyal M (2005) Activated carbon adsorption. Taylor & Francis Group, BocaRaton
39. Danis TG, Albanis TA, Petrakis DE, Pomonis PJ (1998) Removal of chlorinated phenols fromaqueous solutions by adsorption on alumina pillared clays and mesoporous alumina aluminumphosphates. Water Res 32:295–302
40. Freeman HM (1989) Standard handbook of hazardous waste treatment and disposal, 2nd edn.McGraw-Hill, New York
41. Cheremisinoff NP (2002) Handbook of water and wastewater treatment technologies.Butterworth-Heinemann, Boston
42. Alley ER (2000) Water quality control handbook. McGraw-Hill Inc, New York43. Weber WJ (1972) Physiochemical processes for water quality control. Wiley, New York,
pp 199–25944. Snoeyink VL, Summers RS (1999) Adsorption of organic compounds. In: Letterman RD (ed)
Water quality and treatment: a handbook of community water supplies, 5th edn. AmericanWater Works Association/McGraw-Hill Inc, New York
45. Wang XS, Zhou Y, Jiang Y, Sun C (2008) The removal of basic dyes from aqueous solutionsusing agricultural by-products. J Hazard Mater 157:374–385
46. Bailey SE, Olin TJ, Bricka M, Adrian DD (1999) A review of potentially low-cost sorbentsfor heavy metals. Water Res 33:2469–2479
47. Crini G (2006) Non-conventional low-cost adsorbents for dye removal: a review. BioresourTechnol 97:1061–1085
48. Reife A, Freeman H (1996) Environmental chemistry of dyes and pigments. Wiley, New York49. Rafatullah M, Sulaiman O, Hashim R, Ahmad A (2010) Adsorption of methylene blue on
low-cost adsorbents: a review. J Hazard Mater 177:70–8050. Rasul MG, Rudolph V, Carsky M (1999) Physical properties of bagasse. Fuel 78:905–91051. Low LW, Teng TT, Alkarkhi AFM, Ahmad A, Morad N (2011) Optimization of the adsorption
conditions for the decolorization and COD reduction of methylene blue aqueous solutionusing low-cost adsorbent. Water Air Soil Pollut 214:185–195
52. Low LW, Teng TT, Ahmad A, Morad N, Wong YS (2011) A novel pretreatment method oflignocellulosic material as adsorbent and kinetic study of dye waste adsorption. Water AirSoil Pollut 218:293–306

88 T.T. Teng and L.W. Low
53. Ofomaja AE, Ho YS (2007) Equilibrium sorption of anionic dye from aqueous solution bypalm kernel fibre as sorbent. Dyes Pigments 74:60–66
54. McKay G, Porter JF, Prasad GR (1999) The removal of dye colours from aqueous solutionsby adsorption on low-cost materials. Water Air Soil Pollut 114:423–438
55. Hameed BH (2009) Evaluation of papaya seeds as a novel non-conventional low-costadsorbent for removal of methylene blue. J Hazard Mater 162:939–944
56. Magdy YH, Daifullah AAM (1998) Adsorption of a basic dye from aqueous solutions ontosugar-industry-mud. Waste Manag 18:219–226
57. Hameed BH (2009) Grass waste: a novel sorbent for the removal of basic dye form aqueoussolution. J Hazard Mater 166:233–238
58. Hameed BH, Mahmoud DK, Ahmad AL (2008) Sorption of basic dye from aqueous solutionby pomelo (Citrus grandis) peel in a batch system. Colloids Surf A 316:78–84
59. Hameed BH (2009) Removal of cationic dye from aqueous solution using jackfruit peel asnon-conventional low-cost adsorbent. J Hazard Mater 162:344–350
60. Hameed BH, Mahmoud DK, Ahmad AL (2008) Sorption equilibrium and kinetics of basicdye from aqueous solution using banana stalk waste. J Hazard Mater 158:499–506
61. Hameed BH, Ahmad AA (2009) Batch adsorption of methylene blue from aqueous solutionby garlic peel, an agricultural waste biomass. J Hazard Mater 164:870–875
62. Oladoja NA, Asia IO, Aboluwoye CO, Oladimeji YB, Ashogbon AO (2008) Studies on thesorption of basic dye by rubber (Hevea brasiliensis) seed shell. Turk J Eng Environ Sci 32:143–152
63. Sun DS, Zhang XD, Wu YD, Liu X (2010) Adsorption of anionic dyes from aqueous solutionon fly ash. J Hazard Mater 181:335–342
64. Senthilkumaar S, Kalaamani P, Porkodi K, Varadarajan PR, Subburaam CV (2006) Adsorp-tion of dissolved reactive red dye from aqueous phase onto activated carbon prepared fromagricultural waste. Bioresour Technol 97:1618–1625
65. Hsu TC (2008) Adsorption of an acid dye onto coal fly ash. Fuel 87:3040–304566. Alpat SK, Ozbayrak O, Alpat S, Akcay H (2008) The adsorption kinetics and removal of
cationic dye, Toluidine Blue O, from aqueous solution with Turkish zeolite. J Hazard Mater151:213–220
67. Vimonses V, Jin B, Chow CWK (2010) Insight into removal kinetic and mechanisms ofanionic dye by calcined clay materials and lime. J Hazard Mater 177:420–427
68. Almeida CAP, Debacher NA, Downs AJ, Cottet L, Mello CAD (2009) Removal of methyleneblue from colored effluents by adsorption on momtmorillonite clay. J Colloid Interface Sci332:46–53
69. Hong S, Wen C, He J, Gan F, Ho YS (2009) Adsorption thermodynamics of methylene blueonto bentonite. J Hazard Mater 167:630–633
70. Hajjaji M, Alami A, El-Bouadili A (2006) Removal of methylene blue from aqueous solutionby fibrous clay minerals. J Hazard Mater 135:188–192
71. Al-Futaisi A, Jamrah A, Al-Hanai R (2007) Aspects of cationic dye molecule adsorption topalygorskite. Desalination 214:327–342
72. Chakrabarti S, Dutta BK (2005) Note on the adsorption and diffusion of methylene blue inglass fibers. J Colloid Interface Sci 286:807–811
73. Hassan SSM, Awwadb NS, Aboterikaa AHA (2009) Removal of synthetic reactive dyes fromtextile wastewater by Sorel’s cement. J Hazard Mater 162:994–999
74. Vimonses V, Lei SM, Jin B, Chow CWK, Saint C (2009) Adsorption of Congo red by threeAustralian kaolins. Appl Clay Sci 43:465–472
75. Yu JX, Li BH, Sun XM, Yuan J, Chi RA (2009) Polymer modified biomass of bakers yeast forenhancement adsorption of methylene blue, rhodamine B and basic magenta. J Hazard Mater168:1147–1154
76. Marungrueng K, Pavasant P (2007) High performance biosorbent (Caulerpa lentillifera) forbasic dye removal. Bioresour Technol 98:1567–1572
77. Gulnaz O, Kaya A, Matyar F, Arikan B (2004) Sorption of basic dyes from aqueous solutionby activated sludge. J Hazard Mater 108:183–188

4 Removal of Dyes and Pigments from Industrial Effluents 89
78. Rubin E, Rodriguez P, Herrero R, Cremades J, Barbara I, Sastre de Vicente ME (2005)Removal of methylene blue from aqueous solutions using as biosorbent Sargassum muticum:an invasive macroalga in Europe. J Chem Technol Biotechnol 80:291–298
79. Maurya NS, Mittal AK, Cornel P, Rother E (2006) Biosorption of dyes using dead macrofungi: effect of dye structure, ionic strength and pH. Bioresour Technol 97:512–521
80. El-Sikaily A, Khaled A, El-Nemr A, Abdelwahab O (2006) Removal of methylene blue fromaqueous solution by marine green alga Ulva lactuca. Chem Ecol 22:149–157
81. Caparkaya D, Cavas L (2008) Biosorption of methylene blue by a brown alga Cystoseirabarbatula Kutzing. Acta Chim Solv 55:547–553
82. Ncibi MC, Hamissa AMD, Fathallah A, Kortas MH, Baklouti T, Mahjoub B, Seffen M (2009)Biosorptive uptake of methylene blue using Mediterranean green alga Enteromorpha spp. JHazard Mater 170:1050–1055
83. Kumari K, Abraham TE (2007) Biosorption on anionic textile dyes by nonviable biomass offungi and yeast. Bioresour Technol 98:1704–1710
84. Elizalde-Gonzalez MP, Fuentes-Ramırez LE, Guevara-Villa MRG (2009) Degradation ofimmobilized azo dyes by Klebsiella sp. UAP-b5 isolated from maize bioadsorbent. J HazardMater 161:769–774
85. Akar T, Ozcan AS, Tunali S, Ozcan A (2008) Biosorption of a textile dye (Acid Blue 40)by cone biomass of Thuja orientalis: estimation of equilibrium, thermodynamic and kineticparameters. Bioresour Technol 99:3057–3065
86. Mishra G, Tripathy M (1993) A critical review of the treatments for decolouration of textileeffluent. Colourage 40:35–38
87. Ali HG, Gehad RE, Ahmed Z (2007) Kinetics of the oxidative decolorization of ReactiveBlue-19 by acidic bromate in homogeneous and heterogeneous media. Dyes Pigments 73:90–97
88. Kace JS, Linford HB (1975) Reduced cost flocculation of a textile dyeing wastewater. J WaterPollut Control Fed 47:1971
89. Lee JW, Choi SP, Thiruvenkatachari R, Shim WG, Moon H (2006) Evaluation of theperformance of adsorption and coagulation processes for the maximum removal of reactivedyes. Dyes Pigments 69:196–203
90. Anjaneyulu Y, Sreedhara Chary N, Samuel Suman Raj D (2005) Decolourization of industrialeffluents-available methods and emerging technologies – a review. Rev Environ Sci Bio/Technol 4:245–273
91. Klavarioti M, Mantzavinos D, Kassinos D (2009) Removal of residual pharmaceuticals fromaqueous systems by advanced oxidation processes. Environ Int 35:402–417
92. Watanabe T, Koller K, Messner K (1998) Copper-dependent depolymerization of lignin in thepresence of fungal metabolite, pyridine. J Biotechnol 62:221–230
93. Pecci L, Montefoschi G, Cavallini D (1997) Some new details of the copper-hydrogenperoxide interaction. Biochem Biophy Res Comm 235:264–267
94. Lim CL, Morad N, Teng TT, Ismail N (2009) Treatment of Terasil Red R dye wastewaterusing H2O2/pyridine /Cu(II) system. J Hazard Mater 168:383–389
95. Adams CD, Gorg S (2002) Effect of pH and gas-phase ozone concentration on the decolour-ization of common textile dyes. J Environ Eng 128:293–298
96. Xu Y, Lebrun RE (1999) Treatment of textile dye plant effluent by nanofiltration. Membr SepSci Technol 34:2501–2519
97. Tehrani-Bagha AR, Mahmoodi NM, Menger FM (2010) Degradation of persistent organicdye from colored textile wastewater by ozonation. Desalination 260:34–38
98. Sevimli MF, Kinaci C (2002) Decolorization of textile wastewater by ozonation and Fenton’sprocess. Water Sci Technol 45:279–286
99. Hitchcock DR, Law SE, Wu J, Williams PL (1998) Determining toxicity trends in theozonation of synthetic dye wastewaters using the nematode Caenorhabditis elegans. ArchEnviron Contam Toxicol 34:259–264
100. Ince NH, Gonene DT (1997) Treatability of a textile azo dye by UV/H2O2. Environ Technol18:179–185

90 T.T. Teng and L.W. Low
101. Behnajady MA, Modirshahla N, Ghanbary F (2007) A kinetic model for the decolorizationof C.I. Acid Yellow 23 by Fenton process. J Hazard Mater 148:98–102
102. Marco SL, Albino AD, Ana S, Carla A, Jose AP (2007) Degradation of a textile reactiveazo dye by a combined chemical-biological process: Fenton’s reagent-yeast. Water Res 41:1103–1109
103. Robinson T, McMullan G, Marchant R, Nigam P (2001) Remediation of dyes in textileeffluent: a critical review on current treatment technologies with a proposed alternative.Bioresour Technol 77:247–255
104. Balchioglu IA, Arslan I, Sacan MT (2001) Homogeneous and heterogeneous advancedoxidation of two commercial reactive dyes. Environ Technol 22:813–822
105. Shrestha RA, Pham TD, Sillanpaa M (2009) Effect of ultrasonication on removal of persistentorganic pollutants (POPs) from different types of soils. J Hazard Mater 170:871–875
106. Naddeo V, Belgiorno V, Napoli RMA (2007) Behaviour of natural organic matter duringultrasonic irradiation. Desalination 210:175–182
107. Singla R, Grieser F, Ashokkumar M (2009) Sonochemical degradation of martius yellow dyein aqueous solution. Ultrason Sonochem 16:28–34
108. Pang YL, Abdullah AZ, Bhatia S (2010) Effect of annealing temperature on the characteris-tics, sonocatalytic activity and reusability of nanotubes TiO2 in the degradation of RhodamineB. Appl Catal B: Environ 100:393–402
109. Wang J, Lv YH, Zhang L, Liu B, Jiang RZ, Han GX, Xu R, Zhang XD (2010) Sonocatalyticdegradation of organic dyes and comparison of catalytic activities of CeO2/TiO2, SnO2/TiO2
and ZrO2/TiO2 composites under ultrasonic irradiation. Ultrason Sonochem 17:642–648110. Doll TE, Frimmel FH (2004) Kinetic study of photocatalytic degradation of carbamazepine,
clofibric acid, iomeprol and iopromide assisted by different TiO2 materials determination ofintermediates and reaction pathways. Water Res 38:955–964
111. Lin YC, Lee HS (2010) Effects of TiO2 coating dosage and operational parameters on aTiO2/Ag photocatalysis system for decolorizing Procion red MX-5B. J Hazard Mater 179:462–470
112. Khataee AR, Kasiri MB (2010) Photocatalytic degradation of organic dyes in the presence ofnanostructured titanium dioxide: influence of the chemical structure of dyes. J Mol Catal A:Chem 328:8–26
113. Cox M, Rydberg J (2004) Introduction to solvent extraction. In: Rydberg J, Cox M, MusikasC, Choppin GR (eds) Solvent extraction principles and practice. Marcel Dekker, New York,pp 1–10
114. Woo LD, Hi HW, Yup HK (2000) Removal of an organic dye from water using a predispersedsolvent extraction. Sep Sci Technol 35:1951–1962
115. Muthuraman G, Teng TT, Leh CP (2009) Extraction and recovery of methylene blue fromindustrial wastewater using benzoic acid as an extractant. J Hazard Mater 163:363–369
116. Muthuraman G, Teng TT (2009) Extraction of methyl red from industrial wastewater usingxylene as an extractant. Prog Nat Sci 19:1215–1220
117. Muthuraman G, Teng TT (2009) Use of vegetable oil in supported liquid membrane for thetransport of Rhodamine B. Desalination 249:1062–1066
118. Fouad EA, Bart HJ (2008) Emulsion liquid membrane extraction of zinc by a hollow-fibercontactor. J Membr Sci 307:156–168
119. Naim MM, Monir AA (2003) Desalination using supported liquid membranes. Desalination153:361–369
120. Frankenfield JW, Li NN (1987) Recent advance in liquid membrane technology, Handbookof separation process technology. Wiley, New York, pp 840–861
121. Prashant SK, Vijaykumar VM (2002) Application of liquid emulsion membrane (LEM)process for enrichment of molybdenum from aqueous solutions. J Membr Sci 201:123–135
122. Semerjian L, Ayoub GM (2003) High-pH- Magnesium coagulation-flocculation in wastewatertreatment. Adv Environ Res 7:389–403
123. Annadurai G, Sung SS, Lee DJ (2004) Simultaneous removal of turbidity and humic acidfrom high turbidity stormwater. Adv Environ Res 8:713–725

4 Removal of Dyes and Pigments from Industrial Effluents 91
124. Xia S, Zhang Z, Wang X, Yan A, Chen L, Zhao Z, Leonard D, Jaffrezic-Renault N (2007)Production and characterization of a bioflocculant by Proteus mirabilis TJ-1. BioresourTechnol 99:6520–6527
125. Tan BH, Teng TT, Mohd Omar AK (2000) Removal of dyes and industrial dye wastes bymagnesium chloride. Water Res 34:597–601
126. Liao MY, Randtke SJ (1986) Predicting the removal of soluble organic contaminants by limesoftening. Water Res 20:27–35
127. Folkman Y, Wachs AM (1973) Removal of algae from stabilization pond effluents by limetreatment. Water Res 7:419–428
128. Black AP, Christman RF (1961) Electrophoretic studies of sludge particles produced in lime-soda softening. J Am Water Works Assoc 53:737
129. Roussy J, Van Vooren M, Dempsey BA, Guibal E (2005) Influence of chitosan characteristicson the coagulation and the flocculation of bentonite suspensions. Water Res 39:3247–3258
130. Bolto B, Gregory J (2007) Organic polyelectrolytes in water treatment. Water Res 41:2301–2324
131. Szygula A, Guibal E, Palacın MA, Ruiz M, Sastre AM (2009) Removal of an anionic dye(Acid Blue 92) by coagulation-flocculation using chitosan. J Environ Manag 90:2979–2986
132. Sadri Moghaddam S, Alavi Maghaddam MR, Arami M (2010) Coagulation-flocculationprocess for dye removal using sludge from water treatment plant: optimization throughresponse surface methodology. J Hazard Mater 175:651–657
133. Beltran-Heredia J, Sanchez-Martın J, Delgado-Regalado A, Jurado-Bustos C (2009) Removalof Alizarin Violet 3R (anthraquinonic dye) from aqueous solutions by natural coagulants.J Hazard Mater 170:43–50
134. Anouzla A, Abrouki Y, Souabi S, Safi M, Rhbal H (2009) Colour and COD removalof disperse dye solution by a novel coagulant: application of statistical design for theoptimization and regression analysis. J Hazard Mater 166:1302–1306
135. Chan YJ, Chong MF, Law CL, Hassel DG (2009) A review on anaerobic-aerobic treatmentof industrial and municipal wastewater. Chem Eng J 155:1–18
136. Seghezzo L, Zeeman G, Van Lier JB, Hamelers HVM, Lettinga G (1998) A review: theanaerobic treatment of sewage in UASB and EGSB reactors. Bioresour Technol 65:175–190
137. Yeoh BG (1995) Anaerobic treatment of industrial wastewaters in Malaysia. In: Post confer-ence seminar on industrial wastewater management in Malaysia, Kuala Lumpur, Malaysia
138. Leslie Grady CP Jr, Daigger GT, Lim HC (1999) Biological wastewater treatment, 2nd edn.,revised and expanded. CRC Press, Boca Raton
139. Cervantes FJ, Pavlostathis SG, Van Haandel AC (2006) Advanced biological treatmentprocesses for industrial wastewaters: principles and applications. IWA publishing, London
140. Lourenco ND, Novais JM, Pinheiro HM (2000) Reactive textile dye colour removal in asequencing batch reactor. Water Sci Technol 42:321–328
141. Meehan C, Bjourson AJ, McMullan G (2001) Paenibacillus azoreducens sp. nov., a syntheticazo dye decolorizing bacterium from industrial wastewater. Int J Syst Evol Microbiol 51:1681–1685
142. Hu TL (2001) Kinetics of azoreductase and assessment of toxicity of metabolic products fromazo dyes by Pseudomonas luteola. Water Sci Technol 43:261–269
143. Deive FJ, Domınguez A, Barrio T, Moscoso F, Moran P, Longo MA, Sanroman MA (2010)Decolorization of dye Reactive Black 5 by newly isolated thermophilic microorganisms fromgeothermal sites in Galicia (Spain). J Hazard Mater 182:735–742
144. Ertugrul S, Bakir M, Donmez G (2008) Treatment of dye-rich wastewater by an immobilizedthermophilic cyanobacterial strain: Phormidium sp. Ecol Eng 32:244–248
145. Du LN, Yang YY, Li G, Wang S, Jia XM, Zhao YH (2010) Optimization of heavy metal-containing dye Acid Black 172 decolorization by Pseudomonas sp. DYI using statisticaldesigns. Int Biodeterior Biodegrad 64:566–573
146. Pant D, Adholeya A (2007) Biological approaches for treatment of distillery wastewater: areview. Bioresour Technol 98:2321–2334

92 T.T. Teng and L.W. Low
147. Bumpus JA, Brock BJ (1988) Biodegradation of crystal violet by the white rot fungusphanerochaete chrysosporium. Appl Environ Microbiol 54:1143–1150
148. Sani R, Banerjee U (1999) Decolorization of acid green 20, a textile dye, by the white rotfungus Phanerochaete chrysosporium. Adv Environ Res 2:485–490
149. Vasdev K, Kuhad RC, Saxena RK (1995) Decolorization of triphenylmethane dyes by a bird’snest fungus Cyathus bulleri. Curr Microbiol 30:269–272
150. Aksu Z (2003) Reactive dye bioaccumulation by Saccharomyces cerevisiae. Process Biochem38:1437–1444
151. Kapdan IK, Kargia F, McMullanb G, Marchant R (2000) Effect of environmental conditionson biological decolourization of textile dyestuff by C. versicolor. Enzym Microb Technol26:381–387
152. Gou M, Qu YY, Zhou JT, Ma F, Tan L (2009) Azo dye decolorization by a new fungal isolate,Penicillium sp. QQ and fungal-bacterial cocultures. J Hazard Mater 170:314–319
153. Akar T, Divriklioglu M (2010) Biosorption applications of modified fungal biomass fordecolorization of Reactive Red 2 contaminated solutions: batch and dynamic flow modestudies. Bioresour Technol 101:7271–7277
154. Aksu Z, Cagatay SS (2006) Investigation of biosorption of Gemazol Turquise Blue-G reactivedye by dried Phizopus arrhizus in batch and continuous systems. Sep Purif Technol 48:24–35
155. Blanquez P, Caminal G, Sarra M, Vicent T (2007) The effect of HRT on the decolourizationof the Grey Lanaset G textile dye by Trametes versicolor. Chem Eng J 126:163–169
156. Khalaf MA (2008) Biosorption of reactive dye from textile wastewater by non-viable biomassof Aspergillus niger and Spirogyra sp.. Bioresour Technol 99:6631–6634
157. Sumathi S, Manju BS (2000) Uptake of reactive textile dyes by Aspergillus foetidus. EnzymMicrob Technol 27:347–355
158. Yesilada O, Sing S, Asma D (2002) Decolourization of textile dye Astrazon Red FBL byFunalia trogii pellets. Bioresour Technol 81:155–157
159. Papinutti VI, Forchiassin F (2004) Modification of malachite green by Fomes sclerodermeusand reduction of toxicity to Phanerochaete chrysosporium. FEMS Microbiol Lett 231:205–209
160. Zhao X, Hardin IR (2007) HPLC and spectrophotometric analysis of biodegradation of azodyes by Pleurotus ostreatus. Dyes Pigments 73:322–323
161. Kaushik P, Malik A (2009) Fungal dye decolourization: recent advances and future potential.Environ Int 35:127–141
162. Tobin JM, White C, Gadd GM (1994) Metal accumulation by fungi: applications inenvironment biotechnology. J Ind Microbiol 13:126–130
163. Aksu Z, Donmez G (2005) Combined effects of molasses sucrose and reactive dye on thegrowth and dye bioaccumulation properties of Candida tropicalis. Process Biochem 40:2443–2454
164. More TT, Yan S, Tyagi RD, Surampalli RY (2010) Potential use of filamentous fungi forwastewater sludge treatment. Bioresour Technol 101:7691–7700
165. Krull R, Hempel DC (1994) Biodegradation of naptholenosulphenic acid containing sewagein a two stage treatment plant. Bioprocess Eng 10:229–234
166. Carliell CM, Barclay SJ, Buckely CA (1996) Treatment of exhausted reactive dye batheffluent using anaerobic digestion: laboratory and full scale trails. Water SA 22:225–233
167. Bell J, Plumb JJ, Buckley CA, Stuckey DC (2000) Treatment and decolorization of dyes inan anaerobic baffled reactor. J Environ Eng 126:1026–1032
168. Plumb JJ, Bell J, Stuckey DC (2001) Microbial populations associated with treatment of anindustrial dye effluent in an anaerobic baffled reactor. Appl Environ Microbiol 67:3226–3235
169. Wijetunga S, Li XF, Chen J (2010) Effect of organic load on decolourization of textilewastewater containing acid dyes in upflow anaerobic sludge blanket reactor. J Hazard Mater177:792–798
170. Lei L, Chen G, Hu X, Yue PL (2000) Homogeneous catalytic wet-air oxidation for thetreatment of textile wastewater. Water Environ Res 72:147–151

4 Removal of Dyes and Pigments from Industrial Effluents 93
171. Lei L, Hu X, Chen G, Porter JF, Yue PL (2000) Wet air oxidation of desizing wastewater fromtextile industry. Ind Eng Chem Res 39:2896–2901
172. Lei L, Hu X, Chu HP, Yue PL (1997) Catalytic wet air oxidation of dyeing and desizingwastewater. Water Sci Technol 65:311–319
173. Lei L, Hu X, Yue PL (1998) Improved wet oxidation for the treatment of dyeing wastewaterconcentrate from membrane separation process. Water Res 32:2753–2759
174. Kumar P, Prasad B, Mishra IM, Chand S (2008) Treatment of composite wastewater of acotton textile mill by thermolysis and coagulation. J Hazard Mater 151:770–779
175. Bayramoglu M, Kobya M, Can OT, Sozbir M (2004) Operating cost analysis of electrocoag-ulation of textile dye wastewater. Sep Purif Technol 37:117–125
176. Lei L, Wang D (2000) Wet oxidation of PVA-containing desizing wastewater. Chin J ChemEng 8:52–56
177. Lin SH, Lin CM (1993) Treatment of textile waste effluent by ozonation and chemicalcoagulation. Water Res 27:1743–1748
178. Papic S, Koprivanac N, Loncaric Bozc A, Metes A (2004) Removal of some reactive dyesfrom synthetic wastewater by combined Al(III) coagulation/carbon adsorption process. DyesPigments 62:291–298
179. Furlan FR, Da Silva LGDM, Morgado AF, De Souza AAU, De Souza SMAGU (2010)Removal of reactive dyes from aqueous solutions using combined coagulation/flocculationand adsorption on activated carbon. Resour Conserv Recycl 54:283–290
180. Riera-Torres M, Gutierrez-Bouzan C, Crespi M (2010) Combination of coagulation-flocculation and nanofiltration techniques for dye removal and water reuse in textile effluents.Desalination 252:53–59
181. Banerjee P, DasGupta S, De S (2007) Removal of dye from aqueous solution using acombination of advance oxidation process and nanofiltration. J Hazard Mater 140:95–103
182. Harrelkas F, Paulo A, Alves MM, El-Khadir L, Zahraa O, Pons MN, Van Der Zee FP(2008) Photocatalytic and combined anaerobic-photocatalytic treatment of textile dyes.Chemosphere 72:1816–1822
183. De Souza SMDAGU, Bonilla KAS, De Souza AAU (2010) Removal of COD and color fromhydrolyzed textile azo dye by combined ozonation and biological treatment. J Hazard Mater179:35–42

Chapter 5Heavy Metal Removal Through BiosorptivePathways
Jinsheng Sun, Yulan Ji, Fang Cai, and Jing Li
5.1 Introduction
Rapid industrialization and urbanization have resulted in elevated levels of toxicheavy metals. This has been entangled, almost everywhere, in most industrialactivities involving leakage and redistribution of heavy metals, such as miningand metalliferous smelting, metallurgy, iron and steel, electroplating, electrolysis,electro-osmosis, leatherworking, photography etc. Subsequently, these coursesresult in gradual exhaustion of metal land mineral resources. Especially, wastewatersproduced from these industrial activities not only bring about serious environmentaleffect, but also threaten human health and ecosystem. These heavy metals, for theconvenience of analyses, reportedly fall into three families, including toxic metals(such as Hg, Cr, Pb, Zn, Cu, Ni, Cd, As, Co, Sn, etc.), precious metals (such as Pd,Pt, Ag, Au, Ru etc.), and radionuclides (such as U, Th, Ra, Am, etc.) [1].
Methods for removing metal ions from aqueous solution mainly consist of phys-ical, chemical, and biological technologies. Traditional physiochemical methodsinclude chemical precipitation, oxidation or reduction, filtration, ion exchange,electrochemical treatment, reverse osmosis, membrane technology, and evaporationrecovery. Most of these are ineffective or excessively expensive when the metalconcentrations are less than 100 mg/L [2, 3]. For example, usual physical pathwayslike ion exchange, activated carbon, and membrane adsorption belong to the lattercostly group, especially when treating large amounts of wastewater. In recentyears, in a way of financial convenience, applying biotechnology in controlling and
J. Sun (�) • Y. Ji • F. CaiSchool of Chemical Engineering and Technology, Tianjin University, Tianjin 300072,People’s Republic of Chinae-mail: [email protected]
J. LiEngineering Department, China Tianjin Chemical Engineering Design Institute,No. 2 Gu Shan Road, Tianjin 300193, People’s Republic of China
S.K. Sharma and R. Sanghi (eds.), Advances in Water Treatment and PollutionPrevention, DOI 10.1007/978-94-007-4204-8 5,© Springer ScienceCBusiness Media Dordrecht 2012
95

96 J. Sun et al.
removing metal pollution has been paid much attention, and gradually becomeshot topic, for potential application, in the field of metal pollution control. Furtheralternative process is biosorption, which utilizes various certain natural materialsof biological origin, including bacteria, fungi, yeast, algae, etc. These biosorbentspossess instinctive metal-sequestering features to decrease the concentration ofheavy metal ions in solution from ppm to ppb level. It can effectively capturedissolved metal ions and carry them out of dilute complex solutions with highefficiency and celerity; sound features as an ideal candidate for treating high volumeand low concentration complex wastewaters [1].
This metabolism-independent mechanism is called biosorption [4]. According toVolesky and Holan [5], who presented an extensive review on biosorption, the strongbiosorbent behavior of certain types of microbial biomass toward metallic ions is afunction of the chemical makeup of microbial cells. In fact, the biomass in practiceis nonliving and all cells are metabolically inactive. Compared with conventionaltreatment methods, biosorption has the following advantages [6–9]:
• High efficiency and selectivity for heavy metals in low concentrations• Energy-saving• Broad operational range of pH and temperature• Easy reclamation of heavy metal• Easy recycling of the biosorbent
Heavy metal removal by biosorption has been investigated during the last severaldecades [10]. The capability of some living microorganisms to accumulate metallicelements has first been observed from toxicological point of view [10]. However,further researches revealed that inactive/dead microbial biomass can passivelybind metal ions via various physicochemical mechanisms. This discovery then ledbiosorption to the frontier of researches and an active field for the removal ofmetal ions. A large quantity of materials has been investigated as biosorbents forextensive removal of metals or organics. The tested biosorbents can be basicallyclassified into the following categories: Bacteria (e.g., Bacillus subtillis), fungi (e.g.,Rhizopus arrhizus), yeast (e.g., Saccharomyces cerevisiae), algae, industrial wastes(e.g., S. cerevisiae waste biomass from fermentation and food industry), agriculturalwastes (e.g., corn core), and other polysaccharide materials, etc. [11]. The role ofsome groups of microorganisms has been given enough concern, such as bacteria,fungal, yeast, algae, etc.
Some potential biomaterials with high metal-binding capacity have been iden-tified, such as Sargassum natans, Bacillus subtillis, Rhizopus arrhizus, Saccha-romyces cerevisae, and waste microbial biomass from the fermentation and foodindustries [5, 8, 9, 12–17]. Among these materials or biosorbents, some types bindand collect the majority of heavy metals with no specific priority, while others caneven be specific for certain types of metals [5].
Researches on biosorption focus on the biosorbents, the biosorption mechanism,and large-scale experiments. Although many biological materials can bind heavymetals, only those with sufficiently high metal-binding capacity and selectivity forheavy metals are suitable for use in a full-scale biosorption process. Mechanisms

5 Heavy Metal Removal Through Biosorptive Pathways 97
responsible for biosorption are understood to a limited extent, and commercialapplication of microbial biomass as a biosorbent suffered from problems associatedwith the physical characteristics of this material [18]. Attempts to apply biosorptionprocess into practice have proved to be futile [19]. So, the biosorption processis basically at the stage of laboratory-scale study. Also, great efforts have to bemade to improve biosorption process, including immobilization of biomaterials,improvement of regeneration and reuse, optimization of biosorption process, etc. Insum, theoretical and practical development about biosorption should be allowed toforge ahead.
The aim of this chapter is to present the state-of-the-art biosorbent investigationand to compare results found in the literature. The effects of environmental factorson biosorption capacities, biosorption mechanisms, advantages of biotechnology,regeneration/reuse of biosorbents, as well as proposals about improving biotech-nology are presented and discussed. What is more, current hot topics, trends, andoutlook of this field are also touched upon.
5.2 Brief Review of Physicochemical Removal Technology
Before the introduction, this brief review offers a control to the biological pathwaysthat will be discussed in the next paragraph.
Conventional physicochemical methods, such as activated carbon, precipitation,reverse osmosis, membrane separation, chemical oxidation, and ionic exchangeand so on, have been commonly used. However, most of those are less effective,excessively expensive, and eco-unfriendly when initial metal concentrations are inthe range of 10–100 mg/L [20]. For instance, chemical precipitation and electro-chemical treatment are not very effective, especially when metal ion concentrationin aqueous solution is among 1–100 mg/L, and also produce large quantity of sludgerequired to treat with still more great difficulty [21].
The advantages and limitations in application of these traditional methods aregiven below in detail as follows:
5.2.1 Activated Carbon
It is a crude form of graphite with a random or amorphous structure, which is highlyporous, exhibiting abroad range of pore sizes, from visible cracks, crevices, and slitsof molecular dimensions [22]. And with its specific high surface area, microporouscharacter, and chemical nature of their surface, activated carbons have made thempotential adsorbents for the removal of heavy metals from industrial wastewater[23, 24]. In spite of its advantages, it also shows many shortcomings such as highcost to prepare, reactivation resulting in a loss of the carbon, performance typedependent of carbon, being nonselective, and so on. Although modified activatedcarbon [25] can improve the selectivity, its preparation cost roars up subsequently.

98 J. Sun et al.
5.2.2 Chemical Precipitation
This pathway is widely used for heavy metal removal from inorganic effluent[26, 27]. Typically, the metal precipitates from the solution in the form of hydroxide[28]. Since lime or calcium hydroxide is the most commonly employed precipitantagent, this method gains availability at most corners of the world. Lime precipi-tation, another option, can be trusted to effectively treat inorganic effluent with ametal concentration of higher than 1,000 mg/L with a simple process. For instance,it helped to remove heavy metals such as Zn(II), Cd(II), and Mn(II) cations withinitial metal concentrations of 450, 150, and 1,085 mg/L, respectively, in a batchcontinuous system [29]. In spite of its advantages, chemical precipitation requires alarge amount of chemicals to reduce metals to an acceptable level for discharge [30].And generally it can hardly be used to handle low concentration of metal wastewater,which is below 100 mg/L [21]. Other drawbacks are its excessive sludge productionthat requires further treatment, the increasing cost of sludge disposal, slow metalprecipitation, and the long-term environmental impacts of sludge disposal [31–33].
5.2.3 Chemical Oxidation and Reduction
Adding oxidizing or reducing agent makes toxic substances in wastewater beingoxidized or reduced to nontoxic or low toxic substances. It has been reportedthat heavy metals such as Mn2C, Cu2C, Pb2C, Cd2C, Cr3C, and Hg2C could beeffectively removed using potassium ferrate(VI) as oxidation and co-precipitation[34, 35]. However, currently chemical oxidation and reduction was generally usedas a pretreatment for wastewater before more powerful procedures.
5.2.4 Membrane Separation
Membrane separation methods like electrodialysis (ED), nanofiltration (NF), ultra-filtration (UF), and reverse osmosis (RO) [36] have received considerable attentionfor the treatment of inorganic effluent, since they are capable of removing notonly suspended solid and organic compounds, but also inorganic contaminantssuch as heavy metals [37–39]. Although it can be applied in occasions of lowmetal ion concentrations, for example, Tzanetakis’s [40] removal efficiency ofCo(II) and Ni(II) were 90% and 69%, at initial metal concentrations of 0.84 and11.72 mg/L, respectively. The main disadvantages of these processes are inadequateselectivity, high energy consumption, and immature technologies, which limit thepopularization of this technology.

5 Heavy Metal Removal Through Biosorptive Pathways 99
5.2.5 Ion Exchange
This is a method that uses ion-exchange resin or agent to exchange ions in dilutesolution to achieve the purpose of extraction or removal of certain ions in solution.And it is widely used for the recovery and removal of metals from process and wastestreams in chemical process industries [41–43].
In general, ion exchange is reportedly effective to treat inorganic effluent within arelatively wide range of metal concentrations from 10 mg/L [44, 45] to 10–100 mg/L[46–48], or even up to higher than 100 mg/L [49, 50]. Furthermore, unlike chemicalprecipitation, ion exchange does not present any sludge disposal problems [51].Despite these advantages, it also has some limitations in treating wastewater ladenwith heavy metals. Suitable ion exchange resins are not available for all heavymetals, and the capital and operational cost is high [52].
5.3 Biological Removal Technology
In recent decades, more and more attention have been paid to biotechnologicalremoval of heavy metal and application of natural biological origin, includingbacteria, fungi, yeast, algae, etc. These methods have the advantage over lowoperating cost, minimization of the pollutant concentration, and high efficiency indetoxifying the dilute effluents.
5.3.1 Heavy Metals Removal by Bacteria
5.3.1.1 Introduction
Novel methods of metal removal and recovery based on biological materials havebeen considered and widely used. Bacteria are the most abundant and versatile ofmicroorganisms and constitute a significant fraction of the entire living terrestrialbiomass of �1018 g [53]. In addition, because of their small size, ubiquity, ability togrow under controlled conditions, and resilience to a wide range of environmentalsituations, bacteria were often used to remove heavy metal ions [54]. Certain typesof microbial biomass can retain relatively high quantities of metals on their cellwall due to its microstructure. Bacteria species such as Bacillus, Pseudomonas,Streptomyces, Escherichia, and Micrococcus have been tested for uptake metals ororganics. Moreover, many factors such as biomass type and concentration, metalconcentration, pH, and biomass–metal contact time affect removal ratios of heavymetals.
Table 5.1 summarizes some of the important results of metal biosorptionusing bacterial biomasses, according to published references [2, 11]. Metal uptakecapacity does not necessarily reach the maximum values in the field application.

100 J. Sun et al.
Table 5.1 Bacterial biomass used for metal removal
Metal ions Bacteria speciesBiosorptioncapacity (mg/g) References
Pb Bacillus sp. 92:3 [55]Bacillus firmus 467 [56]Corynebacterium glutamicum 567:7 [57]Enterobacter sp. 50:9 [58]Pseudomonas aeruginosa 79:5 [59]Pseudomonas aeruginosa 0:7 [60]Pseudomonas putida 270:4 [61]Pseudomonas putida 56:2 [62]Streptomyces rimosus 135:0 [63]
Zn Streptomyces rimosus 30 [64]Bacillus firmus 418 [56]Aphanothece halophytica 133:0 [65]Pseudomonas putida 6:9 [62]Pseudomonas putida 17:7 [66]Streptomyces rimosus 30:0 [64]Streptomyces rimosus 80:0 [64]Streptoverticillium
cinnamoneum21:3 [67]
Thiobacillus ferrooxidans 82:6 [68]Thiobacillus ferrooxidans 172:4 [69]
Cu Bacillus firmus 381 [56]Bacillus sp. 16:3 [55]Bacillus subtilis 20:8 [70]Enterobacter sp. 32:5 [58]Micrococcus luteus 33:5 [70]Pseudomonas aeruginosa 23:1 [59]Pseudomonas cepacia 65:3 [71]Pseudomonas putida 6:6 [62]Pseudomonas putida 96:9 [61]Pseudomonas putida 15:8 [66]Pseudomonas stutzeri 22:9 [70]Sphaerotilus natans 60 [72]Sphaerotilus natans 5:4 [72]Streptomyces coelicolor 66:7 [73]Thiobacillus ferrooxidansa 39:8 [69]
Cd Aeromonas caviae 155:3 [74]Enterobacter sp. 46:2 [58]Pseudomonas aeruginosa 42:4 [59]Pseudomonas putida 8:0 [62]Pseudomonas sp. 278:0 [75]Staphylococcus xylosus 250:0 [75]Streptomyces pimprina 30:4 [76]Streptomyces rimosus 64:9 [77]
(continued)

5 Heavy Metal Removal Through Biosorptive Pathways 101
Table 5.1 (continued)
Metal ions Bacteria speciesBiosorptioncapacity (mg/g) References
Fe(III) Streptomyces rimosus 122:0 [78]Cr(IV) Bacillus coagulans 39:9 [79]
Bacillus megaterium 30:7 [79]Zoogloea ramigera 2 [80]Aeromonas caviae 284:4 [74]Bacillus coagulans 39:9 [79]Bacillus licheniformis 69:4 [81]Bacillus megaterium 30:7 [79]Bacillus thuringiensis 83:3 [82]Pseudomonas sp. 95:0 [75]Staphylococcus xylosus 143:0 [75]
Ni Bacillus thuringiensis 45:9 [83]Streptomyces rimosus 32:6 [84]
Pd Desulfovibrio desulfuricans 128:2 [85]Desulfovibrio fructosivorans 119:8 [85]Desulfovibrio vulgaris 106:3 [85]
Pt Desulfovibrio desulfuricans 62:5 [85]Desulfovibrio fructosivorans 32:3 [85]Desulfovibrio vulgaris 40:1 [85]
U Arthrobacter nicotianae 68:8 [86]Bacillus licheniformis 45:9 [86]Bacillus megaterium 37:8 [86]Bacillus subtilis 52:4 [86]Corynebacterium equi 21:4 [86]Corynebacterium glutamicum 5:9 [86]Micrococcus luteus 38:8 [86]Nocardia erythropolis 51:2 [86]Zoogloea ramigera 49:7 [86]
Th Arthrobacter nicotianae 75:9 [86]Bacillus licheniformis 66:1 [86]Bacillus megaterium 74:0 [86]Bacillus subtilis 71:9 [86]Corynebacterium equi 46:9 [86]Corynebacterium glutamicum 36:2 [86]Micrococcus luteus 77:0 [86]Zoogloea ramigera 67:8 [86]
Some uptake values were experimentally observed, and some were predicted bythe Langmuir model. Table 5.1 also provides the basic information to evaluate thepossibility of using bacterial biomass for the removal of metal ions.
Large quantities of metals can be accumulated by a variety of processesdependent or independent on metabolism. Both living and dead biomass as wellas cellular products such as polysaccharides can be used for this purpose. The basicprinciple of biosorption lies in biomass which are metabolically inactive [87].

102 J. Sun et al.
Investigations from Ziagova et al. [75] proved that nonliving cells are advan-tageous over living counterparts for operating without an auxiliary cultivationsystem, immunity to toxic wastes around, and low storage requirement. A study[88] demonstrated that living and dead cells of Bacillus sphaericus OT4b31 showeda biosorption of 25% and 44.5% of Cr, respectively, while B. sphaericus IV(4)10showed a biosorption of 32% and 45%, respectively. Practically biosorption exper-iments usually use heat-killed cells or bacterial biomass through heat treatment tobreak cell wall, exposing more functional groups, thus achieving maximum bindingcapacity [79, 89]. Biosorption is responsible for metal concentration by nonlivingbiomass owing to the absence of metabolic activity necessary for intracellular metalaccumulation [90, 91].
5.3.1.2 Effect of Environmental Factors on Biosorption
Many researchers found that some environmental factors, such as pH, biomass con-centration, metal concentration, and biomass-metal contact time, affected biosorp-tion process, result in different removal effects. Further, the kinetics of adsorptionhas been examined and isotherms models, Langmuir and Freundlich, have beenoverwhelmingly used to analyze the equilibrium data.
Effect of pH
For biosorption of heavy metal ions, pH is one of the most important environmentalfactors. This value of solution strongly influences not only the site dissociation ofthe biomass surface, but also the solution chemistry of the heavy metals: hydrolysis,complexation by organic and/or inorganic ligands, redox reactions, precipitation,speciation, and biosorption availability of the heavy metals [92]. Generally, at lowpH values, several cytomembrane functional groups such as amine, phosphonate,sulfonate, carboxyl, and hydroxyl groups are probably associated with the hydrogenions, making the overall surface charge on the microorganisms positive [93]. Onthe contrary, rising pH increases the negative charge at the surface of the cellsuntil all relevant functional groups are deprotonated, which favors electrochemicalattraction and adsorption of cations. However, when pH climbs to a certain value,for example, as high as 7.0, precipitation of the metal can occur by the formation ofmetal hydroxides [94]. The difference in optimum pH values may be attributed tothe different components of the cell wall of these species. Reportedly, this optimumis organism dependent, due to different adsorptive sites of microorganisms [95].For example, Ziagova et al. [75] observed that optimum pH values were estimatedto be 1.0 for Staphylococcus xylosus with 36% biosorption yield and between 4.0and 5.0 for Pseudomonas sp. with 42% biosorption yield in the case of chromiumwhich exists in the solution as anionic group. They revealed that S. xylosus is aGram positive bacterium with its surface consisting of peptidoglycans, teichoic,and teichuronic acids. These substances provide most of the anionic groups of

5 Heavy Metal Removal Through Biosorptive Pathways 103
the cell and are protonated at low pH and facilitate the interaction of chromium.Also, the study of Hancock [96] indicated that the optimum pH value for chromiumbiosorption was estimated to be 4.0. However, Gialamouidis [87] demonstratedthat this value for Mn(II) biosorption was 6.0 for both of Pseudomonas sp. andS. xylosus, which suggested that the adsorption of metals onto the biomass could beruled by ionic attraction.
Effect of Biomass Concentration
Most studies reported that high biomass concentrations result in low metal sorptiondue to electrostatic interactions between cells, which protect binding sites frommetal occupation [97]. However, increase of the biomass concentration results inreducing the equilibrium concentration of metal solution owing to the fact that thereare more available sites for interaction on biomass. The study of Gialamouidis et al.[87] showed that the biosorption capacity of metal ions is inversely proportional tobiomass concentration, when the initial concentration of metal ions is kept constantwith Pseudomonas sp. concentrations over 4.0 g/L. Ziagova et al. [75] observedthat chromium removal with Pseudomonas sp. does not change significantly athigher than 1.0 g/L biomass concentrations. However, in the case of chromium,there is a significant increase in the metal uptake around 40% by altering biomassconcentration of S. xylosus from 1.0 to 8.0 g/L. This may be attributed to thehigher number of available binding sites, which interact with chromium ions of thesolution, as it has been reported before [98, 99]. At higher than 8.0 g/L biomassconcentration, there is no further positive effect on chromium removal, whichprobably results from limitations in metal ion mobility.
Effect of Contact Time
The kinetics of metal uptake, assumed to be a passive physical adsorption at thecell surface, is very rapid and occurs in a very short time after the microorganismshave come into contact with metal ions [100]. The adsorption speed of uraniumby Citrobacter freudii was very fast in the first 20 min and then slowed downgradually and reached equilibrium after 50 min [101]. In the study of Ziagovaet al. [75], the amount of adsorbed Cd(II) reached the highest value, 50%, withinthe first 30 min with Pseudomonas sp. and 55% after 1.0 h with S. xylosus.,respectively. Gialamouidis et al. [87] indicated that the biosorption capacities ofPseudomonas sp. and S. xylosus for Mn2C increased with contact time rapidlyand thereafter it proceeded at a lower rate and finally attained equilibrium within10 min. This result is important because equilibrium time is one of the parametersfor economical wastewater treatment plant application [24]. This behavior suggeststhat in the initial stage adsorption takes place rapidly on the external surface of theadsorbent followed by a slower internal diffusion process, which may be the rate-determining step.

104 J. Sun et al.
5.3.1.3 Biosorption Models
Kinetics Model
In order to examine the mechanism of biosorption process such as mass transfer andchemical reaction, a suitable kinetic model is needed to describe the data. The linearpseudo-first-order equation is given as follows [102]:
log.qeq � qt / D log qeq � k1
2:303t (5.1)
where qt and qeq are the amounts of metal ions adsorbed at time t and equilibrium(mg/g), respectively, and k1 is the rate constant of pseudo-first-order adsorptionprocess (min�1).
The linear pseudo-second-order equation is given [102]:
t
qtD 1
k2q2eqC 1
qeqt (5.2)
where k2 is the equilibrium rate constant of pseudo-second-order biosorption(g/mg min).
These results of Gialamouidis et al. [87] strongly suggest that the biosorption ofMn(II) onto Pseudomonas sp. and S. xylosus cells is most appropriately representedby a pseudo-second-order rate process. In the study of Xie et al. [101], theadsorption kinetics of uranium by C. freudii showed that the pseudo-second-ordermodel fitted the absorption curve much better than the pseudo-first-order model,which indicated the adsorption rate was proportional to the number of unoccupiedsites. Song et al. [103] demonstrated that the equilibrium of Au(III) biosorptionwas achieved within 5 min and the adsorption yield reached 100%, whereas thatof Cu(II) was only 66.61% after 30 min in the binary system of Au(III) andCu(II) by magnetotactic bacteria. They suggested that the first-order equation ofLagergren in most cases does not fit well for the whole range of contact time[104]. The pseudo-second-order equation can be used in this case assuming thatthe measured concentrations are equal to cell surface concentrations, and it is morelikely to predict behavior over the whole range of adsorption and is in agreementwith an adsorption mechanism being the rate controlling step. Consequently, theydemonstrated that the experimental data were fitted well into the pseudo-second-order kinetic model in the single and binary component situations.
Isotherm Models
Langmuir and Freundlich isotherm equations were frequently used to describe theequilibrium state for single-ion adsorption experiments. The theoretical basis ofLangmuir equation relies on the assumption. That is, there is a finite number of

5 Heavy Metal Removal Through Biosorptive Pathways 105
Table 5.2 Adsorption isotherm parameters in the different conditions
Langmuir constantsFreundlich constantsMetal
ions Bacteria speciesQmax
(mg/g)b � 10�3
(L/mg) R2 Kf (L/g) 1/n R2 References
Cd Paeudomonas sp. 278 9 0:901 9:08 0:531 0:998 [75]S. xylosus 250 8 0:912 7:00 0:547 0:996 [75]Ochrobactrum anthropi 37:3 37 0:971 44:64 2:45 0:961 [107]
Cr Pseudomonas sp. 95 7 0:949 1:42 0:676 0:997 [75]S. xylosus 143 5 0:967 1:33 0:758 0:974 [75]Ochrobactrum anthropi 86:2 6 0:932 2:45 1:60 0:981 [107]
Au Magnetotactic bacteria 37:7 978 0:9939 27:56 0:0637 0:9901 [103]Cu Magnetotactic bacteria 36:8 160:5 0:9985 16:09 0:091 0:9428 [103]
Ochrobactrum anthropi 32:6 52 0:991 3:00 1:72 0:816 [107]Mn Pseudomonas sp. 109 13 0:99 4:30 0:536 0:93 [87]
S. xylosus 59 26 0:97 3:22 0:533 0:99 [87]
binding sites which are homogeneously distributed over the adsorbent surface ofthe cells, having the same affinity for adsorption of a single molecular layer andthere is no interaction between adsorbed molecules. The mathematical descriptionof the equation is considered.
Q D QmaxbCi
1C bCi(5.3)
where Ci is the metal residual concentration in solution (mg/L); Qmax is themaximum specific uptake corresponding to sites saturation (mg/g), and b is thebiomass-metal binding affinity (mg/L) [105].
The Freundlich equation is the empirical relationship whereby it is assumed thatthe adsorption energy of a metal binding to a site on an adsorbent depends onwhether or not the adjacent sites are already occupied. This empirical equation ispresented.
Q D Kf � .Ci /1=n (5.4)
where Kf and n are constants indicating adsorption capacity and adsorptionintensity, respectively [106]. The results of some studies about Langmuir andFreundlich isotherm models are presented in Table 5.2.
5.3.1.4 Selective Adsorption in the Case of Multicomponent System
Competitive biosorption takes place in the multicomponent system. Under mostconditions, aqueous sources of precious metals contain not only one but also severalkinds of metal ions. Although many published reports are available on the single-metal biosorption, limited attention has been paid to the biosorption of multimetal

106 J. Sun et al.
Table 5.3 The Freundlich parameters and the correlation coefficients
Au(III) ions Cu(II) ions
C0,other metal/mg/L KF n R2 KF n R2
0 27:56 15:6985 0:9901 16:09 11:0254 0:9428
80 44:33 22:8833 0:9265 1:27 5:1125 0:9693
320 38:64 10:2669 0:9214 0:04 1:4656 0:9857
Note: C0, other metal represents the other metal concentration in solution. WhenC0, other metal D 0, it is single ion solution; when not, it is binary system
Table 5.4 The Langmuir parameters and the correlation coefficients
Au(III) ions Cu(II) ions
C0,other metal/mg L�1 Q0 (mg/g) b (L/mg) R2 Q0 (mg/g) b (L/mg) R2
0 37.7 0.9780 0.9939 36.8 0.1605 0.998580 48.8 4.1000 1.0000 22.4 0.0046 0.9260320 47.6 5.2500 1.0000 27.7 0.0007 0.9026
Note: The meaning of C0, other metal is the same as Table 5.3
ion system [108]. Summarization of these present literatures concerning biosorptionof this more complicated system revealed different biosorptive features from thoseof single counterparts [103]. To make this reasonable, competition among thedifferent metal ions for the cellular surface binding sites is believed to certainlyoccur and depend to some extent on the ionic characteristics for certain microbe. Theexamination of the effects of binary metal ions in various combinations, discussedin this section, is more representative of the actual environmental problems as it hasbeen also reported [109], since real wastewaters are polluted with more than onetoxic metals.
Song et al. [103] observed that the maximum adsorption capacity for Au(III)by magnetotactic bacteria in Au-Cu binary system was nearly doubled as that inthe single system. The results demonstrated that Cu(II) has a “catalyzing” effecton Au(III) sorption during competitive biosorption process, which also indicatesthat the MTB cell walls have high selectivity toward Au(III) ions in binary-solutebiosorption process.
Besides, Langmuir model and Freundlich model have been also introduced todescribe both single and binary system biosorption. The Freundlich and Langmuirconstants evaluated from linear regression analysis are listed in Tables 5.3 and 5.4,respectively. Within the metal concentration range of 80–500 mg/L, both modelswere suitable for describing the adsorption isotherms of Au(III) or Cu(II) ions; thatof Au(III) was more fitted by Langmuir model and that of Cu(II) by Freundlich inbinary system.
In the study of Wang et al. [108], simultaneous biosorptions of Ag(I) and Cu(II)ions by Magnetospirillum gryphiswaldense (MSR-1) were evaluated using severalmediums that contained 2 mmol/L each of the two metal ions. In each medium, themolar ratios of Ag(I) and Cu(II) were different, which were 5:1, 4:1, 3:1, 2:1, 1:1,

5 Heavy Metal Removal Through Biosorptive Pathways 107
100
90
80
70
60
50
40
30
20
10
05:1 4:1 3:1
Ag(I) of binary systemCu(II) of binary systemAg(I) of single systemCu(II) of single system
2:1
Ag/Cu
Y (
%)
1:1 1:2 1:3 1:4 1:5
Fig. 5.1 The results ofAg(I)–Cu(II) binary systemadsorption experiments(Reprinted from Ref. [108].With kind permission of© Elsevier BV (2011))
1:2, 1:3, 1:4, 1:5. The results were compared with that of single systems, whichincluded the same molar concentration of Ag(I) and Cu(II).
As shown in Fig. 5.1, the biosorption capacities of Ag(I) on MSR-1 in thepresence of Cu(II) were higher than that of noncompetitive conditions. Interestingly,when the molar ratios of Ag(I) and Cu(II) were less than 4:1, the biosorptioncapacities of Cu(II) on MSR-1 were higher than that of noncompetitive cases,whereas those were lower under the molar ratios of Ag(I) to Cu(II) of both 5:1and 4:1. They deduced that the most possible factor which affected the phenomenonof selective biosorption was the ions themselves.
In addition, they demonstrated that the adsorption isotherm of Ag(I) can also beperfectly expressed by the Langmuir model just as that in the single ion solution.Nevertheless, both models are mathematically unsuitable for describing Cu(II)adsorption isotherms in binary system, with the regression coefficients (R2) lessthan 0.95. So, a new mathematically consistent Eq. (5) was selected for accuratedescription of Cu(II).
qe D a.1C be�kCe / (5.5)
The constants in this case evaluated from regression analysis were a D 3.50917,b D 7.38993, k D 0.11474, with a high regression coefficient (R2) 0.99343. Thismodel, not fit for the single metal system in this study, is under further checkingamong vast analogous competitive adsorptive systems to find universality before itis introduced to mathematically describe the prohibited one(s). Undoubtedly, it hasan important guiding significance for the future research.
The results indicated that biosorption in binary mixtures is a rather complicatedadsorption mechanism affected by a lot of factors, including surface charge,

108 J. Sun et al.
functional groups, properties of the solution (e.g., pH), and the adsorbates (e.g.,concentration, ionic strength, and weight). In addition, there are many interactionsnot only between the metal ions but also between the metal ions and the surface ofthe biomass [75]. If highly selective biosorbents for a certain metal ion were created,great progress would be made in the removal of heavy metal ions.
5.3.1.5 Regeneration of Biosorbents
The entire biosorption process for metal removal include sorption followed bydesorption, i.e., to concentrate the solute. Biotechnological exploitation of biosorp-tion technology for removal of heavy metal(s) depends on the efficiency of theregeneration of biosorbent after metal desorption. It is important to reclaim thebiosorbents especially, since the biomass preparation is costly. Therefore, nonde-structive recovery by mild and cheap desorbing agents is desirable for regenerationof biomass and reuse in multiple cycles. Appropriate eluants are necessary to attainthe above-mentioned objective, which strongly depends on the type of biosorbentand the mechanism of biosorption [21]. Also, the eluant must meet the followingrequirements: (1) Non-damaging to the biomass, (2) less costly, (3) environmentalfriendly, and (4) effective [11]. Acidic and alkaline condition were used fordesorption. The eluants such as CaCl2 with HCl, HCl with EDTA, NaOH werereported [11]. According to the study of Chen et al. [110], approximately 74.8% ofthe adsorbed Cu was desorbed from nonliving Pseudomonas putida CZ1 by 1.0 MCH3COOK, and more than 80% Zn. Gialamouidis et al. [87] observed that morethan 88% of Mn(II) adsorbed by Pseudomonas sp. was released into the HNO3
solution at the first cycle. After three cycles, biosorption ability of Pseudomonas sp.reduced by 77.4%, which may be due to the fact that HNO3 solution modifies thecell wall, while the desorption ability remains to high levels.
The efficiency of desorption is often expressed by the S/L ratio, i.e. solid toliquid ratio. The solid represents the solid sorbent (in mg dry wt) and the liquidrepresents the amount of eluant applied (in mL). High values of S/L are desirablefor complete elution and to make the process more economical. Sometimes, metal-selective elution is desirable and it is dependent on metal sequestration mechanism.Dilute mineral acids, EDTA, carbonates and bicarbonates, NH4OH, KHCO3, andKCN have been used to remove metal(s) from the loaded biomass [111].
To date, less attention has been paid to investigate the regeneration ability of thebiosorbent, more relevant work is necessary for future field biosorption application.
5.3.1.6 Biosorption Mechanism Discussion
One of them is bioaccumulation, based on the incorporation of metals inside theliving biomass. Another process is biosorption, in which metallic ions remain at thecellular surface by different mechanisms [11]. Elucidation of mechanisms active in

5 Heavy Metal Removal Through Biosorptive Pathways 109
metal biosorption is essential for successful exploitation of the phenomenon and forregeneration of biosorbent materials in multiple reuse cycles. The complex nature ofbiosorbent materials makes this task particularly challenging [5]. These results showthat in binary mixtures, biosorption is a rather complicated adsorption mechanismaffected by a lot of factors, including surface charge, functional groups, propertiesof the solution (e.g., pH), and the adsorbates (e.g., concentration, ionic strength,and weight). In addition, there are many interactions, not only between the metalions, but also between the metal ions and the surface of the biomass. Velasquez andDussan [88] suggested that in dead cells metals could have been adhered to surfacemolecules such as the S-layer which is a porous one that can have saturation velocity.Metallic ions must find a union target and pass through other cellular componentsbefore this happens. What is more, in living cells cellular density increases as timeelapses; therefore, there are more available binding sites for metals. Additionally,if the metal gets inside the cell, it first needs to join surface molecules and thengets in through different mechanisms. So, S-layer proteins might execute a trappingrole of metallic ions in both living and dead cells, being a potential alternative forbioremediation processes of heavy metals in field. Algae, fungi, yeast, and bacteriacan remove heavy metals from aqueous solutions by binding the cationic metalsonto negatively charged functional groups distributed on their cell walls, such ascarboxyl and phosphoryl groups [112, 113]. According to Volesky and Holan [5],who presented an extensive review on biosorption, the strong biosorbent behaviorof certain types of microbial biomass toward metallic ions is a function of thechemical makeup of microbial cells. Beveridge [114] reported that bacteria areexcellent biosorbents due to their high surface-to-volume ratios and high content ofpotentially active chemisorptions sites such as teichoic acid in their cell walls. Thestudy of Gialamouidis et al. [87] is very interesting. They calculated thermodynamicparameters such as enthalpy change (�Ho), entropy change (�So), and free energychange of the sorption (�Go), demonstrating that the heats of biosorption of Mn(II)on Pseudomonas sp. and S. xylosus cells were found to be of the same order asthe heat of chemisorptions whereas the heat of biosorption on Blakeslea trisporacells is lower and in the range of physical adsorption. Besides, equilibrium betweenthe cell surface and the metal ions is usually rapidly attained and easily reversible,because the energy requirements are limited. Studies of copper or zinc interactionswith microorganisms showed that Cu or Zn may be associated with the functionalgroups on the cellular surface [115–118], intercellular accumulation, and storagevia active cationic transport systems [114, 119], or precipitation of Cu sulfides atthe biofilm surface [120]. In terms of biosorption, polysaccharides, proteins, andlipids on bacterial cell walls offer many functional groups such as carboxylate,hydroxyl, phosphate, amine, and sulphate groups which can bind metal ions. Thisnatural affinity of biological compounds for metallic elements could contribute tothe purification of metal-contaminated wastewater [18]. Vullo et al. [18] thought thatmetal biosorption depends upon the available surface negative charges. Metal ionsbiosorption could affect these surface negative charges and thus bacterial electricproperties. Electrophoretic mobility measurements are generally done to understandbacterial cell electric properties [121–123], determining Zeta potential values.

110 J. Sun et al.
Moreover, in their study, for concentrations greater than 0.05 mM, no changes areobserved in Z potential, which could be explained by the saturation of the cellsurface sites available for Cd. Xie et al. [101] observed that the adsorption capacityof uranium by C. freudii increased after the strain was pretreated with 0.5 mol/LNaOH. Proteins, lipids, and some dissolved polysaccharides on the surface of thebacteria could be removed by NaOH. The macromolecular configuration of thecell wall was destroyed and became relaxed, which could improve the diffusioncapability and facilitate the entry of metal ions into the cell. In addition, acetyl intesta could be removed by alkali, and amidocyanogen could be exposed to formLouis alkali, which increased the active sites and the adsorption capacity eventually.By sequential pretreatment with NaOH and methanol-thick hydrochloric acid, thecarboxyl on the C. freudii walls was locked and the adsorption capacity of uraniumdecreased by 45.66% compared with raw bacterium strain, which confirmed thatcarboxyl, as one of the active sites, played an important role in adsorption.
It is necessary to continue searching for the most promising biosorbents from anextremely large pool of readily available and inexpensive biomaterials [8, 9]. Themechanism involved in metal biosorption is far from well understood up to date. It isour mission to investigate the microbe-metal interactions and obtain the mechanismof metal uptake by biosorbents.
Bacteria may either possess the capacity for biosorption of many elementsor, alternatively, depending on the species, may be element specific. It is likelythat, in the future, microorganisms will be tailored for a specific element or agroup of elements, using recombinant DNA technology which is based on geneticmodification using endorestrictive nucleases [53].
5.3.2 Heavy Metals Removal by Fungi
5.3.2.1 Introduction
Powered by another mechanism, fungi also reveal the feature of metal capturers.There are three groups of fungi that have major practical importance: molds,yeasts, and mushrooms. Filamentous fungi and yeasts have been investigated forbiosorption of heavy metal ions in many instances.
It is known for a long time that metallic ions are important to fungal metabolism.The presence of heavy metals had a significant impact on not only the metabolicactivities of fungal cultures, but also the commercial fermentation processes. Theresults from these studies led to a notion of using fungi for the removal of toxicmetals from wastewater and recovery of precious metals from process waters[124]. Fungal cell walls are mainly 80–90% polysaccharide, with proteins, lipids,polyphosphates, and inorganic ions, making up the wall-cementing matrix [21].It is because of these components that both living and dead fungal cells have anextraordinary ability for taking up toxic and precious metals.

5 Heavy Metal Removal Through Biosorptive Pathways 111
The biosorption of heavy metal by filamentous fungi and yeast have beenreported and reviewed in many articles. The fungal organisms are widely used ina variety of large-scale industrial fermentation processes. For example, strains ofAspergillus are used in the production of ferrichrome, kojic acid, gallic acid, itaconicacid, citric acid, and enzymes like amylases, glucose isomerase, pectinase, lipases,and glucanases while Saccharomyces cerevisiae in the food and beverage industries.The use of fungi biomass as an adsorbent for heavy-metal pollution control not onlycan generate economic benefits by recycling industries wastes, but also reduce theburden of disposal costs associated with the waste biomass produced. Alternatively,the biomass can also be grown using unsophisticated fermentation techniques andinexpensive growth media [125].
This section will review and summarize the removal of heavy metals by yeast(Saccharomyces spp.) and filamentous fungi (such as Penicillium sp., Aspergillussp., Mucor sp., Rhizopus sp.) from aqueous solutions.
5.3.2.2 Fungal Biosorbents
Research has proved that yeast and filamentous fungi can remove toxic metals,recover precious metals, and clean radionuclides from aqueous solutions to variousextents. Yeasts of genera Saccharomyces, Candida, different species of Penicillium,under some circumstances, as well as Aspergillus are efficient biosorbents for heavymetal ions. Table 5.5 summarizes some of the important results of metal biosorptionusing fungal biomass.
Except for these four kinds of fungal biomass widely covered by the publishedreports, there are also a lot of other fungi employed for the same purpose.
The cell wall of R. arrhizus involves a high content of chitin. The abilityof chitin to complex metal ions has been confirmed [148]. Viable R. arrhizuscould remove Cu(II) with the maximum specific uptake capacity of 10.76 mg/gat 75 mg/L, the initial Cu(II) concentration [148]. Of the six species of inactivatedfungal mycelia, R. arrhizus, Mucor racemosus, Mycotypha africana, Aspergillusnidulans, A. niger, and Schizosaccharomyces pombe, R. arrhizus exhibited thehighest capacity (qmax D 213 �mol/g). Further experiments with different cellularfractions of R. arrhizus showed that Zn was predominantly bound to cell-wallchitin and chitosan (qmax D 312 �mol/g). R. arrhizus were reported to adsorbTh(IV) [152], Pb(II) [153], Cd(II), Ni(II), and Cr(III) [154]. Brady and Tobin [155]investigated the freeze-dried R. arrhizus biomass for its potential to absorb the hardmetal ion Sr2C and the borderline metal ions Mn2C, Zn2C, Cd2C, Cu2C, and Pb2Cfrom aqueous solutions.
Biosorption of metal ions such as LiC, AgC, Pb2C, Cd2C, Ni2C, Zn2C, Cu2C,Sr2C, Fe2C, Fe3C, and Al3C by Rhizopus nigricans biomass was studied, with themaximum biosorption capacity for the individual metal ions ranging from 160 to460 �mol/g [156].

112 J. Sun et al.
Table 5.5 Fungal biomasses for removal of heavy metals from aqueous solution
Biosorbents Metal ions Biosorption capacity(mg/g) References
Saccharomyces cerevisiae Pb 270:3 [126–129]Ni 46:3 [127, 129]Cr 32:6 [127, 128]Cd 31:75 [128–130]Cu 6:35 [128, 129]Zn 35:31 [128, 129]Hg 64:19 [129]Co 24:75 [129]Fe 16:8 [131]Ag 59 [131]Pd 40:6 [132]Pt 44:0 [133]U 180 [131]Th 63 [134]
Candida albicans, Candida utilis Pb 833:33 [135]Cu 23 [136, 139]Cr 7 [137, 139]Zn 28 [139]Cd 19 [139]Pb 39 [139]
Candida tropicalis Zr 179 [138]Penicillium chrysogenum Pb 55 [140]
Cd 56 [141]Ni 260 [142]Cu 92 [140]
Penicillium simplicissimum Cd 52:5 [143]Zn 65:5 [143]Pb 76:9 [143]Cu 112:3 [144]
Penicillium purpurogenum As 35:6 [145]Hg 70:4 [145]Cd 110:4 [145]Pb 252:8 [145]
Penicillium canescens As 26:4 [146]Hg 54:8 [146]Cd 102:7 [146]Pb 213:2 [146]
Penicillium digitatum Cd 3:5 [15]Pb 5:5 [15]
Penicillium griseofulvum Cu 1:51 [147]Penicillium italicum Cu 2 [2]
Zn 0:2 [2]Penicillium notatum Cu 80 [125]
Zn 23 [125]Cd 5:0 [125]
(continued)

5 Heavy Metal Removal Through Biosorptive Pathways 113
Table 5.5 (continued)
Biosorbents Metal ions Biosorption capacity(mg/g) References
Penicillium janthinellum U 52:7 [125]Aspergillus niger Cu 9:53 [148]
Cd 3:43 [149]Pb 7:24 [149]Ni 0:96 [149]
Aspergillus terreus Cu 180 [150]Fe 164:5 [151]Cr 96:5 [151]Ni 19:6 [151]Cu 224 [151]
The live and dead white rot fungus Trametes versicolor entrapped in Ca-alginatebeads were able to adsorb Cd(II). The maximum experimental biosorption capacitywas 102.3 ˙ 3.2 and 120.6 ˙ 3.8 mg/g, respectively [157].
A white rot fungus species Lentinus sajorcaju biomass was entrapped intoalginate gel via a liquid curing method in the presence of Ca(II) ions. Themaximum experimental biosorption capacity for entrapped live and dead fungalmycelia of L. sajorcaju were found to be 104.8 ˙ 2.7 mg/g and 123.5 ˙ 4.3 mg/g,individually [158].
5.3.2.3 Influencing Factors of Removal of Heavy Metals by Fungi
Pretreatment
The study of Yunsong Zhang et al. [159] showed that ethanol/caustic pretreatmentcould increase the biosorption capabilities of Cu2C on Saccharomyces cerevisiae. Inaddition, SEM and Zeta potential of the three samples account for that caustic andethanol-pretreatment resulted in the change of baker’s yeast surface structure andcharge which is relative to adsorption. These results demonstrate that the increaseof biosorption capacity for Cu2C by ethanol and caustic-baker’s yeast was attributedto the increase and exposure of carboxyl and amino groups on the surface of biomasssample.
Biosorption of chromium ions was found to vary with the type of pretreatment.All pretreatment methods (acid (0.1N H2SO4); alkali (0.01N NaOH); acetone(50%, v/v); formaldehyde (10%, v/v); cetyl trimethyl ammonium bromide (CTAB)(5%, w/v); polyethylemine (PEI) (1%, w/v); and 3-(2-amino ethyl amino) propyltrimethoxy silane (APTS) (3%, v/v)) increased the biosorption of chromiumcompared to the autoclaved A. niger biomass [160]. Park et al. [161] also reportedapproximately 30% removal of chromium using A. niger biomass. The acetonepretreated biomass showed a biosorption capacity of 1.8 mg/g, which was slightlyhigher compared to autoclaved biomass.

114 J. Sun et al.
pH
Solution’s initial pH is a critical parameter for adsorption experiments [162]. Thisparameter strongly influences the solution chemistry of the metals, the activityof functional groups (carboxylate, phosphate and amino groups) on the cell wall,as well as the competition of metallic ions for the binding site [1]. At low pH(<1.0), the biosorption capacity for metal ions is very low, because large quantityof hydrogen ions competes with metal ions at sorption sites. As the pH increases,more negatively charged cell surface become available thus facilitating great metaluptake [163]. However, metal precipitates at high pH values (>7.0) thus inhibitingthe contact of metal with the most fungal biomass.
Ting Fan et al. [143] investigated the effects of the initial pH on biosorption ofCd(II), Zn(II), and Pb(II) ions in aqueous solution by Penicillium simplicissimum.Maximum biosorption capacities were obtained at pH 4.0, 6.0, and 5.0 for Cd(II),Zn(II), and Pb(II), respectively.
The biosorption of nickel(II) ions by deactivated protonated yeast was observedwith respect to the initial pH by V. Padmavathy et al. [164]. The adsorption capacitywas pH dependent with a maximum value of 11.4 mg/g at a pH of 6.75. Thecadmium(II) ion adsorption capacity of Baker’s yeast increased with increasing pH,and was maximum at a pH of 6.5 [165].
Contact Time
It is reported that biosorption of chromium consisted of two phases [161]: a primaryrapid phase and a secondary slow phase. The rapid phase lasted for about 15 min andaccounted for a major portion in the total metal biosorption. Chromium removal of72% was observed in this rapid phase. A maximum chromium removal of 76% wasachieved after 2 h. From 2 h to the end of the kinetic study (12 h), biosorption wasslow and chromium removal varied by ˙2%. This rapid initial uptake is consistentwith reports on the biosorption of Cr(VI) by other researchers [166–170].
This is because the kinetics of metal adsorption is usually rapid during theearly period of contact between the adsorbent and adsorbate possibly by reason ofelectrostatic attraction. The active adsorption sites of the adsorbent become involvedin metal complexation as soon as the adsorbent is introduced into the system. It hasbeen suggested that the slow second phase of metal ions uptake may be due to thereduced availability of active sites [171].
Initial Metal Ion Concentration
As a rule, increasing the initial metal concentration results in an increase in thebiosorption capacity because the initial metal concentration provides a drivingforce to overcome mass transfer resistances between the biosorbent and biosorption

5 Heavy Metal Removal Through Biosorptive Pathways 115
9
8
7
6
5
4
met
al u
ptak
e va
lues
(m
g/g)
3
2
1
0Cu(II) Cd(II) Pb(II)
pH=5pH=4
Fig. 5.2 Competitive metaluptake values (Reprintedfrom Ref. [103]. With kindpermission of © Elsevier(2007))
medium so that higher sorption capacities were obtained at higher initial con-centrations. The adsorption yields are determined at different initial metal ionconcentrations. Increasing the metal ion concentration generally caused a decreasein the biosorption yield. In the case of lower concentrations, the ratio of initialnumber of metal ions to the available sorption sites was low and higher biosorptionyields were obtained. At higher concentrations, the available sites of biosorptionbecame fewer and the saturation of the sorption sites was observed. So biosorptionyields decreased.
The effect of initial metal ion concentration on the biosorption capacity of As-pergillus flavus was studied by Tamer Akar and Sibel Tunali [172]. The biosorptionof Pb(II) and Cu(II) ions on A. flavus increased with increasing initial concentrationof metal ions, becoming saturated at 200 and 150 mg/L for Pb(II) and Cu(II) ions,respectively.
5.3.2.4 Selectivity and Competitive Biosorption by Fungi
Competitive biosorption of Cd2C and Pb2C together with Cu2C ions with ethanoltreated yeast cells were conducted for solution containing 25 mg/L of each metalions at pH 4 and 5 [130]. In their study [130], the highest biosorption capacity ofCu2C ions was determined with caustic treated waste baker’s yeast cells; but forcomparison, ethanol treated yeast biomass was also used for biosorption of Cu2Cions in competitive biosorption studies. The competitive metal uptake values areshown in Fig. 5.2.

116 J. Sun et al.
The competitive biosorption capacities of the yeast biomass for most metalions were lower than non-competitive conditions. The decreased metal uptake incompetitive conditions was thought to be a response to increased competitionbetween like charged species for binding sites of the ethanol treated yeast cells.The order of the sorption capacity was found as Pb>Cu>Cd for both pH values.
P. canescens at competitive or noncompetitive cases exhibited the same preferen-tial order: Pb(II)>Cd(II)>Hg(II)>As(III). Under noncompetitive conditions, thesorption capacity was 26.4 mg/g for As(III), 54.8 mg/g for Hg(II), 102.7 mg/g forCd(II), and 213.2 mg/g for Pb(II) respectively. The competitive adsorption capacityfor the heavy metal ions were 2.0 mg/g for As(III), 5.8 mg/g for Hg(II), 11.7 mg/gfor Cd(II), and 32.1 mg/g for Pb(II), when the initial concentration of the metal ionswas 50 mg/L [146].
The biosorption capacities of Penicillium simplicissimum in the binary and tri-nary metal mixture of Cd(II) C Zn(II), Zn(II) C Pb(II), and Cd(II) C Zn(II) C Pb(II)system were lower than noncompetitive conditions that of unitary system of Cd(II),Zn(II), Pb(II), and Cd(II) [143]. The results clearly demonstrated that the combinedaction of multiple ions was antagonistic and that Cd(II) exerted the inhibitoriesteffect on the biosorption of other metals, followed by Pb(II) and Zn(II).
A similar phenomenon had been observed in the binary adsorption Pb(II) andCu(II) biosorption onto Aspergillus flavus, where it was shown that Pb(II) andCu(II) strongly competed with each other; the biosorption capacities of the binarymetal mixture were lower than that of noncompetitive conditions; and the uptakecapacities of Pb(II) ions were smaller influence than Cu(II) ions [172].
All these published experiments illustrated prohibited competitive biosorptivecapacities, in comparison with the non-competitive cases, for the biomass to uptakemetal ions. The most likely reason for this antagonistic effect is the competition foradsorption sites on the cell surfaces and/or the screening effect by the competingmetal ions.
5.3.2.5 Mechanism of Metal Uptake
DAI Shu-juan et al. [173] provided that cadmium can be adsorbed from electro-plating wastewater by waste Saccharomyces cerevisiae and accumulated mainlyin form of chemical chelating. Electrostatic attraction, hydrogen bonding, and vander Waals force all function in adsorption process. And –NH2–, –CDO–, –CDO–NH–, –CH3, –OH are the main adsorption groups.
Fourier transform, infrared, and X-ray photoelectron spectroscopies were usedto discover that carboxyl, amide, and hydroxyl groups on the biomass surface wereinvolved in the sorption of copper and cadmium by Penicillium chrysogenum andion exchange and complexation dominated the sorption process [174].
The understanding of the mechanism by which microorganisms accumulatemetals is crucial to the development of microbial processes for concentration,removal, and recovery of metals from aqueous solution. Metabolism-independent

5 Heavy Metal Removal Through Biosorptive Pathways 117
metal binding to the cell walls and external surfaces is the only mechanism present inthe case of non-living biomass. Metabolism-independent uptake essentially involvesadsorption process such as ionic, chemical, and physical adsorption. A variety ofligands located on the fungal walls are known to be involved in metal chelation.These include carboxyl, amine, hydroxyl, phosphate, and sulfhydryl groups. Metalions could be absorbed by complexing with negatively charged reaction sites onthe cell surface [175, 176]. The relative importance of each functional groupis often difficult to resolve [177]. Microbial cell wall is rich in polysaccharideand glycoproteins such as glucans, chitin, mannans, and phospho-mannans. Thesepolymers form abundant source of metal binding ligands. Cell walls of fungi presenta multi-laminate architecture where up to 90% of their dry mass consists of aminoor non-amino polysaccharides [178]. In general, the fungal cell wall can be regardedas a two-phase system consisting of the chitin skeleton framework embedded in anamorphous polysaccharide matrix [178]. Up to 30% of Aspergillus niger biomass iscomprised of an association of chitin and glucan [179]. Chitin and chitosan compo-nents of the cell wall are suggested to be important for metal uptake [180, 181].
5.3.2.6 Modeling of Biosorption: Isotherm and Kinetic Models
Analysis of equilibrium data is important for developing an equation that can beused for design purposes. There are several isotherm and kinetic models to describethe sorption phenomena.
Isotherm Modeling
The biosorption isotherms by biomasses are usually described by the well-knownadsorption isotherm models of Freundlich and Langmuir (see Sect. 5.3.1.3).
The parameters of Langmuir and Freundlich isotherm model are presented inTable 5.6. Broadly speaking, most of the data were fit better to Langmuir isothermmodel than Freundlich isotherm model.
Except for these two models, Redlich–Peterson and Temkin adsorption isothermswere also used to describe the sorption phenomena. Arzu Y. Dursun [183] usedLangmuir, Freundlich, and Redlich–Peterson adsorption models to describe thesorption phenomena of Cu(II) and Pb(II) to dried A. niger. In view of the results,the isotherms appeared to follow the Langmuir model more closely than the othermodels at all the temperatures studied. However, the Freundlich and Redlich–Peterson adsorption models also seemed to agree well with the experimental dataconsidering that percentage error values were lower than 11.5. Jing-song Wang[184] used Langmuir, Freundlich, and Temkin isotherms models to describe thesorption phenomena of U(VI) to A. fumigatus. Based on the correlation coefficientR2, the Langmuir isotherm model was the best model to describe the experimentaldata, but the negative value of qmax indicated that this model is not suitable for

118 J. Sun et al.
Table 5.6 Adsorption isotherm parameters
Langmuir constantsFreundlich constantsMetal
ions Bacteria speciesQmax
(mg/g)b � 10�3
(L/mg) R2 KF n R2 References
Pb Candida albicans 828:5 60.0 0.995 51.309 4.716 0.935 [135]Penicillium
simplicissimum144:9 590 0.999 33.0 3.27 0.9016 [144]
Cr Aspergillus niger 3:98 1.1 0.95 2.57 6.6 0.95 [149]Ni Aspergillus niger 2:2 140 0.98 1.47 1.79 0.98 [149]Cd Aspergillus niger 18:08 20 0.997 6.26 4.4 0.671 [182]Cu Saccharomyces
cerevisiae10:27 15.13 0.9968 0.4048 1.762 0.9644 [159]
Penicilliumsimplicissimum
106:4 193 0.9978 19.3 3.02 0.9102 [144]
Zn Aspergillus niger 26:1 120 0.998 6.95 3.6 0.770 [182]
this case. Compared with the other two models, it is clear that both the Freundlichand Temkin isotherm models fitted with the experimental data well, and the formermodel was a better fit than the latter.
Kinetic Modeling
The biosorption kinetics by biomasses is usually described by first-order rateequation and the second-order rate equation (see Sect. 5.3.1.3).
In most cases, the first-order equation of Lagergren does not fit well over theentire adsorption period and is generally applicable for the initial 30–50 min ofthe sorption process [185]. Different to the pseudo first-order model, the pseudo-second-order model predicts the behavior over the whole duration of adsorption andis in agreement with the feature of the adsorption mechanism in the rate-controllingstep.
Kuber C. Bhainsa et al. [186] investigated the kinetic of biosorption for Th byAspergillus fumigatus. Data obtained from the kinetic of uptake when modeled withpseudo-second-order equation showed excellent fitting and the kinetic rate constantand R2 values are >0.99. This suggests that the kinetics of Th uptake followedLagergren’s pseudo-second-order equation. This was also further confirmed bycalculating the qe based on pseudo-second-order reaction that showed very goodfit between the experimental data and the predicted curve obtained by modeling theuptake value.
Removal of cadmium and zinc ions from aqueous solution by living Aspergillusniger was investigated by LIU Yun-guo et al. [182]. The parameters of pseudo-first and pseudo-second order rate kinetics are presented. The theoretical Qeq valuesestimated from the first-order kinetic give significantly different values comparedwith the experimental values, and the correlation coefficients are also found to beslightly lower. The correlation coefficients for the second-order kinetic model andthe theoretical values of Q, also agree well with the experimental ones.

5 Heavy Metal Removal Through Biosorptive Pathways 119
Almost all of the kinetic data of sorption by fungi biomass kinetic were morefitted to pseudo-second-order equation.
5.3.3 Heavy Metals Removal by Algae
5.3.3.1 Introduction
Algae, primarily marine microalgae, are of special interest in search for and thedevelopment of new biosorbents materials due to their high sorption capacity andtheir ready availability in practically unlimited quantities in the seas and oceans[187, 188]. Actually a vast array of biological materials, especially bacteria, yeasts,fungi, and algae have received increasing attention for heavy metal removal andrecovery due to their good performance, low cost, and large available quantities. Ingeneral, the heavy metal uptake capacities varied significantly for different types ofbiomass studied. For divalent heavy metal ions, the reported values for bacteriumbiomass typically ranged from 0.05 to 0.2 mmol/g, fungi and yeast 0.2–0.5 mmol/g,fresh water algae 0.5–1.0 mmol/g, and marine algae 1.0–1.5 mmol/g [189].
From the published literature, among the three groups of algae (red, green, brownalgae) brown algae received the most attention. Higher uptake capacity has beenfound for brown algae than for red and green algae [190]. Table 5.7 summarized theresults achieved with brown algae, green algae, and red algae. We know that brownalgae have since proven to be the most effective and promising substrates amongother biosorbents.
The development of new biosorbent materials is a research area full of challenge,as algae biomass is an accessible, economically competitive, and renewable source.Therefore, its potential value in the treatment of heavy metal wastewater is obvious.
5.3.3.2 Influencing Factors on Biosorption
Effect of pH
This parameter plays an important role for the biosorption process of heavy metalions from aqueous solution, according to a variety of earlier studies [192–194].Whereas the calculation from the solubility product equilibrium constant (Ksp)[195] demonstrated that the suitable pH ranges for the various metal ions wereslightly different, i.e., experiments for Cu2C sorption was performed for the pHrange of 1–6, Cd2C at pH of 1–8, Zn2C at pH of 1–7, and Pb2C at pH of 1–7.5.For the algae biosorption, pH is also a key factor. Algal biomasses contain highcontent of carboxyl groups from mannuronic and guluronic acids on the cell wallpolysaccharides, which suggests that the biosorption process could be affected bychanges in the solution pH [196]. Some examples are cited of algae biosorption ondifferent metal ions.

120 J. Sun et al.
Table 5.7 Uptake of metalsby algal biomass
Metal ions Algae qmax (mmol/g)
Cd Ascophyllum nodosum (B) 0.338 – 1.913Chaetomorha linum (G) 0.48Chlorella vulgaris (G) 0.30Codium fragile (G) 0.0827Corallina officinalis (R) 0.2642Fucus vesiculosus (B) 0.649Gracilaria edulis (R) 0.24Gracilaria Salicornia (R) 0.16Padina sp.(B) 0.53Padina tetrastomatica 0.53Porphira columbina (R) 0.4048Sargassum sp. (B) 1.40Sargassum baccularia (B) 0.74Sargassum natans (B) 1.174Sargassum siliquosum (M) 0.73
Ni Ascophyllum nodosum 1.346 – 2.316Chlorella miniata 0.237Chlorella vulgaris 0.205 – 1.017Chondrus crispus (R) 0.443Codium taylori (G) 0.099Fucus vesiculosus 0.392Galaxaura marginata (R) 0.187Padina gymnospora (B) 0.170Sargassum fluitans (B) 0.409Sargassum natans 0.409Sargassum vulgare (M) 0.085Scenedesmus obliquus 0.5145
Pb Ascophyllum nodosum 1.313 – 2.307Chlorella vulgaris 0.47Cladophora glomerata (G) 0.355Chondrus crispus 0.941Codium taylori 1.815Fucus vesiculosus 1.105 – 2.896Galaxaura marginata 0.121Gracilaria corticata (R) 0.2017 – 0.2605Padina gymnospora 0.314Padina tetrastomatica (B) 1.049Polysiphonia violacea (R) 0.4923Sargassum fluitans 1.594Sargassum hystrix (B) 1.3755Sargassum natans 1.1487 – 1.221Sargassum vulgare 1.100Ulva lactuca (G) 0.61Undaria pinnatifida (B) 1.945
(continued)

5 Heavy Metal Removal Through Biosorptive Pathways 121
Table 5.7 (continued) Metal ions Algae qmax (mmol/g)
Cu Chlorella miniata (G) 0.366Chlorella vulgaris 0.254 – 0.758Sargassum sp. 1.08Scenedesmus obliquus (G) 0.524
Zn Chlorella vulgaris 0.37Cr(VI) Chlorella vulgaris 0.534 – 1.525
Sargassum sp. 1.30 – 1.3257Scenedesmus obliquus 1.131
Fe(III) Chlorella vulgaris 0.439
Source [191](B) Brown alga, (G) Green alga (R) Red alga
Experimental biosorption on green algae Spirogyra species studied by V. K.Gupta [197, 198] showed that the percent adsorption of Cr(VI) increases with pHfrom pH 1.0 to 2.0 and thereafter decreases with further increase in pH. And themaximum adsorption at all the concentrations takes place at pH 2.0. As to leadsorption, when the pH of the lead solution (100 and 200 mg/L) increased from 2.99to 7.04, the adsorption capacity of lead was changed, i.e., it first increased from pH2.99 to pH 5.0 and then dramatically decreased up to pH 7.04. The results statedstrong pH dependence of biosorption. This is consistent with the results obtainedfor the other adsorbent systems [199, 200].
Additionally, cadmium (II) uptake by C. vulgaris studied by Z. Aksu [185] isalso a function of solution pH. The results showed that the biosorption of cadmium(II) increased with pH up to 4.0 and then declined with further increase in pH. Andthe maximum equilibrium uptake value was found to be 62.3 mg/g at pH 4.0.
Summarizing, almost all the relative publications revealed similar informationthat a good control of pH is of great significance for metal biosorption by algae.
Effect of Temperature
The binding of most metals to microorganisms by biosorption observed to enhanceas temperature rising [201–203]. Also, increasing temperature is known to stir upthe diffusion rate of adsorbate molecules within pores as a result of decreasingsolution viscosity and will also modify the equilibrium capacity of the adsorbent fora particular adsorbate [204]. Thus temperature is also an important factor affectingthe adsorption.
Research of cadmium (II) and nickel (II) biosorption with C. vulgaris carried outby Z. Aksu [185, 208] manifested that the equilibrium uptake of cadmium (II) andnickel (II) ions to the dried green alga was significantly affected by the temperature.The uptake of cadmium (II) decreased with an increasing temperature, while nickel(II) increased. And their optimum adsorption temperature was 20ıC and 45ıC, re-spectively. That is, cadmium (II) adsorption is normally exothermic; thus, the extent
122 J. Sun et al.
of adsorption generally increases with decreasing temperature. This result is typicalfor biosorption of metals involving no energy-mediated reactions, where metalremoval from solution is due to purely physical/chemical interactions between thebiomass and metal in solution. Increasing the temperature reduced the biosorptioncapacity of biomass. Nevertheless, nickel (II) adsorption was endothermic; thus, theextent of adsorption increased with increasing temperature. Besides, the sorption ofnickel (II) ions by dried C. vulgaris may involve not only physical but also chemicalsorption. So at higher temperatures, an increase in active sites occurs due to bondrupture.
There are many studies that show the information on the effect of temperature inrecent years, which are associated with the adsorption mechanism [196, 198, 206].
Effect of Contact Time
The contact time has also been evaluated as one of the most important factorsaffecting the biosorption efficiency. The alga Chlorella vulgaris was reported toexhibit the feature of rapid uptake of nickel and then reach the equilibrium in 30–60 min [205]. Also, the study of Sari A. [196] showed the biosorption efficiency ofCd (II) ions by C. virgatum. The biosorption efficiency increases with rising contacttime up to 60 min, after which it is almost constant. Another biosorption of lead fromaqueous solutions by green algae (Spirogyra sp.) [198] demonstrated that maximumadsorption took place within first 100 min. In fact, the equilibrium time needed forthe different metal–biomass systems reportedly range from 1 to 3 h, that is, about90% of the total metal ion sorption was achieved within 60 min [207].
Overall, reported experiments on contact time reveal, without exception, that thesorption took place in two stages: A very rapid surface adsorption followed by along period of equilibrium. Adsorption got slowed down in the later stage becauseinitially a large number of vacant surface sites may be available for adsorption andafter a certain point of time, the remaining vacant surface sites may be difficultto occupy due to forces between the solute molecules of the solid and bulk phase[208–210]. The diminishing removal with increasing time may also attribute tointraparticle diffusion process dominating over adsorption [211].
Effect of Biomass Dosage
The amount of biosorbent used for the treatment of heavy metals is also an importantparameter which influences the biosorption capacity. The biosorption of Cu(II) inthe work of Karthikeyan [212] showed an increased uptake of Cu(II) with the algaquantity which can be accounted for the higher dose of adsorbent in the solutionand the greater availability of exchangeable sites for the ions. But the maximumuptake was attained at about 100 mg. And he analyzed that this trend was causedby the formation of biosorbent aggregates at higher biomass concentration, which

5 Heavy Metal Removal Through Biosorptive Pathways 123
in turn could reduce the effective surface area available for the biosorption. In fact,many studies [196, 198, 213] showed the similar phenomenon that with increasingbiomass dosage, the absorption efficiency experienced an inverted-U curve arousal.
5.3.3.3 Adsorption Mechanism
Metal ion binding during biosorption processes has been found to involve complexmechanisms, such as ion-exchange, complexation, electrostatic attraction, andmicroprecipitation [5]. In fact, for many years, it had been thought that in theprocess of biosorption, metal ions bind to highly developed surface of a biosorbentvia the mechanism of physical adsorption [214]. Whereas the biosorption of Cr3C,Cd2C, and Cu2C ions by blue–green algae Spirulina sp. studied by Chojnacka [215]showed that the mechanism of biosorption is rather chemisorptions than physicaladsorption (ion-exchange), which was further confirmed by the low surface areaassociated with physical adsorption and the presence of cations that appeared in thesolution after biosorption. The maximum contribution of physical adsorption in theoverall biosorption process was evaluated to be 3.7%. Study of the mechanisms ofbiosorption by Raize [216] manifested that the main cadmium cation sequestrationmechanism by the algal biomass was apparently chelation, while that of nickel wasmainly ion exchange. Lead cations exhibit higher affinity to the algal biomass, andtheir binding mechanism includes a combination of ion exchange, chelation, andreduction reactions, accompanied by metallic lead precipitation on the cell wallmatrix. The SEM method was used by Han et al. [217] to probe that the surfacecomplexation was the exact mechanism in Cr(III) biosorption by Chlorella miniata.In fact, among various proposed mechanisms, ion exchange was thought to bethe most important process for the algal biomass [214]. Ion exchange mechanismwas thought to be reversible, and more than 90% of the biosorbed metal could berecovered through acid washing [9].
5.3.3.4 Biosorption Models
Isotherm Modeling
The equilibrium data, commonly known as adsorption isotherms, are the basicrequirements for the design of the adsorption systems. Several isotherm equations,such as Langmuir, Freundlich, Redlich–Peterson, D-R isotherms, and so on, havebeen used for the equilibrium modeling of biosorption systems. Langmuir andFreundlich isotherms (see Sect. 5.3.1.3) were widely used to quantitatively describemetal sorption by algae [196, 198, 205, 206, 218–220].
Additionally, some authors explain that Langmuir isotherm corresponds toa dominant ion-exchange mechanism while the Freundlich isotherm showsadsorption–complexation reactions taking place in the adsorption process

124 J. Sun et al.
Table 5.8 Langmuir and Freundlich parameters for the sorption of the test metals by the selectedalgae
Langmuir constant Freundlich constant
AlgaeMetalion
qmax
(mg/g) b (L/mg) R2KF
(mg1�n/g ln) n R2
Spirogyraneglecta
Cu 40:83 0.034 0.96 5.44 0.370 0.89Cd 27:95 0.047 0.97 5.01 0.320 0.89Zn 31:51 0.034 0.99 4.23 0.368 0.94Ni 26:30 0.042 0.99 4.27 0.366 0.92Pb2C 90:19 0.015 0.97 4.75 0.513 0.92
Pithophoraoedogonia
Cu 23:08 0.069 0.98 5.72 0.265 0.92Cd 13:07 0.038 0.98 2.02 0.344 0.93Zn 8:98 0.103 0.99 2.98 0.214 0.94Ni 11:81 0.039 0.98 1.84 0.342 0.95Pb2C 71:13 0.020 0.96 5.28 0.461 0.91
Cladophoracalliceima
Cu 14:08 0.088 0.98 4.26 0.229 0.92Cd 9:14 0.098 0.97 2.95 0.218 0.92Zn 8:51 0.101 0.98 2.80 0.216 0.95Ni 7:67 0.074 0.99 2.00 0.257 0.94Pb2C 40:50 0.022 0.94 5.29 0.414 0.88
Hydrodictyonreticulatum
Cu 8:72 0.103 0.96 2.81 0.221 0.98Cd 7:20 0.071 0.97 1.83 0.262 0.98Zn 3:70 0.115 0.92 1.26 0.212 0.99Ni 13:86 0.021 0.99 1.14 0.444 0.96Pb2C 24:00 0.054 0.97 4.87 0.299 0.90
Aulosirafertilissima
Cu 21:77 0.060 0.99 4.83 0.285 0.92Cd 14:57 0.087 0.98 4.28 0.236 0.92Zn 19:15 0.049 0.99 3.63 0.310 0.93Ni 4:16 0.235 0.83 2.05 0.145 0.99Pb2C 31:12 0.042 0.97 4.99 0.338 0.89
[221, 222]. Furthermore, most of the equilibrium data were fit better to Langmuirisotherm model than Freundlich isotherm model. The parameters of Langmuir andFreundlich isotherm model are presented in Table 5.8 [223].
Kinetic Models
In order to investigate the mechanism of biosorption and potential rate-controllingstep such as mass transport and chemical reaction processes, kinetic models are usedto test the experimental data. Numerous models (e.g., Elovich, diffusion, pseudo-first-order, and pseudo-second-order equations) have been suggested to analyze thekinetics of sorption process. Kinetic models based on the capacity of the adsorbentsuch as the first-order equation and second-order expression were commonly used(see Sect. 5.3.1.3).

5 Heavy Metal Removal Through Biosorptive Pathways 125
In the work of O.M. Freitas [224], experimental data suggested that the pseudo-first-order model successfully describes the kinetics of the biosorption of Zn onL. hyperborea and Cd on B. bifurcate. The results of Aravindhan Rathinam [28]also suggest that kinetics of cadmium biosorption by H. valentiae biomass followedpseudo-first-order kinetic model very well.
The pseudo-second-order kinetic model has been applied successfully to metalbiosorption by several algae [185, 198, 200, 206, 225–228]. Additionally, theseparameters in equations can change depending on experimental conditions as it wasfound by P. Lodeiro [225].
The Weber and Morris sorption kinetic model [229], a kind of diffusion model,was employed to investigate the sorption mechanism in the study of Prasert Pavasant[195].
To sum up, kinetic model is an important part of the study of heavy metalbiosorption, from which we can get the information of the control steps andmechanism of the process.
5.3.4 Plant Leaves and Their Extraction
5.3.4.1 Introduction
There is a considerable potential for adopting a natural, abundant, and economicalmetal adsorption system, and plant leaves and their extraction, which are cheap andeasily available in a great supply, could be used as an adsorbent for the removalof heavy metals from aqueous solution. In fact, tree leaves and their extractionare frequently employed in heavy metal removal [230–236]. Studies show thatadsorption capability also relies on leaves used. Examples of efficient types ofplant leaves for removal of metal ions are reed [237] for cadmium, poplar forlead and copper [238, 239], cinchona for copper [239], pine for nickel [240],and cypress for aluminum [241]. Moreover, R. Salim [232] conducted cadmiumremoval experiments from aqueous solutions by 20 species of plant leaves andtheir combinations. The results showed that most efficient types of plant leaves forcadmium removal were those of styrax, plum, pomegranate, and walnut.
5.3.4.2 Effects of Environmental Factors on Biosorption
Effect of pH
The pH of the sorbate solution is considered one of the most important environmen-tal factors affecting the biosorption process. This factor is capable of influencingnot only the binding site dissociation state, but also the solution chemistry of thetarget metal [242]. Successful biosorption of base metal cations usually takes placein the range of pH 3–7, and is extremely pH dependent. Ozer A. and Ozer D. [243]

126 J. Sun et al.
reported an optimal pH value for lead and nickel uptake of 5.0, while Vianna LNL[244] found that maximal copper, cadmium, and zinc uptakes happened at pH 4.5,and decreased significantly when the pH was dropped to 3.5 or 2.5.
H. Benaissa [231] studied the removal of copper by dried sunflower leavesfinding the maximum copper sorption occurs at around initial pH 5–6. A. Sharmaand K.G. Bhattacharyya [230] used leaf powder as biosorbent to reclaim Cd (II)obtaining continuous adsorption increases from 8.8% at pH 4.0 to 70.0% at pH 7.0,and 93.6% at pH 9.5. Similarly, R. Salim [232] found that the optimum experimentalcondition reached at pH 4.1. Rice bran was also used for the removal of Cr (VI)from wastewater [245] and the maximum removal yield was 99.4% also at a lowpH of 2.0. Even grape stalks wastes came in handy to absorb copper and nickel ionsand I. Villaescusa [246] found a pH-dependent profile for the course. Maximumsorption for both metals was found to occur at around pH 5.5–6.0. Y. Bulut andZ. Baysal [247] used wheat bran as a sorbate on biosorption of Pb (II) and foundthat the Pb (II) adsorption by wheat bran increases with pH. It can be observedthat the removal of Cu (II) and Pb (II) exhibits similar trend, i.e., it increases withincreasing pH, climbing to maximum at a certain pH range. Bin Yu and Y. Zhang[248] reported that the maximum removal of Pb (II) by sawdust sorption occursaround pH 5.0, while that of Cu (II) 7.0. Furthermore, the greatest increases in thesorption rate of metal ions on sawdust were observed in a range of pH from 2 to 8for copper and 2–5 for lead.
Effect of Temperature
As one of the factors affecting the biosorption efficiency, temperature was studiedin many papers [249–253]. S. Qaiser [254] studied the biosorption of lead fromaqueous solution by Ficus religiosa leaves and found that the temperature change inthe range of 20–40 C affected the biosorption capacity and the maximum removalwas observed at 25ıC. In M.S. Al-Masri’s [255] study, the influence of temperatureon U, Pb, and Cd removal capacities using different parts of poplar trees is different.The maximum U and Cd removal capacity using leaves occurred at a temperature of25ıC while the maximum U, Pb, and Cd removal capacities using branches occurredat a temperature of 35ıC.
5.3.4.3 Mechanism Analysis
The mechanism of metal biosorption varies with the metal species and type ofbiosorbent [217]. To bind and accumulate these pollutants, different previouslymentioned mechanisms reportedly also empower the course, solo or ensemble, suchas physical adsorption, complexation, ion exchange, and surface microprecipitation[203, 256–258]. For example, S. Qaiser [254] reported the release of Ca, Mg,and Na ions during lead biosorption revealing ion exchange as the suitable major

5 Heavy Metal Removal Through Biosorptive Pathways 127
removal mechanism. Javad Zolgharnein [259] in his study of Cr (VI) adsorptiononto Elaeagnus tree leaves found chemisorption as the predominant mechanism ofthis special biosorption.
5.3.5 Summary
In fact, in recent years, applying biotechnology in controlling and removing metalpollution has been paid much attention, and gradually becomes hot topic in thefield of metal pollution control because of its potential application. And biosorptionis an alternative process, which provides a variety of sorption materials, includingbacteria, fungi, yeast, algae, plant leaves, etc. stated above. These biosorbents withrelatively high metal-binding capacity and selectivity possess metal-sequesteringproperty and are suitable for the extraction of metal ions from large volumes ofwater. Therefore it is an ideal candidate for the treatment of high-volume and lowconcentration complex wastewaters.
5.4 Combination and Improvement of Different Pathways
Commercial application of microbial biomass as a biosorbent may suffer from theproblem of how to remove or condense the metal ions-loaded microorganisms fromaqueous solution to facilitate reclaiming in the next step. Generally, millipore filtra-tion and evaporation methods have been carried out, but the high cost of membraneand high energy consumption impede them from wide application. Song et al.[103] studied competitive biosorption of Au(III) and Cu(II) ions by magnetotacticbacteria, which may be significant for developing promising biosorbents. Besides,Wang et al. [108] observed that Cu (II) promoted the adsorption of Ag (I) in thecompetitive biosorption of Ag (I) and Cu (II) on Magnetospirillum gryphiswaldense(MSR-1), which was confirmed magnetotactic bacterium [260], was reported to besensitive to magnetic field and might be one of the promising options for solvingthis problem by means of external field. These bacteria were observed to be able tomove along the local magnetic field lines, which is a very useful feature to facilitatethem to be easily separated from the solutions. This unique finding indicates thehigh possibility to recover heavy metal ions from wastewater using the methodof “MTB biosorption and magnetic separation”, which was simple, effective, andenvironmentally friendly. However, it is still faced with another problem. Forexample, Song et al. [261] applied a magnetotactic bacterium, Stenotrophomonassp., to remove Au(III) from contaminated wastewater. The analyses from FTIR andXRD confirmed that the reduction of Au(III) to Au(0) by the reductants on theMTB biomass occurred, and the deposition of nanocrystal Au(0) particles, rangingfrom 24.7 to 31.4 nm, could be estimated on the biomass surface. Although easy

128 J. Sun et al.
to remove the MTB-nano Au(0) group by the external magnetic field, it may be agreat challenge to separate MTB from nano Au(0), because both nano Au(0) andnanometer-scale magnetosomes own magnetism.
Also, according to combination of abiotic and biotic components, Chen et al.[110] used the bacteria-mineral composite as a geochemically reactive solid andquantified its trace metal ion scavenging ability. In their study, the first quantitativecomparison of the metal-binding capacities of P. putida CZ1–goethite composite toits individual components was evaluated. As a consequence, the nonliving cells–goethite composite retained approximately 82% more Zn than that predicted by itssolo counterpart.
What is more, some attention was focused on immobilization technology forheavy metal removal biomaterial [262–265]. Entrapment, cellular aggregation,and surface fixation are the most common methods to support this technology[266–270]. The choice of an adequate matrix for cell immobilization affects theprocess performance, since the metal biosorption efficiency can be affected by theseheterogeneous systems [271, 272]. Microorganisms loaded natural and syntheticadsorbents have also been used for separation and preconcentration of heavymetals at trace levels. S. cerevisiae loaded on sepiolite was utilized as biosorbentfor copper(II), zinc(II), and cadmium(II) in natural waters [264]. Bag et al. [91]proposed a biosorptive enrichment procedure for Cr (III) and Cr (VI) ions bySaccharomyces cerevisiae-loaded sepiolite. S. cerevisiae and Chlorella vulgarisloaded on silica gel has been used for the separation–preconcentration of Pt2C andPd2C [273]. Vullo et al. [18] made another progress by successfully immobilizingP. veronii 2E on inert surfaces such as Teflon membranes, silicone rubber, andpolyurethane foams. In addition, P. veronii 2E was found to be able to grow onall three surfaces and develop a film over the matrix surfaces, form aggregates,and adhere to glass during batch cultures. Removal rate of Pb(II) reaches thesummit 97.7% at pH 4, at 200 mg/L of initial Pb(II) concentration with 10 g/L ofP. sanguineus beads, prepared by dropping a mixture of 1.5% (w/v) sodium alginatesolution and P. sanguineus mycelial mat into a 2% (w/v) CaCl2 solution [274].
Furthermore, the idea about combination of abiotic and biotic components cou-pled with the immobilization theory and magnetic separation technology. Magneticparticles have been applied as a new sorbent to adsorb metal ions, in which thedifficulty of separation was resolved in an external magnetic field [275]. Based onthese researches, the biofunctional magnetic bead was synthesized and utilized inthe wastewater treatment [276]. Li et al. [276] removed heavy metal in wastewaterby bio-functional magnetic beads constituted by the powder of Rhizopus cohniiand Fe3O4 particles coated with alginate and polyvinyl alcohol (PVA). Thenmagnetic separation technology could make the separation of solid and liquid phaseeasier. The combined technique of biosorption and magnetic separation holds theadvantages of flexibility, eco-friendly characteristics, and economic in operationalcost. Thus, the current investigation into this technique is very important andinspiring.

5 Heavy Metal Removal Through Biosorptive Pathways 129
5.5 Comparative Conclusions of the Methods
Every before-mentioned method for heavy metal removal, especially biosorptionhas actually its advantages and disadvantages for recovering heavy metals. Thismeans in some cases, two or more methods may be chose to treat the target solutionto work their way through drastically. Please refer to Table 5.9 for detail.
5.6 Recovery and Reuse of Heavy Metal
Heavy metal ions from the contaminated water could be reduced into metalnanoparticles by physical, chemical, and biological technology [277, 278]. Mostof these physical and chemical methods need extreme conditions like tempera-ture, pressure etc. Chemical reducing agents are believed to be associated withenvironmental toxicity or biological hazards, whereas comparatively safer reluctantlike citrate, ascerbate, simple sugars like glucose, fructose etc. are not efficientin productivity. It has been, therefore, of increasing interest to develop efficientgreen biological reduction [278]. What is more, current chemical methods of metalnanoparticle synthesis have shown limited success and is expected that the use ofa biological approach may overcome many of these obstacles. The exploitation ofmicroorganisms for the biosynthesis of metal nanoparticles is an area of researchthat has received increasing interest over the last decade. The use of living microbesas a tool for nanoparticle biosynthesis has been researched extensively [279].The size and shape-dependent physicochemical and optoelectronic properties ofmetal nanoparticles have important applications in catalysis, biosensing, recordingmedia, and optics and so on [280]. For example, gold nanoparticles (Au NPs) havepotentially exciting applications in hyperthermia of tumors, optical coatings, andscanning tunneling microscopes as conductive tips [281]. Especially, biologicalmethod available for low metal concentration, less than 100 mg/L, could exertthe advantage of simple course, easy operation, low cost, little pollution, and highrecovery rate of heavy metal etc. [18]. If all of the removal technologies could beapplied in to commercial production, not only effluents are purified but also the toxicheavy metal ions are effectively reused to make a green and perfect recycle betweenthe nature and our industrial society. In sum, researches on heavy metal removalgive a wide vision and a promising future to development of all the fields.
5.7 Current Hot Topics, Trends, and Outlook of This Field
Nowadays, more researche has been focused on the search for alternative andinnovative wastewater treatment techniques. The interesting one was the utilizationof biological materials such as algae, fungi, and bacteria for the metal removal and

130 J. Sun et al.
Tab
le5.
9A
dvan
tage
san
ddi
sadv
anta
ges
ofth
em
etho
ds
Met
hods
Adv
anta
ges
Dis
adva
ntag
es
Act
ivat
edca
rbon
Hig
hsu
rfac
ear
eaH
igh
cost
topr
epar
eac
tivat
edca
rbon
Rea
ctiv
atio
nre
sult
sin
alo
ssof
the
carb
onPe
rfor
man
cede
pend
ent
onth
ety
peof
carb
onus
edan
dno
n-se
lect
ive
Che
mic
alpr
ecip
itat
ion
Eff
ectiv
ely
trea
tino
rgan
icef
fluen
twit
ha
met
alco
ncen
trat
ion
ofhi
gher
than
1,00
0m
g/L
wit
ha
sim
ple
proc
ess
The
dem
and
ofa
larg
eam
ount
ofch
emic
als
Gen
eral
lyit
cann
otbe
used
toha
ndle
low
conc
entr
atio
nof
met
alw
aste
wat
er,w
hich
isbe
low
100
mg/
LT
helo
ng-t
erm
envi
ronm
enta
lim
pact
sof
slud
gedi
spos
alC
hem
ical
redo
xB
eap
plic
able
for
seve
ral
met
alio
nsU
sed
asa
pret
reat
men
tfor
was
tew
ater
trea
tmen
tM
embr
ane
sepa
rati
onC
anbe
appl
icat
ion
inoc
casi
ons
whe
reth
eco
ncen
trat
ion
ofm
etal
ions
islo
wIn
adeq
uate
sele
ctiv
ity
Hig
hen
ergy
cons
umpt
ion
Imm
atur
ete
chno
logi
esIo
nex
chan
geE
ffec
tive
totr
eati
norg
anic
efflu
ent
wit
ha
wid
em
etal
conc
entr
atio
nof
less
than
10m
g/L
tohi
gher
than
100
mg/
LSu
itab
leio
nex
chan
gere
sins
are
nota
vail
able
for
all
heav
ym
etal
sD
oes
notp
rese
ntan
ysl
udge
disp
osal
prob
lem
sT
heca
pita
land
oper
atio
nalc
osti
shi
ghB
ioso
rpti
onG
row
th-i
ndep
ende
nt,n
on-l
ivin
gbi
omas
sis
nots
ubje
ctto
toxi
city
lim
itat
ion
ofce
lls
Ear
lysa
tura
tion
can
bepr
oble
mi.e
.whe
nm
etal
inte
ract
ive
site
sar
eoc
cupi
ed,m
etal
deso
rpti
onis
nece
ssar
ypr
ior
tofu
rthe
rus
e,ir
resp
ectiv
eof
the
met
alva
lue
Bio
mas
sca
nbe
proc
ured
from
the
exis
ting
ferm
enta
tion
indu
stri
es,w
hich
ises
sent
iall
ya
was
teaf
ter
ferm
enta
tion
.T
hepr
oces
sis
notg
over
ned
byth
eph
ysio
logi
calc
onst
rain
tof
livin
gm
icro
bial
cell
sT
hepo
tent
ialf
orbi
olog
ical
proc
ess
impr
ovem
ent
(e.g
.thr
ough
gene
tic
engi
neer
ing
ofce
lls)
isli
mit
edbe
caus
ece
lls
are
notm
etab
oliz
ing.
Bec
ause
prod
ucti
onof
the
adso
rptiv
eag
ento
ccur
sdu
ring
pre-
grow
th,t
here
isno
biol
ogic
alco
ntro
love
rch
arac
teri
stic
ofbi
osor
bent
.T
his
wil
lbe
part
icul
arly
true
ifw
aste
biom
ass
from
afe
rmen
tati
onun
itis
bein
gut
iliz
ed
Bec
ause
non-
livin
gbi
omas
sbe
have
asan
ion
exch
ange
r,th
epr
oces
sis
very
rapi
dan
dta
kes
plac
ebe
twee
nfe
wm
inut
esto
few
hour
s.M
etal
load
ing
onbi
omas
sis
ofte
nve
ryhi
gh,l
eadi
ngto
very
effic
ient
met
alup
take
The
reis
nopo
tent
ialf
orbi
olog
ical
lyal
teri
ngth
em
etal
vale
ncy
stat
e.Fo
rex
ampl
ele
ssso
lubl
efo
rms
orev
enfo
rde
grad
atio
nof
orga
nom
etal
lic
com
plex
es
Bec
ause
cell
sar
eno
n-liv
ing,
proc
essi
ngco
ndit
ions
are
notr
estr
icte
dto
thos
eco
nduc
ive
for
the
grow
thof
cell
s.In
othe
rw
ords
,aw
ider
rang
eof
oper
atin
gco
ndit
ions
such
aspH
,tem
pera
ture
and
met
alco
ncen
trat
ion
ispo
ssib
le.N
oas
epti
cco
ndit
ions
are
requ
ired
for
this
proc
ess
Met
alca
nbe
deso
rbed
read
ily
and
then
reco
vere
dif
the
valu
ean
dam
ount
ofm
etal
reco
vere
dar
esi
gnifi
cant
and
ifth
ebi
omas
sis
plen
tifu
l,m
etal
-loa
ded
biom
ass
can
bein
cine
rate
d,th
ereb
yel
imin
atin
gfu
rthe
rtr
eatm
ent
5 Heavy Metal Removal Through Biosorptive Pathways 131
recovery among these techniques [21]. In other studies, biomasses have exhibitedeconomic, rapid adsorption, and eco-friendly characteristics [2]. However, it is stillnecessary to continue the steps towards the world of these promising biosorbentsfrom an extremely large pool of readily available and inexpensive biomaterials[8, 9]. The mechanism involved in metal biosorption is far from well understoodup to date. It is the mission of this field to investigate the microbe-metal interactionsand obtain the mechanism of metal uptake by biosorbents and then grasp this toolto change the world.
Also in the field, it is a hot and rising topic to synthesize metallic nanoparticlesusing biological technology by simultaneously reducing heavy metal ions levelin the wastewater. The development of these green techniques for the controlledsynthesis of metallic nanoparticles of well-defined size and shape is a big challengeand numerous chemical methods, aimed at controlling the physical properties ofthe particles, are still in the development stage and problems are often experiencedwith stability of the nanoparticle preparations, control of the crystal growth, andaggregation of the particles [115, 117, 118]. Although, these researches are still intheir infancy of theoretic and experimental phase, the coming fruits are sure to be ofexcitingly wide perspective and practicability in the near future.
Acknowledgments The authors greatly acknowledge the financial support from the National Nat-ural Science Foundation, P.R. China (Project No. 21076155). We herein express our thankfulnessto the Analysis Center of Tianjin University for Product Purity testing.
References
1. Wang JL, Chen C (2006) Biosorption of heavy metals by Saccharomyces cerevisiae: a review.Biotechnol Adv 24:427–451. doi:10.1016/j.biotechadv.2006.03.001
2. Ahluwalia SS, Goyal D (2007) Microbial and plant derived biomass for removal of heavy met-als from wastewater. Bioresour Technol 98:2243–2257. doi:10.1016/j.biortech.2005.12.006
3. Patterson JW, Minear R, Gasca E, Petropoulou C (1998) Industrial discharges of metals towater. In: Allen HE, Garrison AW, Luther GW (eds) Metals in surface waters, 3rd edn. AnnArbor Press, Michigan
4. Alexander M (1999) Biodegradation and bioremediation, 2nd edn. Academic, San Diego5. Volesky B, Holan ZR (1995) Biosorption of heavy metals. Biotechnol Progress 11:235–250.
doi:10.1021/bp00033a0016. Chen YS, Sun QJ, Chen J, Zhang YY (1997) Research on technology of biosorption of heavy
metals. Adv Environ Sci 5:34–43. doi:10.1021/bp00033a0017. Chen M, Gan YR (1999) Biosorption of heavy metal. Chem Ind Eng 16:19–25.
doi:cnki:ISSN:1004–9533.0.1999–01–0048. Kratochvil D, Volesky B (1998) Biosorption of Cu from ferruginous wastewater by algae
biomass. Water Res 32:2760–2768. doi:10.1016/S0043-1354(98), 00015-39. Kratochvil D, Volesky B (1998) Advances in the biosorption of heavy metals. Trends
Biotechnol 16:291–300. doi:10.1016/S0167-7799(98), 01218-910. Volesky B (1990) Biosorption and biosorbents. In: Volesky B (ed) Biosorption of heavy
metals. CRC Press, Boca Raton11. Vijayaraghavan K, Yun YS (2008) Bacterial biosorbents and biosorption. Biotechnol Adv
26:266–291. doi:10.1016/j.biotechadv.2008.02.002

132 J. Sun et al.
12. Gavrilesca M (2004) Removal of heavy metals from the environmental by biosorption. EngLife Sci 4:219–232. doi:10.1002/elsc.200420026
13. Davis TA, Volesky B, Mucci A (2003) A review of the biochemistry of heavy metalbiosorption by brown algae. Water Res 37:4311–4330. doi:10.1016/S0043-1354(03), 00293-8
14. Volesky B (2001) Detoxification of metal-bearing effluents: biosorption for the next century.Hydrometallurgy 59:203–216. doi:10.1016/S0304-386X(00), 00160-2
15. Veglio F, Beolchini F (1997) Removal of metals by biosorption: a review. Hydrometallurgy44:301–316. doi:10.1016/S0304-386X(96)00059-X
16. Kapoor A, Viraraghavan T (1995) Fungi biosorptiondan alternative treatment op-tion for heavy metal bearing wastewaters: a review. Bioresour Technol 53:195–206.doi:10.1016/0960-8524(95)00072-M
17. White C, Wilkinson SC, Gadd GM (1995) The role of microorganisms in biosorption oftoxic metals and radionuclides. Int Biodeter Biodegr 35:17–40. doi:10.1016/0964-8305(95),00036-5
18. Vullo DL, Ceretti HM, Daniel MA, Ram{rez SAM, Zalts A (2008) Cadmium, zinc andcopper biosorption mediated by Pseudomonas veronii 2E. Bioresour Technol 99:5574–5581.doi:10.1016/j.biortech.2007.10.060
19. Tsezos M (2001) Biosorption of metals. The experience accumulated and the outlookfor technology development. RefDoc. http://cat.inist.fr/?aModele=afficheN&cpsidt=898441.Accessed 2001
20. Aksu Z (1998) Biosorption of heavy metals by micro algae in batch and continuous systems.In: Wong YS, Tam NFY (eds) Wastewater treatment with algae. Springer, Berlin
21. Wang JL, Chen C (2009) Biosorbents for heavy metals removal and their future. BiotechnolAdv 27:195–226. doi:10.1016/j.biotechadv.2008.11.002
22. Hamerlinck Y, Mertens DH (1994) In: Vansant EF (ed) Activated carbon principles inseparation technology. Elsevier, New York
23. Dobrowolski R, Stefaniak E (2000) Study of chromium (VI) adsorption from aqueous solutionon to activated carbon. Adsorpt Sci Technol 18:97–106. doi:10.1260/0263617001493314
24. Kadirvelu K, Namasivayam C (2003) Activated carbon from coconut coirpith as metaladsorbent: adsorption of Cd (II) from aqueous solution. Adv Environ Res 7:471–478.doi:10.1016/S1093-0191(02), 00018-7
25. Gomez-Serrano V, Macias-Garcia A, Espinosa-Mansilla A, Valenzuela-Calahorro A (1998)Adsorption of mercury, cadmium and lead from aqueous solution on heat-treated andsulphurized activated carbon. Water Res 32:1–4. doi:10.1016/S0043-1354(97), 00203-0
26. Benefield LD, Morgan JM (1999) Chemical precipitation. In: Letterman RD (ed) Waterquality and treatment. McGraw-Hill, New York
27. US Environmental Protection Agency (EPA) (2000) Chemical precipitation. US EPA,Washington, DC, EPA832-F-00–018
28. Tunay O (2003) Developments in the application of chemical technologies to wastewatertreatment. Water Sci Technol 48:43–52
29. Charerntanyarak L (1999) Heavy metals removal by chemical coagulation and precipitation.Water Sci Technol 39:135–138. doi:10.1016/S0273-1223(99), 00304-2
30. Juttner K, Galla U, Schmieder H (2000) Electrochemical approaches to envi-ronmental problems in the process industry. Electrochim Acta 45:2575–2594.doi:10.1016/S0013-4686(00)00339-X
31. Yang XJ, Fane AG, Mac Naughton S (2001) Removal and recovery of heavy metals fromwastewater by supported liquid membranes. Water Sci Technol 43:341–348
32. Bose P, Bose MA, Kumar S (2002) Critical evaluation of treatment strategies involvingadsorption and chelation for wastewater containing copper, zinc, and cyanide. Adv EnvironRes 7:179–195. doi:10.1016/S1093-0191(01), 00125-3
33. Wingenfelder U, Hansen C, Furrer G, Schulin R (2005) Removal of heavy metals from minewater by natural zeolites. Environ Sci Technol 39:4606–4613. doi:10.1021/es048482s

5 Heavy Metal Removal Through Biosorptive Pathways 133
34. Jain A, Sharma VK, Mbuya OS (2009) Removal of arsenic by Fe (VI), Fe (VI)/Fe(III), and Fe (VI)/Al (III) salts: effect of pH and anions. J Hazard Mater 169:339–344.doi:10.1016/j.jhazmat.2009.03.101
35. Jiang JQ (2007) Research progress in the use of ferrate (VI) for the environmental remedia-tion. J Hazard Mater 146:617–623. doi:10.1016/j.jhazmat.2007.04.075
36. Kurniawan TA, Chan GYS, Lo WH, Babel S (2006) Physico-chemical treatment tech-niques for wastewater laden with heavy metals. Chem Eng J 118:83–98. doi:10.1016/j.cej.2006.01.015
37. Ahn KH, Song KG, Cha HY, Yeom IT (1999) Removal of ions in nickel electroplat-ing rinse water using low-pressure nanofiltration. Desalination 122:77–84. doi:10.1016/S0011-9164(99), 00029-6
38. Juang RS, Shiau RC (2000) Metal removal from aqueous solutions using chitosan-enhancedmembrane filtration. J Membr Sci 165:159–167. doi:10.1016/S0376-7388(99), 00235-5
39. Ujang Z, Anderson GK (1996) Application of low-pressure reverse osmosis membrane forZn2C and Cu2C removal from wastewater. Water Sci Technol 34:247–253. doi:10.1016/S0273-1223(96), 00811-6
40. Tzanetakis N, Taama WM, Scott K, Jachuck RJJ, Slade RS, Varcoe J (2003) Comparativeperformance of ion exchange membrane for electrodialysis of nickel and cobalt. Sep PurifTechnol 30:113–127. doi:10.1016/S1383-5866(02), 00139-9
41. Fernandez Y, Maraon E, Castrillon L, Vazquez I (2005) Removal of Cd and Zn frominorganic industrial waste leachate by ion exchange. J Hazard Mater 126:169–175.doi:10.1016/j.jhazmat.2005.06.016
42. Lee IH, Kuan YC, Chern JM (2006) Factorial experimental design for recoveringheavy metals from sludge with ion-exchange resin. J Hazard Mater 138:549–559.doi:10.1016/j.jhazmat.2006.05.090
43. Juang RS, Kuo HC, Liu FY (2006) Ion exchange recovery of Ni (II) from simulatedelectroplating waste solutions containing anionic ligands. J Hazard Mater 128:53–59.doi:10.1016/j.jhazmat.2005.07.027
44. Sapari N, Idris A, Hisham N (1996) Total removal of heavy metal from mixed plating rinsewastewater. Desalination 106:419–422. doi:10.1016/S0011-9164(96), 00139-7
45. Gode F, Pehlivan E (2003) A comparative study of two chelating ion exchange resinsfor the removal of chromium (III) from aqueous solution. J Hazard Mater 100:231–243.doi:10.1016/S0304-3894(03), 00110-9
46. lvarez-Ayuso EA, Garcia-Sanchez A, Querol X (2003) Purification of metal electroplatingwastewaters using zeolites. Water Res 37:4855–4862. doi:10.1016/j.watres.2003.08.009
47. Papadopoulos A, Fatta D, Parperis K, Mentzis A, Harambous KJ, Loizidou M (2004)Nickel uptake from a wastewater stream produced in a metal finishing industry bycombination of ion-exchange and precipitation methods. Sep Purif Technol 39:181–188.doi:10.1016/j.seppur.2003.10.010
48. Keane MA (1998) The removal of copper and nickel from aqueous solution using Y zeoliteion exchangers. Colloid Surf A 138:11–20. doi:10.1016/S0927-7757(97), 00078-2
49. Ali AA, Bishtawi RE (1997) Removal of lead and nickel ions using zeolite tuff. J ChemTechnol Biotechnol 69:27–34. doi:10.1002/(SICI)1097-4660(199705
50. Lin SH, Kiang CD (2003) Chromic acid recovery from waste acid solution by an ionexchange process: equilibrium and column ion exchange modeling. Chem Eng J 92:193–199.doi:10.1016/S1385-8947(02), 00140-7
51. Dobrevsky I, Todorova-Dimova M, Panayotova T (1996) Electroplating rinse wastewa-ter treatment by ion exchange. Desalination 108:277–280. doi:10.1016/S0011-9164(97),00036-2
52. Ahmed S, Chughtai S, Keane MA (1998) The removal of cadmium and lead fromaqueous solution by ion exchange with Na–Y zeolite. Sep Purif Technol 13:57–64.doi:10.1016/S1383-5866(97), 00063-4
53. Mann H (1990) Removal and recovery of heavy metals by biosorption. In: Volesky B (ed)Biosorption of heavy metals. CRC press, Boca Raton

134 J. Sun et al.
54. Urrutia MM (1997) General bacterial sorption processes. In: Wase J, Forster C (eds)Biosorbents for metal ions. CRC Press, London
55. Tunali S, Cabuk A, Akar T (2006) Removal of lead and copper ions from aqueous solutions bybacterial strain isolated from soil. Chem Eng J 115:203–211. doi:10.1016/j.cej.2005.09.023
56. Salehizadeh H, Shojaosadati SA (2003) Removal of metal ions from aqueous so-lution by polysaccharide produced from Bacillus firmus. Water Res 37:4231–4235.doi:10.1016/S0043-1354(03), 00418-4
57. Choi SB, Yun YS (2004) Lead biosorption by waste biomass of Corynebacteriumglutamicum generated from lysine fermentation process. Biotechnol Lett 26:331–336.doi:10.1023/B:BILE.0000015453.20708.fc
58. Lu WB, Shi JJ, Wang CH, Chang JS (2006) Biosorption of lead, copper and cadmium byan indigenous isolate Enterobacter sp J1 possessing high heavy-metal resistance. J HazardMater 134:80–86. doi:10.1016/j.jhazmat.2005.10.036
59. Chang JS, Law R, Chang CC (1997) Biosorption of lead, copper and cadmium by biomassof Pseudomonas aeruginosa PU21. Water Res 31:1651–1658. doi:10.1016/S0043-1354(97),00008-0
60. Lin CC, Lai YT (2006) Adsorption and recovery of lead(II) from aqueous solutionsby immobilized Pseudomonas aeruginosa PU21 beads. J Hazard Mater 137:99–105.doi:10.1016/j.jhazmat.2006.02.071
61. Uslu G, Tanyol M (2006) Equilibrium and thermodynamic parameters of single and binarymixture biosorption of lead(II) and copper(II) ions onto Pseudomonas putida: effect oftemperature. J Hazard Mater 135:87–93. doi:10.1016/j.jhazmat.2005.11.029
62. Pardo R, Herguedas M, Barrado E, Vega M (2003) Biosorption of cadmium, copper, leadand zinc by inactive biomass of Pseudomonas putida. Anal Bioanal Chem 376:26–32.doi:10.1007/s00216-003-1843-z
63. Selatnia A, Boukazoula A, Kechid N, Bakhti MZ, Chergui A, Kerchich Y (2004) Biosorptionof lead (II) from aqueous solution by a bacterial dead Streptomyces rimosus biomass.Biochem Eng J 19:127–135. doi:10.1016/j.bej.2003.12.007
64. Mameri N, Boudries N, Addour L, Belhocine D, Lounici H, Grib H (1999) Batch zincbiosorption by a bacterial nonliving Streptomyces rimosus biomass. Water Res 33:1347–1354.doi:10.1016/S0043-1354(98), 00349-2
65. Incharoensakdi A, Kitjaharn P (2002) Zinc biosorption from aqueous solution bya halotolerant cyanobacterium Aphanothece halophytica. Curr Microbiol 45:261–264.doi:10.1007/s00284-002-3747-0
66. Chen XC, Wang YP, Lin Q, Shi JY, Wu WX, Chen YX (2005) Biosorption of copper(II) andzinc(II) from aqueous solution by Pseudomonas putida CZ1. Colloids Surf B Biointerfaces46:101–107. doi:10.1016/j.colsurfb.2005.10.003
67. Puranik PR, Paknikar KM (1997) Biosorption of lead and zinc from solutions usingStreptoverticillium cinnamoneum waste biomass. J Biotechnol 55:113–124. doi:10.1016/S0168-1656(97), 00067-9
68. Celaya RJ, Noriega JA, Yeomans JH, Ortega LJ, Ruiz-Manriquez A (2000) Abiosorption of Zn(II) by Thiobacillus ferrooxidans. Bioprocess Eng 22:539–542.doi:10.1007/s004499900106
69. Liu HL, Chen BY, Lan YW, Cheng YC (2004) Biosorption of Zn(II) and Cu(II) by theindigenous Thiobacillus thiooxidans. Chem Eng J 97:195–201. doi:10.1016/S1385-8947(03),00210-9
70. Nakajima A, Yasuda M, Yokoyama H, Ohya-Nishiguchi H, Kamada H (2001) Copperbiosorption by chemically treated Micrococcus luteus cells. World J Microbiol Biotechnol17:343–347. doi:10.1023/A:1016638230043
71. Savvaidis I, Hughes MN, Poole RK (2003) Copper biosorption by Pseudomonas cepacia andother strains. World J Microbiol Biotechnol 19:117–121. doi:10.1023/A:1023284723636
72. Beolchini F, Pagnanelli R, Toro L, Veglio F (2006) Ionic strength effect on copper biosorptionby Sphaerotilus natans: equilibrium study and dynamic modeling in membrane reactor. WaterRes 40:144–152. doi:10.1016/j.watres.2005.10.031

5 Heavy Metal Removal Through Biosorptive Pathways 135
73. Ozturk A, Artan T, Ayar A (2004) Biosorption of nickel(II) and copper(II) ions fromaqueous solution by Streptomyces coelicolor A3(2). Colloids Surf B Biointerfaces 34:105–111. doi:10.1016/j.colsurfb.2003.11.008
74. Loukidou MX, Karapantsios TD, Zouboulis AI, Matis KA (2004) Diffusion kinetic study ofcadmiurn (II) biosorption by Aeromonas caviae. J Chem Technol Biotechnol 79:711–719.doi:10.1002/jctb.1043
75. Ziagova M, Dimitriadis G, Aslanidou D, Papaioannou X, Tzannetaki EL, Liakopoulou-Kyriakides M (2007) Comparative study of Cd(II) and Cr(VI) biosorption on Staphylococcusxylosus and Pseudomonas sp. in single and binary mixtures. Bioresour Technol 98:2859–2865. doi:10.1016/j.biortech.2006.09.043
76. Puranik PR, Chabukswar NS, Paknikar KM (1995) Cadmium biosorption by Strepto-myce pimprina waste biomass. Appl Microbiol Biotechnol 43:1118–1121. doi:10.1007/BF00166935
77. Selatnia A, Bakhti MZ, Madani A, Kertous L, Mansouri Y (2004) Biosorption of Cd2C
from aqueous solution by a NaOH-treated bacterial dead Streptomyces rimosus biomass.Hydrometallurgy 75:11–24. doi:10.1016/j.hydromet.2004.06.005
78. Selatnia A, Boukazoula A, Kechid N, Bakhti MZ, Chergui A (2004) Biosorption of Fe3C
from aqueous solution by a bacterial dead Streptomyces rimosus biomass. Process Biochem39:1643–1651. doi:10.1016/S0032-9592(03), 00305-4
79. Srinath T, Verma T, Ramteke PW, Garg SK (2002) Chromium (VI) biosorption andbioaccumulation by chromate resistant bacteria. Chemosphere 48:427–435. doi:10.1016/S0045-6535(02), 00089-9
80. Nourbakhsh M, Sag Y, Ozer D, Aksu Z, Kutsal T, Caglar A (1994) A comparative study ofvarious biosorbents for removal of chromium(VI) ions from industrial wastewaters. ProcessBiochem 29:1–5. doi:10.1016/0032-9592(94), 80052-9
81. Zhou M, Liu YG, Zeng GM, Li X, Xu WH, Fan T (2007) Kinetic and equilibrium studiesof Cr(VI) biosorption by dead Bacillus licheniformis biomass. World J Microbiol Biotechnol23:43–48. doi:10.1007/s11274-006-9191-8
82. Sahin Y, Ozturk A (2005) Biosorption of chromium(VI) ions from aqueous solution bythe bacterium Bacillus thuringiensis. Process Biochem 40:1895–1901. doi:10.1016/j.procbio.2004.07.002
83. Ozturk A (2007) Removal of nickel from aqueous solution by the bacterium Bacillusthuringiensis. J Hazard Mater 147:518–523. doi:10.1016/j.jhazmat.2007.01.047
84. Selatnia A, Madani A, Bakhti MZ, Kertous L, Mansouri Y, Yous R (2004) Biosorptionof Ni2C from aqueous solution by a NaOH-treated bacterial dead Streptomyces rimosusbiomass. Miner Eng 17:903–911. doi:10.1016/j.mineng.2004.04.002
85. de Vargas I, Macaskie LE, Guibal E (2004) Biosorption of palladium and platinum bysulfatereducing bacteria. J Chem Technol Biotechnol 79:49–56. doi:10.1002/jctb.928
86. Nakajima A, Tsuruta T (2004) Competitive biosorption of thorium and uranium by Micrococ-cus luteus. J Radioanal Nucl Chem 260:13–18. doi:10.1023/B:JRNC.0000027055.16768.1e
87. Gialamouidis D, Mitrakas M, Liakopoulou-Kyriakides M (2010) Equilibrium, thermody-namic and kinetic studies on biosorption of Mn(II) from aqueous solution by Pseudomonassp., Staphylococcus xylosus and Blakeslea trispora cells. J Hazard Mater 182:672–680.doi:10.1016/j.jhazmat.2010.06.084
88. Velasquez L, Dussan J (2009) Biosorption and bioaccumulation of heavy metals on deadand living biomass of Bacillus sphaericus. J Hazard Mater 167:713–716. doi:10.1016/j.jhazmat.2009.01.044
89. Fehrmann C, Pohl P (1993) Cadmium adsorption by the non-living biomass of microalgaegrown in axenic mass culture. J Appl Phycol 5:555–562. doi:10.1007/BF02184634
90. Godlewska-Zyłkiewicz B (2004) Preconcentration and separation procedures for the spec-trochemical determination of platinum and palladium. Microchim Acta 147:189–210.doi:10.1007/s00604-004-0234-2
91. Bag H, Turker AR, Lale M, Tunceli A (2000) Separation and speciation of Cr (III) and Cr (VI)with Saccharomyces cerevisiae immobilized on sepiolite and determination of both species inwater by FAAS. Talanta 51:895–902. doi:10.1016/S0039-9140(99), 00354-9

136 J. Sun et al.
92. Esposito A, Pagnanelli F, Veglio F (2002) pH-related equilibria models for biosorption insinglemetal systems. Chem Eng Sci 57:307–313. doi:10.1016/S0009-2509(01), 00399-2
93. Duran C, Bulut VN, Gundogdu A, Soylak M, Belduz AO, Beris FS (2009) Biosorption ofheavy metals by Anoxybacillus gonensis immobilized on Diaion HP-2MG. Sep Sci Technol44:335–358. doi:10.1080/01496390802437131
94. Klimmek S, Stan HJ, Wilke A, Bunke G, Buchholz R (2001) Comparative analysis of thebiosorption of cadmium, lead, nickel and zinc by algae. Environ Sci Technol 35:4283–4288.doi:10.1021/es010063x
95. Aksu Z, Akpinar D (2001) Competitive biosorption of phenol and Cr(VI) from binarymixtures onto dried anaerobic activated sludge. Biochem Eng J 7:183–193. doi:10.1016/S1369-703X(00), 00126-1
96. Hancock IC (1986) The use of Gram-positive bacteria for the removal of metals from aqueoussolutions. In: Thompson R (ed) Trace metal removal from aqueous solution. Royal ChemistrySociety, London
97. Sekhar KC, Subramanian S, Modak JM, Natarajan KA (1998) Removal of metal ions using anindustrial biomass with reference to environmental control. Int J Miner Process 53:107–120.doi:10.1016/S0301-7516(97), 00061-6
98. Basci N, Kocadagistan E, Kocadagistan B (2004) Biosorption of copper(II) from aqueoussolutions by wheat shells. Desalination 164:135–140. doi:10.1016/S0011-9164(04), 00172-9
99. Valdman E, Erijman L, Pessoa FLP, Leite SGF (2001) Continuous biosorption of Cu and Znby immobilised waste biomass Sargassum sp. Process Biochem 36:869–873. doi:10.1016/S0032-9592(00), 00288-0
100. Singh S, Rai BN, Rai LC (2001) Ni(II) and Cr(VI) sorption kinetics by Microcystis in singleand multimetallic systems. Process Biochem 36:1205–1213. doi:10.1016/S0032-9592(01),00160-1
101. Xie SB, Yang J, Chen C, Zhang XJ, Wang QL, Zhang C (2008) Study on biosorption kineticsand thermodynamics of uranium by Citrobacter freudii. J Environ Radioact 99:126–133.doi:10.1016/j.jenvrad.2007.07.003
102. Ozacar M, Sengil IA (2003) Adsorption of reactive dyes on calcined alunite from aqueoussolutions. J Hazard Mater 98:211–224. doi:10.1016/S0304-3894(02), 00358-8
103. Song HP, Li XG, Sun JS, Yin XH, Wang YH, Wu ZH (2007) Biosorption equilibrium andkinetics of Au(II1) and Cu(I1) on magnetotactic bacteria. Chin J Chem Eng 15:847–854.doi:10.1016/S1004-9541(08), 60013-0
104. Ho YS, McKay G (1999) Pseudo-second order model for sorption processes. ProcessBiochem 34:451–465. doi:10.1016/S0032-9592(98), 00112-5
105. Donmez G, Aksu Z (2002) Removal of chromium(VI) from saline wastewaters by Dunaliellaspecies. Process Biochem 38:751–762. doi:10.1016/S0032-9592(02), 00204-2
106. Bayramoglou G, Celik G, Yalcin E, Yilmaz M, Arica MY (2005) Modification of surfaceproperties of Lentinus sajor-caju mycelia by physical and chemical methods: evaluationof their Cr6C removal efficiencies from aqueous medium. J Hazard Mater 119:219–229.doi:10.1016/j.jhazmat.2004.12.022
107. Ozdemir G, Ozturk T, Ceyhan N, Isler R, Cosar T (2003) Heavy metal biosorption by biomassof Ochrobactrum anthropi producing exopolysaccharide in activated sludge. BioresourTechnol 90:71–74. doi:10.1016/S0960-8524(03), 00088-9
108. Wang YH, Gao H, Sun JS, Li J, Su YX, Ji YL, Gong CM (2011) Selective reinforced com-petitive biosorption of Ag (I) and Cu (II) on Magnetospirillum gryphiswaldense. Desalination270:258–263. doi:10.1016/j.desal.2010.11.053
109. Sag Y, Akcael B, Kutsal T (2003) Application of multicomponent adsorption models tothe biosorption of Cr(VI), Cu(II), and Cd(II) ions on Rhizopus arrhizus from ternary metalmixtures. Chem Eng Commun 190:797–812. doi:10.1080/00986440302119
110. Chen XC, Chen LT, Shi JY, Wu WX, Chen YX (2008) Immobilization of heavy metals byPseudomonas putida CZ1/goethite composites from solution. Colloids Surf B Biointerfaces61:170–175. doi:10.1016/j.colsurfb.2007.08.002
111. Vieira R, Volesky B (2000) Biosorption: a solution to pollution. Int Microbiol 3:17–24

5 Heavy Metal Removal Through Biosorptive Pathways 137
112. Ehrlich HL (1997) Microbes and metals. Appl Microbiol Biotechnol 48:687–692.doi:10.1007/s002530051116
113. Gadd GM (1990) Biosorption. Chem Ind 13: 421–426. RefDoc. http://cat.inist.fr/?aModele=afficheN&cpsidt=19367157. Accessed 1990
114. Beveridge TJ (1989) Role of cellular design in bacterial metal accumulation and mineraliza-tion. Annu Rev Microbiol 43:147–171. doi:10.1146/annurev.mi.43.100189.001051
115. BeveridgeTJ HMN, Lee H, Leung KT, Poole RK, Savvaidis I, Silver S, Trevors JT (1997)Metal–microbe interactions: contemporary approaches. Adv Microb Physiol 38:177–243.doi:10.1016/S0065-2911(08), 60158-7
116. Kretschmer KC, Gardea-Torresdey J, Chianelli R, Webb R (2002) Determination of copperbinding in Anabaena flos-aquae purified cell walls and whole cells by X-ray absorptionspectroscopy. Microchem J 71:295–304. doi:10.1016/S0026-265X(02)00022-X
117. YeeN BLG, Phoenix VR, Ferris FG (2004) Characterization of metal-cyanobacteria sorptionreactions: a combined macroscopic and infrared spectroscopic investigation. Environ SciTechnol 38:775–782. doi:10.1021/es0346680
118. Toner B, Manceau A, Marcus MA, Millet DB, Sposito G (2005) Zinc sorption by a bacterialbiofilm. Environ Sci Technol 39:8288–8294. doi:10.1021/es050528C
119. Chen XC, Shi JY, Chen YX, Xu XH, Xu SY, Wang YP (2006) Tolerance and biosorptionof copper and zinc by Pseudomonas putida CZ1 isolated from metal-polluted soil. Can JMicrobiol 52:308–316
120. White C, Gadd GM (2000) Copper accumulation by sulfate-reducing bacterial biofilms.FEMS Microbiol Lett 183:313–318. doi:10.1111/j.1574-6968.2000.tb08977.x
121. Borrok DM, Fein JB (2005) The impact of ionic strength on the adsorption of protons, Pb,Cd and Sr onto surfaces of Gram negative bacteria: testing non-electrostatic diffuse and triplemonolayer models. J Colloid Interface Sci 286:110–126. doi:10.1016/j.jcis.2005.01.015
122. Hayashi H, Seiki H, Tsuneda S, Hirata A, Sasaki H (2003) Influence of growth phase onbacterial cell electrokinetic characteristics examined by soft particle electrophoresis theory.J Colloid Interface Sci 264:565–568. doi:10.1016/S0021-9797(03), 00418-1
123. Hetzer A, Daughney CJ, Morgan HW (2006) Cadmium ion biosorption by the thermophilicbacteria Geobacillus stearothermophilus and G. thermocatenulatus. Appl Environ Microbiol72:4020–4027. doi:10.1128/AEM.00295–06
124. Kapoor A, Viraraghavan T (1997) Fungi as biosorbents. In: Wase J, Forster C (eds) Biosor-bents for metal ions. CRC Press, London
125. Kapoor A, Viraraghavan T (1995) Fungal biosorption—an alternative treatment option forheavy metal bearing wastewaters: a review. Bioresour Technol 53:195–206. doi:10.1016/0960-8524(95)00072-M
126. Cabuk A, Akar T, Tunali S, Gedikli S (2007) Biosorption of Pb(II) by industrial strain of Sac-charomyces cerevisiae immobilized on the biomatrix of cone biomass of Pinus nigra: equi-librium and mechanism analysis. Chem Eng J 131:293–300. doi:10.1016/j.cej.2006.12.011
127. Ozer A, Ozer D (2003) Comparative study of the biosorption of Pb (II), Ni (II) and Cr (VI)ions onto S. cerevisiae: determination of biosorption heats. J Hazard Mater 100:219–229.doi:10.1016/S0304–3894(03)00109–2
128. Mapolelo M, Torto N (2004) Trace enrichment of metal ions in aquatic environments bySaccharomyces cerevisiae. Talanta 64:39–47. doi:10.1016/j.talanta.2003.10.058
129. Al-Saraj M, Abdel-Latif MS, El-Nahal I, Baraka R (1999) Bioaccumulation of somehazardous metals by sol-gel entrapped microorganisms. J Non-Cryst Solids 248:137–140.doi:10.1016/S0022-3093(99), 00306-3
130. Goksungur Y, Uren S, Guvenc U (2005) Biosorption of cadmium and lead ions byethanol treated waste baker’s yeast biomass. Bioresour Technol 96:103–109. doi:10.1016/j.biortech.2003.04.002
131. Bustard M, McHale AP (1998) Biosorption of heavy metals by distillery-derived biomass.Bioprocess Eng 19:351–353. doi:10.1007/s004490050531
132. Chen C, Wang JL (2006) Review on biosorption of heavy metal by Saccharomyces cerevisiae.China Biotechnol 26:69–76. doi:cnki:ISSN:1671-8135.0.2006-01-014

138 J. Sun et al.
133. Dhankhara R, Hoodaa A (2011) Fungal biosorption – an alternative to meet the chal-lenges of heavy metal pollution in aqueous solutions. Environ Technol 32:467–491.doi:10.1080/09593330.2011.572922
134. Tsezos M (1997) Biosorption of lanthanides, actinides and related materials in biosorbentsfor metal ions. In: Wase J, Forster C (eds) Biosorbents for metal ions. CRC Press, London
135. Baysal Z, Cinar E, Bulut Y, Alkan H, Dogru M (2009) Equilibrium and thermodynamicstudies on biosorption of Pb(II) onto Candida albicans biomass. J Hazard Mater 161:62–67.doi:10.1016/j.jhazmat.2008.02.122
136. Zu YG, Zhao XH, Hu MS, Ren Y, Xiao P, Zhu L, Cao YJ, Zhang Y (2006) Biosorption effectsof copper ions on Candida utilis under negative pressure cavitation. J Environ Sci 18:1254–1259. doi:10.1016/S1001-0742(06), 60071-5
137. Yin H, He BY, Lu XY, Peng H, Ye JS, Yang F (2008) Improvement of chromiumbiosorption by UV–HNO2 cooperative mutagenesis in Candida utilis. Water Res 42:3981–3989. doi:10.1016/j.watres.2008.07.005
138. Akhtar K, Akhtar MW, Khalid AM (2008) Removal and recovery of zirconium fromits aqueous solution by Candida tropicalis. J Hazard Mater 156:108–117. doi:10.1016/j.jhazmat.2007.12.002
139. Muter O, Lubinya I, Millers D, Grigorjeva L, Ventinya E, Rapoport A (2002) Cr(VI) sorptionby intact and dehydrated Candida utilis cells in the presence of other metals. Process Biochem38:123–131. doi:10.1016/S0032-9592(02), 00065-1
140. Deng SB, Ting YP (2005) Characterization of PEI-modified biomass and biosorption ofCu(II), Pb(II) and Ni(II). Water Res 39:2167–2177. doi:10.1016/j.watres.2005.03.033
141. Holan ZR, Volesky B (1995) Accumulation of cadmium, lead, and nickel by fungal and woodbiosorbents. Appl Biochem Biotechnol 53:133–146. doi:10.1007/BF02788603
142. Tan TW, Hu B, Su HJ (2004) Adsorption of Ni2C on amine-modified mycelium of Penicilliumchrysogenum. Enzyme Microb Technol 35:508–513. doi:10.1016/j.enzmictec.2004.08.035
143. Fan T, Liu YG, Feng BY, Zeng GM, Yang CP, Zhou M, Zhou HZ, Tan ZF, WangX (2008) Biosorption of cadmium (II), zinc (II) and lead (II) by Penicillium sim-plicissimum: isotherms, kinetics and thermodynamics. J Hazard Mater 160:655–661.doi:10.1016/j.jhazmat.2008.03.038
144. Li XM, Liao DX, Xu XQ, Yang Q, Zeng GM, Zheng W, Guo L (2008) Kinetic studies for thebiosorption of lead and copper ions by Penicillium simplicissimum immobilized within loofasponge. J Hazard Mater 159:610–615. doi:10.1016/j.jhazmat.2008.02.068
145. Say R, Y{lmaz N, Denizli A (2003) Biosorption of cadmium, lead, mercury, and ar-senic ions by the fungus Penicillium purpurogenum. Sep Sci Technol 38:2039–2053.doi:10.1081/SS-120020133
146. Say R, Yilmaz N, Denizli A (2003) Removal of heavy metal ions using the fungus Penicilliumcanescens. Adsorpt Sci Technol 21:643–650. doi:10.1260/026361703772776420
147. Shah MP, Vora SB, Dave SR (1999) Evaluation of potential use of immobi-lized Penicillium griseofulvum in bioremoval of copper. Process Metall 9:227–235.doi:10.1016/S1572-4409(99), 80112-6
148. Dursun AY, Uslu G, Tepea O, Cuci Y, Ekiz HI (2003) A comparative investigation on thebioaccumulation of heavy metal ions by growing Rhizopus arrhizus and Aspergillus niger.Biochem Eng J 15:87–92. doi:10.1016/S1369-703X(02), 00187-0
149. Kapoor A, Viraraghavan T, Cullimore DR (1999) Removal of heavy metals using the fungusAspergillus niger. Bioresour Technol 70:95–104. doi:10.1016/S0960-8524(98), 00192-8
150. Gulati R, Saxena RK, Gupta R (2002) Fermentation waste of Aspergillus terreus: apotential copper biosorbent. World J Microbiol Biotechnol 18:397–401. doi:10.1023/A:1015540921432
151. Dias MA, Lacerda ICA, Pimentel PF, de Castro HF, Rosa CA (2002) Removal of heavy metalsby an Aspergillus terreus strain immobilized in a polyurethane matrix. Lett Appl Microbiol34:46–50. doi:10.1046/j.1472-765x.2002.01040.x
152. Gadd GM, White C (1992) Removal of thorium from simulated acid process streams byfungal biomass—potential for thorium desorption and reuse of biomass and desorbent. JChem Technol Biotechnol 55:39–44. doi:10.1002/jctb.280550107

5 Heavy Metal Removal Through Biosorptive Pathways 139
153. Naja G, Mustin C, Berthelin J, Volesky B (2005) Lead biosorption study with Rhizopusarrhizus using a metal-based titration technique. J Colloid Interface Sci 292:537–543.doi:10.1016/j.jcis.2005.05.098
154. Bhattacharyya S, Pal TK, Basumajumdar A, Banik AK (2002) Biosorption of heavy metalsby Rhizopus arrhizus and Aspergillus niger. J Indian Chem Soc 79:747–750
155. Brady JM, Tobin JM (1995) Binding of hard and soft metal ions to Rhizopus arrhizus biomass.Enzyme Microb Technol 17:791–796. doi:10.1016/0141-0229(95)00142-R
156. Kogej A, Pavko A (2001) Comparison of Rhizopus nigricans in a pelleted growth form withsome other types of waste microbial biomass as biosorbents for metal ions. World J MicrobiolBiotechnol 17:677–685. doi:10.1023/A:1012901224684
157. Arica MY, Kacar Y, Genc O (2001) Entrapment of white-rot fungus Trametes versicolor inCaalginate beads: preparation and biosorption kinetic analysis for cadmium removal from anaqueous solution. Bioresour Technol 80:121–129. doi:10.1016/S0960-8524(01), 00084-0
158. Bayramoglu G, Denizli A, Bektas S, Arica MY (2002) Entrapment of Lentinus sajorcajuinto Caalginate gel beads for removal of Cd (II) ions from aqueous solution: preparation andbiosorption kinetics analysis. Microchem J 72:63–76. doi:10.1016/S0026-265X(01), 00151-5
159. Zhang YS, Liu WG, Xu M, Zheng F, Zhao MJ (2010) Study of the mechanisms of Cu2C
biosorption by ethanol/caustic-pretreated baker’s yeast biomass. J Hazard Mater 178:1085–1093. doi:10.1016/j.jhazmat.2010.02.051
160. Mungasavalli DP, Viraraghavan T, Jin YC (2007) Biosorption of chromium from aqueoussolutions by pretreated Aspergillus niger: batch and column studies. Colloids Surf APhysicochem Eng Asp 301:214–223. doi:10.1016/j.colsurfa.2006.12.060
161. Park D, Yun YS, Park JM (2005) Use of dead fungal biomass for the detoxifica-tion of hexavalent chromium: screening and kinetics. Process Biochem 40:59–2565.doi:10.1016/j.procbio.2004.12.002
162. Saygideger S, Gulnaz O, Istifli ES, Yucel N (2005) Adsorption of Cd (II), Cu (II) and Ni (II)ions by Lemna minor L.: effect of physicochemical environment. J Hazard Mater 126:96–104.doi:10.1016/j.jhazmat.2005.06.012
163. Ahuja P, Gupta R, Saxena RK (1999) Zn2C biosorption by Oscillatroria anguistissima.Process Biochem 34:77–85. doi:10.1016/S0032-9592(98), 00072-7
164. Padmavathy V, Vasudevan P, Dhingra SC (2003) Biosorption of nickel(II) ions on baker’syeast. Process Biochem 38:1389–1395. doi:10.1016/S0032-9592(02), 00168-1
165. Vasudevan P, Padmavathy V, Dhingra SC (2003) Kinetics of biosorption of cadmium onbaker’s yeast. Bioresour Technol 89:281–287. doi:10.1016/S0960-8524(03), 00067-1
166. Tewari N, Vasudevan P, Guha BK (2005) Study of biosorption of Cr(VI) by Mucor hiemalis.Biochem Eng J 23:185–192. doi:10.1016/j.bej.2005.01.011
167. Tunali S, Kiran I, Akar T (2005) Chromium(VI) biosorption characteristics of Neurosporacrassa fungal biomass. Miner Eng 18:681–689. doi:10.1016/j.mineng.2004.11.002
168. Prakasham RS, Merrie JS, Sheela R, Saswathi N, Ramakrishna SV (1999) Biosorption ofchromium VI by free and immobilized Rhizopus arrhizus. Environ Pollut 104:421–427.doi:10.1016/S0269-7491(98), 00174-2
169. Bai RS, Abraham TE (2001) Biosorption of Cr (VI) from aqueous solution by Rhizopusnigrican. Bioresour Technol 79:73–81. doi:10.1016/S0960-8524(00), 00107-3
170. Sag Y, Aktay Y (2002) Kinetic studies on sorption of Cr(VI) and Cu(II) ions by chitin,chitosan and Rhizopus arrhizus. Biochem Eng J 12:143–153. doi:10.1016/S1369-703X(02),00068-2
171. Sag Y, Aktay Y (2000) Mass transfer and equilibrium studies for the sorption of chromiumions onto chitin. Process Biochem 36:157–173. doi:10.1016/S0032-9592(00), 00200-4
172. Akar T, Tunali S (2006) Biosorption characteristics of Aspergillus flavus biomass for removalof Pb(II) and Cu(II) ions from an aqueous solution. Bioresour Technol 97:1780–1787.doi:10.1016/j.biortech.2005.09.009
173. Dai SH, Wei DZ, Zhou DQ, Jia CY, Wang YG, Liu WG (2008) Removing cadmium fromelectroplating wastewater by waste Saccharomyces cerevisiae. Trans Nonferr Metal SocChina 18:1008–10013. doi:10.1016/S1003-6326(08), 60173-9

140 J. Sun et al.
174. Deng SB, Ting YP (2005) Fungal biomass with grafted poly(acrylic acid) for enhancementof Cu(II) and Cd(II) biosorption. Langmuir 21:5940–5948. doi:10.1021/la047349a
175. Beveridge TJ, Murray RGE (1980) Sites of metal deposition in the cell walls of Bacillussubtilis. J Bacteriol 141:876–887
176. Gupta R, Ahuja P, Khan S, Saxena RK, Mohapatra M (2000) Microbial biosorbents:meetings challenges of heavy metals pollution in aqueous solution. Curr Sci 78:967–973.doi:10.1517/13543784.13.4.373
177. Strandberg GW, Shumate SE, Parrott JR (1981) Microbial cells as biosorbents for heavymetals: accumulation of uranium by Saccharomyces cerevisiae and Pseudomonas aeruginosa.Appl Environ Microbiol 41:237–245, PMCID:PMC243671
178. Farkas V (1980) Biosynthesis of cell wall of fungi. Microbiol Rev 44:117–141, PMCID:PMC281469
179. Muzzarelli RA, Tanfari F (1982) The chelating ability of chitinous material from Aspergillusniger, Streptomyces, Mucor rouxii, Phycomyces blakeseanus and Choamephora curcurnitium.In: Mirano S, Tokura S (eds) Chitin and Chitiosan. Japanese Society of Chitin and Chitiosan,Sapporo
180. Tsezos M, Volesky B (1981) Biosorption of uranium and thorium. Biotechnol Bioeng 23:583–604. doi:10.1002/bit.260230309
181. Fourest E, Roux JC (1992) Heavy metal biosorption by fungal mycelial by-products: mecha-nism and influence of pH. Appl Microbiol Biotechnol 37:399–403. doi:10.1007/BF00211001
182. Liu YG, Fan T, Zeng GM, Li X (2006) Removal of cadmium and zinc ions fromaqueous solution by living Aspergillus niger. Trans Nonferr Metal Soc China 16:681–686.doi:10.1016/S1003-6326(06), 60121-0
183. Dursun AY (2006) A comparative study on determination of the equilibrium, kinetic andthermodynamic parameters of biosorption of copper(II) and lead(II) ions onto pretreatedAspergillus niger. Biochem Eng J 28:187–195. doi:10.1016/j.bej.2005.11.003
184. Wang JS, Hu XJ, Xie SB, Bao ZL (2010) Biosorption of uranium (VI) by immobilized As-pergillus fumigatus beads. J Environ Radioact 101:504–508, 10.1016/j.jenvrad.2010.03.002
185. Aksu Z (2001) Equilibrium and kinetic modelling of cadmium (II) biosorption byC. Vulgaris in a batch system: effect of temperature. Sep Purif Technol 21:285–294.doi:10.1016/S1383-5866(00), 00212-4
186. Bhainsa KC, D’Souza SF (2009) Thorium biosorption by Aspergillus fumigatus, a filamentousfungal biomass. J Hazard Mater 165:670–676. doi:10.1016/j.jhazmat.2008.10.033
187. Kuyicak N, Volesky B (1990) Biosorption by fungal biomass. In: Volesky B (ed) Biosorptionof heavy metals. CRC press, Boca Raton
188. Rincon J, Gonzalez F, Ballester A, Blazquez ML, Munoz JA (2005) Biosorption of heavymetals by chemically-activated alga Fucus vesiculosus. J Chem Technol Biotechnol 80:1403–1407. doi:10.1002/jctb.1342
189. Yu Q, Matheickal JT, Yin P (1999) Heavy metal uptake capacities of common marine macroalgal biomass. Water Res 33:1534–1537. doi:10.1016/S0043-1354(98), 00363-7
190. Brinza L, Dring MJ, Gavrilescu M (2007) Marine micro- and macro-algal species asbiosorbents for heavy metals. Environ Eng Manag J 6:237–251
191. Romera E, Gonzalez F, Ballester A, Blazquez ML, Munoz JA (2006) Biosorption with algae:a statistical review. Crit Rev Biotechnol 26:223–235. doi:10.1080/07388550600972153
192. Matheickal JT, Iyengar L, Venkobachar C (1991) Sorption and desorption of Cu (II) byGanoderma lucidum. Water Qual Res J Can 26:187–200
193. Fourest E, Canal C, Roux JC (1994) Improvement of heavy metal biosorption by mycelialdead biomasses (Rhizopus arrhizus, Muchor miehei, and Pencillium chrysogenum): pH con-trol and cationic activation. FEMS Microbiol Rev 14:325–332. doi:10.1016/0168-6445(94),90050-7
194. Matheickal JT, Yu Q (1996) Biosorption of lead from aqueous solutions by marine algaEcklonia radiate. Water Sci Technol 34:1–7. doi:10.1016/S0273-1223(96), 00780-9
195. Pavasant P, Apiratikul R, Sungkhum V, Suthiparinyanont P, Wattanachira S, Marhaba TF(2006) Biosorption of Cu2C, Cd2C, Pb2C, and Zn2C using dried marine green macroalgaCaulerpa lentillifera. Bioresour Technol 97:2321–2329. doi:10.1016/j.biortech.2005.10.032

5 Heavy Metal Removal Through Biosorptive Pathways 141
196. Sari A, Tuzen M (2008) Biosorption of cadmium (II) from aqueous solution by red algae(Ceramium virgatum): equilibrium, kinetic and thermodynamic studies. J Hazard Mater157:448–454. doi:10.1016/j.jhazmat.2008.01.008
197. Gupta VK, Shrivastava AK, Jain N (2001) Biosorption of chromium (VI) from aque-ous solutions by green algae Spirogyra species. Water Res 35:4079–4085. doi:10.1016/S0043-1354(01), 00138-5
198. Gupta VK, Rastogi A (2008) Biosorption of lead from aqueous solutions by green al-gae Spirogyra species: kinetics and equilibrium studies. J Hazard Mater 152:407–414.doi:10.1016/j.jhazmat.2007.07.028
199. Tuzun I, Bayramoglu G, Alcin YE, Basaran G, Celik G, Arica MY (2005) Equilibrium and ki-netic studies on biosorption of Hg(II), Cd(II) and Pb(II)ions onto microalgae Chlamydomonasreinhardtii. J Environ Manage 77:85–92. doi:10.1016/j.jenvman.2005.01.028
200. Deng LP, Su YY, Su H, Wang XX, Zhu XB (2007) Sorption and desorption of lead(II)from wastewater by green algae Cladophora fascicularis. J Hazard Mater 143:220–225.doi:10.1016/j.jhazmat.2006.09.009
201. Ajmal M, Rao RAK, Ahmad R, Ahmad J (2000) Adsorption studies on Citrus reticulata (fruitpeel of orange): removal and recovery of Ni (II) from electroplating wastewater. J HazardMater B 79:117–131. doi:10.1016/S0304-3894(00)00234-X
202. Aksu Z, Kutsal T (1990) A comparative study for biosorption characteristics of heavy metalions with C. vulgaris. Environ Technol 11:979–987. doi:10.1080/09593339009384950
203. Donmez GC, Aksu Z, Ozturk A, Kutsal T (1999) A comparative study onheavy metal biosorption characteristics of some algae. Process Biochem 34:885–892.doi:10.1016/S0032-9592(99), 00005-9
204. Khezami L, Capart R (2005) Removal of chromium (VI) from aqueous solutionby activated carbons: kinetic and equilibrium studies. J Hazard Mater 123:223–231.doi:10.1016/j.jhazmat.2005.04.012
205. Aksu Z (2002) Determination of the equilibrium, kinetic and thermodynamic parameters ofthe batch biosorption of nickel (II) ions onto Chlorella vulgaris. Process Biochem 38:89–99.doi:10.1016/S0032-9592(02), 00051-1
206. Pahlavanzadeh H, Keshtkar AR, Safdari J, Abadi Z (2010) Biosorption of nickel (II) fromaqueous solution by brown algae: equilibrium, dynamic and thermodynamic studies. J HazardMater 175:304–310. doi:10.1016/j.jhazmat.2009.10.004
207. Sheng PX, Ting YP, Chen JP, Hong L (2004) Sorption of lead, copper, cadmium, zinc andnickel by marine algal biomass: characterization of biosorptive capacity and investigation ofmechanisms. J Colloid Interface Sci 275:131–141. doi:10.1016/j.jcis.2004.01.036
208. Bishnoi NR, Pant A, Garima (2004) Biosorption of copper from aqueous solution using algalbiomass. J Sci Ind Res 63:813–816, ISSN 0022–4456
209. Chand S, Agarwal VK, Kumar P (1994) Removal of hexavalent Cr from wastewater byadsorption. Indian J Environ Health 36:151–158, ISSN 0367–827X
210. Saravanane R, Sundararajan T, Sivamurthyreddy S (2002) Efficiency of chemically modifiedlow cost adsorbents for the removal of heavy metals from wastewater: a comparative study.Indian J Environ Health 44:78–87
211. Deo N, Ali M (1992) Optimization of a new low cost adsorbent in removal of Cr(VI) fromwastewater. Indian J Environ Protect 12:828–834
212. Karthikeyan S, Balasubramanian R, Iyer CSP (2007) Evaluation of the marine algae Ulvafasciata and Sargassum sp. for the biosorption of Cu(II) from aqueous solutions. BioresourTechnol 98:452–455. doi:10.1016/j.biortech.2006.01.010
213. Aravindhan R, Maharshi B, Sreeram KJ (2010) Biosorption of cadmium metal ion fromsimulated wastewaters using Hypnea valentiae biomass: a kinetic and thermodynamic study.Bioresour Technol 101:1466–1470. doi:10.1016/j.biortech.2009.08.008
214. Crist DR, Crist RH, Martin JR, Watson JR (1994) Ion exchange systems inproton–metal reaction with algal cell walls. FEMS Microbiol Rev 14:309–314.doi:10.1111/j.1574-6976.1994.tb00104.x

142 J. Sun et al.
215. Chojnacka K, Chojnacki A, Gorecka H (2005) Biosorption of Cr3C, Cd2Cand Cu2C ionsby blue–green algae Spirulina sp.: kinetics, equilibrium and the mechanism of the process.Chemosphere 59:75–84. doi:10.1016/j.chemosphere.2004.10.005
216. Raize O, Argaman Y, Yannail S (2004) Mechanisms of biosorption of different heavy metalsby brown marine macroalgae. Biotechnol Bioeng 87:451–458. doi:10.1002/bit.20136
217. Han X, Wong YS, Tam NFY (2006) Surface complexation mechanism and modeling in Cr(III) biosorption by a microalgal isolate, Chlorella miniata. J Colloid Interface Sci 303:365–371. doi:10.1016/j.jcis.2006.08.028
218. Kalyani S, Rao PS (2004) Removal of nickel (II) from aqueous solutionsusing marine macroalgae as the sorbing biomass. Chemosphere 57:1225–1229.doi:10.1016/j.chemosphere.2004.08.057
219. Ajjabiv LC, Chouba L (2009) Biosorption of Cu2C and Zn2C from aqueous solutionsby dried marine green macroalga Chaetomorpha linum. J Environ Manage 90:3485–3489.doi:10.1016/j.jenvman.2009.06.001
220. Sahmurova A, Turkmenler H (2010) Biosorption kinetics and isotherm studies of Cd(II) bydried Enteromorpha compress macroalgae cells from aqueous solutions. Clean Soil Air Water38:936–941. doi:10.1002/clen.201000108
221. Murugesan GS, Sathishirkumar M, Suaminathan K (2006) Arsenic removal fromgroundwater by pretreated waste tea fungal biomass. Bioresour Technol 97:483–487.doi:10.1016/j.biortech.2005.03.008
222. Fiol N, Villascusa I, Martinez M, Mirralles N, Poch J, Seralos J (2006) Sorpton of Pb (II),Ni (II), Cu (II) and Cd (II) from aqueous solutions by olive stone waste. Sep Purif Technol50:132–140. doi:10.1016/j.seppur.2005.11.016
223. Singh A, Mehta SK, Gaur JP (2007) Removal of heavy metals from aqueous solutionby common freshwater filamentous algae. World J Microbiol Biotechnol 23:1115–1120.doi:10.1007/s11274-006-9341-z
224. Freitas OM, Martins RJE, Delerue-Matos CM, Boaventura RAR (2008) Removal of Cd (II),Zn (II) and Pb (II) from aqueous solutions by brown marine macro algae: kinetic modeling.J Hazard Mater 153:493–501. doi:10.1016/j.jhazmat.2007.08.081
225. Lodeiro P, Cordero B, Grille Z, Herrero R, Sastre de Vicente ME (2004) Physicochemicalstudies of cadmium (II) biosorption by the invasive alga in Europe, Sargassum muticum.Biotechnol Bioeng 88:237–247. doi:10.1002/bit.20229
226. Cruz CCV, da Costa ACA, Henriques CA, Luna AS (2004) Kinetic modeling and equilibriumstudies during cadmium biosorption by dead Sargassum sp. biomass. Bioresour Technol91:249–257. doi:10.1016/S0960–8524(03)00194–9
227. Martins BL, Cruz CCV, Luna AS, Henriques CA (2006) Sorption and desorp-tion of Pb2C ions by dead Sargassum sp. biomass. Biochem Eng J 27:310–314.doi:10.1016/j.bej.2005.08.007
228. Kumar YP, King P, Prasad VSRK (2006) Removal of copper from aqueous solutionusing Ulva fasciata sp., a marine green algae. J Hazard Mater 137:367–373. doi:10.1016/j.jhazmat.2006.02.010
229. Weber WJ, Morris JC (1962) Advance in water pollution research: removal of biologicalresistant pollutions from wastewater by adsorption. In: Proceedings of the internationalconference on water pollution symposium. Pergamon Press, Oxford
230. Sharma A, Bhattacharyya KG (2005) Azadirachta indica (neem) leaf power as a biosor-bent for removal of Cd (II) from aqueous medium. J Hazard Mater B 125:102–112.doi:10.1016/j.jhazmat.2005.05.012
231. Benaissa H, Elouchdi MA (2007) Removal of copper ions from aqueous solutions by driedsunflower leaves. Chem Eng Process 46:614–622. doi:10.1016/j.cep. 2006.08.006
232. Salim R, Al-Subu M (2008) Efficiency of removal of cadmium from aqueous solutionsby plant leaves and the effects of interaction of combinations of leaves on their removalefficiency. J Environ Manage 87:521–532. doi:10.1016/j.jenvman.2007.01.028
233. Al Rmalli SW, Dahmani AA, Abuein MM, Gleza AA (2008) Biosorption of mercury fromaqueous solutions by powdered leaves of castor tree (Ricinus communis L.). J Hazard Mater152:955–959. doi:10.1016/j.jhazmat.2007.07.111

5 Heavy Metal Removal Through Biosorptive Pathways 143
234. Sangi M, Shahmoradi A, Zolgharnein J, Azimi GH, Ghorbandoost M (2008) Removal andrecovery of heavy metals from aqueous solution using Ulmus carpinifolia and Fraxinusexcelsior tree leaves. J Hazard Mater 155:513–522. doi:10.1016/j.jhazmat.2007.11.110
235. Zolgharnein J, Shamoradi A, Sangi MR (2008) Optimization of Pb (II) biosorptionby Robinia tree leaves using statistical design of experiments. Talanta 76:528–532.doi:10.1016/j.talanta.2008.03.039
236. Zolgharnein J, Shahmoradi A (2010) Characterization of sorption isotherms, kinetic models,and multivariate approach for optimization of Hg (II) adsorption onto Fraxinus tree leaves.J Chem Eng Data 55:5040–5049. doi:10.1021/je1006218
237. Sayrafi O, Salim R, Sayrafi SA (1996) Removal of cadmium from polluted water usingdecaying leaves: effects of type of leaves and of concentration of cadmium. J Environ SciHealth A 31:2503–2513. doi:10.1080/10934529609376506
238. Salim R, Al-Subu M, Qashoa S (1994) Removal of lead from polluted water using decayingplant leaves. J Environ Sci Health A 29:2087–2114. doi:10.1080/10934529409376166
239. Al-Subu M, Salim R, Abu-Shqair I, Swaileh K (2001) Removal of dissolved copper frompolluted water using plant leaves: effects of acidity and plant species. Rev Int ContamAmbient 17:91–96
240. Salim R (1988) Removal of nickel (II) from polluted water using decaying leaves-effects of pH and type of leaves. J Environ Sci Health A 23:183–197, 321–334. doi:10.1080/10934528809375403
241. Salim R, Robinson JW (1985) Removal of dissolved aluminum released by acid rain usingdecaying leaves. J Environ Sci Health A 20:701–734. doi:10.1080/10934528509375253
242. Fiol N, Villaescusa I, Martınez M, Miralles N, Poch J, Serarols J (2006) Sorption of Pb (II),Ni (II), Cu (II) and Cd (II) from aqueous solution by olive stone waste. Sep Purif Technol50:132–140. doi:10.1016/j.seppur.2005.11.016
243. Ozer A, Ozer D (2003) Comparative study of the biosorption of Pb (II), Ni (II) and Cr (VI)ion onto S. cerevisiae: determination of biosorption heats. J Hazard Mater B 100:219–228.doi:10.1016/S0304–3894(03)00109–2
244. Vianna LNL, Andrade MC, Nicoli JR (2000) Screening of waste biomass from Saccha-romyces cerevisiae, Aspergillus oryzae and Bacillus lentus fermentations for removal ofCu, Zn and Cd by biosorption. World J Microbiol Biotechnol 16:437–440. doi:10.1023/A:1008953922144
245. Singh KK, Rastogi R, Hasan SH (2005) Removal of Cr (VI) from wastewater using rice bran.J Colloid Interface Sci 290:61–68. doi:10.1016/j.jcis.2005.04.011
246. Villaescusa I, Fiol N, Martinez M, Miralles N, Poch J, Serarols J (2004) Removal of copperand nickel ions from aqueous solutions by grape stalks wastes. Water Res 38:992–1002.doi:10.1016/j.watres.2003.10.040
247. Bulut Y, Baysal Z (2006) Removal of Pb (II) from wastewater using wheat bran. J EnvironManage 78:107–113. doi:10.1016/j.jenvman.2005.03.010
248. Yu B, Zhang Y, Shukla A, Shukla SS, Dorris KL (2001) The removal of heavy metals fromaqueous solutions by sawdust adsorption: removal of lead and comparison of its adsorptionwith copper. J Hazard Mater 84:83–94. doi:10.1016/S0304-3894(01), 00198-4
249. Ho YS, Huang CT, Huang HW (2002) Equilibrium sorption isotherm for metal ions on treefern. Process Biochem 37:1421–1430. doi:10.1016/S0032-9592(02), 00036-5
250. Wang R, Liao X, Shi B (2005) Adsorption behaviors of Pt(II) and Pd(II) on collagen fibreimmobilized bayberry tannin. Ind Eng Chem Res 44:4221–4226. doi:10.1021/ie049069w
251. Ahluwalia SS, Goyal D (2005) Removal of heavy metals from waste tea leaves from aqueoussolution. Eng Life Sci 5:158–162. doi:10.1002/elsc.200420066
252. Singh KK, Talat M, Hasan SH (2006) Removal of lead from aqueous solutions by agriculturalwaste maize bran. Bioresour Technol 97:2124–2130. doi:10.1016/j.biortech.2005.09.016
253. Reddya D, Harinatha Y, Seshaiah K (2010) Biosorption of Pb (II) from aqueous solu-tions using chemically modified Moringa oleifera tree leaves. Chem Eng J 162:626–634.doi:10.1016/j.cej.2010.06.010

144 J. Sun et al.
254. Qaiser S, Saleemi AR, Umar M (2009) Biosorption of lead from aqueous solutionby Ficus religiosa leaves: batch and column study. J Hazard Mater 166:998–1005.doi:10.1016/j.jhazmat.2008.12.003
255. Al-Masri MS, Amin Y (2010) Biosorption of cadmium, lead, and uranium bypowder of poplar leaves and branches. Appl Biochem Biotechnol 160:976–987.doi:10.1007/s12010-009-8568-1
256. Aksu Z, Donmez G (2001) Comparison of copper (II) biosorptive properties of live and treatedCandida sp. J Environ Sci Health A 36:367–381. doi:10.1081/ESE-100102928
257. Yang J, Volesky B (1999) Sorption of copper on algae and fungi. Environ Sci Technol33:751–757
258. Aksu Z, Kutsal T, Gun S, Haciosmanoglu N, Gholaminejad M (1991) Investigation ofbiosorption of Cu(II), Ni(II) and Cr(VI) ions to activated sludge bacteria. Environ Technol12:915–921. doi:10.1080/09593339109385086
259. Zolgharnein J, Shahmoradi A (2010) Adsorption of Cr (VI) onto elaeagnus tree leaves:statistical optimization, equilibrium modeling, and kinetic studies. J Chem Eng Data 55:3428–3437. doi:10.1021/je100157y
260. Tian JS, Li Y, Li JL (2008) High-yield growth and magnetosome formation by Magnetospir-illum gryphiswaldense MSR-1 in an oxygen-controlled fermentor supplied solely with air.Appl Microbiol Biotechnol 9:389–397. doi:10.1007/s00253-008-1453-y
261. Song HP, Li XG, Sun JS, Xu XM, Han X (2008) Application of a magnetotactic bacterium,Stenotrophomonas sp. to the removal of Au(III) from contaminated wastewater with amagnetic separator. Chemosphere 72:616–621. doi:10.1016/j.chemosphere.2008.02.064
262. Krishna MVB, Chandrasekaran K, Rao SV, Karunasagar D, Arunachalam J (2005) Speciationof Cr(III) and Cr(VI) in waters using immobilized moss and determination by ICP-MS andFAAS. Talanta 65:135–142. doi:10.1016/j.talanta.2004.05.051
263. Godlewska-Zyłkiewicz B, Kozłowska M (2005) Solid phase extraction using immobilizedyeast Saccharomyces cerevisiae for determination of palladium in road dust. Anal Chim Acta539:61–67. doi:10.1016/j.aca.2005.02.051
264. Bag H, Lale M, Turker AR (1999) Determination of Cu, Zn and Cd in water by FAASafter preconcentration by baker’s yeast (Saccharomyces cerevisiae) immobilized on sepiolite.Fresenius J Anal Chem 363:224–230. doi:10.1007/s002160051178
265. Menegario AA, Smichowski P, Polla G (2005) On-line preconcentration and speciationanalysis of Cr(III) and Cr(VI) using baker’s yeast cells immobilised on controlled pore glass.Anal Chim Acta 546:244–250. doi:10.1016/j.aca.2005.05.030
266. Akhtar N, Iqbal J, Iqbal M (2004) Removal and recovery of nickel (II) from aqueoussolution by loofa sponge-immobilized biomass of Chlorella sorokiana: characterizationstudies. J Hazard Mat B 108:85–94. doi:10.1016/j.jhazmat.2004.01.002
267. Bender J, Phillips P (2004) Microbial mats for multiple applications in aquaculture andbioremediation. Bioresour Technol 94:229–238. doi:10.1016/j.biortech.2003.12.016
268. Chang WC, Hsu GS, Chiang SM, Su MC (2006) Heavy metal removal from aqueous solutionby wasted biomass from a combined AS-biofilm process. Bioresour Technol 97:1503–1508.doi:10.1016/j.biortech.2005.06.011
269. Gadd GM (2000) Bioremedial potential of microbial mechanisms of metal mobilization andimmobilization. Curr Opin Biotechnol 11:271–279. doi:10.1016/S0958-1669(00), 00095-1
270. Liu Y, Xu H, Yang S, Tay J (2003) A general model for biosorption of Cd, Cu, and Zn byaerobic granules. J Biotechnol 102:233–239. doi:10.1016/S0168-1656(03), 00030-0
271. Han R, Zhang J, Zou W, Xiao H, Shi J, Liu H (2006) Biosorption of copper(II) andlead(II) from aqueous solution by chaff in a fixed-bed column. J Hazard Mater 133:262–268.doi:10.1016/j.jhazmat.2005.10.019
272. Vijayaraghavan K, Jegan J, Palanivelu K, Velan M (2005) Biosorption of copper, cobalt andnickel by marine green alga Ulva reticulate in a packed column. Chemosphere 60:419–426.doi:10.1016/j.chemosphere.2004.12.016

5 Heavy Metal Removal Through Biosorptive Pathways 145
273. Godlewska-Zylkiewicz B (2003) Biosorption of platinum and palladium for their separationpreconcentration prior to graphite furnace atomic absorption spectrometric determination.Spectrochim Acta B Atom Spectrosc 58:1531–1540. doi:10.1016/S0584-8547(03), 00076-4
274. Azila YY, Mashitah MD, Bhatia S (2008) Process optimization studies of lead (Pb(II))biosorption onto immobilized cells of Pycnoporus sanguineus using response surface method-ology. Bioresour Technol 99:8549–8552. doi:10.1016/j.biortech.2008.03.056
275. Hu J, Chen GH, Irene MCL (2005) Removal and recovery of Cr(VI) from wastewater bymaghemite nanoparticles. Water Res 39:4528–4536. doi:10.1016/j.watres.2005.05.051
276. Li HD, Li Z, Liu T, Xiao X, Peng ZH, Deng L (2008) A novel technology for biosorption andrecovery hexavalent chromium in wastewater by bio-functional magnetic beads. BioresourTechnol 99:6271–6279. doi:10.1016/j.biortech.2007.12.002
277. Sau TK, Murphy CJ (2004) Room temperature, high-yield synthesis of multipleshapes of gold nanoparticles in aqueous solution. Am Chem Soc 126:8648–8649.doi:10.1021/ja047846d
278. Binupriya AR, Sathishkumar M, Vijayaraghavan K, Yun SI (2010) Bioreduction oftrivalent aurum to nano-crystalline gold particles by active and inactive cells andcell-free extract of Aspergillus oryzae var. viridis. J Hazard Mater 177:539–545.doi:10.1016/j.jhazmat.2009.12.066
279. Riddin T, Gericke M, Whiteley CG (2010) Biological synthesis of platinum nanopar-ticles: effect of initial metal concentration. Enzyme Microb Technol 46:501–505.doi:10.1016/j.enzmictec.2010.02.006
280. Shankar SS, Rai A, Ankamwar B, Singh A, Ahmad A (2004) Biological synthesis oftriangular gold nanoprisms. Nat Mater 3:482–488. doi:10.1038/nmat1152
281. Shankar SS, Rai A, Ahmad A, Sastry M (2005) Controlling the optical properties oflemongrass extract synthesized gold nanotriangles and potential application in infrared-absorbing optical coatings. Chem Mater 17:566–572. doi:10.1021/cm048292g

Chapter 6Mesoporous-Assembled NanocrystalPhotocatalysts for Degradation of Azo Dyes
Thammanoon Sreethawong
6.1 Introduction
Currently, wastewater problems can be generally found all over the world. Variouskinds of wastewaters have been generated from industrial processes. One of themajor industrial water pollutions is wastewaters from textiles, fibers, fabrics,plastics, papers, leathers, and related industries, which consist of high unfixedorganic dye concentrations of approximately 20%. Big concern has been paidto these organic dyes because of their prevalent application, noxious aromaticintermediate formation, and biorecalcitrance for conventional aerobic wastewater-treating processes [1–5]. A more complicated environmental problem related tothe wastewaters is that the organic dyes are opposed to bacterial degradation,and accordingly they can inevitably be converted to carcinogenic compounds.Particularly, a plentiful type of synthetically colored organic compounds is azo dye[6–11], such as methyl orange, congo red, and acid black, which is characterized bythe presence of azo group (–NDN–) commonly linked between aromatic rings.
Various technologies have been developed for azo dye degradation from thewastewaters, including physical methods (adsorption), chemical methods (chlo-rination and ozonation), biodegradation, reverse osmosis, combined coagulationand flocculation, electrochemical oxidation, as well as photocatalysis [12–16]. Theexisting physical/chemical methods have some disadvantages of being economicallyunfeasible (more energy and chemicals required), being unable to degrade therecalcitrant azo dyes and their aromatic intermediates completely, generating a largeamount of undesired sludge that unavoidably causes secondary pollution problems,and greatly increasing the overall treatment cost due to complicated procedures.However, photocatalysis is an environmentally friendly process that employs solar
T. Sreethawong (�)Baan Klangmuang Luzern, Soi On-nut 46, Sukhumvit 77 Road,Suanluang, Bangkok 10250, Thailande-mail: [email protected]
S.K. Sharma and R. Sanghi (eds.), Advances in Water Treatment and PollutionPrevention, DOI 10.1007/978-94-007-4204-8 6,© Springer ScienceCBusiness Media Dordrecht 2012
147

148 T. Sreethawong
irradiation energy to perform catalytic reactions under ambient conditions [15].Thus, photocatalysis technology has been extensively investigated for azo dyedegradation from the wastewaters.
From literature, it is clearly seen that among the new oxidation methodscalled advanced oxidation processes (AOPs), heterogeneous photocatalysis hasbeen increasingly considered to be a promising destructive technology due to itsseveral advantages. Firstly, it can degrade the azo dye pollutants by destroyingtheir complex molecules to less toxic substances in the presence of UV andnear-UV light irradiation, which ultimately leads to the total degradation of theazo dye pollutants. Secondly, environmentally benign materials can be used as asemiconductor photocatalyst, especially titanium dioxide (titania, TiO2). Thirdly,this process can be operated at room temperature and atmospheric pressure. Finally,the photocatalytic process has been attracting a considerable attention because of itscomparatively low cost due to the use of solar light as the source of irradiation.
6.2 Background of Azo Dyes
6.2.1 General Remarks
The “azo dye” term is normally used to name synthetically colored organiccompounds that are characterized by the presence of the azo group (–NDN–), whichcannot be found in natural dyes. This divalent group can be linked to sp2 hybridizedcarbon atom on one side and to an aromatic or heterocyclic nucleus on the other.It may be linked to an unsaturated molecule of the carboxylic, heterocyclic, oraliphatic type. On commercial scale, the azo dyes are the largest and most widelyused class of synthetic organic dyes. More than 10,000 color index (CI) genericnames are applied to differentiate commercial dyes, whereas approximately 4,500are currently used, and more than half of these dyes belong to the azo class [17].The azo dyes are extensively used by the industries to provide colors to natural andsynthetic textiles, fibers, fabrics, plastics, papers, and leathers, and they can also beused to produce organic pigments and in the dyeing of leather and plastic.
6.2.2 Classification of Azo Dyes
The most comprehensive information including the constitution, properties, prepa-ration methods, manufactures, and other coloring data of the azo dyes is the ColorIndex publication, which is jointly collected by the Society of Dyers and Coloristsand the American Association of Textile Chemists and Colorists [18, 19]. In theColor Index, a dual classification system is used to categorize the azo dyes withrespect to usage area and chemical constitution. As a result of their versatileapplications, the azo dyes comprise the largest chemical class in terms of thenumber, economic price, and quantities produced.

6 Mesoporous-Assembled Nanocrystal Photocatalysts. . . 149
Table 6.1 Color indexof different azo dyes [20]
Type of azo dye Range of color index
Monoazo 11,000–19,999Diazo 20,000–29,999Trisazo 30,000–34,999Polyazo 35,000–36,999
Most of the dye manufacturers use both letters and numerals together in theirproduct’s commercial name in order to identify the dye color. The examples ofletters used are as follows: B is blue; G is green; R is red; and Y is yellow; whereas,numerals, such as 2G (or GG), 3G, 4G, etc. indicate the shade of the color. In somecases, suffixed letters are also used to describe other properties, such as solubility,light fastness, and brightness. Moreover, the azo dyes can be subdivided with respectto the number of existing azo groups into mono-, dis-, tris-, tetrakis-, etc. [20].Generally, the significance of both mono- and diazo dyes are quite identical, trisazodyes are somewhat less significant, while tetrakisazo dyes, except for some of them,are far less significant. As a consequence, the azo dyes containing more than threeazo groups are usually incorporated under the heading of polyazo dyes. Table 6.1summarizes the color index of different azo dyes.
6.3 Removal of Azo Dyes from Wastewater
A number of textiles, fibers, fabrics, plastics, papers, leathers, and other relatedindustries use the azo dyes in order to color their products and also consume a largequantity of water during their production processes. Consequently, they generate asignificantly high amount of azo dye-contaminated wastewaters. Generally, waterquality is realized by public perception according to its color; therefore, the color isthe first issue to be recognized in wastewaters. The existence of very small amountsof azo dyes in water (even less than 1 ppm for some azo dyes) is visible andundesirable [12, 21]. According to their extremely good solubility in water, they areregularly found in various quantities in industrial wastewaters. Because restrictionson the organic content in industrial wastewater effluents become increasingly strin-gent, the contaminated azo dyes are required to be removed from the wastewatersbefore being discharged. This is mainly because, as aforementioned, most of theazo dyes are toxic and even carcinogenic, and they can cause a serious dangerwhen exposed to aquatic living organisms. Nevertheless, the azo dye-containingwastewaters are rather difficult to be treated since the azo dyes are recalcitrantorganic compounds and resistant to aerobic wastewater-treating processes, as wellas stable to light, heat, and oxidizing agents [22–24]. Hence, during the past decades,several physical, chemical, and biological methods have been developed to removethe azo dyes from wastewaters [12], as briefly described below.

150 T. Sreethawong
6.3.1 Physical Treatment Methods
Various physical methods have been widely employed to treat the azo dye-containing wastewaters, especially membrane- and filtration-based processes (suchas reverse osmosis, nanofiltration, and electrodialysis) and adsorption processes.Even though they are very important in terms of applications, some disadvantagesfor each process have been found. The major drawbacks of the membrane processesis their restricted lifetime of usage since fouling can gradually occur on themembrane surface, and the replacement cost is comparatively high. Moreover, theadsorption is one of the most popular methods to have been scientifically studiedand practically applied for the removal of azo dye pollutants from wastewaters sincethe well-optimized operation in combination with the most efficient unit design ofthe adsorption processes can result in acceptably high azo dye removal efficiency[25]. Particularly, the adsorption processes seem to provide a relatively promisingoption for the treatment of azo dye-contaminated wastewaters in the cases that thesolid adsorbents are inexpensive, and any pretreatment steps are not necessarilyrequired prior to their use.
6.3.2 Chemical Treatment Methods
Chemical methods are also efficient for the removal of azo dyes contaminated inthe wastewaters. The examples of important chemical methods are coagulation orflocculation combined with flotation and filtration, electroflotation, precipitation-flocculation, electrokinetic coagulation, conventional oxidation methods by oxidiz-ing agents (such as ozone), and irradiation or electrochemical processes. Thesechemical methods are typically costly as compared to the physical methods, andalthough the azo dyes can be effectively removed, the formation and accumulationof sludges cause a secondary disposal problem. The excessive chemical use alsodefinitely leads to a secondary pollution problem. Recently, other interestingtechniques, known as advanced oxidation processes (AOPs), which are based on thegeneration of very powerful oxidizing agents, such as hydroxyl radicals, have beensuccessfully applied for the azo dye degradation [26]. Even if these methods areefficient for the treatment of azo dye-contaminated wastewaters, they are still verycostly and practically infeasible because the huge consumptions of chemicals andelectricity are the main problems. However, in replacing the electrical energy, theother important sources of abundantly available and renewable energy, especiallysolar energy, can be employed in order to drive the AOP via photocatalysis, asexplained in detail in the next section.
6.3.3 Biological Treatment Methods
Biological methods are so far the most practically attractive when compared to theaforementioned physical and chemical methods. Fungal decolorization, microbial

6 Mesoporous-Assembled Nanocrystal Photocatalysts. . . 151
degradation, adsorption by living or dead microbial biomass, and bioremediationsystems are the important examples of biological methods that are generally usedto treat the wastewaters. It is because several kinds of microorganisms, includingbacteria, yeasts, algae, and fungi, are able to accumulate and degrade azo dyepollutants contaminated in the wastewaters. However, these methods still have somedrawbacks. Biological treatment requires a large area of land and is restricted bytoxicity limitation of some chemicals that may be generated and released. Theless flexibility in process design and operation is also another main drawback [27].Furthermore, even though many organic azo dye molecules can be partly degradedby biological methods, there are still several recalcitrant azo dyes that withstand thebiodegradability due to their complex chemical structure [22].
All of the aforementioned methods have both advantages and drawbacks. Cur-rently, no single process is capable of sufficiently treating the wastewaters, primarilybecause of the complicated characteristics of the contaminated azo dye compounds.In practical use, a combination of different methods is definitely required in orderto achieve the desired effluent quality [28, 29]. Nevertheless, this chapter mainlyfocuses on photocatalysis, which is an effective method for degrading the azo dyespresent in the wastewaters.
6.4 Photocatalysis and Photocatalytic Degradationof Azo Dyes
6.4.1 Semiconductor
A semiconductor is a substance which possesses an electrical conductivity betweenthose of an insulator and a conductor. Basically, semiconductor substances haveelectronic band structure governed by their crystalline properties. A semiconductor,which can be employed as a photocatalyst, is typically an oxide of metals, suchas TiO2, SrTiO3, ZnO, WO3, and SnO2 [30, 31]. For the electrons confined in asemiconductor, their actual energy distribution is determined by the Fermi level andtemperature of the electrons. At absolute zero temperature, all of the electrons haveenergy below the Fermi energy, but at nonzero temperature, the energy levels arerandomized, and some electrons have energy above the Fermi level. Among theelectronic bands occupied with the electrons, the band having the highest energylevel is universally defined as the valence band (VB), while the one outside of thisis defined as the conduction band (CB). The energy difference between the valenceband and the conduction band is defined as the band gap [31]. The overall schematicof band gap energy is shown in Fig. 6.1.
The band gap can be imaginably considered as a partition, where the electronsmust jump over from the valence band to the conduction band for being free. The en-ergy quantity required to jump over the partition is widely known as the band gap en-ergy (Eg, normally in the unit of eV). Only the electrons capable of jumping over the

152 T. Sreethawong
Electron energy
Occupiedbands
Unoccupiedbands
Conductionband
Band gap
Valenceband
Fig. 6.1 The schematic of band gap energy [31]
Table 6.2 The band gap positions of some semiconductor photocatalysts [31, 32]
SemiconductorValence bandlevel (eV)
Conductionband level (eV)
Band gapenergy (eV)
Band gapwavelength (nm)
TiO2 C3.1 �0.1 3.2 387SrTiO3 C3.1 �0.1 3.2 387ZnO C3.0 �0.2 3.2 387WO3 C3.0 C0.2 2.8 443SnO2 C4.1 C0.3 3.8 326
partition to enter the conduction band can freely move around. When a semiconduc-tor is irradiated by light having suitable wavelengths with energy equal to or greaterthan its band gap energy, the valence band electrons can be excited to the conductionband. In the meantime, the positive holes are created and left in the valence band,and the number of holes is equal to that of electrons that have been excited to theconduction band. The valence band level, conduction band level, band gap energy,and band gap wavelength of some semiconductors are shown in Table 6.2.
6.4.2 Photocatalysts
Substances with semiconductor characteristics can be effectively employed asphotocatalysts in photocatalytic systems because they are able to generate electronsand holes (both known as charge carriers) by absorbing appropriate light energies.The efficiency in separating the photoinduced charge carriers to prevent theirrecombination is a very crucial factor in determining the photocatalytic activity of asemiconductor photocatalyst. Titanium dioxide (titania, TiO2) and strontium titanate
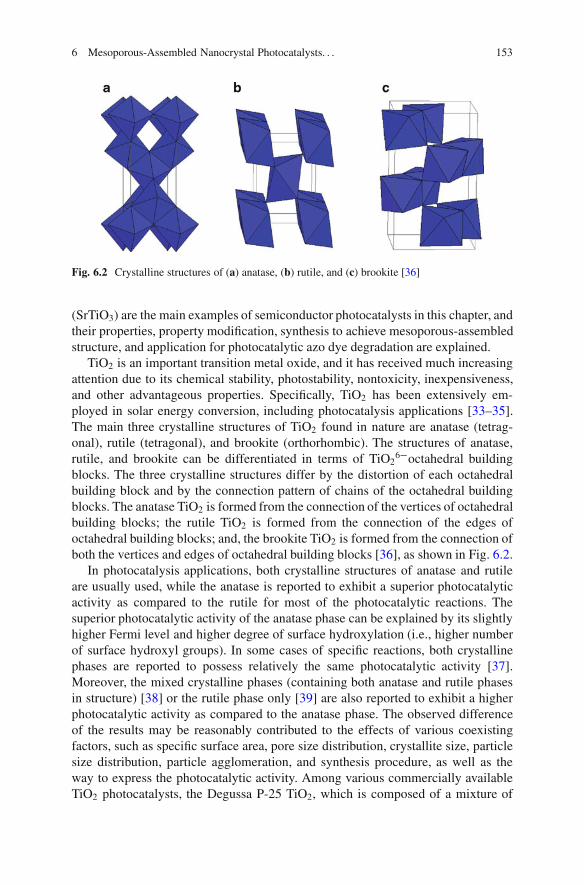
6 Mesoporous-Assembled Nanocrystal Photocatalysts. . . 153
Fig. 6.2 Crystalline structures of (a) anatase, (b) rutile, and (c) brookite [36]
(SrTiO3) are the main examples of semiconductor photocatalysts in this chapter, andtheir properties, property modification, synthesis to achieve mesoporous-assembledstructure, and application for photocatalytic azo dye degradation are explained.
TiO2 is an important transition metal oxide, and it has received much increasingattention due to its chemical stability, photostability, nontoxicity, inexpensiveness,and other advantageous properties. Specifically, TiO2 has been extensively em-ployed in solar energy conversion, including photocatalysis applications [33–35].The main three crystalline structures of TiO2 found in nature are anatase (tetrag-onal), rutile (tetragonal), and brookite (orthorhombic). The structures of anatase,rutile, and brookite can be differentiated in terms of TiO2
6�octahedral buildingblocks. The three crystalline structures differ by the distortion of each octahedralbuilding block and by the connection pattern of chains of the octahedral buildingblocks. The anatase TiO2 is formed from the connection of the vertices of octahedralbuilding blocks; the rutile TiO2 is formed from the connection of the edges ofoctahedral building blocks; and, the brookite TiO2 is formed from the connection ofboth the vertices and edges of octahedral building blocks [36], as shown in Fig. 6.2.
In photocatalysis applications, both crystalline structures of anatase and rutileare usually used, while the anatase is reported to exhibit a superior photocatalyticactivity as compared to the rutile for most of the photocatalytic reactions. Thesuperior photocatalytic activity of the anatase phase can be explained by its slightlyhigher Fermi level and higher degree of surface hydroxylation (i.e., higher numberof surface hydroxyl groups). In some cases of specific reactions, both crystallinephases are reported to possess relatively the same photocatalytic activity [37].Moreover, the mixed crystalline phases (containing both anatase and rutile phasesin structure) [38] or the rutile phase only [39] are also reported to exhibit a higherphotocatalytic activity as compared to the anatase phase. The observed differenceof the results may be reasonably contributed to the effects of various coexistingfactors, such as specific surface area, pore size distribution, crystallite size, particlesize distribution, particle agglomeration, and synthesis procedure, as well as theway to express the photocatalytic activity. Among various commercially availableTiO2 photocatalysts, the Degussa P-25 TiO2, which is composed of a mixture of

154 T. Sreethawong
approximately 80% anatase and 20% rutile phases, is reported to be more activethan both pure crystalline phases for many reactions. The enhancement in itsphotocatalytic activity may originate from its capability to efficiently separate theelectron/hole pairs and prevent their undesired recombination due to the mixedphase nature of the particles.
Another promising photocatalyst type is perovskite-related material. Perovskite-related materials are simply represented by the general formula of ABO3 (A rep-resents rare earth or alkali element with or without its partial substitution byalkaline earth element, and B represents transition element, such as Ti, Ta, Ni, Fe,etc., with or without its partial substitution) [40, 41]. More specifically, strontiumtitanate (SrTiO3) is a well-known cubic-perovskite oxide, which has received anincreasing attention due to its excellent dielectric, photoelectric, optical, catalytic,and photocatalytic properties. SrTiO3 is also considered to be applicable forvarious photocatalytic reactions. However, pure SrTiO3 without a cocatalyst loadingon its surface normally shows very low photocatalytic activity. Therefore, themodification of SrTiO3 in several ways is necessary to obtain active photocatalystsfor the photocatalytic degradation of azo dyes contaminated in the wastewaters.Particularly, the incorporation/loading of some effective transition and noble metals,such as Cr, Zr, Pt, and Au, into/onto SrTiO3 has been proved to be a very efficientmodification technique. For example, SrTiO3 doped with Cr3C led to an introductionof isolated energy levels within its band gap, so irradiated light can be absorbed attwo levels, i.e., the band gap and sub-band gap, where the latter resulted in lightabsorption in the visible region [42]. The synthesis of Zr-doped SrTiO3 by a sol-gel method and its photocatalytic degradation of methylene blue dye were alsoreported. It was shown that the 8% Zr content doped on SrTiO3 provided the highestphotocatalytic degradation rate due to free zirconium ions that induced SrTiO3 tomore efficiently absorb light [43].
6.4.3 Nanocrystalline Photocatalysts
Nanocrystalline photocatalysts are extremely small semiconductor particles, whichare as small as few nanometers in particle size. During the past decades, theinvestigation of nanosized semiconductor particles and their photocatalytic appli-cations has been one of the most attractive research areas in nanotechnology. Thesignificance of these nanosized semiconductor particles stems from their uniquephysical, chemical, and photocatalytic properties. Interestingly, much research hasrevealed that some properties of nanosized semiconductor particles are differentfrom those of the bulk materials. Nanosized particles possess properties fallinginto the transition region between the molecular and bulk phases. For the bulkmaterials, the electrons excited from the valence band to the conduction band bylight absorption have comparatively high density of states, where they can movearound with different kinetics energies. However, for the nanosized particles, theparticle size is the same as or smaller than the size of the first excited state; therefore,

6 Mesoporous-Assembled Nanocrystal Photocatalysts. . . 155
the electrons and holes generated upon light irradiation cannot fit into such particle.Hence, as the size of the semiconductor particles is reduced below a critical value,the confinement of the generated charge carriers induces them to behave quantumcharacteristics. In the other words, this means that the bands split into separateelectronic states in the valence and conduction bands, and the nanosized particlesgradually behave in a similar manner to a huge atom. Nanosized semiconductorparticles that possess size-dependent optical and electronic properties are widelyknown as quantized particles or quantum dots [44].
There are many advantages for the application of nanosized semiconductorparticles. A main important advantage is the increase in band gap energy ofsemiconductor particles with decreasing particle size. As aforementioned, whenthe size of a semiconductor particle becomes lower than the critical diameter, thephotogenerated charge carriers start to behave quantum characteristics, and thecharge confinement produces separate electronic states. Consequently, there is ashift of the band edge and thus an increase in the band gap. This implies thatthe redox potentials of the valence band holes and the conduction band electronscan be adjusted by varying the size of the semiconductor particles. The increaseddriving force accordingly results in increasing the charge transfer rate at theparticle surface. Hence, the use of nanosized semiconductor particles increasesphotocatalytic activity for many reaction systems, in which interfacial chargetransfer is the rate-limiting step. Besides, the nanosized semiconductor particlescan facilitate redox reactions to be able to readily occur, which cannot be easilyenhanced in the bulk materials. The other benefit of nanosized particles is thatthe fraction of atoms located at the nanoparticle surface is very large, causing thenanosized particles to have high surface area-to-volume ratio, which in turn helpsenhance their photocatalytic activity. Moreover, the nanosized particles require lightwith a shorter wavelength for band gap excitation, so a smaller portion of irradiatedlight is sufficiently useful for photocatalytic reactions [45].
6.4.4 Photocatalytic Degradation of Azo Dyes
There are two main mechanisms for azo dye degradation by photocatalysis usinga semiconductor photocatalyst: photocatalytic oxidation under UV light irradiationand photosensitized oxidation under visible light irradiation [15].
6.4.4.1 Photocatalytic Oxidation
Basically, the conduction band electrons (e�) and valence band holes (hC) are gen-erated when photocatalyst powders suspended in an aqueous solution are irradiatedwith light having energy equal to or higher than its band gap energy (UV light with�< 420 nm in general cases), as mentioned before. The photogenerated electronscan both reduce the dissolved organic dye molecules and react with electronacceptors, such as O2 adsorbed on the photocatalyst surface or dissolved in water,

156 T. Sreethawong
leading to its reduction to superoxide radical anion, O2•�. The photogenerated
holes can both oxidize the organic dye molecules to form oxidized species andreact with OH� or H2O, leading to their transformation to hydroxyl radical, OH•.The resulting O2
•� and OH• radicals are reported to play a significant role in thephotocatalytic degradation of azo dye molecules. The possible reactions occurringat the semiconductor photocatalyst surface to result in the azo dye degradation byphotocatalytic oxidation can be expressed as follows [46–50]:
Photocatalyst C hv .UV/ ! Photocatalyst�eCB
� C hVBC�
Photocatalyst�hVB
C� C H2O ! Photocatalyst C HC C OH�
Photocatalyst�hVB
C� C OH� ! Photocatalyst C OH�
Photocatalyst .eCB�/C O2 ! Photocatalyst C O2
��
O2�� C HC ! HO2
�
Dye C OH�; HO2�; O2
�� ! Degradation products
Dye C hVBC ! Oxidation products
Dye C eCB� ! Reduction products
The O2•� and OH• radicals as well as HO2
• radical subsequently formed, whichpossess an extremely strong oxidizing power, can oxidize most of azo dye moleculesto less harmful end products, such as H2O and CO2. By this means, a lot of azodyes that are intrinsically reactive toward hydroxyl radical can be degraded viaphotocatalysis, which is greatly affected by the valence band edge position of asemiconductor photocatalyst. The reduction pathway (i.e., direct reaction of azo dyewith conduction band electrons) in the photocatalysis is also involved in the azo dyedegradation, but in a less extent than the oxidation pathway (i.e., direct reaction ofazo dye with valence band holes) [46, 51].
6.4.4.2 Photosensitized Oxidation
The detailed mechanism of photosensitized oxidation (also known as photoassisteddegradation) by visible light irradiation (�> 420 nm) totally differs from the above-mentioned mechanism under UV light radiation of photocatalytic oxidation. In thiscase, the mechanism starts with the excitation of the azo dye molecules adsorbedon the photocatalyst surface by visible light to their corresponding singlet or tripletstates (1Dye* or 3Dye*), then followed by electron transfer from the excited dyemolecules into the conduction band of the photocatalyst particles, whereas the dyemolecules become unstable and are readily converted to the cationic dye radicals(Dye•C) that further undergoes their degradation. The possible reactions occurringat the semiconductor photocatalyst surface to result in the azo dye degradation byphotosensitized oxidation can be expressed as follows [50, 52–55]:

6 Mesoporous-Assembled Nanocrystal Photocatalysts. . . 157
Dye C hv .visible/ ! 1Dye� or 3Dye�
1Dye� or 3Dye� C Photocatalyst ! Dye�C C Photocatalyst .eCB�/
Photocatalyst .eCB�/C O2 ! O2
�� C Photocatalyst
Dye�C ! Degradation products
The cationic dye radicals can also both react with hydroxyl ions to causetheir oxidation and react with O2
•�, HO2•, or HO• species to generate various
intermediates that eventually lead to their degradation, as shown in the following:
Dye�C C OH� ! Dye C HO�
Dye C 2HO� ! H2O C Oxidation products
O2�� C HC ! HO2
�
HO2� C HC C Photocatalyst .eCB
�/ ! H2O2 C Photocatalyst
H2O2 C Photocatalyst .eCB�/ ! HO� C HO� C Photocatalyst
Dye�C C O2�� ! Degradation products
Dye�C C HO2� �
or HO�� ! Degradation products
In experimental works, when either real or simulated solar light is employed,both photocatalytic and photosensitized mechanisms can simultaneously take placeduring the azo dye degradation, and both the photocatalyst and the light irradiationare required for the reaction. In the photocatalytic oxidation, the photocatalyst isirradiated and excited by UV light to initiate charge carrier formation. On theother hand, in the photosensitized oxidation, the dye molecules themselves ratherthan the photocatalyst are excited by visible light, followed by electron transferinto the photocatalyst conduction band. Nevertheless, it is still difficult to concludethat the photocatalytic oxidation mechanism is more capable of degrading azo dyemolecules than the photosensitized oxidation mechanism since the photosensitizedmechanism can help enhance the overall degradation efficiency and make the dyedegradation more practical when using solar light [55].
6.5 Synthesis Procedures of Mesoporous-AssembledNanocrystal Photocatalysts
6.5.1 Porous Materials
The International Union of Pure and Applied Chemistry (IUPAC) has classifieddifferent terminologies about porous materials with their definitions [56, 57] as

158 T. Sreethawong
Table 6.3 Definitions about porous materials [56, 57]
Terminology Definition
Porous material Material with cavities or channels, which are deeper than their internal widthMicropore Pore of internal width lower than 2 nmMesopore Pore of internal width between 2 and 50 nmMacropore Pore of internal width higher than 50 nmPore size Pore width (diameter of cylindrical pore or distance between opposite walls
of slit)Pore volume Volume of pores determined by any given methodSurface area Magnitude of total surface area determined by any given method under
stated conditions
summarized in Table 6.3. As widely accepted, the pore size is identified as the porewidth, i.e., the distance between two opposite walls of pore. The pore size has a clearand specific meaning when the geometrical shape of pores is well defined. However,in most cases, the effective pore size is commonly represented by the size of poreswith the smallest dimension.
According to the IUPAC classification, porous materials can be generally dividedinto three major categories based on their principal pore size, as follows:
• Microporous materials (pore size lower than 2 nm) consist of amorphous silicaand inorganic gel to crystalline materials, such as zeolites, aluminophosphates,gallophosphates, and related materials.
• Mesoporous materials (pore size between 2 and 50 nm) consist of the M41Sfamily (e.g., MCM-41, MCM-48, MCM-50, etc.), other non-silica materials,such as double hydroxides, metal (e.g., titanium, zirconium, etc.) oxides andphosphates, and clays.
• Macroporous materials (pore size higher than 50 nm) consist of glass-relatedmaterials, aerogels, and xerogels.
Currently, microporous and mesoporous materials are regularly described asnanoporous materials. Even if mesoporous materials are proper for catalysisapplications (including photocatalysis applications in this chapter), the pores ofmicroporous materials are too small and may be easily blocked by metal particlesduring photocatalyst preparation with high metal loadings. The main characteristicsand some important properties of microporous and mesoporous materials are givenin Table 6.4. The significance of microporous materials is because of their broadindustrial applications within catalytic areas, especially in petrochemistry and chem-ical synthesis [58]; however, the industrial applications of microporous materials areoccasionally restricted by their relatively small pore sizes, as aforementioned. Muchinterest has been therefore devoted to mesoporous materials with the main attentionto widen their catalysis applications to comparatively larger molecules. A fewdecades ago (1990s), the successful discovery of M41S materials has brought thefocus of several researchers around the world to the synthesis of various mesoporousmaterials, which can be considered as multifunctional advanced materials [59, 60].

6 Mesoporous-Assembled Nanocrystal Photocatalysts. . . 159
Table 6.4 Characteristics and some important properties of microporous and mesoporousmaterials
Material type Microporous materials Mesoporous materials
Pore size <2 nm 2–50 nmMain components
for the synthesisSilicon source, aluminum source,
templating agent, solvent, andmineralizing agent
Silicon (or other metal) source,self-assembled templatingagent, solvent, and catalyst(acid or base)
Advantages Large surface area and adsorptioncapacity, the possibility ofcontrolling the adsorptionproperties by tuning thehydrophobicity orhydrophilicity of the materials,the channel opening andcavities are in the range ofmany molecules of interest(0.5–1.2 nm), and the uniquepore structure makes thematerials able to recognizemolecules
Controlled porosity, largeaccessible internal surface areaand pore volume, a capacitythat often leads to unusualmagnetic, electronic, andoptical properties, the ability toallow reactions with bulkysubstrates, grafting of largecatalytically active species tothe walls of the mesopores isachievable
Disadvantages Not able to efficiently processmolecules that are larger thantheir pore diameters (maximum1–1.2 nm)
Poor thermal and hydrothermalstability
6.5.2 Sol-Gel Process
Sol-gel process has been extensively studied as an effective means to synthesizenanosized mesoporous materials. Because the mesoporous metal oxides, whichare normally applied for catalysis/photocatalysis fields, can be thermally deac-tivated due to particle sintering and crystallite growth during their exposure tohigh-temperature treatment, and their catalytic/photocatalytic efficiency is stronglydependent on their specific surface area, the sol-gel process provides some uniqueadvantages via a low-temperature process. It imparts a lower level of contaminationof the synthesized materials and also yields a better stoichiometric and particlesize control. In addition, this process does not require complicated equipment, andit provides a straightforward and efficient route for achieving nanosized particles,which are desirable for nano-photocatalysts with various functionalized properties[61–78]. Its molecular chemistry involves the formation of metal-oxo-polymernetwork via hydrolysis and polycondensation of metal precursors, such as metalalkoxides (i.e., the most important metal precursors for the sol-gel process), asfollows [79]:
M � OR C H2O ! M � OH C ROH
M � OH C M � OR ! M � O � M C R � OH
M � OH C M � OH ! M � O � M C H2O

160 T. Sreethawong
where M D Ti, Zr, etc., and R D alkyl group. Each individual stage during the sol-gelprocess, including the formation of colloidal sol particles, formation of gel network,drying of wet gel, and calcination of dried gel, can result in different degreesof crystallite growth and particle agglomeration. Therefore, the sol-gel processneeds to be suitably controlled in order to attain highly active and reproduciblemesoporous metal oxide powders. The relative hydrolysis and polycondensationrates greatly affect the structural and physicochemical properties of the resultingmaterials. Basically, the original precipitates derived from the sol-gel processpossess amorphous structure in nature; thus, they require further thermal treatmentto induce crystallization. The calcination step unavoidably leads to crystallitegrowth and particle agglomeration, and may also stimulate phase transformation.Thus, a surfactant is generally applied to prevent the particle agglomeration. Thesol-gel process proceeded in the presence of a surfactant can enable a good controland dispersity of mesoporous metal oxide particle size.
There are several factors that affect the sol-gel process and the resultingmesoporous materials, particularly the reactivity (hydrolysis and polycondensationrates) of metal alkoxides, pH of the sol-gel medium, water-to-alkoxide ratio, sol-geltemperature, and nature of solvent and additive (e.g., acid catalyst, base catalyst, andtemplating surfactant). For example, the water-to-alkoxide ratio strongly influencesthe sol-gel chemistry and the structural properties of the hydrolyzed gel. A higherwater-to-alkoxide ratio in the sol-gel medium guarantees a more complete hydroly-sis of metal alkoxides, which consequently results in reducing the crystallite size ofthe calcined material. The utilization of acid or base catalyst is an alternative wayto manipulate the hydrolysis and polycondensation rates of metal alkoxides–in theother words, the sol-gel reaction rates. It was reported that a smaller particle size anda narrower pore size distribution with a smaller mean pore diameter of a mesoporousmetal oxide material were obtained via the sol-gel process with HCl addition in asuitable quantity [61]. The size of alkoxide group in metal alkoxides also exerts asignificant effect in the particle size control. The metal alkoxides possessing morebulky alkoxide groups offer a slower hydrolysis rate due to their steric hindrance,which is very beneficial for the preparation of very fine colloidal sol particles [80].
6.5.3 Surfactant-Assisted Templating Sol-Gel Process
Surfactant-assisted templating sol-gel process is an effective approach for synthe-sizing mesoporous metal oxide materials based on the utilization of cooperativelyco-assembled organic surfactant molecules in the form of micelles or liquid crystalphases as templates to support the growth of metal oxide materials induced by thesol-gel process [63]. After the complete gel formation, the templating surfactantmolecules can be subsequently eliminated from the gel framework, e.g., by thermaltreatment and chemical extraction. For this approach, the micellar structure ofsurfactant molecules and charge compatibility between surfactant head group andmetal alkoxide species at the micellar interface are the critical parameters to

6 Mesoporous-Assembled Nanocrystal Photocatalysts. . . 161
A0
VLc
Fig. 6.3 Surfactant micellar structure [82]
control the framework structure and pore size of the resulting mesoporous metaloxide materials. Therefore, the synthesis of mesoporous metal oxide materialswith desired shape and pore size can be succeeded by properly manipulatingthe processing conditions, e.g., types of metal alkoxide precursor and templatingsurfactant, pH of sol-gel medium, calcination condition, etc. Moreover, the criticalpacking parameter (P) is an important characteristic of surfactant micellar structurethat can govern the formation of mesoporous structure of the obtained metal oxidematerials [81, 82]. As seen from the surfactant micellar structure shown in Fig. 6.3,the P value is defined as:
P D V
A0Lc
where V is the topographical volume of hydrophobic portion of surfactant molecule,A0 is the effective area of surface head group, and Lc is the critical length ofhydrophobic tail of surfactant molecule.
The relationship between the P value and self-assembled surfactant shape isas follows: 0 � P � 1/3 for sphere, 1/3 � P � 1/2 for cylinder, and 1/2 � P � 1 forbilayer. However, the P value is also strongly affected by some system conditions,e.g., pH, ionic strength, and temperature.
For the metal oxide particles synthesized by the surfactant-assisted templatingsol-gel process, their mesoporous structure is formed by loose aggregation of crys-talline metal oxide nanoparticles. The pore structures of metal oxide nanocrystalsconnect randomly and lack an apparent long-range order in the pore arrangementamong the crystalline metal oxide nanoparticles [83]. It is apparent that themesopores among the aggregated metal oxide nanoparticles exhibits the type IVIUPAC nitrogen adsorption-desorption isotherms with a clear hysteresis loop, whichis the main feature of mesoporous-structured materials (as can be seen in the next

162 T. Sreethawong
Fig. 6.4 A proposed possiblemodel of the mesoporeformation for the metal oxidenanocrystals synthesized bythe surfactant-assistedtemplating sol-gel process
section). A proposed possible model of the mesopore formation for the metal oxidenanocrystals synthesized by the surfactant-assisted templating sol-gel process isshown in Fig. 6.4. As proposed in the model, the hydrolysis and condensationreactions of the metal precursor (either without or with chemical modification) takeplace when it is added to the micellar surfactant aqueous solution, and the organic-inorganic (surfactant-metal oxide) composite materials are formed. The interactionbetween surfactant micelles and the aggregated inorganic moieties occurs througha mechanism involving self-assembly with simultaneous condensation of inorganicmoieties around the micellar surfactant head groups [84–86]. After the complete gelformation via the condensation, the micellar surfactant molecules highly dispersedand embedded inside the inorganic gel structure are thermally removed, renderingthe inorganic moieties to coalesce and crystallize to form assembled particles withinterconnected mesopores. The resulting products are therefore called mesoporous-assembled metal oxide nanocrystals.

6 Mesoporous-Assembled Nanocrystal Photocatalysts. . . 163
6.6 Application of Mesoporous-Assembled NanocrystalPhotocatalysts for Azo Dye Degradation
The surfactant-assisted templating sol-gel process can be efficiently applied forsynthesis of mesoporous-assembled nanocrystal photocatalysts. In this chapter, thesynthesis and application for azo dye degradation of mesoporous-assembled TiO2,SrTiO3, and SrTixZr1�xO3 nanocrystal photocatalysts are mainly focused.
6.6.1 Mesoporous-Assembled TiO2 Nanocrystal Photocatalyst
The mesoporous-assembled TiO2 nanocrystal photocatalyst can be synthesizedvia the surfactant-assisted templating sol-gel process by using tetraisopropyl or-thotitanate (TIPT) as the Ti precursor modified with acetylacetone (ACA) as themodifying agent and laurylamine hydrochloride (LAHC) as the structure-templatingsurfactant [63]. Firstly, the TIPT is homogeneously mixed with the ACA with theTIPT-to-ACA molar ratio of 1:1, leading to a modification of the co-ordinationnumber of the Ti atom from 4 to 5, as shown in the equation below. This modificationresults in the change of mixture solution color from colorless to yellow. Theresulting ACA-modified TIPT is much less active to the moisture in air than theTIPT itself, and can be applied as the starting mixture for the sol-gel synthesis.
Ti(OCH(CH3)2)4 + CH3COCH2COCH3 HOCH(CH3)2
(TIPT) (ACA)
+
Pri–O–Ti–O–PriO–Pri
O OC CCH3C CH3H
+
Ti coordination number: 4 Ti coordination number: 5
To the ACA-modified TIPT mixture, the LAHC aqueous solution is added inorder to control the mesoporous structure of the TiO2. The yellow precipitates occurinstantaneously after the LAHC aqueous solution addition because of the partialhydrolysis of the modified TIPT molecules. Then, the precipitates are completelydissolved at 40ıC under mechanical agitation to obtain a transparent yellow sol,which is resulted from the interaction between the hydrolyzed TIPT moleculesand the hydrophilic head groups of micellar LAHC molecules, as well as fromthe suspension of these interacted species in the solution as microscopic colloidalparticles. After that, a gelation is completed by thermal curing of the sol at 80ıCdue to the condensation of the modified TIPT molecules attached to the LAHChead groups. During the condensation process, the ACA molecules are detachedfrom the modified TIPT molecules due to the presence of a transparent yellowliquid layer above the gel. Then, the gel is dried at 80ıC to obtain dried gel (zerogel) of TiO2. Finally, the dried gel is calcined at equal to or above 500ıC, whichis a sufficiently high temperature for both the LAHC surfactant removal from thegel network and the photocatalyst crystallization process, to yield the mesoporous-
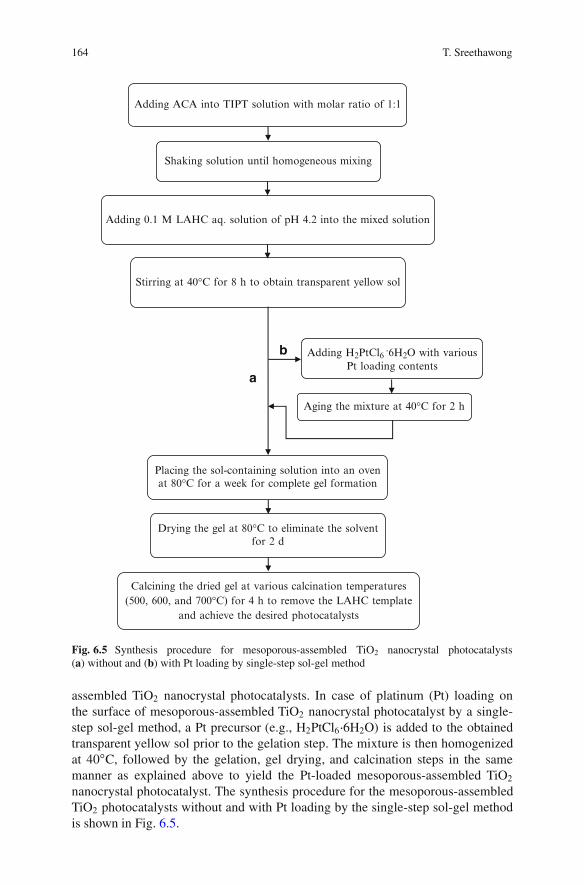
164 T. Sreethawong
Shaking solution until homogeneous mixing
Adding 0.1 M LAHC aq. solution of pH 4.2 into the mixed solution
Stirring at 40°C for 8 h to obtain transparent yellow sol
Adding H2PtCl6 .6H2O with various
Pt loading contents
Aging the mixture at 40°C for 2 h
Placing the sol-containing solution into an ovenat 80°C for a week for complete gel formation
Drying the gel at 80°C to eliminate the solventfor 2 d
Calcining the dried gel at various calcination temperatures(500, 600, and 700°C) for 4 h to remove the LAHC template
and achieve the desired photocatalysts
Adding ACA into TIPT solution with molar ratio of 1:1
a
b
Fig. 6.5 Synthesis procedure for mesoporous-assembled TiO2 nanocrystal photocatalysts(a) without and (b) with Pt loading by single-step sol-gel method
assembled TiO2 nanocrystal photocatalysts. In case of platinum (Pt) loading onthe surface of mesoporous-assembled TiO2 nanocrystal photocatalyst by a single-step sol-gel method, a Pt precursor (e.g., H2PtCl6�6H2O) is added to the obtainedtransparent yellow sol prior to the gelation step. The mixture is then homogenizedat 40ıC, followed by the gelation, gel drying, and calcination steps in the samemanner as explained above to yield the Pt-loaded mesoporous-assembled TiO2
nanocrystal photocatalyst. The synthesis procedure for the mesoporous-assembledTiO2 photocatalysts without and with Pt loading by the single-step sol-gel methodis shown in Fig. 6.5.

6 Mesoporous-Assembled Nanocrystal Photocatalysts. . . 165
0
20
40
60
80
100
0 0.2 0.4 0.6 0.8 1
Relative pressure (P/P0)
Ads
orbe
d am
ount
(cm
3 (ST
P)g
-1)
Adsorption
Desorption
0
10
20
30
40
0 10 20 30 40 50
Pore diameter (nm)
Dv
(mm
3 nm
-1g-1
)
Fig. 6.6 N2 adsorption-desorption isotherms and pore size distribution of the mesoporous-assembled TiO2 nanocrystal photocatalyst calcined at 500ıC (Inset: Pore size distribution) [87]
Fig. 6.7 TEM micrograph ofthe mesoporous-assembledTiO2 nanocrystalphotocatalyst calcined at500ıC [87]
The synthesized TiO2 nanocrystal photocatalysts possess very narrow andmonomodal pore size distribution in the mesoporous range (i.e., pore diameterbetween 2 and 50 nm), as verified by the N2 adsorption-desorption isotherm andpore size distribution analyses in Fig. 6.6. The particle size of the synthesizedmesoporous TiO2 is also very uniform in a nanosized range, as observed by theTEM analysis in Fig. 6.7.

166 T. Sreethawong
0
0.2
0.4
0.6
0.8
1
0 1 2 3 4Irradition time (h)
C/C
0
500°C
600°C
700°C
P-25
ST-01
JRC-03
Fig. 6.8 Photocatalyticdegradation of MO dye interms of relativeconcentration (C/C0) over thesynthesizedmesoporous-assembled TiO2
nanocrystal photocatalystscalcined at varioustemperatures (500ıC, 600ıC,and 700ıC) and commercialTiO2 photocatalysts as afunction of irradiation time(photocatalyst dosage D 2 g/l;reaction volume D 80 ml;initial MO concentrationD 5 mg/l; and UV lamppower D 44 W) [87]
The synthesized mesoporous-assembled TiO2 nanocrystal can be employed asan efficient photocatalyst for degrading various kinds of azo dyes, e.g., methylorange (MO) monoazo dye, acid yellow (AY) monoazo dye, and acid black (AB)diazo dye. As the first instance, the photocatalytic degradation of MO dye overthe synthesized mesoporous-assembled TiO2 nanocrystal photocatalysts calcinedat various temperatures is shown in Fig. 6.8, as compared to that over variouscommercially available non-mesoporous TiO2 powders (i.e., Degussa P-25 TiO2,Ishihara ST-01 TiO2, and Ishihara JRC-03 TiO2) [87]. It is clearly revealed thatthe mesoporous-assembled TiO2 nanocrystal photocatalyst calcined at a suitabletemperature of 500ıC provides the highest photocatalytic MO dye degradationefficiency, which is considerably higher than that of the commercial TiO2 powders.It can therefore be inferred that the mesoporosity with uniform pore size distributionof the synthesized TiO2 nanocrystal photocatalyst is a prime and very importantfactor in achieving its acceptably high photocatalytic dye degradation performance(this will also be confirmed for the SrTiO3 and SrTixZr1�xO3 nanocrystal photo-catalysts, as shown in the next section). Moreover, a suitable Pt loading content of0.6 wt.% can improve the photocatalytic MO dye degradation performance of thesynthesized mesoporous-assembled TiO2 nanocrystal photocatalyst [88], as shownin Fig. 6.9. This is because of the electron transfer-mediating capability of theloaded Pt particles that prevents the electron-hole recombination at both surfaceand bulk traps.
As the synthesized mesoporous-assembled TiO2 nanocrystal photocatalystcalcined at 500ıC shows a superior photocatalytic activity, its photocatalyticperformance for simultaneously degrading a mixture of AY and AB dyes withmore complex molecular structures is also evaluated [89], as shown in Fig. 6.10.

6 Mesoporous-Assembled Nanocrystal Photocatalysts. . . 167
0.75
1.25
1.75
2.25
0 0.2 0.4 0.6 0.8
Pt loading content (wt.%)
Rea
ctio
n ra
te c
onst
ant, k
(h-
1 )
Fig. 6.9 Photocatalytic degradation of MO dye in terms of pseudo-first-order rate constant overthe synthesized Pt-loaded mesoporous-assembled TiO2 nanocrystal photocatalysts prepared bysingle-step sol-gel method and calcined at 500ıC as a function of Pt loading content (photocatalystdosage D 2 g/l; reaction volume D 80 ml; initial MO concentration D 5 mg/l; and UV lamppower D 44 W) [88]
0
20
40
60
80
100AB for 5:2.5 mg/l
TOC for 5:2.5 mg/l
Deg
rada
tion
eff
icie
ncy
(%)
AY for 5:2.5 mg/l
No ha
rdne
ss
Ca 10
0 pp
m
Ca 20
0 pp
m
Ca 50
0 pp
m
Mg 10
0 pp
m
Mg 20
0 pp
m
Mg 50
0 pp
m
Ca+M
g 10
0 pp
m
Ca+M
g 20
0 pp
m
Ca+M
g 50
0 pp
m
Fig. 6.10 Photocatalytic degradation of a mixture of AY and AB dyes in the presence of hardnessin terms of degradation efficiency over the synthesized mesoporous-assembled nanocrystal TiO2
photocatalysts calcined at 500ıC as functions of type and concentration of hardness (photocatalystdosage D 10 g/l; reaction volume D 80 ml; initial AY concentration D 5 mg/l; initial AB concen-tration D 2.5 mg/l; irradiation time D 60 min; and UV lamp power D 44 W) [89]

168 T. Sreethawong
It is apparent that even in the presence of hardness found in tap water (normallyfound at a concentration of approximately 100–200 ppm in the form of eitherCa, Mg, or Ca-Mg mixture up to 500 ppm, which represents an extremely highhardness concentration), the synthesized mesoporous-assembled TiO2 nanocrystalphotocatalyst still exhibits a considerably high photocatalytic degradation activityfor both dyes present in the aqueous mixture. This verifies that the mesoporous-assembled TiO2 nanocrystal photocatalyst possesses an exceptional photocatalyticproperty and can be efficiently employed for the azo dye removal fromwastewaters.
6.6.2 Mesoporous-Assembled SrTiO3 and SrTixZr1�xO3
Nanocrystal Photocatalysts
The aforementioned surfactant-assisted templating sol-gel process, with some mod-ifications, can also be adapted to synthesize the mesoporous-assembled SrTiO3 andSrTixZr1�xO3 nanocrystal photocatalysts by using strontium titanate (Sr(NO3)2) asthe Sr precursor, tetraisopropyl orthotitanate (TIPT) as the Ti precursor, zirconiumbutoxide (ZRB, 80 wt.% in 1-butanol) as the Zr precursor, acetylacetone (ACA) asthe modifying agent, laurylamine hydrochloride (LAHC) as the structure-templatingsurfactant, and ethanol (EtOH) as the co-solvent [90, 91]. The synthesis procedurefor the mesoporous-assembled SrTiO3 and SrTixZr1�xO3 nanocrystal photocatalystswithout and with Pt loading by the single-step sol-gel method is illustrated inFig. 6.11.
The synthesized SrTiO3 and SrTixZr1�xO3 nanocrystal photocatalysts also pos-sess narrow pore size distribution in the mesoporous range and uniform particlesizes, as confirmed by the N2 adsorption-desorption and TEM analyses [90, 91], inthe same manner as the synthesized TiO2 nanocrystal photocatalyst. The photocat-alytic MO dye degradation performance of the synthesized mesoporous-assembledSrTiO3 nanocrystal photocatalysts calcined at various temperatures is shown inFig. 6.12, as compared to that of the commercially available non-mesoporousSrTiO3 powder (Wako) [90]. It can be clearly seen that the mesoporous-assembledSrTiO3 nanocrystal photocatalyst calcined at an appropriate temperature of 700ıCshows a considerably higher photocatalytic activity than the commercial SrTiO3
powder. It can then be concluded that the mesoporous-assembled structure witha uniform pore size distribution of SrTiO3 plays the most important role thatgoverns the photocatalytic activity of the SrTiO3 photocatalyst. The photocat-alytic activity of the mesoporous-assembled SrTiO3 nanocrystal photocatalystcan be further greatly enhanced by partly substituting Ti atoms in the SrTiO3
photocatalyst by a suitable quantity of Zr atoms to obtain the SrTi0.9Zr0.1O3
photocatalyst [91], as shown in Fig. 6.13 for the photocatalytic degradation of AB

6 Mesoporous-Assembled Nanocrystal Photocatalysts. . . 169
Drying the gel at 80°C to eliminate the solvents for 4 d
Calcining the dried gel at 600-800°C to removethe LAHC and achieve the desired photocatalysts
Placing the sol-containing solution into an oven at 80°C for 4 d for complete gel formation
Mesoporous-assembled SrTixZr1-xO3 nanoparticles
Stirring continuously at room temperature to obtain transparent yellow sol
LAHC-Sr(NO3)2 solution(Mixing at 25°C)
TIPTACA
EtOHLAHC
Sr(NO3)2 H2O
LAHC solution
Sr(NO3)2 solutionTIPT-ZRB-ACA solution(Mixing at 25°C)
ZRB
Adding H2PtCl6.H2O with variousPt loadings
a
b
Fig. 6.11 Synthesis procedure for mesoporous-assembled SrTiO3 and SrTixZr1�xO3 nanocrystalphotocatalysts (a) without and (b) with Pt loading by single-step sol-gel method
dye. Moreover, the Pt loading with an appropriate content of 1 wt.% can additionallyimprove the photocatalytic AB dye degradation performance of the mesoporous-assembled SrTi0.9Zr0.1O3 nanocrystal photocatalyst, as shown in Fig. 6.14. Hence,the surfactant-assisted templating sol-gel process can be a promising and effectivemeans for synthesizing very highly photoactive mesoporous-assembled photocata-lysts for azo dye degradation application.

170 T. Sreethawong
0
10
20
30
40
50
60
70
80
90
100
0 50 100 150 200
Time, min
Deg
rada
tion
, %
600 °C
650 °C
700 °C
750 °C
Commercial SrTiO3
Fig. 6.12 Photocatalytic degradation of MO dye in terms of degradation efficiency over thesynthesized mesoporous-assembled SrTiO3 nanocrystal photocatalysts calcined at various tem-peratures (600ıC, 650ıC, 700ıC, and 750ıC) and commercial SrTiO3 photocatalyst as a functionof irradiation time (photocatalyst dosage D 5 g/l; reaction volume D 15 ml; initial MO concentra-tion D 10 mg/l; and UV lamp power D 15 W) [90]
1.2
1.0
0.8
0.6
0.4
0.2
0.00 0.5 0.6 0.7 0.8
x in SrTixZr1-xO3
Rea
ctio
n ra
te c
onst
ant, k
(h-
1 )
0.9 10.85 0.95
Fig. 6.13 Photocatalytic degradation of AB dye in terms of pseudo-first-order rate constantover the synthesized mesoporous-assembled SrTixZr1�xO3 nanocrystal photocatalysts calcined at700ıC as a function of Ti content (x) in SrTixZr1�xO3 (photocatalyst dosage D 5 g/l; reactionvolume D 100 ml; initial AB concentration D 15 mg/l; irradiation time D 4 h; and UV lamppower D 44 W) [91]

6 Mesoporous-Assembled Nanocrystal Photocatalysts. . . 171
2.5
2.0
1.5
1.0
0.5
0.00 0.5 0.7 1.2 1.5
700°C
750°C
800°C
1
Pt loading (wt.%)
Rea
ctio
n ra
te c
onst
ant, k
(h-
1 )
Fig. 6.14 Photocatalytic degradation of AB dye in terms of pseudo-first-order rate constantover the synthesized Pt-loaded mesoporous-assembled SrTi0.9Zr0.1O3 nanocrystal photocatalystsprepared by single-step sol-gel method and calcined at various temperatures as a function of Ptloading content (photocatalyst dosage D 5 g/l; reaction volume D 100 ml; initial AB concentra-tion D 15 mg/l; irradiation time D 4 h; and UV lamp power D 44 W) [91]
Acknowledgment The Asahi Glass Foundation, Japan; the Research Grant for Mid-CareerUniversity Faculty (RMU) co-funded by the Thailand Research Fund (TRF), the Commissionon Higher Education, Thailand, and Chulalongkorn University, Thailand; the RatchadapisekSomphot Endowment Fund, Chulalongkorn University, Thailand; the Research Unit of AppliedSurfactants for Separation and Pollution Control under the Ratchadapisek Somphot EndowmentFund, Chulalongkorn University, Thailand; the Research Unit of Petrochemical and Environ-mental Catalysis under the Ratchadapisek Somphot Endowment Fund, Chulalongkorn University,Thailand; the Sustainable Petroleum and Petrochemicals Research Unit, Center for Petroleum,Petrochemicals, and Advanced Materials, Chulalongkorn University, Thailand; and the Petroleumand Petrochemical College, Chulalongkorn University, Thailand are acknowledged.
References
1. Sokolowsak-Gajda J, Freeman HS, Reife A (1996) Synthetic dyes based on environmentalconsiderations. Part 2: iron complexed formazan dyes. Dye Pigment 30:1–20
2. Hsu TC, Chiang CS (1997) Activated sludge treatment of dispersed dye factory wastewater.J Environ Sci Health A Environ Sci Eng Tox Hazard Subst Control A 32:1921–1932
3. Kabdach I, Tunay O, Orhon D (1999) Wastewater control and management in a leathertanning district. Water Sci Technol 40:261–267
4. Slampova A, Smela D, Vondrackova A, Jancarova I, Kuban V (2001) Determination ofsynthetic colorants in foodstuffs. Chem Listy 95:163–168
5. Wrobel D, Boguta A, Ion RM (2001) Mixtures of synthetic organic dyes in a photoelectroniccell. J Photochem Photobiol A Chem 138:7–22
6. Wang Y (2000) Solar photocatalytic degradation of eight commercial dyes in TiO2 suspen-sion. Water Res 34:990–994

172 T. Sreethawong
7. Guillard C, Lachheb H, Houas A, Ksibi M, Elaloui E, Herrmann JM (2003) Influence ofchemical structure of dyes, of pH and of inorganic salts on their photocatalytic degradationby TiO2 comparison of the efficiency of powder and supported TiO2. J Photochem PhotobiolA Chem 158:27–36
8. Netpradit S, Thiravetyan P, Towprayoon S (2004) Adsorption of three azo reactive dyes bymetal hydroxide sludge: effect of temperature, pH, and electrolytes. J Colloid Interface Sci270:255–261
9. Yang Y, Wu Q, Guo Y, Hu C, Wang E (2005) Efficient degradation of dye pollutants onnanoporous polyoxotungstate–anatase composite under visible-light irradiation. J Mol CatalA Chem 225:203–212
10. Marugan J, Lopez-Munoz MJ, van Grieken R, Aguado J (2007) Photocatalytic decolorizationand mineralization of dyes with nanocrystalline TiO2/SiO2 materials. Ind Eng Chem Res46:7605–7610
11. Khataee AR, Kasiri MB (2010) Photocatalytic degradation of organic dyes in the presence ofnanostructured titanium dioxide: influence of the chemical structure of dyes. J Mol Catal AChem 328:8–26
12. Robinson T, McMullan G, Marchant R, Nigam P (2001) Remediation of dyes in textileeffluent: a critical review on current treatment technologies with a proposed alternative.Bioresour Technol 77:247–255
13. Fu Y, Viraraghavan T (2001) Fungal decolorization of dye wastewaters: a review. BioresourTechnol 79:251–262
14. Forgacsa E, Cserhatia T, Oros G (2004) Removal of synthetic dyes from wastewaters: areview. Environ Int 30:953–971
15. Konstantinou IK, Albanis TA (2004) TiO2-assisted photocatalytic degradation of azo dyesin aqueous solution: kinetic and mechanistic investigations: a review. Appl Catal B Environ49:1–14
16. van der Zee FP, Villaverde S (2005) Combined anaerobic–aerobic treatment of azo dyes – ashort review of bioreactor studies. Water Res 39:1425–1440
17. http://www.colour-index.org/. (Accessed on 30 April 2012)18. http://www.sdc.org.uk/. (Accessed on 30 April 2012)19. http://www.aatcc.org/. (Accessed on 30 April 2012)20. Mary HG (1991) Encyclopedia of chemical technology. Wiley-Interscience, New York21. Banat IM, Nigam P, Singh D, Marchant R (1996) Microbial decolorization of textile dye-
containing effluents: a review. Bioresour Technol 58:217–22722. Ravi Kumar MNV, Sridhari TR, Bhavani KD, Dutta PK (1998) Trends in color removal from
textile mill effluents. Colorage 40:25–3423. O’Neill C, Hawkes FR, Hawkes DL, Lourenco ND, Pinheiro HM, Delee W (1999) Colour in
textile effluents–sources, measurement, discharge consents and simulation: a review. J ChemTechnol Biotechnol 74:1009–1018
24. Sun Q, Yang L (2003) The adsorption of basic dyes from aqueous solution on modified peat-resin particle. Water Res 37:1535–1544
25. Dabrowski A (2001) Adsorption, from theory to practice. Adv Colloid Interface Sci 93:135–224
26. Gogate PR, Pandit AB (2004) A review of imperative technologies for wastewater treatmentI: oxidation technologies at ambient conditions. Adv Environ Res 8:501–551
27. McMullan G, Meehan C, Conneely A, Kirby N, Robinson T, Nigam P, Banat IM, Marchant R,Smyth WF (2001) Microbial decolourisation and degradation of textile dyes. Appl MicrobiolBiotechnol 56:81–87
28. Marco A, Esplugas S, Saum G (1997) How and why to combine chemical and biologicalprocesses for wastewater treatment. Water Sci Technol 35:231–327
29. Oller I, Malato S, Sanchez-Perez JA (2011) Combination of advanced oxidation processesand biological treatments for wastewater decontamination – a review. Sci Total Environ 409:4141–4166

6 Mesoporous-Assembled Nanocrystal Photocatalysts. . . 173
30. Lin Y, Yuan G, Liu R, Zhou S, Sheehan SW, Wang D (2011) Semiconductor nanostructure-based photoelectrochemical water splitting: a brief review. Chem Phys Lett 507:209–215
31. Robertson PKJ (1996) Semiconductor photocatalysis: an environmentally acceptable alterna-tive production technique and effluent treatment process. J Cleaner Prod 4:203–212
32. Moreira ML, Andrs J, Longo VM, Li MS, Varela JA, Longo F (2009) Photoluminescentbehavior of SrZrO3/SrTiO3 multilayer thin films. Chem Phys 473:293–298
33. Hoffmann MR, Martin ST, Choi W, Bahnemann DW (1995) Environmental applications ofsemiconductor photocatalysis. Chem Rev 95:69–96
34. Linsebigler AL, Lu G, Yater JT Jr (1995) Photocatalyst on TiO2 surfaces: principles,mechanisms, and selected results. Chem Rev 95:735–758
35. Mills A, Le Hunte S (1997) An overview of semiconductor photocatalysis. J PhotochemPhotobiol A Chem 108:1–35
36. Carp O, Huisman CL, Reller A (2004) Photoinduced reactivity of titanium dioxide. Prog SolidState Chem 32:33–177
37. Deng X, Yue Y, Gao Z (2002) Gas phase photo-oxidation of organic compounds overnanosized TiO2 photocatalysts by various preparations. Appl Catal B Environ 39:135–147
38. Mugglie DS, Ding L (2001) Photocatalytic performance of sulfated TiO2 and Degussa P-25TiO2 during oxidation of organics. Appl Catal B Environ 32:181–188
39. Mills A, Lee SK, Lepre A (2003) Photodecomposition of ozone sensitised by a film oftitanium dioxide on glass. J Photochem Photobiol A Chem 155:199–205
40. Tanaka H, Misono M (2001) Advances in designing perovskite catalysts. Curr Opin SolidState Mater Sci 5:381–387
41. Fang CM, Ahuja R (2006) Structures and stability of ABO3 orthorhombic perovskites at theEarth’s mantle conditions from first-principles theory. Phys Earth Planet Inter 157:1–7
42. Ashokkumar M (1998) An overview on semiconductor particulate systems for photoproduc-tion of hydrogen. Int J Hydrog Energy 23:427–438
43. Chen L, Zhang S, Wang L, Xue D, Yin S (2008) Photocatalytic activity of Zr:SrTiO3 underUV illumination. J Cryst Growth 311:735–737
44. Kamat PV (1995) Tailoring nanostructured thin films. Chemtech45. Chen X, Mao SS (2007) Titanium dioxide nanomaterials: synthesis, properties, modifications,
and applications. Chem Rev 107:2891–295946. Tanaka K, Padermpole K, Hisanaga T (2000) Photocatalytic degradation of commercial azo
dyes. Water Res 34:327–33347. Galindo C, Jacques P, Kalt A (2000) Photodegradation of the aminoazobenzene Acid Orange
52 by three advanced oxidation processes: UV/H2O2, UV/TiO2 and VIS/TiO2: comparativemechanistic and kinetic investigations. J Photochem Photobiol A Chem 130:35–47
48. Bianco-Prevot A, Baiocchi C, Brussino MC, Pramauro E, Savarino P, Augugliaro V, MarciG, Palmisano L (2001) Photocatalytic degradation of Acid Blue 80 in aqueous solutionscontaining TiO2 suspensions. Environ Sci Technol 35:971–976
49. Houas A, Lachheb H, Ksibi M, Elaloui E, Guillard C, Hermann JM (2001) Photocatalyticdegradation pathway of methylene blue in water. Appl Catal B Environ 31:145–157
50. Daneshvar N, Salari D, Khataee AR (2003) Photocatalytic degradation of azo dye Acid Red14 in water: investigation of the effect of operational parameters. J Photochem Photobiol AChem 157:111–116
51. Vinodgopal K, Bedja I, Hotchandani S, Kamat PV (1994) A photocatalytic approach for thereductive decolorization of textile azo dyes in colloidal semiconductor suspensions. Langmuir10:1767–1771
52. Vinodgopal K, Wynkoop D, Kamat P (1996) Environmental photochemistry on semiconduc-tor surfaces: photosensitized degradation of a textile azo dye, Acid Orange 7, on TiO2 particlesusing visible light. Environ Sci Technol 30:1660–1666
53. Zhang F, Zhao J, Shen T, Hidaka H, Pelizzetti E, Serpone N (1998) TiO2-assisted photodegra-dation of dye pollutants II. Adsorption and degradation kinetics of eosin in TiO2 dispersionsunder visible light irradiation. Appl Catal B Environ 15:147–156

174 T. Sreethawong
54. Chen F, Xie Y, Zhao J, Lu G (2001) Photocatalytic degradation of dyes on a magneticallyseparated photocatalyst under visible and UV irradiation. Chemosphere 44:1159–1168
55. Epling GA, Lin C (2002) Photoassisted bleaching of dyes utilizing TiO2 and visible light.Chemosphere 46:561–570
56. Ishizaki K, Komarneni S, Nanko M (1988) Porous materials: process technology andapplications. Kluwer Academic, London
57. Rouquerol F, Rouquerol J, Sing K (1999) Adsorption by powders and porous solid: principle,methodology, and applications. Academic, San Diego
58. Stein A (2003) Advanced materials progress report on advances in microporous andmesoporous solids–highlights of recent progress. Adv Mater 15:763–775
59. Kresge CT, Leonowicz ME, Roth WJ, Vartuli JC, Beck JS (1992) Ordered mesoporousmolecular sieves synthesized by a liquid-crystal template mechanism. Nature 359:710–712
60. Beck JS, Vartuli JC, Roth WJ, Leonowicz ME, Kresge CT, Schmitt KD, Chu TTW, Olson DH,Sheppard EW, McCullen SB, Higgins JB, Schlenker JL (1992) A new family of mesoporousmolecular sieves prepared with liquid crystal templates. J Am Chem Soc 114:10834–10843
61. Wang CC, Ying J (1999) Sol-gel synthesis and hydrothermal processing of anatase and rutiletitania nanocrystals. Chem Mater 11:3113–3120
62. Wu JC, Chen CH (2004) A visible-light response vanadium-doped titania nanocatalyst bysol-gel method. J Photochem Photobiol A Chem 163:509–515
63. Sreethawong T, Suzuki Y, Yoshikawa S (2005) Synthesis, characterization, and photocatalyticactivity for hydrogen evolution of nanocrystalline mesoporous titania prepared by surfactant-assisted templating sol-gel process. J Solid State Chem 178:329–338
64. Sreethawong T, Susuki Y, Yoshikawa S (2005) Photocatalytic evolution of hydrogen overmesoporous TiO2 supported NiO photocatalyst prepared by single-step sol-gel process withsurfactant template. Int J Hydrog Energy 30:1053–1062
65. Sreethawong T, Yoshikawa S (2005) Comparative investigation on photocatalytic hydrogenevolution over Cu-, Pd-, and Au-loaded mesoporous TiO2 photocatalysts. Catal Commun6:661–668
66. Sreethawong T, Ngamsinlapasathian S, Suzuki Y, Yoshikawa S (2005) Nanocrystallinemesoporous Ta2O5-based photocatalysts prepared by surfactant-assisted templating sol-gelprocess for photocatalytic H2 evolution. J Mol Catal A Chem 235:1–11
67. Sreethawong T, Yoshikawa S (2006) Enhanced photocatalytic hydrogen evolution over Ptsupported on mesoporous TiO2 prepared by single-step sol-gel process with surfactanttemplate. Int J Hydrog Energy 31:786–796
68. Sreethawong T, Laehsalee S, Chavadej S (2008) Comparative investigation of mesoporous-and non-mesoporous-assembled TiO2 nanocrystals for photocatalytic H2 production over N-doped TiO2 under visible light irradiation. Int J Hydrog Energy 33:5947–5957
69. Sreethawong T, Laehsalee S, Chavadej S (2009) Use of Pt/N-doped mesoporous-assemblednanocrystalline TiO2 for photocatalytic H2 production under visible light irradiation. CatalCommun 10:538–543
70. Puangpetch T, Sreethawong T, Yoshikawa S, Chavadej S (2009) Hydrogen productionfrom photocatalytic water splitting over mesoporous-assembled SrTiO3 nanocrystal-basedphotocatalysts. J Mol Catal A Chem 312:97–106
71. Sreethawong T, Junbua C, Chavadej S (2009) Photocatalytic H2 production from watersplitting under visible light irradiation using Eosin Y-sensitized mesoporous-assembledPt/TiO2 nanocrystal photocatalyst. J Power Sources 190:513–524
72. Puangpetch T, Sreethawong T, Chavadej S (2010) Hydrogen production over metal-loadedmesoporous-assembled SrTiO3 nanocrystal photocatalysts: effects of metal type and loading.Int J Hydrog Energy 35:6531–6540
73. Puangpetch T, Sommakettarin P, Chavadej S, Sreethawong T (2010) Hydrogen produc-tion from water splitting over Eosin Y-sensitized mesoporous-assembled perovskite ti-tanate nanocrystal photocatalysts under visible light irradiation. Int J Hydrog Energy 35:12428–12442

6 Mesoporous-Assembled Nanocrystal Photocatalysts. . . 175
74. Puangpetch T, Chavadej S, Sreethawong T (2011) Mesoporous-assembled V2O5 nanosheetsynthesized via a surfactant-modified sol-gel technique and its photocatalytic H2 productionactivity under visible light irradiation. Powder Technol 208:37–41
75. Onsuratoom S, Chavadej S, Sreethawong T (2011) Hydrogen production from water splittingunder UV light irradiation over Ag-loaded mesoporous-assembled TiO2-ZrO2 mixed oxidenanocrystal photocatalysts. Int J Hydrog Energy 36:5246–5261
76. Sakulkhaemaruethai S, Sreethawong T (2011) Synthesis of mesoporous-assembled TiO2
nanocrystals by a modified urea-aided sol-gel process and their outstanding photocatalyticH2 production activity. Int J Hydrog Energy 36:6553–6559
77. Wongwisate P, Chavadej S, Gulari E, Sreethawong T, Rangsunvigit P (2011) Effects ofmonometallic and bimetallic Au-Ag supported on sol-gel TiO2 on photocatalytic degradationof 4-chlorophenol and its intermediates. Desalination 272:154–163
78. Puangpetch T, Chavadej S, Sreethawong T (2011) Hydrogen production over Au-loadedmesoporous-assembled SrTiO3 nanocrystal photocatalyst: effects of molecular structure andchemical properties of hole scavengers. Energy Convers Manag 52:2256–2261
79. Brinker CJ, Scherer GW (1989) Sol-gel science. Academic, New York80. Murakami Y, Matsumoto T, Takasu Y (1999) Salt catalysts containing basic anions and
acidic cations for the sol–gel process of titanium alkoxide: controlling the kinetics anddimensionality of the resultant titanium oxide. J Phys Chem B 103:1836–1840
81. Israelachvili JN, Mitchell DJ, Ninham BW (1976) Theory of self-assembly of hydrocarbonamphiphiles into micelles and bilayers. J Chem Soc Faraday Trans II 72:1525–1568
82. Nagarajan R (2002) Molecular packing parameter and surfactant self-assembly: the neglectedrole of the surfactant tail. Langmuir 18:31–38
83. Zheng JY, Pang JB, Qiu KY, Wei Y (2001) Synthesis and characterization of mesoporous tita-nia and silica-titania materials by urea templated sol-gel reaction. Microporous MesoporousMater 49:189–195
84. Oliver S, Kuperman A, Coombs N, Lough A, Ozin GA (1995) Lamellar aluminophosphateswith surface patterns that mimic diatom and radiolarian microskeletons. Nature 378:47–50
85. Tanev PT, Pinnavaia TJ (1996) Biomimetic templating of porous lamellar silicas by vesicularsurfactant assemblies. Science 271:1267–1269
86. Yuan ZY, Liu JQ, Peng LM, Su BL (2000) Morphosynthesis of vesicular mesostructuredcalcium phosphate under electron irradiation. Langmuir 18:2450–2452
87. Jantawasu P, Sreethawong T, Chavadej S (2009) Photocatalytic activity of nanocrystallinemesoporous-assembled TiO2 photocatalyst for degradation of methyl orange monoazo dye inaqueous wastewater. Chem Eng J 155:223–233
88. Jantawasu P (2008) Photocatalytic decomposition of methyl orange azo dye using nanos-tructured TiO2 photocatalyst. M.S. thesis, The Petroleum and Petrochemical College,Chulalongkorn University, Thailand
89. Wongkalasin P, Chavadej S, Sreethawong T (2011) Photocatalytic degradation of mixed azodyes in aqueous wastewater using mesoporous-assembled TiO2 nanocrystal synthesized by amodified sol-gel process. Colloid Surf A Physocochem Eng Asp 384:519–528
90. Puangpetch T, Sreethawong T, Yoshikawa S, Chavadej S (2008) Synthesis and photocatalyticactivity in methyl orange degradation of mesoporous-assembled SrTiO3 nanocrystals pre-pared by sol-gel method with the aid of structure-directing surfactant. J Mol Catal A Chem287:70–79
91. Khunrattanaphon P, Chavadej S, Sreethawong T (2011) Synthesis and application of novelmesoporous-assembled SrTixZr1�xO3-based nanocrystal photocatalysts for azo dye degrada-tion. Chem Eng J 170:292–307

Chapter 7Microwave-Assisted Organic PollutantsDegradation
Ackmez Mudhoo
7.1 Water Pollutants and Environmental Concerns
The global environment is under much stress due to fast urbanization,industrialization, and rapid population growth which in turn set a limit in theusage of the limited natural resources. The problems are compounded by drasticchanges that have been taking place in the lifestyle and habits of people. The natureand the magnitude of the environmental problems are ever changing, bringing newchallenges and creating a constant need for developing newer and more appropriatetechnologies helpful in the remediation of polluted strata.
The problems of the environment can be classified as follows and may betraced to be one or more of the following either directly or indirectly: Wastegeneration (sewage, wastewaters, kitchen wastes, industrial solid wastes andeffluents, agricultural wastes, and food wastes) and the use of chemicals for variouspurposes in the form of insecticides, pesticides, herbicides, chemical fertilizers,toxic products, and by-products from chemical industries. Waste generation is aside effect of consumption and anthropogenic production activities and tends toincrease with economic advance. What is of concern is the increased presenceof toxic organic chemicals such as halogen aliphatics, aromatics, polychlorinatedbiphenyls (PCBs) and other organic and inorganic pollutants which may reach air,water, or soil and affect the environment in several ways, ultimately threatening theself-regulating capacity of the biosphere [1, 2]. These pollutants may be present inhigh levels at their respective points of discharge or may remain low or fixed insome chemical form, but be still highly toxic for the receiving bodies as a result ofbioaccumulation up the food chain, wherein their concentrations increase as theypass through the food chain [3, 4].
A. Mudhoo (�)Department of Chemical and Environmental Engineering, Faculty of Engineering,University of Mauritiuse-mail: [email protected]; [email protected]
S.K. Sharma and R. Sanghi (eds.), Advances in Water Treatment and PollutionPrevention, DOI 10.1007/978-94-007-4204-8 7,© Springer ScienceCBusiness Media Dordrecht 2012
177
178 A. Mudhoo
Organic pollutant inputs have increased in recent decades, and the result hasbeen degradation of water quality in many rivers, lakes, and coastal oceans.This degradation shows up in the disruption of natural aquatic ecosystems andthe consequent loss of their component species as well as the amenities thatthese ecosystems once provided to society [5]. The most common impairmentsof surface waters is eutrophication caused by excessive inputs of phosphorus (P)and nitrogen (N), and severe cellular damage and mutation caused to the existingfauna in these waters due to assimilation of toxic contaminants. Impaired watersare defined as those that have been contaminated with organic and/or inorganicpollutants and have thus become unsuitable for designated uses such as drinking,irrigation, industry, recreation, or fishing [5].
7.2 Remediation Approaches
7.2.1 Steps in Pollutant Remediation
There are three main approaches in dealing with contaminated sites. The firststep consists in the identification of the problem, followed by the assessment ofthe nature and degree of the hazard, and finally selecting and implementing thebest choice of remedial action. The need to remediate sites which have beencontaminated with organic (and inorganic pollutants) has led to the development of anumber of (new) technologies that emphasize the degradation, detoxification, and/ordestruction of the organic pollutants [6, 7] rather than the conventional approach ofend of pipe disposal. All the more, rapid developments in understanding activatedsludge processes and wastewater remediation have paved the way in research andapplied research for the exploitation and design of different strategies for studyingthe degradation of such pollutants.
7.2.2 Conventional Technologies Versus Bioremediation
The remediation technologies for organic pollutants may be broadly lumped intwo major categories. These are conventional remediation and bioremediationoptions. Some of these conventional techniques for organic pollutants remediationare advanced oxidation processes [8], electrokinetic remediation [9], UV-assistedphotocatalytic degradation, adsorption on activated carbon, coagulation/flocculationprocesses; nanofiltration membrane technology [10], high-performance catalytic airoxidation, ozonation, and photoelectrocatalysis [11]. On the other hand, bioreme-diation techniques which are more cost effective as compared to the conventionaltreatment options embrace the concept of Green Technology and EnvironmentalSustainability. Bioremediation is in principle the engineered use of microorganisms

7 Microwave-Assisted Organic Pollutants Degradation 179
Table 7.1 Selected studies on the bioremediation of organic pollutants
Pollutant(s) Bioremediation technique Reference
Phenanthrene (PHEN), and1,2,4,5-tetrachlorobenzene (TeCB)
Biosorption by Escherichia coli [17]
Pentachlorophenol (PCP) Biosorption by Aspergillus niger biomass [18]Anionic reactive dyes were C.I.
Reactive Black 8, C.I. ReactiveBrown 9, C.I. Reactive Green 19,C.I. Reactive Blue 38, and C.I.Reactive Blue 3
Biosorption by Aspergillus niger,Aspergillus japonica, Rhizopusnigricans, Rhizopus arrhizus, andSaccharomyces cerevisiae biomass
[19]
Direct brown MR (DBMR) azo dye inthe textile industry
Biodegradation of dye by Acinetobactercalcoaceticus NCIM 2890
[20]
Methyl red, orange II, G-Red(FN-3G), basic cationic, and basicfuchsin
Biodegradation by Chlorella vulgaris,Lyngbya lagerlerimi, Nostoc lincki,Oscillatoria rubescens, Elkatothrixviridis, and Volvox aureus
[21]
Phenanthrene (Phen), anthracene(Anth), and benzo(a)pyrene (BaP)
Vermicomposting using Eisenia fetida [22]
4-Nonylphenol (known endocrinedisruptor)
Degradation during biosolids composting [23]
Fungicides and triazoles Dissipation of pesticides duringcomposting
[24]
Pirimiphos-methyl Degradation of pollutant duringcomposting of greenhouse tomatoplant residues
[25]
Simazine, terbuthylazine, cyanazineand prometryn
Degradation of pollutant in soil amendedwith olive cake, compost andvermicompost of olive cake
[26]
Agricultural pesticides2,4-dichlorophenoxyacetic acid(2,4-D) and isoproturon
Biodegradation potential during anaerobicdigestion process
[27]
Isoproturon and 2,4-D Biodegradability of herbicides insequencing batch reactors (anaerobicsystems)
[28]
Pentachlorophenol and methanol Anaerobic biological treatment ofpentachlorophenol and methanol in ahorizontal-flow anaerobicimmobilized biomass (HAIB) reactor
[29]
and microbial processes to degrade and detoxify environmental contaminants[12, 13]. Vidali [14] has proposed the following classification of microorgan-isms involved in bioremediation processes: Aerobic microbes, anaerobic bacteria,ligninolytic fungi, and methylotrophs. Some of the biological remediation technolo-gies/techniques such as biosorption, bioaugmentation, biostimulation, biopulping,biodeterioration, biobleaching, bioaccumulation, biotransformation, bioattenuation,vermicomposting and composting [15] anaerobic digestion biotechnology andphytoremediation are being actively studied [16] for the degradation of organiccontaminants for pollutant media remediation. Table 7.1 lists some recent studieswhich have employed bioremediation options for the degradation/detoxification oforganic pollutants.

180 A. Mudhoo
7.3 Novel Green Remediation Options
Green Technology, emanating directly from Green Chemistry may be described asthe utilization of a set of principles that reduces or eliminates the use or generationof hazardous substances in the design, manufacture, and application of chemicalproducts [30]. In practice, Green Chemistry is taken to cover a broader range ofissues than the definition itself may imply.
7.3.1 Green Technology Principles
Anastas and Warner [31] have developed “The Twelve Principles of Green Chem-istry” that serve as valuable benchmark guidelines for practicing chemists, re-searchers, and engineers in developing and assessing how green a synthesis,compound, process, or technology is. These principles are related to the conceptsof prevention, atom economy, less hazardous chemical syntheses, designing saferchemicals, safer solvents and auxiliaries, design for energy efficiency, use ofrenewable feedstocks, reduce derivatives, catalysis, design for degradation, real-time analysis for pollution prevention, and inherently safer chemistry for accidentprevention. Green chemistry is an essential part of green engineering. The defi-nitions of green chemistry and green engineering share many commonalities, andthe application of both chemistry and engineering principles is needed to advancethe goals of environmental sustainability [32]. A practical definition of greenengineering proposed by Kirchhoff [32] is the design, commercialization, and use ofprocesses and products that are feasible and economical while minimizing pollutionat the source and risk to human health and the environment. While green chemistryfocuses on the design of chemical products and processes that reduce or eliminatethe use and generation of hazardous substances, it also lays down the ground plan forthe design of the green engineering technologies needed to implement sustainableproducts, processes, and systems [32]. Sonochemistry and microwave irradiation aretwo crucial branches of green chemistry, and their application in organic pollutantremediation is increasingly being studied. While the focus of this chapter shall beon microwave irradiation and pollutants degradation, a succinct outline of the natureand application of sonochemistry is herein made for the nonexpert. Sonochemistryis chemistry that deals with sonic waves on chemical reactions.
7.3.2 A Window on Sonochemistry
Decomposition and removal of anthropogenic organic contaminants from surfacewaters, groundwaters, sediments, wastewaters, and soils are also very importantin environmental remediation. The unique mechanism of ultrasound combines

7 Microwave-Assisted Organic Pollutants Degradation 181
simultaneous oxidation, thermolysis, shear degradation of shock waves, microjetspitting, and enhanced mass transfer and mixing together. As a result, sonication is avery attractive and interesting technique in environmental remediation, especiallyfor decontamination of recalcitrant and hazardous compounds. Cavitation is theformation, growth, and the implosion of bubbles in a liquid by ultrasound. Ultra-sound refers to inaudible sound waves with frequencies in the range of 16 kHz to500 MHz, greater than the upper limit of human hearing. Like any sound wave,ultrasound is propagated via a series of compression and rarefaction waves inducedin the molecules of the medium through which it passes. Compression cycles pushmolecules together, while expansion cycles pull them apart. At sufficiently highpower, the rarefaction cycle may exceed the attractive forces of the molecules of theliquid and cavitation bubbles will form.
According to Feng and Aldrich [33], the likely mechanism of ultrasonic des-orption can be explained by considering the different effects of ultrasound inheterogenous media. First, the high temperatures in localized hot spots enhancethe breaking of physical bonds between the adsorbate (contaminants) and theadsorbent surface. Second, acoustic cavitation produces high-speed microjets andhigh-pressure shock waves that impinge on the surface and erode the adsorbate[34, 35]. Eventually, ultrasound produces acoustic vortex microstreaming within thepores of the solid particles, as well as the solid–liquid interface and this phenomenonarises by the increase in momentum brought about as the liquid absorbs energy fromthe propagating sound waves, even in the absence of cavitation [36]. Ultrasonicationnot only assists the desorption of the contaminants from the soil but also promotesthe formation of the strong oxidant, •OH radical [37]. Ultrasonication can hencedestroy the contaminants through oxidation by free radicals and pyrolysis processes.There are over 100 anthropogenic contaminants that have been studied by sonolyticdegradation [38–40]. Due to limited spaces, only selected studies on the sonolyticdegradation of organic contaminants are summarized in Table 7.2.
The next sections substantiate the essential characteristics of microwave powerand discuss the research and application of microwave irradiation as a greenremediation technique employed for the degradation of a number of organicpollutants including textile dyes, pesticides, herbicides, xenobiotics, PAHs, PCBs,and other persistent organic pollutants for the remediation of contaminated watersand wastewaters.
7.4 Microwave Power: Essentials and Applications
7.4.1 Characteristics of Microwave Power
Microwaves (frequencies of 0.3–300 GHz and wavelengths of 1 m to 1 mm)lie between radio wave frequencies and infrared frequencies in the electromag-netic spectrum. Domestic and industrial microwave ovens generally operate at a

182 A. Mudhoo
Table 7.2 Ultrasound-assisted degradation of contaminants in real and synthetic effluents
Contaminant(s) Degradation conditions Degradation performance ReferencePolycyclic aromatic
hydrocarbons(PAHs) in apetrochemicalindustrywastewater
Ambient conditions(25ıC), increasingsonication time(0–150 min),temperature(30–60ıC),dissolved oxygen(DO, 2–10 mg L�1)and hydrogenperoxide (H2O2,100–2,000 mg L�1)concentrations testedon the removal ofPAHs
Maximum PAH removalswere 80.2%, 91%, 98.5%,and 98% at 25ıC, 60ıC,DO concentration of6 mg L�1 and H2O2
concentration of2,000 mg L�1,respectively, after 150 minsonication
[41]
Sonication alone providesPAH removals varyingbetween 88% and 92%without DO
PAH sonodegradationappeared to bepseudo-first order inPAHs naphthalene (NAP),acenaphthylene (ACL),phenanthrene (PHE),pyrene (PY), and benz[b]fluoranthene
Ethylenediamine-tetraacetic acid(EDTA)–copperwastewater
Electrochemicalperformance ofultrasound integratedwith anelectrodepositiontechnique for thereclamation ofwastewater
The ultrasound Celectrodepositiontechnique couldeffectively remove copper(95.6%, w/w) anddecompose the EDTA(84% COD removal) fromthe wastewater containingEDTA–copper complexcompounds under certainoperational control
[42]
Ammonia-contaminatedsimulatedwastewater fromstrippers atpetroleumrefinery
High ultrasoundfrequency sonicationat 2.4 and 1.7 MHzconducted to studythe effect on removalof ammonia
Sonication could removeammonia with 5%concentration to meet thelocal standard of treatedwastewater within lessthan 2 h for 0.080 Lsolution
[43]
Nitrobenzene (NB)in wastewater
Removal of NB by slagcontaining titaniaunder ultrasoundirradiation
Slag titania removed NBcatalytically undersonication with 18 g L�1
high titania slag, andremoval efficiency of NBcould reach 100% alter140 min under 45 kHzultrasonic irradiation
[44]
(continued)

7 Microwave-Assisted Organic Pollutants Degradation 183
Table 7.2 (continued)
Contaminant(s) Degradation conditions Degradation performance Reference
Phenol in wastewater Ultrasound alone andwith ultrasoundassociated withelectrolysis
With a 20 kHz sonication, theelectrochemical oxidationof phenol in NaCl mediaallows the conversion of75% of initial phenolwithin 10 min oftreatment
[45]
At 500 kHz a conversion of95% of the initial phenolwas obtained within thesame treatment time, andfinal products ofdegradation were aceticand chloroacrylic acids
4-Chlorophenol, 2,4-dichlorophenol,[aryl-2H3]2,4-dichlorophenol,4-chloro-3,5-dimethylphenol,4-fluorophenol,2,4,6-trinitrotoluene,2-amino-4,6-dinitrotolueneand 4-amino-2,6-dinitrotoluene indilute aqueoussolution
Ultrasonicmineralizationstudied as functionsof substrate structureand concentration,bulk phasetemperature, pH, andthe presence ofco-solutes such asdetergents andhumic acids
All substrates were found todegrade sonochemically,as evidenced by therelease of Cl� and NO3
�,respectively
[46]
Chloride release fromchlorophenols wasapproximatelyproportional to substratetotal chlorine content,irrespective of structuraldifferences, and reached80% of the theoreticallimit. Fluoride releasefrom 4-fluorophenol wasca. tenfold lower than thatof chloride from4-chlorophenol
2,4-Dibromophenolin aqueoussolutions
Combined effect ofsonication and MWin a new flow reactor
Complete degradation within6 h, at which time organiccompounds were nolonger detectable
[47]
Degradation of2,4-dibromophenol(0.1 g L–1 in water)by Fenton’s reagent
Even if no Fenton’s reagentwas added, about 50% of2,4-dibromophenol wasdegraded after 3 hirradiation
frequency of 2.45 GHz corresponding to a wavelength of 12.2 cm and energy of1.02 � 10�5 eV [48]. Microwaves can be reflected, transmitted, and/or absorbed.The absorbed MW energy is converted into heat within the material, resulting in anincrease in temperature. Gases, liquids, and solids can interact with microwaves andbe heated. Under certain conditions, gases can be excited by microwaves to formplasmas that also can be useful for processing.

184 A. Mudhoo
An important characteristic of microwave heating is the phenomenon of“hotspot” formation, whereby regions of very high temperature form due tononuniform heating [49]. This thermal instability arises because of the nonlineardependence of the electromagnetic and thermal properties of the material ontemperature [50]. The formation of standing waves within the microwave cavityresults in some regions being exposed to higher energy than others. This resultsin an increased rate of heating in these higher energy areas due to the nonlineardependence. Cavity design is an important factor in the control, or the utilization ofthis hotspot phenomenon.
Their absorption may be increased by adding absorbing constituents (e.g.,silicon carbide, carbon, and organic binders), altering their microstructures anddefect structures, changing their form (e.g., bulk vs. powder), or changing thefrequency of the incident radiation. The latter often is not feasible due to therelative unavailability of equipment. Fortunately, absorption of poorly absorbingceramics also can be improved by increasing their temperatures. This phenomenonhas led to the development of hybrid heating, where the ceramics are heated initiallyusing conventional methods. Hybrid heating can be achieved either by using anindependent heat source, such as a gas or electric furnace in combination withmicrowaves, or through the use of an external susceptor that couples with themicrowaves. In the latter, the material is exposed simultaneously to microwaveenergy and radiant conventional heat produced by the susceptor. Microwaves canbe absorbed by ceramics either through polarization or conduction processes.Polarization involves short-range displacement of charge through formation androtation of electric dipoles (or magnetic dipoles, if present). Conduction requireslong-range (compared to rotation) transport of charge. Both processes give rise toabsorption losses in certain frequency ranges.
7.4.2 Applications and Merits of Microwave Irradiation
Microwave energy has been widely used in several domestic, industrial, and medicalapplications such as food sterilization, organic/inorganic syntheses, polymerization,dehydration, analyses and extraction, and biological destruction [51]. The potentialapplications of microwave energy as remedial alternatives for various types ofwastes and diverse contamination of soils, sludge, or wastewaters have also beengrowing field of research during the last decade [52]. The application of microwaveenergy has proven to be superior to the use of conventional heating on acceleratingrates of biochemical/chemical reactions, improving yields, selectively activatingor suppressing reaction pathways [51], allowing for greater control of the heat-ing or drying process and reducing equipment size and wastes, and environmentalremediation.

7 Microwave-Assisted Organic Pollutants Degradation 185
7.5 Organic Contaminants in Water and Wastewaters
Wastewaters are waterborne solids and liquids discharged into sewers that representthe wastes of community life [53] and a variety of industrial and manufacturingprocesses. Wastewater includes dissolved and suspended organic solids, which arenormally biologically decomposable to some extent.
7.5.1 Wastewater Categories
Two general categories of wastewaters, not entirely separable, are recognized:domestic and industrial. Wastewater treatment is a process in which the solidsand contaminants in wastewater are partially removed and partially changed bydecomposition from highly complex, putrescible, organic solids to mineral orrelatively stable organic solids [53]. Wastewater generally contains a high load ofoxygen-demanding wastes, pathogenic or disease-causing agents, organic materi-als, nutrients that stimulate plant growth, inorganic chemicals, and minerals andsediments. It may also contain toxic compounds. The most commonly detectedorganic pollutants in wastewater are dyes, pesticides, herbicides, xenobiotics,pharmaceuticals and personal care products, PAHs, PCBs, and other persistentorganic pollutants. These are discussed in more detail in the following sections.
7.5.2 Organic Pollutants Discharges
Chemical inputs of organic pollutants to rivers, lakes, and oceans originate eitherfrom point or nonpoint sources. Point sources include effluent pipes from municipalsewage treatment plants and factories. Pollutant discharges from such sources tendto be continuous, with little variability over time, and often they can be monitoredby measuring discharge [5] and chemical concentrations periodically at a singleplace. Consequently, point sources are relatively simple to monitor and regulate,and can often be controlled by treatment at the source. Nonpoint inputs can alsobe continuous, but are more often intermittent and linked to seasonal agriculturalactivity such as planting and plowing or irregular events such as heavy rains or majorconstruction. Nonpoint inputs often arise from various activities across extensivestretches of the landscape, and materials enter receiving waters as overland flow,underground seepage, or through the atmosphere. Consequently, nonpoint sourcesare difficult to measure and control [5]. Data in Table 7.3 and the discussionsbelow trace down the main categories of organic pollutants detected in water andwastewaters.

186 A. Mudhoo
Table 7.3 Organic pollutants detected in contaminated waters and wastewaters
Pollutant(s) Contaminated media Reference
Textile dye Acid Blue 25 Textile wastewater [54]Methylene blue, red basic dye,
blue basic dye,nonylphenol, andoctylphenol
Synthetic contaminated aqueoussolutions
[55]
Vat Green 01 Textile wastewater [56]C.I. Acid Red 14 (AR14) Synthetic solutions in batch mode
testing[57]
Malachite green Synthetic aqueous solutions [58]PAHs Urban lakes, water, sediment and soil in
drinking water resource, sedimentsin marshes, river water, subsurfacewater samples
[59–61]
PCBs, polybrominateddiphenyl ethers (PBDEs)
Water and sediments from estuaries,municipal sewage treatment planteffluents, river water, subsurfacewater samples, air and seawater,soils
[62–65]
Pharmaceuticals and personalcare products (PPCPs)
River waters, sewage treatment planteffluents
[66]
Dioxins and furans (PCDD/Fs) Soils/water in natural park in urban sitesOrganochlorine and
organophosphate pesticidesRiver waters, sediments in rivers, soils,
ground water[67–69]
Dichlorodiphenyltrichloroethane(DDTs)
Wastewater [64]
Estrogens, progestogens, andpolar pesticides
Sewage treatment plant effluents [66]
Agricultural pesticides andherbicides (atrazine,alachlor, trifluralin,metazachlor, metamitronand sulcotrione)
Surface water and groundwater,rainwater
[70–76]
Pharmaceuticals, personal careproducts, antibiotics
Wastewater streams, surface waters [77–82]
Hormones Wastewater streams, surface waters [83–87]Petroleums Wastewater streams, surface waters [88–91]
7.5.2.1 Dyes
Wastewaters from the textile industry is a complex mixture of many polluting sub-stances ranging from residual dyestuffs to heavy metals associated with the dyeingand printing process [92, 93]. More than 110,000 commercially available dyes areknown [94]. Furthermore, the color and chemical composition of textile effluents areusually subject to daily and seasonal variations dictated by the production routine.The presence of even trace concentrations of dyes in effluent is highly visible andundesirable [95]. The release of colored wastewater in the ecosystem is a remarkable

7 Microwave-Assisted Organic Pollutants Degradation 187
source of esthetic pollution, eutrophication, and disruptions in aquatic life. Dyeeffluent usually contains chemicals, including dye itself, that are toxic, carcinogenic,mutagenic, or teratogenic to various microbiological and fish species [96].
It has been estimated that more than 10% of the total dyestuff used in dyeingprocesses is released into the environment [97]. Azo dyes are the largest group ofdyes used in textile industry [98] constituting 60–70% of all dyestuff produced [99].They have one or more azo groups (R1–NDN–R2) having aromatic rings mostlysubstituted by sulfonate groups. These complex aromatic substituted structuresmake conjugated system and are responsible for intense color, high water solubility,and resistance to degradation of azo dyes under natural conditions [100]. Variouschemical and physical processes such as precipitation, adsorption, air stripping,flocculation, reverse osmosis, and ultrafiltration can be used for color removal fromtextile effluents [101]. However, these techniques are nondestructive, since theyonly transfer the nonbiodegradable matter into sludge, giving rise to new type ofpollution, which needs further treatment [102, 103].
7.5.2.2 Xenobiotics
The term “xenobiotic” has a range of meanings and implications revolving aroundthe chemical industry, its products and by-products [104]. Xenobiotics in the strictsense of the word are defined as man-made molecules, foreign to life, and shouldhave never been encountered by bacterial populations before their introductionby man. Examples are polychlorinated biphenyls (PCBs), PAHs, and variouspesticides. In this respect, a more wide-ranging definition of xenobiotics includes“all compounds that are released in any compartment of the environment by theaction of man and thereby occur in a concentration that is higher than natural” [105].
Many synthetic organic chemicals (e.g., organochlorines, organophosphates,PAHs, and organometals) are of growing environmental concern, because of theirhigh toxicity and high persistence in the environment and in biological systems[106]. Furthermore, the high lipophilicity of many of these xenobiotics greatlyenhances their bioconcentration/biomagnification, thereby posing potential healthhazards on predators at higher trophic levels (including human beings) [106].Persistent xenobiotic compounds have been found in every part of the ocean:from arctic to antarctic, and from intertidal to abyssal [106]. Most xenobioticcompounds occur only at very low concentrations in the environment, and theirthreats to marine life and public health may be detected. However, sublethal effectsof these compounds over long-term exposure may cause significant damage tomarine populations through the impairment in reproduction functions of animalswhile others may be carcinogenic, mutagenic, or teratogenic [106].
PAHs are a class of organic compounds that have accumulated in the naturalenvironment mainly as a result of anthropogenic activities such as the combustionof fossil fuels [107, 108]. The increasing use of fossil fuels and their combustionproducts by human beings during the past two centuries raises several questionsabout PAHs hazards for living organisms. Since most PAHs are highly hydrophobic

188 A. Mudhoo
[109], their pathways of transfer through geological and biological media are notwell understood. Also, explicit correlations between PAH sources and carcinogeniceffects have been reported only for intense exposure to PAHs. Polychlorinateddibenzodioxins and polychlorinated dibenzofurans (dioxins) consist of 210 differentcompounds that have similar chemical properties [110]. This class of compoundsis persistent, toxic, and bioaccumulative. They are generated as by-products duringincomplete combustion of chlorine containing wastes such as municipal solid waste,sewage sludge, and hospital and hazardous wastes [110]. PCBs were widely usedin the past and now contaminate many industrial and natural areas.
According to the United States Environmental Protection Agency, the term“pesticide” is a broad nonspecific term covering a large number of substancesincluding, insecticides, herbicides, and fungicides, “though often misunderstoodto refer only to insecticides.” Chemical pesticides have consistently demonstratedtheir merit by increasing the global agricultural productivity [111], reducing insect-borne, endemic diseases and protecting plantations, forests, and harvested wood[112]. As of date, pesticides are more valued in developing countries, particularlythose in tropical regions seeking to enter the global economy by providing off-season fresh fruits and vegetables to countries in more temperate climates [111].However, the continuous use of pesticides has caused severe irreversible damageto the environment, caused human ill-health, negatively impacted on agriculturalproduction, and reduced agricultural sustainability [113].
7.5.2.3 Pharmaceuticals
The term “pharmaceutical” covers a wide-ranging class of compounds with substan-tial variability in structures, function, behavior, and activity [114]. Pharmaceuticalcompounds and their metabolites are emerging contaminants that have been fre-quently detected at low levels in environmental samples [110, 115], biota, andhuman tissues. The persistence of pharmaceutical contaminants in the environmenthas been attributed to human consumption of drugs (not including natural andsynthetic hormones) and subsequent discharges from sewage treatment plants, aswell as veterinary use of drugs, and nonpoint discharges from agricultural runoff[15]. The use of some pesticides may have experienced a fall in recent years asnew laws have been introduced to minimize their use [116], but even if they shouldprove problematic, pharmaceuticals are unlikely to be restricted in this way, dueto their beneficial human health effects and economic importance [117]. Indeed,their use is expected to grow with the increasing average age of the population[118], and consequently, they and their metabolites are much likely to be detected inthe environment [119]. Drugs may be degraded during sewage treatment processes[117] but many pharmaceuticals are not thermally stable [120] and so may beexpected to break down during processes such as composting due to microbial heatgenerated during the process.
Medicinal compounds are generally excreted after being partially or completelyconverted to water-soluble metabolites [121, 122] but a significant amount of theoriginal substance may also be excreted unchanged [123]. This has previously

7 Microwave-Assisted Organic Pollutants Degradation 189
been regarded as inconsequential because of the dilution received in the seweragesystem. However, recent studies on pharmaceutical residues (primarily in Germany)have demonstrated that elimination of high to medium polar pharmaceuticals inmunicipal STPs is often incomplete, ranging between 60% and 90% [124, 125].One of the most comprehensive studies of this type was performed by Kolpin et al.[115] who chronicled the detection of over 95 organic chemicals in US streamsand rivers.
7.5.2.4 Hormones
During recent years, estrogenic compounds such as nonylphenol, octylphenol,nonylphenol polyethoxylates, dihydrofolliculin (ˇ-estradiol), estrone, estriol, andethynylestradiol (˛-estradiol) have increasingly been found in treated domesticwastewater effluents [126]. These estrogenic compounds are of great concernbecause of their potential in altering the normal endocrine function and physio-logical status of animals and humans [127]. Natural estrogens line ˇ-estradiol and˛-estradiol are excreted by both humans and animals [128]. Many of these knownestrogenic compounds end up in the aquatic environment via sewage, the dischargeof municipal and/or industrial effluents, and agricultural runoff. Chang et al. [129]monitored five estrogens, nine androgens, nine progestogens, six glucocorticoids,and one mineralocorticoid in samples from urban rivers. Androgens were thedominant steroids detected (total concentrations up to 480 ng/L), followed byglucocorticoids (up to 52 ng/L), progestogens (up to 50 ng/L), and estrogens (up to9.8 ng/L). The summed concentration for each class of detected hormones in the 13discharging site samples was higher than that in river samples, up to 1,887 ng/L forandrogens, 390 ng/L for glucocorticoids, 75 ng/L for progestogens, and 25 ng/L forestrogens. Chang et al. [129] found that 62.7% of the mean summed hormones werecontributed by freshly discharged untreated sewage, 29.4% by treated sewage and/ornaturally attenuated untreated sewage, and 7.9% by an unknown source, possiblypharmaceutical manufacturing plants.
7.5.2.5 Petroleums
Total petroleum hydrocarbons (TPH) describe a broad family of several hundredchemical compounds that originally come from crude oil. Crude oils can varydepending on their chemical constituents, and so can the petroleum products thatare made from crude oils. Because modern society uses so many petroleum-basedproducts (gasoline, kerosene, fuel oil, mineral oil, and asphalt), contamination of theenvironment by them is potentially widespread. Contamination caused by petroleumproducts contains a variety of these hydrocarbons. Because they are found in acomplex mixture, it is not usually practical to measure each one individually andtreat them separately with complete remediation.

190 A. Mudhoo
7.6 Microwave-Assisted Degradation Processesfor Organic Pollutants
Microwave power has been applied widely in the remediation of contaminatedsoils, treatment of wastes, oil and water separation, reduction of nitrogen oxidesand sulfur dioxide, polymer synthesis, organic reactions, and regeneration ofactivated carbon. Up to now, two main pathways of using microwave energy as anemerging technology for the treatment of organic pollutants’ contaminated watersand wastewaters have been adopted. The first one is that the contaminants areadsorbed on the surfaces of carbonaceous material or soil from aqueous media,which then is irradiated by microwave and the adsorbed pollutants are decomposedsimultaneously. The second approach is that the effluent is irradiated directly bymicrowave and contaminants are degraded in the aqueous phase. The treatment ofindustrial and municipal wastewaters is always among the most severe obstaclesfaced by all countries.
Research carried out so far in this respect and with regard to the applicabilityof microwave irradiation has shown that microwave technology may be effectivein treating wastewaters at the various stages of the treatment process, and henceimproving the degradation of a variety of organic pollutants. A survey of theliterature shows that there are three major types of research areas in the use ofmicrowave irradiation for the degradation of organic pollutants. These are stan-dalone microwave-assisted degradation processes, combined microwave-assisteddegradation processes, and microwave-assisted catalytic degradation processes. Instand-alone processes, the microwave irradiation is the only kind of treatmentconditions imposed on the contaminants. In the combined process (hybrid process),microwave irradiation is coupled or performed in the presence of other degradationprocesses like ozonation, electrokinetic remediation, advanced oxidation, ultra-violet illumination, or sonolysis. In the microwave-assisted catalytic degradationprocesses, the contaminants are degraded in the presence of a catalyst, eitherhetereogeneous or homogeneous. Most of the studies in this category have reportedthe use of hetereogeneous catalysts coupled with photocatalysis. Table 7.4 presentsthe main results of a representative set of studies on the microwave-assisteddegradation of organic contaminants in wastewaters, synthetic effluents, and othersurface waters.
Other researchers have also reported some salient findings and inferences on theadvantages and possible mechanisms involved in the use of microwave irradiationfor organic pollutant degradation. Liu et al. [135, 136] concluded that adoptingmicrowave irradiation resulted in rapid degradation rates, low cost, no residualintermediates, and no secondary pollution in actual application. In their work,Zhihui et al. [137] analyzed the synergistic effects of several microwave-assistedadvanced oxidation processes (MW/AOPs) for the degradation of 4-chlorophenol(4-CP). Their results showed that the synergistic effects between MW and H2O2,UV/H2O2, TiO2 photocatalytic oxidation (PCO) resulted in a higher degradationefficiency for 4-CP. All the more, Park et al. [138] found that the photocatalytic

7 Microwave-Assisted Organic Pollutants Degradation 191
Tab
le7.
4C
ompa
riso
nof
mic
row
ave-
assi
sted
degr
adat
ion
proc
esse
sfo
ror
gani
cco
ntam
inan
ts
Con
tam
inan
t(s)
Test
med
iaD
egra
dati
onco
ndit
ions
Deg
rada
tion
perf
orm
ance
Ref
eren
ce
2,4-
Dic
hlor
ophe
noxy
-ac
etic
acid
Agr
icul
tura
llan
dC
oupl
edph
otoc
atal
ytic
/mic
row
ave
met
hod
inan
aque
ous
TiO
2
disp
ersi
on
Rat
esof
degr
adat
ion
wer
e2
�10�
3m
Mm
in�
1
(pho
toca
taly
tic/
mic
row
ave
met
hod
(PD
/MW
))an
d1.
1�1
0�3
mM
min
�1
(pho
toca
taly
tic
met
hod
(PD
)).T
heco
uple
dPD
/MW
met
hod
was
abou
tte
nti
mes
mor
eef
ficie
ntth
anth
ePD
met
hod
alon
e
[130
]
Aqu
eous
disp
ersi
onw
asco
ntai
ned
ina
high
-pre
ssur
eTe
flon
batc
h(T
B)
reac
tor
that
also
inte
grat
eda
doub
legl
ass
cyli
ndri
calp
lasm
ala
mp
(DG
CPL
)as
the
sour
ceof
the
UV
-Vis
radi
atio
nM
ethy
lene
blue
Aqu
eous
susp
ensi
ons
Phot
ocat
alyt
icde
grad
atio
nw
ith
mic
row
ave
pow
erfr
omel
ectr
odel
ess
disc
harg
ela
mps
(ED
Ls)
inT
iO2
susp
ensi
ons
45%
min
eral
izat
ion
ofdy
eac
hiev
edaf
ter
15m
inof
irra
diat
ion
[131
]
Phen
olA
queo
usso
luti
ons
and
batc
hm
ode
anal
yses
Phot
ocat
alyt
icde
grad
atio
nin
the
pres
ence
ofm
icro
wav
e-as
sist
edpr
epar
edzi
ncox
ide
15m
inm
icro
wav
e-ir
radi
ated
sam
ple
show
s88
%ph
enol
(0.6
gL
�1
dose
)de
grad
atio
nat
pH5.
0an
d4
hre
acti
onti
me
unde
rsu
nlig
ht.Z
inc
oxid
esa
mpl
espr
epar
edby
mic
row
ave
irra
diat
ion
and
calc
ined
at30
0ıC
exhi
bite
dhi
ghes
tsur
face
area
,aci
dsi
tes
and
low
estc
ryst
alli
tesi
zes
and
show
edhi
ghes
tact
ivit
yto
war
dph
otoc
atal
ytic
oxid
atio
nof
phen
ol
[132
]
(con
tinu
ed)

192 A. Mudhoo
Tab
le7.
4(c
onti
nued
)
Con
tam
inan
t(s)
Test
med
iaD
egra
dati
onco
ndit
ions
Deg
rada
tion
perf
orm
ance
Ref
eren
ce
Phen
olA
queo
usso
luti
ons
wit
hco
ntin
uous
bubb
ling
ofai
rth
roug
hth
eli
quid
phas
e
Mic
row
ave-
enha
nced
cata
lyti
cde
grad
atio
n(M
EC
D)
ofph
enol
wer
ein
vest
igat
edw
ith
mix
-val
ence
dni
ckel
oxid
eca
taly
st,
NiO
x,pr
epar
edfr
omni
ckel
nitr
ate
aque
ous
solu
tion
thro
ugh
apr
ecip
itat
ion
wit
hso
dium
hydr
oxid
ean
dan
oxid
atio
nby
sodi
umhy
poch
lori
te
The
intr
oduc
tion
ofm
icro
wav
eir
radi
atio
nco
uld
grea
tly
shor
ten
the
tim
eof
phen
olde
grad
atio
n
[133
]
4-C
hlor
ophe
nol
(4-C
P)A
queo
usso
luti
ons
wit
hco
ntin
uous
bubb
ling
ofai
rth
roug
hth
eli
quid
phas
e
Mic
row
ave-
enha
nce
cata
lyti
cde
grad
atio
n(M
EC
D)
wit
hm
ix-v
alen
ced
nick
elox
ide
cata
lyst
,N
iOx,
prep
ared
from
nick
elni
trat
eaq
ueou
sso
luti
onth
roug
ha
prec
ipit
atio
nw
ith
sodi
umhy
drox
ide
and
anox
idat
ion
byso
dium
hypo
chlo
rite
4-C
Pw
asde
grad
edco
mpl
etel
yby
ME
CD
met
hod
wit
hin
20m
inun
der
pH7,
TD
40ı
Can
dC
D20
0g
dm�
3ov
erca
taly
st
[134
]
7 Microwave-Assisted Organic Pollutants Degradation 193
degradation of bromothymol blue increased with the TiO2 particle dosages andmicrowave intensity in a microwave/UV/TiO2/ozone/H2O2 hybrid process system.When an auxiliary oxidant such as ozone or hydrogen peroxide was added to themicrowave-assisted photocatalysis, however, a synergetic effect that enhanced thereaction rate considerably was equally observed.
With respect to the proposed mechanisms of microwave-mediated contaminantdegradation, Horikoshi et al. [139] have indicated that a greater efficacy ofaqueous TiO2 dispersions using an integrated microwave/UV-illumination techniqueappeared to be the result of enhanced formation of reactive oxygen species (•OHradicals), and due to the activity of bulk water or the TiO2 particle surface. Intheir work on the microwave-assisted photocatalysis of atrazine on TiO2 nanotubes,Gao et al. [140] indicated that atrazine had been completely degraded in 5 min andthe mineralization efficiency was up to 98.5% in 20 min. Gao et al. [140] equallyattributed this enhanced degradation performance to the intense UV radiation gen-erated by electrodeless discharge lamps under microwave irradiation, the increasednumber of •OH, additional defect sites on TiO2 under the irradiation of microwave,and larger specific surface area of TiO2 nanotubes which could adsorb more organicsubstances to degrade than TiO2 nanoparticles.
7.7 Conclusions
This chapter has been synthesized after over 400 research papers were read throughand scrutinized. The first sections of this chapter have discussed the environmentalissues and concerns that are occasioned in a cascade of impacts through the con-tamination of water bodies and wastewaters by a wide variety of organic pollutants(xenobiotics, hormones, and petroleums). The subsequent sections have presentedthe findings of several research studies on the application of microwave irradiation inassisting the degradation and detoxification of a number of these organic pollutantsin contaminated waters. The major inferences come out to be that microwave-assisted degradation of organic pollutants seems to achieve a relatively cleaner,faster, and almost complete degradation of many organic pollutants. In this regard,microwave power demonstrates an initial promising momentum for further appliedresearch in upscaling the application of microwave power for organic pollutantremediation.
Acknowledgements The author expresses his gratitude to all the researchers whose valuabledata have been of significance to this chapter, and is also grateful to other colleagues for theirconstructive criticisms and suggestions. Kind regards are also due to the editors, Prof. S.K. Sharmaand Dr. R. Sanghi, for granting the opportunity to contribute a chapter in this comprehensive bookon green technology and wastewater remediation.

194 A. Mudhoo
References
1. Prasad MNV, Freitas H, Fraenzle S, Wuenschmann S, Markert B (2010) Knowledge explosionin phytotechnologies for environmental solutions. Environ Pollut 158:18–23
2. Beltrame MO, De Marco SG, Marcovecchio JE (2010) Effects of zinc on molting and bodyweight of the estuarine crab Neohelice granulata (Brachyura: Varunidae). Sci Total Environ408:531–536
3. Kelly BC, Ikonomou MG, Blair JD, Morin AE, Gobas FAPC (2007) Food web–specificbiomagnification of persistent organic pollutants. Science 317:236–239
4. Takeuchi I, Miyoshi N, Mizukawa K, Takada H, Ikemoto T, Omori K, Tsuchiya K (2009)Biomagnification profiles of polycyclic aromatic hydrocarbons, alkylphenols and polychlori-nated biphenyls in Tokyo Bay elucidated by •13C and •15N isotope ratios as guides to trophicweb structure. Mar Pollut Bull 58:663–671
5. Carpenter S, Caraco NF, Correll DL, Howarth RW, Sharpley AN, Smith VH (1998) Nonpointpollution of surface waters with phosphorus and nitrogen. Issue Ecol 3:1–12
6. Kulkarni PS, Crespo JG, Afonso CAM (2008) Dioxins sources and current remediationtechnologies — a review. Environ Int 34:139–153
7. Busca G, Berardinelli S, Resini C, Arrighi L (2008) Technologies for the removal of phenolfrom fluid streams: a short review of recent developments. J Hazard Mater 160:265–288
8. Mascolo G, Ciannarella R, Balest L, Lopez A (2008) Effectiveness of UV–based advancedoxidation processes for the remediation of hydrocarbon pollution in the groundwater: alaboratory investigation. J Hazard Mater 152:1138–1145
9. Wang JY, Huang XJ, Kao JCM, Stabnikova O (2007) Simultaneous removal of organiccontaminants and heavy metals from kaolin using an upward electrokinetic soil remediationprocess. J Hazard Mater 144:292–299
10. Kim JH, Park PK, Lee CH, Kwon HH (2008) Surface modification of nanofiltrationmembranes to improve the removal of organic micro–pollutants (EDCs and PhACs) indrinking water treatment: graft polymerization and cross–linking followed by functionalgroup substitution. J Membr Sci 321:190–198
11. Nissen S, Alexander BD, Dawood I et al (2009) Remediation of a chlorinated aromatichydrocarbon in water by photoelectrocatalysis. Environ Pollut 157:72–76
12. Margesin R, Hammerle M, Tscherko D (2007) Microbial activity and community compositionduring bioremediation of diesel–Oil–contaminated soil: effects of hydrocarbon concentration,fertilizers, and incubation. Microb Ecol 53:259–269
13. Zhao B, Poh CL (2008) Insights into environmental bioremediation by microorganismsthrough functional genomics and proteomics. Proteomics 8:874–881
14. Vidali M (2001) Bioremediation. An overview. Pure Appl Chem 73:1163–117215. Mudhoo A, Mohee R (2010) Composting as a bioremediation technique for hazardous
organic contaminants. In: Sharma SK, Mudhoo A (eds) Green chemistry for environmentalsustainability. Taylor & Francis, Boca Raton, pp 215–247
16. Whiteley CG, Lee D-J (2006) Enzyme technology and biological remediation. EnzymeMicrob Technol 38:291–316
17. Xiao L, Qu X, Zhu D (2007) Biosorption of nonpolar hydrophobic organic compoundsto Escherichia coli facilitated by metal and proton surface binding. Environ Sci Technol41:2750–2755
18. Mathialagan T, Viraraghavan T (2009) Biosorption of pentachlorophenol from aqueoussolutions by a fungal biomass. Bioresour Technol 100:549–558
19. Kumari K, Abraham TE (2007) Biosorption of anionic textile dyes by nonviable biomass offungi and yeast. Bioresour Technol 98:1704–1710
20. Ghodake G, Jadhav S, Dawkar V, Govindwar S (2009) Biodegradation of diazo dye Directbrown MR by Acinetobacter calcoaceticus NCIM 2890. Int Biodeterior Biodegrad 63:433–439

7 Microwave-Assisted Organic Pollutants Degradation 195
21. El-Sheekh MM, Gharieb MM, Abou-El-Souod GW (2009) Biodegradation of dyes by somegreen algae and cyanobacteria. Int Biodeterior Biodegrad 63:699–704
22. Contreras-Ramos SM, Alvarez-Bernal D, Dendooven L (2009) Characteristics of earthworms(Eisenia fetida) in PAHs contaminated soil amended with sewage sludge or vermicompost.Appl Soil Ecol 41:269–276
23. Das KC, Xia K (2008) Transformation of 4–nonylphenol isomers during biosolids compost-ing. Chemosphere 70:761–768
24. Kupper T, Bucheli TD, Brandli RC, Ortelli D, Edder P (2008) Dissipation of pesticides duringcomposting and anaerobic digestion of source–separated organic waste at full–scale plants.Bioresour Technol 99:7988–7994
25. Ghaly AE, Alkoaik F, Snow A (2007) Degradation of pirimiphos–methyl during thermophiliccomposting of greenhouse tomato plant residues. Can Biosyst Eng 49:6.1–6.11
26. Delgado-Moreno L, Pena A (2009) Compost and vermicompost of olive cake to bioremediatetriazines–contaminated soil. Sci Total Environ 407:1489–1495
27. Elefsiniotis P, Li W (2008) Biodegradation behavior of agricultural pesticides in anaerobicbatch reactors. J Environ Sci Health B 43:172–178
28. Celis E, Elefsiniotis P, Singhal N (2008) Biodegradation of agricultural herbicides insequencing batch reactors under aerobic or anaerobic conditions. Water Res 42:3218–3224
29. Baraldi EA, Damianovic MHRZ, Manfio GP, Foresti E, Vazoller RF (2008) Performanceof a horizontal–flow anaerobic immobilized biomass (HAIB) reactor and dynamics of themicrobial community during degradation of pentachlorophenol (PCP). Anaerobe 14:268–274
30. Kidwai M, Mohan R (2005) Green chemistry: an innovative technology. Found Chem7:269–287
31. Anastas PT, Warner JC (1998) Green chemistry, theory and practice. Oxford University Press,Oxford
32. Kirchhoff MM (2003) Promoting green engineering through green chemistry. Environ SciTechnol 37:5349–5353
33. Feng D, Aldrich C (2000) Sonochemical treatment of simulated soil contaminated with diesel.Adv Environ Res 4:103–112
34. Suslick KS, Casadonte DJ, Green MLH, Thompson ME (1987) Effects of high intensityultrasound on inorganic solids. Ultrasonics 25:56–61
35. Stephanis CG, Hariris JG, Mourmouras DE (1997) Process (mechanism) of erosion of solublebrittle materials caused by cavitation. Ultrason Sonochem 4:269–271
36. Ley SV, Low CMR (1989) Ultrasound in synthesis. Springer, Berlin, Ch. 237. Flores R, Blass G, Dominguez V (2007) Soil remediation by an advanced oxidative method
assisted with ultrasonic energy. J Hazard Mater 140:399–40238. Adewuyi YG (2005) Sonochemistry in environmental remediation. Combinative and hybrid
sonophotochemical oxidation processes for the treatment of pollutants in water. Environ SciTechnol 39:3409–3420
39. Chowdhury P, Viraraghavan T (2009) Sonochemical degradation of chlorinated organiccompounds, phenolic compounds and organic dyes – a review. Sci Total Environ 407:2474–2492
40. Pham TD, Shrestha RA, Virkutyte J, Sillanpaa M (2009) Recent studies in environmentalapplications of ultrasound. Can J Civil Eng 36:1849–1858
41. Sponza DT, Oztekin R (2010) Removals of PAHs and acute toxicity via sonication in apetrochemical industry wastewater. Chem Eng J 162:142–150
42. Chang JH, Ellis AV, Yan CT, Tung CH (2009) The electrochemical phenomena and kineticsof EDTA–copper wastewater reclamation by electrodeposition and ultrasound. Sep PurifTechnol 68:216–221
43. Matouq MA-D, Al-Anber ZA (2007) The application of high frequency ultrasound waves toremove ammonia from simulated industrial wastewater. Ultrason Sonochem 14:393–397
44. Kang Y, Xue X, Yang H, Liu J (2009) Degradation of nitrobenzene in wastewater by slagtitania with ultrasound. J Chin Ceram Soc 37:536–542

196 A. Mudhoo
45. Trabelsi F, Aıt-Lyazidi H, Ratsimba B et al (1996) Oxidation of phenol in wastewater bysonoelectrochemistry. Chem Eng Sci 51:1857–1865
46. Goskonda S, Catallo WJ, Junk T (2004) Sonochemical degradation of aromatic organicpollutants. Waste Manag 22:351–356
47. Cravotto G, Di Carlo S, Curini M, Tumiatti V, Roggero C (2007) A new flow reactor forthe treatment of polluted water with microwave and ultrasound. J Chem Technol Biotechnol82:205–208
48. Jacob J, Chia LHL, Boey FYC (1995) Review—thermal and non–thermal interaction ofmicrowave radiation with materials. J Mater Sci 30:5321–5327
49. Hill JM, Marchant TR (1996) Modelling microwave heating. Appl Math Model 20:3–1550. Reimbert CG, Minzoni AA, Smyth NF (1996) Effect of radiation losses on hotspot formation
and propagation in microwave heating. IMA J Appl Math 57:165–17951. Wu T-N (2008) Environmental perspectives of microwave applications as remedial alterna-
tives: review. Pract Period Hazard Tox Radioact Waste Manag 12:102–11552. Nuchter M, Ondruschka B, Bonrath W, Gum A (2004) Microwave assisted synthesis –
a critical technology overview. Green Chem 6:128–14153. Sonune A, Ghate R (2004) Developments in wastewater treatment methods. Desalination
167:55–6354. Mahmoodi NM, Arami M (2009) Degradation and toxicity reduction of textile wastewater
using immobilized titania nanophotocatalysis. J Photochem Photobiol B Biol 94:20–2455. Kurinobu S, Tsurusaki K, Natui Y, Kimata M, Hasegawa M (2007) Decomposition of
pollutants in wastewater using magnetic photocatalyst particles. J Magn Magn Mater310:1025–1027
56. Schrank SG, Ribeiro N, dos Santos J, Santos Souza D, Santos Souza EE (2007) Decolouri-sation effects of Vat Green 01 textile dye and textile wastewater using H2O2/UV process.J Photochem Photobiol A Chem 186:125–129
57. Aleboyeh A, Daneshvar N, Kasiri MB (2008) Optimization of C.I. Acid Red 14 azo dyeremoval by electrocoagulation batch process with response surface methodology. Chem EngProcess Process Intensif 47:827–832
58. Khattri SD, Singh MK (2009) Removal of malachite green from dye wastewater using neemsawdust by adsorption. J Hazard Mater 167:1089–1094
59. Li J, Cheng H, Zhang G, Qi S, Li X (2009) Polycyclic aromatic hydrocarbon (PAH) depositionto and exchange at the air–water interface of Luhu, an urban lake in Guangzhou, China.Environ Pollut 157:273–279
60. Zhu L, Chen Y, Zhou R (2008) Distribution of polycyclic aromatic hydrocarbons in water,sediment and soil in drinking water resource of Zhejiang Province, China. J Hazard Mater150:308–316
61. Liang Y, Tse MF, Young L, Wong MH (2007) Distribution patterns of polycyclic aromatichydrocarbons (PAHs) in the sediments and fish at Mai Po Marshes Nature Reserve, HongKong. Water Res 41:1303–1311
62. Cailleaud K, Forget-Leray J, Souissi S, Hilde D, LeMenach K, Budzinski H (2007) Seasonalvariations of hydrophobic organic contaminant concentrations in the water–column of theSeine Estuary and their transfer to a planktonic species Eurytemora affinis (Calanoıda,copepoda). Part 1: PCBs and PAHs. Chemosphere 70:270–280
63. Magnusson K, Magnusson M, Ostberg P, Granberg M, Tiselius P (2007) Bioaccumulationof 14C–PCB 101 and 14C–PBDE 99 in the marine planktonic copepod Calanus finmarchicusunder different food regimes. Mar Environ Res 63:67–81
64. Chak S, Kluskens B, Ford D (2010) Determination of polychlorinated biphenyl (PCBs) anddichlorodiphenyltrichloroethane (DDTs) in sediments in Boeng Cheung Ek, Phnom Penh,Cambodia. Asia J Water Environ Pollut 7:3–11
65. Vane CH, Harrison I, Kim AW (2007) Polycyclic aromatic hydrocarbons (PAHs) andpolychlorinated biphenyls (PCBs) in sediments from the Mersey Estuary, U.K. Sci TotalEnviron 374:112–126

7 Microwave-Assisted Organic Pollutants Degradation 197
66. Kuster M, Lopez J, de Alda M, Hernando MD, Petrovic M, Martın-Alonso J, BarceloD (2008) Analysis and occurrence of pharmaceuticals, estrogens, progestogens and polarpesticides in sewage treatment plant effluents, river water and drinking water in the Llobregatriver basin (Barcelona, Spain). J Hydrol 358:112–123
67. Zhou R, Zhu L, Yang K, Chen Y (2006) Distribution of organochlorine pesticides in surfacewater and sediments from Qiantang River, East China. J Hazard Mater 137:68–75
68. Leong KH, Tan LLB, Mustafa AM (2002) Contamination levels of selected organochlorineand organophosphate pesticides in the Selangor River, Malaysia between 2002 and 2003.Chemosphere 66:1153–1159
69. Qiu S, Zhu T, Wang F, Hu J (2008) Air–water Gas exchange of organochlorine pesticides inTaihu Lake, China. Environ Sci Technol 42:1928–1932
70. Iwakuma T, Shiraishi H, Nohara S, Takamura N (1993) Runoff properties and change inconcentrations of agricultural pesticides in a river system during a rice cultivation period.Chemosphere 27:677–691
71. Knee KL, Gossett R, Boehm AB, Paytan A (2010) Caffeine and agricultural pesticideconcentrations in surface water and groundwater on the north shore of Kauai (Hawaii, USA).Mar Pollut Bull 60:1376–1382
72. Schwab AP, Splichal PA, Banks MK (2006) Persistence of atrazine and alachlor in groundwater aquifers and soil. Water Air Soil Pollut 171:203–235
73. Chen J-Z, Meng S-L, Hu G-D, Qu J-H (2009) Bioaccumulation of herbicide atrazine inCarassius auratus. J Agro-Environ Sci 28:1313–1318
74. Navarro S, Vela N, Jose Gimenez M, Navarro G (2004) Persistence of four s–triazineherbicides in river, sea and groundwater samples exposed to sunlight and darkness underlaboratory conditions. Sci Total Environ 329:87–97
75. Scheyer A, Morville S, Mirabel P, Millet M (2007) Pesticides analysed in rainwater inAlsace region (eastern France): comparison between urban and rural sites. Atmos Environ41:7241–7252
76. Mamy L, Barriuso E, Gabrielle B (2005) Environmental fate of herbicides trifluralin,metazachlor, metamitron and sulcotrione compared with that of glyphosate, a substitute broadspectrum herbicide for different glyphosate–resistant crops. Pest Manag Sci 61:905–916
77. Bartelt-Hunt SL, Snow DD, Damon T, Shockley J, Hoagland K (2009) The occurrence ofillicit and therapeutic pharmaceuticals in wastewater effluent and surface waters in Nebraska.Environ Pollut 157:786–791
78. Fatta D, Achilleos A, Nikolaou A, Meric S (2007) Analytical methods for tracing pharma-ceutical residues in water and wastewater. TrAC Trend Anal Chem 26:515–533
79. Shariati FP, Mehrnia MR, Salmasi BM et al (2010) Membrane bioreactor for treatment ofpharmaceutical wastewater containing acetaminophen. Desalination 250:798–800
80. Badawy MI, Wahaab RA, El-Kalliny AS (2009) Fenton–biological treatment processes forthe removal of some pharmaceuticals from industrial wastewater. J Hazard Mater 167:567–574
81. O’Connell DW, Birkinshaw C, O’Dwyer TF (2008) Persistence and fate of highly solublepharmaceutical products in various types of municipal wastewater treatment plants. WITTrans Ecol Environ I:799–807
82. Sim WJ, Lee JW, Oh JE (2010) Occurrence and fate of pharmaceuticals in wastewatertreatment plants and rivers in Korea. Environ Pollut 158:1938–1947
83. Plosz BG, Leknes H, Liltved H, Thomas KV (2010) Diurnal variations in the occurrenceand the fate of hormones and antibiotics in activated sludge wastewater treatment in Oslo,Norway. Sci Total Environ 408:1915–1924
84. Ikehata K, Gamal El-Din M, Snyder SA (2008) Ozonation and advanced oxidation treatmentof emerging organic pollutants in water and wastewater. Ozone: Sci Eng 30:21–26
85. Schlusener MP, Bester K (2008) Behavior of steroid hormones and conjugates duringwastewater treatment – a comparison of three sewage treatment plants. CLEAN – soil, Air.Water 36:25–33

198 A. Mudhoo
86. Pedersen JA, Soliman M, Suffet IL (2005) Human pharmaceuticals, hormones, and personalcare product ingredients in runoff from agricultural fields irrigated with treated wastewater.J Agric Food Chem 53:1625–1632
87. Nghiem LD, Manis A, Soldenhoff K, Schafer AI (2004) Estrogenic hormone removal fromwastewater using NF/RO membranes. J Membr Sci 242:37–45
88. Saien J, Nejati H (2007) Enhanced photocatalytic degradation of pollutants in petroleumrefinery wastewater under mild conditions. J Hazard Mater 148:491–495
89. Antic MP, Jovancicevic B, Vrvic MM, Schwarzbauer J (2006) Petroleum pollutant degrada-tion by surface water microorganisms. Environ Sci Pollut Res 13:320–327
90. El-Naas MH, Al-Zuhair S, Abu Alhaija M (2010) Removal of phenol from petroleum refinerywastewater through adsorption on date–pit activated carbon. Chem Eng J 162:997–1005
91. Meng J-B, Lu S-M, Yang L (2008) A test of emergency treatment of petroleum pollution insource water by powder activated carbon. Ind Water Wastewater 39:22–25
92. Correia VM, Stephenson T, Judd SD (1994) Characterisation of textile wastewaters – a review.Environ Technol 15:917–929
93. Hood EE (2002) From green plants to industrial enzymes. Enzyme Microb Technol 30:279–283
94. Selvam K, Swaminathan K, Keo-Sang C (2003) Microbial decolorization of azo dyes and dyeindustry effluent by Fomes lividus. World J Microbiol Biotechnol 19:591–593
95. Hao OJ, Kim H, Chiang P-C (2000) Decolorization of wastewater. Crit Rev Environ SciTechnol 30:449
96. Daneshvar N, Ashassi-Sorkhabi H, Tizpar A (2003) Decolorization of orange II by electroco-agulation method. Sep Purif Technol 31:153
97. Maguire RJ (1992) Occurrence and persistence of dyes in a Canadian river. Water Sci Technol25:265–270
98. Maximo C, Amorim MTP, Costa-Ferreira M (2003) Biotransformation of industrial reactiveazo dyes by Geotricum sp. CCMI 1019. Enzyme Microb Technol 32:145–151
99. Carliell CM, Barclay SJ, Buckley CA (1995) Microbial decolourizationof a reactive azo dyeunder anaerobic conditions. Water SA 21:61–69
100. Rajaguru P, Kalaiselvi K, Palanivel M, Subburam V (2000) Biodegradation of azo dyes in asequential anaerobiceaerobic system. Appl Microbiol Biotechnol 54:268–273
101. Robinson TF, McMullan G, Marchant R, Nigam P (2001) Remediation of dyes in textileeffluent: a critical review on current treatment technologies with a proposed alternative.Bioresour Technol 77:247
102. Arslan I, Balcioglu IA, Tuhkanen T, Bahnemann D (2000) H2O2/UV–C and Fe2C/H2O2/UV–CversusTiO2/UV–A treatment for reactive dye wastewater. J Environ Eng 126:903
103. Stock N, Peller J, Vinodgopal K, Kamat PV (2000) Combinative sonolysis and photocatalysisfor textile dye degradation. Environ Sci Technol 34:1747
104. Hutzinger O, Veerkamp W (1981) Xenobiotic chemicals with pollution potential. In:Leisinger T, Cook AM, Hiitter R, Naesch J (eds) Microbial degradation of xenobiotics andrecalcitrant compounds. Academic, London, pp 3–45
105. Leisinger T (1983) Microorganisms and xenobiotic compounds. Experientia 39:1183–1220106. Wu RSS (1999) Eutrophication, water borne pathogens and xenobiotic compounds: environ-
mental risks and challenges. Mar Pollut Bull 39:11–22107. Bamforth SM, Singleton I (2005) Bioremediation of polycyclic aromatic hydrocarbons:
current knowledge and future directions. J Chem Technol Biotechnol 80:723–736108. Johnsen AR, Wick LY, Harms H (2005) Principles of microbial PAH–degradation in soil.
Environ Pollut 133:71–84109. Wild SR, Jones KC (1992) Organic chemicals entering agricultural soils in sewage sludges:
screening for their potential to transfer to crop plants and livestock. Sci Total Environ 119:85–119
110. Bhandari A, Xia K (2005) Hazardous organic chemicals in biosolids recycled as soil amend-ments. In: Handbook of environmental chemistry, vol 5/Part F. Springer, Berlin/Hiedelberg,pp 217–239

7 Microwave-Assisted Organic Pollutants Degradation 199
111. Ecobichon DJ (2001) Pesticide use in developing countries. Toxicology 160:27–33112. Ecobichon DJ (2000) Our changing perspectives on beneft and risks of pesticides: a historical
overview. Neurotoxicology 21:211–218113. Wilson C, Tisdell C (2001) Why farmers continue to use pesticides despite environmental,
health and sustainability costs. Ecol Econ 39:449–462114. Derksen JGM, Rijs GBJ, Jongbloed RH (2004) Diffuse pollution of surface water by
pharmaceutical products. Water Sci Technol 49:213–221115. Kolpin DW, Furlong ET, Meyer MT, Thurman EM, Zaugg SD, Barber LB, Buxton HT (2002)
Pharmaceuticals, hormones, and other organic wastewater contaminants in U.S. streams,1999–2000: a national reconnaissance. Environ Sci Technol 36:1202–1211
116. Daughton CG (2002) Environmental stewardship and drugs as pollutants. Lancet 360:1035–1036
117. Jones OAH, Voulvoulis N, Lester JN (2005) Human pharmaceuticals in wastewater treatmentprocesses. Crit Rev Environ Sci Technol 35:401–427
118. Daughton CG, Ternes TA (1999) Pharmaceuticals and personal care products in the environ-ment: agents of subtle change? Environ Health Perspect 107:907–942
119. Sedlak DL, Pinkston KE, Gray JL, Kolodziej EP (2003) Approaches for quantifying theattenuation of wastewater–derived contaminants in the aquatic environment. Chimia 57:567–569
120. Ternes TA (2001) Analytical methods for the determination of pharmaceuticals in aqueousenvironmental samples. Trends Anal Chem 20:419–434
121. Grahame-Smith DG, Aronson JK (2002) Oxford textbook of clinical pharmacology and drugtherapy. Oxford University Press, Oxford
122. Rang HP, Dale M, Ritter JM (1999) Pharmacology. Churchill Livingstone, St. Louis123. Hirsch R, Ternes T, Haberer K, Kratz KL (1999) Occurrence of antibiotics in the aquatic
environment. Sci Total Environ 225:109–118124. Ternes TA (1998) Occurrence of drugs in German sewage treatment plants and rivers. Water
Res 32:3245–3257125. Ternes T (2000) Pharmaceuticals and metabolites as contaminants of the aquatic environment:
an overview. Abstr Pap Am Chem Soc 219:30-ENVR126. Johnson A, Jurgens M (2003) Endocrine active industrial chemicals: release and occurrence
in the environment. Pure Appl Chem 75:1895–1904127. Hoffmann B, Landeck A (1999) Testicular endocrine function, seasonality and semen quality
of the stallion. Anim Reprod Sci 57:89–98128. Meng Z, Chen W, Mulchandani A (2005) Removal of estrogenic pollutants from contami-
nated water using molecularly imprinted polymers. Environ Sci Technol 39:8958–8962129. Chang H, Wan Y, Ghu J (2009) Determination and source apportionment of five classes of
steroid hormones in urban rivers. Environ Sci Technol 43:7691–7698130. Horikoshi S, Hidaka H, Serpone N (2004) Environmental remediation by an integrated
microwave/UV illumination technique: VI. A simple modified domestic microwave ovenintegrating an electrodeless UV–Vis lamp to photodegrade environmental pollutants inaqueous media. J Photochem Photobiol A Chem 161:221–225
131. Hong J, Sun C, Yang SG, Liu YZ (2006) Photocatalytic degradation of methylene blue inTiO2 aqueous suspensions using microwave powered electrodeless discharge lamps. J HazardMater 133:162–166
132. Parida KM, Parija S (2006) Photocatalytic degradation of phenol under solar radiation usingmicrowave irradiated zinc oxide. Solar Energy 80:1048–1054
133. Lai TL, Lee CC, Wu KS, Shu YY, Wang CB (2006) Microwave–enhanced catalyticdegradation of phenol over nickel oxide. Appl Catal B Environ 68:147–153
134. Lai TL, Liu JY, Yong KF, Shu YY, Wang CB (2008) Microwave–enhanced catalyticdegradation of 4–chlorophenol over nickel oxides under low temperature. J Hazard Mater157:496–502

200 A. Mudhoo
135. Liu Y, Yang S, Hong J, Sun C (2007) Low–temperature preparation and microwavephotocatalytic activity study of TiO2–mounted activated carbon. J Hazard Mater 142:208–215
136. Liu X, Zhang Q, Zhang G, Wa R (2008) Application of microwave irradiation in the removalof polychlorinated biphenyls from soil contaminated by capacitor oil. Chemosphere 72:1655–1658
137. Zhihui A, Peng Y, Xiaohua L (2005) Degradation of 4–Chlorophenol by microwave irradia-tion enhanced advanced oxidation processes. Chemosphere 60:824–827
138. Park Sh, Kim SJ, Seo SG, Jung SC (2010) Assessment of microwave/UV/O3 in the photo–catalytic degradation of bromothymol blue in aqueous nano TiO2 particles dispersions.Nanoscale Res Lett 5:1627–1632
139. Horikoshi S, Hidaka S, Serpone N (2002) Environmental remediation by an integratedmicrowave/UV–illumination method. 1. Microwave–assisted degradation of Rhodamine–Bdye in aqueous TiO2 dispersions. Environ Sci Technol 36:1357–1366
140. Gao Z, Yang S, Ta N, Sun C (2007) Microwave assisted rapid and complete degradation ofatrazine using TiO2 nanotube photocatalyst suspensions. J Hazard Mater 145:424–430

Chapter 8Direct Flocculation Process for WastewaterTreatment
Mei Fong Chong
Notations
Ap, Am, As Hamaker constant of the solids, solvent and polymer respectively, Jam Effective monomer size, nmbR Fitting parameter in Eq. 8.10, dimensionlessCL Aggregate structure prefactor, dimensionlessdam Arithmetic mean floc diameter, �mdF Fractal dimension, dimensionlessdi Arithmetic mean diameter of flocs in size class i , �mD Impeller diameter, mDsc Scaling length, nme Elementary charge, CEf Fluid collection efficiency of an aggregate, dimensionlessG Global average fluid velocity gradient or shear rate, s�1
ho Minimum separation distance between particle surfaces, nmH.x;y/ Unretarded geometric functions, dimensionlessK Debye-Huckel parameter, J/m3CKB Boltzmann constant, J/Kmi Salt concentration, mol/m3
n Number concentration of particles or aggregates, m�3
N Rotational speed, rpmNAV Avogadro’s number, mol�1
M.F. Chong (�)Department of Chemical and Environmental Engineering, Faculty of Engineering, The Universityof Nottingham, Malaysia Campus, Jalan Broga, 43500 Semenyih, Selangor, Malaysiae-mail: [email protected]
S.K. Sharma and R. Sanghi (eds.), Advances in Water Treatment and PollutionPrevention, DOI 10.1007/978-94-007-4204-8 8,© Springer ScienceCBusiness Media Dordrecht 2012
201

202 M.F. Chong
Ni Number concentration of particles or aggregates in section i , m�3
NP Power number of impeller, Wrci , rcj Floc collision radius, �mri Particle radius at size class i , �mro Composite radius of a particle with adsorbed polymer layers, �mroi , roj Primary particles radii, �mr Mass mean aggregate radius, �ms Distance between particles centers, nmS Specific rate constant of fragmentation, s�1
t Flocculation time, sT Suspension temperature, Kv, u Particle or aggregate volumes, m3
V Volume of the suspension, JVT Net interaction energy between two primary particles, JVedl Electrical double layer repulsion, JVs Energy of steric repulsion or bridging attraction, JVvdw Van der Waals energy, Jzc Valence of counterion, dimensionlesszi Valence of electrolyte ions, dimensionless
Greek Letters
˛ Collision efficiency factor, dimensionless˛Sc Numerical constant, dimensionlessˇ Collision frequency factor, m3/s� Breakage distribution function, dimensionless"o, "r Dielectric constant of a vacuum and the solvent, C/mV" Average turbulent energy dissipation rate, m2/s3
� Density of the suspension, kg/m3
�p Particle density, kg/m3
� Fluid dynamic viscosity, kg/msv Kinematic viscosity, m2/si Floc volume fraction in size class i , dimensionlessı Adsorbed polymer layer thickness, nm�R Characteristic wavelength of interaction, nm oi , oj Surface potential, mV Total amount of polymer adsorbed on a single surfaceo Adsorbed amount at saturationˆso Polymer volume fraction at a single saturated surface, dimensionless

8 Direct Flocculation Process for Wastewater Treatment 203
8.1 Introduction
Chemical treatment is one of the most utilized treatment methods in any water andwastewater treatment process. Chemical treatment, often being termed as primarytreatment, involves a process of coagulation and flocculation. In this process, thecolloidal particles brought about are destabilized while the soluble constituents areprecipitated, both into microflocs by the addition of a chemical reagent called ascoagulant. This is then followed by flocculation where the destabilized particlesagglomerate and form bulky floccules, which can be settled, called flocs. Theaddition of another reagent called flocculant or a coagulant aid may promotethe formation of the flocs [1]. The aim of applying coagulation and flocculationtreatment is generally to remove the colloidal matters such as suspended solidspresent in the wastewater.
The most common coagulants used are hydrolyzable metal cations such as lime,aluminum sulfate (alum), ferric chloride, and ferrous sulfate whereas polymers areemployed as flocculants. These coagulants and flocculants are employed extensivelyin water and wastewater treatment [2–4]. Although inorganic coagulants are inex-pensive and readily available, their usage requires high chemical cost due to highdosage. It also generates excessive volumes of phytotoxic sludge and cannot bereadily disposed. A large amount of caustic soda is needed to alter the solution pHto achieve its isoelectric point and coupling with flocculation is needed to improvethe efficiency [5].
The flocculants of organic macromolecules polymers offer significant advantagesin coagulation-flocculation process. The concentrations needed are only a fewmilligrams per liter and they generate small quantity of nonhazardous sludge foreasy disposal. On a price-per-weight basis, they are much more expensive thaninorganic coagulants, but overall operating cost is lower because of a reduceddosage, elimination of pH-adjusting chemicals, and reduced sludge disposal costsdue to lower sludge volumes [6].
With the wide availability of flocculants or more precisely polyelectrolytesat variety of type, charge density, and molecular size, complete elimination ofcoagulation by using direct flocculation is gaining its popularity and importance.The major reasons to its gaining application are its biodegradability, simplicity,and it is also inexpensive. This chapter provides some useful information ondirect flocculation which consists of the detailed description on the basic principleof flocculation, the difference between conventional coagulation-flocculation anddirect flocculation, process modeling and simulation for flocculation process basedon Population Balance Model (PBM), type of flocculants and their applications,industrial applications of direct flocculation, and finally, a special case study on theadsorption-flocculation for boron removal from wastewater.

204 M.F. Chong
8.2 Basic Principle of Flocculation
Coagulation and flocculation are often used interchangeably and ambiguously, as inreality most coagulants often enable the formation of agglomerates by bridging andthus helping to flocculate. At the same time, the cationic or anionic charge carriedby the flocculants will simultaneously destabilize the colloidal particles and bridgethem together. However, in this chapter, the terms coagulation and flocculation carrydistinguish meanings as:
1. Coagulation is the process of destabilization of colloidal particles brought aboutor precipitation of soluble constituents as complex metal hydroxide by theaddition of a chemical reagent called as coagulant which is mostly metal salts,e.g., alum, ferric chloride, and polyaluminum chloride (PAC). The destabilizationof colloidal particles takes place when the DLVO (Derjaguin, Landau, Verwey,and Overbeek) energy barrier is effectively eliminated thus lowering the energybarrier.
2. Flocculation is defined as the agglomeration of destabilized particles due tobridging, by the addition of long chains polymers called flocculants, when theyare driven toward each other by hydraulic shear forces in the rapid mix, intobulky, visible floccules which can be settled as flocs.
8.2.1 Stabilized Colloidal Suspensions
The agglomeration of destabilized colloidal suspensions by polymer flocculants,which undergo an irreversible process controlled by hydrodynamic and physic-ochemical conditions, is gaining its popularity in terms of scientific interest andindustrial importance [7]. The understanding of the mechanisms of flocculation isthe key to successful treatment performance while successful flocculation shouldstart with the understanding of the type of contaminants/constituents present inthe wastewater. Industrial wastewater treatment experts always relate flocculationprocess to water clarification as a means of suspended solids removal or turbidityreduction. In other words, the contaminants/constituents present in the wastewatermust be in the form of stabilized insoluble colloidal suspension so that effective floc-culation can be initialized. Contaminants in soluble form should be preconditionedinto precipitated microflocs by means of coagulation and pH adjustment prior toflocculation.
The insoluble stabilized colloidal suspensions especially range from 0.01 to 5�min size, which contributing to water turbidity, pose great challenge in wastewatertreatment due to their unsettle-ability. The stability of the colloidal suspensions isstrongly influenced by their electrokinetic or simply surface charge, which in natureis usually negative. The surface charge, as shown in Fig. 8.1, causes the adjacentparticles to repel each other and as a result, they tend to remain discrete, dispersed,and in suspension [6].

8 Direct Flocculation Process for Wastewater Treatment 205
Fig. 8.1 (a) Stabilized particles which repel each other due to the surface charge. (b) Unchargedparticles which tend to agglomerate during collisions (Reprinted from [6]. With kind permissionof © Zeta-Meter Inc)
The tendency of the colloids to destabilize from their stabilized form is dependenton the balance between two opposing forces of electrostatic repulsion and van derWaals attraction. The classical DLVO theory [8, 9] stated that the net interactionenergy of the colloids is equal to the sum of van der Waals attraction and electricaldouble layer repulsion. The net interaction can be attractive or repulsive dependingon the distance between the colloidal particles and if it falls at the repulsive section,then the region is called the energy barrier as shown in Fig. 8.2. In order toagglomerate, the energy barrier has to be lowered or completely removed so thatthe net interaction energy is always attractive.

206 M.F. Chong
Fig. 8.2 Representation of DLVO theory (Reprinted from [10]. With kind permission of© Elsevier)
8.2.2 Mechanisms for Flocculation
The generally accepted mechanisms for flocculation are charge neutralization,charge patch neutralization, and bridging [11]. More than one mechanism mayoperate at the same time depending on the nature of the particle surface and thepolymer conformation at the solid-liquid interface. The dominant mechanism duringflocculation can be possibly identified from the rate of flocculation as the rate offlocculation by bridging is several orders of magnitude higher than that by eithercharge-patch neutralization or simple charge neutralization. The rate obtained fromcharge patch neutralization is about two to three times greater than that by simplecharge neutralization [12].
Bridging flocculation takes place when the polymer with long chains adsorbsonto the surface of the colloidal particles following several elementary processeswhich occur simultaneously under turbulent flow as schematically illustrated inFig. 8.3, which are [7]:
1. Dilution of the flocculation into homogeneous solution.2. Collision between colloidal particles.3. Transportation of polymer flocculant toward the surface of colloidal particles.4. Reconformation of adsorbed polymer on the surface of colloidal particles.5. Formation of a bond (or bridge) between colloidal particles.6. Rearrangement and breakup of the structure of a floc.

8 Direct Flocculation Process for Wastewater Treatment 207
Stericstabilization
Mixing
Dilution into homogeneous solution
Collision
Bridgingflocculation
breakup
Reconformation
Rearrangement
Fig. 8.3 Schematic diagram of adsorbing polymer on colloidal particles (Reprinted from [7]. Withkind permission of © Elsevier)
Depending on the affinity of the polymer to the surface, polymer chains canhave any one or a combination of the three conformations: trains or thin layers(starched flat on the surface), loops or coils, and dangling tails that are starched intothe solution, at some angle to the surface [13, 14]. Figure 8.4 shows a schematicrepresentation of the three different polymer conformations at the solid–liquidinterface.
When the long chains polymer adsorbing on the colloidal particles conveys acharge, especially in most of the occasions where polyelectrolyte is used, the factorof charge neutralization must be considered. Only simple charge neutralization willbe considered in this chapter and it often applies to cationic polymer besides thetypical inorganic coagulants due to the opposite surface charge of the colloidalparticles. Charge neutralization is simply lowering the DLVO energy barrier whena positively charged polymer adsorbs onto the surface of the colloidal particles. Thepositively charged coating neutralizes the negative charge of the colloidal particles,resulting in a near isoelectric point or zero net interaction energy.
8.3 Coagulation-Flocculation Versus Direct Flocculation
The conventional chemical pretreatment for wastewater often involves coagulation-flocculation process where inorganic coagulants (metal salts) are first added intothe system to alter the physical state of dissolved and suspended solids to obtain

208 M.F. Chong
Fig. 8.4 Schematic representation of the three different polymer conformations at the solid–liquidinterface. (a) thin layers, (b) coils, and (c) trains, loops, and tails. ıC is adsorbed layer thickness(Reprinted from [15]. With kind permission of © Elsevier)
complex precipitates of metal hydroxides at the desired pH to facilitate sedimen-tation. This is followed by the addition of flocculants or often being termed ascoagulant aids to enhance the treatment efficiency and sedimentation rate by themechanical bringing of the microflocs into visible, dense, and rapid settling flocs. Inthis case, long chains nonionic or anionic polymers are usually used and the majorflocculation mechanism involved is bridging.
The direct flocculation (i.e., without addition of coagulants) using cationicand/or anionic polymers offers the possibility to completely replace the inorganiccoagulants with water-soluble organic polymers in chemical pretreatment under aconstant applied shear. The direct flocculation process can be classified into thesingle and dual polymer systems. The single polymer system utilizes the mediumcharge density with high molecular weight cationic polymer. The cationic polymerserves as double acting polymer by first neutralizing the negative charge of theparticles (charge neutralization) and then visible flocs formation by bridging. Thedual polymer system is employed when the single polymer system failed to achievethe desired flocculation. In this system, the cationic polymer is first added for chargeneutralization and bridging. The bridging-type long chain anionic polymer is thenadded to further enhance the bridging effects by mechanically bridging the flocs intolarger and rapid settling flocs.
Although direct flocculation can be used to completely replace the inorganiccoagulants without the need of pH alteration and with less sludge generation, whicheventually lead to lower operational cost; the conventional coagulation-flocculationprocess still remains for its attractiveness especially for the wastewater withdissolved inorganic constituents which can only be precipitated as metal hydroxideat the present of suitable coagulants. Thus, the selection between conventional

8 Direct Flocculation Process for Wastewater Treatment 209
coagulation-flocculation and direct flocculation is highly depending on the typeof wastewater and the understanding of the mechanism of flocculation is alsoimportant to ensure successful treatment. Table 8.1 provides a brief overview onthe differences between coagulation-flocculation and direct flocculation which isuseful as a preliminary selection guideline between the two processes.
In this following section, the pretreatment of palm oil mill effluent (POME)by using conventional coagulation-flocculation and direct flocculation is analyzedas a case study to evaluate their differences. The direct flocculation of single anddual polymer systems are also discussed to provide further insight on how dualpolymer system can improve the treatment efficiency of the single polymer system.A preliminary cost analysis was also conducted to give a direct cost comparisonbetween the two systems.
8.3.1 Coagulation-Flocculation for POME Pretreatment
POME is a colloidal suspension of 95–96% water, 0.6–0.7% oil, and 4–5% totalsolids including 2–4% suspended solids originating from the mixture of a sterilizercondensate, separator sludge, and hydrocyclone wastewater [36]. In the coagulation-flocculation for POME pretreatment, alum (Envifloc 40L) and flocculant (Envifloc20S), obtained from Envilab Sdn. Bhd., Malaysia, were used throughout the studyconducted by Ahmad et al. [16].
The coagulation results obtained from Ahmad et al. [16], which were plottedin Fig. 8.5, shows that water recovery and the supernatant turbidity decreased atthe increasing pH from 4.5 to 9 when a constant coagulant dosage of 15,000 mg/Lwas used. It is interesting to note that even though minimum turbidity value of thesupernatant at pH 9 was found, higher volume of sludge was generated due to theweak flocs formation which led to the poor sedimentation and water recovery. Thisindicates that further flocculation was required to enhance dense flocs formation forimproved sedimentation and water recovery.
Figure 8.6 depicts the effects of flocculant dosage on the coagulated POMEwith the alum dosage of 15,000 mg/L at the pH of 6.5. The results show that theflocculation enhanced the treatment efficiency by increasing the water recovery withat least 10%. However, the water recovery and turbidity had a slight decrease withan increasing flocculant dosage.
8.3.2 Direct Flocculation for POME Pretreatment
In the study of the direct flocculation process for POME pretreatment, the perfor-mance of different type of cationic and anionic polymers at different dosage wasevaluated based on the selected operating parameters of temperature, stirring speed,and stirring time. The efficiency of the direct flocculation process was evaluated

210 M.F. Chong
Table 8.1 Differences between coagulation-flocculation and direct flocculation
Process Coagulation-flocculation Direct flocculation
Ability Able to remove highly solublesolids and metals from thewastewater besides theinsoluble portion
Able to remove the suspended andstabilized colloidal particles. It isonly suitable when the removal ofthe soluble portion is not the majorconcern
Type ofwastewater
More suitable for inorganicwastewater, e.g., wastewaterfrom semiconductor, metalplating, mining industries,though it is also applicable toorganic based wastewater. Alsosuitable for portable watertreatment where the watersource can be from river orunderground basins
Only suitable for organic-basedwastewater with consideratesuspended solids concentration,e.g., food, paper, and pulp,dyestuff, slaughtering house
Type ofchemicals forthe initialstage
Addition of coagulants (metalsalts) to precipitate thedissolved constituents intocomplex metal hydroxide andto neutralize the surface chargeof the suspended particles.Relatively weak flocs will form
Addition of flocculants (usuallycationic polymers depending onthe surface charge of the particles)to neutralize the surface charge andmechanical bridging of thesuspended particles. Strong anddense flocs can be readily formedat this stage
Type of chemicalfor thesubsequentstage
Addition of flocculants (usuallyanionic polymers) for bringingof the microflocs into visible,dense, and rapid settling flocs
Sometimes (quite rare) it requires theaddition of opposite chargepolymers (usually anionicpolymers) to further enhance thedense flocs formation by bridging
Otherrequirements
Requires additional chemicals ofcaustic and acid for pHadjustment due to the acidicbehavior of the coagulantsadded and the desiredisoelectric point forprecipitation
No requirement for pH adjustment dueto the near neutral behavior of theflocculants and its dependant oncharge neutralization withoutundergoing precipitation
Chemicals Inorganic, inexpensive (per weightbasis), and readily available
Organic, more expensive (per weightbasis) and readily available
Sludge generated Generates excessive volumes ofphytotoxic sludge and cannotbe readily disposed
Less sludge generation and readily fordisposal as the polymers areorganic in nature. However, it stilldepends on the type of wastewatertreated
Overall treatmentcost
More expensive due to the highdosage of coagulants andphytotoxic sludge disposal atexcessive volume
Less expensive due to the low dosageof flocculants and nontoxic sludgedisposal at small volume
Operation More complicated as it involvesmore chemicals (coagulantsand flocculants), handling ofcorrosive chemicals (acids andcaustics), and the need for anexact pH adjustment
Easy as it usually involves only dosingof one chemical (cationic polymer)
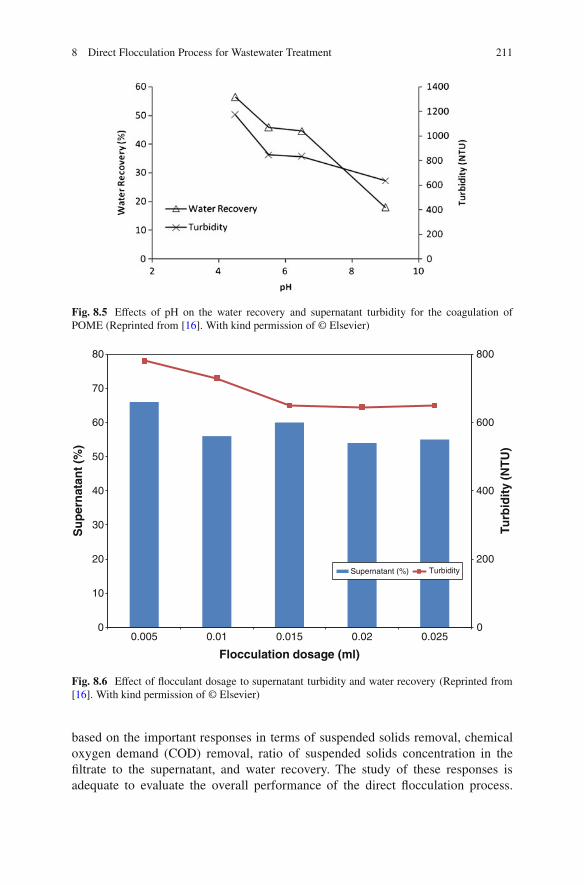
8 Direct Flocculation Process for Wastewater Treatment 211
Fig. 8.5 Effects of pH on the water recovery and supernatant turbidity for the coagulation ofPOME (Reprinted from [16]. With kind permission of © Elsevier)
0
200
400
600
800
0
10
20
30
40
50
60
70
80
0.005 0.01 0.015 0.02 0.025
Turb
idit
y (N
TU
)
Su
per
nat
ant
(%)
Flocculation dosage (ml)
Supernatant (%) Turbidity
Fig. 8.6 Effect of flocculant dosage to supernatant turbidity and water recovery (Reprinted from[16]. With kind permission of © Elsevier)
based on the important responses in terms of suspended solids removal, chemicaloxygen demand (COD) removal, ratio of suspended solids concentration in thefiltrate to the supernatant, and water recovery. The study of these responses isadequate to evaluate the overall performance of the direct flocculation process.

212 M.F. Chong
Table 8.2 The supplier and price of cationic polymer
Type of cationic polymer Supplier Price* (RM/kg)
KP1200H Euro Chemo Pharma Sdn. Bhd. 19.80Polyfloc KP9650 Dia-Chemical Sdn. Bhd. 13.50KP7000 Euro Chemo Pharma Sdn. Bhd. 33.00Envifloc 70KS Envilab Sdn. Bhd. 16.50FO 4190SH Exotic Chemical Sdn. Bhd. 16.00
*The prices quoted as per private communications in 2004 are for reference only
80
85
90
95
100
a b
0 200 400 600 800
Dosage (mg/L)
Su
spen
ded
So
lids
Rem
ova
l (%
)
: KP 1200H: Polyfloc KP 9650: Envifloc 70KS: FO 4190SH
52
54
56
58
60
62
0 200 400 600 800
Dosage (mg/L)
CO
D R
emo
val (
%)
Fig. 8.7 Effect of cationic polymer dosage on (a) suspended solids removal and (b) COD removalof POME for different type of cationic polymers
Other responses such as the removal of biological oxygen demand (BOD), and oiland grease were not discussed in detail as the removal of BOD and oil and greaseshowed a similar trend as the removal of COD and suspended solids, respectively.
8.3.2.1 Single Polymer System
In the single polymer system, only cationic polymer was added in the flocculationprocess. Five types of cationic polymers (KP 1200H, Polyfloc KP 9650, KP 7000,Envifloc 70KS, and FO 4190SH) as shown in Table 8.2 were evaluated. Theexperiment was done on-site so that the experimental data were representative.The performance of all the cationic polymers was evaluated at the dosage range of100–600 mg/L while the other parameters of temperature (71ıC, the on-site tem-perature) and pH (4.1, the on-site pH) remained constant. The POME was stirred at150 rev/min for 1 min after the addition of cationic polymer.
Figure 8.7a shows the effect of dosage for the cationic polymers on the suspendedsolids removal. For all the cationic polymers, the highest suspended solids removal(>99.4%) with the concentration less than 100 mg/L was achieved at the dosageof 300–600 mg/L. However, Envifloc 70KS gave poorer performance in terms ofsuspended solids removal compared to other polymers. The COD removal as shown

8 Direct Flocculation Process for Wastewater Treatment 213
0
10
20
30
40
50
60
Dosage (mg/L)
a bR
F/S
: KP 1200H: Polyfloc KP 9650: Envifloc 70KS: FO 4190SH
0
20
40
60
80
0 200 400 600 800 0 10 20 30 40 50 60
Time (s)
Wat
er R
eco
very
(%
)
Fig. 8.8 Effect of cationic polymer dosage on (a) RF=S and (b) water recovery of POME fordifferent type of cationic polymers
in Fig. 8.7b was highest for all cationic polymers at the dosage of 300–600 mg/Lexcept for Polyfloc KP 9650. For Polyfloc KP 9650, the COD removal increasedas the dosage increased to 500 mg/L and slightly decreased at 600 mg/L. However,the range of COD removal was small as it varied only from 53% to 61% for all thecationic polymers.
The flocculation efficiency based on filtration study is measured in terms of thewater recovery and the ratio of suspended solids concentration in the filtrate to thesupernatant,RF=S. An efficient flocculation should have RF=S � 1. If RF=S > 1, thisindicates that some fine flocs have been carried over to the filtrate, the flocs obtainedare easy to break, and thus it is not suitable to be dewatered.
Figure 8.8a shows the effect of cationic polymers dosage on the RF=S value.For all the polymers, the filtrate-suspended solids concentration at the dosage of200 mg/L and below increased tremendously with RF=S from 6 to 61. The filtrate-suspended solids concentration increased tremendously at all dosages for KP 1200Hand FO 4190SH. This indicates that flocs generated were soft, weak, easy to break,and were not suitable for dewatering process. Thus, KP 1200H and FO 4190SHwere not suitable in this system. For Polyfloc KP 9650 and Envifloc 70KS, the RF=S
value at the dosage of 300 mg/L and above was close to unity (filtrate suspendedsolids remained below 100 mg/L) and this indicates that flocs breakage did not occurduring filtration. This shows that the flocs were dense and therefore, suitable fordewatering. Based on the observed results, the dosage of 300 mg/L was the optimumdosage for the cationic polymer flocculation.
Figure 8.8b shows the water recovery for the cationic polymers at the dosage of300 mg/L. Polyfloc KP 9650 gave the highest percentage of water recovery (56%)at 10 s. The Envifloc 70KS and FO 4190SH achieved the maximum water recoveryof 56% after 60 s. This shows that Polyfloc KP 9650 had the best dewateringcapability followed by Envifloc 70KS. The FO 4190SH should not be consideredas it generated weak flocs as discussed in Fig. 8.8a. Between Polyfloc KP 9650 andEnvifloc 70KS, Polyfloc KP 9650 was chosen for the cationic polymer flocculation

214 M.F. Chong
Table 8.3 The supplier and price of anionic polymer
Type of anionic polymer Supplier Price* (RM/kg)
AN 350M Euro Chemo Pharma Sdn. Bhd. 16.00Polyfloc AP 8350 Dia-Chemical Sdn. Bhd. 12.70Polyfloc AP 8300 Dia-Chemical Sdn. Bhd. 12.70
*The prices quoted as per private communications in 2004 are for reference only
system as it offered lower price. Though Polyfloc KP 9650 demonstrated the bestdewatering capability, the water recovery of 56% was still very low compared tothe desired water recovery of 75%. In addition, though the maximum suspendedsolids removal of >99.4% with the concentration of <100 mg/L was achieved, theperformance was still poor compared to the desired suspended solids concentrationof <50 mg/L. Therefore, addition of anionic polymer flocculation was needed toenhance the suspended solids removal and dewatering capability of the flocculationsystem.
8.3.2.2 Dual Polymer System
In the dual polymer system, the cationic polymer was first added and followedby anionic polymer to enhance the performance of flocculation process. Theflocculation of POME by using anionic polymer was aimed to achieve the suspendedsolids concentration of less than 50 mg/L and water recovery of more that 75% tomeet the physical constraint of the subsequent treatments. The anionic polymers ofAN 350M, Polyfloc AP 8350, and Polyfloc AP 8300 as shown in Table 8.3 wereevaluated. This experiment was also done on-site so that the experimental data wererepresentative. The performance of the anionic polymers was evaluated at the dosagerange of 10–60 mg/L at the fixed parameters of cationic polymer dosage (300 mg/L),cationic polymer type (Polyfloc KP9650), temperature (71ıC, on-site temperature),and pH (4.1, on-site pH). The POME was stirred at 150 rev/min for 1 min after theaddition of cationic polymer and 50 rev/min for 1 min after the addition of anionicpolymer.
Figure 8.9a shows that the suspended solids removal increased when the anionicpolymer dosage increased. The suspended solids concentration of less than 50 mg/Lwith the removal of more than 99.7% was achieved at the dosage of 50–60 mg/L forAN 350M and Polyfloc AP 8350. Polyfloc AP 8300 showed the lowest performancein terms of suspended solids removal and failed to achieve the desired concentrationof 50 mg/L for all the dosage. Figure 8.9b shows that the COD removal increasedwhen the anionic polymer dosage increased with the Polyfloc AP 8350; it also gavethe highest COD removal. However, the range of COD removal was small as it wasvaried only from 53% to 61% for all the anionic polymers.
Figure 8.10a shows that the RF=S remained at the value close to unity for thedosage of 50–60 mg/L. This indicates that the floc breakage during filtration at thedosage of 50 mg/L and above was very minimal. It shows that, the floc formed

8 Direct Flocculation Process for Wastewater Treatment 215
99.0
99.2
99.4
99.6
99.8
100.0
a b
Dosage (mg/L)
Su
spen
ded
So
lids
Rem
ova
l (%
)
: AN 350M: Polyfloc AP 8350: Polyfloc AP 8300
52
54
56
58
60
62
0 20 40 60 80 0 20 40 60 80Dosage (mg/L)
CO
D R
emo
val (
%)
Fig. 8.9 Effect of anionic polymer dosage on (a) suspended solids removal and (b) COD removalof POME for different type of anionic polymers
0
2
4
6
8
10
Dosage (mg/L)
a b
RF
/S
: AN 350M: Polyfloc AP 8350: Polyfloc AP 8300
0
20
40
60
80
100
0 20 40 60 80 0 20 40 60
Time (s)
Wat
er R
eco
very
(%
)
Fig. 8.10 Effect of anionic polymer dosage on (a) RF=S and (b) water recovery of POME fordifferent type of anionic polymers
was dense and suitable for the dewatering process. Based on these findings, theanionic polymer dosage of 50 mg/L was recommended. Figure 8.10b shows thewater recovery of the anionic polymers at the dosage of 50 mg/L. Both AN 350Mand Polyfloc AP 8350 gave the highest water recovery with 78% achieved in just10 s while Ployfloc AP 8300 gave poor water recovery. Based on the price of anionicpolymers shown in Table 8.3, the Polyfloc AP 8350 was cheaper than the AN 350M.Therefore, the anionic polymer chosen was Polyfloc AP 8350.
8.3.3 Preliminary Cost Analysis
A preliminary cost analysis presented in Table 8.4 was carried out to evaluateand compare the treatment costs between the direct flocculation of POME and

216 M.F. Chong
Table 8.4 Comparison of the treatment costs between the direct flocculation of POME and theconventional coagulation-flocculation process
Parameters Direct flocculationConventionalpretreatmenta
1st stage Type of coagulant/flocculant Cationic polymer AlumDosage of coagulant/flocculant 300 mg/L POME
treated15,000 mg/L POME
treatedUnit cost of coagulant/flocculant RM 15.50/kg RM 1.00/kgTotal cost of coagulant/flocculant RM 4.65/m3 POME
treatedRM 15.00/m3
POME treated2nd stage pH adjustment Not needed Needed3rd stage Type of flocculant Anionic polymer Cationic polymer
Dosage of flocculant 50 mg/L POMEtreated
300 mg/L POMEtreated
Unit cost of flocculant RM 9.00/kg RM 11.00/kgTotal cost of flocculant RM 0.45/m3 POME
treatedRM 3.30/m3 POME
treatedTotal treatment cost RM 5.10/m3 POME
treatedRM 18.30/m3
POME treatedSuspended solids removal 99.66% >99%COD removal 55.79% >50%Oil and grease removal 99.66% >99%Water recovery 80.78% 78%
aThe literature data obtained from Ahmad et al. [16, 17]
the conventional coagulation-flocculation process [16, 17]. The cost estimates werebased on the current market price in Malaysia for all the materials as quoted bysuppliers. Based on the comparison of treatment efficiency between direct floccula-tion and conventional pretreatment of POME in terms of water recovery, suspendedsolids, COD, oil and grease removal, the direct flocculation showed comparabletreatment efficiency if it was not better. However, without even considering thecost of chemical used in pH adjustment for the conventional pretreatment, the totaltreatment cost of conventional pretreatment was 3.6 times higher than the totaltreatment cost of direct flocculation. Therefore, direct flocculation was more costeffective than the conventional pretreatment of POME.
8.4 Process Modeling and Simulationfor Flocculation Process
PBM of Smoluchowski [18] is commonly used for modeling aggregation phenom-ena in colloidal suspensions. In the aggregation-fragmentation processes, fragmen-tation is generally assumed to take place only due to fluid stress and not due tocollisions between different aggregates, though it is also possible. The incorporationof both aggregation and fragmentation kinetics in the PBM is given by the followingpartial integral-differential equation [18]:

8 Direct Flocculation Process for Wastewater Treatment 217
@n .; t/
@tD �
1Z
0
˛ .; u/ ˇ .; u/ n .; t/ n .u; t/ du
C 1
2
�Z
0
˛ .v � u; u/ ˇ .v � u; u/ n .v � u; t/ n .u; t/ du
� S.v/ n .v; t /C1Z
�
S.u/ � .v; u/ n .u; t/ du (8.1)
where n is the number concentration of particles or aggregates, v and u are particleor aggregate volumes, t is flocculation time, ˛ is collision efficiency factor, ˇ iscollision frequency factor, S is the specific rate constant of fragmentation, and �is breakage distribution function. The first term in the Eq. 8.1 accounts for lossor disappearance of particles or aggregates of size v due to their interaction withprimary particles or aggregates belonging to all sizes. The second term representsthe growth of aggregates due to the interaction between primary particles andaggregates belonging to smaller size classes. The third term accounts for the lossof aggregation due to fragmentation while the last term represents generationof primary particles or smaller aggregates due to breakage or erosion of largeraggregates.
Equation 8.1 is a stochastic model. It is necessary to employ numerical solutionafter discretizing the equation with respect to size into a set of nonlinear ordinarydifferential equation (ODE). Based on the geometric discretization techniques[19], the rate of change of particle or aggregate number concentration during thesimultaneous aggregation and fragmentation is given by the following discretizedand lumped PBM:
dNidt
D1
2˛i�1; i�1ˇi�1; i�1N 2
i�1 CNi�1i�2X
jD12j�iC1˛i�1; j ˇi�1; j Nj
�Ni
i�1X
jD12j�i˛i; j ˇi; jNj�Ni
max1X
jDi˛i; j ˇi; j Nj � SiNi C
max2X
jDi�i;j Sj Nj
(8.2)
where Ni is number concentration of particles or aggregates in section i , max1is maximum number of sections used to represent the complete aggregate sizespectrum, and max2 corresponds to the largest section from which flocs in thecurrent section are produced by fragmentation. The first and second terms on theright of Eq. 8.2 account for growth, while the third and fourth terms account for lossof aggregates by aggregation, fifth term accounts for the loss of aggregates due tofragmentation, and the last term account for generation of smaller aggregates due

218 M.F. Chong
to breakage or erosion. The flocculation can be visualized as a three-step process:aggregate transport represented by the collision frequency factor, ˇi;j , attachmentgiven by the collision efficiency, ˛i;j and aggregates breakage represented by thespecific rate constant of fragmentation, Si , and breakage distribution function �i;j .
8.4.1 Collision Frequency
In the wastewater treatment system, orthokinetic aggregation (aggregation due toapplied shear) is often preferred. Shear is applied by the stirring motion of impellerto accelerate aggregation process. The collision frequency factor of orthokinetic [15]is given by:
ˇshi;j D 4
3G
�pEfi rci C p
Efj rcj
�3(8.3)
where G is the global average fluid velocity gradient or shear rate, rci or rcj isthe floc collision radius, and Ef is the fluid collection efficiency of an aggregate.The Ef is in the range of 0 � Ef � 1. The collision frequency factor for permeableaggregates can be reverted to those for rigid spheres (rectilinear model) by settingEf equal to 1. If theEf is less than 1, it is curvilinear model [20, 21]. The shear rate,G can be obtained as [22]:
G DsNP�N 3D5
V�D
r"
v(8.4)
where NP is the power number of impeller, � is density of the suspension, N isrotational speed,D is the impeller diameter, V is the volume of the suspension,� isthe fluid dynamic viscosity, " is the average turbulent energy dissipation rate, and vis the kinematic viscosity. The flocs collision radius of an aggregate, rci containingno primary particles is given by [23]:
rci D ro
�noi
CL
�1=dF
(8.5)
where CL is the aggregate structure prefactor, ro is composite radius of a particlewith adsorbed polymer layers, and dF is the fractal dimension. The collisionfrequency of Eq. 8.3 can be computed by assigning appropriate values of dF. Thefractal dimension is an indirect indicator of the flocs structure and its openness. Thefractal dimension is used to incorporate the qualitatively analysis of flocs structureinto the PBM which is quantitative (number and radii of flocs).

8 Direct Flocculation Process for Wastewater Treatment 219
8.4.2 Collision Efficiency
The collision efficiency factor is computed as the reciprocal of the Fuchs’ stabilityratio, W between the primary particles [15]:
Wi;j D �roi C roj
�1Z
roiCroj
exp .VT =KBT /
s2ds (8.6)
where VT is net interaction energy between two primary particles of radii roi and roj ,s is the distance between particles centers (s D roi C roj C ho), ho is the minimumseparation distance between particle surfaces,KB is the Boltzmann constant, and Tis the suspension temperature.
In the DLVO (Derjaguin Landau Verwey Overbeek) theory [15, 24, 25], the netinteraction energy between two primary particles, VT is equal to the sum of Vander Waals energy Vvdw, electrical double layer repulsion Vedl, and energy of stericrepulsion or bridging attraction Vs.
VT D Vvdw C Vedl C Vs (8.7)
8.4.2.1 Van der Waals Energy
In the case where inorganic coagulant is used as the coagulant, the van der Waalsenergy of attraction between bare particles, V H
vdw should be considered [15].
V Hvdw D �A
6
(2roi roj
s2 � �roi C roj
�2 C 2roi roj
s2 � �roi � roj
�2 C ln
"s2 � �
roi C roj�2
s2 � �roi � roj
�2
#)
(8.8)
where A is the Hamaker constant of solids across the solvent medium. However, inthe case where polymer is used, the adsorbed polymer layers on the particles shouldbe considered. The expression for the Van der Waals energy for the case of twosolids of the same kind with equal adsorbed polymer layer thickness is [15, 26]:
�12V Vvdw D Hsi sj
�A1=2si �A1=2m
� �A1=2sj � A1=2m
�CHpi pj
�A1=2pi � A
1=2si
�
��A1=2pj � A
1=2sj
�CHpi sj
�A1=2pi �A1=2si
� �A1=2sj �A1=2m
�
CHpj si
�A1=2pj �A1=2sj
� �A1=2si � A1=2m
�(8.9)

220 M.F. Chong
where Ap, Am, As is the Hamaker constant of the solids, solvent, and polymerrespectively across vacuum, H.x;y/ is the unretarded geometric functions. Theretardation effect is incorporated by multiplying the unretarded van der Waalsenergy between the polymer coated particles with a correction function, fR.ho/ [27].
fR.ho/ D 1 � bRho
�Rln
�1C �R
bRho
�(8.10)
�R is the characteristic wavelength of interaction, 100 nm and bR is a fittingparameter of 5.32.
8.4.2.2 Electrical Double Layer Repulsion
The interaction energy due to the electrical double layers between two spheres ofradii, (roi and roj ) and surface potentials, oi and oj is given by [28]:
Vedl D 64�"o"r
�KBT
zce
�2 �roi roj
roi C roj
�tanh
�zce oi
4KBT
�tanh
�zce oj
4KBT
�exp .�K ho/
(8.11)
where e is the elementary charge, zc is the valence of counter ion, "o, "r are thedielectric constant of vacuum and the solvent, and K is the Debye-Huckel parameterwhich is defined as [29]:
K D NAV e2
Pi miz2i
"o"rKBT(8.12)
where NAV is the Avogadro’s number, mi is salt concentration, and zi is valence ofelectrolyte ions. The i in Eq. 8.12 refers to an electrolyte species in solution.
8.4.2.3 Bridging Attraction
The interaction energy due to bridging attraction (Vs) is dependent on the adsorbedpolymer layers. It is important to understand the electrochemical changes broughtby the adsorbed polymer on particle surfaces. The scaling theory [30, 31] is usedto compute forces due to adsorbed polymer layers. It was chosen because it permitsderivation of analytical formulas for interaction between spherical particles. Thescaling theory is based on minimization of a surface free energy functional subjectto the constraint that total amount of polymer adsorbed is fixed in the regionbetween two surfaces having adsorbed layers. The interaction energy due to bridgingattraction between two unequal polymer-coated spheres can be computed as [25]:

8 Direct Flocculation Process for Wastewater Treatment 221
Vs D�2�roi roj
roi C roj
� �˛ScKBT
a3m
�ˆ9=4so DSc
�(
�16DSc
oln
�2ı
ho
�C 4D
5=4Sc
25=4
�8
o
�9=4 "1
h1=4o
� 1
.2ı/1=4
#)
(8.13)
where ı is adsorbed polymer layer thickness, ˛Sc is numerical constant which canbe obtained from osmotic pressure and light scattering experiments on polymersolution, am is effective monomer size, is total amount of polymer adsorbed ona single surface, Dsc is the scaling length, ˆso is polymer concentration at a singlesaturated surface, and o is adsorbed amount at saturation.
The proposed scaling theory of Eq. 8.13 is based on flocculation in the absence ofshear. When shear is applied, there will be lateral sliding and friction forces besidesthe normal forces. Due to the lateral shear stress, the adsorbed polymer chains mayswell or stretch because of the fluid velocity gradients and osmotic pressure canincrease as the fluid tries to squeeze out of the gap between particle surfaces. Thechain may get desorbed if the shear rate is too high. However, shear forces betweensurfaces covered with adsorbed polymers have not been studied, either theoreticallyor experimentally [25]. Due to current limitations, the scaling theory is being appliedin the modeling of flocculation under applied shear by ignoring the sliding andfriction forces on the adsorbed layer.
8.4.3 Aggregates Breakage
The increase of collision frequency by applying shear does not necessary result inhigh rates of flocculation. Aggregates breakage or fragmentation often occurs dueto shear stress especially at high stirring speed. The parameters used to computethe aggregates breakage is the specific rate constant of fragmentation, Si and thebreakage distribution function, �i;j . The specific rate constant of fragmentation, Siis defined as [15, 23]:
Si D�4
15�
� 12�"
v
� 12
exp��"b;i
"
�(8.14)
where "b; i is the critical turbulent energy dissipation rates at which floc breakagetakes place. The breakage distribution function, �i;j is a fitting parameter.
8.4.4 Dynamic Scaling
As aggregation proceeds, flocs develop as porous object with highly irregular andopen structures. PBM represent aggregation process quantitatively (number and

222 M.F. Chong
radii of flocs); however, it does not compute the aggregates quality in terms of flocscompactness. Flocs quality, besides having large aggregate radii, and compactnessof the flocs is also crucial to assist sedimentation and liquid-solid separation. Thefractal dimension, dF is a simple parameter to represent the complex structure ofaggregates. The fractal dimension falls in the range of 1 � dF � 3 [32]. The formedaggregates are more compact when the system has high fractal dimension. Thefractal dimension of polymer flocculated flocs ranges from 1.7 to 2.5 [21]. Thefractal dimension can be computed by using the scaling law for mean aggregatesize as a function of time [33]:
r / t1=dF (8.15)
where r is the mass mean aggregate radius. A plot of log (r) against log (t) will bea straight line and dF can be obtained as the reciprocal of the slope.
8.4.5 Solution of the Model
Equation 8.2 of discretized PBM forms the governing equation for the flocculationprocess. The time evolution floc size distribution data can be predicted from Eq. 8.2once the parameters of collision frequency factor, ˇi;j , collision efficiency, ˛i;j , andspecific rate constant of fragmentation, Si are specified. The collision frequencyfactor, ˇi;j can be calculated from the Eqs. 8.3, 8.4, and 8.5 once the value offractal dimension, dF is obtained from the dynamic scaling based on Eq. 8.15. Thecollision efficiency, ˛i;j can be obtained from the Eqs. 8.6, 8.7, 8.8, 8.9, 8.10, 8.11,8.12, and 8.13 which accounts the effects of van der Waals energy, V V
vdw, electricaldouble layer repulsion, Vedl and bridging attraction, Vs. The specific rate constant offragmentation, Si can be obtained from Eq. 8.14. The discretized PBM of Eq. 8.2forms a set of nonlinear ODEs and can be solved numerically by the orthogonalcollocation technique [34]. The Eq. 8.2 coupled with Eqs. 8.3, 8.4, 8.5, 8.6, 8.7,8.8, 8.9, 8.10, 8.11, 8.12, 8.13, and 8.14 can be solved using any computer softwarepackage, e.g., Matlab 7.0 following the algorithm as shown in Fig. 8.11.
8.5 Type of Flocculants and Their Applications
It is always a challenging task to select an appropriate polymer for a specificwastewater treatment due to its wide availability from the manufacturers. Thecharacteristics in terms of type of charge, molecular weight, molecular structure,and charge density are always used for the polymer’s classification. The knowledgeon the polymer characteristics as shown in Table 8.5 will aid in polymer selection;however, preliminary bench testing of polymers by using standard jar tests is themost important part of the selection process to identify the specific polymer, itsdosage, and mixing requirements.

8 Direct Flocculation Process for Wastewater Treatment 223
Collision Frequency FactorEqs. 8.3–8.5
Collision EfficiencyEqs. 8.6–8.13
Specific Rate Constant Eq. 8.14
Fractal Dimensiondynamic scaling Eq. 8.15
Surface Potentialsfitting parameter
Operating Parameterspolymer dosage,
flocculation time, stirring speed, temperature, etc.
Physical Parametersinitial particle concentration and
mean diameter, suspension density, viscosity, etc.
Initial guess of the number concentration of particles/aggregates, Ni
Comparison between Vi,calculated and Vi, experimental
END
5%?
Calculation of Ni,calculated using PBM of Eq. 8.2
Calculation of volume fraction, Vi,calculated using Ni,calculated
Yes
No
Fig. 8.11 Flow diagram of the algorithm for solution of the governing equations
To date, there are some world’s leading manufacturers of flocculants for waterand wastewater treatment, which include SNF, Inc., a subsidiary of SNF Floeger,France, Ciba Specialty Chemicals Corporation, Germany, BASF-The ChemicalCompany, Germany, Dia-Nitrix Co., Ltd., Japan, Stockhausen, Inc., Germany,Sanyo Chemical Industries, Ltd., Japan, Mitsui Chemical Aqua Polymer Inc., Japan,CYTEC Industries, USA, Kolon Industries, Inc., and Korea. There are also manymore other manufacturers especially from China and Korea. Table 8.6 providessome general rules on polymer selection based on the experience obtained fromSNF Floerger. Looking at the great diversity of the flocculants, this could offersome limited helps to narrow the flocculants selection prior to the jar test. Evenso, there are no specific rules of thumb to give systematic guidelines on flocculantsselection but cumulated experience in hands-on flocculation experiments is the mostimportant key to instant selection of the right flocculants.

224 M.F. Chong
Table 8.5 Characterizing polymers based on their classification
TypeNonionicVery low charge density, typically known as polyacrylamide, flocculates through bridgingAnionicNegatively charged, and normally used for bridgingCationicPositively charged, double acting ability: charge neutralization and bridgingAmphotericExhibit both cationic and anionic behavior
Physical forma
PowderAdvantage: Contains 100% active matterLiquidAdvantage: Simplicity of useEmulsionAdvantage: Easy to use and an increased efficiency on certain applications due to the specific
molecular structuresBeadsAdvantage: Absence of dust and rapid dissolutionDispersionAdvantage: Ability to be directly fed inline without any expensive makeup equipment or aging
time. They have also been found efficient in phase separation of flotation processes
Molecular weightVery high >10,000,000 g/molHigh 1,000,000–10,000,000 g/molMedium 200,000–1,000,000 g/molLow 100,000–200,000 g/molVery low 50,000–100,000 g/molVery, very low <50,000 g/mol
Charge densityVery highHighMediumLowVery lowaData obtained from SNF FLOERGER
8.6 Industrial Applications of Direct Flocculation
Ever since the introduction of flocculants, industrial applications of direct floc-culation in water and wastewater treatment is very minimal compare to theconventional coagulation-flocculation though it is widely applied in sludge con-ditioning and dewatering. One of the major reasons is the inadequate knowledgeand understanding of the water chemistry, colloidal particles surface behaviors,

8 Direct Flocculation Process for Wastewater Treatment 225
Table 8.6 General rules for polymer selection
Industries Nonionic flocculants Anionic flocculants Cationic flocculants
Agri foodstuffSludge treatment
pWater treatment
p pDyeingSludge treatment
pWater treatment
pPaper makingSludge treatment
p pWater treatment
p pChemical industrySludge treatment
p pWater treatment
p p pEffluent with oil
pMechanical industrySludge treatment
p p pWater treatment
p p pEffluent with oil
p
Municipal effluentSludge treatment
p pWater treatment
p p pNote: data obtained from SNF Floerger
and flocculation mechanisms. In some cases, the wastewater treatment plants aredesigned, constructed, and commissioned together with the processing plants by ateam of engineers who are not environmental engineers.
Tables 8.7 and 8.8 provide some examples of successful cases where theconventional coagulation-flocculation processes were completely replaced by directflocculation processes in Malaysia. The treatment efficiencies were evaluated byfocusing only on suspended solids reductions as the major role of direct flocculationwas to remove the stabilized colloidal particles. Table 8.7, which summarizes theindustrial applications of direct flocculation for single polymer system, shows thatcationic polymers with very high molecular weights indicating long chains typewere used in majority to flocculating the suspended solids regardless on theirinfluent concentrations. As a general rule, the higher influent suspended solidsconcentration, the higher cationic polymer dosage required. However, it is notalways applicable as the polymer dosage required still depends highly on thewastewater characteristic. In certain occasions, dual polymer system as in Table 8.8was used to enhance the treatment efficiency, where cationic polymers were alwaysadded for charge neutralization and bridging, followed by anionic polymers for onlymechanical bridging. It is important to note that the direct flocculation was ableto achieve high suspended solids removal with more than 90% at reasonable costreductions as compared to the conventional coagulation-flocculation process.

226 M.F. Chong
Tab
le8.
7In
dust
rial
appl
icat
ions
ofdi
rect
flocc
ulat
ion-
sing
lepo
lym
ersy
stem
Susp
ende
dso
lids
(mg/
L)
Indu
stry
Cor
epr
oduc
tsFl
owra
te(m
3/h
)Po
lym
erty
pe
Mol
ecul
arw
eigh
t(1
06g/
mol
)C
harg
ede
nsit
y(%
)D
osag
e(m
g/L
)In
fluen
tE
fflue
nt
Cos
tre
duct
ion
(%)
Cer
amic
tile
sSa
nita
ryw
are
5C
atio
nic
12
80
60
4;500
130
Hom
ogen
ous
porc
elai
nti
les
6C
atio
nic
12
80
1;500
11;400
220
Fine
porc
elai
nta
blew
are
0:04
Cat
ioni
c12
80
1;000
36;700
120
Mod
ern
cera
mic
sani
tary
war
e5
Cat
ioni
c12
80
45
36;700
720
Sani
tary
war
e21
Cat
ioni
c12
80
30
3;670
24
20Po
rcel
ain
tile
s100
Ani
onic
16
50
50
122
120
Food
Dai
rypr
oduc
ts20
Cat
ioni
c0:5
40
15
77
1–
Dai
rypr
oduc
ts35
Cat
ioni
c12
80
10
25
1–
Proc
esse
dch
icke
npr
oduc
ts3
Cat
ioni
c12
20
1600
1–
Ric
eve
rmic
elli
2C
atio
nic
12
40
20
400
10
–Pa
steu
rize
dli
quid
egg
6C
atio
nic
12
20
0:5
633
1–
Ole
o-ch
emic
alFa
tty
acid
s,gl
ycer
in,t
riac
etin
42
Cat
ioni
c12
80
15
108
3–
Fatt
yal
coho
l70
Cat
ioni
c3
100
15
278
1–
Pape
rm
illa
ndpa
ckag
ing
Box
esfo
rpa
ckag
ing
1C
atio
nic
12
20
200
15;800
850
Pape
rsfo
rho
useh
old
usag
e100
Cat
ioni
c12
40
4985
22
5Pe
troc
hem
ical
Var
ious
chem
ical
prod
ucts
25
Cat
ioni
c14
80
15
330
1–
Var
ious
chem
ical
prod
ucts
25
Cat
ioni
c12
40
15
775
185
Puri
fied
tele
ptha
lic
acid
s250
Cat
ioni
c14
40
5385
1–
Ole
fins
and
poly
olefi
ns18
Cat
ioni
c12
40
15
25
1–
Text
ile
Aut
omot
ive
text
ile
0:2
Cat
ioni
c12
20
1;000
2;850
5–
Poly
este
rst
aple
fiber
20
Cat
ioni
c12
20
10
77
1–
Slau
ghte
ring
hous
eFr
esh
dres
sed
chic
ken
8C
atio
nic
12
40
12
640
990
Fres
hdr
esse
dch
icke
n4:5
Cat
ioni
c12
40
15
1;885
775
Fres
hdr
esse
dch
icke
n300
Cat
ioni
c12
20
3640
39
–Fr
esh
dres
sed
chic
ken
40
Cat
ioni
c12
20
10
1;122
20
–

8 Direct Flocculation Process for Wastewater Treatment 227
Tab
le8.
8In
dust
rial
appl
icat
ions
ofdi
rect
flocc
ulat
ion-
dual
poly
mer
syst
em
Sing
lepo
lym
erD
ualp
olym
er
Susp
ende
dso
lids
(mg/
L)
Indu
stry
Cor
epr
oduc
tsFl
owra
te(m
3/h
)Po
lym
erty
pe
Mol
ecul
arw
eigh
t(1
06g/
mol
)
Cha
rge
dens
ity
(%)
Dos
age
(mg/
L)
Poly
mer
type
Mol
ecul
arw
eigh
t(1
06g/
mol
)
Cha
rge
dens
ity
(%)
Dos
age
(mg/
L)
Influ
ent
Effl
uent
Cos
tre
duct
ion
(%)
Ole
oche
mic
alSo
ap,
glyc
erin
2C
atio
nic
1240
2A
nion
ic16
302
1;210
2–
Bio
dies
el0:5
Cat
ioni
c12
405
Ani
onic
1630
20
302
160
Pape
rm
ill
Bro
wn
grad
epa
per
5C
atio
nic
1240
500
Ani
onic
1630
50
55;600
61
–
Rub
ber
and
late
xN
atur
alru
bber
conc
en-
trat
es
0:6
Cat
ioni
c12
4020
Ani
onic
1630
25
12;500
2–

228 M.F. Chong
8.7 Adsorption-Flocculation for Boron Removalfrom Wastewater
A novel adsorption-flocculation method proposed for the removal of boron andclarification of ceramic wastewater is an innovative approach for direct flocculationapplication. In ceramic industry, the wastewater is highly turbid due to the existenceof fine solid particles (clay) besides having high boron concentration. The palm oilmill boiler (POMB) bottom ash was used as an alternative adsorbent and after boronadsorption on POMB bottom ash, the suspended particles as well as the bottom ashwere flocculated by using the long chain polymer flocculant [35].
The optimum operating conditions for boron removal by using adsorption-flocculation process was obtained following a standard jar test. The optimumoperating conditions and the quality of the treated wastewater are shown inTables 8.9 and 8.10 respectively. At the proposed optimum operating conditionas shown in Table 8.9, the boron concentration was reduced from 15 to 3 mg/Lwhich was lower than the legislation requirement by Malaysia Department ofEnvironment (DOE) in Standard B, 4 mg/L (Environmental Quality Act 1974).Standard B is classified corresponding to the location of the industrial area, whichis the downstream region of the water reservoir. The suspended solids concentrationof the wastewater was also greatly reduced. The suspended solids concentration ofthe wastewater was reduced to less than 5 mg/L. This was well below the DOErequirement in Standard B of 100 mg/L.
Table 8.9 Optimum operating conditions for adsorption-flocculation
Process Parameter Optimum conditions
Adsorption pH 8Dosage (g bottom ash/ 300 mL wastewater) 40Residence time (h) 1Mixing speed (rpm) 100
Flocculation Flocculant typea KP 1200 B AP 120 CDosage (mg flocculant/L wastewater) 100 50Mixing speed (rpm) 200Mixing time (min) 1
Reprinted from [35]. With kind permission of © ElsevieraSupplied from Dia-Chemical Sdn. Bhd.
Table 8.10 Boron, suspended solids, and COD values before and after treatmentcompared to DOE standards
Parameter Raw wastewater Treated wastewater DOE Standard B
Boron (mg/L) 15 3 4Suspended solids (mg/L) 2;000 5 100COD (mg/L) 46 22 100pH 6 9 5–9
Source: Chong et al. [35]

8 Direct Flocculation Process for Wastewater Treatment 229
The COD concentration and pH level of the treated wastewater was tested inorder to ensure that the treated wastewater was in the allowable range for discharge.The COD concentration was 22 mg/L with the pH of 9.0. Thus, no further treatmentfor COD was required but a final pH adjustment was needed.
Nonetheless, looking at the optimum dosage of 40 g of bottom ash/300 mlof wastewater, this will result in applying 133 kg of bottom ash to purify everycubic meter of wastewater. This implies that the proposed treatment scheme isonly suitable for the industries having small volume or low concentration of boroncontaminated wastewater. The bottom ash is dosed directly into the adsorptiontank or readily available tank without major (or any) modification in their existingtreatment plant and this is the major benefit of the proposed adsorption-flocculationmechanism. In the case of high volume or concentration of boron contaminatedwastewater, column operations should be considered.
References
1. Degremont (1979) Water treatment handbook, 5th edn. Halstead Press, New York2. Vilge-Ritter A, Masion A, Boulange T, Rybacki D, Bottero JY (1999) Removal of natural
organic matter by coagulation-flocculation: a pyrolysis-GC-MS study. Environ Sci Technol33:3027–3032
3. Lee JD, Lee SH, Jo MH, Park PK, Lee CH, Kwak JW (2000) Effect of coagulationconditions on membrane filtration characteristics in coagulation-microfiltration process forwater treatment. Environ Sci Technol 34:3780–3788
4. Wang D, Tang H, Gregory J (2006) Coagulation behavior of aluminum salts in eutrophic water:significance of Al13 species and pH control. Environ Sci Technol 40:325–331
5. Sarika R, Kalogerakis N, Mantzavinos D (2005) Treatment of olive mill effluents PartII. Complete removal of solids by direct flocculation with poly-electrolytes. Environ Int31:297–304
6. Ravina L (1993) Everything you want to know about coagulation and flocculation, 4th edn.Zeta-Meter Inc, Staunton
7. Adachi Y (1995) Dynamic aspects of coagulation and flocculation. Adv Colloid Interface Sci56:1–31
8. Derjaguin BV, Landau LD (1941) A theory of the stability of strongly charged lyophobic solsand of the adhesion of strongly charged particles in solutions of electrolytes. Acta PhysiochimUSSR 14:633
9. Verwey EJW, Overbeek JThG (1948) Theory of the stability of lyophilic colloids. Elsevier,Amsterdam
10. Thomas DN, Judd SJ, Fawcett N (1999) Flocculation modeling: a review. Water Res33:1579–1592
11. Levine S, Friesen WI (1987) Flocculation of colloids particles by water-soluble polymers. In:Attia YA (ed) Flocculation in biotechnology and separation systems. Elsevier, Amsterdam
12. Gregory J (1973) Rates of flocculation of latex particles by cationic polymers. J ColloidInterface Sci 42:448–456
13. Tjipangandjara K, Huang YB, Somasundaran P, Turro NJ (1990) Correlation of aluminaflocculation with adsorbed polyacrylic acid conformation. Colloid Surf A 44:229–236
14. Fleer GJ, Cohen Stuart MA, Scheutjens JMHM, Cosgrove T, Vincent B (1993) Polymers atinterfaces. Chapman and Hall, New York
15. Somasundaran P, Runkana V (2003) Modeling flocculation of colloidal mineral suspensionsusing population balances. Int J Miner Process 72:33–55

230 M.F. Chong
16. Ahmad AL, Ismail S, Bhatia S (2003) Water recycling from palm oil mill effluent (POME)using membrane technology. Desalination 157:87–95
17. Ahmad AL, Ismail S, Bhatia S (2005) Optimization of coagulation-flocculation process forpalm oil mill effluent using response surface methodology. Environ Sci Technol 39:2828–2834
18. Kumar S, Ramkrishna D (1996) On the solution of population balance equations by discretiza-tion: I. A fixed pivot technique. Chem Eng Sci 51:1311–1332
19. Spicer PT, Pratsinis SE (1996) Coagulation and fragmentation: universal steady-state particlesize distribution. AlChE J 42:1612–1620
20. Thill A, Moustier S, Aziz J, Wiesner MR, Bottero JY (2001) Flocs restructuring dur-ing aggregation: experimental evidence and numerical simulation. J Colloid Interface Sci243:171–182
21. Bushell GC, Yan YD, Woodfield D, Raper J, Amal R (2002) On techniques for the measure-ment of the mass fractal dimension of aggregates. Adv Colloid Interface Sci 95:1–50
22. Hopkins DC, Ducoste JJ (2003) Characterizing flocculation under heterogeneous turbulence.J Colloid Interface Sci 264:184–194
23. Flesch JC, Spicer PT, Pratsinis SE (1999) Laminar and turbulence shear-induced flocculationof fractal aggregates. AlChE J 45:1114–1124
24. Runkana V, Somasundaran P, Kapur PC (2004) Mathematical modeling of polymer-inducedflocculation by charge neutralization. J Colloid Interface Sci 270:347–358
25. Runkana V, Somasundaran P, Kapur PC (2006) A population balance model for flocculation ofcolloidal suspensions by polymer bridging. Chem Eng Sci 61:182–191
26. Vincent B (1973) The van der Waals attraction between colloid particles having adsorbed layersII. Calculation of interaction curves. J Colloid Interface Sci 42:270–285
27. Gregory J (1981) Approximate expressions for retarded van der Waals interaction. J ColloidInterface Sci 83:138–145
28. Bell GM, Levine S, McCartney LN (1970) Approximate methods of determining the double-layer free energy of interaction between two charged colloidal spheres. J Colloid Interface Sci33:335–359
29. Israelachvili JN (1991) Intermolecular and surface forces, 2nd edn. Academic, New York30. Genes PG (1981) Polymer solutions near an interface. 1. Adsorption and depletion layers.
Macromolecules 14:1637–164431. Genes PG (1982) Polymer solutions near an interface. 2. Interaction between two plates
carrying adsorbed polymer layers. Macromolecules 15:492–50032. Sterling MC, Bonner JS, Ernest ANS, Page CA, Autenrieth RL (2005) Application of
fractal flocculation and vertical transport model to aquatic sol-sediment systems. Water Res39:1818–1830
33. Amal R, Coury JR, Raper JA, Walsh WP, Waite TD (1990) Structure and kinetics ofaggregating colloidal hematite. Colloid Surf A 46:1–19
34. Constantinides A, Mostoufi N (2000) Numerical methods for chemical engineers withMATLAB applications. Prentice Hall PTR, Upper Saddle River, pp 502–522
35. Chong MF, Lee KP, Chieng HJ, Ramli IIS (2009) Removal of boron from ceramic industrywastewater by adsorption–flocculation mechanism using palm oil mill boiler (POMB) bottomash and polymer. Water Res 43:3326–3334
36. Ma AN (2000) Environment management for the palm oil industry. Palm Oil Developments30:1–10

Chapter 9Combined Macromolecular Adsorptionand Coagulation for Improvement of MembraneSeparation in Water Treatment
Mohammed Al-Abri, Chedly Tizaoui, and Nidal Hilal
Nomenclature
Cp Permeate concentration (mg/l)Cb Bulk concentration (mg/l)Cw Wall concentration (mg/l)Rm Hydraulic membrane resistance (m�1) P Trans-membrane pressure (bar)J0 Pure water flux (L/m2.s1)Jv Permeate flux (L/m2.s)Ji Pure water flux after 30 min backwash (L/m2.s)k Mass transfer coefficient (L/m2.s)dh Hydraulic diameter of the filtration channel (m)D Bulk diffusivity of solute (m2/s)Rg Gel layer resistance (m�1)Cg Gel concentration (mg/l)Rc Concentration polarization resistance (m�1)Ra Adsorption resistance (m�1)Ra1 Weak adsorption resistance (m�1)Ra2 Strong adsorption resistance (m�1)� Dynamic viscosity (kg/m/s) or (Pa.s)
M. Al-AbriPetroleum and Chemical Engineering Department, College of Engineering,Sultan Qaboos University, Muscat, Omane-mail: [email protected]
C. Tizaoui • N. Hilal (�)Centre for Water Advanced Technologies and Environmental Research (CWATER),College of Engineering, Swansea University, Swansea, UKe-mail: [email protected]; [email protected]
S.K. Sharma and R. Sanghi (eds.), Advances in Water Treatment and PollutionPrevention, DOI 10.1007/978-94-007-4204-8 9,© Springer ScienceCBusiness Media Dordrecht 2012
231

232 M. Al-Abri et al.
9.1 Introduction
Desalination is the process of removing contaminants and reducing the dissolvedsalts content in a water source to produce water suitable for a particular application.Several technologies were developed to achieve this and these can be categorizedas thermal or membrane processes. Reverse osmosis (RO) is the most commonlyused membrane technology for water desalination. In the marketplace, when judgedby installed capacity, the RO process leads with 44% of total capacity, closelyfollowed by the multistage flash with 40% of total capacity. The remaining 16%are divided between other processes [1]. The estimated water cost for the multistageflash process is $0.52/m3, whereas the RO cost is $0.45/m3 of desalinated seawater[2]. The expected costs for the RO desalination of brackish water are between $0.20and $0.35 per m3 of produced water [3]. The cost figures indicate that RO will bethe dominating desalination technology in the near future.
Fouling is the biggest obstacle facing the operation of RO desalination plants.Ideal RO membranes should be resistant to chemical and microbial attack, wheretheir separation and mechanical characteristics should not change after a long-termoperation. Unfortunately, seawater contains many foulants that foul RO membranessuch as suspended particles, natural organic matter (NOM), micro-organisms, andheavy metals. RO process is restricted to certain operating conditions. The typicalRO elements have limitations with respect to temperature (45ıC), pH value (2–10),silt density index (<3 SDI), chlorine (dechlorination mandatory), and several otherparameters [4]. Seawater and brackish water contain different composition of pollu-tants, depending on the source of collection. These pollutants cause different dete-riorating effects on the RO desalination process; thus, many pretreatment methodshave been proposed to obtain the desired results. Extensive pretreatment is requiredto increase the water recovery ratio of 30:50% for RO seawater desalination [5].
Different processes such as coagulation, flocculation, acid treatment, pH adjust-ment, addition of anti-scalant, and media filtration have been used as conventionalpretreatment for years [6]. Nowadays, the trend is moving in the direction ofintegrated membrane systems pretreatment. Reasons are mainly feasibility, processreliability, plant availability, modularity, relative insensitivity in the case of rawwater, and lower operating costs. Integrated membrane systems are expected to offer14% reduction in RO treatment plant compared to conventional pretreatment [7].This is due to the substantial drop in membrane prices in the last few years, andfurther reduction is expected in the coming years [3].
9.2 Seawater Composition
9.2.1 Humic Substances
Typical natural water contains natural organic matter (NOM), mono- and multi-valent ions, micro-organisms, and organic and inorganic colloids [8]. These
9 Combined Macromolecular Adsorption and Coagulation. . . 233
contaminants are divided into soluble (<1 nm), colloidal (1 nm to 1 �m), andparticulate fractions (>1 �m) [9]. Natural organic matter is present in all watersources and is a complex mixture of compounds formed from the breakdown ofplant and animal material in the environment. It has no readily identifiable structure.It consists of small, low molecular weight species such as carboxylic, amino acids,and proteins, through to larger and higher molecular weight humic substances (HS).Natural organic matter is one of the major fouling agents during membrane filtration[10]. They bind particles to each other and to the membrane surface [11].
Humic substances constitute a major part of the NOM present in ground water[12]. They occur as long linear chains at high pH and low ionic strength dueto charge repulsion of functional groups, and as coiled, spherical molecules atlow pH and high ionic strength; hence, they are more soluble at high pH [8].It is well established that HS are amphiphilic molecules, containing at the sametime hydrophilic and hydrophobic groups. Representing the hydrophilic groupsin HS are those containing oxygen, nitrogen, phosphorous, and sulfur, whilehydrophobic groups are aliphatic, aromatic, and cyclic hydrocarbons [13]. HS arerefractory anionic macromolecules of low to moderate molecular weight. Theycontain both aromatic and aliphatic components with primarily carboxylic andphenolic functional groups. Carboxylic functional groups account for 60–90% ofall functional groups. As a result, humic substances are negatively charged at thepH range of natural waters [14].
Humic substances are usually defined as substances containing humic acids (HA)and fulvic acids (FA) plus other components. Humic acids are acidic componentsthat are soluble in bases but precipitate in acids. Fulvic acids are the acidiccomponents that are soluble in both bases and acids [15]. To better understand thedifferent behavior of HA and FA, it is necessary to consider their different molecularweight as well. Fulvic acids have a lower molecular weight and a higher percentageof carboxylic groups than HA, and that increases their hydrophilicity. Therefore,FA are soluble also at low pH values (pH �2), where humic acids precipitate. Thus,FA have less affinity for binding hydrophobic compounds, while they often showa high metal complexion capacity; otherwise, the high molecular weight and basichydrophobicity of the HA favor the formation of micelle-like structures [16].
The molecular weight and molecular weight distribution of humic substancesdiffer from site to site. The average molecular weight varies from 0.5 to 10 kDafor aquatic FA [17] to a value as high as 40–300 kDa for soil-extracted HA [18].These values are far greater than the values reported earlier, typically, 0.5–2 kDa foraquatic FA, 1.5–5 kDa for aquatic HA, and 4–6 kDa for soil HA and FA [19–21].
9.2.2 Heavy Metals
Many metals exist in natural water. Their concentration varies significantly withwater source [22]. River and anthropogenic inputs, and biological and geochemicalcycling may influence the concentration of metals in estuarine and coastal seawater

234 M. Al-Abri et al.
to a much greater extent than that occurring in open ocean water. Transport ofmetals from rivers and estuaries is dependent on the partitioning of metals betweendissolved and particulate phases. The partitioning of trace metals between dissolvedand particulate phases is a function of several factors including specific metal ion,metal concentration, nature of particles, particle concentration, pH, salinity, anddissolved oxygen [23, 24]. In a study of trace elements, three groups had beendistinguished according to their behavior during filtration and association withcolloids. Heavy metals like Co, Ni, Zn, Cu, and Cd were grouped as elements of1–10 kDa fraction that have a tendency to form inorganic or organic complexes [22].
Although the toxicity of trace metals to humans is fairly low, bioaccumulationsof even small amounts in the body may be lethal [25]. In addition to trace metaltoxicity, they are of particular concern in desalination due to their effects on ROmembrane fouling [26]. The conventional and most commonly used method for thetreatment of industrial wastewater containing heavy metals is chemical precipitationmethod. However, this process requires a large amount of treatment chemicals.However, nanofiltration (NF) and RO membranes can achieve >97% and >99%removal, respectively [27].
9.2.3 Colloids
The term “colloids” is still subject to an operational definition, although there is ageneral consensus that colloids fall largely in the nanometer to sub-micrometer sizerange and occur in relatively large concentrations (more than 109 colloids per liter).Colloids are ubiquitous; they occur in natural waters, seawater, groundwater, andinterstitial soil water. Colloids may include clay minerals, oxides, or hydroxidesof iron and aluminum, colloidal silica, organic matter, and biocolloids, includingviruses and bacteria [28]. In suspensions, colloids interact with each other viaelectrostatic double-layer repulsion and/or van der Waals attraction and/or short-range repulsion (born or hydration forces) [29].
Colloids have a large specific surface area and a large number of reactivesurface functional groups per unit mass because of their small size. Therefore,they are efficient sorbents for contaminants such as heavy metals, nonpolar organiccompounds, and radionuclides and can potentially enhance contaminant mobility[30]. Eyrolle and Benaim [31] studied Amazonian surface water using sequentialultrafiltration (UF). Several fractions defined by the nominal molecular weightcut-off (MWCO) of the UF membranes were obtained: <5 kDa, 5–20 kDa,20–100 kDa, 100 kDa to 0.2 �m, and 0.2–0.45 �m. The metal binding capacityof these fractionated samples revealed that the 20–100 kDa fraction was the mostefficient fraction for copper binding. In addition, the UF experiments conducted byPokrovsky and Schott [22] showed that several transition metals including Cu, Zn,Ni, Co, and Cd can be partially transported by low molecular weight (<1–10 kDa)organic acids. A full understanding of metal chemistry in natural waters and theirmembrane filtration needs to take into account the competitive reactions of metals

9 Combined Macromolecular Adsorption and Coagulation. . . 235
with humic matter. The binding ability of HS toward heavy metals is known todepend on ion size [32] as well as HS–metal ratio [28]. Therefore, although tracemetals have molecular sizes less than the pore sizes of ultrafiltration membranes,they can still be rejected in the presence of HS using UF membranes due to HS–metal complex formation [28, 33].
9.3 Ultrafiltration Membranes
Ultrafiltration membranes have pore sizes in the range of 10–500 nm and arecapable of retaining species of molecular weight higher than 1 kDa. Typical rejectedspecies include sugars, biomolecules, polymers, and colloidal particles. Most UFmembranes are described by their nominal molecular weight cut-off (MWCO),which is usually defined as the smallest molecular weight species for which themembrane has more than 90% retention. Ultrafiltration can provide high-qualityfeedwater with low SDI and free from all suspended solids and microorganisms[34]. UF process is strongly dependent on membrane material, operating conditions,and raw water quality, but it is insensitive to high salinity [35].
9.3.1 Retention Mechanisms
Membranes and membrane suitability for a particular separation is measured bytheir retention among other factors. Single solute retention is defined as [36]:
Robs D 1 � Cp
Cb(9.1)
where Robs is solute retention, Cp is permeate concentration, and Cb is bulk (feed)concentration.
However, during actual separation, membrane performance changes with time,depending on many factors including membrane fouling. Real retention of solutesdiffers with different membrane-fouling phenomena. There are different retentionmodels that have been developed to approximate solutes’ real retention instead ofobserved retention such as concentration-polarization model and gel-layer model.These fouling phenomena are discussed in Sect. 9.3.2.
During any membrane separation process, the concentration of solute at themembrane surface is higher than the bulk concentration due to the gradual increaseof the rejected solute near the surface. This well-known phenomenon is concentra-tion polarization. Concentration-polarization retention model is used when highersolute concentration at the membrane surface forms a thin boundary layer above themembrane of thickness (ı). Real retention is calculated using [36]:
Cw
CbD Rreal:e
. Jvk / C 1 �Rreal (9.2)

236 M. Al-Abri et al.
where Cw is membrane surface concentration, Rm is hydraulic membrane resistance,Jv is permeate flux, k is mass transfer coefficient, and Rreal is solute real retention.The mass transfer coefficient (k) is related to Sherwood number:
Sh D kdhD
D aRebScc�dh
L
�d(9.3)
where Sh is the Sherwood number (kdh/D), dh is the hydraulic diameter of thefiltration channel, D is the bulk diffusivity of the solute, Re is the Reynoldsnumber (udh/v), Sc is the Schmidt number (v/D), L is the length of the membranechannel, and a, b, c, and d are constants. The value of k depends strongly on thehydrodynamics of the system and, therefore, can be optimized.
Concentration polarization can be very severe in membrane filtration, especiallyif membrane flux is high and the diffusivity of the macromolecules is low, leading tohigh membrane retention. This may result in the formation of a high concentrationgel layer at the surface of the membrane. The difference between concentration-polarization and gel-layer resistances is that the former is a thermodynamicmodification of the pressure driving force, and the latter is the viscous resistancefor flow through highly concentrated (precipitated or gelled) solutes [37]. Gel-layerconcentration depends on the size, shape, chemical structure, and degree of salvation[38]. In the gel-layer region, k is expressed using the equation:
Jv D k ln
�Cg
�
.Cb/(9.4)
where Cg is gel concentration, assuming that the gel concentration remains constantacross the layer.
9.3.2 Membrane Fouling
Fouling often associated with accumulation of substances on the membrane surfaceor within the membrane pore structure, worsens membrane performance and,ultimately, reduces membrane efficiency and shortens membrane life. These includedissolved and macromolecular organic substances, sparingly soluble inorganiccompounds, colloidal and suspended particles, and microorganisms [39–41]. Thefollowing fouling mechanisms may play a role: colloidal or particulate fouling,organic fouling, biological fouling (biofouling), and scaling. To prevent RO mem-brane fouling, organic, colloidal, and biological matter need to be removed from thefeedwater to the RO system [42]. Different fouling mechanisms require differentpretreatment strategies. Biological fouling, defined as accumulation of microorgan-isms at the surface of the membrane, is reduced by a biological process in the

9 Combined Macromolecular Adsorption and Coagulation. . . 237
pretreatment stage. It can be controlled by reducing the degradable components inthe feed using slow sand filtration or by soil passage or using membrane filtrationand effective cleaning procedures [39]. Scaling can be dealt with by reducingmembrane recovery and by adding chemicals, e.g., acid and anti-scalants.
Colloidal matter in natural water includes sulfur, silica, and ferric and aluminumhydroxides. Their residual colloids form membrane deposits with a high hydraulicresistance contributing to the permeate flux decline due to their small size. Theycan also precipitate at the membrane surface forming gel layer and enhancing theosmotic pressure [43, 44]. Natural organic matter is considered a major cause offouling in membrane filtration of natural waters. HS is the most detrimental NOMfoulant, causing fouling by membrane adsorption and pore plugging [4, 45–47].Organic fouling of membranes is dependent on the chemical properties of the NOMmolecules and/or chemical transformations that they undergo at the membranesurface [48, 49]. Colloidal and organic fouling pretreatment includes conventionalpretreatment such as coagulation and sedimentation and membrane pretreatment.
Two kinds of fouling can be distinguished: reversible and irreversible fouling.Reversible fouling is caused by the physical separation mechanisms that induceconcentration-polarization phenomena, deposit formation, and plugging of thepores. The phenomena induce important variations of the system permeability.These variations can be regulated by enhancing the hydrodynamic shear stressesclose to the membrane such as cross-flow circulation, back flushing, and momentaryfiltration stopping. Irreversible fouling is linked to interactions between compoundsin solution and membrane material. Chemical cleaning is necessary to detach thesecompounds from the membrane surface. However, in water treatment, this kind offouling does not cause very important variation of membrane permeability [50].Polysaccharides usually foul the membranes irreversibly [51].
There are different causes of flux decline. In general, the flux decline is causedby a decreased driving force and/or an increased resistance [52]. The foulingprocess may be attributed to a number of mechanisms including pore blockingby solutes that are of similar diameter to the pores, formation of a cake fromrejected solutes, precipitation or gelation of inorganic and organic particulates atthe membrane surface as a result of the localized high concentrations that occurat the membrane/solution interface and reversible and irreversible physical changesto the membrane (e.g., compression). A schematic diagram of membrane foulingmechanisms is found in Fig. 9.1 [52]. These mechanisms can be defined using aresistance in series model [37]:
Jv D �P
��Rm CRc CRg CRa
� (9.5)
where Jv is flux through the membrane, �P is trans-membrane pressure, � isdynamic viscosity, Rm is membrane hydraulic resistance, Rc is concentrationpolarization resistance, Rg is gel layer resistance, Ra is adsorption resistance.

238 M. Al-Abri et al.
Concentration polarization
Pore blockageAdsorption
Gel layer
Fig. 9.1 Schematic diagram of membrane fouling mechanisms
9.4 Pretreatment Prior to Desalination
9.4.1 Conventional Pretreatment
A conventional water treatment plant consists of a multistep process applying screenfiltration, ozonation, coagulation and flocculation, sedimentation, sand filtration,and usually disinfection as a last step. Each step of this process has to be controlledto get an optimal performance of the overall process, which results in a complexcontrol system [53, 54]. Pretreatment chemicals may include ozone, flocculants,coagulants, hydrogen peroxide, lime, chlorine, sulfuric acid, sodium metabisulfiate,and anti-scalants. The use of such chemicals requires special precautions forsafety purposes [55]. A conventional pretreatment is an extremely complicatedchemical process. Due to its complexity and inefficiency compared to membranepretreatment, it frequently fails in providing the required seawater quality [56].Conventional filtration is also susceptible to inconsistent filtrate water quality whenthe feedwater quality varies. In addition, chemical addition and changing waterconditions can lead to an operator intensive plant [57].
9.4.2 Membrane Pretreatment
The failure of conventional methods to produce treated seawater capable of reducingthe fouling tendencies of RO plants and the high cost of specific operations of suchconventional methods are the main factors that lead to the use of membrane filtrationas a pretreatment to RO [4]. Membrane technology is widely accepted as a meansof producing various qualities of water from surface water, brackish water, andseawater. Over the past years, such processes have been widely adopted by differentindustries. The advantages of membrane processes as compared to conventionalprocess include [53, 58]:
• Little conditioning or ripening time after backwashing.• Limited or no chemical requirement. No chemicals are used apart from those for
cleaning the membranes, i.e., substantially reduced residues and by-products.

9 Combined Macromolecular Adsorption and Coagulation. . . 239
• Ease of operation and minimal operator involvement. The membrane plant iseasier to automate owing to its simple design and greater flexibility owing to itsmodular construction (e.g., later extension of capacity).
• Reduction of sludge and water volume.
Desirable membranes must have suitable porosity to ensure high volume flux,low pore sizes, and a narrow pore-size distribution to meet the separation require-ments, essential mechanical strength to withstand the pressure employed in theoperation, and also have high chemical and biological resistance [59]. Applicationof UF pretreatment has the benefits of a better/safer pretreatment compared toconventional pretreatment. It has the potential to reduce the cost of seawaterdesalination [60]. UF systems require significantly less space and often haveless power and chemical consumption than conventional pretreatment systems.As a result, UF membrane systems are a practical solution to seawater reverseosmosis (SWRO) pretreatment needs, especially for locations with limited spaceor variable seawater quality [57]. UF pretreatment also allows the economicalutilization of RO membranes in areas where membrane desalination has not beenconsidered as the appropriate technology due to difficult raw water conditions.UF, unlike conventional pretreatment technologies, provides a physical barrier tomicroorganisms, particulates, and colloids, which ensures that the RO plants canoperate on a continuous basis, at high and stable fluxes, at higher recovery rates,and also allow a better control of contaminants limit values [61].
Water Supply Company of North Holland and Kiwa combined UF/ultralowpressure RO for the treatment of surface water. Measurements showed >95%removal of haloacetic acids [62]. Removal of colloidal silica and bacteria can besignificant using UF membrane treatment [63]. In addition, removal of foulingconstituents of seawater is more efficient using UF pretreatment compared toconventional pretreatment [51]. A study by Van Hoof et al. [64] showed a reductionof turbidity from 3 to 4 NTU to around 0.3 NTU using UF. UF has the potential ofcomplete turbidity removal [65]. UF membrane pretreatment is a reliable technologycapable of providing consistently excellent quality water independently of thefluctuation in raw water quality [66, 67]. Installation of UF prior to RO may increasethe output of RO by >25% [68].
9.4.3 Fouling During Membrane Filtration
The loss of membrane flux due to fouling is a major impediment to the developmentof membrane processes for use in drinking water treatment [69]. The generalmechanistic view of NOM interactions with membranes which plays a major role inthe filtration process are [63, 70]:
• The NOM mixture has an intrinsic chemical nature (aromaticity, polarity,ionizable groups, etc.) and molecular size. The actual charge, configuration,

240 M. Al-Abri et al.
and chemical potential of the NOM in solution depend on the current solutionenvironment (pH, ionic strength, ion compositions, temperature, pressure, etc.),which varies throughout the filtration process.
• The combination of (a) the operating conditions of the filtration process (trans-membrane pressure and hydrodynamic mass transfer at the membrane/feedinterface); (b) the membrane geometry (porosity and pore size distribution),and (c) the membrane’s retention characteristics toward the NOM controls theNOM’s concentration at the membrane surface and in the pores.
• The chemical nature of the NOM; its concentration at the membrane fluid–solidinterfaces and the chemical and geometrical nature of the membrane (under thegiven solution conditions) control the amount (and degree) of gel or precipitateformation and reversible and irreversible adsorption that occurs.
• The NOM’s interfacial concentration, the interfacial solution’s viscosity, and themass and porosity of the adsorbed layer influence the hydrodynamic aspects offlux decline and the change in the filtration process’s apparent retention of theNOM through both porous media and physical property aspects.
Increasing the feed flow increases both permeate flow and recovery up until anoptimum feed flow is reached, then recovery begins to decline [71]. According toTeng et al. [63] low flux–high recovery operation is more suitable than high flux–low recovery approach for direct application on seawater UF. Intending to increasethe production capacity with higher flux has to be weighed carefully against theincrease in chemical cost of backwashing. Brehant et al. [51] showed that combinedMF/UF cannot operate at high-flux rates when treating highly fouling surface waterbecause of severe membrane fouling and plugging of fibers.
Membranes may be fouled by relatively hydrophilic and/or hydrophobic NOMcomponents, depending on NOM characteristics, membrane properties and operat-ing conditions [72]. The major contribution to fouling was attributed by the NOMfraction comprising small, neutral, hydrophilic compounds. The NOM fractionscomprising HA and FA made only a minor contribution to fouling [73]. Yiantsiosand Karabelas [74] studied the effect of colloid stability on membrane fouling.The rate of fouling was relatively low for hydrophobic fractions of NOM and forthe charged hydrophilic fraction. However, in the case of the neutral hydrophilicfraction, the rate of fouling was considerably faster. Colloidal material may causefouling by forming a cake on the membrane surface, while dissolved materialmay cause fouling by precipitating at the membrane surface or adsorption withinthe membrane pore space [73]. In the study by Jarusutthirak et al. [75], colloidalfractions showed high flux decline on UF membranes primarily due to the effects ofpore blockage. The hydrophobic and transphilic fractions exhibited less fouling thanthe colloids due to their molecular size as well as electrostatic repulsion betweenorganic acids and the membrane surface.

9 Combined Macromolecular Adsorption and Coagulation. . . 241
9.5 Coagulation
In general, very small particles are difficult to remove from water using conven-tional separation methods such as sedimentation and filtration. Those separationtechniques work very effectively for larger particles. The goal of coagulationand flocculation is to coalesce the smaller particles into larger and more easilyremoved particles (flocs). Removal of NOM by chemical coagulation requiresphysical/chemical incorporation into flocs, which are subsequently removed by asolid–liquid separation process [76]. Coagulation/flocculation processes are mainlyused for colloidal material removal, which cause color and turbidity [77]. HSinteract strongly with cationic additives, especially hydrolyzing metal coagulantsand cationic polyelectrolytes [78]. Kinetics of coagulant reactions is very fast and isnormally complete within the first few seconds after coagulant addition [79].
Due to the sensitivity of coagulation processes, different optimal doses wereobtained for different water and NOM qualities. Variations in the daily andseasonal raw water quality and chemistry issues such as pH, alkalinity, NOM,and temperature determine the optimum coagulant dose [79]. Coagulation has anoptimum dosage since a higher dose may result in an increase of the residualturbidity of the settled water; and, at low dosages, a substantial reduction of residualturbidity may be observed [80]. There exists a threshold coagulant concentrationvalue below which there is deleterious effect on plant operation. This implies thatfloc growth needs to proceed to a certain critical floc size prior to challengingmembrane filtration, which otherwise is, apparently, partially irreversibly cloggedby the flocculants solids [81].
Humic substances with higher apparent molecular weight and lower carboxylicacidities are preferentially removed by alum coagulation [76]. Enhancement ofcoagulation is more obvious when the organic content in water is relatively high [80]and the multivalency of the coagulant could conceivably lead to large aggregates[82]. Experimental results indicate that the removal of organics by coagulationis directly related to molecular weight. The interaction of alum with HS involvescomplexation, charge neutralization, precipitation, and adsorption. As the dosageis increased, the major mechanism of HS removal can be expected to shift fromcomplexation–charge neutralization–precipitation to adsorption [83].
Jar tests done by Bolto et al. [84] on reconstituted water with alum and/orcationic polyelectrolyte showed synergistic benefits from combinations of thetwo. The more hydrophobic NOM fractions were the most easily removed bythe polymer. The performance of cationic polymers improved significantly withincreasing charge density and molecular weight. In a study by Kam and Gregory[78], they disagreed in that there was no systematic effect of molecular weightin removing dissolved organic matter, but agreed in that the most highly chargedpolyelectrolyte showed good removal of HA (up to around 90%) over a fairly narrowrange of dosages. As the charge density of the polyelectrolyte decreases, the zoneof good removal becomes broader and the removal becomes progressively worse(to about 75%).For cationic polymers with a charge density of around 3 meq/g or

242 M. Al-Abri et al.
greater, there seems to be a simple one-to-one charge interaction, so that chargeneutralization occurs with a certain amount of added polymer charge, irrespectiveof charge density or molecular weight.
9.6 Integration of Coagulation with Membrane Filtration
Seawater pretreatment may constitute up to one fourth of the total costs of amembrane desalting facility [85]. Pretreatment may consist of chlorination, coagu-lation, sand filtration, acidification, anti-scalant, micro-filtration, and dechlorination[86]. Combination of different water treatment processes depend on the feedwaterquality, feedwater composition, and product requirements [7, 34, 51, 71]. The useof membrane separation as opposed to conventional clarification techniques permitsa much reduced flocculation time and, thus, a more compact plant [81]. Accordingto Kampa et al. [87], coagulation, sedimentation, and filtration (CSF) pretreatmentled to unacceptable colloidal fouling, which could not be improved by an additional(in line) filtration step. Additional pretreatment by UF showed a superior particleremoval. In addition, combined use of CSF/UF reduced biological parameterssignificantly; thereby, reducing the risks of a severe biofouling. Therefore, thetreatment scheme CSF-UF-RO was pursued for a practical application.
The literature contains many contradictory results on the effects of coagulationon membrane fouling. This contradiction may be attributed to the type of watertreated, type of coagulants and membranes used, and operational conditions.According to Abdessemed and Nezzal [88], coagulation improves the permeate fluxin a very significant way. The coupling makes it possible to modify the structureof the deposit on the surface of the membrane by the formation of larger particlesof flocs. Results obtained by Maartens et al. [82] indicate that a reduction in NOMconcentration by coagulation before filtration cannot reduce or prevent membranefouling. In fact, irreversible membrane fouling was much worse, indicating thatmore substances were adsorbed onto the membranes from the pretreated water,probably because metal-ions that remained in solution formed complexes with theNOM in the feed solution. On the contrary, Low et al. [89] stated that it is possible toprotect polypropylene membranes from fouling occurring inside the membranepores as well as the formation of a cake layer using a two-step coagulation usingferric chloride with anionic polyelectrolyte in the first step and aluminum coagulantin the second one.
Most studies available in the literature used inorganic coagulants combinedwith membrane filtration as pretreatment to seawater desalination. Recently, theindustry introduced polyelectrolyte coagulants as an aid to membrane pretreatment.Unfortunately, all available research studied the use of polyelectrolytes under lowsalinity feedwater conditions. The aim of this study is to investigate the benefits ofcombined polyelectrolyte coagulation and membrane filtration as pretreatment tobrackish water and seawater using synthetic water resembling their salinity.

9 Combined Macromolecular Adsorption and Coagulation. . . 243
Rea
l re
tent
ion
PEG Molecular Weight (kDa)
0.7
0.8
0.9
1.0
1 10
P005F
Fig. 9.2 P005F membrane real retention using polyethylene glycols (PEG)
9.7 P005F Membrane Properties
P005F polyethersulfone membrane used during the study was provided by Nadirfiltration GmbH (Germany). It has an MWCO of 5 kDa as specified by themanufacturer although a real retention study illustrated in Fig. 9.2 showed that themembrane has an MWCO of 3.6–3.8 kDa. In addition, atomic force microscopystudy showed that the membrane has a mean pore size of 10.0 nm and porosity of17.3%, as illustrated in Fig. 9.3. More details are provided in Hilal et al. [90].
9.8 Membrane Retention
9.8.1 Agglomerates of Humic Substance and Heavy Metals
9.8.1.1 Humic Substance Retention
The influence of salinity, HS concentration, and heavy metals concentration onHS retention is studied using P005F-UF membrane. HS retention decreased whensalinity level increased from 10,000 to 25,000 ppm NaCl, but no further in-crease in retention was experienced when salinity level was further increased to35,000 ppm NaCl, as shown in Fig. 9.2. HS retention using P005F operating at3 bar and initial feed concentration of 10 mg/l HS and 5 mg/l heavy metals was0.77 and 0.73 at salinity of 10,000 and 25,000 ppm NaCl, respectively, as shownin Fig. 9.4.
Cation sodium ions (NaC) are attracted to the area surrounding the anionicHS particles, forming a layer called the diffuse layer. As the salinity increases,

244 M. Al-Abri et al.
Fig. 9.3 3D topographic AFM image of P005F membrane under air environments
more counterions are added to the suspension and being attracted toward the HSparticles causes the diffuse layer to compress [91]. Ionic strength has an effecton HS retention due to the increased coiling of HS molecules with increasingionic strength. At low salinity level, HS functional groups are stretched. Whensalinity level is increased, these groups curl up and aggregate causing reductionin size of colloids, thus increasing HS permeability, as shown in Fig. 9.5 [8]. Thisphenomenon is called double-layer compression [91]. Discussion of the effects ofhigh-level salinity (35,000 ppm NaCl) is provided in Sect. 9.8.2.
HS retention slightly decreased with increasing HS concentration, as shown inFig. 9.4. HS retention using P005F operating at 3 bar and initial feed concentrationof 25,000 ppm NaCl and 10 mg/l heavy metals was 0.73, 0.71, and 0.68 at HSconcentration of 10, 20, and 30 mg/l, respectively. As HS concentration increases,the number of HS species settling at the surface of membrane will increase. Thissettling will enhance concentration polarization at the surface of the membrane andreduce HS retention.
Figure 9.4 shows the effect of heavy metals concentration on HS retention. Heavymetals concentration did not affect HS retention. Retention of HS using P005Foperating at 3 bar and initial feed concentration of 25,000 ppm NaCl and 10 mg/lHS was 0.72, 0.73, and 0.73 at heavy metals concentration of 0, 5, and 10 mg/l,respectively. The same trend was experienced by Alpatova et al. [28] and Verbychet al. [92] using UF membranes.
Divalent ions affect HS removal through double-layer compression similar tomonovalent ion effect. Divalent ions also affect HS removal through chemical

9 Combined Macromolecular Adsorption and Coagulation. . . 245
Humic substance concentration (mg/l)
HS
rete
ntio
n
0.7
0.8a
b
0 10 20 30 40
0 10 20 30 400.6
0.7
0.6
0.8
0 mg/l heavy metals5 mg/l heavy metals10 mg/l heavy metals
0 mg/l heavy metals5 mg/l heavy metals10 mg/l heavy metals
Fig. 9.4 Effect of salinity, HS concentration and heavy metals concentration on HS retention;P005F membrane operating at 3 bar. (a) 10,000 ppm NaCl and (b) 25,000 ppm NaCl
association. It is well known that HS offers binding and mobility sites for heavymetals in aquatic water and soil [93]. It may be hypothesized that the effect ofdouble-layer compression (reducing HS colloids’ size) is opposed by the chemicalaggregation of heavy metals with HS (increasing the size of resultant colloids).Thus, the aggregation effects of heavy metals and HS did not affect HS retentionusing the tested P005F membrane. More details are presented elsewhere [94, 95].
9.8.1.2 Cu and Zn Retention
The influence of salinity, HS concentration, and heavy metals concentration onheavy metals retention was studied using P005F membrane. Heavy metal solutionsconsists of equal concentration of Cu, Co, Ni, Zn, and Cd, Co, Ni, and Cd retentionwill not be discussed in this study.
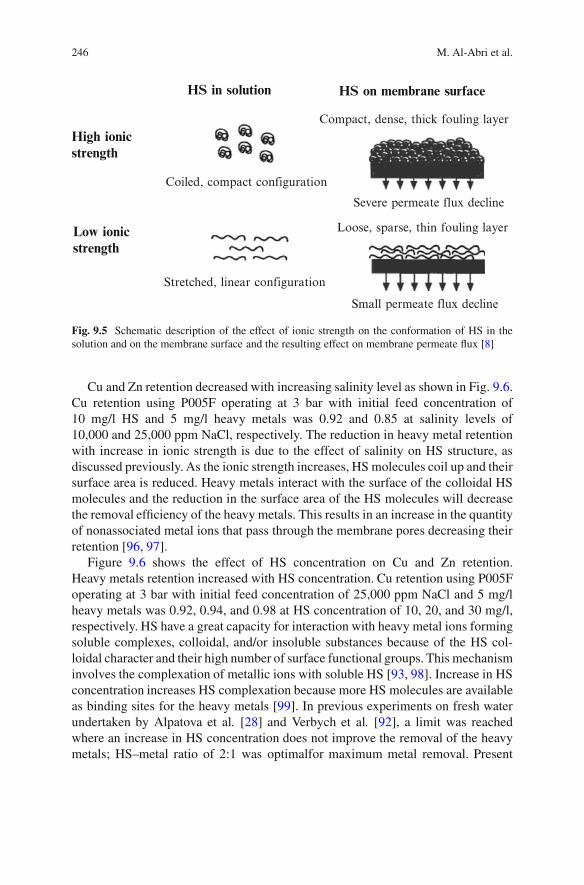
246 M. Al-Abri et al.
HS in solution HS on membrane surface
High ionicstrength
Low ionicstrength
Coiled, compact configuration
Stretched, linear configuration
Compact, dense, thick fouling layer
Severe permeate flux decline
Loose, sparse, thin fouling layer
Small permeate flux decline
Fig. 9.5 Schematic description of the effect of ionic strength on the conformation of HS in thesolution and on the membrane surface and the resulting effect on membrane permeate flux [8]
Cu and Zn retention decreased with increasing salinity level as shown in Fig. 9.6.Cu retention using P005F operating at 3 bar with initial feed concentration of10 mg/l HS and 5 mg/l heavy metals was 0.92 and 0.85 at salinity levels of10,000 and 25,000 ppm NaCl, respectively. The reduction in heavy metal retentionwith increase in ionic strength is due to the effect of salinity on HS structure, asdiscussed previously. As the ionic strength increases, HS molecules coil up and theirsurface area is reduced. Heavy metals interact with the surface of the colloidal HSmolecules and the reduction in the surface area of the HS molecules will decreasethe removal efficiency of the heavy metals. This results in an increase in the quantityof nonassociated metal ions that pass through the membrane pores decreasing theirretention [96, 97].
Figure 9.6 shows the effect of HS concentration on Cu and Zn retention.Heavy metals retention increased with HS concentration. Cu retention using P005Foperating at 3 bar with initial feed concentration of 25,000 ppm NaCl and 5 mg/lheavy metals was 0.92, 0.94, and 0.98 at HS concentration of 10, 20, and 30 mg/l,respectively. HS have a great capacity for interaction with heavy metal ions formingsoluble complexes, colloidal, and/or insoluble substances because of the HS col-loidal character and their high number of surface functional groups. This mechanisminvolves the complexation of metallic ions with soluble HS [93, 98]. Increase in HSconcentration increases HS complexation because more HS molecules are availableas binding sites for the heavy metals [99]. In previous experiments on fresh waterundertaken by Alpatova et al. [28] and Verbych et al. [92], a limit was reachedwhere an increase in HS concentration does not improve the removal of the heavymetals; HS–metal ratio of 2:1 was optimalfor maximum metal removal. Present

9 Combined Macromolecular Adsorption and Coagulation. . . 247
Humic substance concentration (mg/l)
Hea
vy m
etal
s re
tent
ion
0.2
0.4
0.6
0.8
1.0
0 10 20 30 40
Cu : 10,000 ppm NaClCu : 25,000 ppm NaClZn : 10,000 ppm NaClZn : 25,000 ppm NaCl
Fig. 9.6 Effect of salinity and HS concentration on heavy metals retention using P005F membraneoperating at 3 bar; Initial feed concentration of 5 mg/l heavy metals
Humic substance concentration (mg/l)
Hea
vy m
etal
s re
tent
ion
0.2
0.4
0.6
0.8
1.0
0 10 20 30 40
Cu : 5 mg/l heavy metals
Cu : 10 mg/l heavy metals
Zn : 5 mg/l heavy metalsZn : 10 mg/l heavy metals
Fig. 9.7 Effect of heavy metals concentration on heavy metals retention using P005F membraneoperating at 3 bar; Initial feed concentration of 25,000 ppm NaCl
results show a higher ratio; between 2:1 and 4:1. This limit was not experienced inthis study due to the effect of salinity on the aggregation of heavy metals with HSmolecules. Salinity compresses HS colloidal structure and reduces their active sites,as discussed previously. This will increase the amount of HS molecules required toobtain the same heavy metal removal.
Figure 9.7 shows the effect of heavy metal concentration on heavy metal reten-tion. Heavy metal retention decreased with increasing heavy metal concentration.Cu retention using P005F operating at 3 bar with initial feed concentration of25,000 ppm NaCl and 10 mg/l heavy metals was 0.84 and 0.71 at heavy metals

248 M. Al-Abri et al.
concentration of 5 and 10 mg/l, respectively. Retention of heavy metals decreaseswhen heavy metal concentration is increased due to the increase in concentrationpolarization at the surface of the membrane. When heavy metals concentrationis increased, more metal ions are available in the bulk solution. These ions aretransported to the surface of the membrane, where they accumulate and increaseconcentration polarization, thus reducing retention. In addition, increasing heavymetals concentration will increase the amount of dissociated heavy metals insolution due to limitation of heavy metals binding with HS.
Heavy metals retention is in the range of Cu (II)>Zn (II) using P005F, as shownin Fig. 9.7. Heavy metals retention is dependent on metal ions size, their stabilityconstants, and the reactivity and selectivity of HS [28, 92]. The molecular weightsof the studied heavy metals are 63.4 and 65.4 Da for Cu (II) and Zn (II), respectively.As the metals’ molecular weight increases, their binding with HS colloids decreases.In addition, metals with higher stability constants form more stable complexes withHS. Stability constants (Log K values) of the studied heavy metals are 4.6 and 3.1for Cu (II) and Zn (II), respectively [100].
9.8.2 Humic Substance Coagulation
The influence of salinity, HS concentration, and polyelectrolyte type and concen-tration on HS retention are investigated using P005F membrane. HS retentiondecreased when salinity level increased from 10,000 to 25,000 ppm NaCl, butno further increase in retention was experienced when salinity level was furtherincreased to 35,000 ppm NaCl, as shown in Fig. 9.7. HS retention using P005Foperating at 3 bar with initial feed concentration of 10 mg/l HS and 1 mg/lPDADMAC was 0.88, 0.82, and 0.83 at salinity levels of 10,000, 25,000, and35,000 ppm NaCl, respectively.
Salinity effects on HS retention with polyelectrolyte coagulation follow the samebehavior as the effect of salinity on HS retention with heavy metals agglomeration,as discussed previously. At low salinity level, HS functional groups are stretched.As salinity increases, these groups curl up and aggregate causing reduction in size ofcolloids due to double-layer compression [91]. The increase in salinity from 25,000to 35,000 ppm did not exert any change in HS retention due to the very high salinityof the feed; salinity is no longer an important factor. The stability of HS is a functionof the attraction and the repulsive forces. The attraction force is independent of theionic strength; whereas, the repulsive force is affected by ionic strength. Repulsiveforce affects the stability of HS through the factors
P �niz2i
��1and e� P
.niz2i /, where
zi is the valency and ni is the number of ions of the ith species per unit volume. Dueto the negative exponential factor, the increase in double-layer compression willrapidly become smaller as the ionic strength grows. Therefore, at a certain point HScolloids can be considered fully destabilized and any additional increase in ionicstrength will not affect the HS colloidal structure [101].
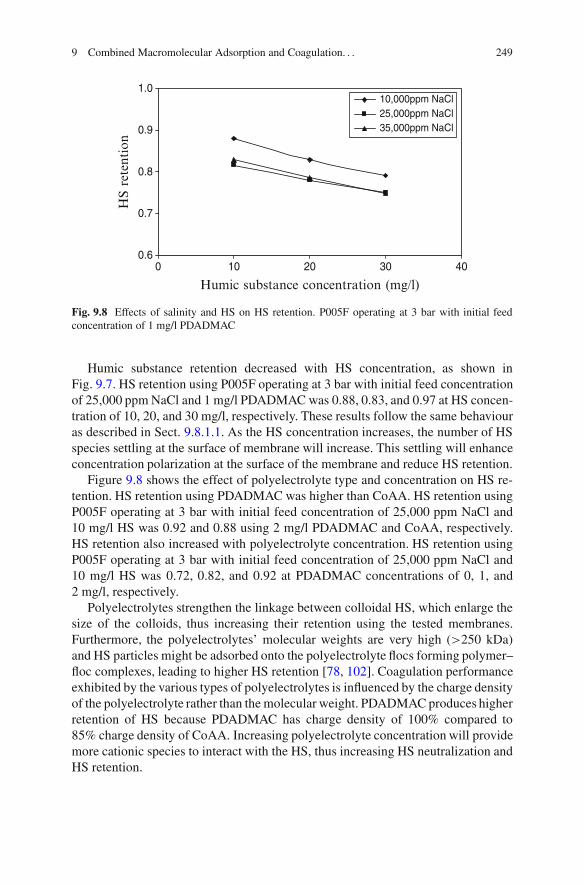
9 Combined Macromolecular Adsorption and Coagulation. . . 249
Humic substance concentration (mg/l)
HS
rete
ntio
n
0.6
0.7
0.8
0.9
1.0
0 10 20 30 40
10,000ppm NaCl25,000ppm NaCl35,000ppm NaCl
Fig. 9.8 Effects of salinity and HS on HS retention. P005F operating at 3 bar with initial feedconcentration of 1 mg/l PDADMAC
Humic substance retention decreased with HS concentration, as shown inFig. 9.7. HS retention using P005F operating at 3 bar with initial feed concentrationof 25,000 ppm NaCl and 1 mg/l PDADMAC was 0.88, 0.83, and 0.97 at HS concen-tration of 10, 20, and 30 mg/l, respectively. These results follow the same behaviouras described in Sect. 9.8.1.1. As the HS concentration increases, the number of HSspecies settling at the surface of membrane will increase. This settling will enhanceconcentration polarization at the surface of the membrane and reduce HS retention.
Figure 9.8 shows the effect of polyelectrolyte type and concentration on HS re-tention. HS retention using PDADMAC was higher than CoAA. HS retention usingP005F operating at 3 bar with initial feed concentration of 25,000 ppm NaCl and10 mg/l HS was 0.92 and 0.88 using 2 mg/l PDADMAC and CoAA, respectively.HS retention also increased with polyelectrolyte concentration. HS retention usingP005F operating at 3 bar with initial feed concentration of 25,000 ppm NaCl and10 mg/l HS was 0.72, 0.82, and 0.92 at PDADMAC concentrations of 0, 1, and2 mg/l, respectively.
Polyelectrolytes strengthen the linkage between colloidal HS, which enlarge thesize of the colloids, thus increasing their retention using the tested membranes.Furthermore, the polyelectrolytes’ molecular weights are very high (>250 kDa)and HS particles might be adsorbed onto the polyelectrolyte flocs forming polymer–floc complexes, leading to higher HS retention [78, 102]. Coagulation performanceexhibited by the various types of polyelectrolytes is influenced by the charge densityof the polyelectrolyte rather than the molecular weight. PDADMAC produces higherretention of HS because PDADMAC has charge density of 100% compared to85% charge density of CoAA. Increasing polyelectrolyte concentration will providemore cationic species to interact with the HS, thus increasing HS neutralization andHS retention.

250 M. Al-Abri et al.
Polyelectrolyte concentration (mg/l)
HS
rete
ntio
n
0.6
0.7
0.8
0.9
1.0
0 10 20 30 40
No coagulant1.0 mg/l PDADMAC
2.0 mg/l PDADMAC1.0 mg/l CoAA2.0 mg/l CoAA
Fig. 9.9 Effects of polyelectrolyte type and concentration on HS retention. P005F operating at3 bar with initial feed concentration of 25,000 ppm NaCl
9.8.3 Humic Substance and Heavy Metals Coagulation
9.8.3.1 Humic Substance Retention
The influence of salinity, HS concentration, heavy metals concentration and poly-electrolyte type and concentration on HS retention was studied using P005Fmembrane. Humic substance retention decreased with increasing salinity level usingP005F membrane at low polyelectrolyte concentration. No effect of salinity on HSretention was experienced at high polyelectrolyte concentration, although highestHS retention was achieved at lower polyelectrolyte concentration using 10,000 ppmNaCl, as shown in Fig. 9.9. HS retention was 0.86 and 0.81 at 10,000 and25,000 ppm NaCl, respectively, at initial feed concentration of 2 mg/l PDADMAC,while HS retention was 0.98 and 0.99 at 10,000 and 25,000 ppm NaCl, respectively,at initial feed concentration of 2 mg/l PDADMAC. Maximum HS retention wasreached at 5 and 7 mg/l PDADMAC at 10,000 and 25,000 ppm NaCl, respectively.These results show the same behavior as previous results discussed in Sect. 9.8.1.Due to the coiling of HS structure and compression of the double layer withincreased ionic strength, HS colloidal size decreases; thus, a reduction in HSretention is experienced. At high polyelectrolytes concentration, salinity does notplay a major role in HS retention since maximum HS retention is achieved due tothe addition of high polyelectrolyte dosage.
HS retention decreased with increasing HS concentration using P005F mem-branes, as shown in Fig. 9.10. HS retention using P005F operating at 3 bar at was0.91, 0.85, and 0.81 at HS concentration of 10, 20, and 30 mg/l, respectively. Theseresults follow a similar behavior as previous results discussed in Sect. 9.8.1. AsHS concentration increases, the number of HS species settling at the surface of

9 Combined Macromolecular Adsorption and Coagulation. . . 251
Polyelectrolyte concentration (mg/l)
HS
rete
ntio
n
0.7
0.8
0.9
1.0
0 4 8 12 16
10kppm NaCl
25kppm NaCl
Fig. 9.10 Effects of membrane type and salinity on HS retention using P005F membraneoperating at 3 bar. Initial feed concentration of 30 mg/l HS, 5 mg/l heavy metals and usingPDADMAC
membrane will increase. This settling will enhance concentration polarization atthe surface of the membrane and reduces HS retention. At high polyelectrolyteconcentration, similar maximum HS retention was achieved at all studied HSconcentrations, although a higher polyelectrolyte concentration was required toreach the maximum achievable HS retention at higher HS concentrations, as shownin Fig. 9.10. Maximum HS retention reached using P005F was 0.99 and wasachieved at PDADMAC dose of 3, 5, and 7 mg/l at HS concentration of 10, 20,and 30 mg/l, respectively.
Comparison of HS coagulation without heavy metals results, Sect. 9.8.1, withHS and heavy metals coagulation shows that the addition of heavy metals does notincrease HS retention at the same conditions, as illustrated in Fig. 9.11. HS retentionusing P005F was 0.81 and 0.82 at 5 and 10 mg/l heavy metals, respectively. As statedpreviously, the effect of double-layer compression (reducing HS colloids’ size) isopposed by the chemical aggregation of heavy metals with HS (increasing the sizeof the resultant colloids).
Figure 9.11 shows the effect of polyelectrolyte type and concentration on HSretention using P005F membrane. Typical to the results shown in Sect. 9.8.2,PDADMAC produced higher HS retention compared to CoAA at low polyelec-trolyte concentration. HS retention was 0.81 and 0.77 for PDADMAC and CoAA,respectively, at 2 mg/l polyelectrolyte. Coagulation performance exhibited bythe various types of polyelectrolytes is influenced by the charge density of thepolyelectrolyte rather than the molecular weight. PDADMAC produces higherretention of HS because PDADMAC has a higher charge density of 100% comparedto 85% charge density of CoAA. Furthermore, no difference in HS retention usingPDADMAC and CoAA was observed at high polyelectrolyte concentration. HSretention was 0.99 for both polyelectrolytes at 7 mg/l. Increase in polyelectrolyteconcentration increased HS retention until the maximum retention was achieved.

252 M. Al-Abri et al.
Polyelectrolyte concentration (mg/l)
HS
rete
ntio
n
0.7
0.8
0.9
1.0
0 4 8 12 16
10mg/l HS20mg/l HS30mg/l HS
Fig. 9.11 Effects of HS concentration on HS retention using P005F membrane operating at 3 bar.Initial feed concentration of 25,000 ppm NaCl, 5 mg/l heavy metals, and using PDADMAC
Further increase in polyelectrolyte concentration deteriorated HS retention, asshown in Fig. 9.11. HS retention was 0.75, 0.81, 0.93, 0.99, 0.99, and 0.77 atPDADMAC concentration of 1, 2, 5, 7, 10, and 15 mg/l, respectively. Increasingpolyelectrolyte concentration will provide more cationic species to interact withthe HS, which increases HS neutralization, thus increasing HS retention. Atpolyelectrolyte concentration higher than the optimum dosage, HS colloids will besurrounded by excess polyelectrolyte molecules leading to high electrostatic andsteric repulsion thus reducing HS retention.
9.8.3.2 Cu and Zn Retention
The influence of salinity, HS concentration, heavy metals concentration, andpolyelectrolyte type and concentration on Cu and Zn retention was studied. Cuand Zn retention decreased slightly with increasing salinity at low polyelectrolyteconcentration as shown in Fig. 9.12. Cu retention was 0.99 and 0.96 at salinity levelsof 10,000 and 25,000 ppm NaCl, respectively. Reduction in heavy metal retentionwith increase in ionic strength is due to the effect of salinity on HS structure, asexplained earlier in Sect. 9.8.1.2. As the ionic strength increase, HS moleculescoil up reducing their colloidal surface area. Contraction of HS double layer will,thereby, reduce the probability of HS–metal interaction. This results in an increasein the quantity of nonassociated metal ions that pass through the membrane poresand decreases retention.
Figure 9.13 shows the effect of HS concentration on Cu and Zn retention. Cuand Zn retention increased with HS concentration. Cu retention was 0.86, 0.92, and0.96 at HS concentration of 10, 20, and 30 mg/l, respectively. These results follow

9 Combined Macromolecular Adsorption and Coagulation. . . 253
Polyelectrolyte concentration (mg/l)
HS
rete
ntio
n
0.6
0.7
0.8
0.9
1.0
0 4 8 12 16
PDADMAC : 5mg/l HMPDADMAC : 10mg/l HMCoAA : 5mg/l HMCoAA : 10mg/l HM
Fig. 9.12 Effects of heavy metals (HM) concentration on HS retention using P005F membraneoperating at 3 bar. Initial feed concentration of 25,000 ppm NaCl and 30 mg/l HS
Polyelectrolyte concentration (mg/l)
Hea
vy m
etal
s re
tent
ion
0.2
0.4
0.6
0.8
1.0
0 5 10 15 20
Cu : 10,000 ppm NaClZn : 10,000 ppm NaClCu : 25,000 ppm NaClZn : 25,000 ppm NaCl
Fig. 9.13 Effect of salinity on Cu and Zn retention using P005F membrane operating at 3 bar.Initial feed concentration of 30 mg/l HS, 5 mg/l heavy metals and using PDADMAC
a similar trend to previous experiments discussed in Sect. 9.8.1.2. As explainedpreviously, due to properties of HS colloidal surface, HS have a great capacityfor interaction with heavy metal ions. This mechanism involves the complexationof metallic ions with soluble HS. Increase in HS concentration increases humicsubstance complexation because more HS molecules are available as binding sitesfor the heavy metals.
Figure 9.14 shows the effect of heavy metal concentration on Cu and Zn reten-tion. Heavy metal retention decreased with increasing heavy metal concentration.

254 M. Al-Abri et al.
Polyelectrolyte concentration (mg/l)
Hea
vy m
etal
s re
tent
ion
0.2
0.4
0.6
0.8
1.0
0 5 10 15 20
Cu : 10 mg/l HSZn : 10 mg/l HSCu : 20 mg/l HSZn : 20 mg/l HSCu : 30 mg/l HSZn : 30 mg/l HS
Fig. 9.14 Effect of HS concentration on Cu and Zn retention using P005F membrane operating at3 bar. Initial feed concentration of 25,000 ppm NaCl, 5 mg/l heavy metals, and using PDADMAC
Cu retention was 0.95 and 0.89 at heavy metals concentration of 5 and 10 mg/l,respectively. These results follow a similar trend to previous results discussedin 9.8.1.2. Retention of heavy metals decreases when heavy metal concentrationis increased due to the increase in concentration polarization at the surface ofthe membrane. When heavy metals concentration is increased, more metal ionsare available in the bulk solution. These ions are transported to the surface of themembrane, where they accumulate and increase concentration polarization, thusreducing retention. In addition, increasing heavy metals concentration will increasethe amount of dissociated heavy metals in solution due to limitation of heavy metalsbinding with HS.
Figure 9.15 shows the effect of polyelectrolyte type and concentration on Cu andZn. Cu and Zn retention using PDADMAC was higher than CoAA. Cu retentionwas 0.96 and 0.93 for PDADMAC and CoAA, respectively. PDADMAC higherretention of heavy metals is due to its higher retention of HS. Metal retention isdependent on HS retention using P005F membrane as discussed previously. As HSretention increase, metals retention increase.
Increasing polyelectrolyte concentration increased Cu and Zn retention untilmaximum retention is achieved. Further increase in polyelectrolyte concentrationreduced metal retention. Cu retention was 0.95, 0.96, 0.98, 0.98, 0.98, and 0.94at 1, 2, 5, 7, 10, and 15 mg/l PDADMAC, respectively. As explained previously,metals retention using UF membranes is dependent on HS retention. An increaseor decrease in HS retention due to the effect of polyelectrolyte will increase metalsretention.

9 Combined Macromolecular Adsorption and Coagulation. . . 255
Polyelectrolyte concentration (mg/l)
Hea
vy m
etal
s re
tent
ion
0.2
0.4
0.6
0.8
1.0
0 5 10 15 20
5 mg/l Cu
5 mg/l Zn
10 mg/l Cu
10 mg/l Zn
Fig. 9.15 Effect of heavy metals concentration on Cu and Zn retention using P005F membraneoperating at 3 bar. Initial feed concentration of 25,000 ppm NaCl, 30 mg/l HS, and usingPDADMAC
9.9 Membrane Fouling
9.9.1 Agglomerates of Humic Substance and Heavy Metals
Many factors affect membrane fouling such as membrane’s surface charge, proper-ties, and composition of the bulk solution and hydrodynamic conditions. Differentmembranes respond differently to any changes in these factors. The influence ofsalinity, HS concentration, and heavy metals concentration on P005F UF membranefouling were studied. Figure 9.16 shows the effect of salinity on membrane fouling.Increasing salinity level increased membrane fouling. P005F fouling at 3 bar andinitial feed concentration of 10 mg/l HS and 5 mg/l heavy metals were 27.1%and 32.3% at salinity levels of 10,000 and 25,000 ppm NaCl, respectively. Asexplained in Sect. 9.8.1, increasing the ionic strength compresses the diffuse layerof HS colloids. Double-layer compression will reduce HS colloidal charge and theelectrostatic repulsion between HS colloidal macromolecules. The reduction in HSinterchain repulsion will coil up HS colloids forming as a result a more denselypacked deposition of HS at the surface of the membrane and formation of a compactfouling layer, as shown in Fig. 9.5.
Figure 9.16 shows the effect of HS concentration on membrane fouling. In-creasing HS concentration increased membrane fouling. P005F fouling at 3 barand initial feed concentration of 25,000 ppm NaCl and 5 mg/l heavy metals were32.3%, 35.6%, and 37.9% at HS concentration of 10, 20, and 30 mg/l, respectively.As HS concentration increases, number of HS molecules settling at the surface ofmembrane increases. This settling enhances concentration polarization at the surfaceof the membrane and increases membrane fouling.

256 M. Al-Abri et al.
Polyelectrolyte concentration (mg/l)
Hea
vy m
etal
s re
tent
ion
0.2
0.4
0.6
0.8
1.0
0 5 10 15 20
Cu : PDADMACZn : PDADMAC
Cu : CoAAZn : CoAA
Fig. 9.16 Effect of polyelectrolyte type and concentration on Cu and Zn retention using P005Fmembrane operating at 3 bar. Initial feed concentration of 25,000 ppm NaCl, 30 mg/l HS, and5 mg/l heavy metals
Figure 9.16 shows the effect of heavy metals concentration on membranefouling. Membrane fouling increased with heavy metals concentration. P005Ffouling at 3 bar and initial feed concentration of 25,000 ppm NaCl and 10 mg/lHS were 31.2%, 32.3%, and 35.9% at heavy metals concentration of 0, 5, and10 mg/l, respectively. Unlike NaC cations, divalent cations interact specificallywith humic carboxyl functional groups; thus, substantially reducing HS charge andthe electrostatic repulsion between the HS macro-molecules. The reduction in HSinterchain repulsion results in increased HS deposition at the membrane surface andthe formation of a densely packed fouling layer.
9.9.2 Humic Substance Coagulation
The influence of salinity, HS concentration, and polyelectrolyte type and concentra-tion on membrane fouling was studied using P005F membrane. Figure 9.17 showsthe effect of salinity level on membrane fouling. Increasing salinity level from10,000 to 25,000 ppm NaCl increased fouling, but no further increase in foulingwas experienced when salinity was increased to 35,000 ppm NaCl. P005F foulingat 3 bar and initial feed concentration of 10 mg/l HS and 2 mg/l PDADMAC were30.1%, 36.0%, and 35.2% at salinity levels of 10,000, 25,000, and 35,000 ppmNaCl, respectively. Increasing the ionic strength compresses the diffuse layer ofHS colloids. Double-layer compression reduces the HS colloidal charge and theelectrostatic repulsion between HS colloidal macro-molecules. The reduction in HSinterchain repulsion will coil up HS colloids forming as a result a more denselypacked deposition of HS at the surface of the membrane and formation of a compact

9 Combined Macromolecular Adsorption and Coagulation. . . 257
Humic substance concentration (mg/l)
Mem
bran
e F
oulin
g (%
)
20
30
40
50a
b
0 mg/l heavy metals5 mg/l heavy metals10 mg/l heavy metals
20
30
40
50
0 10 20 30 40
0 10 20 30 40
0 mg/l heavy metals5 mg/l heavy metals10 mg/l heavy metals
Fig. 9.17 Effect of membrane type, salinity, and HS concentration on membrane fouling usingP005F operating at 3 bar. (a) 10,000 ppm NaCl and (b) 25,000 ppm NaCl
fouling layer. The increase in salinity from 25,000 to 35,000 ppm did not exert anychange in HS colloids; due to the very high salinity of feed, salinity is no longer animportant factor, as explained in Sect. 9.8.2.
Figure 9.17 shows the effect of HS concentration on membrane fouling. Mem-brane fouling increased with HS concentration. P005F fouling at 3 bar and initialfeed concentration of 25,000 ppm NaCl and 2 mg/l PDADMAC were 36.0%,39.2%, and 40.6% at HS concentration of 10, 20, and 30 mg/l, respectively. Theseresults follow a similar trend to previous results discussed in Sect. 9.9.1. As HSconcentration increases, the number of HS molecules settling at the surface ofmembrane will increase. This settling will enhance concentration polarization atthe surface of the membrane and increase membrane fouling.
Figure 9.18 shows the effect of polyelectrolyte type and concentration onmembrane fouling. No difference in fouling was experienced using PDADMACand CoAA coagulants. P005F fouling at 3 bar and initial feed concentration of25,000 ppm NaCl and 10 mg/l HS were 33.5% and 34.0% using 1 mg/l PDADMACand CoAA, respectively. In addition, membrane fouling increased with increasing

258 M. Al-Abri et al.
Humic substance concentration (mg/l)
Fou
ling
(%)
20
30
40
50
0 10 20 30 40
10,000ppm NaCl
25,000ppm NaCl
35,000ppm NaCl
Fig. 9.18 Effects of salinity and HS on membrane fouling using P005F operating at 3 bar. Initialfeed concentration of 2 mg/l PDADMAC
polyelectrolyte concentration. P005F fouling at 3 bar and initial feed concentrationof 25,000 ppm NaCl and 10 mg/l HS were 31.2%, 33.5%, and 36.0% at PDADMACconcentration of 0, 1, and 2 mg/l, respectively. The increase in fouling with increasein polyelectrolyte concentration is due to the increase in polyelectrolyte and colloidssettling at the surface of membrane. An increase in polyelectrolyte concentrationwill increase the amount of polyelectrolyte molecules settling at the surface of themembrane inducing concentration. The addition of polyelectrolyte also changes thestructure of the HS molecules enabling them to foul the membrane more extensively.
9.9.3 Humic Substance and Heavy Metals Coagulation
The influence of salinity, HS concentration, heavy metals concentration, andpolyelectrolyte type and concentration on membrane fouling were studied usingP005F membrane. Figure 9.19 shows the effect of salinity on membrane fouling.Increasing salinity level increased membrane fouling. P005F fouling was 36.0 and41.7% at salinity levels of 10,000 and 25,000 ppm NaCl, respectively. As explainedpreviously, increasing the ionic strength compresses the diffuse layer of HS colloids.Double-layer compression will reduce HS colloidal charge and the electrostaticrepulsion between HS colloidal macromolecules. The reduction in HS interchainrepulsion will coil up HS colloids forming as a result a more densely packeddeposition of HS at the surface of the membrane and formation of a compact foulinglayer as shown in Fig. 9.5.
Figure 9.20 shows the effect of HS concentration on membrane fouling. Increas-ing HS concentration increased fouling. P005F fouling was 37.0%, 39.0%, and41.7% at HS concentration of 10, 20, and 30 mg/l, respectively. These results showsimilar trend to previous results discussed in Sect. 9.9.1. As HS concentration in-

9 Combined Macromolecular Adsorption and Coagulation. . . 259
Polyelectrolyte concentration (mg/l)
Fou
ling
(%)
20
30
40
50
0 10 20 30 40
No coagulant1.0 mg/l PDADMAC2.0 mg/l PDADMAC1.0 mg/l CoAA2.0 mg/l CoAA
Fig. 9.19 Effects of polyelectrolyte type and concentration on membrane fouling using P005Foperating at 3 bar. Initial feed concentration of 25,000 ppm NaCl and 10 mg/l HS
Polyelectrolyte concentration (mg/l)
Mem
bran
e F
oulin
g (%
)
30
40
50
60
70
0 2 4 6 8 10 12 14 16
10kppm NaCl
25kppm NaCl
Fig. 9.20 Effect of salinity on membrane fouling using P005F membrane operating at 3 bar. Initialfeed concentration of 30 mg/l HS, 5 mg/l heavy metals, and using PDADMAC
creases, the number of HS molecules settling at the surface of membrane increases.This settling enhances concentration polarization and increases membrane fouling.
Figure 9.21 shows the effect of heavy metals concentration on membrane fouling.Membrane fouling increased with heavy metals concentration following similartrend as previous results discussed in Sect. 9.9.1. P005F fouling was 44.7% and45.9% at heavy metals concentration of 5 and 10 mg/l, respectively. As explainedpreviously, divalent cations interact specifically with humic carboxyl functionalgroups thus, substantially reducing HS charge and the electrostatic repulsionbetween the HS macromolecules. The reduction in HS interchain repulsion resultsin increased HS deposition at the membrane surface and the formation of a denselypacked fouling layer.

260 M. Al-Abri et al.
Mem
bran
e F
oulin
g (%
)
20
30
40
50
60
70
0 2 4 6 8 10 12 14 16
10mg/l HS20mg/l HS30mg/l HS
Polyelectrolyte concentration (mg/l)
Fig. 9.21 Effect of HS concentration on membrane fouling using P005F membrane operating at3 bar. Initial feed concentration of 25,000 ppm NaCl, 5 mg/l heavy metals, and using PDADMAC
Mem
bran
e F
oulin
g (%
)
Polyelectrolyte concentration (mg/l)
30
40
50
60
70
0 2 4 6 8 10 12 14 16
PDADMAC : 5mg/l HMPDADMAC : 10mg/l HMCoAA : 5mg/l HMCoAA : 10mg/l HM
Fig. 9.22 Effect of Heavy metals concentration and polyelectrolyte type and concentration onmembrane fouling using P005F membrane operating at 3 bar. Initial feed concentration of25,000 ppm NaCl and 30 mg/l HS
Figure 9.21 also shows the effect of polyelectrolyte type and concentrationon membrane fouling. No difference in fouling was experienced using PDAD-MAC and CoAA coagulants. P005F fouling was 44.7% and 45.9% using 2 mg/lPDADMAC and CoAA, respectively. In addition, fouling increased with increasingpolyelectrolyte concentration. P005F fouling was 41.7%, 44.7%, 48.7%, 52.9%,56.6%, and 60.9% at PDADMAC concentration of 1, 2, 5, 7, 10, and 15 mg/l,respectively. These results show similar behaviour to previous results discussedpreviously in Sect. 9.9.2. Increase in fouling with increasing polyelectrolyte con-centration is due to the increase in polyelectrolyte and colloids settling at the

9 Combined Macromolecular Adsorption and Coagulation. . . 261
surface of membrane. An increase in polyelectrolyte concentration will increasethe amount of polyelectrolyte molecules settling at the surface of the membraneinducing concentration. The addition of polyelectrolyte also changes the structure ofthe HS molecules enabling them to foul the membrane more extensively (Fig. 9.22).
Acknowledgment The authors would like to thank the Middle East Desalination Research Center(MEDRC) for funding this work (project number 03-AS-02).
References
1. Ebensperger U, Isley P (2005) Review of the current state of desalination. Water PolicyWorking Paper, 2005–008
2. Borsani R, Rebagliati S (2005) Fundamentals and costing of MSF desalination plants andcomparison with other technologies. Des J 182:29–37. doi:10.1016/j.desal.2005.03.007
3. Semiat R (2000) Desalination: present and future. IWRA 25:54–654. Nicolaisen B (2003) Developments in membrane technology for water treatment. Des J
153:355–360. doi:10.1016/S0011-9164(02)01127-X5. Ghabayen S, McKee M, Kemblowski M (2004) Characterization of uncertainties in the
operation and economics of the proposed seawater desalination plant in the Gaza Strip. Des J161:191–201. doi:10.1016/S0011-9164(04), 90054-9
6. Sikora J, Hansson C, Ericsson B (1989) Pretreatment and desalination of mine drainage waterin a pilot plant. Des J 75:363–373. doi:10.1016/0011-9164(89), 85022-2
7. Redondo J (2001) Brackish-, sea- and wastewater desalination. Des J 138:29–40.doi:10.1016/S0011-9164(01), 00241-7
8. Schaefer A, Schwicker U, Fischer M, Fane A, Waite T (2000) Microfiltration of colloids andnatural organic matter. J Membr Sci 171:151–172. doi:10.1016/S0376-7388(99), 00286-0
9. Wilkinson K, Negre J, Buffle J (1997) Coagulation of colloidal material in sur-face water: the role of natural organic matter. J Contaminant Hydrol 26:229–243.doi:10.1016/S0169-7722(96)00071-X
10. Costa A, De Pinho M (2002) The role of membrane morphology on ultrafiltration for naturalorganic matter removal. Des J 145:299–304. doi:10.1016/S0011-9164(02), 00426-5
11. Xu W, Chellam S, Clifford D (2004) Indirect evidence for deposit rearrangement dur-ing dead-end microfiltration of iron coagulated suspensions. J Membr Sci 239:243–254.doi:10.1016/j.memsci.2004.03.039
12. Hong S, Elimelech M (1997) Chemical and physical aspects of natural organicmatter (NOM) fouling of nanofiltration membranes. J Membr Sci 132:159–181.doi:10.1016/S0376-7388(97), 00060-4
13. Raspor B (1989) Adsorption of humic substances from seawater at differently chargedsurfaces. Sci Total Environ 81–82:319–328. doi:10.1016/0048-9697(89), 90139-3
14. Aiken G, McKnight D, Wershaw R, MacCarthy E (1985) Humic substances in soil, sediment,and water. Wiley, New York
15. Ruohomaki K, Vaisanen P, Metsamuuronen S, Kulovaara M, Nystrom M (1998) Character-ization and removal of humic substances in ultra- and nanofiltration. Des J 118:273–283.doi:10.1016/S0011-9164(98), 00147-7
16. De Paolis F, Kukkonen J (1997) Binding of organic pollutants to humic and fulvicacids: influence of pH and the structure of humic material. Chemosphere J 34:1693–1704.doi:10.1016/S0045-6535(97)00026-X
17. Amy G, Collins M, Kuo C, King P (1987) Comparing gel permeation chromatography andultrafiltration for the molecular weight characterization of aquatic organic matter. AWWA79:43–49

262 M. Al-Abri et al.
18. Rao L, Choppin G (1995) Thermodynamic study of the complexation of neptunium(V) withhumic acids. Radiochim Acta 69:87–95
19. Aiken G, Malcolm R (1987) Molecular weights of aquatic fulvic acids by vapor pressureosmometry. Geochim Cosmochim Acta 51:2177–2184
20. Beckett R, Zhang J, Giddings J (1987) Determination of molecular weight distributions offulvic and humic acids, using flow field-flow fractionation. Environ Sci Technol 21:289–295
21. Reid P, Wilkinson A, Tipping E, Jones M (1990) Determination of molecular weights ofhumic substances by analytical (UV scanning) ultracentrifugation. Geochim Cosmochim Acta54:131–138
22. Pokrovsky O, Schott J (2002) Iron colloids/organic matter associated transport of majorand trace elements in small boreal rivers and their estuaries (NW Russia). Chem Geol190:141–179
23. Munksgaard N, Parry D (2001) Trace metals, arsenic and lead isotopes in dissolved andparticulate phases of North Australian coastal and estuarine seawater. Mar Chem 75:165–184
24. Gavriil A, Angelidis M (2005) Metal and organic carbon distribution in water column of ashallow enclosed Bay at the Aegean Sea Archipelago: Kalloni Bay, Island of Lesvos, Greece.Estuar Coast Shelf Sci 64:200–210
25. Yates D, Joyce K, Heaney P (1998) Complexation of copper with polymeric silica in aqueoussolution. Appl Geochem 13:235–241
26. Goosen M, Sablani S, Al-Hinai H, Al-Obeidani S, Al-Belushi R, Jackson D (2005) Fouling ofreverse osmosis and ultrafiltration membranes: a critical review. Sep Sci Tech 39:2261–2297
27. Abu Qdais H, Moussa H (2004) Removal of heavy metals from wastewater by membraneprocesses: a comparative study. Des J 164:105–110
28. Alpatova A, Verbych S, Bryk M, Nigmatullin R, Hilal N (2004) Ultrafiltration of watercontaining natural organic matter: heavy metal removing in the hybrid complexation–ultrafiltration process. Sep Pur Tech 40:155–162
29. Harmant P, Aimar P (1998) Coagulation of colloids in a boundary layer during cross-flowfiltration. Colloids Surf A Physicochem Eng Asp 138:217–230
30. Kretzschmar R, Sticher H (1998) Colloid transport in natural porous media: Influence ofsurface chemistry and flow velocity. Phys Chem Earth 23:133–139
31. Eyrolle F, Benaim J (1999) Metal available sites on colloidal organic compounds in surfacewaters (Brazil). Water Res 33:995–1004
32. Tipping E, Lofts S, Lawlor A (1998) Modelling the chemical speciation of trace metals in thesurface waters of the Humber system. Sci Total Environ 210–211:63–77
33. Martell A (1957) The chemistry of metal chelates in plant nutrition. Soil Sci 84:13–2634. Pervov A, Andrianov A, Efremov R, Desyatov A, Baranov A (2003) A new solution for the
Caspian Sea desalination: low-pressure membranes. Des J 157:377–38435. Teuler A, Glucina K, Laine J (1999) Assessment of UF pretreatment prior RO membranes for
seawater desalination. Des J 125:89–9636. Schafer A, Fane A, Waite T (1998) Nanofiltration of natural organic matter: removal, fouling
and the influence of multivalent ions. Des J 118:109–12237. Schaefer A, Fane A, Waite T (2000) Fouling effects on rejection in the membrane filtration of
natural waters. Des J 131:215–22438. Agashichev S (2006) Enhancement of concentration polarization due to gel accumulated at
membrane surface. J Membr Sci 285:96–10139. Vrouwenvelder H, Van Paassen J, Folmer H, Hofman A, Nederlof M, Kooij D (1998)
Biofouling of membranes for drinking water production. Des J 118:157–16640. Vrouwenvelder J, Kappelhof J, Heijman S, Schippers J, Kooij D (2003) Tools for fouling
diagnosis of NF and RO membranes and assessment of the fouling potential of feed water.Des J 157:361–365
41. Van Der Bruggen B, Braeken L, Vandecasteele C (2002) Evaluation of parameters describingflux decline in nanofiltration of aqueous solutions containing organic compounds. Des J147:281–288
42. Isaias N (2001) Experience in reverse osmosis pretreatment. Des J 139:57–64

9 Combined Macromolecular Adsorption and Coagulation. . . 263
43. Luo M, Wang Z (2001) Complex fouling and cleaning in-place of a reverse osmosisdesalination system. Des J 141:15–22
44. Chua K, Hawlader M, Malek A (2003) Pretreatment of seawater: results of pilot trials inSingapore. Des J 159:225–243
45. Kaiya Y, Itoh Y, Fujita K, Takizawa S (1996) Study on fouling materials in the membranetreatment process for potable water. Des J 106:71–77
46. Clark M, Lucas P (1998) Diffusion and partitioning of humic acid in a porous ultrafiltrationmembrane. J Membr Sci 143:13–25
47. Jones K, O’Melia C (2000) Protein and humic acid adsorption onto hydrophilic membranesurfaces: effects of pH and ionic strength. J Membr Sci 165:31–46
48. Chang Y, Benjamin M (2003) Formation of natural organic matter fouling layer on ultrafiltra-tion membranes. Envir Eng J 129:25–32
49. Lee S, Lee C (2006) Microfiltration and ultrafiltration as a pretreatment for nanofiltration ofsurface water. J Sep Sci Tech 41:1–23
50. Choksuchart P, Heran M, Grasmick A (2002) Ultrafiltration enhanced by coagulation in animmersed membrane system. Des J 145:265–272
51. Brehant A, Bonnelye V, Perez M (2002) Comparison of MF/UF pretreatment with conven-tional filtration prior to RO membranes for surface seawater desalination. Des J 144:353–360
52. Derradji A, Taha S, Dorange G (2005) Application of the resistances in series model inultrafiltration. Des J 184:1357–1364
53. Clever M, Jordt F, Knauf R, Rabiger N, Rudebusch M, Hilker-Scheibel R (2000) Processwater production from river water by ultrafiltration and reverse osmosis. Des J 131:325–336
54. Bottino A, Capannelli C, Del Borghi A, Colombino M, Conio O (2001) Water treatment fordrinking purpose: ceramic microfiltration application. Des J 141:75–79
55. Stover R, Ameglio A, Khan P (2005) The ghalilah SWRO plant an overview of the solutionsadopted to minimize energy consumption. Des J 184:1197–1201
56. Gille D, Czolkoss W (2005) Ultrafiltration with multi bore membranes as seawater pre-treatment. Des J 182:295–301
57. Halpern D, McArdle J, Antrim B (2005) UF pretreatment for SWRO: pilot studies. Des J182:317–326
58. Kothari N, Taylor J (1998) Pilot scale microfiltration at Manitowoc. Des J 119:93–10259. Wang K, Matsuura T, Chung T, Guo W (2004) The effects of flow angle and shear rate within
the spinneret on the separation performance of poly(ethersulfone) (PES) ultrafiltration hollowfiber membranes. J Membr Sci 240:67–79
60. Cote P, Siverns S, Monti S (2005) Comparison of membrane-based solutions for waterreclamation and desalination. Des J 182:251–257
61. Wolf P, Siverns S, Monti S (2005) UF membranes for RO desalination pretreatment. Des J182:289–296
62. Kruithof J, Schippers J, Kamp P, Folmer H, Hofman J (1998) Integrated multi-objective mem-brane systems for surface water treatment: pretreatment of reverse osmosis by conventionaltreatment and ultrafiltration. Des J 117:37–48
63. Teng C, Hawlader M, Malek A (2003) An experiment with different pretreatment methods.Des J 156:51–58
64. Van Hoof S, Hashim A, Kordes A (1999) The effect of ultrafiltration as pretreatment to reverseosmosis in wastewater reuse and seawater desalination applications. Des J 124:231–242
65. Schafer A, Richards B (2005) Field testing of a hybrid membrane system for groundwaterdesalination. Des J 183:55–62
66. Glueckstern P, Priel M, Wilf M (2002) Field evaluation of capillary UF technology as apretreatment for large seawater RO systems. Des J 147:55–62
67. Hofman J, Beumer M, Baars E, Van Der Hoek J, Koppers H (1998) Enhanced surface watertreatment by ultrafiltration. Des J 119:113–125
68. Murrer J, Rosberg R (1998) Desalting of seawater using UF and RO – results of a pilot study.Des J 118:1–4

264 M. Al-Abri et al.
69. Speth T, Gusses A, Summers R (2000) Evaluation of nanofiltration pretreatments for flux losscontrol. Des J 130:31–44
70. Assemi S, Newcombe G, Hepplewhite C, Beckett R (2004) Characterization of naturalorganic matter fractions separated by ultrafiltration using flow field-flow fractionation. WaterRes 38:1467–1476
71. Hassan A, Farooque A, Jamaluddin A, Al-Amoudi A, Al-Sofi M, Al-Rubaian A, Kither N,Al-Tisan I, Rowaili A (2000) A demonstration plant based on the new NF-SWRO process.Des J 131:157–171
72. Lee H, Amy G, Cho J, Yoon Y, Moon S, Kim I (2001) Cleaning strategies for flux recoveryof an ultrafiltration membrane fouled by natural organic matter. Water Res 35:3301–3308
73. Carroll T, King S, Gary S, Bolto B, Booker N (2000) The fouling of microfiltrationmembranes by NOM after coagulation treatment. Water Res 34:2861–2868
74. Yiantsios S, Karabelas A (1998) The effect of colloid stability on membrane fouling. Des J118:143–152
75. Jarusutthirak C, Amy G, Croue P (2002) Fouling characteristics of wastewater effluent organicmatter (EfOM) isolates on NF and UF membranes. Des J 145:247–255
76. Kuo C, Amy G (1988) Factors affecting coagulation with aluminium sulphate-II: dissolvedorganic matter removal. Water Res 22:863–872
77. Al-Mutairi N, Hamoda M, Al-Ghusain I (2004) Coagulant selection and sludge conditioningin a slaughterhouse wastewater treatment plant. Bioresource Tech 95:115–119
78. Kam S, Gregory J (2001) The interaction of humic substances with cationic polyelectrolytes.Water Res 35:3557–3566
79. Vickers J, Thompson M, Kelkar U (1995) The use of membrane filtration in conjunction withcoagulation processes for improved NOM removal. Des J 102:57–61
80. Ma J, Liu W (2002) Effectiveness of ferrate (VI) preoxidation in enhancing the coagulationof surface waters. Water Res 36:4959–4962
81. Judd S, Hillis P (2001) Optimisation of combined coagulation and microfiltration for watertreatment. Water Res 35:2895–2904
82. Maartens A, Swart A, Jacobs E (1999) Feed-water pretreatment: methods to reduce membranefouling by natural organic matter. J Membr Sc 163:51–62
83. Huang C, Shiu H (1996) Interactions between alum and organics in coagulation. ColloidsSurf A: Physiochem Eng Aspects 113:155–163
84. Bolto B, Abbt-Braun G, Dixon D, Eldridge R, Frimmel F, Hesse S, King S, Toifl M (1999)Experimental evaluation of cationic polyelectrolytes for removing natural organic matter fromwater. Water Sci Technol 40:71–79
85. Gabelich C, Yun T, Coffey B, Mel Suffet I (2002) Effects of aluminum sulfate and ferricchloride coagulant residuals on polyamide membrane performance. Des J 150:15–30
86. Zidouri H (2000) Desalination in Morocco and presentation of design and operation of theLaayoune seawater reverse osmosis plant. Des J 131:137–145
87. Kampa P, Kruithof J, Folmer H (2000) UF/RO treatment plant Heemskerk: from challenge tofull scale application. Des J 131:27–35
88. Abdessemed D, Nezzal G (2002) Treatment of primary effluent by coagulation-adsorption-ultrafiltration for reuse. Des J 152:367–373
89. Low S, Han H, Jin W (2004) Characteristics of a vibration membrane in water recovery fromfine carbon-loaded wastewater. Des J 160:83–90
90. Hilal N, Al-Abri M, Al-Hinai H (2007) Characterization and retention of membranes usingPEG, HS and polyelectrolytes. Des J 206:568–578. doi:10.1016/j.desal.2006.02.077
91. O’Melia C, Becker W, Au K (1999) Removal of humic substances by coagulation. Water SciTechnol 40:47–54
92. Verbych S, Bryk M, Alpatova A, Chornokur G (2005) Ground water treatment by enhancedultrafiltration. Des J 179:237–244
93. Alvarez-Puebla R, Valenzuela-Calahorro C, Garrido J (2004) Retention of Co(II), Ni(II), andCu(II) on a purified brown humic acid. Modeling and characterization of the sorption process.Langmuir J 20:3657–3664

9 Combined Macromolecular Adsorption and Coagulation. . . 265
94. Hilal N, Al-Abri M, Moran A, Al-Hinai H (2008) Effects of heavy metals and poly-electrolytes in humic substance coagulation under saline conditions. Des J 220:85–95.doi:10.1016/j.desal.2007.01.024
95. Hilal N, Al-Abri M, Al-Hinai H, Somerfield C (2008) Combined humic substance andheavy metals agglomeration, and membrane filtration under saline conditions. Sep Sci Tech J43:1488–1506. doi:10.1080/01496390801941091
96. Spark K, Wells J, Johnson B (1997) Sorption of heavy metals by mineral-humic acidsubstrates. Aust J Soil Res 35:113–122
97. Spark K, Wells J, Johnson B (1997) The interaction of a humic acid with heavy metals. AustJ Soil Res 35:89–101
98. Alvarez-Puebla R, Valenzuela-Calahorro C, Garrido J (2004) Cu(II) retention on a humicsubstance. J Colloid Interface Sci 270:47–55
99. Zhou P, Yan H, Gu B (2005) Competitive complexation of metal ions with humic substances.Chemosphere J 58:1327–1337
100. Fukushima M, Nakayasu K, Tanaka S, Nakamura H (1995) Chromium(III) binding abilitiesof humic acids. Anal Chim Acta 317:195–206
101. Alaerts G, Van Haute A (1981) Flocculation of brackish water from a tidal river. Water Res15:517–523
102. Chang E, Chiang P, Tang W, Chao S, Hsing H (2005) Effects of polyelectrolytes on reductionof model compounds via coagulation. Chemosphere J 58:1141–1150

Chapter 10Hybrid Sonochemical Treatment ofContaminated Wastewater: Sonophotochemicaland Sonoelectrochemical Approaches. Part I:Description of the Techniques
B. Neppolian, M. Ashokkumar, I. Tudela, and J. Gonzalez-Garcıa
10.1 Introduction
The chemical and biological effects of ultrasound were reported by Loomis et al.about 80 years ago [1, 2]. Ultrasound as an initiator of chemical reactions and phys-ical transformations of material has emerged as a potential technology within lastfew decades (from 1970). There are widespread applications of ultrasound in manyindustrial fields. Ultrasound frequencies in the range 20 kHz–1 MHz have beenused in sonochemistry [3]. The physical and chemical effects of ultrasound havebeen widely used in numerous applications such as cleaning, degassing, polymer-ization, emulsification, drilling, cutting, flow measurements, imaging, biomedical,automotive, food preservation, drug delivery, and dairy industry [4, 5]. Ultrasoundirradiation has found use in plastic welding, drying, air scrubbing, and nebulization.It is used in manufacturing industries such as synthetic textiles and reinforcedcomposite materials [5]. Over the last two decades, new opportunities have emergedfor utilizing ultrasound for chemical reactions such as controlled synthesis ofnanomaterials and oxidation of organic pollutants (wastewater treatment) [6–22].
B. NeppolianSRM Research Institute, SRM University, Kattankulathur, Chennai 603203, Indiae-mail: b [email protected]
M. AshokkumarSchool of Chemistry, University of Melbourne, Melbourne, Australiae-mail: [email protected]
I. Tudela • J. Gonzalez-Garcıa (�)Grupo de Nuevos Desarrollos Tecnologicos en Electroquımica: Sonoelectroquımicay Bioelectroquımica, Departamento de Quımica Fısica e Instituto de Electroquımica,Universidad de Alicante, Alicante, Spaine-mail: [email protected]; [email protected]
S.K. Sharma and R. Sanghi (eds.), Advances in Water Treatment and PollutionPrevention, DOI 10.1007/978-94-007-4204-8 10,© Springer ScienceCBusiness Media Dordrecht 2012
267

268 B. Neppolian et al.
This chapter is concerned with the applications of ultrasound for the treatmentof water and wastewater in environmental remediation. The focus of this chapteris to introduce different experimental techniques that are commonly used for thedegradation of organic pollutants present in an aqueous environment.
10.2 Equipment
Sonochemical degradation of organic pollutants is a very simple process that canbe easily adapted to any working environment. Ultrasound waves are generated bytransducers that convert electrical energy into mechanical energy. The transducersmay be magnetostrictive- or piezoelectric-type materials [23]. Among the two types,piezoelectric transducers are commonly used in ultrasonic instruments. In lab-scalestudies, bath- and horn-type ultrasonicators are commonly used. Most experimentalstudies to date have used low-frequency (�20 kHz) horn type or high-frequencyplate type (100–600 kHz) sonicators (200–500 mL reactor capacity). In lab-scaleexperiments, reactors are fabricated mostly in Pyrex glass of about 1 L capacity.For industrial or pilot-scale studies, stainless steel reactors that can hold many high-frequency piezoelectric transducers of different capacity are used. Calorimetery isthe most common method used to measure the acoustic power delivered into theliquid.
10.3 Operational Variables
Sonochemistry is strongly influenced by many operational variables of ultrasoundsuch as frequency, power delivered to the liquid, different types of transducers,namely, horn type (low frequency, �20 kHz) and plate type (high frequency,�100 kHz–1 MHz), different modes of operation (pulse and normal mode),solution temperature, dual frequency configuration, geometry, and size of thereactor [24–29]. These are important considerations in the effective application ofultrasound for any particular type of chemical reaction. All operational variablesplay a significant role in the direction and efficiency of the sonochemical oxidationreactions that take place in the reactor [24, 25, 27]. For example, the choiceof frequency has a major impact on the sonochemical reactivity. Low-frequencyultrasound (20–100 kHz) generates a large bubble and as a result violent cavitationalcollapse occurs, producing higher localized temperatures and pressures at cavitationsites as well as strong shockwaves [23]. This cavitation effect is commonly used inindustry for cleaning particles bound to a surface and for wastewater treatment.Whereas, at higher frequencies (100 kHz–1 MHz), more cavitation events occur perunit time but the smaller bubbles tend to collapse less violently, producing lowertemperatures and pressures [29]. Hence, high-frequency ultrasound is used in the

10 Hybrid Sonochemical Treatment of Contaminated Wastewater. . . 269
electronics industry to clean components such as silicon wafers [3]. The productionof free radicals is much higher at higher frequencies and, hence, the rate of chemicalreactions is relatively faster.
Another important variable of ultrasound is acoustic power. Most of the com-mercially available ultrasonic equipments usually operate at a fixed frequency withvariable power levels [8, 9, 25, 30]. Depending on the nature of reactions, oneneeds to optimize the acoustic power to be delivered to the medium. Many reportshave demonstrated the importance of using optimal acoustic power in sonochemicalreactions. The use of higher acoustic power results in stronger cavitation events. Therate of oxidation of organic compounds, e.g., is greatly enhanced with an increasein acoustic power [8].
10.4 Lab-Scale Reactors Used in EnvironmentalRemediation
10.4.1 Low-Frequency Horn-Type Ultrasonic Reactors
10.4.1.1 Sonochemical-Oxidative Degradation of Organic Compounds
There have been many reports on utilizing low-frequency horn-type ultrasonicatorsfor the degradation of either volatile or nonvolatile organic pollutants. Simpleglass reactor vessels with a double wall for cooling water circulation have beenused in lab-scale studies. As an example, a low-frequency horn-type ultrasonicator(20 kHz) is used for the degradation of highly volatile organic compounds such asmethyl tert-butyl ether (MTBE) that is widely used in petroleum industry. MTBEis considered to be a potential carcinogen. The total degradation of MTBE wasachieved by ultrasound irradiation within a short period of time in the presenceof other oxidizing agents [8, 31]. MTBE is a highly volatile organic compoundand, hence, the reactor was fabricated in such a way that it remains air tightand could hold the volatile compound without releasing it into the atmosphere.Figure 10.1 shows the reactor setup used for the effective degradation of volatileorganic compounds by ultrasound, using a low-frequency horn-type ultrasonicator.The reactor assembly is made up of borosilicate glass of 150 mL equipped withan ultrasonicator (VCX-400 vibracell). The O-ring with metal collar connects theglass reactor to the stainless steel probe. Sampling and gas purging ports are sealedwith Teflon valves and covered with rubber septa. The temperature of the reactoris maintained by circulating cooling water between the double walls of the reactor,as shown in Fig. 10.1. The rate of degradation of MTBE steadily increased withan increase in power density of the ultrasonicator from 22 to 76 W and also witha rise in reactor solution temperature from 10ıC to 30ıC. In the presence of anoxidizing agent, potassium persulfate, the sonolytic rate of degradation of MTBEwas enhanced substantially. The intermediate products formed such as tert-butylformate and acetone were also completely degraded by this process [8].

270 B. Neppolian et al.
Fig. 10.1 Schematic diagram of a gas-tight glass reactor with a metal collar for attachment tostainless-steel sonication probe. This type of reactor design is recommended for the degradation ofvolatile compounds (Reproduced from Ref. [8]. With kind permission of © Elsevier (2002))
10.4.1.2 Sonochemical Oxidation of Highly Toxic As(III) Metalloidto Less Toxic As(V)
Ultrasound irradiation can also be used for the oxidation of metalloids, such asAs(III) to As(V). As(III) is highly toxic and more mobile than As(V). OnceAs(III) is oxidized to As(V), the latter can be easily removed from the water andwastewater systems by using conventional adsorption methods. Many researchershave used different techniques for the oxidation of As(III) to As(V) [32–37].Recently, Neppolian et al. reported on the effect of the sonochemical oxidationof As(III) to As(V) using a low-frequency horn-type ultrasonicator [24, 25]. OHradicals generated during acoustic cavitation oxidize As(III) to As(V). The physicalforces generated during acoustic cavitation at low ultrasound frequency (20 kHz)substantially enhanced the As(III) oxidation rate. Sonication in a pulse mode hasbeen found to show a profound effect on the rate of the oxidation of As(III) to As(V)in comparison with the continuous mode of operation. An almost two times higherrate of As(III) oxidation was observed in the pulse mode of ultrasonication. Further,the reaction rate was remarkably faster for the oxidation of As(III) to As(V) byultrasound in combination with other oxidizing agents such as peroxydisulfate [24].Figure 10.2 shows the percentage oxidation of As(III) to As(V) using low-frequency

10 Hybrid Sonochemical Treatment of Contaminated Wastewater. . . 271
Fig. 10.2 Effect of the different initial concentrations of As(III) on the rate of oxidation ofAs(III) to As(V). Experimental conditions: pH D 7, tip diameter D 19 mm and power D 36 W(Reproduced from Ref. [25]. With kind permission of © The American Chemical Society (2009))
Table 10.1 Amount ofAs(III) oxidized into As(V)after Sonication
Initial[As] (ppb)
Amount oxidizedin 10 min (ppb)
Amount oxidizedin 30 min (ppb)
500 325 500
750 390 690
1000 430 820
1500 680 1050
2000 690 1200
Reproduced from Ref. [25]. With kind permission of© The American Chemical Society (2009)
(20 kHz) sonication. It can be seen in this figure that the percentage of sonochemicaloxidation of As(III) increases with an increase in As(III) concentration. The datashown in Fig. 10.2 are processed for a better understanding of the effect of [As(III)]and presented in Table 10.1. It is clearly seen that the amount of oxidation ofAs(III) increases with an increasing concentration of As(III) [25]. For example,within 10 min of sonication time, 325 ppb of As(III) was oxidized into As(V)when the initial concentration of As(III) was 500 ppb, at the same time, 680 ppb ofAs(III) could be oxidized for the initial concentration of 1,500 or 2,000 ppb As(III).The same trend was observed for 30 min of reaction time (Table 10.1). Thus, theoverall oxidation was higher for the higher concentration of As(III). This is a greatadvantage of using the sonochemical method for oxidizing high concentration ofAs(III) [25].

272 B. Neppolian et al.
Fig. 10.3 TEM image of Auloaded-graphene oxideprepared by ultrasonicirradiation (Reproduced fromRef. [50]. With kindpermission of © TheAmerican Chemical Society(2010))
10.4.2 Ultrasonic Reactors with Plate-Type Transducers
High-frequency ultrasound in the range 100–700 kHz is suitable for degradationof organic pollutants. The production of OH radicals is generally high with highfrequency of the ultrasonicator [4]. Ashokkumar et al. reported that the amountof OH radicals obtained from a 200 kHz frequency ultrasonicator is about tentimes higher than that generated by using a 20 kHz horn sonicator [4]. Manyreports demonstrated the application of high-frequency ultrasound for the oxidationof organic compounds, such as different surfactants that are commonly used indomestic as well as industrial applications. The use of high-frequency ultrasoundefficiently degrades surfactants without the addition of any external chemicals orcatalysts [11, 13, 14]. Various other pollutants such as phenols and textile dyes werealso successfully degraded by high frequency of ultrasound [38–44].
Recently, catalyst assemblies, based on metal nanoparticles deposited on singleor few layers of graphene sheets, have gained considerable attention in a variety ofapplications ranging from photocatalysts to fuel cells and sensors to storage batteries[45–53]. Recently, Vinodgopal et al. [50] reported that high-frequency ultrasound at211 kHz was very effective for the simultaneous reduction of metallic precursorto pure metal as well as converting graphene into reduced graphene oxide. Thesonochemically prepared metal particles along with graphene oxide sheets werefound to be very stable over a long period of time. With high-frequency ultrasound,graphene oxide sheets consisting of few layers of (�2–3) could be obtained by thismethod. Further, due to the physical forces generated from the collapse of acousticcavitation during ultrasound irradiation, high levels of metal nanoparticles weredeposited on the sheets of graphene oxide, as shown in the following TEM image(Fig. 10.3). Thus, ultrasound is useful for reducing graphene very effectively as wellas for the effective loading of metal catalysts onto the sheets.

10 Hybrid Sonochemical Treatment of Contaminated Wastewater. . . 273
Cooling water-in Thermocouple
Cooling pipe
25 kHzGenerator
40 kHzGenerator
Rhodamine B solution
Transducers
Cooling water-out
Fig. 10.4 Schematic diagram of dual frequency bath reactor (Reproduced from Ref. [58]. Withkind permission of © Elsevier (2001))
10.4.3 Dual-Frequency Ultrasonic Reactors
It is generally reported that when using a single frequency transducer, the chemicalreaction zone is limited to the volume of propagation or transmission of ultrasonicwaves in a liquid medium. For large-scale industrial wastewater or water treatment,flow-through reactors attached with many transducers are required in order toachieve maximum volume for reaction. Few reports described the application ofdual frequencies for different sonochemical processes [54–57]. Sivakumar andPandit [58] fabricated a reactor, which could be operated for both continuous aswell as batch type reactions. Their study involved the degradation of rhodamine bluedye as a model pollutant to check the feasibility of the reactor for environmentalremediation. The reactor was made up of a stainless steel vessel and fitted with20 and 40 kHz frequency piezoelectric transducers, as shown in Fig. 10.4. Thisreactor can work either with single frequency or dual frequency. A cooling pipelocated inside the reactor (Fig. 10.4) was used for the circulation of water from athermostated bath in order to maintain the temperature at around 25ıC. The reactorwas operated at three modes: 20, 40, and 20 C 40 kHz. The results showed thatthere was no synergetic or detrimental effect on the degradation of the dye with dualfrequency. Only an additive effect of the separate frequencies was observed in the

274 B. Neppolian et al.
dual frequency mode. Despite the absence of a synergy effect, this work showed thatflow-through reactors are suitable for the effective treatment of large-scale volumesof wastewater containing organic pollutants.
10.5 Large Size Reactors
10.5.1 Multifrequency Reactors
Utilizing ultrasound for industrial-scale studies is a challenging issue with limitedinformation available in the literature. One has to study the effect of variousimportant parameters of ultrasound for a large-scale reactor. Gogate et al. [59]reported the effect of various operational variables of ultrasound such as frequencyof irradiation, use of multiple frequencies and power dissipation into the system onthe extent of degradation of Rhodamine B as a model pollutant with a 7.5 L capacityreactor. The configuration of hexagonal reactor setup is shown in Fig. 10.5, which
Fig. 10.5 Schematicrepresentation of triplefrequency flow cell used inthe experimental work(Reproduced from Ref. [59].With kind permissionof © Elsevier (2004))

10 Hybrid Sonochemical Treatment of Contaminated Wastewater. . . 275
Fig. 10.6 Scheme of the experimental setup: 1. Peristaltic pump; 2. three-stage sonochemicalreactor; 3. continuously stirred vessel (Reproduced from Ref. [60]. With kind permission of© Elsevier (1999))
consists of three different frequency transducers mounted on each side. A total of 18transducers with equal power rating of 50 W are present in the reactor. This reactorwas able to operate both batch as well as continuous mode of operation. There wereseven different configurations of frequencies (20, 30, 50, 20 C 30, 20 C 50, 30 C 50,and 20 C 30 C 50 kHz) that could be operated to control the effect of power andfrequency for a particular reaction. The maximum power dissipation was 900 Wwhen all transducers were in use with a combination of 20 C 30 C 50 kHz. Thisstudy revealed that the rate of degradation of Rhodamine B strongly depended onthe cavitation intensity of a particular application. Aeration and the presence of solidparticles could effectively enhance the rate of degradation of the dye. The aboveinformation is useful with respect to designing large- and appropriate-scale reactorsfor sonochemically assisted wastewater treatment.
10.5.2 Flow-Through Reactors
As a part of scale-up of the ultrasonic process for a large-scale wastewatertreatment, Petrier and coworkers [60] first reported a three stage sonochemicalreactor operating in continuous flow mode for the degradation of pentachlorophenol(PCP) as a model pollutant. Figure 10.6 shows the three stage sonochemical reactor

276 B. Neppolian et al.
Transducer
Booster
Cylindrical ultrasonic cavity
InletOutlet
Fig. 10.7 Cylindrical reactor of 35 kHz (Reproduced from Ref. [61]. With kind permission of© Elsevier (2003))
setup. Each unit consists of a 500 kHz piezoelectric disk with a variable powersupply in the range of 0–100 W. The temperature of the reaction solution wasmaintained at 20ıC using a cooling unit. The study involved the influence ofdifferent operating variables such as ultrasonic power, volume of the reactor, andvolumetric feed flow rate on the reactor performance. The rate of PCP degradationincreased with an increase in the acoustic power of the ultrasonicator. At the sametime, the reaction decreased with an increase in the flow rate of the solution. Therate of oxidation of phenol with the flow-type reactor mainly depended on acousticpower as well as flow rate of the solution, similar to other batch type reactors.According to theoretical as well as experimental results and interpretations, manychallenging factors need to be taken into consideration when scaling up this methodfor industrial-scale application is desired.
10.5.3 Cylindrical Reactors
Generally, geometry and size of reactors play a significant role in determining therate of a particular reaction. Many reports have described batch or semi-batch typereactors with square or rectangular shape for ultrasonic reactions. Petrier [61] wasable to fabricate a cylindrical flow-through reactor with three different frequencies(20, 35, and 500 kHz), operated in a continuous flow mode for the degradation ofphenol in aqueous solutions. Figure 10.7 shows the reactor assembly in which thereactor can be fitted with one of the transducers at a particular time. A titanium tube

10 Hybrid Sonochemical Treatment of Contaminated Wastewater. . . 277
40 cm
120 cm
35 cm
ProbeUltrasoniccavitation
meter
Acousticabsorbents
Measurementlocations
Transducermodule
Ultrasonic transducercontroller
Fig. 10.8 Schematic of the large-scale sonoreactor and the location of measurement of cavitationenergy (side view) (Reproduced from Ref. [62]. With kind permission of © Elsevier (2009))
was used for transmitting ultrasound waves at 20 kHz, whereas a piezoelectric diskfixed on a Pyrex plate emits ultrasound at 500 kHz. The degradation of phenol wascarried out using a continuous flow mode of operation within a reaction volumeof 350 mL. The rate of degradation of phenol was higher at 500 kHz than thatat 20 or 35 kHz. However, the cylindrical type flow reactor enhanced the rateof phenol oxidation at lower frequency (35 kHz) than that of higher frequency(500 kHz) in the presence of oxidizing agent H2O2 and copper sulfate. Further, theintermediate products formed during the degradation of phenol were easily degradedby 35 kHz frequency. This is a simple and highly efficient way of degradationorganic pollutants by using cylindrical flow type reactor.
10.5.4 Large-Scale Reactors
It is necessary to study the effect of operational variables of ultrasound for large-scale reactors (>100 L capacity) during organic compound degradation. Thistype of study might give sufficient information to build a pilot-plant reactor forindustrial applications using ultrasound. Son et al. [62] described the performanceand the cavitation energy distribution in a large-scale reactor (250 L capacity).They were able to design a large-scale reactor with variable frequencies from 35 to170 kHz. Figure 10.8 shows a schematic representation of the reactor. The large-scale reactor consists of an acrylic bath (L 1.20 m � W 0.60 m) and ultrasonictransducer module placed at the face center of the reactor as shown in Fig. 10.8.The module has nine PZT transducers and can produce ultrasound at 35, 72, 110,and 170 kHz frequencies. The temperature of the reactor was maintained around18ıC. Among the various frequencies of the ultrasonicator, 72 kHz provided boththe maximum and uniform energy distribution throughout the large-scale reactor(Table 10.2). Many research reports suggested that high frequencies in the range of

278 B. Neppolian et al.
Table 10.2 Average cavitation energy in the whole sonoreactor
Frequency (kHz) 35 72 110 170Average cavitation energy (W) 53.50 83.87 6.41 0.10
Reproduced from Ref. [62]. With kind permission of © Elsevier (2009)
200–1,700 kHz were more efficient for complete and relatively faster degradationof pollutants in small-scale reactors. This is due the formation of large number ofbubbles at high frequencies that lead to more radical production. However, in large-scale reactors, the energy distribution was found to be very high and uniform onlyfor low-frequency sonication (Table 10.2) because sound waves over 100 kHz do notpropagate as effectively for long distances in a reactor as those of lower frequency.Such information is highly useful in designing a large-scale reactor for industrialwastewater treatment.
10.6 Ultrasound and Other AOTs as Examples of HybridSonochemical Treatments
10.6.1 Sonolysis in Combination with Photocatalysis
Advanced oxidation technologies (AOTs) such as photocatalysis, sonolysis, ozonol-ysis, the Fenton’s process, and photochemical oxidation have been extensively usedfor the treatment of contaminated water and wastewater. These AOT processes canproduce OH radicals as a primary nonselective oxidant, which assists the oxidationprocess. Many researchers reported the effect of combining two or more AOTsto increase the rate of degradation of organics by combining the advantages ofindividual process [4, 8, 9, 30, 31, 38–45, 63–70]. For example, during TiO2
photocatalysis, adsorbed reaction intermediates on the TiO2 surface slowly decreasethe activity of TiO2. The fluid flow generated by ultrasound acoustic bubblesenhances mass transport of pollutants as well as prevent particles settling at thebottom of the reactor. In combining both these AOTs, adsorption of reactionproducts on the surface of catalysts can be prevented as well as make the catalyst’ssurface readily available for reaction. Using this approach, Stock et al. [70] reportedthe effect of combining photocatalysis and sonolysis for the degradation of thetextile azo dye naphthol blue black (NBB). They used 600 kHz high-frequencyultrasonicator for this study. The reaction cell had a volume capacity of 600 mLand was placed 4 cm above the transducer (Fig. 10.9). The temperature of thereactor during sonolysis was maintained around 30ıC. The reaction solution wassparged with oxygen throughout the experiment. The results revealed that sonolysiswas an effective method for the degradation of the parent compound (NBB);whereas, photocatalysis was highly effective for complete mineralization of NBBand the reaction intermediates. Thus, this combined method result in completemineralization and an additive effect on the degradation of NBB.

10 Hybrid Sonochemical Treatment of Contaminated Wastewater. . . 279
Fig. 10.9 High-frequencyultrasound sample cell. Thetransducer is separated fromthe sample solution by apolyethylene film(Reproduced from Ref. [70].With kind permission of© The American ChemicalSociety (2000))
10.6.2 Degradation of Organic Pollutant by UltrasonicIrradiation Along with Ozone
The generation of high temperatures during the acoustic cavitation bubble collapseprovides the conditions with which to decompose not only water molecules but alsooxidants like ozone very efficiently [71–73]. Ozone readily decomposes in the gasphase of the cavitation bubbles in a process that generates molecular oxygen andoxygen atoms (Reactions 10.1 and 10.2). Oxygen atoms react with water moleculesand produce OH radicals. In addition to this, many other reactions occur betweenozone and other free radicals in this coupled method, which facilitates the fastand rapid mineralization of organic pollutants. Kang and Hoffmann [71] appliedultrasound irradiation coupled with ozonation for the oxidation of methyl-tert-butylether (MTBE). The rate of oxidation of MTBE was remarkably high using thecoupled method of oxidation of MTBE than the individual methods of oxidation,as shown in Table 10.3. The ozone-US coupled method enhanced the rate of MTBEoxidation by a factor of 1.5–4, depending on the initial concentration of MTBE.Similarly, the coupled method showed a very rapid mineralization of phenol intoCO2. On the other hand, ozone itself could not degrade phenol completely and led tointermediate products such as formate and oxalate, which accounted for the residual

280 B. Neppolian et al.
Table 10.3 Comparison of various pseudo-first order rate constants for the sono-chemical degradation of MTBE for various initial reaction conditions
Conditionsa[O3] or [O2](mM)
[MTBE]o
(mM)Power(WL–1) ko (s–1) t1/2(min)
O2 C US 0.25 0.05 200 8.7 x 10 -4 13.3O3 C US 0.31 0.05 200 8.7 x 10 -4 3.7O2 C no US 0.25 0.70 NAb 0 NAO3 C no US 0.25 0.31 NA 8.7 x 10 -4 192
Reproduced from Ref. [71]. With kind permission of © The American ChemicalSociety (1998)
Gas-sparge
Emitting Surface
To power generator
TransducerGlass-jacketedvessel
Fig. 10.10 Ultrasonic reactor configuration for sonication at 513 kHz (Figure reproduced fromRef. [72]. With kind permission of © The American Chemical Society (1997))
total organic carbon (TOC). A 205 kHz ultrasonic transducer was used in this studyand mounted with a glass reactor, as shown in Fig. 10.10. The reactor capacitywas 500 mL with a double walled construction for water cooling during ultrasonicirradiation. The reactor had four ports, which were used for gas inlet, gas outlet, towithdraw samples, and for adding other chemicals.
O3
///���! O2 C O (10.1)
O C H2O ! 2OH� (10.2)

10 Hybrid Sonochemical Treatment of Contaminated Wastewater. . . 281
Fig. 10.11 A comparison of degradation rates of AR88 dye in the presence of Fe3C using differentprocesses (Reproduced from Ref. [41]. With kind permission of © Elsevier (2010))
10.6.3 Ultrasound-Assisted Homogeneous Photocatalysis
Ultrasound irradiation is also used as a source for the production of H2O2 aswell as to accelerate homogenous photocatalytic degradation of organic pollutants.Fenton’s reaction (Fe2C/H2O2) and modified Fenton’s like oxidation (Fe3C/H2O2,Fe3C/oxone and etc.) in the presence of UV light irradiation is known as homo-geneous photocatalysis (reaction 10.3). This method has also been reported as amethod for the effective degradation aqueous organic pollutants. Fenton’s reactionproduces OH radicals through splitting of H2O2 by iron salts (reaction 10.4). Ultra-sound assists water splitting reaction to generate hydrogen peroxide by pyrolysis.H2O2 produced from ultrasound is a source for OH radicals that react with Fe2Cions; and considered to be one of the main advantages of combining this Fenton’sprocess along with ultrasound, since the external addition of H2O2 is not required.
Fe3C C H2O C h ! Fe2C C HO� C HC (10.3)
Fe2C C H2O2 ! Fe3C C HO� C H2O (10.4)
Madhavan et al. [43] have developed a method for the degradation of a mono-azo textile dye acid-red 88 (AR88) using this combined process. Hydrated iron(III)nitrate was used as a source for Fe3C ion. A 213 kHz frequency ultrasonicator wasused to produce cavitation. The reactor volume had a capacity of 200 mL. Waterwas circulated around the reactor to maintain the constant temperature at around25ıC. The study demonstrated that there was a synergistic effect on the degradationof textile dye with a synergistic index of 2.3 (Fig. 10.11) compared with individualprocesses. UV light irradiation played a major role in reducing Fe3C to Fe2C, whichinstigated the Fenton’s reaction for the dye degradation. The regeneration of catalystcould be achieved with OH radicals by continuous UV light irradiation of Fe3C. Thisis another simple and highly efficient method for the degradation of textile dyes.

282 B. Neppolian et al.
10.6.4 Ultrasound-Assisted Fenton-Like Oxidation
Goethite (FeOOH) is solid iron oxide, which reacts with H2O2 at low pH values(�3) and produce OH radicals. It is, generally, known as Fenton-like oxidation. Thisprocess has been used in the past few years to decompose organic contaminantspresent in wastewater as well as in soil. Neppolian et al. [9] studied the effect ofultrasound coupled with Fenton’s like oxidation using FeOOH particles for theoxidative degradation of p-chlorobenzoic acid (p-CBA) with a 20 kHz horn typeultrasonicator. The reactor setup is described in Sect. 10.4.1.1. During sonochemicalreactions, the physical forces of ultrasound can enhance mass transport of FeOOHparticles and H2O2. As a result, there was enhanced decomposition of H2O2
observed in the presence of FeOOH, which led to a higher oxidation rate of organicspresent in this system. Figure 10.12 shows the influence of ultrasound on thedecomposition efficiency of H2O2 under this coupled method of oxidation. Thehigh rate of decomposition of H2O2 and organic compounds could be attributedto the indirect chemical effects associated with continuous cleaning and activationof FeOOH surfaces and the enhanced mass transport resulting from the turbulenteffects of cavitation in the system.
10.6.5 Ultrasound-Assisted Preparation of Highly ActiveTiO2 Photocatalysts for Water Treatment
Many researchers have reported the application of ultrasound during the synthesisof semiconductor nanoparticles [7, 74–80]. Neppolian et al. [7] applied ultrasoundduring the pH swing method of preparation of TiO2 photocatalysts and observed areduction in the particle sizes of the TiO2 particles than in the absence of ultrasound.The authors also reported that during ultrasonic irradiation, the fragmentation ofnanoparticles and increased high velocity interparticle collisions prevented the for-mation of larger particles. The catalytic activity of prepared TiO2 showed a relativelybetter performance than the P-25 commercially available TiO2. Figure 10.13 showsthe application of ultrasound and its effect on the particle size during the pH swingmethod of synthesizing TiO2 nanoparticles. It was also found that not only particlesize of TiO2 could be controlled by ultrasound but also other important parametersof TiO2 such as surface area, ratio of anatase, rutile, and brookite, aggregated porevolume as well as the pore size of TiO2 particles very effectively just by alteringthe ultrasound irradiation time [80]. Both horn- (20 kHz) as well as bath-typeultrasonicators (a cleaning bath, 40 kHz) showed almost the same trend on thephysicochemical characteristics of TiO2 particles produced.
Figure 10.14 shows the surface area of TiO2 particles, steadily increasing withincreasing ultrasound time and then decreasing after 100 min. The decreasing size

10 Hybrid Sonochemical Treatment of Contaminated Wastewater. . . 283
1.1a
b 1.1
1.0
1.0
0.9
0.9
0.80.0375g0.075g0.150g0.300g0.450g0.600g
0.0375g0.0750g0.150g0.300g0.450g0.600g
[H2O
2]/H
2O2]
0[H
2O2]
/H2O
2]0
0.8
0.7
0.7
0.60 10 20 30
Time (min)
Time (min)
40 50 60 70
0 10 20 30 40 50 60 70
0.6
0.5
0.4
Fig. 10.12 Effect of FeOOH concentration in Fenton-like method on H2O2 decomposition:without using ultrasound (a); with ultrasound (b) (Reproduced from Ref. [9]. With kind permissionof © Elsevier (2004))
of TiO2 after some time was due to the formation of large size rutile particles.During ultrasound assisted preparation, the important operating variables of anultrasonicator such as power density, ultrasound irradiation time, initial solutiontemperature, and different types of ultrasonic sources (horn and bath types) play asignificant role in controlling the properties of TiO2 nanoparticles. Thus, ultrasoundis a useful technique to control many properties of synthesized semiconductornanoparticles.

284 B. Neppolian et al.
Fig. 10.13 Schematic representation of pH swing method with ultrasound (Reproduced fromRef. [7]. With kind permission of © Springer (2008))
140a
b180
135
90
45
0
120
100
80
60
Sur
face
are
a (m
2 /g)
Sur
face
are
a (m
2 /g)
40
20
00 20 40 60 80
Ultrasonic irradiation time (min)
Ultrasonic irradiation time (min)
100 120 140
0 20 40 60 80 100 120 140
Fig. 10.14 Surface areaof TiO2 prepared by(a) bath-type ultrasonicator;(b) horn-type ultrasonicator(Reproduced from Ref. [80].With kind permission of© Elsevier (2008))

10 Hybrid Sonochemical Treatment of Contaminated Wastewater. . . 285
10.7 Ultrasound and Electrochemistry as HybridSonochemical Treatment
The combination of an electrical field with an ultrasound field, namely, sonoelec-trochemistry has been studied since 1930s [81] as an interesting way to generatechemical reactions. This is due to the high-energy chemical microenvironmentprovided by the combination of both fields. These benefits have been routinelyhighlighted in the literature [82–84], where several reviews [85–88] summarizeddifferent applications of this discipline. Among these applications, the approach tothe environmental remediation can be considered as a hybrid methodology for thetreatment of contaminated wastewater [89]. There are several special features ofthe sonoelectrochemical technique, coming from the electrochemical contribution,which justify a specific section in this chapter. One of them is the possibility tocarry out reduction and oxidation processes at the same time in different regions ofthe reactor, and with the same operating cost. Another aspect is the enhancementof the kinetics of reactions, as will be discussed later. Finally, the avoidance ofdangerous and harmful reagents and solvents remains as a remarkable feature of thesonoelectrochemical treatment of wastewater from an environmental point of view.
10.7.1 Different Adaptations of the Sonoreactorsin Sonoelectrochemical Devices
The mechanical nature of the ultrasound field opens different possibilities in theapplication of electrochemistry. In this way, while the electrical field is establisheddirectly in the working solution with the introduction of the electrodes, theultrasound field can be (or not) applied to an external medium that can be transmittedthrough the wall of the electrochemical cell. Therefore, different experimentalsetups can be found for the development of sonoelectrochemical reactions, whichare discussed below.
10.7.1.1 Physical Separation Configuration
The most easy and convenient experimental setup is the immersion of the electro-chemical cell in an ultrasonic bath [90], as shown in Fig. 10.15. This configurationis still in use, despite the commercial availability of ultrasonic horns [91, 92], dueto its low cost and an easier control of the electrochemical system from an electricpoint of view. As we can find low- and high-frequency devices in an ultrasoundbath configuration, it is possible to develop sonoelectrochemical experiments in awide range of frequencies. However, drawbacks such as its low reproducibility andthe fact that the power transmitted inside the cell is low and the dependence ofthe efficiency on the position of the cell inside the ultrasonic field could prevent

286 B. Neppolian et al.
Fig. 10.15 Electrochemical cell dipped into an ultrasonic bath (Reproduced from Ref. [90]. Withkind permission of © The Royal Society of Chemistry (RSC) for the Centre National de laRecherche Scientifique (CNRS) and the RSC (1998))
its use for systematic analysis. Due to these practical issues, sonoelectrochemistshave developed more sophisticated designs with high-pressure conducting liquid[93], trying to overcome its drawbacks. Better reproducibility has been achieved,although technical issues with the overpressure remain to be improved further [94].In spite of the fact that there is no reason for not working in flow-through mode, thisphysical separation configuration has been routinely used in lab-scale, batch modewith low volume of working solution [95].
10.7.1.2 Electrode-Apart-Transducer Configurations
In this configuration, the electrodes and the ultrasonic horn are directly dippedinto the working solution of the sonochemical cell. The configuration designdepends on the transducer shape and geometry and, therefore, different experimentalarrangements can be found. The simplest configuration is the introduction of theelectrodes and ultrasonic horn from the top of the cell, as shown in Fig. 10.16 [96].
The other one is the introduction of the electrodes and horn from opposite sides:(1) the electrodes from the bottom and the ultrasound tip from the top (Fig. 10.17[96]) and (2) the ultrasound horn from the bottom and the electrodes from the top(Fig. 10.18 [97]).
All previous configurations are normally used for high-power low-frequencyultrasound field, due to the fact that there are many different commercially availableequipments in the market. Besides, its technology is further developed with low

10 Hybrid Sonochemical Treatment of Contaminated Wastewater. . . 287
Fig. 10.16 Experimental setup for sonoelectrolysis in a batch scale in divided configuration:(1) ultrasound horn, (2) working electrode (or cathode), (3) luggin capillary, (4) counter-electrode,(5) separator (membrane), (6) glass cell, (7) cooling jacket, and (8) port for the cooling fluid(Reproduced from Ref. [96]. With kind permission of © Elsevier (2010))
Fig. 10.17 Sonovoltammericcell: (1) luggin capillary, (2)glass cell, (3) gas port, (4)counter-electrode, (5)working electrode, and (6)ultrasound horn (Reproducedfrom Ref. [96]. With kindpermission of © Elsevier(2010))
power, high frequencies. At low-power, high-frequency ultrasound fields, theconfiguration is basically limited to the flat plate configuration (see Fig. 10.19).
With all these different kinds of configurations, we can find in the literaturethat studies have been carried out in batch and flow-through operation modes[87], which have provided a wide range of database for the performance of thesonoelectrochemical technology from the technical, economical, and environmentalpoint of views.

288 B. Neppolian et al.
Fig. 10.18 20 kHzsonoreactor adapted as asonoelectrochemical device:(1) lead dioxide electrode, (2)copper counter-electrode(foam geometry), (3) workingsolution, (4) cooling jacket,(5) glass cell, (6) Teflonholder, (7) ultrasonictransducer (Reproduced fromRef. [97]. With kindpermission of © Elsevier(2011))
Fig. 10.19 Scheme showinga high-frequencysonoelectrochemical reactor:(1) working electrode, (2)counterelectrode, (3) workingsolution, (4) luggin capillary,(5) temperature probe, (6)stirring bar, (7) glass reactor,(8) cooling fluid, (9)ultrasonic transducer

10 Hybrid Sonochemical Treatment of Contaminated Wastewater. . . 289
Fig. 10.20 Schematic diagram of a sonoelectrochemical reactor in the sonoelectrode configura-tion: [a] Ti sonotrode (working electrode), [b] saturated sulfate electrode in a Tacussel bridge(reference electrode), [c] Pt grid (counter-electrode) (Reproduced from Ref. [98]. With kindpermission of © Elsevier (1996))
10.7.1.3 Sonotrode or Sonoelectrode Configuration
Finally, in this case, the working electrode acts as an ultrasound tip, see Fig. 10.20[98]. This configuration provides a much localized microenvironment for thereaction at the surface of the sonoelectrode, which normally works at low frequencyand high-power ultrasound.
In these conditions, not only acoustic streaming by cavitation [86, 99] occursbut also other effects of cavitation such as microjetting [94] and shock waves[100] occur at the electrode surface. Therefore, the presence of ultrasound in anelectrochemical process enhances various processes such as depassivation [101],electrochemical reaction mechanism modification [102], surface activation [103],decrease of adsorption phenomena [104], and the mass transport [105]. Thisidea has also been used in scale-up processes at flow-through operation mode.The equipment is commercially provided by Advanced Sonic Processing Systems(Fig. 10.21 [106]), where the flat electrodes are also the ultrasound emitters.Each electrode oscillates at different frequencies and this provides a well-definedcavitation pattern in the electrode chambers.
10.7.2 Sonoelectrochemical Treatment of ContaminatedWastewater
As we have discussed above, a sonoelectrochemical process presents a widevariety of strategies. It can be carried out with or without separation between the

290 B. Neppolian et al.
Fig. 10.21 Schematicdiagram of theelectro-acoustical reactioncell from advanced sonics(Reproduced from Ref. [106].With kind permission of© Advanced SonicProcessing System (2004))
anodic (oxidation) and the cathodic (reduction) reactions. This possibility allowsenvironmental researchers not only to study the degradation of the pollutant byoxidation, reduction or by forcing the pollutants (and their by-products) to undergoboth electrons transfer possibilities, but also to investigate the relation among themby modifying the reaction mechanisms with the formation of new intermediates. Inaddition, we can apply both electrical and ultrasonic energy fields simultaneouslyin the same reactor or in different chambers. Therefore, extensive study of thesonoelectrochemical treatment of wastewater could be developed. However, thechemical nature of the pollutant can normally allow the choice among the anodic,cathodic, or dual treatment. This suggestion can be supported on the preliminaryanalysis carried out using sonovoltametric techniques [90] that may also provideinformation about the electrocatalysis of the different electrodic materials to beused or the need for the separation between cathodic and anodic compartment ina sonoelectrochemical reactor. After this study, the design of a sonoelectrochemicaldegradation process at lab scale in batch configuration can be carried out. All thesetrials provide a clear idea of the feasibility of the sonoelectrochemical treatmentfrom a technical and environmental point of views. In spite of the fact that notalways a systematic analysis has been followed, in the following subsections, wewill develop the most popular approaches found in the literature, leaving the specificcase of the sonoelectrochemical treatment of organics for Chap. 14.
10.7.2.1 Sonoelectrochemical Treatment by Oxidation
The oxidation process is the most popular route for the degradation of chemicalpollutants. Two strategies are normally followed: (1) the transformation of the initialcompounds to CO2, H2O, and other small molecules and (2) the transformation ofthe initial compounds to other forms with a higher biodegradability. An example

10 Hybrid Sonochemical Treatment of Contaminated Wastewater. . . 291
of this is the oxidation of the cyanide anion. Cyanide can be electrochemicallydegraded by direct oxidation, first giving cyanate, which is further oxidized, orby indirect oxidation using chloride (forming ClO�) as an oxygen carrier [107].Both electrochemical procedures have been used in combination with ultrasound[108] analyzing six types of electrodic materials. Cyanide indirect electrochemicaldegradation under sonication provided better results.
Other applications of sonoelectrochemical oxidation are the improvement of theelectrochemical water disinfection. The disinfecting species, mainly hypochlorousacid and hypochlorite, can be electrochemically produced from chloride ions inelectrolyzed water, but the deposition of calcareous deposits on the cathode surfaceis the main drawback of the process. In this case, the combination of ultrasoundwith this process has been studied by Kraft et al. [109] who showed that thesonotrode efficiently removed calcium carbonate scales from the cathode surface.Thus, electrochemical water disinfection in potable water can be performed on along timescale, without the necessity for cathode cleaning, through the use of acidsor the polarity reversal method.
10.7.2.2 Sonoelectrochemical Treatment by Reduction
The other route in electrochemical processes is the reduction, which is currently themost widely employed method for metal recovery. The low concentration of metalsin wastewater is one of the most important problems of electrodeposition, becausethe mass transport of metallic cations to the cathode, often the rate-controlling step,can be very slow. Therefore, the deposition of metals under the influence of anultrasonic field has received significant attention [93]. Nevertheless, this work hasbeen focused on the electrodeposits rather than on the recovery processes [110].Much of this work has been carried out from an industrial standpoint, particularly onmetals that are important in the electroplating industry. The results of various studies[110–112] dealing with copper removal show an improvement in the depositionrate with an ultrasonically agitated bath. Farooq et al. [111] used electrodepositionand ultrasound at 35 kHz to remove copper in wastewater. The copper removalefficiency was enhanced from 55.1% to 94.6% in the presence of an ultrasonic field.The removal of zinc [110] and lead [112] from industrial wastewater has also beenstudied. Hyde et al. [113] concluded that in electrodeposition under the influenceof ultrasound, the critical effect is the increase in mass transport, which may behigh enough to change from a diffusion-controlled system to a charge-controlledsystem. In addition, ultrasound also ablates material from the electrode surface, buthas no effect on growth through charge transfer from the electrode to the metal ion.All these observations demonstrate that ultrasound can dramatically improve theefficiency of heavy metal wastewater treatment.
Other example of the sonoelectrochemical methodology in metal recovery appli-cation is developed in the removal of silver from photographic processing solutions,which consist mainly of sodium thiosulfate, sodium bisulfite, and silver halides.Currently, the most widely employed method for silver removal is electrolysis,

292 B. Neppolian et al.
where vigorous agitation is required in order to overcome electrode fouling. Thereduction of silver cations has been deeply studied by Pollet and coworkers[114–118] at platinum, stainless steel, and carbon stationary or rotating electrodes inthe absence and presence of ultrasound. In these studies, low-frequency experimentswere performed using either a typical single-compartment voltammetric cell, orusing a cell similar in design to that of Compton et al. [119] except that theultrasound source was placed at the bottom of the electrochemical cell, whilehigh-frequency experiments were performed using a three-compartment cell [114],and bulk electrolysis was carried out in a specially designed cell enabling theuse of three ultrasonic probes [116]. Their results indicate that the AgC cathodicdischarge potential does not significantly vary with the ultrasonic frequency [114],but rather with ultrasonic intensity [115] and the position of the ultrasonic probewith respect to the electrode [117]. More results were obtained using a combinationof ultrasonic irradiation at 20 kHz and bulk potential–controlled electrolysis withsonoelectrochemical cells adapted to use three ultrasonic probes in “face-on”(probe 2) and “side-on” (probes 1 and 3) geometries (Fig. 10.22 [116]). Their resultsconfirm that the cell geometry is an important parameter in the removal of silverand for most sonoelectrochemical processes. The specially designed cell permitteddifferent ultrasound probe combinations. Operating the one side probe (“side-on”) and the bottom ultrasonic probes (“face-on”) simultaneously (i.e., probes 1and 2) led to a higher rate constant for a given ultrasonic power. Other probecombinations (probes 2 C 3 or 1 C 2 C 3) were less effective, and the use of thethree ultrasonic probes operating at the same power did not significantly improvethe rate constant of silver removal compared with that obtained for the “face-on”geometry.
10.7.2.3 Sonoelectrochemical Treatment by Dual Degradation
Finally, it is important to point out the interrelation and mutual influence betweenanodic and cathodic reactions during the process. In this way and following withthe previous processes shown, the anodic reaction for silver removal reactionfrom photographic “fixer” processing solutions has also been studied [120]. Thesonoelectrochemical treatment used in silver removal enhances not only the silverrecovery rates, but also the thiosulfate oxidation process. A 50-fold increase wasobserved compared with silent conditions in the degradation of thiosulfate onplatinum. Under the conditions studied, the thiosulfate degradation increased as theultrasonic power was increased, suggesting that the oxidation of thiosulfate was alsolimited by diffusion.
In the same way, industrial wastewaters usually contain metal complexes,e.g., copper-ethylenediaminetetraacetic acid (EDTA). During the electrodeposition,organic pollutants can be degraded at the anode while heavy metals are reducedat the cathode. Nevertheless, a very low current efficiency for treating wastewatercontaining chelated heavy metals is observed, reducing the economical viabilityof the electrodeposition technique; e.g., a 97.7% recovery rate, but a 3.1% current

10 Hybrid Sonochemical Treatment of Contaminated Wastewater. . . 293
Fig. 10.22 Sonoelectrochemical cell for bulk electrolysis fitted with three ultrasonic probes(Reproduced from Ref. [116]. With kind permission of © Elsevier (2000))
efficiency, for EDTA-Cu system was obtained for the Cu electrodeposition process[121]. Therefore, the influence of ultrasound on electrodeposition applied to EDTA-Cu solutions has been studied [122]. In this case, an ultrasonic transducer with around tip was placed in the middle of the reactor to produce the ultrasonic waveinstead of using an ultrasonic bath. Again, it is concluded that the mass transportmechanism changes to a charge-controlled system under ultrasonic conditions, withthe oxidation of EDTA by the combined technique and an 84% COD removal.

294 B. Neppolian et al.
10.8 Energetic Costs Analysis
In spite of the increasing number of sonochemical and hybrid ultrasonic applicationsfor environmental remediation, very few processes have actually been scaled-upwith industrial purposes due to the lack of standard strategies for the design of largeand efficient reactors. As stated by different authors [123, 124], the economicalviability of sonochemical and hybrid ultrasonic processes is, without any doubt, themain goal to achieve in order to consider overall ultrasonic processes as competitiveas other technologies. This is due to the high energy consumption associatedwith the application of ultrasound inside the reactors and the nonhomogeneousdistribution of cavitation phenomena, both of which make the current sonochemicaland hybrid ultrasonic wastewater treatments hardly feasible for the industry from aneconomic point of view.
Unfortunately, this key issue has received poor attention from most of thescientific community, as only a few studies found in the literature include anestimation of the energetic consumption of the sonochemical treatment. In thissense, Peters and coworkers found that the degradation of highly volatile chlori-nated compounds in natural ground water with concentrations in the mg/L rangeconsumed 640 kWh m�3 [125], while in the �g/L range 500 kWh m�3 [126]was necessary for the removal of the pollutants. In a different study, Shemer andNarkis [127] calculated that 300–1,400 kWh m�3 would be necessary to reacha degradation of 90% of the trihalomethanes (CHCl3, CHBr3, and CHI3, amongothers) present in a water sample with an initial concentration of 10 mg/L.
For hybrid ultrasonic technologies, Ragaini et al. [69] evaluated the energyconsumption of the sonophotocatalytic degradation of 2-chlorophenol in water,comparing the results with other techniques (photocatalysis, photocatalysis withozone, sonophotocatalysis with ozone, among others). They estimated the energyconsumed to obtain a degradation of 70% for all different experimental techniques.They found that the combination of ultrasound and ozone (190 kWh m�3, reactiontime of 130 min) was quite competitive compared with the ozone treatment(177.5 kWh m�3, reaction time of 170 min). A similar procedure was carried outby Selli et al. [128] to study the degradation of methyl tert-butyl ether in water,where they measured the energy required to reach a degradation of 90% of theinitial concentration in the solution (10–3 M). The sonophotocatalytic treatmentwith intermittent stirring was the most efficient (4,900 kWh m�3, reaction time of148 min), compared to the sonophotocatalytic treatment with continuous stirring(9,550 kWh m�3, reaction time of 280 min) or the photocatalytic treatment(8,750 kWh m�3, reaction time of 322 min). More recently, Rokhina et al. [129]studied the silent and ultrasound-assisted oxidation of phenol over RuI3 catalyst,estimating that the sonocatalytic oxidation yielded lower energy consumption(501.8 kWh m�3) than the sonochemical treatment in presence of hydrogen peroxide(2,297.8 kWh m�3) or the sonolysis alone (31,265.5 kWh m�3). Analogousconclusions have been made by Mahamuni and Adewuyi regarding the combinationof ultrasound and other AOTs for wastewater treatment [130]. In their work, a quitecomplete review of different hybrid ultrasonic processes is presented, with a focus

10 Hybrid Sonochemical Treatment of Contaminated Wastewater. . . 295
on the estimation of the economic cost. In their analysis, they concluded that thecombination of ultrasound with different AOTs was economically more attractivethan the use of ultrasound alone for the degradation of diverse pollutants, specifi-cally for the degradation of reactive azo dyes, where the combination of ultrasound,ultraviolet light and H2O2 achieved a competitive cost of $65.17/1,000 gal, which isan order of magnitude less than commercially available processes.
In order to shed more light on the benefits of combining ultrasound with othertechnologies, we comment on the different degradation strategies followed by Saezand coworkers’s work on the removal of perchloroethylene (PCE) and its degrada-tion by-products from water. While the more optimized electrochemical treatment(ECT) in sodium sulfate aqueous media (sodium sulfate acted as backgroundelectrolyte) yield a conversion of PCE of 84% [131], the nonoptimized 20 kHzsonochemical treatment (SCT) reached a 99% [132]. However, poor degradationefficiency was obtained in the removal of C–Cl bonds (30% for SCT vs. 68% forECT) and a tremendous energetic consumption was observed (900 kWh m�3 forSCT vs. 3.8 kWh m�3 for ECT). A complete degradation of PCE was observedwith the nonoptimized 20 kHz background-electrolyte-assisted sonoelectrochemicaltreatment (BEA-SECT) [133], although a lower C–Cl degradation efficiency (57%)and higher energy consumption (902 kWh m�3) were observed compared with theECT process. And more recently, the nonoptimized 20 kHz sonoelectrochemicaltreatment with no further addition of a background electrolyte (SECT) [134] enabledto reach not only the complete degradation of PCE in the sample, but also toachieve an outstanding C–Cl degradation efficiency of 99%, while reducing theenergy consumption (682 kWh m�3) compared with the SCT and the BEA-SECTprocesses. Yet, the energy consumption of the ECT degradation of PCE remainsmuch lower compared with the SECT process; but we have to keep in mindthat, from an environmental point of view, the benefits of the SECT degradation(complete removal of the toxicity inherent to the presence of C–Cl bonds in pollutedfreshwater) far outweigh the drawback of the energy consumption.
Besides the combination of ultrasound with other technologies as those brieflycommented in this chapter, other efforts are being pursued by different researchgroups in order to increase the energetic efficiency of all kinds of chemical processesinvolving ultrasound. These include the improvement of high power ultrasonicdevices [135], the previously commented use of multiple frequencies, the useof pulsed ultrasound [136], the proper selection of the working frequency neara resonance peak of the system [137] and the design of the reactor taking intoaccount its geometry and materials. For the latter, a proper understanding of thespatial distribution of the acoustic pressure in the reactor is, therefore, mandatoryin order to precisely predict the cavitation phenomena inside the reactor and toeffectively design large-scale reactors. Regarding this issue, new developments withcomputer-aided simulations have been recently raised involving linear [138–140]and nonlinear [141–143] acoustics. These developments would eventually lead tothe efficient design of ultrasonic systems and devices that would also enable incontrolling the extent of transient and stable cavitation phenomena [144], dependingon the specifications of the desired application.

296 B. Neppolian et al.
10.9 Concluding Remarks
Although an increasing number of studies have been reported, the ultrasound-assisted degradation of organic pollutants is still in its early stage of development,especially with respect to large-scale treatment. The rate of chemical reactionsdepends on various operational parameters of ultrasound such as frequency, acousticpower, reactor size and design, initial temperature, and mode of operation. Thenature of the contaminant, influence of oxidizing agent, mass transport of catalysts,etc., also play a considerable role in the degradation process. During ultrasonicirradiation of a contaminated fluid, many intermediate products are formed thatrequires a long time for complete mineralization. On the other hand, the coupledmethod of oxidation can considerably enhance the complete mineralization of anorganic compound within a short period of sonication time. Applying double, triple,or multiple acoustic frequencies was found to provide an additive effect on thechemical reactivity generated in most of the studies undertaken. Low-frequencyultrasound is able to distribute acoustic energy more efficiently within a reactionvessel for large-scale reactors than with higher acoustic frequencies. In addition, thedevelopment of hybrid technologies involving ultrasound is in progress in order toobtain a practical technology for the degradation of recalcitrant pollutants. Amongthem, the sonophotocatalysis and sonoelectrochemistry have provided promisingresults from a technical and environmental point of views while the economicsaspects are still being optimized.
References
1. Richards WT, Loomis AL (1927) The chemical effects of high frequency sound waves I.A preliminary survey. J Am Chem Soc 49:3086–3100
2. Wood R, Loomis AL (1927) The physical and biological effects of high-frequency sound-waves of great intensity. Philos Mag Ser 4:417–436
3. Ashokkumar M (2007) Sonochemistry. In: Kirk-Othmer encyclopedia of chemical technol-ogy. Wiley, Hoboken
4. Ashokkumar M, Sunartio D, Kentish S, Mawson R, Simons L, Vilkhu K, Versteeg C (2008)Modification of food ingredients by ultrasound to improve functionality: a preliminary studyon a model system. Innov Food Sci Emerg Technol 9:155–160
5. Suslick KS (1988) Ultrasound, its chemical, physical and biological effects. VCH, New York6. Bang JH, Han K, Skrabalak SH, Kim H, Suslick KS (2007) Porous carbon supports prepared
by ultrasonic spray pyrolysis for direct methanol fuel cell electrode. J Phys Chem C111:10959–10964
7. Neppolian B, Celik E, Anpo M, Choi H (2008) Ultrasonic-assisted pH Swing method for thesynthesis of highly efficient TiO2 nano-size photocatalysts. Catal Lett 125:183–191
8. Neppolian B, Haeryong J, Choi H, Lee JH, Kang JW (2002) Sonolytic degradation of methyltert-butyl ether: the role of coupled Fenton process and persulphate ion. Water Res 36:4699–4708
9. Neppolian B, Park JS, Choi H (2004) Effect of Fenton-like oxidation on enhanced oxidativedegradation of para-chlorobenzoic acid by ultrasonic irradiation. Ultrason Sonochem 11:273–279

10 Hybrid Sonochemical Treatment of Contaminated Wastewater. . . 297
10. Singla R, Grieser F, Ashokkumar M (2004) The mechanism of the sonochemical degradationof benzoic acid in aqueous solutions. Res Chem Intermed 30:723–733
11. Singla R, Grieser F, Ashokkumar M (2009) Kinetics and mechanism for the sonochemicaldegradation of a nonionic surfactant. J Phys Chem A 113:2865–2872
12. Vecitis CD, Wang Y, Cheng J, Park H, Mader B, Hoffmann MR (2010) Sonochemicaldegradation of perfluorooctanesulfonate in aqueous film-forming foams. Environ Sci Technol44:432–438
13. Yang L, Sostaric JZ, Rathman JF, Weavers LK (2008) Effect of ultrasound frequency onpulsed sonolytic degradation of octylbenzene sulfonic acid. J Phys Chem B 112:852–858
14. Yang L, Rathman JF, Weavers LK (2005) Sonochemical degradation of alkylbenzenesulfonate surfactants in aqueous mixtures. J Phys Chem B 110:18385–18391
15. Zhang GM, Zhang PY, Yang JM, Chen YM (2007) Ultrasonic reduction of excess sludge fromthe activated sludge system. J Hazard Mater 145:515–519
16. Lim M, Son Y, Park B, Khim J (2010) Sonophotochemical degradation of Bisphenol A withsolid catalysts. Jpn J Appl Phys 49:07HEO6
17. Gultekin I, Tezcanli-Guyer G, Ince NH (2009) Degradation of 4-n-nonylphenol in water by20 kHz ultrasound. J Adv Oxid Technol 12:105–110
18. Hamdaoui O, Naffrechoux E (2008) Sonochemical and photosonochemical degradation of4-chlorophenol in aqueous media. Ultrason Sonochem 15:981–987
19. Guo ZB, Zheng Z, Zheng SR, Hu WY, Feng R (2005) Effect of various sono-oxidationparameters on the removal of aqueous 2,4-dinitrophenol. Ultrason Sonochem 12:461–465
20. Little C, Hepher MJ, El-Sharif M (2002) The sono-degradation of phenanthrene in an aqueousenvironment. Ultrasonics 40:667–674
21. Kim JK, Martinez F, Metcalfe IS (2007) The beneficial role of use of ultrasound inheterogeneous Fenton-like system over supported copper catalysts for degradation ofp-chlorophenol. Catal Today 124:224–231
22. Suh WH, Jang AR, Suh YH, Suslick KS (2006) Porous, hollow, and ball-in-ball metal oxidemicrospheres: preparation, endocytosis, and cytotoxicity. Adv Mater 18:1832–1837
23. Muthukumaran S, Kentish SE, Stevens GW, Ashokkumar M (2006) Application of ultrasoundin membrane separation process: a review. Rev Chem Eng 22:155–194
24. Neppolian B, Doronila A, Ashokkumar M (2010) Sonochemical oxidation of arsenic(III) toarsenic(V) using potassium peroxydisulfate as an oxidizing agent. Water Res 44:3687–3695
25. Neppolian B, Doronila A, Grieser F, Ashokkumar M (2009) Simple and efficient sonochemi-cal method for the oxidation of arsenic (III) to arsenic (V). Environ Sci Technol 43:6793–6798
26. Okitsu K, Ashokkumar M, Grieser F (2005) Sonochemical synthesis of gold nanoparticles:effects of ultrasound frequency. J Phys Chem B 109:20673–20675
27. Singla R, Grieser F, Ashokkumar M (2009) Sonochemical degradation of martius yellow dyein aqueous solution. Ultrason Sonochem 16:28–34
28. Vinodgopal K, He Y, Ashokkumar M, Grieser F (2006) Sonochemically prepared platinum-ruthenium bimetallic nanoparticles. J Phys Chem B 110:3849–3852
29. Ashokkumar M, Hodnett M, Zeqiri GF, Price GJ (2007) Study of the coalescence of acousticbubbles as a function of frequency, power, and water-soluble additives. J Am Chem Soc129:2250–2258
30. Neppolian B, Ciceri L, Bianchi CL, Grieser F, Ashokkumar M (2011) Sonophotocatalyticdegradation of 4-chlorophenol using Bi2O3/TiZrO4 as a visible light responsive photocatalyst.Ultrason Sonochem 18:1832–1837
31. Weavers L, Malmstadt N, Hoffmann MR (2000) Kinetics and mechanism of pentachlorophe-nol degradation by sonication, ozonation, and sonolytic ozonation. Environ Sci Technol34:1280–1285
32. Ferguson MA, Hering JG (2006) TiO2-photocatalyzed As (III) oxidation in a fixed-bed, flow-through reactor. Environ Sci Technol 40:4261–4267
33. Iqbal J, Kim HJ, Yang JS, Baek K, Yang JW (2007) Removal of arsenic from groundwater bymicellar-enhanced ultrafiltration (MEUF). Chemosphere 66:970–976

298 B. Neppolian et al.
34. Johnston RB, Singer PC (2007) Redox reactions in the Fe-As-O2 system. Chemosphere69:517–525
35. Kanel SR, Manning B, Charlet L, Choi HC (2005) Removal of arsenic (III) from groundwaterby nanoscale zero-valent iron. Environ Sci Technol 39:1291–1298
36. Kim MJ, Nriagu J (2000) Oxidation of arsenite in groundwater using ozone and oxygen. J SciTotal Environ 247:71–79
37. Lee H, Choi W (2002) Photocatalytic oxidation of arsenite in TiO2 suspension: kinetics andmechanisms. Environ Sci Technol 36:3872–3878
38. Madhavan J, Kumar S, Anandan A, Grieser F, Ashokkumar M (2010) Sonophotocatalyticdegradation of monocrotophos using TiO2 and Fe3C. J Hazard Mater 177:944–949
39. Madhavan J, Grieser F, Ashokkumar M (2010) Degradation of orange-G by advancedoxidation processes. Ultrason Sonochem 17:338–343
40. Madhavan J, Grieser F, Ashokkumar M (2010) Combined advanced oxidation processesfor the synergistic degradation of ibuprofen in aqueous environments. J Hazard Mater 178:202–208
41. Madhavan J, Grieser F, Ashokkumar M (2010) Degradation of formetanate hydrochloride bycombined advanced oxidation processes. Sep Purif Technol 73:409–414
42. Madhavan J, Kumar S, Anandan S, Zhou M, Grieser F, Ashokkumar M (2010) Ultrasoundassisted photocatalytic degradation of diclofenac in an aqueous environment. Chemosphere80:747–752
43. Madhavan J, Kumar S, Anandan S, Grieser F, Ashokkumar M (2010) Degradation of acid red88 by the combination of sonolysis and photocatalysis. Sep Purif Technol 74:336–341
44. Madhavan M, Grieser F, Ashokkumar M (2009) Kinetics of the sonophotocatalytic degrada-tion of orange G in presence of Fe3C. Water Sci Technol 60:2195–2202
45. Kamat PV (2011) Graphene-based nanoassemblies for energy conversion. J Phys Chem Lett2:242–251
46. Kamat PV (2010) Graphene-based nanoarchitectures. Anchoring semiconductor and metalnanoparticles on a two-dimensional carbon support. J Phys Chem Lett 1:520–527
47. Lightcap IV, Kosel TH, Kamat PV (2010) Anchoring semiconductor and metal nanoparticleson a 2-dimensional catalyst mat. Storing and shuttling electrons with reduced graphene oxide.Nano Lett 10:577–583
48. Rao CNR, Sood AK, Voggu R, Subrahmanyam KS (2010) Some novel attributes of graphene.J Phys Chem Lett 1:572–580
49. Seger B, Kamat PV (2009) Electrocatalytically active graphene-platinum nanocomposites.Role of 2-D carbon support in PEM fuel cells. J Phys Chem C 113:7990–7995
50. Vinodgopal K, Neppolian B, Lightcap IV, Grieser F, Ashokkumar M, Kamat PV (2010)Sonolytic design of graphene-Au nanocomposites. Simultaneous and sequential reduction ofgraphene oxide and Au(III). J Phys Chem Lett 1:1987–1993
51. Williams G, Seger B, Kamat PV (2008) TiO2-Graphene nanocomposites. UV-assistedphotocatalytic reduction of graphene oxide. ACS Nano 2:1487–1491
52. Williams G, Kamat PV (2009) Graphene-semiconductor nanocomposites. Excited stateinteractions between ZnO nanoparticles and graphene oxide. Langmuir 25:13869–13873
53. Zhang H, Lv X, Li Y, Wang Y, Li J (2010) P-25 graphene composite as a high performancephotocatalyst. ACS Nano 4:380–386
54. Brotchie A, Ashokkumar M, Grieser F (2007) Effect of water-soluble solutes on sonolumi-nescence under dual-frequency sonication. J Phys Chem C 111:3066–3070
55. Kanthale PM, Brotchie A, Ashokkumar M, Grieser F (2008) Experimental and theoreticalinvestigations on sonoluminescence under dual frequency conditions. Ultrason Sonochem15:629–635
56. Brotchie A, Ashokkumar M, Grieser F (2008) Sonochemistry and sonoluminescence underdual-frequency ultrasound irradiation in the presence of water-soluble solutes. J Phys ChemC 112:10247–10250
57. Vijayanand SM (2009) Mechanistic optimization of a dual frequency sonochemical reactor.Chem Eng Sci 64:5255–5267

10 Hybrid Sonochemical Treatment of Contaminated Wastewater. . . 299
58. Sivakumar M, Pandit AB (2001) Ultrasound enhanced degradation of Rhodamine B: opti-mization with power density. Ultrason Sonochem 8:233–240
59. Gogate PR, Sivakumar M, Pandit AB (2004) Destruction of Rhodamine B using novelsonochemical reactor with capacity of 7.5l. Sep Purif Technol 34:13–24
60. Gondrexon N, Renaudin V, Petrier C, Boldo P, Bernis A, Gonthier Y (1999) Degradation ofpentachlorophenol aqueous solutions using a continuous flow ultrasonic reactor: experimentalperformance and modeling. Ultrason Sonochem 5:125–131
61. Entezari MH, Petrier C, Devidal P (2003) Sonochemical degradation of phenol in water:a comparison of classical equipment with a new cylindrical reactor. Ultrason Sonochem10:103–108
62. Son Y, Lim M, Khim J (2009) Investigation of acoustic cavitation energy in a large-scalesonoreactor. Ultrason Sonochem 16:552–556
63. Vinu R, Madras G (2009) Kinetics of sonophotocatalytic degradation of anionic dyes withnano-TiO2. Environ Sci Technol 43:473–479
64. Dorathi RPJ, Palanivelu K (2010) Sonochemical degradation of p-chlorophenol in aqueoussolution using hypervalent iron. Ind J Chem Technol 17:111–119
65. Bremner DH, Molina R, Martinez F, Melero JA, Segura Y (2009) Degradation of phenolicaqueous solutions by high frequency sono-Fenton systems (US-Fe2O3/SBA-15-H2O2). ApplCatal B-Environ 90:380–388
66. Luo T, Ai ZH, Zhang LZ (2008) Fe@Fe2O3 core-shell nanowires as iron reagent. 4. Sono-Fenton degradation of pentachlorophenol and the mechanism analysis. J Phys Chem C112:8675–8681
67. Ioan I, Wilson S, Lundanes E, Neculai A (2007) Comparison of Fenton and sono-Fentonbisphenol A degradation. J Hazard Mater 142:559–563
68. Gogate PR, Pandit AB (2004) A review of imperative technologies for wastewater treatmentII: hybrid methods. Adv Environ Res 8:553–597
69. Ragaini V, Selli E, Bianchi CL, Pirola C (2001) Sono-photocatalytic degradation of2-chlorophenol in water: kinetic and energetic comparison with other techniques. UltrasonSonochem 8:251–258
70. Stock N, Peller J, Vinodgopal K, Kamat PV (2000) Combinative sonolysis and photocatalysisfor textile dye degradation. Environ Sci Technol 34:1747–1750
71. Kang JW, Hoffmann MR (1998) Kinetics and mechanism of the sonolytic destruction ofmethyl tert-butyl ether by ultrasonic irradiation in the presence of ozone. Environ Sci Technol32:3194–3199
72. Hua I, Hoffmann MR (1997) Optimization of ultrasonic irradiation as an advanced oxidationtechnology. Environ Sci Technol 31:2237–2243
73. Lesko T, Colussi AG, Hoffmann MR (2006) Sonochemical decomposition of phenol:evidence for a synergistic effect of ozone and ultrasound for the elimination of total organiccarbon from water. Environ Sci Technol 40:6818–6823
74. Neppolian B, Bruno A, Bianchi CL, Ashokkumar M (2012) Graphene oxide based Pt-TiO2
photocatalyst: Ultrasound assisted synthesis, characterization and catalytic efficiency. Ultra-son Sonochem 19:9–15.
75. Bang JH, Suslick KS (2010) Applications of ultrasound to the synthesis of nanostructuredmaterials. Adv Mater 22:1039–1059.
76. Didenko YT, Suslick KS (2005) Chemical aerosol flow synthesis of semiconductor nanopar-ticles. J Am Chem Soc 127:12196–12197.
77. Zhou S, Yuan R, Lou S, Wang Y, Yuan H, Zhu G, Liu L, Hao Y, Li N (2011) Sono-chemical synthesis and optical properties of amorphous ZnO nanowires. J. Nanoparticle Res13:4511–4518.
78. Chen Y, Zhu CL, Xiao G (2006) Reduced-temperature ethanol sensing characteristics offlower-like ZnO nanorods synthesized by a sonochemical method. Nanotech 17:4537–4541.
79. Suh WH, Jang AR, Suh YH, Suslick KS (2006) Porous, hollow, and ball-in-ball metal oxidemicrospheres: reparation, endocytosis, and cytotoxicity. Adv Mater 18:1832–1837.

300 B. Neppolian et al.
80. Neppolian B, Wang Q, Jung H, Choi H (2008) Ultrasonic-assisted sol-gel method ofpreparation of TiO2 nano-particles: characterization, properties and 4-chlorophenol removalapplication. Ultrason Sonochem 15:649–658
81. Morigushi N (1934) The effect of supersonic waves on chemical phenomena (III). The effecton the concentration polarization. J Chem Soc Jpn 55:749–750
82. Mason TJ, Lorimer JP, Walton DJ (1990) Sonoelectrochemistry. Ultrasonics 28:333–33783. Pollet BG, Phull SS (2001) Sonoelectrohemistry-theory, principles and applications. Recent
Res Dev Electrochem 4:55–7884. Brett C (2008) Sonoelectrochemistry. In: Arnau Vives A (ed) Piezoelectric transducer and
applications. Springer, Berlin/Heidelberg85. Walton DJ, Phull SS (1996) Sonoelectrochemistry. Adv Sonochem 4:205–28486. Compton RG, Eklund JC, Marken F (1997) Sonoelectrochemical processes. A review.
Electroanalysis 9:509–52287. Gonzalez-Garcıa J, Esclapez MD, Bonete P, Vargas-Hernandez Y, Gaete-Garreton L, Saez V
(2010) Current topics on sonoelectrochemistry. Ultrasonics 50:318–32288. Klima J (2011) Application of ultrasound in electrochemistry. An overview of mechanisms
and design of experimental arrangement. Ultrasonics 51:202–20989. Gonzalez-Garcıa J (2011) Sonoelectrochemical synthesis of materials. In: Pankaj, Ashokku-
mar M (eds) Theoretical and experimental sonochemistry involving inorganic systems.Springer, Dordrecht/Heidelberg/London/New York
90. Gonzalez-Garcıa J, Iniesta J, Aldaz A, Montiel V (1998) Effects of ultrasound on theelectrodeposition of lead dioxide on glassy carbon electrodes. New J Chem 22:343–347
91. Hielscher Ultrasonics GmbH. http://www.hielscher.com92. Sonics & Materials, INC. http://www.sonics.com/93. Klıma J, Bernard C (1999) Sonoassisted electrooxidative polymerisation of salicylic acid: role
of acoustic streaming and microjetting. J Electroanal Chem 462:181–18694. Klıma J, Bernard C, Degrand C (1994) Sonoelectrochemistry: effects of ultrasound on
voltammetric measurements at a solid electrode. J Electroanal Chem 367:297–30095. Mohapatra SK, Raja KS, Misra M, Mahajan VK, Ahmadian M (2007) Synthesis of self-
organized mixed oxide nanotubes by sonoelectrochemical anodization of Ti-8Mn alloy.Electrochim Acta 53:590–597
96. Esclapez MD, Saez V, Milan-Yanez D, Tudela I, Louisnard O, Gonzalez-Garcıa J (2010)Sonoelectrochemical treatment of water polluted with trichloroacetic acid: from sonovoltam-metry to pre-pilot plant scale. Ultrason Sonochem 17:1010–1020
97. Saez V, Esclapez MD, Frıas-Ferrer AJ, Bonete P, Tudela I, Dıez-Garcıa MI, Gonzalez-Garcıa J(2011) Lead dioxide film sonoelectrodeposition in acidic media: preparation and performanceof stable practical anodes. Ultrason Sonochem 18:873–880
98. Durant A, Francois H, Reisse J, Kirsch-DeMesmaeker A (1996) Sonoelectrochemistry: theeffects of ultrasound on organic electrochemical reduction. Electrochim Acta 41:277–284
99. Compton RG, Hardcastle JL, del Campo J (2003) Sonoelectrochemistry: physical aspects. In:Bard AJ, Stratmann M (eds) Encyclopedia of electrochemistry, vol 3. Wiley-VCH, Weinheim
100. Birkin PR, Offin DG, Joseph PF, Leighton TG (2005) Cavitation, shock waves and theinvasive nature of sonoelectrochemistry. J Phys Chem B 109:16997–17005
101. Marken F, Compton RG (1998) Sonoelectrochemically modified electrodes: ultrasoundassisted electrode cleaning, conditioning, and product trapping in 1-octanol/water emulsionsystems. Electrochim Acta 43:2157–2165
102. Rejnak M, Klıma J, Svodoba J, Ludvik J (2004) Synthesis and electrochemical reductionof methyl 3-halo-1-benzothiophene-2-carboxylates. Collect Czechoslov Chem Commun69:242–260
103. Zhang H, Coury LA Jr (1993) Effects of high-intensity ultrasound on glassy carbonelectrodes. Anal Chem 65:1552–1558
104. Compton RG, Eklund JC, Page SD, Sanders GHW, Booth J (1994) Voltammetry in thepresence of ultrasound. Sonovoltammetry and surface effects. J Phys Chem 98:12410–12414

10 Hybrid Sonochemical Treatment of Contaminated Wastewater. . . 301
105. Cooper EL, Coury LA Jr (1998) Mass transport in sonovoltammetry with evidence ofhydrodynamic modulation from ultrasound. J Electrochem Soc 145:1994–1999
106. Advanced Sonic Processing Systems Company. http://www.advancedsonics.com/Reaction%20Cells.htm
107. Perret A, Haenni W, Skinner N, Tang NM, Gandini D, Comninellis C, Correa B, Foti G (1999)Electrochemical behavior of synthetic diamond thin film electrodes. Diam Relat Mater 8:820–823
108. Iordache I, Nechita MT, Rosca I, Aelenei N (2004) Ultrasound assisted electrochemicaldegradation of cyanides: influence of electrode type. Turk J Eng Environ Sci 28:377–380
109. Kraft A, Blaschke M, Kreysig D (2002) Electrochemical water disinfection part III:hypochlorite production from potable water with ultrasound assisted cathode cleaning. J ApplElectrochem 32:597–601
110. Walker R (1997) Ultrasound improves electrolytic recovery of metals. Ultrason Sonochem4:39–43
111. Farooq R, Wang Y, Lin F, Shaukat SF, Donaldson J, Chouhdary AJ (2002) Effect of ultrasoundon the removal of copper from the model solutions for copper electrolysis process. Water Res36:3165–3169
112. Yaqub A, Ajab H, Khan S, Farooq R (2009) Electrochemical removal of copper and lead fromindustrial wastewater: mass transport enhancement. Water Qual Res J Can 44:183–188
113. Hyde ME, Compton RG (2002) How ultrasound influences the electrodeposition of metals.J Electroanal Chem 531:19–24
114. Pollet BG, Lorimer JP, Phull SS, Mason TJ, Walton DJ, Hihn JY, Ligier V, Wery M (1999)The effect of ultrasonic frequency and intensity upon electrode kinetic parameters for theAg(S2O3)2
3�/Ag redox couple. J Appl Electrochem 29:1359–1366115. Lorimer JP, Pollet BG, Phull SS, Mason TJ, Walton DJ (1998) The effect upon limiting
currents and potentials of coupling a rotating disc and cylindrical electrode with ultrasound.Electrochim Acta 43:449–455
116. Pollet BG, Lorimer JP, Phull SS, Hihn JY (2000) Sonoelectrochemical recovery of silver fromphotographic processing solutions. Ultrason Sonochem 7:69–76
117. Pollet BG, Lorimer JP, Phull SS, Mason TJ, Hihn J-Y (2003) A novel angular geometry for thesonochemical silver recovery process at cylinder electrodes. Ultrason Sonochem 10:217–222
118. Pollet BG, Lorimer JP, Hihn JY, Touyeras F, Mason TJ, Walton DJ (2005) Electrochemicalstudy of silver thiosulphate reduction in the absence and presence of ultrasound. UltrasonSonochem 12:7–11
119. Compton RG, Eklund JC, Marken F, Waller DN (1996) Electrode processes at the surfaces ofsonotrodes. Electrochim Acta 41:315–320
120. Pollet BG, Lorimer JP, Hihn J-Y, Phull SS, Mason TJ, Walton DJ (2002) The effect ofultrasound upon the oxidation of thiosulphate on stainless steel and platinum electrodes.Ultrason Sonochem 9:267–274
121. Allen HE, Chen PH (1993) Remediation of metal contaminated soil by EDTA incorporatingelectrochemical recovery of metal and EDTA. Environ Prog 12:284–293
122. Chang JH, Ellis AV, Yan CT, Tung CH (2009) The electrochemical phenomena and kinetics ofEDTA-copper wastewater reclamation by electrodeposition and ultrasound. Sep Purif Technol68:216–221
123. Gonzalez-Garcıa J, Saez V, Tudela I, Dıez-Garcıa MI, Esclapez MD, Louisnard O (2010)Sonochemical treatment of water polluted by chlorinated organocompounds. A review. Water2:28–74
124. Gogate PR, Sutkar VS, Pandit AB (2011) Sonochemical reactors: important design and scaleup considerations with a special emphasis on heterogeneous systems. Chem Eng J 166:1066–1082
125. Kruger O, Schulze Th-L, Peters D (1999) Sonochemical treatment of natural ground water atdifferent high frequencies: preliminary results. Ultrason Sonochem 6:123–128
126. Peters D (2001) Sonolytic degradation of volatile pollutants in natural ground water:conclusions from a model study. Ultrason Sonochem 8:221–226

302 B. Neppolian et al.
127. Shemer H, Narkis N (2005) Sonochemical removal of trihalomethanes from aqueoussolutions. Ultrason Sonochem 12:495–499
128. Selli E, Bianchi CL, Pirola C, Bertelli M (2005) Degradation of methyl tert-butyl etherin water: effects of the combined use of sonolysis and photocatalysis. Ultrason Sonochem12:395–400
129. Rokhina EV, Repo E, Virkutyte J (2010) Comparative kinetic analysis of silent andultrasound-assisted catalytic wet peroxide oxidation of phenol. Ultrason Sonochem 17:541–546
130. Mahamuni NN, Adewuyi YG (2010) Advanced oxidation processes (AOPs) involvingultrasound for waste water treatment: a review with emphasis on cost estimation. UltrasonSonochem 17:990–1003
131. Saez V, Esclapez MD, Tudela I, Bonete P, Louisnard O, Gonzalez-Garcıa J (2010) Electro-chemical degradation of perchloroethylene in aqueous media: influence of the electrochemicaloperational variables in the viability of the process. Ind Eng Chem Res 49:4123–4131
132. Saez V, Esclapez MD, Bonete P, Walton DJ, Rehorek A, Louisnard O, Gonzalez-Garcıa J(2011) Sonochemical degradation of perchloroethylene: the influence of ultrasonic variables,and the identification of products. Ultrason Sonochem 18:104–113
133. Saez V, Esclapez MD, Tudela I, Bonete P, Louisnard O, Gonzalez-Garcıa J (2010) 20 kHzsonoelectrochemical degradation of perchloroethylene in sodium sulphate aqueous media:influence of the operational variables in batch mode. J Hazard Mater 183:648–654
134. Saez V, Tudela I, Esclapez MD, Bonete P, Louisnard O, Gonzalez-Garcıa J (2011) Sonoelec-trochemical degradation of perchloroethylene in water: enhancement of the process by theabsence of background electrolyte. Chem Eng J 168:649–655
135. Gallego-Juarez JA, Rodriguez G, Acosta V, Riera E (2010) Power ultrasonic transducers withextensive radiators for industrial processing. Ultrason Sonochem 17:953–964
136. Tuziui T, Yasui K, Lee J, Kozuka T, Towata A, Iida Y (2008) Mechanism of enhancement ofsonochemical-reaction efficiency by pulsed ultrasound. J Phys Chem A 112:4875–4878
137. Abdelsalam ME, Birkin PR (2002) A study investigating the sonoelectrochemical degradationof an organic compound employing Fenton’s reagent. Phys Chem Chem Phys 4:5340–5345
138. Yasui K, Kozuka T, Tuziuti T, Towata A, Iida Y, King J, Macey P (2007) FEM calculation ofan acoustic field in a sonochemical reactor. Ultrason Sonochem 14:605–614
139. Louisnard O, Gonzalez-Garcıa J, Tudela I, Klıma J, Saez V, Vargas-Hernandez Y (2009) FEMsimulation of a sono-reactor accounting for vibrations of the boundaries. Ultrason Sonochem16:250–259
140. Tudela I, Saez V, Esclapez MD, Bonete P, Harzali H, Baillon F, Gonzalez-Garcıa J,Louisnard O (2011) Study of the influence of transducer-electrode and electrode-wall gapson the acoustic field inside a sonoelectrochemical reactor by FEM simulations. Chem Eng J.doi:10.1016/j.cej.2011.03.064
141. Vanhille C, Campos-Pozuelo C (2011) Nonlinear ultrasonic standing waves: two-dimensionalsimulations in bubbly liquids. Ultrason Sonochem 18:679–682
142. Louisnard O (2011) A simple model of propagation in a cavitating liquid. Part I: theory,nonlinear attenuation and traveling wave generation. Ultrason Sonochem 19:56–65
143. Louisnard O (2011) A simple model of propagation in a cavitating liquid. Part II: PrimaryBjerkness force and bubble structures. Ultrason Sonochem 19:66–76
144. Ashokkumar M, Lee J, Iida Y, Yasui K, Kozuka T, Tuziuti T, Towata A (2009) The detectionand control of stable and transient acoustic cavitation bubbles. Phys Chem Chem Phys11:10118–10121

Chapter 11Hybrid Sonochemical Treatmentsof Wastewater: Sonophotochemicaland Sonoelectrochemical Approaches. Part II:Sonophotocatalytic and SonoelectrochemicalDegradation of Organic Pollutants
B. Neppolian, M. Ashokkumar, V. Saez, M.D. Esclapez, and P. Bonete
11.1 Introduction
After discovering the photocatalytic splitting of water using TiO2 photoelectrodeby Fujishima and Honda in 1972, there have been widespread applications ofphotocatalysis for the degradation of both organic as well as inorganic pollutantsin environmental remediation. Numerous research reports have demonstrated thefundamental processes in photocatalysis [1–12]. The major advantages of thistechnology are as follows: (1) complete degradation of organics into carbon dioxideand water in a relatively short period of time, (2) OH radicals obtained fromthis method are nonselective oxidants, which can be used to degrade a variety ofhazardous compounds in different wastewater streams, (3) the technology can beapplied to aqueous and gaseous-phase treatments, (4) the operating conditions forphotocatalysis are simple, (5) the efficiency can be improved by doping with transi-tion metals, and (6) visible light photocatalysts can also be used to harvest sunlight.
The common disadvantages of photocatalysis are: (1) the strong adsorption ofpollutants on the photocatalyst particles that deactivates the catalyst and (2) masstransfer limitations: catalyst particles settle at the bottom and direct contact betweencatalyst and pollutants is largely prevented that need continuous stirring at all times.
B. NeppolianSRM Research Institute, SRM University, Kattankulathur, Chennai 603203, Indiae-mail: b [email protected]
M. AshokkumarSchool of Chemistry, University of Melbourne, Melbourne, Australiae-mail: [email protected]
V. Saez • M.D. Esclapez • P. Bonete (�)Grupo de Nuevos Desarrollos Tecnologicos en Electroquımica: Sonoelectroquımicay Bioelectroquımica, Grupo de Fotoquımicay Electroquımica de semiconductores, Departamentode Quımica Fısica e Instituto de Electroquımica, Universidad de Alicante, Alicante, Spaine-mail: [email protected]; desiree [email protected]; [email protected]
S.K. Sharma and R. Sanghi (eds.), Advances in Water Treatment and PollutionPrevention, DOI 10.1007/978-94-007-4204-8 11,© Springer ScienceCBusiness Media Dordrecht 2012
303

304 B. Neppolian et al.
Recently, sonochemical oxidation has gained much attention as an advancedoxidation process for the degradation of organic contaminants in aqueous envi-ronment [13–20]. The chemical reactions that occur from the ultrasonic irradiationof a solution are produced through the phenomenon of cavitation. The process ofcavitation refers to the rapid growth and implosive collapse of bubbles in a liquidresulting in an extreme reaction environment within and in the vicinity of bubbles.The temperature produced during the collapse of a cavitation bubble is as high as4,500 K. During ultrasonication of an aqueous solution, thermolytic cleavage ofwater molecules occurs, leading to the formation of H and OH radicals. OH radicalsare powerful nonselective oxidants that can be used for the complete degradationof organic pollutants in aqueous solutions. Generally, the sonochemical oxidationof organic compounds in aqueous solution occurs by two-reaction pathways:(1) volatile compounds evaporate into the cavity during the expansion cycle anddegrade via pyrolytic reaction within the collapsing bubble and (2) it proceeds bythe reaction of OH radicals with the solute adsorbed at the bubble interface. Thenature of the reaction pathway depends on the volatility, hydrophobicity and surfaceactivity of the compound in question [16]. Advantages of this method are: (1) thereis no requirement to use any added chemicals or catalysts for the oxidation oforganic pollutants, (2) a simple ultrasonic transducer is sufficient for the completeoxidation of organics in water, and (3) effective mass transfer. Disadvantages ofthis method are: (1) complete mineralization of pollutants takes relatively longertime and (2) sonochemically formed H2O2 is stable in the presence of low levels ofpollutants.
Combining photocatalysis and sonochemistry offers a potentially useful way ofovercoming the existing problems of the individual methods, i.e., (1) the aggregationof photocatalyst nanoparticles in aqueous solutions is prevented by the physicaleffects of acoustic cavitation, leading to an increase in the active surface area,(2) the catalyst surface is continuously cleaned due to acoustic microstreaming,which has the ability to further increase the catalytic performance of the photo-catalyst, (3) increase in the mass transport of the pollutants to the catalyst surface,(4) sonochemically formed H2O2 is stable in the presence of low levels of pollutantsdue to the facilitated transport by shockwave propagation, and can be cleavedinto OH radicals during photolysis [21], (5) enhance the rate of mineralization oforganic pollutants, and (6) more free radicals are available for degradation (fromphotocatalysis as well as sonolysis).
Electrochemical degradation of pollutants in wastewater treatment is not beingroutinely used because cheaper conventional treatments are available. They areusually composed of a physicochemical step followed by a biological degradation.However, these methods have continuously presented deficiencies, mainly treatingsome refractory compounds because they are toxic for the microorganisms in thebiological plant [22].
From an environmental point of view, one of the most important requirementsis the use of effective procedures that avoid, if possible, the use of stoichiometricquantities of nonreusable chemicals. In this sense, in the last decades, ultrasonicirradiation has been used as degradation treatment or in combination with othertechniques. Although sonolysis does not require the use of chemicals, it has

11 Hybrid Sonochemical Treatments of Wastewater: Sonophotochemical. . . 305
been observed that the addition of some salts improves the degradation of somepollutants. On the other hand, the electrochemical treatment is a versatile technologywith a well-known theoretical basis that has made possible its application not onlyin synthesis processes but also for the degradation of contaminants in water reme-diation. The electrochemical treatment requires, a priori, a supporting electrolytewhen the solution to electrolyze does not have enough electrical conductivity. Thisis the only chemical required which increases the salinity of solutions when its use isneeded. Polluted freshwaters usually show low electrical conductivity but industrialeffluents have a high salinity degree.
Textile dyes are one of the major classifications under the organic dyes, which arecommonly used in textile industries and considered to be potentially carcinogenic.During dye production as well as textile manufacturing processes, a large quantity ofwastewater containing dyestuffs with intensive color and toxicity is introduced intothe aquatic systems. Due to the large degree of organics present in these moleculesand stability of modern textile dyes, conventional biological treatment methods areineffective for their decolourization and degradation [23–32]. This led to the study ofother effective methods. Recent studies have demonstrated that photocatalysis andsonochemical methods can be used to degrade dye compounds using semiconductorphotocatalysts under ultrasonic irradiation [2, 3, 33–41].
Among various organic contaminants, pharmaceutical products are of significantconcern because of their large variety and high consumption over the last fewdecades. Main sources of pharmaceutical products are emission from productionsites due to inadequate treatment of manufacturing effluents, direct disposal ofunused medicine and the release of drug-containing waste by human beings andanimals. The presence of low levels of pharmaceutical products in water can havepotential health effects on humans, through drinking water or consumption offood irrigated by polluted water. Therefore, it is necessary to treat the effluentscontaining pharmaceutical compounds adequately before discharging them intowater streams [42].
A large number of pesticides and herbicides are currently in use worldwide foragricultural and nonagricultural activities. The use of both pesticides and herbicidesin the targeted areas is found to contaminate the surrounding aqueous environment.The treatment of wastewater containing pesticides and herbicides is important inorder to protect the ecosystem and, hence, has attracted much attention of manyresearchers in recent years [43–45]. The use of advanced oxidation technologies(AOTs), such as heterogeneous photocatalysis, Fenton and photo-Fenton oxidation,ozonation, sonolysis, and UV/H2O2, for the degradation of aqueous organic pollu-tants have been widely described in the literature [46–50].
Similarly, surfactants have been widely used in various applications to removecontaminants from surfaces of human skin, textiles, and also used in industries suchas paper, food, polymers, pharmaceuticals, and oil recovery for various purposes[51]. Every year large quantities of surfactants are produced worldwide for theabove purposes to face the demand. For example, the average annual production ofdetergent is �8 million tons from the western countries alone [52]. Many types ofsynthetic surfactants that include alkyl-benzenesulfonate such as dodecylbenzene-sulfonate (DBS) have been let into water systems after the use, which constitutes a

306 B. Neppolian et al.
serious environmental pollution and attracted much environmental concerns [13].DBS is nonbiodegradable in nature and accumulated in water systems over aperiod of time [13]. The conventional treatment methods for the total removal anddegradation of DBS are still in primitive stage.
The persistent presence of halogenated hydrocarbons in all environmental mediais still a serious problem, but especially in aqueous medium. Disposal and spills ofchlorinated solvents at industrial sites, military bases, government facilities, or drycleaner sites have led to extensive groundwater contamination [53, 54]. As a conse-quence of the poor efficiency of the biological methods for the degradation of chlo-rinated compounds, a large number of alternative technologies have emerged andbeen developed in the last decade. These include not only simple procedures such ascatalytic hydrogenation [55], metal alloys in dilute aqueous alkaline solutions [56],photochemistry [57], or the techniques mentioned above such as sonochemistry[58] and also electrochemistry [59], but also combined treatments such as reductivedehalogenation and biodegradation [60], which are being considered as possiblemethods for the degradation of chlorinated organocompounds. On the other hand,several authors have pointed out, not only that the treatment of water with chlorinein the distribution system produces trihalomethanes and haloacetic acids, whichprevents its use as drinking water [61], but also the resistance of these compounds totransformation via mainstream biochemical processes [62] used in the water treat-ment plants, and the formation and fate of haloacetic acid within these plants [63].
The aim of this chapter is to provide an overview of the studies available on theeffective degradation of few selected organic pollutants such as (1) organic dyes,(2) pesticides and pharmaceuticals, and (3) surfactants using combined processes.This may provide a broad scope for the researchers to know about the advantageousof these methodologies for environmental remediation. In addition, the applicationof sonoelectrochemistry to the protection of the environment is an emerging fieldof research that has been applied successfully for the degradation of a rangeof important contaminants in water. Sonoelectrochemistry for the degradation ofcontaminants has several advantages over the conventional methods in that it canbe carried out under mild conditions, at room temperature and without the needfor additional chemical treatment. The sonoelectrochemistry section summarizesthe treatment of major pollutants including textile dyes, phenolic derivatives,nitrocompounds, chlorinated pollutants, and metals that have been studied to date.
11.2 Sonophotocatalytic Degradation of Organic Pollutants
11.2.1 Degradation of Organic Dyes
Information available for the sonophotocatalytic degradation of some organicdyes in recent years is listed in Table 11.1, which provides a clear outline ofsonophotocatalytic degradation of various organic compounds, the type of ultrason-icator, catalysts, and name of the organic compound used along with experimentalconditions and important observations.

11 Hybrid Sonochemical Treatments of Wastewater: Sonophotochemical. . . 307
Table 11.1 Overview of the work done in sonophotocatalytic degradation of organic dyes,surfactants and pesticides, and pharmaceuticals
S. No. References Experimental details Key findings
1 Stock et al. [64] Naphthol blue black(NBB), P-25-TiO2
(Degussa) 640 kHzultrasonicator,240 W
Enhancement observed in therates of decoloration andmineralization of the azodye, NBB – thesimultaneous process isbetter than sequential
2 Madhavan et al. [72] Orange G (OG),P-25-TiO2
(Degussa) 213 kHzultrasonicator,continuous mode,20 W
An additive effect wasobserved during thesonophotocatalyticoxidation of OG
3 Vinu and Madras [74] Six different anionicdyes, TiO2, horntype sonicator,25 kHz, 36 W, 80 Whigh pressuremercury UV lamp
Sonophotocatalytic degradationof all dyes was highercompared to the individualprocesses. P-25 TiO2 led tolesser mineralization andtheir prepared TiO2 showedbetter conversion
4 Son et al. [75] Reactive black 5 (RB5),35 kHzultrasonicator,254 nm wavelengthUVC lamp
Observed enhanceddegradation under acidicconditions and there was noeffect of NaCl with highconcentration due tophysical effect ofultrasound
5 Madhavan et al. [76] Acid red 88 (AR88),Fe3C is used forhomogeneousphotocatalysis,P-25-TiO2
(Degussa), 213 kHzultrasonicator,continuous mode,55 mW L–1
Heterogeneoussonophotocatalysis showed1.3 synergy index whereas,Fe3C assisted homogeneoussonophotocatalysis showed2.3 synergy index for thedye degradation
6 Ashokkumar et al. [65] Orange G (OG), Fe3C,213 kHzultrasonicator,continuous mode,20 W
Photolysis was found to beresponsible for the increasein the synergy index.Sonophotocatalysis wasshown to be more efficientthan the individualprocesses
7 Yuan et al. [66] TiO2 nano array,methylene blue(MB), differentfrequencies from 18to 30 kHz
Frequency has great effect onthe synergy, at 27 kHz, thesynergistic effect was ashigh as 22.1%
(continued)

308 B. Neppolian et al.
Table 11.1 (continued)
S. No. References Experimental details Key findings
8 Zhang et al. [77] Visible lightirradiation,Fe-TiO2-MWCNTs,methylene blue(MB), 28 kHz
The sonophotocatalysis was fasterthan the respective individualprocesses due to the increase ofthe active surface area ofFe/TiO2-MWCNT undervisible light
9 Bejarano-Perez andSuarez-Herrera[71]
Congo red andmethyleneorange, TiO2,4 W lamp,47 kHz, 81 W
A positive effect of ultrasound notonly occurred on oxidationreactions, but also on reductionreactions, a remarkableincrease on the rate ofcombined process
10 Kaur and Singh [67] Reactive red 198,visible light,dye-sensitizedTiO2, 47 kHz,130 W
Synergy effect was observed,reaction took place viaformation of singlet oxygen,superoxide and hydroxylradicals
11 Berberidou et al. [68] Malachite green(MG), TiO2,80 kHz, up to150 W
The parent molecules are easilyoxidizable, its degradationproducts are more stable tototal oxidation and synergyindex was observed withcombined process
12 Wang et al. [69] Methyl orange,CNTs/TiO2,20 kHz, 0–50 W
Results indicated that thephotocatalytic efficiency ofCNTs/TiO2 remarkableincreased in the presence ofultrasound, compared withP25, CNTs/TiO2 nanoparticleshowed much highersonophotocatalytic ability
13 Gonzalez andMartınez [70]
Basic blue 9, TiO2,20 kHz,76 W,15 W UVlamp, 352 nm
Rate of the reaction increasedmany folds with combinedprocess. Reaction wasdependent on the pH solutionwith the highest at pH 7
14 Wang et al. [73] Methylene orange(MO), P-25TiO2, Ag-TiO2,40 kHz, 180 W
Degradation ratio of MO increasedwith increase of ultrasonicpower. MO can be remarkablydegraded by thesonophotocatalytic reaction inthe presence of photocatalystsunder simulated sunlight
15 Madhavan et al. [78] Ibuprofen (IBP),P-25-TiO2,Fe3C, 213 kHzfrequency,55 mW mL–1
A significant synergy effect wasobserved for thesonophotocatalysis in thepresence of Fe3C, sonication ofIBP led to the formation of itsmono and di-hydroxylatedintermediates
(continued)

11 Hybrid Sonochemical Treatments of Wastewater: Sonophotochemical. . . 309
Table 11.1 (continued)
S. No. References Experimental details Key findings
16 Madhavan et al. [79] Diclofenac (DF), ananti-inflammatorydrug, TiO2, ZnO,and Fe–ZnO,213 kHz,55 mW mL–1
Combined process showed aslight synergy effect withTiO2, an additive effect withFe-ZnO. However, themineralization process duringthe combined process showeda detrimental effect
17 Bahena et al. [80] Alazine and gesaprim(herbicides), P-25TiO2, 20 kHz,500 W, 15 W UVlight emits at 352 nm
90% of the active component inthe gesaprim and alazinewere completely degraded,photodegradation of thesecommercial herbicidesenhanced by ultrasound, acomplete mineralization inboth commercial herbicides
18 Ashokkumar et al. [81] Formetanatehydrochloride(pesticide), TiO2,Fe3C, 213 kHz,55 mW mL–1
TiO2-assisted sonophotocatalysisresulted in a negative effect(synergy index 0.7), whereaswith Fe3C showed asynergistic enhancement(synergy index 1.7)
19 Ashokkumar et al. [82] Monocrotophos (MCP),pesticide, TiO2,Fe3C, 213 kHz,55 mW mL–1
The mineralization process wasadditive for both TiO2 andFe3C
20 Anandan andAshokkumar [84]
Nonylphenol ethoxylate(NPE), surfactant,Au-TiO2, 358 kHz,17 W
Photocatalysis was efficient forthe degradation of an organicsurfactant, synergetic effectscould not be observed in thesonophotocatalytic process
21 Neppolian et al.(submitted) [83]
Dodecylbenzene-sulphonate (DBS),surfactant,Pt-graphene oxide(GO)-TiO2,215 kHz, 17 W
There was no pH effect on thesonophotocatalyticdegradation of DBS, additiveeffect was observed withcombined process. Fastmineralization was observed
One of the major concerns in any advanced oxidation technique is the formationof reactive intermediates during the oxidation of organics. A fast mineralizationof any organic compound should be the goal to minimize the reaction time as ittakes prolonged time for complete mineralization. A combined sonophotocatalyticapproach has led to faster mineralization. TiO2 and TiO2-based photocatalysts havebeen widely used for this combined study for the degradation of organic dyesincluding textile dyes. Generally, the following observations were reported for thesonophotocatalytic degradation of organic dyes:

310 B. Neppolian et al.
1. The rate of sonophotocatalytic degradation of dyes mostly follows pseudo-first-order kinetics.
2. The rate of degradation of organics dyes mainly depends on the initial concen-tration of the dye. Similarly, the amount of photocatalyst also controls the rate ofdegradation. The optimization of both amount of catalyst as well as concentrationof the dyes is inevitable.
3. The solution pH may be an important factor, depending upon the nature ofpollutants.
4. The nature and the structure of the dyes are very important factors for themineralization of the dyes.
5. The nature of the catalysts plays a considerable role: size, shape, surface areas,and other morphologies of the catalysts need to be considered.
6. Experimental parameters such as nature (UV or visible) and intensity of the lightsource and the reactor assembly are important factors.
7. Intensity of ultrasound is also taken into consideration as one of the importantparameters during the dye degradation.
A few studies have reported on the effects of various experimental parameters onthe sonophotocatalytic degradation of textile dyes [64–71]. Kamat et al. in theirstudy on the sonolytic degradation of a textile dye, naphthol blue back (NBB),showed that the rupture of azo group by OH radical attack produced several organicintermediates, which needed to be further degraded to achieve complete mineraliza-tion [64]. It was mentioned that the reaction intermediates compete with the parentcompound for OH radicals and, hence, slow down the overall degradation process.The enhancement observed in the combined method with TiO2 photocatalystswas an additive effect. About 68% mineralization in 12 h was obtained by thephotocatalytic degradation of NBB solution. Only 35% mineralization was notedin the sonolysis experiment. Nearly 80% in 12 h was obtained when they performedsimultaneous photocatalysis and sonolysis treatments. Two types of combinationswere attempted: (1) simultaneous and (2) sequential. The simultaneous sonolysisand photocatalysis experiment was found to be better than the sequential combina-tion. It has been suggested that the sonication prevents the catalyst from aggregationand keeps them as individual nanoparticles. This is almost a general observation formost of the textile dyes degradation by this combined [64–77].
It is generally seen that neutral solution pH is good for sonophotocatalyticdegradation of textiles dyes. The TiO2 surface charge plays an important role onthe kinetics of photo-oxidation of ionic dyes. It has been reported that TiO2 has asuperficial pH of �6.3, which coincides with its zero point charge (zpc). Therefore,the attractive interaction with cations is stronger at higher pH values (pH> pHzpc), but at lower pH the interactions forces are repulsive; the anions behave inthe opposite way. For example, Congo red dye molecules have two sulfonic groupsthat are charged negative at alkaline pH, and it prevents the adsorption of the dyemolecule to the negative surface of TiO2. On the other hand, at acidic pH, theadsorption of Congo red seems to be high and does not allow the adsorption of O2
on TiO2 particles, making the photo-oxidation process very difficult. Experiments

11 Hybrid Sonochemical Treatments of Wastewater: Sonophotochemical. . . 311
performed at different pH values showed that the optimum pH value for thephoto-oxidation process of Congo red was near to the isoelectric point of TiO2, asreported by Bejarano-Perez et al. [71]. Madhavan et al. also reported similar resultsduring the degradation of textile dye orange G. They have explained the results onthe basis of pKa of the dye [72, 73].
The effect of dissolved gases was studied by Vinu and Madras [74]. Thesonophotocatalytic degradation of textile dyes in the presence of different gasesfollows the order, O2>N2>Ar>dissolved natural air. The observed behavior couldbe explained with the solubility of the gases in water. Ar is highly soluble in watercompared to N2 and O2 and, hence, it exhibited the slowest degradation. AmongN2 and O2, although N2 is less soluble in water, it exhibited a lower activity, whichcan be attributed to the scavenging of hydroxyl radicals by N2 to yield nitrogenand nitrous oxides. Moreover, O2 chemically participates in the reaction pathwayof photocatalysis and the formation of oxygen radicals in sonocatalysis, therebyleading to complete degradation. But, Ar and N2 are inert gases and, hence, theirrelative contribution to the UV and ultrasound pathways is diminished. Among thedifferent gases, presence of oxygen enhances the rate of reaction substantially. Aftercarrying out a complete investigation on the sonophotocatalytic degradation of 6different textile dyes, Vinu and Madras proposed that UV light played a significantrole in the degradation of dyes in the initial period, whereas ultrasound had a moreinfluential effect at longer exposure hours in TOC removal [74].
The effect of additives such as sodium chloride on the sonophotocatalyticdegradation of dyes was studied by Son et al. [75]. Interestingly, there wasno significant difference in the removal trends of the dye under various NaClconcentrations ranging from 50 to 5,000 mgL�1 (0.86–86 mM). When salt waspresent in the solution, salt could be an inhibitor in AOTs as NaCl acted as OHradical scavenger and generated by-product radicals, which are considered as weakoxidants. When the concentration of a pollutant was high, NaCl acted as an inhibitor,but there was no significant change in removal rate at various NaCl concentrations.On the contrary, the presence of NaCl largely increased removal rate at low pollutantconcentrations. Owing to a relatively high initial concentration of the pollutant, itappeared that salt concentration did not affect ultrasonic degradation in this study.The physical forces of ultrasound are able to clean the surface of TiO2 continuouslyand, hence, the problem associated with NaCl was largely prevented during thiscombined method.
The effect of ultrasound power during sonophotocatalysis was reported bymany researchers [21, 73, 74, 76]. Recently, Madhavan et al. studied the effect ofultrasound power on the sonophotocatalytic degradation of textile dye acid red 88[76]. It was reported that the degradation rate increased with an increase in theultrasound power. For example, a higher degradation rate of 36.9 � 10�7 M min�1
was obtained at 55 mW mL�1, whereas only about 0.77 � 10�7 M min�1 of dyedegradation was observed at 16 mW mL�1. Vinu and Madras also observed asimilar effect on the degradation of textile dyes. This is due to the formation ofmore cavitation bubbles and their transient behavior in solution [74], which maylead to their increase in average size. Generally, the transient cavitation bubbles

312 B. Neppolian et al.
contain vapor, which implode violently, as there is not much gas to cushion theircollapse. This contributes to higher local temperature and pressure and, hence, thegeneration of more hydroxyl radicals. It is worthwhile to note that the rate increasedwith an increase in ultrasound intensity, signifying that increasing the ultrasoundpower amplitude imparts a cleaning effect on the catalyst particles. This leads todesorption of the dye from TiO2 active sites.
Generally, UV irradiation is harmful to human beings. Many researchers havebeen using solar light as a source of irradiation, which is freely available withabundant source of energy. Zhang et al. studied the effect of visible light on thedegradation of textile dyes using different types of photocatalysts [77]. Methyleneblue (MB) degradation was monitored by means of simultaneous visible light andultrasound in the present of pure TiO2, Fe/TiO2 and Fe/TiO2-multi-walled carbonnanotube (MWCNT) catalyst. It is reported that the sonophotocatalytic degradationof MB dye by Fe/TiO2-MWCNT catalyst was better than that of pure TiO2 andFe/TiO2 catalyst under visible light irradiation.
Homogeneous photocatalysis using Fenton (Fe2C/H2O2) and modified Fentonreagents (Fe3C/H2O2, ferrioxalate, Fe3C/oxone) have also been reported as a usefulmethod for the degradation of aqueous organic pollutants [76]. Madhavan et al. [76]have developed a method for the degradation of a mono-azo textile dye, acid-red88 (AR88) using sonophotocatalysis. During this homogeneous sonophotocatalyticoxidation method, the synergy index was observed more than two times. In addition,Fe3C can also be regenerated during the combined method as described in Part 1 inChap.10. The simultaneous operation of sono-Fenton and photo-Fenton reactions islikely to be the underlying reason for the observed synergy in the presence of Fe3C-assisted sonophotocatalysis. This approach is relatively simple and an efficient wayfor the degradation of organics.
The above-mentioned studies clearly suggest that sonophotocatalysis is aneffective method for the degradation of textile dyes in terms of both fast degradationas well as fast mineralization, i.e., an additive effect can be achieved by thismethod. The general conclusion is that sonolysis is effective for inducing fasterdegradation of the parent dye, while TiO2 photocatalysis is effective for promotingmineralization.
11.2.2 Degradation of Pesticides and Pharmaceuticals
Madhavan et al. described the sonophotocatalytic degradation of two commonlyused pharmaceuticals (ibuprofen and diclofenac) with TiO2, Fe-ZnO, and Fe3C-mediated homogeneous sonophotocatalysis (Table 11.1) [78, 79]. The resultsdiscussed are almost similar to those results obtained for the degradation oftextile dyes. The rate of the degradation of pharmaceuticals followed first-orderdegradation. Ibuprofen (commonly used as analgesic and anti-inflammatory drug)can be easily degraded by TiO2 and Fe3C homogenous sonophotocatalysis. Bothcatalysts showed a slight synergy in the degradation of ibuprofen whereas anadditive effect was observed with mineralization of ibuprofen. On the other hand, a

11 Hybrid Sonochemical Treatments of Wastewater: Sonophotochemical. . . 313
synergistic effect was observed with homogeneous photocatalysis in the presenceof Fe3C ion. This is due to the complex formation of photoactive complexesbetween Fe3C and carboxylic acid intermediates. The degradation of diclofenac(anti-inflammatory drug) using TiO2 and Fe–ZnO photocatalysts showed an additiveeffect. However, mineralization studies revealed that TiO2 exhibited a detrimentaleffect but Fe–ZnO attributed an additive effect. The rate of degradation of phar-maceuticals also depends on the nature of TiO2 and organic compounds. Manyintermediate products were identified during the degradation processes. Most of theintermediates were more highly toxic than their parent compounds. Hence, completemineralization of pharmaceuticals is a very important aspect in this method. Most ofthe pharmaceuticals are nonvolatile in nature; hence, there was less chance for themto undergo pyrolytic degradation during sonolysis. Most of the reactions are inducedby OH radicals. All other parameters discussed for the dye degradation have shownalmost similar trend for the degradation of pharmaceuticals.
Details of some herbicides and pesticides degradation studies with sonophoto-catalysis performed in recent years are provided in Table 14.1. Bahena et al. andAshokkumar et al. described the sonophotocatalytic degradation of few herbicidesand pesticides using TiO2 and Fe3C photocatalysts [80–82]. Bahena et al. attemptedto degrade alazine and gesaprim, commercial herbicides, in aqueous TiO2 suspen-sions under UV light (15 W, 352 nm) and using an ultrasound source of 20 kHz [80].Alazine and esaprim are herbicides used for the control of broadleaf weeds andsome grassy weeds. Alazine contains alachlor and atrazine as active compounds,and esaprim comprises atrazine as active compound. HPLC was used to monitorthe parent compounds as well as active compounds during the reaction. The amountof catalysts and concentration of herbicides were optimized before proceeding forfurther experiments. TOC results clearly indicated that both the active compoundspresent in alazine and esaprim were completely degraded by the combined methodof degradation in 2 h. According to TOC results, the degradation of gesaprimpreceded this order: sonophotocatalysis> photocatalysis> sonolysis> photolysis.
Madhavan et al. have studied the sonophotocatalytic degradation of commonlyused insecticides such as formetanate hydrochloride and monocrotophos (MCP)[81, 82], which have been found as pollutants in aqueous environments. The reactionwas carried out in the presence of homogeneous (Fe3C) and heterogeneous (TiO2)photocatalysts with high frequency ultrasound 213 kHz and high intensity UV lamp(400 W). The combination of sonolysis with TiO2 photocatalysis showed a negativeeffect on the degradation of formetanate hydrochloride with a synergy index of 0.7.The degradation rates obtained for US C Fe3C, UV C Fe3C, and US C UV C Fe3Cwere 14.1, 10.1, and 40.9 � 10�7 M min�1, respectively. Fe3C addition during thesonophotocatalysis process was found to be beneficial with a synergy index of1.6. The total organic carbon analysis showed that the mineralization process wassynergistic by combining the two processes in the presence of Fe3C. On the otherhand, the rate of photocatalytic degradation of monocrotophos using TiO2 was foundto be lower than that of sonolysis alone due to the interference of phosphate ionsformed as an intermediate product. A 15-fold enhancement in the degradation ratewas achieved when photolysis was carried out in the presence of Fe3C compared

314 B. Neppolian et al.
to the rate observed with photolysis alone. The combination of sonolysis andphotocatalysis (using either TiO2 or Fe3C) showed a detrimental effect. Synergyindices of 0.62 and 0.87 were noted for the sonophotocatalytic degradation of MCPin the presence of TiO2 and Fe3C. The mineralization process was additive for bothTiO2 and Fe3C sonophotocatalysis according to TOC results. It is clearly seen thatagain the complete mineralization of organics strongly depends on the nature of pol-lutants. Dimethyl phosphate, dimethylphosphonate, 3-hydroxy 2-buteneamide, andN-methyl 3-oxobutanamide were identified as intermediates during the degradationof monocrotophos and all of them degraded effectively under this process.
11.2.3 Degradation of Surfactants
Ashokkumar and coworkers studied the sonophotocatalytic degradation ofcommonly used surfactants dodecylbenzenesulphonate (DBS) and nonylphenolethoxylate Teric GN9 (GN9) in aqueous solution using TiO2 based photocatalysts(Table 11.1) [submitted 83, 84]. In their study, it was found that the initial pHof the solution played an important role during the photocatalytic degradationof DBS; whereas, there was no effect of pH during both sonolytic as well assonophotocatalytic degradation using Pt-graphene oxide (GO)-TiO2 nanoparticles.It is an added advantage of coupling both methods especially for surfactantsdegradation at any pH condition. Moreover, in the presence of GO, an enhancedrate of DBS oxidation was observed. When doped with platinum, mineralization ofDBS was further enhanced. Many intermediate products were identified during theDBS degradation within 10 min of reaction using electrospray mass spectrometry,mostly by the removal of CH2-groups from the chain and also subsequent additionof very few CH2- and OH-groups onto DBS. In 1-h reaction time, almost all theintermediate products were completely decomposed with a small amount of parentcompound remaining, as a result more than 75% mineralization was observed(0.2 mM DBS concentration). Ag doped TiO2 was used as a photocatalysts for thedegradation of nonylphenol ethoxylate under the visible region of light. Ag-TiO2
was able to degrade GN9 within 3 h of reaction. There was no synergetic effect onthe rate of this combined method for the degradation of both surfactants. This isdue to the formation of many intermediates during the degradation, which took longtime for the complete mineralization of surfactants.
11.3 Sonoelectrochemical Degradation of Organic Pollutants
11.3.1 Degradation of Textile Dyes
Lorimer et al. studied the decolorization of several dye effluents [85, 86] suchas Sandolan Yellow and Maxilion Blue 5G using sonolysis (SCT), electrolysis

11 Hybrid Sonochemical Treatments of Wastewater: Sonophotochemical. . . 315
(ECT), and background electrolyte-assisted sonoelectrolysis (BEA-SECT).Sandolan Yellow solutions were not decolorized under ultrasound (20 and 40 kHz).Decolorization could be achieved using electro-oxidation and the decolorizationprocess was further enhanced under simultaneous sonication (40 kHz) [85]. Thiswork showed that the decolorization process was dependent on the type of electrodeused, the current density applied, and the nature and concentration of the electrolyte.Only alkali metal chloride solutions promoted the decolorization of dye solutionsdue to the production of hypochlorite during electrolysis. Furthermore, platinumelectrodes led to better efficiencies than carbon electrodes when galvanostaticelectrolysis was carried out. Similar results were observed using a basic dye such asMaxilion Blue 5G in high-frequency (510 kHz) sonoelectrochemical oxidation [86].
Sonovoltammetric oxidation studies of Procion Blue on a boron-doped diamond(BDD) electrode were carried out in buffered aqueous solutions [87] as a functionof pH, dye concentration, and ultrasound treatment. The oxidation of the aqueoussolution of Procion Blue was most easily achieved in acidic solutions and at low dyeconcentrations; and electrode surface fouling occurred in more alkaline solutionsand at very high dye concentrations. Upon increasing the dye concentration, aproportional increase in the limiting current was observed. It was concluded thata resistive layer was formed on the electrode surface as a result of the adsorptionand desorption of the large dye molecules at the BDD electrode prior and afteroxidation.
Other dyes including Lissamine Green B [88], Trupocor Red [88], ReactiveBlack 5 [88], Acid Black [88], Methyl Orange [88, 89], Rhodamine B [89],Methylene Blue [89], Reactive Brilliant X-3B [89], and Reactive Blue 19 [90] havebeen used as reactive dyes for acoustic cavitation coupled with electrochemicaltreatment. Hydrodynamic cavitation has also been used to enhance the electrochem-ical treatment of Brilliant Red X-3B [91]. For all these studies, various electrodematerials such as Ti-IrO2 [91], graphite [88], platinum [89], PbO2 [90], and three-dimensional electrodes [92] were employed and the effect of several parameterswere studied including the ultrasonic power/intensity, the cell design, come alongthe pH and initial dye concentrations.
It can be concluded that the use of electro-oxidation combined with ultrasoundincreases the efficiency compared to the individual treatments, and in most of thestudied cases synergic effects were observed.
11.3.2 Degradation of Aromatic and Phenolic Derivatives
Trabelsi et al. [93] reported the BEA-SECT of aqueous phenol solutions underlow (20 kHz) and high-frequency (540 kHz) ultrasound irradiation. Electrochemicaloxidation of phenol was carried out using 0.1 g L�1 phenol solutions in 0.5 g L�1
NaCl as supporting electrolyte in galvanostatic mode (6.8 mA cm�2) with acylindrical nickel foam as cathode and a cylindrical expanded platinized titaniumas anode. When 20 kHz ultrasonic waves were applied, conversion of 75% of initial

316 B. Neppolian et al.
Table 11.2 Sonoelectrochemical degradation of phenol at 20 kHz and 540 kHz
Time/minute Phenol/mg L–1 p-Quinone/mg L–1Aceticacid/mg L–1
Phenolconversion/%
20 kHz0 100 0 0 0
5 54 7:9 2:4 46
10 24 12:6 3:1 76
20 12:8 11:1 4:6 87
45 7:8 7:6 4:8 92
60 3 5:5 6:2 97
540 kHz0 100 � 0 0
5 26:4 � 2:7 73:6
10 5 � 3:5 95
45 � � 11:5 100
60 � � 7:4 100
Reproduced from Ref. [93]. With kind permission of © Elsevier (1996)
phenol was achieved within 10 min of treatment. However, a toxic intermediate,p-quinone, was formed. At 540 kHz, a conversion of 95% of the initial phenol con-centration was obtained at the same treatment time, and final products of degradationwere acetic and chloroacrylic acids. Main by-products of the sonoelectrochemistrytreatment of phenol are shown in Table 11.2.
Zhao et al. analyzed the electrochemical oxidation of phenol on BDD andPt electrodes under silent and ultrasonic conditions (30 kHz, 50 W), from bothfundamental and applied aspects point of view [94]. Although both anode materialswere highly fouled, a much stronger electrode passivation took place on Pt. It wasfound that the ultrasonic irradiation improved the phenol degradation leading tohigh current efficiencies on both electrodes; although much higher when usingBDD electrodes. Mass transport and adsorption phenomena, as well as electrodereactions, can explain the different behaviors of these electrode materials. It wasobserved that, for the BDD electrode, (1) reaction rates and current efficiencieswere increased by 300% and 100%, respectively, under sonication and (2) loweryields of intermediates compared to silent conditions. Figure 11.1 shows the mainby-products for both treatments. Although in the presence of ultrasound the varietyof intermediates do not change for both electrodes used, it was found that theproduction and degradation rates of intermediates were especially enhanced byultrasound on BDD electrodes. In addition, the energy consumption of the electro-oxidation of phenol decreased when ultrasound was used, due to the fact that thetreatment time was significantly reduced.
The potentiostatic sonoelectrochemical oxidation of 2,4-dihydroxybenzoic acid(0.1–0.3 g L�1) was also performed using both 20 and 500 kHz ultrasonic irradi-ations [95]. The geometry and position of the electrodes were optimized in orderto maximize the acoustic effects. The platinized titanium grid anode (cylinderor disc at high-frequency or low-frequency ultrasonic experiments, respectively)

11 Hybrid Sonochemical Treatments of Wastewater: Sonophotochemical. . . 317
3000a b
c d
e
g
f
80
25075
600
450
300
150
0
60
45
30
15
0
200
150
100
50
0
180
150
120
90
60
30
0
60
40
20
0
50
40
30
20
10
0
2500
2000
1500
1000
Con
cent
ratio
n (μ
M)
Con
cent
ratio
n (μ
M)
Con
cent
ratio
n (μ
M)
Con
cent
ratio
n (μ
M)
Con
cent
ratio
n (μ
M)
Con
cent
ratio
n (μ
M)
Con
cent
ratio
n (μ
M)
500
0
0 2 4t (h)
6 8 10
Ph Hydroquinone
BenzoquinoneResorcin
Maleic acid Fumaric acid
Oxalic acid
d
d
db
b
bd
a
a
c
c
bb
b
a
c
0
0 4 8 12 16 20
0 4 8 12 16 20
0 4 8 12 16 20
2 4t (h)
t (h)
t (h)
t (h)
6 8 10
0 2 4t (h)
6 8 10
0 2 4t (h)
6 8 10
Fig. 11.1 Variation of the concentration of phenol and by-products with the degradation time:(a) ECT and (b) BEA-SECT on platinum; (c) ECT and (d) BEA-SECT on BDD (Reproducedfrom Ref. [94]. With kind permission of © Elsevier (2008))

318 B. Neppolian et al.
was located either in the region of highest ultrasonic intensity (situated near theair–liquid interface) or at the transducer surface for low-frequency and high-frequency ultrasonic experiments, respectively.
11.3.3 Degradation of Nitrocompounds
The treatment of nitroaromatic compounds using sonoelectrochemistry methodshas been analyzed sonovoltammetrically [96] and galvanostatically [97]. Aque-ous solution of nitrobenzene (pH D 13) was reduced on glassy carbon and goldelectrodes [96] under both silent and ultrasonic conditions (20 kHz and up to40 W cm–2). A reduction mechanism was proposed. First, a chemically reversibleone electron process took place followed by an irreversible three electron reductionand, furthermore, an overall four electron process occurred at sufficiently negativepotentials, leading to the production of phenylhydroxylamine. In these experiments,the glassy carbon electrode surface was damaged for very short electrode–horndistances and the gold electrode led to more complicated mechanisms due to surfacereaction pathways.
The effect of ultrasonic irradiation on galvanostatic reduction of 1,3-dinitrobenzene and 2,4-dinitrotoluene in acid media have also been studied [97].Ultrasound irradiation enhanced the electrochemical reduction rate.
11.3.4 Degradation of Chlorinated Compounds
2,4-Dichlorophenoxyacetic acid is one of the most widely used herbicides world-wide. It is a poorly biodegradable pollutant with mild toxicity, which can beconverted into highly toxic chlorinated compounds such as 2,4-dichlorophenol. Thedegradation of 2,4-dichlorophenol has been studied sonoelectrochemically [98] us-ing platinum electrodes in an ultrasonic bath (44 kHz). Cyclic sonovoltrammogramsshowed an increase in currents under insonation leading to an overall overpotentialdecrease together with no deactivation of the electrode. Bulk electrolyses using1.0 M Na2SO4 as supporting electrolyte were carried out galvanostatically at variouscurrent densities. High degradation rates were obtained when the current densitywas increased to 70 mA cm�2, leading to a reduction of 78% in total organiccarbon value. The mass balance based on chloride ions indicated the formation ofunanalyzed low-molecular–weight chlorinated compounds.
Other chlorinated compounds such as perchloroethylene (PCE) and trichlo-roacetic acid [99, 100] have been treated using the sonoelectrochemistry method.Alicante group has extensively studied the degradation of PCE using electrochem-ical (ECT), sonochemical (SCT), and sonoelectrochemical treatments [101–107].The following section shows the main results obtained in the degradation of thispollutant.

11 Hybrid Sonochemical Treatments of Wastewater: Sonophotochemical. . . 319
Fig. 11.2 Surface-enhanced Raman spectra of (a) bared copper, (b) 0.05 M Na2SO4 and (c–l)10 ppm PCE C 0.05 M Na2SO4 adsorbed on SERS-active copper electrode at different potentialsshowed in the figure (Reproduced from Ref. [101]. With kind permission of © Elsevier (2008))
11.3.4.1 Fundamental Studies
The study of application of ECT started with the study of the voltammetric behaviorof the aqueous supporting electrolyte/electrode system, followed by the use ofsurface-enhanced Raman spectroscopy (SERS) analysis. It continues with rotatingdisc electrode and bulk electrolyses experiments to give whole information aboutoptimal variable parameters and reactor configuration. SERS, HPLC, GC, andion chromatography analyses were used for the identification of degradation by-products, their quantification and mechanistic details.
Taking into account the industrial application, only a few electrode materialswere used in this study. Copper showed a good performance on SERS experimentsand exceptional catalytic properties and was used by Saez et al. [101] on thepreliminary voltammetric and SERS study of aqueous PCE electroreduction, usingNa2SO4 as supporting electrolyte. Authors found that as the electrode potentialdecreases, the reduction of PCE is favored. The potential-dependent formationof PCE derivatives on a copper surface reveals that PCE undergoes reductionat E � �0.3 V vs. Ag/AgCl/KCl (3 M) electrode (all potential data on the PCEdegradation study are quoted with reference to this electrode). This is confirmed bythe emergence of intense Cu–Cl stretching (290 cm�1), C–H stretching (contributionto the band at 2,920 cm�1) band on SERS analysis (Fig. 11.2). The presence of Cl�and dichloroethylene (DCE) in the catholyte was observed during electrolysis at�0.3 V detected by IC, HPLC, and GC.

320 B. Neppolian et al.
Fig. 11.3 Linear voltammograms at electrode material in 50 ppm of PCE C 0.05 M Na2SO4
aqueous solution, 0.5 V s�1, first scan (Reproduced from Ref. [102]. With kind permission of© J New Mater Electrochem Syst (2008))
A band centered at 1,900 cm�1 (C–C structures) was detected in the 0 to �0.9 Vpotential region. The presence of carbon on the surface of the copper electrode issupported by the appearance of two bands at 1,330 and 1,590 cm�1 at potentialslower than �1.0 V, and by the XPS analysis of the electrode surface after preparativeelectrolysis carried out at �1.0 V. During the preparative electrolysis, a C–Clmultibond cleavage process occurs as it suggests by the appearance of DCE andthe absence of trichloroethylene (TCE). The direct generation of DCE in front of astep process via TCE is favored.
11.3.4.2 Electrodic Material Study
Other electrodic materials such as glassy carbon and lead have been studied onthe ECT of PCE by Saez et al. [102]. No peaks can be observed on the cyclicvoltammetry of an aqueous PCE/Na2SO4 solution on glassy carbon; and, therefore,slow kinetics for PCE reduction could be expected or its electroreduction couldtake places at potentials close to the supporting electrolyte decomposition. Leadelectrode presents a stronger interaction with PCE and a peak at �0.7 V and ashoulder at �1.2 V can be observed on cyclic voltammograms. The peak at �0.7 V isassociated to the lead oxide/lead sulfate surface reduction process and the reductionof PCE at this potential. On copper electrodes this process is associated with theshoulder appearing at �0.55 V. Figure 11.3 summarizes the voltammetric behaviorof the PCE electroreduction with the three electrode materials.

11 Hybrid Sonochemical Treatments of Wastewater: Sonophotochemical. . . 321
11.3.4.3 Bulk Electrolyses
The controlled potential bulk electrolyses (divided glass cell, Nafion 450 cationicmembrane) confirm the electroreduction of PCE in aqueous medium at the threeelectrodes (at �1.0 and �1.2 V for glassy carbon, at �0.4, �0.55, �0.7, �1.0, and�1.2 V for lead; and �0.3, �0.55 and �1.0 V for copper electrodes), but showingdifferent electrocatalytic behavior. The lead electrode gave the best results andhigher chlorinated or C3 reaction products have not been detected on any electrode.The reduction mechanism does not seem to follow a soluble radical route, andauthors suggest that reduction seems to take place in a step-wise process givingproducts that are soluble and can be easily detected. A molar ratio TCE/DCE closeto 2 obtained in the preparative electrolyses is in agreement with a predominant step-wise electroreduction pathway. Chemical reduction trials discarded the reduction ofPCE by the zero-valent metal.
For all the electrode materials studied, TCE, DCE, and Cl� anions were clearlydetected as major intermediates and final products. The major part of the chlori-nated compounds was detected and quantified, but some nonchlorinated organiccompounds remain unidentified according to the mass balances calculations. Thecurrent efficiencies were low but they increased as the working electrode potentialdecreases.
Galvanostatic electrolyses are preferable for industrial purposes because of thecheapest investment and easiest handling, and were carried out in the next stage.Saez et al. [103] studied not only the influence the initial concentration of PCE, butalso several glass cell configurations with different cathodic (divided cell, electrore-duction), anodic (divided cell, electrooxidation) and both simultaneously (undividedcell, dual degradation) treatments. Aqueous and gas phases were analyzed and themass balance of the processes was checked. Lead was chosen as cathode materialin this study because of its high overpotential for the reduction of water in spite ofthe theoretical drawbacks, from an environmental point of view. An anode of leaddioxide was used (Fig. 11.4).
The highest degradation (�50%) was obtained using the undivided configuration.PCE can be nearly degraded (<7% of the initial product remaining) and Cl�, DCE,and TCE were found as major reactions products. The mass balance on total chlorineis closed. In the anodic treatment of PCE chloroacetic anions have been clearlydetected along with the presence of CHCl3 and CCl4 compounds suggesting thatthe anodic degradation follows a slow and complex multipath route.
Following the study of ECT of PCE in water a scale-up to a laboratory scaleelectrochemical filter-press reactor and an extensive study of the influence ofthe operational variables was carried out by Saez et al. [104]. The influencesof the initial concentration, volumetric flow and electrode geometry, as well asthe nature on the kinetics, degradation efficiency and mechanism were analyzedby determining the values of process performance parameters such as fractionalconversion (FC), degradation efficiency (DE), current efficiency (CE), mass balanceerror based on chlorine (Cl-MBE) and selectivity (SCl).

322 B. Neppolian et al.
1.0
0.8
0.6
0.4
[CI]
/[C
I] the
oret
ical
0.2
0.00 50 100 150
t/min
200 250 300
Fig. 11.4 Degradation of PCE for the three ECTs: (�) dual, (�) cathodic, and (O) anodic(Reproduced from Ref. [103]. With kind permission of © Elsevier (2009))
FC D ŒPCE�tD0 � ŒPCE�tDtf
ŒPCE�tD0� 100 (11.1)
DE D ŒCl��tDtf � ŒCl��tD04 � ŒPCE�tD0
� 100 (11.2)
CE D ŒCl��tDtf � V � 2 � F
Passed charge� 100 (11.3)
Cl � MBE D
0
B@1 �
PDcompoundP.mg of Clin P/tDtf
.mg of Clin PCE/tD0
1
CA � 100 (11.4)
SCl D mol of chloride ionP
mol of detected chlorinated compounds C mol of chloride ion; (11.5)
where [PCE]tD0 and ŒPCE�tDtf are the initial and the final PCE concentration,[Cl–]tD0 and ŒCl��tDtf are the initial and the final chloride anion concentration,respectively; V represents the total volume of the solution and F the Faradayconstant.
Several electrode materials and electrode geometries were tested. Three-dimensional carbon electrodes did not provide a more competitive option. Thebest results on the scale-up were an FC higher than 85%, DE of 65%, SCl close to0.8 and energetic consumption around 3 kWh m�3 obtained with two-dimensionalelectrodes. In summary, the ECT provides a high DE for PCE with low energeticconsumption; but toxic chlorinated by-products are not fully degraded (Table 11.3,Fig. 11.5).

11 Hybrid Sonochemical Treatments of Wastewater: Sonophotochemical. . . 323
Table 11.3 Main results for ECT, SCT, BEA-SECT, and SECT at batch scale
FC/% DE/% Cl-MBE/% SCl/% CE/% Time/min
ECTQV /L h–1
100 84 51 4 0.75 2 300150 87 65 2 0.87 2:5 300200 86 42 5 0.71 1 300250 84 68 13 0.84 1 300
SCTIa/Wcm–2–…/Wcm–3
1.84–0.065 86 24 53 0.79 � 3003.39–0.120 98 29 59 0.88 � 3005.09–0.180 99 30 62 0.92 � 3006.36–0.225 98 25 64 0.90 � 3007.64–0.270 99 21 72 0.91 � 300
BEA-SECTIa/Wcm–2–…/Wcm–3
1.84–0.065 95 30 52 0.83 2:3 15097 37 38 0.86 1:2 300
3.39–0.120 96 46 45 0.97 12 15097 46 47 0.96 5 300
5.09–0.180 96 50 50 1.00 11 150100 57 39 0.98 6 300
6.36–0.225 97 49 48 0.99 13 150100 53 43 0.99 7 300
7.64–0.270 97 50 46 0.98 14 150100 56 41 0.99 8 300
SECTIa/Wcm–2–…/Wcm–3
1.84–0.065 82 36 23 0.78 19 15096 50 40 0.95 9 300
3.39–0.120 96 49 46 0.98 21 150100 57 34 0.93 14 300
5.09–0.180 95 65 20 0.98 20 15096 74 29 0.98 13 300
6.36–0.225 97 77 16 0.99 12 150100 84 13 0.99 10 300
7.64–0.270 100 99 1 1.00 13 150100 100 0 0.99 10 300
Reproduced from Refs. [104, 107]. With kind permission of © Elsevier (2010) and © TheAmerican Chemical Society (2011)
11.3.4.4 Sonochemical Treatment
SCT has routinely been used for the degradation of chlorinated compounds in orderto check water remediation applications and it has been reported in the literatureof some papers about the SCT of PCE [108–112]. A deep analysis of the reaction

324 B. Neppolian et al.
Fig. 11.5 (a) Electrochemical filter-press reactor: (1) backplate, (2) backplate joint, (3) polypropy-lene block with flow channels, (4) electrode joint, (5) cathode, (6) anode, (7) compartment joint,(8) compartment. (b) Experimental setup: (1) electrochemical filter-press reactor, (2) electrolytereservoir, (3) gasmeter, (4) pump, (5) flowmeter, (6) temperature control, (7) cooling system,(8) power supply, (9) voltmeter, (10) probes holder, (11) pH meter, (12) conductimeter (Reprintedfrom Ref. [104]. With kind permission of © The American Chemical Society (2010))
by-products, the effect of ultrasonic operational variables upon PCE degradation(frequency, power, and system geometry as well as substrate concentration) and amass balance were carried out by Saez et al. [107]. They studied these parametersand noted Cl� and CO2/CO as major reaction products, and also TCE, and DCE atppm concentrations as reported earlier in the literature. The formation of very low(ppb) concentrations of small halocompounds (CHCl3, CCl4), and also of highermass species, such as pentachloropropene, hexachloroethane, is noteworthy. Theyalso found significant quantities of chloroacetate derivatives at ppm concentrations.
The best results for PCE degradation (in terms of DE and Cl-MBE) were obtainedat 580 and 850 kHz. Taken into account the hydrophobic and volatile nature of PCE,the authors suggest that the first step of the mechanism is the degradation of PCEinto other chloroethenes in the interior of cavitation bubbles by pyrolysis or in theinterfacial region of a cavitation bubble, rather than in the aqueous solution. Then,two pathways can interfere: pyrolysis of the remaining compounds and oxidationby the OH radicals. At high frequencies, the pyrolytic pathway is prevalent, takingpart in the degradation of the initial PCE and the formation of residual (at ppblevel) 1C, 3C, and 4C chlorinated compounds. At low frequency the oxidation bythe OH radicals is predominant and highly soluble oxygenated compounds such aschloroacetates can be formed because the reaction time inside the cavitating bubblesis longer whereas at high frequency OH radicals are rapidly ejected to the solution.
Sonolysis was very effective for PCE degradation and Saez et al. obtainedFC> 97%, and a mass balance close to 100% in the same conditions. From anapplication point of view, it should be noted that chlorinated reaction products are of

11 Hybrid Sonochemical Treatments of Wastewater: Sonophotochemical. . . 325
some intrinsic toxicity, so the overall environmental benefit of insonation to destroypollutants of this type remains debatable. In summary, the SCT of PCE proceedswith high DE values but with very high energetic cost and produces a higher by-products speciation than the ECT (Table 11.3).
11.3.4.5 Sonoelectrochemical Treatment
The use of hybrid technologies such as sonoelectrochemical treatment has beenproposed by the authors in order to achieve a good level of water remediation. The20 kHz BEA-SECT of PCE in aqueous Na2SO4 using controlled current densitysonoelectrolyses in batch mode gave an important improvement in the viability ofthe SCT process when the electrochemistry is implemented [105]. On the BEA-SECT, a fractional conversion near 100% and degradation efficiency around 55%are obtained independent of the ultrasound power used (Fig. 11.6 and Table 11.3).Although the main volatile compounds produced, TCE and DCE, are not only totallydegraded, similar concentration levels are achieved at shorter reaction time than inthe SCT or ECT. The current efficiency is enhanced compared to the ECT and ahigher speciation is also detected.
The combination of ultrasound and electrical fields provides a reaction environ-ment, which greatly improves the SCT and ECT of PCE solutions, providing anacceptable procedure from a technical point of view. Moreover, the treatment timeis significantly reduced, and then, the energetic consumption with BEA-SECT islower than that presented by SCT.
The treatment of PCE solutions simulating real wastewater samples completesthis study of technical viability [106]. The authors studied the sonoelectrolysis,without the addition of the supporting electrolyte (SECT) (20 kHz, Pb/PbO2 ascathode/anode), of low conductivity PCE solutions. A controlled-voltage modewas selected for the electrolysis (a maximum applied voltage between anode andcathode of 14.3 V) and the maximum permitted current density was fixed at3.5 mA cm�2. The absence of supporting electrolyte implies that in the early stagesof the sonoelectrolysis experiments the current is quite low because of the lowconductivity of the solution. As the process proceeds, a background electrolyte isgenerated due to the fact that the electrochemical process provides, at least, chloride,chlorate and hydrogen ions.
Controlled-voltage PCE solutions sonoelectrolysis experiments at different ul-trasound intensities (Ia) showed that when Ia was increased, an increase in the rateof disappearance of PCE was observed. However, the CE was not influenced bythis parameter. The higher values of CE (>50% for chlorinated compounds) weremaintained during the first hour of treatment (Fig. 11.7) in comparison with thoseobtained during the ECT (<8% in the best situation) or during the BEA-SECT. PCE,TCE and DCE were totally degraded in the first 2.5 h of the process (Fig. 11.8 andTable 11.3) in a similar way to those of BEA-SECT and in contrast to the ECT, forwhich even at high volumetric flows, a steady-state was observed in the remaining

326 B. Neppolian et al.
1.0
0.8
0.6
0.4
[PC
E, T
CE
, DC
E]/[
PC
E] 0
[CI],
[CIO
3]/4
�[P
CE
] 0
[CI],
[CIO
3]/4
�[P
CE
] 0[C
I], [C
IO3]
/4�
[PC
E] 0
[CI],
[CIO
3]/4
�[P
CE
] 0
[CI],
[CIO
3]/4
�[P
CE
] 0
[PC
E, T
CE
, DC
E]/[
PC
E] 0
[PC
E, T
CE
, DC
E]/[
PC
E] 0
[PC
E, T
CE
, DC
E]/[
PC
E] 0
[PC
E, T
CE
, DC
E]/[
PC
E] 0
0.2
0.00 50 100 150
t/min t/min200 250 300 0 50 100 150 200 250 300
0 50 100 150t/min t/min
200 250 300 0 50 100 150 200 250 300
t/min0 50 100 150 200 250 300
1.0
0.8
0.6
0.4
0.2
0.0
1.0
0.8
0.6
0.4
0.2
0.0
1.0
0.8
0.6
0.4
0.2
0.0
1.0
0.8
0.6
0.4
0.2
0.0
1.0
0.8
0.6
0.4
0.2
0.0
1.0
0.8
0.6
0.4
0.2
0.0
1.0
0.8
0.6
0.4
0.2
0.0
1.0
0.8
0.6
0.4
0.2
0.0
1.0
0.8
0.6
0.4
0.2
0.0
a b
c d
e
Fig. 11.6 Normalized concentration evolution vs time: (�) PCE, (N) TCE, (•) DCE, (x) Cl�,(*) ClO3
� for the BEA-SECT at different ultrasonic intensities (a) 1.84; (b) 3.39; (c) 5.09; (d) 6.36and (e) 7.64 W cm�2, f D 20 kHz, 3.5 mA cm�2, 20ıC (Reproduced from Ref. [105]. With kindpermission of © Elsevier (2010))
concentration of TCE and DCE. The results obtained in the SECT suggest that themechanism is not fully controlled by the mass transport.
Therefore, the implementation of an ultrasound field during the electrochemicaltreatment of polluted water with low electrical conductivity appears to be apromising option enabling the electrochemical degradation of halogenated organiccompounds in polluted water, employing an electrical current as the unique reactant,

11 Hybrid Sonochemical Treatments of Wastewater: Sonophotochemical. . . 327
Fig. 11.7 Normalized degradation of PCE by sonoelectrochemical treatment and in the inset theCE for different concentrations (g L�1) of Na2SO4 (mM ionic strength in brackets): (x) 0, (�) 0.5(3.5), (•) 2.5 (17.6), (N) 7.1 (50), (H) 12 (84.5); f D 20 kHz, 3.5 mA cm�2, 3.39 W cm�2, 20ıC(Reproduced from Ref. [106]. With kind permission of © Elsevier (2011))
and avoiding the undesirable addition of any chemicals. The high energetic cost ofthis treatment is the main drawback.
11.3.5 Hybrid Sonoelectrochemical Methods
Presently, further efforts in the development of the emerging AOTs, going deep intothe possibility of achieving high synergic effects when some of those processesare applied simultaneously, are subject of interest. In this sense, combinationsof sonoelectrochemical treatments with ozonation, photocatalysis, and Fentontechniques have been addressed.
As previously stated, photocatalytic degradation of water contaminants has beensuccessfully used alone or together with the irradiation of an ultrasonic field. Zhangand coworkers were able to combine properly the advantages of photocatalysis,electrocatalysis, and sonocatalysis achieving a synergistic effect [113]. The authorsraised the azodye methyl orange degradation at the 1.0 � 10–5–2.0 � 10–4 Mconcentration range through different oxidative strategies in a comparative study.

328 B. Neppolian et al.
1.0
0.8
0.6
0.4
0.2
0.0
1.0
0.8
0.6
0.4
0.2
0.0
1.0
0.8
0.6
0.4
0.2
0.0
1.0
0.8
0.6
0.4
0.2
0.0
1.0
0.8
0.6
0.4
0.2
0.0
1.0
0.8
0.6
0.4
0.2
0.0
1.0
0.8
0.6
0.4
0.2
0.0
1.0
0.8
0.6
0.4
0.2
0.0
1.0
0.8
0.6
0.4
0.2
0.0
1.0
0.8
0.6
0.4
0.2
0.0
0 50 100 150t/min
200 250 300 0 50 100 150t/min
200 250 300
0 50 100 150t/min
200 250 3000 50 100 150t/min
200 250 300
0 50 100 150t/min
200 250 300
[PC
E, T
CE
, DC
E]/[
PC
E] 0
[PC
E, T
CE
, DC
E]/[
PC
E] 0
[PC
E, T
CE
, DC
E]/[
PC
E] 0
[PC
E, T
CE
, DC
E]/[
PC
E] 0
[PC
E, T
CE
, DC
E]/[
PC
E] 0
[CI],
[CIO
3]/4
�[P
CE
] 0[C
I], [C
IO3]
/4�
[PC
E] 0
[CI],
[CIO
3]/4
�[P
CE
] 0
[CI],
[CIO
3]/4
�[P
CE
] 0[C
I], [C
IO3]
/4�
[PC
E] 0
a b
c d
e
Fig. 11.8 Normalized concentration vs time: (�) PCE, (N) TCE, (•) DCE, (*) Cl–, (x) ClO3�
for the PCE SECT at different ultrasonic intensities (a) 1.84; (b) 3.39; (c) 5.09; (d) 6.36 and (e)7.64 W cm�2, f D 20 kHz, VA�C D 14.3 V, 20ıC, 0 g L�1 Na2SO4 (Reproduced from Ref. [106].With kind permission of © Elsevier (2011))
Different batch photocatalytic, sonophotocatalytic, photoelectrocatalytic, andsonophotoeletrocatalytic experiences were carried out in the same multipurposereactor. A photoreactor immersed in 40 kHz ultrasonic cleaning bath operatingat several acoustic powers ranging from 60 to 150 W was used. The workingelectrode was a homemade TiO2 nanotube anode, the supporting electrolyte was0.5 M Na2SO4 aqueous solution, and electrode potential applied was 0.6 V vs. SCEfor the ECT. The reactor used had a bottom-attached 11 W UV lamp with centralwavelength of 253.7 nm (0.1 Hz chopped UV irradiation was used).

11 Hybrid Sonochemical Treatments of Wastewater: Sonophotochemical. . . 329
The degradation processes tested followed pseudo-first-order kinetics in all caseand their rate constants increased as follows: photocatalytic (0.0035 min�1)< sonophotocatalytic (0.0073 min�1) < photoelectrocatalytic (0.0523 min�1)< sonophotoelectrocatalytic (0.0732 min�1). Results showed that the hybrid photo-electrocatalytic and sonophotoelectrocatalytic processes could efficiently enhancethe degradation efficiency of methyl orange dye achieving a degradation of 88%of the initial pollutant after 60 min of treatment (Co D 5 � 10–5 M, ultrasoundpower 150 W).
The possibility of the combination of a BEA-SECT with ozonation has also beenexplored by Abramov et al. in their work on the destruction of 1,3-dinitrobenzeneand 2,4-dinitrotoluene [97]. In that case, a titanium ultrasonic horn (5 cm2) wasused as a cathode immersed in a 100 cm3 catholyte containing 100 mg L�1
of 1,3-dinitrobenzene and 2,4-dinitrotoluene. The use of ultrasound (5 W cm�2,calorimetrically measured) enhanced the rate of electrochemical reduction (current:50 mA), increasing the current efficiency from �15% to 55–57%, but the overallreaction rate remained still slow. On the other hand, the compounds were shownto be stable to reaction with ozone, even under ultrasonic activation. However, thesimultaneous application of ultrasound and ozonation (flow rate 0.1–3 L�1 h�1, O3
concentration 3–10%) to the electrochemical reaction allowed complete destructionof the compounds in short times.
In this case, the effect was attributed to the ultrasonic enhancement of the elec-trochemical process giving intermediates that are susceptible to ozone oxidation.Ozone is a very efficient oxidizing agent able to interact with electron donors orbe reduced in the cathode to O3
�. This highly oxidant anion rapidly forms theanion radical O•� in acidic media, or alternatively can generate OH radical, a veryactive oxidant. It is assumed that this process is improved by the mechanical effectsprovided by cavitation such as enhanced mixing, diffusion, and mass transfer.
On the other hand, different groups have tried to improve the performance ofthe Fenton process applied to environmental remediation by the application ofsonoelectrochemistry. Fenton reaction is based on the H2O2 decomposition to OHradicals in acid aqueous medium, catalyzed by the addition of a small amount ofFe2C [114]. It involves further radical reactions among the organic compounds andthe OH radicals formed.
H2O2 C Fe2C ! Fe3C C HO� C HO� (11.6)
The potentiality of the application of electrochemical processes coupled withFenton treatment has revealed itself as a useful technology that improves signifi-cantly the original approach [115]. One of the main advantages of this combinationis the possibility to generate H2O2 electrochemically in a safer process comparedwith H2O2 addition to the polluted effluent. Moreover, the possibility of Fe2Cregeneration in the cathode makes the process more environmentally friendly, sinceless amount of iron is needed initially. As in other electrochemical processes, someauthors have taken advantage of the outstanding beneficial effects of ultrasound insonochemical processes.

330 B. Neppolian et al.
The first study found in literature dealt with the sonoelectro-Fenton degradation(SEF) of the organic dye molecule meldola blue (MDB) [116]. The authorsused a sonoelectrochemical reactor containing 100 cm3 of solution (1 � 10–4 MMDB, 0.050 mM Na2SO4, 0.010 mM H2SO4, 0.5 mM FeSO4) with a retic-ulated carbon felt cathode (15 mm � 10 mm � 5 mm) working at �0.7 V vsAg. The solution was exposed to 124 kHz ultrasound field. Assuming pseudo-first-order kinetics, it was found that the rate constant for the dye degrada-tion reached for the different tested treatments in the following order: ECT(negligible)<SCT (0.0044 min�1)< sono-Fenton (0.0081 min�1)<BEA-SECT(0.0126 min�1)< electro-Fenton (0.0142 min�1)<SEF (0.0237 min�1). In theECT, SCT, and BEA-SECT treatments exposed, no FeSO4 was added to the reactionsolution.
Recently, the effect of low-frequency ultrasonic irradiation on the SEF degrada-tion has been tested again for decomposition of cationic red X-GRL [117]. It hasbeen found that both total organic carbon removal efficiency and mineralizationcurrent efficiency were efficiently promoted with the electro-Fenton process.
Furthermore, the SEF treatment is a helpful technology for the degradationof organochlorinated compounds in wastewater [118]. Outran et al. found asynergistic effect while using an undivided electrolytic cell (250 mL) with athree-dimensional carbon-felt cathode (15 cm � 8 cm) applying constant current(200 mA) for the destruction of the herbicides, 4,6-dinitro-o-cresol (DNOC), and2,4-dichlorophenoxyacetic acid (2,4-D) [119]. A 28 kHz ultrasound field operatingat 20 W was used for the SEF processes. The apparent rate constants for theelectro-Fenton and SEF processes were 0.025 min�1 and 0.046 min�1 for 2,4-Dand 0.023 min�1 and 0.051 min�1 for DNOC, respectively, and followed pseudo-first-order kinetics in all cases.
The enhancement observed in the SEF process is partially ascribed to theenhancement in the mass transfer of both reactants (Fe3C and O2) toward thecathode for the electrochemical generation of Fenton’s reagent (Fe2C C H2O2)and its subsequent transfer. Gonzalez-Garcıa et al. observed an enhancement ofthe electrochemically produced H2O2 in aqueous solution by means of ultrasoundapplication [120]. Furthermore, the amount of OH radical in solution is expected tobe higher in irradiated systems than in silent conditions due to its formation insidecavitation bubbles.
11.4 Conclusion
It has been shown that sonophotocatalysis seems to be a promising method for thedegradation of organic pollutants in aqueous solutions. The degradation process ismostly governed by free radical reactions because all the organics discussed hereare nonvolatile in nature. The extent of degradation depends on many parameterssuch as nature of catalysts, concentration of pollutant, amount of catalyst, intensityof light, ultrasonic power, solution temperature, pH, and dissolved gas. Although the

11 Hybrid Sonochemical Treatments of Wastewater: Sonophotochemical. . . 331
initial rate of sonochemical degradation is relatively fast, complete mineralization isachieved along with TiO2 photocatalysts in most cases.
This chapter also has summarized the applications found in the literature on theuse of sonoelectrochemical treatment of organic pollutants in aqueous solutions.Greater effort is needed to fully understand the degradation process that occurswhen combining both methods. This will bring improvements in existing and futureapplications. Given that the contamination of water effluents is a raising problem,an increase on the research into the new possibilities of hybrid sonoelectrochemicaltechnologies is also expected in the near future.
References
1. Hoffmann MR, Martin ST, Choi W, Bahnemann DW (1995) Environmental applicationssemiconductor photocatalysis. Chem Rev 95:69–96
2. Neppolian B, Sakthivel S, Palanichamy M, Arabindoo B, Murugesan V (1998) Photocatalyticdegradation of textile dye commonly used in cotton fabrics. Stud Surf Sci Catal 113:329–335
3. Neppolian B, Sakthivel S, Palanichamy M, Arabindoo B, Murugesan V (1999) Degradationof textile dye using TiO2 and ZnO photocatalysts. J Environ Sci Health A 43:1829–1838
4. Serpone N, Pelizzetti E (1989) Photocatalysis: fundamentals and applications. Wiley,New York
5. Herrmann JM (1995) Heterogeneous photocatalysis – an emerging discipline involvingmultiphase systems. Catal Today 24:157–164
6. Vinodgopal K, Wynkoop DE, Kamat PV (1996) Environmental photochemistry on semicon-ductor surfaces: photosensitized degradation of a textile azo dye, acid orange 7, on TiO2
particles using visible light. Environ Sci Technol 30:1660–16667. Das S, Kamat PV, Padmaja S, Madison SA (1999) Free radical induced oxidation of the azo
dye Acid Yellow 9. J Chem Soc Perkin Trans 2:1219–12238. Stafford U, Gary KA, Kamat PV (1997) Photocatalytic degradation of 4-chlorophenol: the
effects of varying TiO2 concentration and light wavelength. J Catal 167:25–329. Davis RJ, Gainer JL, Neal GO, Wenwu I (1994) Photocatalytic decolourization of wastewater
dyes. Water Environ Res 66:50–5310. Bahnemann D, Boule P (eds) (1999) Photocatalytic degradation of polluted waters, The
handbook of environmental chemistry, vol 2, Part L: Environmental photochemistry. Springer,Berlin
11. Singla R, Grieser F, Ashokkumar M (2009) Sonochemical degradation of martius yellow dyein aqueous solution. Ultrason Sonochem 16:28–34
12. Choi W (2006) Pure and modified TiO2 photocatalysts and their environmental applications.Catal Surv Asia 10:16–28
13. Yang L, Rathman LK, Weavers LK (2005) Sonochemical degradation of alkylbenzenesulfonate surfactants in aqueous mixtures. J Phys Chem B 110:18385–18391
14. Neppolian B, Jung H, Choi H, Lee JH, Kang JW (2002) Sonolytic degradation of methyl tert-butyl ether: the role of coupled Fenton process and persulphate ion. Water Res 36:4699–4708
15. Singla R, Ashokkumar M, Grieser F (2004) The mechanism of the sonochemical degradationof benzoic acid in aqueous solutions. Res Chem Intermed 30:723–733
16. Singla R, Grieser F, Ashokkumar M (2009) Kinetics and mechanism for the sonochemicaldegradation of a nonionic surfactant. J Phys Chem A 113:2865–2872
17. Peller J, Wiest O, Kamat PV (2001) Sonolysis of 2, 4-dichlorophenoxyacetic acid in aqueoussolutions. Evidence for OH-radical-mediated degradation. J Phys Chem 105:3176–3181

332 B. Neppolian et al.
18. Yang L, Sostaric JZ, Rathman JF, Weavers LK (2008) Effect of ultrasound frequency onpulsed sonolytic degradation of octylbenzene sulfonic acid. J Phys Chem B 112:852–858
19. Naldoni A, Schibuola A, Bianchi CL, Bremner DH (2011) Mineralization of surfactants usingultrasound and the advanced Fenton process. Water Air Soil Pollut 215:487–495
20. Neppolian B, Park JS, Choi H (2004) Effect of Fenton-like oxidation on enhanced oxidativedegradation of para–chlorobenzoic acid by ultrasonic irradiation. Ultrason Sonochem 11:273–279
21. Neppolian B, Ciceri L, Bianchi CL, Grieser F, Ashokkumar M (2011) Sonophotocatalyticdegradation of 4-chlorophenol using Bi2O3/TiZrO4 as a visible light responsive photocatalyst.Ultrason Sonochem 18:135–139
22. Tarr M (2003) Chemical degradation methods for wastes and pollutants. Environmental andindustrial applications. Marcel-Dekker, New York
23. Souther RH, Alspaugh TA (1957) Textile wastes- recovery and treatment. J Water PollutControl Fed 29:804–810
24. Hamza A, Hamoda MF (1980) Multiprocess treatment of textile wastewater. In: Proceedingsof the 35th Purdue industrial waste congress, West Lafayette, IN, USA
25. Sheng HL, Chi ML (1993) Treatment of textile waste effluents by ozonation and chemicalcoagulation. Water Res 27:1743–1748
26. Arslan I, Balcioglu IA, Tuhkanen T, Bahnemann D (2000) H2O2/UV-C and Fe2C/H2O2/UV-Cversus TiO2/UV-A treatment for reactive dye wastewater. J Environ Eng 126:903–911
27. Chaudhuri SK, Sur B (2000) Oxidative decolorization of reactive dye solution using fly ashas catalyst. J Environ Eng 126:583–594
28. Neppolian B, Sakthivel S et al (1999) Photoassisted degradation of textile dye using ZnOcatalyst. Bull Catal Soc India 81:164–171
29. Neppolian B, Choi H, Sakthivel S, Arabindoo B, Murugesan V (2002) The influence of solarlight induced and TiO2 assisted degradation of textile dye reactive blue 4. Chemosphere46:1173–1181
30. Yang YQ, Wyatt DT, Bahorsky M (1998) Decolorization of dyes using UV/H2O2 photochem-ical oxidation textile dye. Chem Color 30:27–35
31. Balcioglu IA, Arslan I (1997) Treatment of textile waste water by heterogeneous photocat-alytic oxidation processes. Environ Technol Lond 18:1053–1059
32. Neppolian B, Shankar MV, Murugesan V (2002) Semiconductor assisted photodegradationof textile dye, reactive red 2 by ZnO. J Sci Indus Res 61:224–230
33. Neppolian B, Kanel SR, Choi H, Shankar MV, Arabindoo B, Murugesan V (2003) Photocat-alytic degradation of reactive yellow 17 in aqueous solution in the presence of cement. Int JPhotoenergy 5:45–49
34. Hua I, Hochemer RH, Hoffmann MR (1995) Sonochemical degradation of p-nitrophenol in aparallel-plate near-field acoustic processor. Environ Sci Technol 29:2790–2796
35. Kang JW, Hung HM, Lin A, Hoffmann MR (1999) Sonolytic destruction of methyl tert-butylether by ultrasonic irradiation: the role of O3, H2O2, frequency, and power supply. EnvironSci Technol 33:3199–3205
36. Kotronarou A, Mills G, Hoffmann MR (1992) Decomposition of parathion in aqueoussolution by ultrasonic irradiation. Environ Sci Technol 26:1460–1475
37. Hua I, Hoffmann MR (1996) Kinetics and mechanism of sonolytic degradation of CCl4:intermediates and byproducts. Environ Sci Technol 30:864–871
38. Hua I, Hoffmann MR (1997) Optimization of ultrasonic irradiation as an advanced oxidationtechnology. Environ Sci Technol 31:2237–2243
39. Lin JH, Ma YS (2000) Oxidation of 2-chlorophenol in water by ultrasound/Fenton method.J Environ Eng 126:130–137
40. Lin JH, Chang CN, Wu JR (1996) Decomposition of 2-chlorophenol in aqueous solution byultrasound/H2O2 process. Water Sci Technol 33:75–81
41. Kang JW, Hoffmann MR (1998) Kinetics and mechanism of the sonolytic destruction ofmethyl tert-butyl ether by ultrasonic irradiation in the presence of ozone. Environ Sci Technol32:3194–3199

11 Hybrid Sonochemical Treatments of Wastewater: Sonophotochemical. . . 333
42. Magureanu M, Piroi D, Mandache N, David V, Medvedovici A, Parvulescu V (2010)Degradation of pharmaceutical compound pentoxifylline in water by non-thermal plasmatreatment. Water Res 44:3445–3453
43. Perez MH, Penuela G, Maldonado MI, Malato O, Fernandez-Ibanez P, Oller I, Gernjak W,Malato S (2006) Degradation of pesticides in water using solar advanced oxidation processes.Appl Catal B Environ 64:272–281
44. Shankar MV, Nelieu S, Kerhoas L, Einhorn J (2008) Natural sunlight NO3-/NO2–inducedphoto-degradation of phenylurea herbicides in water. Chemosphere 71:1461–1468
45. Santos TCR, Rocha JC, Alonso RM, Martınez E, Ibanez C, Barcelo D (1998) Rapiddegradation of propanil in rice crop fields. Environ Sci Technol 32:3479–3484
46. Lee DJ, Senseman SA, Sciumbato AS, Jung SC, Krutz LJ (2003) The effect of titaniumdioxide alumina beads on the photocatalytic degradation of picloram in water. J Agric FoodChem 51:2659–2664
47. Tamimi M, Qourzal S, Barka N, Assabbane A, Ait-Ichou Y (2008) Methomyl degradationin aqueous solutions by Fenton’s reagent and the photo-Fenton system. Sep Purif Technol61:103–108
48. Chelme-Ayala P, El-Din MG, Smith DW (2010) Kinetics and mechanism of the degradationof two pesticides in aqueous solutions by ozonation. Chemosphere 78:557–562
49. Rajeswari R, Kanmani S (2009) A study on synergistic effect of photocatalytic ozonation forcarbaryl degradation. Desalination 242:277–285
50. Acero JL, Real FJ, Benitez FJ, Gonzalez A (2008) Oxidation of chlorfenvinphos in ultrapureand natural waters by ozonation and photochemical processes. Water Res 42:3198–3206
51. Bandala ER, Pelaez MA, Salgado MJ, Torres L (2008) Degradation of sodium dodecylsulphate in water using solar driven Fenton-like advanced oxidation processes. J Hazard Mater151:578–584
52. Lea J, Adesina AA (1998) The photo-oxidative degradation of sodium dodecyl sulphate inaerated aqueous TiO2 suspension. J Photochem Photobiol A: Chem 118:111–122
53. Rao PSC, Lee LS, Pinal R (1990) Cosolvency and sorption of hydrophobic organic chemicals.Environ Sci Technol 24:647–654
54. Lee LS, Rao PSC, Nikedi-Kizza P, Delfino JJ (1990) Influence of solvent and sorbentcharacteristics on distribution of pentachlorophenol in octanol-water and soil-water systems.Environ Sci Technol 24:654–661
55. Song H, Carraway ER (2008) Catalytic hydrodechlorination of chlorinated ethenes bynanoscale zero-valent iron. Appl Catal B: Environ 78:53–60
56. Lee CC, Doong RA (2008) Dechlorination of tetrachloroethylene in aqueous solutions usingmetal-modified zerovalent silicon. Environ Sci Technol 42:4752–4757
57. Satuf ML, Brandi RJ, Cassano AE, Alfano OM (2008) Photocatalytic degradation of 4-chorophenol: a kinetic study. Appl Catal B: Environ 82:37–49
58. Gonzalez-Garcıa J, Saez V, Tudela I, Dıez-Garcıa MI, Esclapez MD, Louisnard O (2010)Sonochemical treatment of water polluted by chlorinated organocompounds. A review. Water2:28–74
59. Isse AA, Gottardello S, Durante D, Gennaro A (2008) Dissociative electron transfer to organicchlorides: electrocatalysis at metal cathodes. Phys Chem Chem Phys 10:2409–2416
60. Kastanek F, Maleterova Y, Kastanek P (2007) Combination of advanced oxidation and/orreductive dehalogenation and biodegradation for the decontamination of waters contaminatedwith chlorinated organic compounds. Sep Sci Technol 42:1613–1625
61. Villanueva CM, Kogevinas M, Grimalt JO (2003) Haloacetic acids and trihalomethanes infinished drinking waters from heterogeneous sources. Water Res 37:953–958
62. McRae BM, Lapara TM, Hozalski RM (2004) Biodegradation of haloacetic acids by bacterialenrichment cultures. Chemosphere 55:915–925
63. Rodriguez MJ, Serodes J, Roy D (2007) Formation and fate of haloacetic acids (HAAs) withinthe water treatment plant. Water Res 41:4222–4232
64. Stock N, Peller J, Vinodgopal K, Kamat PV (2003) Combinative sonolysis and photocatalysisfor textile dye degradation. Environ Sci Technol 34:1747–1750

334 B. Neppolian et al.
65. Madhavan J, Grieser F, Ashokkumar M (2009) Kinetics of the sonophotocatalytic degradationof orange G in presence of Fe3C. Water Sci Technol 60:2195–2202
66. Yuan S, Yu L et al (2009) Highly ordered TiO2 nanotube array as recyclable catalyst for thesonophotocatalytic degradation of methylene blue. Catal Commun 10:1188–1191
67. Kaur S, Singh V (2007) Visible light induced sonophotocatalytic degradation of Reactive Reddye 198 using dye sensitized TiO2. Ultrason Sonochem 14:531–537
68. Berberidou C, Poulios I, Xekoukoulotakis NP, Mantzavinos D (2007) Sonolytic, photocat-alytic and sonophotocatalytic degradation of malachite green in aqueous solutions. Appl CatalB Environ 74:63–72
69. Wang S, Gong Q, Liang J (2009) Sonophotocatalytic degradation of methyl orange by carbonnanotube/TiO2 in aqueous solutions. Ultrason Sonochem 16:205–208
70. Gonzalez A, Martınez S (2008) Study of the sonophotocatalytic degradation of basic blue 9industrial textile dye over slurry titanium dioxide and influencing factors. Ultrason Sonochem15:1038–1042
71. Bejarano-Perez NJ, Suarez-Herrera MF (2007) Sonophotocatalytic degradation of congo redand methyl orange in the presence of TiO2 as a catalyst. Ultrason Sonochem 14:589–595
72. Madhavan J, Grieser F, Ashokkumar M (2010) Degradation of orange-G by advancedoxidation processes. Ultrason Sonochem 17:338–343
73. Wang H, Niu J, Long X, He Y (2008) Sonophotocatalytic degradation of methyl orange bynano-sized Ag/TiO2 particles in aqueous solutions. Ultrason Sonochem 15:386–392
74. Vinu R, Madras G (2009) Kinetics of sonophotocatalytic degradation of anionic dyes withnano-TiO2. Environ Sci Technol 43:473–479
75. Son Y, Cho E, Lim M, Khim J (2010) Effects of salt and pH on sonophotocatalytic degradationof azo dye reactive black 5. Jpn J Appl Phys 49:07HE05–3–07HE05–1
76. Madhavan J, Kumar P, Anandan S, Grieser F, Ashokkumar M (2010) Degradation of acid red88 by the combination of sonolysis and photocatalysis. Sep Purif Technol 74:336–341
77. Zhang K, Oh WC (2010) Kinetic study of the visible light-induced sonophotocatalyticdegradation of MB solution in the presence of Fe/TiO2-MWCNT catalyst. Bull Korean ChemSoc 31:1589–1595
78. Madhavan J, Grieser F, Ashokkumar M (2010) Combined advanced oxidation processesfor the synergistic degradation of ibuprofen in aqueous environments. J Hazard Mater 178:202–208
79. Madhavan J, Kumar P, Anandan S, Zhou M, Grieser F, Ashokkumar M (2010) Ultrasoundassisted photocatalytic degradation of diclofenac in an aqueous environment. Chemosphere80:747–752
80. Bahena C, Martınez S, Guzman D et al (2008) Sonophotocatalytic degradation of alazine andgesaprimcommercial herbicides in TiO2 slurry. Chemosphere 71:982–989
81. Madhavan J, Grieser F, Ashokkumar M (2010) Degradation of formetanate hydrochloride bycombined advanced oxidation processes. Sep Purif Technol 73:409–414
82. Madhavan J, Kumar P, Anandan S, Grieser F, Ashokkumar M (2010) Sonophotocatalyticdegradation of monocrotophos using TiO2 and Fe3C. J Hazard Mater 177:944–949
83. Neppolian B, Bruno A, Bianchi CL, Ashokkumar M (2012) Graphene oxide based TiO2 pho-tocatalyst: synthesis, characterization and catalytic efficiency. Ultrason Sonochem 19:9–15
84. Anandan S, Ashokkumar M (2009) Sonochemical synthesis of Au–TiO2 nanoparticles forthe sonophotocatalytic degradation of organic pollutants in aqueous environment. UltrasonSonochem 16:316–320
85. Lorimer JP, Mason TJ, Plattes M, Phull SS (2000) Dye effluent decolourisation usingultrasonically assisted electro-oxidation. Ultrason Sonochem 7:237–242
86. Lorimer JP, Mason TJ, Plattes M, Phull SS, Walton DJ (2001) Degradation of dye effluent.Pure Appl Chem 73:1957–1968
87. Foord JS, Holt KB, Compton RG, Marken F, Kim DH (2003) Mechanistic aspects of thesonoelectrochemical degradation of the reactive dye Procion Blue at boron-doped diamondelectrodes. Diamond Relat Mater 10:662–666
11 Hybrid Sonochemical Treatments of Wastewater: Sonophotochemical. . . 335
88. Rivera M, Pazos M, Sanroman MA (2009) Improvement of dye electrochemical treatment bycombination with ultrasound technique. J Chem Technol Biotechnol 84:1118–1124
89. Ai Z, Li J, Zhang L, Lee S (2010) Rapid decolorization of azo dyes in aqueous solution by anultrasound-assisted electrocatalytic oxidation process. Ultrason Sonochem 17:370–375
90. Siddique M, Farooq R, Khan ZM, Khan Z, Shaukat SF (2011) Enhanced decompositionof reactive blue 19 dye in ultrasound assisted electrochemical reactor. Ultrason Sonochem18:190–196
91. Wang X, Jia J, Wang Y (2010) Electrochemical degradation of reactive dye in the presence ofwater jet cavitation. Ultrason Sonochem 17:515–520
92. He P, Wang L, Xue J, Cao Z (2010) Electrolytic treatment of methyl orange in aqueoussolution using three-dimensional electrode reactor coupling ultrasonics. Environ Technol31:417–422
93. Trabelsi F, Ait-lyazidi H, Ratsimba B, Wilhelm AM, Delmas H, Fabre PL, Berlan J (1996)Oxidation of phenol in wastewater by sonoelectrochemistry. Chem Eng Sci 51:1857–1865
94. Zhao G, Shen S, Li M, Wu M, Cao T, Li D (2008) The mechanism and kinetics of ultrasound-enhanced electrochemical oxidation of phenol on boron-doped diamond and Pt electrodes.Chemosphere 73:1407–1413
95. Lima Leite RH, Cognet P, Wilhelm AM, Delmas H (2002) Anodic oxidation of 2,4-dihydroxybenzoic acid for wastewater treatment: study of ultrasound activation. Chem EngSci 57:767–778
96. Marken F, Kumbhat S, Sanders GHW, Compton RG (1996) Voltammetry in the presence ofultrasound: surface and solution processes in the sonovoltammetric reduction of nitrobenzeneat glassy carbon and gold electrodes. J Electroanal Chem 414:95–105
97. Abramov VO, Abramov OV, Gekhman AE, Kuznetsov VM, Price GJ (2006) Ultrasonicintensification of ozone and electrochemical destruction of 1,3-dinitrobenzene and 2,4-dinitrotoluene. Ultrason Sonochem 13:303–307
98. Padilla KR, Blanco LM, Orozco S, Jauregui F (2004) Degradacion oxidativa del 2,4-diclorofenol por vıa sonoelectroquımica. Ciencia UANL VII:51–59
99. Esclapez MD, Saez V, Milan-Yanez D, Tudela I, Louisnard O, Gonzalez-Garcıa J (2010)Sonoelectrochemical treatment of water polluted with trichloroacetic acid: from sonovoltam-metry to pre-pilot plant scale. Ultrason Sonochem 17:1010–1020
100. Esclapez MD, Dıez-Garcıa MI, Saez V, Tudela I, Perez JM, Gonzalez-Garcıa J, Bonete P(2011) Spectroelectrochemical study of trichloroacetic acid reduction at copper electrodes inan aqueous sodium sulfate medium. Electrochim Acta 56:8138–8146
101. Saez V, Esclapez MD, Bonete P, Gonzalez-Garcıa J, Perez JM (2008) Spectroelectrochemicalstudy of perchloroethylene reduction at copper electrodes in neutral aqueous medium.Electrochim Acta 53:3210–3217
102. Saez V, Esclapez MD, Frıas-Ferrer A, Bonete P, Gonzalez-Garcıa J (2008) Electrochemicalreduction of perchloroethylene in aqueous media: influence of the electrode material. J NewMater Electrochem Syst 11:287–295
103. Saez V, Esclapez MD, Frıas-Ferrer A, Bonete P, Gonzalez-Garcıa J (2009) Electrochemicaldegradation of perchloroethylene in aqueous media: an approach to different strategies. WaterRes 43:2169–2178
104. Saez V, Esclapez MD, Tudela I, Bonete P, Gonzalez-Garcıa J (2010) Electrochemical degra-dation of perchloroethylene in aqueous media: influence of the electrochemical operationalvariables in the viability of the process. Ind Eng Chem Res 49:4123–4131
105. Saez V, Esclapez MD, Tudela I, Bonete P, Louisnard O, Gonzalez-Garcıa J (2010) 20 kHzsonoelectrochemical degradation of perchloroethylene in sodium sulfate aqueous media:influence of the operational variables in batch mode. J Hazard Mater 183:648–654
106. Saez V, Esclapez MD, Tudela I, Bonete P, Louisnard O, Gonzalez-Garcıa J (2011) Sonoelec-trochemical degradation of perchloroethylene in water: enhancement of the process by theabsence of background electrolyte. Chem Eng J 168:649–655
107. Saez V, Esclapez MD, Bonete P, Walton DJ, Rehorek A, Louisnard O, Gonzalez-Garcıa J(2011) Sonochemical degradation of perchloroethylene: the influence of ultrasonic variables,and the identification of products. Ultrason Sonochem 18:104–113

336 B. Neppolian et al.
108. Colussi AJ, Hung HM, Hoffmann MR (1999) Sonochemical degradation rates of volatilesolutes. J Phys Chem A 103:2696–2699
109. Bhatnagar A, Cheung HM (1994) Sonochemical destruction of chlorinated C1 and C2 volatileorganic compounds in dilute aqueous solution. Environ Sci Technol 28:1481–1486
110. Inazu K, Nagata Y, Maeda Y (1993) Decomposition of chlorinated hydrocarbons in aqueoussolutions by ultrasonic irradiation. Chem Lett 22:57–60
111. Clark CJ II, Annable MD, Rao PS (2000) Evaluation of sonochemical destruction of PCE insitu flushing waste fluids. J Environ Eng 126:1033–1038
112. Kruger O, Schulze ThL, Peters D (1999) Sonochemical treatment of natural ground water atdifferent high frequencies: preliminary results. Ultrason Sonochem 6:123–128
113. Zhang Z, Yuan Y, Liang L, Fang Y, Cheng Y, Ding H, Shi G, Jin L (2008) Sonophotoelectro-catalytic degradation of azo dye on TiO2 nanotube electrode. Ultrason Sonochem 15:370–375
114. Lipczynska-Kochany E (1991) Degradation of aqueous nitrophenols and nitrobenzene bymeans of the Fenton reaction. Chemosphere 22:529–536
115. Brillas E, Sires I, Oturan MA (2009) Electro-Fenton process and related electrochemicaltechnologies based on Fenton’s reaction chemistry. Chem Rev 109:6570–6631
116. Abdelsalam ME, Birkin PR (2002) A study investigating the sonoelectrochemical degradationof an organic compound employing Fenton’s reagent. Phys Chem Chem Phys 4:5340–5345
117. Li H, Lei H, Yu Q, Li Z, Feng X, Yang B (2010) Effect of low frequency ultrasonic irradiationon the sonoelectro-Fenton degradation of cationic red X-GRL. Chem Eng J 160:417–422
118. Yasman Y, Bulatov V, Gridin VV, Agur S, Galil N, Armon R, Schechter I (2004) A new sono-electrochemical method for enhanced detoxification of hydrophilic chloroorganic pollutantsin water. Ultrason Sonochem 11:365–372
119. Oturan MA, Sires I, Oturan N, Perocheau S, Laborde JL, Trevin S (2008) Sonoelectro-Fenton process: a novel hybrid technique for the destruction of organic pollutants in water.J Electroanal Chem 624:329–332
120. Gonzalez-Garcıa J, Banks CE, Sljukic B, Compton RG (2007) Electrochemical synthesis ofhydrogen peroxide assisted by ultrasound. Ultrason Sonochem 13:405–412
Chapter 12Nature Is the Answer: Water and WastewaterTreatment by New Natural-Based Agents
Jesus Sanchez-Martın and Jesus Beltran-Heredia
12.1 Introduction
It is well known that water is the most relevant and affecting factor in lifedevelopment [1]. The immediate need of water in adequate conditions (quality andquantity) is a crucial factor for allowing a dignified life, and it is more than obviousthat no economical development is possible without water [2]. Drinkable waterscarcity is directly linked to high morbi-mortality levels and to low economicaldevelopment; therefore, several vicious and virtuous circles are established fromand to water situation (Fig. 12.1).
As can be seen, water is not only one of the first necessities in the Maslow’spyramid [3], but also the promoting agent in the economic and social development.Bad water makes this growth difficult (even impossible). These links are nottheoretical; the real situation confirms the importance of water in the globalscenario. Figure 12.2 shows three world maps that were modified according to aspecific study variable.
The first two are very similar while they are almost opposed to the third one.Poverty is directly proportional to water scarcity (first and second world maps) andinversely to industrial development (the third map).
Consequently, water must be considered a valuable and scarce good, not onlyregarding environmental concerns, but above all bearing in mind the impact it hason the human wellness. If it is adequately managed, treated, and cared for, water canbe an equity factor in the fight against poverty, since an appropriate and sustainabledevelopment model that allows dignified life conditions to humankind is needed.
J. Sanchez-Martın (�) • J. Beltran-HerediaDepartment of Chemical Engineering and Physical Chemistry, University of Extremadura,Badajoz, Spaine-mail: [email protected]; [email protected]
S.K. Sharma and R. Sanghi (eds.), Advances in Water Treatment and PollutionPrevention, DOI 10.1007/978-94-007-4204-8 12,© Springer ScienceCBusiness Media Dordrecht 2012
337

338 J. Sanchez-Martın and J. Beltran-Heredia
Fig. 12.1 Relationship between water, poverty and human development
In this sense, research is needed with the clear focus on people’s development,according to the current developing model [4]; i.e., the promotion of people’schances in agreement with sustainability, governability, democracy, and participa-tion criteria. This kind of investigation is supported by several international actors[5] and must also be implemented inside the university context.
The current chapter is within this general scenario. Natural resources areevidently widespread, cheap and easy-to-handle materials. Their possibilities arealmost unlimited and many of them are still unknown. Our researching groupshave been working on natural-based solutions to water pollution problems, so thetechnical solutions we are presenting are also easy to implement in developing areas.
This chapter will explore the possibilities of two main groups of natural resourcesin water and wastewater treatment: Moringa oleifera seed extract as a coagulant andtannin-derived products. The latter ones can be used under the form of cationiccoagulants (for the removal of anionic colloidal pollutants) or anionic tannin rigidresins (tannin gels) for the removal of cationic contaminants.
12.2 Present Pollution Problem: Refractory Contaminants
The water scarcity is a global situation that reaches unacceptable levels: 40% ofthe total earth population lack proper sanitation infrastructures and problems withwater quality are the fifth cause of death (above AIDS, tuberculosis, or malaria).Nowadays, more than one in six does not have access to safe freshwater [6]. Thisfact is even more acute if we take into account that the shortage of safe waterhas a concomitant effect with living without basic sanitation, which is the case

12 Nature Is the Answer: Water and Wastewater Treatment. . . 339
Fig. 12.2 Three world maps. The areas are proportionally deformed to (a) Human poverty index,(b) Safe water scarcity and (c) Industrial water consumption (Source: www.worldmapper.org)
of 2.5 billion people [7]. In addition, emerging economies like India or China arecurrently facing a pollution problem with special contaminants that are not easy toremove from water effluents. These are called refractory contaminants and the mostimportant groups are the dyes, surfactants, and heavy metals.

340 J. Sanchez-Martın and J. Beltran-Heredia
12.2.1 Dyes
The removal of dye effluents is still a challenge inside many industrial wastewatertreatments. Pigments and dyes are extensively used for several applications, suchas textiles, printing, pharmaceuticals, and a large variety of other products. Thedischarge of these chemical pollutants is a dangerous and noxious practice that mayaffect the aquatic systems [8, 9] and, therefore, may get into the alimentary chain,with the corresponding risks due to their well-known toxic and mutagenic activityto living organisms [10, 11].
Dyes may be classified into many chemical species. The most common clas-sification of these products pertains to their industrial usage [12] (acid, basic,direct, reactive, disperse dyes). Other criterion may be according to their chemicalcomposition: azo, anthraquinonic, triphenylmethane, indigoid, or thiazinic dyes canalso be considered.
Three main dyes have been selected to work on in this review.
• Alizarin Violet 3R is an anthraquinonic dye. It is a synthetic dye which ischaracterized by a high chemical/biological oxygen demand and intense color.These aspects make industrial effluents of this dye highly toxic and extremelyinjurious to both aquatic and landform lives. The difficulty to degrade or removethis dye has been thoroughly reported previously [13] and it is mainly caused bythe aromatic rings and the two sulfonate groups that make this dye a persistentand carcinogenic agent.
• Indigo Carmine is an indigoid dye. Its structure includes two aromatic ringswith a double link inside them and two sulfonate negative-charged groups [14].This gives it an anionic and aromatic character that allows cationic characterof different coagulant agents to link the dye molecules and provoke theirdestabilization and settle in a coagulation and flocculation process.
• Palatine Fast Black WAN is an azo dye. It is an extremely long molecule whosestructure includes 12 aromatic rings and 3 sulfonate groups, apart from manyother functional groups (Fig. 12.3). The presence of chromium atoms associatedwith the organic chain makes it especially dangerous, involving its mutagenicaction [15].
The chemical structures of these dyes are presented in Fig. 12.3.
12.2.2 Surfactants
Surfactants have become a very important group of compounds in modern life.They are present in a large variety of usual and normal products, like soaps,detergents, pharmaceuticals, personal care products, etc.; they are also used inthe chemical industry, “high-tech” devices, paints, and leather [16]. As can beappreciated, surfactants have achieved a main position in human activity in manyfields. Analyzing the last statistical data, more than 12 M tons per year are used [17],so surfactants can be considered as a first important chemical group. Figure 12.4presents some of the most important anionic surfactants.

12 Nature Is the Answer: Water and Wastewater Treatment. . . 341
Fig. 12.3 Chemicalstructures of different dyesconsidered in this review. (1)Alizarin Violet 3R; (2) IndigoCarmine; (3) Palatine FastBlack WAN
oo
o
o
oo
o
o
o o OHHO
HO
HN+
o
o−
o−
o−
o− o−
o−
o−
o−
o−
o
o
o
o
o
o
o
o
o o
o
oo
o
o
3.5
oo
o
o
o
s
s
s
s s
s
s
s
s
H3C
H3C
H3C
H3C
CH3
CH3
CH3
CH3
CH3CH3
Na+
Na+
Na+ Na+
Na+
Na+
Na+
Na+
Na+
1
3
5
7 8
6
4
2
Fig. 12.4 Chemical structures of different anionic surfactants. (1) Sodium dodecyl benzenesulfonate (SDBS); (2) Sodium dodecyl diphenyl ether disulfonate (SDDED), (3) POE (3.5)Sodium lauryl ether sulfate (SLES); (4) Sodium lauryl sulfoacetate (SLSA); (5) Sodium dioctylsulfosuccinate (SDSS); (6) Sodium triethanolamine lauryl sulfate (TEA-LS); (7) POE sodiumnonylphenol sulfate (SNS) and (8) Sodium lauryl sulfate (SLS)

342 J. Sanchez-Martın and J. Beltran-Heredia
Surfactants dumping into the environment represent a harmful and noxiouspractice. They may be useful and needed compounds, but they are also considereddangerous and undesirable substances because of their impact on water animaland vegetal life. The main routes by which surfactants can alter environmentalequilibrium are contamination of groundwater and lakes [18], association withpharmaceuticals (thereby, considerably enhancing their contaminant potential),biopersistence and toxicity for animals including humans, etc. [19, 20].
Effluents with high content in surfactants usually presents high COD levels (upto 50 g L�1) [21], which is a cause of problems in normal water treatment plants, sonew and cheaper methods for treating these kinds of wastewaters are still needed.
Nowadays, surfactants can be removed by several mechanisms; most of themimply adsorption on activated carbon [19, 22], chemical oxidation [23] or electro-chemical removal [24]. However, new removal methods should be researched onbecause the impact of surfactants and tensioactives is quite high.
Due to these reasons, removing surfactants from water flows has become apriority for a large number of researchers. As it is known, there are several types ofsurfactants depending on its ionic character: anionic, cationic, amphoteric, nonionic,etc. Cationic surfactants enter aquatic ecosystems together with polluted watersbecause they are widely used in many industries, including petroleum, oil refining,petrochemical, and gas industries. They are also used in pest control in aquaculturefor combating pathogenic organisms in fish [25].
12.2.3 Heavy Metals
Finally, the pollution with heavy metals is well known. Effluents from industrialfacilities, mainly linked to minery, are highly charged with Cu2C, Hg2C, Pb2C,Zn2C, Ni2C, or Cd2C. These wastewaters represent cumulative pollution in the foodchain [26], so the elimination of such harmful compounds has been the subject ofresearch by scientists for a long time and is achieved by different ways: chemicalprecipitation [27] coagulation and flocculation [28], or nanofiltration [29], amongothers.
12.3 Natural Products: A Feasible Chanceof Becoming Clean
One of the possible paths of minimizing the multiple concerns that have recentlyarisen on water and refractory pollutants is the implementation of new treat-ments based on natural products. Both adsorption and coagulation are well-knownprocesses for eliminating these kinds of contaminants; yet, new agents must bedeveloped.

12 Nature Is the Answer: Water and Wastewater Treatment. . . 343
Today there is a global challenge regarding water management: Water resourcesmay be optimized in order to guarantee an adequate availability for the largemajority of the people. This is the first and main motivation to continue researchon these kinds of resources.
12.3.1 Appropriate Technology and the Needsof the Present World
Undoubtedly, the water shortage hits in an unequal way, depending on the devel-oping situation of countries. Israel can produce shrimp inside the desert by usingadvanced techniques of water extraction from beneath the ground [30], while almost40% of total Nicaraguan population has no home access to tap water [31]. Thatfact reveals that water subject is not linked to global technological advances, but toparticular and adequate systems of solving specific situations [32].
Among the most influencing parameters in this situation is the fact that thepollution sources are widespread and often nonlocalized. Contaminants such assurfactants, dyes, or heavy metals get into the alimentary chain and appear almosteverywhere, and usually there is not a specific procedure for their removal, mostlyin places where water treatment is almost a luxuriant process. Because of this, itis necessary for the development of new materials and methods to fit into the largevariety of economical situations, both in the First and the so-called Third World.Natural products are perhaps one of the most interesting options of making watertreatment a universal chance. Becoming clean is then a cheaper and affordablepossibility.
Technology is one of the mechanisms human beings can apply to fight againstpoverty [33], but as it is a cultural construct, it is not free from social implications[34]. The concept of appropriate technology (Fig. 12.5) arose in the mid-1970s andincluded some aspects that may be especially cared for in order to guarantee socialand environmental feasibility of a technical proposal. The target is to develop a newtechnological paradigm suitable mostly in developing countries (but not only) thatcan be executed on the following principles [35]:
• Environmental-friendly (sustainability): It does not endanger subsequent gener-ations’ resources
• Cultural suitability: The solutions to given problems does not interfere with socialmanners or modals
• Technological transfer, not external dependency of mechanisms, apparatuses, orequipment
These statements are summarized in one: Technology must match both the userand the need in complexity and scale [34]. Relatively, new research concerns arerecently open in order to provide enough first-line knowledge in this sense [36] forapplying new discoveries to the Third World.

344 J. Sanchez-Martın and J. Beltran-Heredia
Appropriatetechnologies
Cleantechnologies
Unsustainabletechnologies
(cultures, traditions,organizations......)
Non healthyand nonappropriatetechnologies
Sustainabledevelopment
Possibletechnological
solutions
Endogen development
Fig. 12.5 Appropriatetechnologies inside thegeneral scenario of possibletechnologies (Source: Ownelaboration from [113])
Bearing in mind all the above, this chapter will deal with two main naturalsources: Moringa oleifera and tannin derivatives. Both seem to present ratherinteresting properties in order to become important agent of water treatment inremoving contaminants according to appropriate technology principles.
12.3.2 Moringa oleifera
Moringa oleifera is a tropical tree that comes from the sub-Himalayan valleys. It isa multipurpose tree and is generally known in the developing world as a vegetable, amedicine plant and a source of vegetal oil. Its multiple properties have been knownfor a long time [37] and several authors have referred to the importance of someMoringa oleifera aspects: human [38] and animal nutrition [39, 40], pharmacology[41, 42], cosmetics [43], etc.
The leaves and young seeds of Moringa oleifera are rich in calcium, iron, andvitamin C, which serve as nutritious source for communities. The fruits are called“pods” and roots of the tree are used as vegetables. The fruits range usually from20 to 30 cm long. Each fruit contains more or less 20 seeds. Seeds are globular,weighing on an average between 0.3 and 0.4 g, 0.6–1 cm long, and 0.7–1.2 cm wide(Fig. 12.6).
Moringa oleifera is a widely spread, readily available, and easy to store product,especially in the developing countries. It can be a social-change factor, as it allowswater treatment without external dependence [32].
According to Goh [44], the cultivation cost for producing 1 kg of Moringaoleifera is approximately US$2. Although the cost of Moringa oleifera seems moreexpensive than alum, it is more beneficiary to communities in terms of health andeconomy. Community could gain income from the sale of the seeds to companies orinstitutions processing them to produce coagulant or oil [45].

12 Nature Is the Answer: Water and Wastewater Treatment. . . 345
Fig. 12.6 Seeds of Moringaoleifera
Moringa oleifera has a big advantage considering its high added value, i.e.,expensive oil is obtained from it [46], which can be used for many scopes. AsBhuptawat et al. [47] pointed out, the simple aqueous extract that can be obtainedfrom the press cake residue remaining after oil extraction may be used for waste anddrinking water treatment, being a real cheap and easy way of getting profit from thismain usage of Moringa oleifera. The interest on Moringa oleifera in this aspect hasbeen pointed by institutions such as Food and Agricultural Organization (FAO) [48].
This chapter is focused on the removal of surfactants by means of naturalproducts. Moringa oleifera seed extract is one of these agents, and it acts as acoagulant. Particularly, this coagulant presents some characteristics that make itaffordable and technologically friendly: It is obtained directly from the seeds witha little help of reasonably low dosages of sodium chloride. The complete extractionprocess involves the following steps. First, the seeds are reduced into powder bya domestic mill. A 1 M sodium chloride solution is prepared and 5 g of powderis added to 100 mL of it. The sodium chloride solution with powder is stirredfor 30 min at room temperature (around 25ıC). No pH modification is needed, asnatural pH 7 is achieved. Then, the extract is filtered twice, once through commercialfilter paper on Buchner funnel and again through a fine filtering Millipore system(0.45 �m glass fiber). The result is a clear, milk-like liquid. This raw materialpresents the physicochemical characteristics showed in Table 12.1.
12.3.3 Tannin Derivatives
The term tannin covers many families of chemical compounds. Traditionally, theyhave been used for tanning animal skins, hence their name, but one also finds severalof them used as natural-derived coagulants and adsorbents. Their natural origin is as

346 J. Sanchez-Martın and J. Beltran-Heredia
Table 12.1 Chemicalcharacteristics of Moringaoleifera seed extract
Parameter Value
Dry residue (sodium chloride excluded) 3.24 g L�1
Ammonium 0.06 g L�1 (N)Nitrate 0.55 g L�1 (N)Nitrite 0 g L�1 (N)KMnO4 oxidability 1.08 g L�1 (O2)Phosphate 0.05 g L�1 (P)Total phosphorus 0.07 g L�1 (P)
Fig. 12.7 Chemical structureof a standard tannin(Reprinted from Ref. [51].With kind permission of© The American ChemicalSociety (2009))
secondary metabolites of plants [49], occurring in the bark, fruit, leaves, etc. WhileAcacia and Schinopsis bark constitute the principal source of tannins for the leatherindustry, the bark of other nontropical trees such as Quercus ilex, Quercus suber,Quercus robur, Castanea, and Pinus can also be tannin-rich.
Tannins are mostly water-soluble polyphenolic compounds of molecular weightranging between 500 and some thousands of Daltons [50]. The chemical complexityof tannins and the fact that they are usually taken from natural matrix without a verythorough purification make it a very difficult task to understand their structure. Someapproaches are found in literature review and one of them is shown in Fig. 12.7.A full study about tannins, its chemical structure, and properties can be found inPizzi [52].
Tannin structure involves multiple aromatic rings that provide a useful matrixin which active centers can be introduced by means of an adequate polymerizationprocess [52], either for coagulant or adsorbent production. Two classes of chemicalcompounds of mainly phenolic nature are included as vegetable tannins: condensedand hydrolyzable tannins [53]. Inside the first group, one can present tanninsfrom Acacia mearnsii de Wild, Schinopsis balansae, or Pinus pinaster. Regardingthe hydrolyzable tannins, this group includes barks from Castanea sativa orCaesalpinia spinosa.

12 Nature Is the Answer: Water and Wastewater Treatment. . . 347
Cationization of tannins is a chemical procedure that confers cationic characterto the organic tannin matrix, so the main characteristics (such as solubility, stabilityat different pH levels or heavy metals quelating activity) are retained while othersare added. These new abilities that appear have to do with the coagulating potential,as positive charged agents may destabilize anionic colloids if mixed in aqueoussolution.
Destabilization and subsequent settlement provoke the removal of a wide varietyof anionic substances such as dyes, surfactants, or organic matter. The chemicalprocedure for making tannins become cationic is known to follow a Mannichreaction path, and different variations have been reported under several patents[54–57]. Namely, tannins undergo Mannich aminomethylation by reaction with analdehyde and an amine [58]. The resulting tannin Mannich polymer possesses ahigher molecular weight due to formaldehyde and Mannich base cross-linking, andalso possesses ampholytic character due to the presence of both cationic aminesand anionic phenols on the polymer. Briefly, Mannich reaction is described as theintroduction of a quaternary nitrogen into the tannin complex structure [59].
Two main ways of obtaining Mannich bases are reported in scientific literature—one involving the use of ammonium chloride and another involving other types ofnitrogen compounds, such as mono- or diethanolamine. The reaction is completedin both cases by the controlled addition of formaldehyde in a lower proportionthan in gelation. Higher doses of formaldehyde would lead to tanning gelation and,therefore, makes the product insoluble [60].
Although these kinds of coagulants are quite well known, very few examplesof investigations have been found about them. Regarding the main scope of watertreatment, according to these prescriptions, they found several previous papers thatpointed out the use of tannins as a coagulant aid [61] or other cationic compounds[62]. We point out the use of tannin-based coagulants that has been researched byGraham et al. [63, 64] as well as in our own previous papers.
Commercial tannin-based coagulants are available mainly as a way of gettingprofit from tannery wastes. These are the situations for Acacia mearnsii de Wild(black wattle), which is the feedstock for TANFLOC and for ACQUAPOL, andSchinopsis balansae (quebracho colorado), which gives SILVAFLOC. Althoughthe production processes of these coagulants are under patent law, following therules of Mannich reactions we can surely make an approach of their synthesis, e.g.,SILVAFLOC may be the reaction product of three reagents: monoethanolamine(MEA), formaldehyde, and the tannin extract mixture. First, MEA and formalde-hyde may react in the way described in Eq. 12.1:
H2N � CH2 � CH2OH C HCHO ! CH2 D N � CH2 � CH2OH C H2O (12.1)
which yields the reactive species called imine. This may react with aqueous tanninextract mixture to form SILVAFLOC, whose chemical formula may respond toEq. 12.2:
tannin � .CH2 � NH � CH2 � CH2OH/n (12.2)

348 J. Sanchez-Martın and J. Beltran-Heredia
In the case of TANFLOC, it is said to be a vegetal water-extract tannin, mainlyconstituted of flavonoid structures with an average molecular weight of 1.7 kDa. It ispresented as powder. More groups as hydrocolloids gums and other soluble salts areincluded in TANFLOC structure. The industrial production of TANFLOC involvesthe reaction between formalin, ammonium chloride and commercial hydrochloricacid. The mixture is stirred and heated and tannin extract is added. The reactioncontinues for several hours and then a viscous mixture with 40% of solids content isachieved. Allowing it to evaporate, TANFLOC in its powder form is produced [65].
On the other hand, tannin gelation is a chemical procedure that immobilizestannins in an insoluble matrix [60] so that their properties of interest, e.g., metalchelation, are then available in an efficient adsorbent agent. In addition, thematerial resulting from their gelation (sometimes called tannin rigid resin) presentsinteresting properties in terms of resistance, nonflammability and mechanicalundeformability [66, 67].
Gelation of tannins has been widely described in the scientific literature andin patents. The experimental conditions for gelation may involve the use offormaldehyde or other aldehyde in a basic or acid medium. One may find examplesof basic gelation in the scientific literature [68–70] and in patents such as US patent5,158,711 and acid gelation is described by other workers [71, 72].
The chemical basis of the tannin gelification are widely reported [52]. Formalde-hyde and other aldehydes react with tannins to induce polymerization throughmethylene bridge linkages at reactive positions on the tannin flavonoid molecules.The reactive positions of the rings depend on the type of tannin; but mainly involvethe upper terminal flavonoid units. For example, the A-rings (Fig. 12.7) of Acaciamearnsii and Quebracho tannins show reactivity toward formaldehyde compared tothat of resorcinol.
However, aspects such as size and shape make the tannin molecules lose mobilityor flexibility at relatively low level of condensation, so that the available reactivesites are too far apart for further methylene bridge formation. The result may beincomplete polymerization and, therefore, poor material properties. There is a needto search for constitutional differences between several tannin extracts in order topredict the gelation product. For example, among condensed tannins from mimosabark (Acacia mearnsii), the main polyphenolic pattern is represented by flavonoidanalogues based on resorcinol A-rings and pyrogallol B-rings. This is similar inthe case of Quebracho bark extract, but no phloroglucinol A-ring pattern existsin the first or in the second type. The A-rings of pine tannin possess only thephloroglucinol type of structure, much more reactive toward formaldehyde thanresorcinol-type counterpart. Elemental probable reaction mechanism in two stepsbetween generic condensed tannin and formaldehyde is shown in Fig. 12.8 [73].
Therefore, it is very difficult to state the exact and real gelation mechanismfor each type of tannin extract. Presumably, it depends on the real structure andcomposition of each one, which not only has to do with the tannin source (the vegetalbark), but also with the extraction process. In addition, researchers are not interestedin working with pure tannin extracts but with natural wood materials, the chemical

12 Nature Is the Answer: Water and Wastewater Treatment. . . 349
Fig. 12.8 Probable generic gelation mechanism between condensed tannin and formaldehyde.(1) First step: hydroxy-methylation; (2a) Second step: Methylene bridge immovilization; (2b)Methylene ether bridge immovilization (Reprinted from Ref. [73]. With kind permission of© Elsevier (2011))
characterization of gelified tannins is rather complex. However, researchers whohave worked with these types of adsorbents performed several characterizationprocedures. This is the case of our own work [74], where a FTIR analysis wasperformed, or the work of Yurtsever and Sengil [75] where SEM was presented.
12.4 Natural Coagulants
When talking about natural coagulants, one must present on the one hand the seedextract from Moringa oleifera; and on the other hand, tannin-derived coagulantscan be commercial ones (SILVAFLOC, ACQUAPOL or TANFLOC mainly) or lab-synthesized ones (from Acacia mearnsii de Wild and diethanolamine, ammoniumchloride or glycidyltrimethyl ammonium chloride).
The first product is the seed extract from Moringa oleifera. It can be easilyobtained by a well-known procedure. Moringa oleifera has been found to present a

350 J. Sanchez-Martın and J. Beltran-Heredia
Fig. 12.9 Preliminary screening for dyes-Moringa oleifera seed extract interaction
protein with coagulating properties [76, 77]. The usual way of extracting it from thewhole kernel has been thoroughly described for the first time by Ndabigengesereet al. [78] and has been later improved with different modifications. The mostimportant of these changes are referred by Okuda et al. [79, 80] and it includesaddition of salt (sodium or potassium chloride) to the extraction solution. Followingthis last method, Moringa oleifera seed extract is usually obtained in this way:A certain amount of dry shelled or nonshelled seeds are crushed in a domestic miller.Then, the resulting mass is added to a sodium chloride solution and the active proteinprinciple is extracted for a given period with magnetic stirring. A clear, milk-likeliquid is then separated by filtration.
This seed extract is usually carried out in the following conditions: 100 mL ofdistilled water, pH 7, 20ıC, and 5 g of crushed shelled seed. In addition, a sodiumchloride concentration of 0.1 M can enhance the extraction process.
This protein extract has been proved to remove dyes. Moringa oleifera seedextract has been found effective in removing at least four types of anionic dyes:triphenylmethane, anthraquinonic, indigoid, and azo dyes.
The ability of Moringa oleifera in removing all of these kinds of dyes has beenthoroughly tested in our previous cited works. Figure 12.9 presents a preliminaryscreening with a fixed dose of Moringa oleifera seed extract (around 150 mg L�1)and a fixed initial concentration of each dye (100 mg L�1). As can be appreciated,Moringa oleifera presents a very high capability of removing azo dyes. For the threestudied azo dyes (Chicago Sky Blue 6B, Acid Red 88 and Palatine Fast Black WAN),the percentage of dye removal was higher than 98.8%.

12 Nature Is the Answer: Water and Wastewater Treatment. . . 351
Fig. 12.10 Chicago Sky Blue 6B reduction by coagulation with Moringa oleifera (Reprinted fromRef. [81]. With kind permission of © John Wiley and Sons (2008))
Consequently, we have studied the removal of azo dyes thoroughly [81]. The in-teraction between Chicago Sky Blue 6B and the coagulation principle was evidencedand the suitability of Moringa oleifera for removing color from dye solutions wasconfirmed. Figure 12.10 shows the rapid depletion of dye concentration as coagulantdosage is increased.
Anthraquinonic dyes (such as Alizarin Violet 3R) also were demonstrated tobe easily removed by Moringa oleifera [82], so were the indigoid dyes [83].Figure 12.11 depicts the fast elimination of almost 100% of dye (initial dyeconcentration [IDC] equal to 100 mg L�1) with an average coagulant dosage equalto 150 mg L�1. Coagulant–dye interaction may be predicted by a theoretical model;in this case, by Langmuir hypothesis.
A significant difference in dye removal is shown in the case of Eriochromecya-nine R. Although almost 40% of dye removal is achieved, this lack of effectivenessmay be due to nonlinear structure that may cause steric difficulties, and the coagu-lation process may prefer linear molecules rather than other space distributions.
In the case of Methylene Blue, no removal was achieved by Moringa oleifera seedextract. Its cationic nature implies no cationic polyelectrolytes, including proteinicflocculants such as Moringa, which may cause its destabilization.
Kinetics of dye removal has been shown to be very fast. In the first 10 min, thecoagulation and adsorption process are quite complete, so up to 95% of total dyeremoval is achieved in this first stage.
Moringa oleifera has been confirmed as a fully working coagulant agent evenin a wide range of pH and IDC, although the different nature of several dyescan affect in the efficiency of the process [18]. Figure 12.12 reflects this fact within

352 J. Sanchez-Martın and J. Beltran-Heredia
Fig. 12.11 Alizarin Violet 3R reduction by coagulation with Moringa oleifera. On the uppercorner: Theoretical modelization of coagulant extract-dye interaction
Fig. 12.12 Moringa oleifera seed extract coagulation in removing three types of dyes. Analysisthrough response surface methodology (Reprinted from Ref. [81]. With kind permission of © JohnWiley and Sons (2009))
an analysis with response surface methodology (RSM). Coagulation process canbe appreciated taking into account the shape of the surface: As the curve becomesconvex the interaction Moringa-dye is more affected by pH and IDC and, therefore,the coagulation process is less efficient.
Extensive studies on the removal of Alizarin Violet 3R [82] and on Chicago SkyBlue 6B [81] have concluded that temperature is not a significant variable in thetreatment efficiency. This is an advantage in order to implement a scale-up system,as the flexibility in working ranges allows in treating several kind of industrialeffluents.

12 Nature Is the Answer: Water and Wastewater Treatment. . . 353
Fig. 12.13 Sodium lauryl sulfate removal by coagulation with Moringa oleifera seed extract. Onthe upper corner: Theoretical modelization of coagulant extract-surfactant interaction
Apart from dyes, Moringa oleifera seed extract fully works in the removal ofseveral anionic surfactants. It has been a long time since the interaction amongnatural polymers and surfactants is well-known [84]. The interest of testing Moringaoleifera in removing surfactants from water lies on the fact that they are dangerousand are widely spread pollutants [18]. Because of the cationic character of Moringaoleifera seed extract, it is expected to be effective against anionic surfactants. Ourstudy [85] evidenced that the coagulation and flocculation processes fully work forthe removal of sodium lauryl sulfate (Fig. 12.13) and this interaction Moringa-surfactant obeys the adsorption-like phenomenon rule postulated by the Gu andZhu theoretical model [86]. Other models, such as Freundlich or Frunkim-Fowler-Guggenheim can also be used to predict this behavior. Some recent studies haveshown that Moringa oleifera actually interacts with anionic surfactants and alsowith cationic ones, although in a slight manner.
The pH level does not have a very acute influence on surfactant removal. Moringaoleifera presents a high efficiency in removing sodium lauryl sulfate from pH 5 topH 9. This fact may be due to the anionic character of the surfactant that shouldnot be dramatically reduced by lowering the pH; whereas the proteinic nature of thevegetal extract makes this agent to be cationic. Therefore, its cationic form wouldbe higher at acidic pH. Electrostatic attraction between Moringa oleifera cationicproteins and negative-charge surfactant active centers is reinforced. Both effectsshould explain this behavior.

354 J. Sanchez-Martın and J. Beltran-Heredia
Temperature does not present a significant influence on surfactant elimination.Experiments at 10ıC, 20ıC, 30ıC and 40ıC revealed removal efficiencies in therange of 67–69%. In a general way, this variable does not seem to be significantlyimportant if it is fixed at room temperature or higher, as the only different data insurfactant appear at 10ıC.
Finally, by increasing the initial surfactant concentration, the removal efficiencytends to be higher up to a maximum, then it appears to decrease (around 10 mg L�1).It may be due to the fact that we are reaching the critical micellar concentration(so properties may change dramatically) and to the denaturation of proteins in thepresence of surfactants [87].
Models can be applied to surfactant coagulation and adsorption. According tothe theoretical modelization for this particular system (surfactant-Moringa), qmax
appears around 2.1�10�3 mol g�1 (500 mg g�1, approximately), which is a veryhigh removal capacity.
The second type of natural products is tannin-based coagulants and adsorbents.Tannin derivatives can be commercial or noncommercial. Regarding the firstgroup, as said before, the more representative are TANFLOC, SILVAFLOC, andACQUAPOL. They differ from each other either in the tannin feedstock source(Acacia or Quebracho) or in the polymerization agent (ammonium chloride ormonoethanolamine).
Commercial tannin coagulants show a very interesting ability in removing heavymetals (not presented in the case of Moringa oleifera). The chelating activity oftannins is supposed to enhance dissolved heavy metals removal from water [88].
We have researched on the ability of TANFLOC in removing heavy metals frompolluted wastewater [89] on two basic hypothesis: the effective chelating activityand the adsorption process between metal ions and suspended matter (such ashumic or fulvic matters) that may be measured as turbidity. The result is that heavymetals such as Zn2C, Ni2C, or Cu2C are easily removed by dosages between 50 and150 mg L�1.
The pH dependency of the metal ions in aqueous solution makes this removingprocess to be very pH-sensitive. As pH is an important factor for metal hydroxideprecipitation, it is needed to adjust the pH in order to avoid this effect and evaluatemetal removal caused only by coagulation and flocculation process. An orientativepH working value for each metal is given by the solubility-product constant valuesat each pH, which shows an idea of what quantity of metal is dissolved and whatquantity is under solid form. Solubility-product constants of Ni2C, Zn2C and Cu2Chydroxides are well known and their values are 5.54 � 10�16, 1.2 � 10�17, and1.6 � 10�19, respectively [90]. It should be difficult to calculate the solubility ofthese species accurately, as the working water in the referred article is not distilled,but river water (so it has a lot of impurities that may interfere in the equilibriumprocess), and these values give an idea of how Cu2C will be insoluble at lower pHthan Ni2C and Zn2C.
In fact, pH precipitation is a common method for metal removal. Contaminatedwater is pH-adjusted till a basic value (pH 10–11) is attained. At this pH, metal ionsbecome into a hydroxide form according to Eq. 12.3.

12 Nature Is the Answer: Water and Wastewater Treatment. . . 355
M2C C 2.OH/� ! M.OH/2 # (12.3)
As pH is supposed to be favorable to metal removal, it is very important to adjustits value and evaluate the amount of metal that is removed by TANFLOC effectand the metal ion loss due to natural precipitation. In this paper, natural removal byhydroxide precipitation is excluded from metal removal results, as the initial metalconcentration was considered after the first Jar-test assay, in which no flocculantwas added.
Taking this fact into account, optimum pH levels were found for each metal andequilibrium metal concentration was reached after standard Jar test. These pH valueswere 7, 8, and 9 for Cu2C, Zn2C, and Ni2C, respectively. Figure 12.14 shows themain insights this investigation reached. Up to 85% of metal removal (from an initialmetal concentration equal to 20 mg L�1) was obtained in every case.
The interaction with anionic dyes was also fully proved. Bearing in mind theincreasing importance of dyes in industries all over the world [91], it is easy tounderstand that these compounds mean a very significative pollutant, as it is knownover 50,000 tons of dyes are discharged into environmental effluent annually, withthe severe consequences to fauna and flora equilibrium [92].
Coagulation has been one of the most popular ways of removing dyes fromaqueous systems because of its simplicity and high efficiency [93]. The utilizationof these new tannin-based coagulants in removing anionic dyes has been found inprevious scientific literature in some works where they were used in a preliminaryscreening for dye removal [81, 82], but there are at least two papers where theyare the main agents: Graham et al. [64] and Beltran-Heredia et al. [83]. The firstof them works on already known TANFLOC and its use in colored humic water(which is not properly dye removal) and the second one develops the study on asimilar commercial tannin coagulant called ACQUAPOL-C1, which is also derivedfrom Acacia mearnsii de Wild tannin.
ACQUAPOL-C1 has demonstrated to be a very effective coagulant agent inremoving at least two kinds of anionic dyes: anthraquinonic and azo dyes. Its abilityin removing triphenylmethane (such as Eriochromecyanine R) or indigoid dyes(such as Indigo Carmine) is much lower (Fig. 12.15). In the case of ACQUAPOL-C1 with Alizarin Violet 3R (anthraquinonic dye), the efficiency of the coagulantis quite high [82]. An average qmax was found around 0.5 mg mg�1, which isa very interesting value, and the process seems to follow a Langmuir adsorptionphenomenon (Fig. 12.16).
The feasibility of removing surfactants with these kinds of commercial tannin-based coagulants was also confirmed. As said before, surfactants are a veryimportant chemical group in modern life. Due to their biopersistance and impli-cations on environmental equilibrium [18], their removal from aqueous systems hasbecome an important task for wastewater treatment. Tannin-derived coagulants havebeen used with this scope in recent publications.
The ability of TANFLOC and SILVAFLOC in removing anionic surfactants hasbeen thoroughly tested by Beltran-Heredia et al. [51, 94].

356 J. Sanchez-Martın and J. Beltran-Heredia
Fig. 12.14 Heavy metalremoval by coagulation withTANFLOC (Reprinted fromRef. [89]. With kindpermission of © Elsevier(2009))

12 Nature Is the Answer: Water and Wastewater Treatment. . . 357
Fig. 12.15 Removal of different dyes by ACQUAPOL-C1. Initial dye concentration: 100 mg L�1.Coagulant dosage: 100 mg L�1 (Reprinted from Ref. [82]. With kind permission of © Elsevier(2009))
Fig. 12.16 Equilibrium data and models adjustment for Alizarin Violet 3R removal byACQUAPOL-C1 (Reprinted from Ref. [82]. With kind permission of © Elsevier (2009))
Figure 12.17 depicts the efficient decrease in sodium dodecyl benzene sulfonate(SDBS, anionic surfactant) concentration when treated with these coagulants. Ascan be appreciated, in both cases, near 90% of initial surfactant concentration(50 mg L�1) is achieved with a reasonably coagulant dosage.

358 J. Sanchez-Martın and J. Beltran-Heredia
Fig. 12.17 Sodium Dodecyl Benzene Sulfonate (SDBS, anionic surfactant) removal by (a)TANFLOC and (b) SILVAFLOC
The pH seems to be a rather important variable in surfactant removal bythese tannin-based coagulants [51, 94]. In the same way, the initial surfactantconcentration also refers as a reliable influence in the efficiency of the process.Bearing in mind these two variables, Beltran-Heredia et al. [95] developed amultistep analysis by means of a Design of Experiments in order to obtain themaximum efficiency by varying both these parameters. The result was analyzed

12 Nature Is the Answer: Water and Wastewater Treatment. . . 359
Fig. 12.18 Response surface of a design of experiments for obtaining the optimum q in SDBSremoval by TANFLOC (Reprinted from Ref. [51]. With kind permission of © The AmericanChemical Society (2009d))
according to RSM and this optimum was estimated to be 0.96 mg mg�1 for q in apH level of 4.9 and initial surfactant concentration equal to 103.2 mg L�1. This isshown in Fig. 12.18.
Regarding the special surface characteristics of anionic surfactants [96] and theiradsorption affinity onto polymers [97], removal phenomenon has been treated ascoagulation followed by adsorption, so the theoretical basis of this last operationcan be applied in order to explain how the surfactant is removed from the aqueousmatrix. In the case of SDBS and TANFLOC, three theoretical models have beentested–Freundlich, Frumkin-Fowler-Guggenheim and Gu-Zhu.
As can be appreciated in Fig. 12.19, a very well data fit is obtained with thethree models. Beltran-Heredia et al. [94] carried out the linear and nonlinear dataadjustments and concluded that the best model (regarding r2 values) was the Gu-Zhu hypothesis, which is properly defined for surfactant–polymer interactions [86].
Lastly, several attempts were carried out for optimizing the synthesis of tannin-based coagulants. Some of them were performed following a categorical optimiza-tion process, others were focused following an orthogonal rotatable cubic centereddesign (CCD).
The reagents involved in the cationization process were:
• Tannin extracts from Schinopsis balansae and from Acacia mearnsii de Wild.Commercial trademarks are Quebracho ATO (Q) for the first one and Clarotan(C) and Weibull black (W) for the second one. The three tannin extracts weresupplied by TANAC Inc. (Brazil).
• Reagents involved in the coagulant synthesis are Ammonium Chloride (Cl), Di-ethanolamine (D), Glycidyltrimethylammonium Chloride (G) and Formaldehyde(F). The four products were supplied by SIGMA in commercial purity grade.

360 J. Sanchez-Martın and J. Beltran-Heredia
Fig. 12.19 Equilibrium data and models adjustment for SDBS removal by TANFLOC (Reprintedfrom Ref. [51]. With kind permission of © The American Chemical Society (2009d))
Table 12.2 Production processes of different tannin coagulants
Amine Tannin (g) Amine (g) Formaldehyde (g) Reference
Ammonium chloride (Cl) 2.5 2.5 1.5 [65]Diethanolamine (D) 2.5 10.8 1.5 [98]Glycidyltrimethylammonium
chloride (G)2.5 2.5 0.06 [99]
Table 12.2 presents the specific amounts of each reagent. The cationizationprocesses were conducted as follows: certain fixed amount of tannin extract wasdiluted in distilled water at room temperature. Then the sample was thermostated atthe reaction temperature (30ıC). Then, certain amount of amine was added to themix: diethanolamine, ammonium chloride or glycidyltrimethylammonium chloride.Finally, always under thermal control, formaldehyde was added to the reactionmixture. A peristaltic pump was used in this step, so that it lasted for 90 min atleast.
The product so obtained was kept under agitation and at the same temperaturefor 24 h. The final product was put in a 50 mL-flask and filled up to the mark withdistilled water.
Figure 12.20 shows the interaction graphics of the involved variables accordingto the factorial model design. The trials with each nitrogenant agents are representedby the different lines, tannin extracts are placed along the X-axis. Palatine FastBlack WAN was the model compound for simulating textile wastewater. Tests were

12 Nature Is the Answer: Water and Wastewater Treatment. . . 361
100a b
80
60
40
Ave
rage
rem
oval
(%
)
Ave
rage
rem
oval
(%
)
20
0
C Q
Tannin extract Tannin extract
W
Amine Amine
CIDG
CIDG
C Q W
80
60
40
20
Fig. 12.20 Interaction graphics in qualitative optimizing. (a) Simulated textile wastewater withPalatine Fast Black WAN; (b) Simulated laundry wastewater with SDBS
100a b
80
60
40
20
0CDF CDFCCIF CCIFWCIF WCIFWDF
Category
Effi
cacy
(%
)
Effi
cacy
(%
)
CategoryWDFWGF WGFQCIF QCIFQDF QDFQGF QGFCGF CGF
100
80
60
40
20
0
Fig. 12.21 Box plot for the nine products in coagulation of two types of water. (a) Simulatedtextile wastewater with Palatine Fast Black WAN; (b) Simulated laundry wastewater with SDBS
carried out with an IDC of 100 mg L�1 or SDBS initial concentration of 50 mg L�1.Coagulant dosage was 500 mg L�1 in the case of textile and laundry simulatedwastewater.
For wastewater samples, the interaction is clear, not only from the graphicalanalyses, but also because of the ANOVA report, which gives a p-value forinteraction lower than 0.05 in each case. The complexity of the different pollutantsshould interfere in the destabilization of each one [100] and the model is not sosimple in this case.
Because of that fact, the nine combinations can be compared with every objectivevariable–dye removal and surfactant elimination. A box-and-whisker plot, whichshows the results of the tests, is presented in Fig. 12.21. This is a multicategoricalanalysis in which each product is tested and compared to the rest of them.

362 J. Sanchez-Martın and J. Beltran-Heredia
For evaluating the system coagulant-SDBS or coagulant-Palatine Fast BlackWAN, we have to study ANOVA test, which gives us significativity data aboutthese results. In a first approach, we can see that there is a set of coagulantsthat work significantly better than the rest of them; they are those derived fromAcacia mearnsii de Wild, Clarotan and Weibull black. Combinations with DEA areespecially effective, either in terms of pollutant removal or low dispersion. Thistendency is presented more clearly in the removal of Palatine Fast Black WAN,while a wider dispersion of results is presented in the case of SDBS.
Tukey’s test for multiple comparison did not give significative differences above75% in both dye and surfactant removal. Three subsets are arranged in the caseof dye removal, while up to five were established regarding SDBS removal. Thishas to do with the increase in dispersion of the last data presented, so more groupscan be identified. It is also important to point out the fact that no overlapping isobserved among the subsets that are related to dye removal, so clear differences canbe appreciated in this case. This again may be explained by the more affinity the dyepresents towards the coagulant.
On the contrary, the five subsets that are obtained for SDBS elimination presentedseveral cases that are not distinguishable and could be inserted in various groups.
Quebracho-derived coagulants seem to be less effective, according not only to thegraphical representation, but also to Tukey’s multiple comparisons (data not shown).Probably the differences between coagulants may be found in the fact that tanninextracts are not exactly equal in their chemical composition; so the cationizationand polymerization are affected not only by the chemical nitrogenant agent, but alsoby the specific tannin structure [101, 102].
In view of these results, an intermediate solution was selected. Clarotan waschosen as tannin source for a standard cationization. So-called CDF (Clarotanwith DEA and formaldehyde) coagulant was used in dye removal and surfactantelimination.
The way this new coagulant forms coagules and flocs suggests it follows abridging procedure. This is caused by a flocculent clarification of the surface waterand it is characteristically slow, without the typical sedimentation zones [100, 103].
Regarding the coagulant dosage on dye removal (Fig. 12.22), it is shown thatdye concentration undergoes a rapid and dramatic decrease from the first coagulantdosage [104]. The efficacy of the coagulant is very high, therefore, 100 mg L�1 canreduce up to 80% the initial dye concentration. However, a flocculent sedimentationis presented regarding the value of sludge production (ca. 200 ml L�1 in Imhoff’scone test). This yields to a Sludge Volume Index (SVI) equal to 317 ml L�1.This relatively high value recommends the usage of a flocculant agent, beyond thecoagulant effect of the tannin-derived product [105, 106].
Other experimental series were done in order to determine the influence ofvariables on the removal of SDBS. A fixed dose of 0.10 mmol L�1 of surfactantwas evaluated to be removed with different doses of coagulant. As is shown in thesame figure, Fig. 12.22, final surfactant concentration tends to decrease as CDFdose increases. However, it is observed that the efficiency of the process arrives

12 Nature Is the Answer: Water and Wastewater Treatment. . . 363
0.8
0.6
0.7
0.4
0.5
0.2
0.3
0.00 100 200 300
Coagulant dosage (mg.L−1)
CI (
mm
ol. L
−1)
CI (
mm
ol. L
−1)
Coagulant dosage (mg.L−1)
400 500 600 0 100 200 300 400 500 600
0.1
0.12a b
0.10
0.08
0.06
0.04
0.02
0.00
Fig. 12.22 Wastewater treatment with optimum CDF coagulant. (a) Simulated textile wastewaterwith Palatine Fast Black WAN; (b) Simulated laundry wastewater with SDBS (Reprinted from Ref.[104]. With kind permission of Elsevier (2010))
at a maximum, and a higher dose of coagulant does not achieve lower surfactantconcentrations. There is a residual surfactant concentration that is no possible toremove through this flocculation process, and it seems to be about 0.02 mmol L�1.This can be due to the existence of an “equilibrium surfactant concentration” whichis highly difficult to remove, as reported previously [107].
12.5 Natural Adsorbents
Tannin gelation is a feasible way of obtaining natural adsorbents that can easilyremoved these kinds of pollutants. For this purpose, a complete study on types oftannin gels has been carried out by Sanchez-Martın et al. [108].
Commercially available tannin extracts, such as Acacia mearnsii de Wild(Weibull black), Schinopsis balansae (Quebracho colorado), Castanea sativa(Chestnut), and Caesalpinia spinosa (Tara) were kindly supplied by TANAC(Brazil). They were products involved in the leather treatment and they are presentedas powder.
Lab-extracted tannins such as Pinus pinaster (Pine) and Cupressus sempervivens(Cypress) are extracted according to the following procedure [109]. A quantity of100 g of bark was milled in a cutting mill and placed in 600 mL of tap water.Then 5 g of sodium hydroxide (PANREAC) was added and the mixture was stirredin magnetic stirrer at 90ıC for 1 h. Solids were separated by filtration and liquidfraction was dried in an oven (65ıC) overnight. The resultant was considered thetannin extract.
Tannin rigid resins are useful for the removal of cationic pollutants, not an-ionic ones. For this reason, different pollutants were used in the current in-vestigation. Methylene blue (MB) was used as dye model compound, althoughothers were included in preliminary screening. It was provided by Sigma-Aldrich.

364 J. Sanchez-Martın and J. Beltran-Heredia
Regarding heavy metal, Zn2C was selected as model compound and it was suppliedby Panreac. Finally, Cetyltrimethylammonium bromide (CTAB) was the modelcompound for cationic surfactants. It was supplied by Sigma-Aldrich.
Tannin gels were prepared according to the basis of Nakano [69]. Five gramsof tannin extract was dissolved in 32 mL of sodium hydroxide (PANREAC)0.125 mol L�1 and 30 mL of distilled water at 80ıC. When the mixture washomogeneous, 2 mL of formaldehyde (commercial purity grade) was added andthe reaction was kept at the same temperature for 8 h until polymerization wasconsidered as being completed. Then, the apparent gummy product was led tocomplete evaporation of remaining water and dried in an oven (65ıC) overnight.
After gelation, tannin rigid foams were crushed and sieved to produce 38–53�mdiameter particles. They were washed successively with distilled water and nitricacid 0.01 mol L�1 (PANREAC) to remove unreacted sodium hydroxide. Finally, theadsorbent was dried again in the oven. Differences are found between this prepara-tion and the description made by Yurtsever and Sengil [75], mainly concerning theamount of formaldehyde.
Chemical polymerization of tannin extracts by means of formaldehyde is a well-known process for producing tannin gels. Our previous work on adsorbents derivedfrom Schinopsis balansae (red quebracho) presented some interesting data about theremoval of MB from aqueous solutions. So the obtained adsorbent is called QTG.
As a first approach, the tannin gel was synthesized strictly according to referredNakano et al. [69] even with the formaldehyde proportions (2 mL each 5 g of tanninextract). The first physical characterization of this preliminary product was madeon the basis of FTIR. The spectra of both samples are shown in Fig. 12.23. Widebands in the range of 3,600–3,100 cm�1 correspond to –OH bridging groups inall systems and are attributed to O–H stretching (phenolic or alcoholic group) andto water molecules hydrogen bonded with –OH groups. The small peaks in theregion of 2,950–2,850 cm�1 are associated with the methylene (–CH2–) bridges.Also, stretching vibrations of C–H groups in the aromatic rings give absorptionbands in this region. The absorption bands between 1,620 and 1,450 cm�1 arecharacteristic of the elongation of the aromatic –CDC– bonds. The deformationvibration of the C–C bonds in the phenolic group absorbs in the region of 1,500–1,400 cm�1. The peak at 1,390–1,370 cm�1 is associated with the O–H deformationvibration of phenolic or alcoholic group. The peaks in the region 1,280–1,210 cm�1
are associated with the –CO stretchings of the aromatic ring and the methyleneether bridges formed by reaction with formaldehyde. The peaks at 1,160–975 cm�1
are due to asymmetrical C–O–C stretching and C–H deformation. The deformationvibrations of the C–H bond in the aromatic rings give absorption bands in the rangeof 835–650 cm�1.
For confirming the validity of equilibrium periods (up to 15 days), a kineticstudy was carried out with Methylene Blue (MB). A series of trials was performedwith a fixed initial dye concentration (IDC) (100 mg L�1) and with differentproportions of QTG and MB (mmol g�1 of adsorbent). Figure 12.24 reports the

12 Nature Is the Answer: Water and Wastewater Treatment. . . 365
70Original raw material
QTG
65
60
60
55
50
45
40
35
30
25
20
15
10
5
0
55
50
45
40
35
30
%Tr
ansm
ittan
ce%
Tran
smitt
ance
25
20
15
10
5
44000 3500 3000 2500
Wavenumbers (cm−1)
Wavenumbers (cm−1)
2500 150016
15,1
3
3367
,69
3400
,01
1610
,77
1519
,64
1383
,23
1209
,08
1111
,01
1037
,96
835,
61
1789
,33
1519
,59
1450
,06
1369
,26
1282
,63
1160
,11
1115
,07
1037
,42
975,
15 778,
09
649,
64
1000 500
4000 3500 3000 2500 2500 1500 1000 500
Fig. 12.23 FTIR spectra of raw and gelified Quebracho tannin (Reprinted from Ref. [74]. Withkind permission of © Elsevier (2010))

366 J. Sanchez-Martın and J. Beltran-Heredia
Fig. 12.24 Kinetics of dye removal with classical tannin gel from quebracho (Reprinted from Ref.[74]. With kind permission of © Elsevier (2010))
decreasing concentration of dye in six experiments with 1.5, 1.8, 2.2, 2.5, 2.8 and3.7 mmol g�1. A rather rapid dye removal is achieved in the first 150 h, althoughcomplete equilibrium dye concentration is reached at 350 h.
The application of the three classical models in kinetic studies (Lagergren,Ho and Elovich) has been carried out by a nonlinear adjustment and results arepresented in Fig. 12.25. As can be appreciated, the three of them fit reasonably wellto the experimental situations, so regression coefficient r2 may be considered inorder to discriminate the goodness of each data fit. All of them presented r2 levelsabove 0.95. According to this, the three models explain rather well the adsorptionprocess. With little differences, Lagergren model gives a 0.98 regression coefficient.Due to its simplicity and to the goodness of the linear correlation, not only thenonlinear regression, this hypothesis may be assumed as the best theoretical modelin this adsorption case. Similar phenomena have been reported in Methylene Blueadsorption on other natural products [110].
Finally, equilibrium studies on MB and CTAB adsorption onto tannin gels werecarried out. The adsorption of MB onto classical QTG is presented in Fig. 12.26 andfollows the Langmuir hypothesis as presented in Eq. 12.4 (Fig. 12.26).
q D kl1Cl
1C kl2Cl(12.4)
where kl1 is the first Langmuir adsorption constant (L [g of adsorbent]�1), and kl2 isthe second Langmuir adsorption constant (L [mmol of pollutant]�1).

12 Nature Is the Answer: Water and Wastewater Treatment. . . 367
Fig. 12.25 Kinetic of dyeremoval with classical tanningel from quebracho dataadjustment in the removal ofMethylene Blue (Reprintedfrom Ref. [74]. With kindpermission of © Elsevier(2010))

368 J. Sanchez-Martın and J. Beltran-Heredia
Fig. 12.26 Data fit of multiparameter, nonlinear and linear adjustments of Langmuir equation(Reprinted from Ref. [74]. With kind permission of © Elsevier (2010))
In addition, temperature can be included in a generalized expression of Langmuirhypothesis by considering Langmuir constants according to Arrhenius correlation.That assumes that kl1 and kl2 may have the following form (12.5):
k D k0 exp
�� E
RT
�(12.5)
where k0 is the basic constant, whose units are equal to k, E is the activation energy(J mol�1), R is the universal constant for perfect gases (8.314 J mol�1 K�1), and Tis the temperature of the adsorption process (K).
The inclusion of definition (12.5) into Langmuir expression (12.4) leads to theexpression (12.6):
q D ko1 exp��E1
RT
�Cl
1C ko2 exp��E2
RT
�Cl
(12.6)
The specific r2 is 0.86 in this case. It stands near to the average value ofr2 in the case of nonlinear individual adjustments for each temperature (0.84).Both the nonlinear procedures give a more accurate idea of the goodness of themodel, while linear regression checks the adequacy of Langmuir’s hypothesis inthis adsorption process. In addition, multiparametric adjustment gives us two more

12 Nature Is the Answer: Water and Wastewater Treatment. . . 369
Table 12.3 Fittingparameters for equilibriumadsorption process. Unitsin text
Model Parameters r2
Nonlinear Langmuir10ıC k11 D 0.69; kl2 D 19.4 0.5220ıC k11 D 0.87; kl2 D 34.4 0.5230ıC k11 D 0.77; kl2 D 105.2 0.7740ıC k11 D 0.81; kl2 D 94.4 0.77Linear Langmuir10ıC k11 D 0.67; kl2 D 21.8 0.8420ıC k11 D 0.80; kl2 D 27.4 0.9530ıC k11 D 0.82; kl2 D 48.2 0.9740ıC k11 D 0.80; kl2 D 95.3 0.99Multiparameter Langmuir
k01 D 1.59; k02 D 1.27 0.77E1 D 0.18 104, E2 D 5.37 104
data–activation energies. According to the mathematical results, the first of theseparameters (E1), which corresponds to adsorption energy (while E2 corresponds todesorption energy) is equal to 9,973.4 J mol�1. E2 is equal to zero, so desorptionprocess is not temperature-dependent. In every case, the values of each k belongsto similar magnitude order, as can be appreciated according to the adjustment ofexperimental to predicted data.
Regarding CTAB adsorption onto Pinus pinaster classical tannin gel, the samethree fitting procedures were performed: A linear and a nonlinear fit for eachtemperature, and a multiparameter fit for the entire temperature range. Table 12.3lists the values of the parameters and the correlation coefficients r2.
The nonlinear Langmuir fits for the specific temperatures gave lower correlationcoefficients (mean of 0.65) because the error bars are wider. However, previousstudies have shown this method to be more accurate than linear fits [111, 112].
Finally, the goodness of the multiparameter fit is reflected in the reasonablyhigh value of the r2 coefficient (0.77). In addition, this model yields two furtherparameters: the activation energies. According to the mathematical results, one ofthese parameters (E02), which corresponds to the equilibrium adsorption energy, isequal to 5.37 �104 J mol�1, while the other one is equal to 0.18 �104 J mol�1. Sincethe difference between them is positive, the adsorption process reaches equilibrium.The fact that its value is very low has to do with the enhancement of the adsorptionprocess due to the thermal effect on the pores, i.e., to thermal activation. In eachcase of the linear and nonlinear fits, the values of the parameters are similar in orderof magnitude (Fig. 12.27).
The energies involved in the adsorption process are high enough for it to beconsidered as chemisorption (the links between adsorbate and adsorbent are stableand irreversible). The SEM images also led us to think that this chemisorptionmust be governed by the external diffusion stage, since they showed the materialto have little porosity so that the adsorption process must take place on the surfaceat regularly distributed active centers.

370 J. Sanchez-Martın and J. Beltran-Heredia
Fig. 12.27 Multiparameter, nonlinear, and linear fits of the Langmuir equation to the CTABadsorption onto Pinus pinaster classical tannin gel data
Pinus tannin gel presents a reasonably high level of maximum q as shown bythe nonlinear Langmuir model. Of the relatively few materials referred to in thescientific literature for CTAB removal, none belongs to the category of the so-called waste or low-cost materials. One observes that most of the adsorbents aresynthetic in origin, such as perlite or modified silica gel. Pinus tannin gel presentsan intermediate situation in terms of CTAB removal, so its capacity is comparableto that presented by other materials.
12.6 Conclusion
This chapter aimed to present some novel natural products as a possible response toconcomitant and urgent pollution process. It is more than evident that environmentalconcerns are more significant every day and human beings are forced to facethis challenge if we want to keep the current level of development. Moreover,the appropriate implementation of these and others technical resources should beproperly developed for promoting economical and social development in emergingcountries and in the so-called Third World.
We presented two main sources for controlling water pollution: Moringa oleiferaseed extract and tannin derivatives. The last ones can be considered either ascoagulants and adsorbents. The performance of every agent is promising and

12 Nature Is the Answer: Water and Wastewater Treatment. . . 371
further investigations must be carried out, but it is clearly shown that Moringaseed extract and tannin coagulants (both commercial and lab-synthesized) are fullyefficient in the removal of anionic dyes and surfactants. On the other hand, tanninadsorbents can easily remove cationic dyes, heavy metals, and cationic surfactantsfrom wastewater samples.
References
1. UNESCO (2009) World water assessment programme. The United Nations world waterdevelopment report 3: water in a changing world. EarthScan, London
2. PEP (2006) Linking poverty reduction and water management. Poverty-Environment Partner-ship and World Health Organization, Ginebra
3. Maslow A (1987) Motivation and personality, Brandeis University, Late4. Unceta K (2007) La cooperacion al desarrollo en las universidades espanolas/Development
cooperation in the Spanish universities. Spanish Agency for International Cooperation,Madrid
5. SPAIN (2009) Plan Director de Cooperacion para el Desarrollo 2009–2010/DevelopmentCooperation Director Plan 2009–2010, Madrid
6. WHO, UNICEF (2009) Joint programme on water supply and sanitation. WHO LibraryCataloguing-in-Publication Data, Geneva
7. WHO (2008) United Nation-global annual assessment of sanitation and drinking water. WHOLibrary Cataloguing-in-Publication Data, Geneva
8. Lee JW, Choi SP, Thiruvenkatachari R, Shim WG, Moon H (2006) Evaluation of theperformance of adsorption and coagulation processes for the maximum removal of reactivedyes. Dye Pigment 69:196–203
9. Shaul GM, Holdsworth TJ, Dempsey CR, Dostal KA (1991) Fate of water soluble azo dyesin the activated sludge process. Chemosphere 22:107–119
10. Guibal E, Roussy J (2007) Coagulation and flocculation of dye-containing solutions using abiopolymer (Chitosan). React Funct Polym 67:33–42
11. Shi B, Li G, Wang D, Feng C, Tang H (2007) Removal of direct dyes by coagulation: theperformance of preformed polymeric aluminum species. J Hazard Mater 143:567–574
12. O’Neill C, Hawkes FR, Hawkes DL, Lourenco ND, Pinheiro HM, Delee W (1999) Colour intextile effluents-sources, measurement, discharge consent and simulation: a review. J ChemTechnol Biotechnol 74:1009–1018
13. Zollinger H (1987) Colour chemistry-synthesis. Properties and application of organic dyesand pigments. VCH Publishers, New York
14. Gaini LE, Lakraimi M, Sebbar E, Meghea A, Bakasse M (2009) Removal of indigocarmine dye from water to Mg–Al–CO3-calcined layered double hydroxides. J Hazard Mater161:627–632
15. Chung KT, Chen SC, Claxton LD (2006) Review of the Salmonella typhimurium mutagenicityof benzidine, benzidine analogues, and benzidine-based dyes. Mutat Res/Rev Mutat Res612:58–76
16. Myers D (2006) Surfactant science and technology. Wiley, New Jersey17. Edser C (2008) Status of global surfactant markets. Focus Surfactant 11:1–218. Cserhati T, Forgacs E, Oros G (2002) Biological activity and environmental impact of anionic
surfactants. Environ Int 28:337–34819. Basar CA, Karagunduz A, Cakici A, Keskinler B (2004) Removal of surfactant by powdered
activated carbon and microfiltration. Water Res 38:2117–212420. Clara M, Scharf S, Scheffknecht C, Gans O (2007) Occurrence of selected surfactants in
untreated and treated sewage. Water Res 41:4339–4348

372 J. Sanchez-Martın and J. Beltran-Heredia
21. Patterson DA, Metcalfe IS, Xiong F, Livingston AG (2006) Wet air oxidation of linear alkyl-benzene sulfonate: 1. Effect of temperature and pressure. Ind Eng Chem Res 40:5507–5516
22. Pasieczna-Patkowska S, Czech B, Ryczkowski J, Patkowski J (2010) Removal of recalcitrantpollutants from wastewater. Appl Surf Sci 256:5434–5438
23. Rosu M, Marlina A, Kaya A, Schumpe A (2008) Surfactant adsorption onto activated carbonand its effect on absorption with chemical reaction. Chem Eng Sci 62:7336–7343
24. Onder E, Koparal AS, Ogutveren UB (2007) An alternative method for the removal ofsurfactants from water: electrochemical coagulation. Sep Purif Technol 52:525–532
25. Ostroumov SA (2006) Biological effects of surfactants. CRC Press, Boca Raton26. Kurniawan TA, Chan GYS, Lo W-H, Babel S (2006) Physicochemical treatment techniques
for wastewater laden with heavy metals. Chem Eng J 118:83–9827. Tunai O, Kabdasly NI (1994) Hydroxide precipitation of complexed metals. Water Res
28:2117–212428. Charerntanyarak L (1999) Heavy metals removal by chemical coagulation and precipitation.
Water Sci Technol 39:135–13829. Yoon J, Amy G, Chung J, Sohn J, Yoon Y (2009) Removal of toxic ions (chromate, arse-
nate, and perchlorate) using reverse osmosis, nanofiltration, and ultrafiltration membranes.Chemosphere 77:228–235
30. Appelbaum S, Garada J, Mishra JK (2002) Growth and survival of the white leg shrimp(Litopenaeus vannamei) reared intensively in the brackish water of the Israeli Negev desert.Isr J Aquac–Bamidgeh 54:41–48
31. WHO and UNICEF (2007) Meeting the MDG drinking water and sanitation target: the urbanand rural challenge of the decade. WHO Library Cataloguing-in-Publication Data, Geneva
32. Wilderer PA (2004) Applying sustainable water management concepts in rural and urbanareas: some thoughts about reasons, means and needs. Water Sci Technol 49:8–16
33. WHO (1985) Appropriate technology for the treatment of wastewaters for small ruralcommunities. WHO Library Cataloguing-in-Publication Data, Geneva
34. Dorf RC (2001) Sustainable and appropriate technologies, technology, humans, and society.Academic, San Diego
35. Bowonder B (1979) Appropriate technology for developing countries: some issues. TechnolForecast Soc Change 15:55–67
36. Miller SM, Fugate EJ, Craver VO, Smith JA, Zimmerman JB (2008) Towards understandingthe efficacy and mechanism of Opuntia spp. as a natural coagulant for potential application inwater treatment. Environ Sci Technol 42:4274–4279
37. Fuglie LJ (2001) The miracle tree. The multiple attributes of Moringa. Technical Centre forAgricultural and Rural Cooperation, Wageningen
38. Makkar HPS, Becker K (1996) Nutritional value and antinutritional components of whole andethanol extracted Moringa oleifera leaves. Anim Feed Sci Technol 63:211–228
39. Aregheore EM (2002) Intake and digestibility of Moringa oleifera-Batiki grass mixtures bygrowing goats. Small Rumin Res 46:23–28
40. Richter N, Siddhuraju P, Becker K (2003) Evaluation of nutritional quality of Moringa(Moringa oleifera Lam.) leaves as alternative protein source for Nile Tilapia (Oreochromisniloticus L.). Aquaculture 217:599–611
41. Caceres A, Cabrera O, Morales O, Mollinedo P, Mendia P (1991) Pharmacological propertiesof Moringa oleifera. 1: preliminary screening for antimicrobial activity. J Ethnopharmacol33:213–216
42. Caceres A, Saravia A, Rizzo S, Zabala L, De Leon E, Nave F (1992) Pharmacologic propertiesof Moringa oleifera. 2: Screening for antispasmodic, antiinflammatory and diuretic activity.J Ethnopharmacol 36:233–237
43. Armand-Stussi I, Basocak V, Pauly G, McCaulley J (2003) Moringa oleifera: an interestingsource of active ingredients for skin and hair care. SOFW-J 129:45–52
44. Goh CW (2009) Effect of room temperature on coagulation performance of Moringa oleiferaseeds. B. Sc. dissertation, Faculty of Engineering, University of Putra, Malaysia

12 Nature Is the Answer: Water and Wastewater Treatment. . . 373
45. Katayon S, Noor MM, Asma M, Thamer AM, Liew AG, Idris A, Suleyman AM, AminuddinMB, Khor BC (2004) Effects of storage duration and temperature of Moringa oleifera. Stocksolution on its performance in coagulation. Int J Eng Technol 1:146–151
46. Abdulkarim SM, Long K, Lai OM, Muhammad SKS, Ghazali HM (2005) Some physico-chemical properties of Moringa oleifera seed oil extracted using solvent and aqueousenzymatic methods. Food Chem 93:253–263
47. Bhuptawat H, Folkard GK, Sanjeev C (2007) Innovative physico-chemical treatment ofwastewater incorporating Moringa oleifera seed coagulant. J Hazard Mater 145:120–126
48. Jahn SA, Musnad HA, Burgstalle H (1986) The tree that purifies water: cultivating multipur-pose Moringaceae in Sudan. Unasylva 38:23–28
49. Schofield P, Mbugua DM, Pell AN (2001) Analysis of condensed tannins: a review. AnimFeed Sci Technol 91:21–40
50. Haslam E (1989) Plant polyphenols-vegetables and tannins revisited. Cambridge UniversityPress, Cambridge
51. Beltran-Heredia J, Sanchez-Martın J, Solera-Hernandez C (2009) Anionic surfactants re-moval by natural coagulant/flocculant products. Ind Eng Chem Res 48:5085–5092
52. Pizzi A (2008) Tannins: major sources, properties and applications. In: Belgacem MN,Galdini A (eds) Monomers, polymers and composites from renewable sources. Elsevier,Amsterdam
53. Hagerman A (1995) Tannin analysis. Miami University, Ohio54. Mitchel DB, Minnis RL, Curran TP, Deboo SM, Kelly JA, Patwardhan R, Tai W-T (1998)
Treatment of aqueous systems using a chemically modified tannin. US Patent 5,843,33755. Quamme JE, Kemp AH (1985) Stable tannin based polymer compound. US Patent 4,558,08056. Reed PE, Finck MR (1997) Modified tannin Mannich polymers. US Patent 5,659,00257. Vasconcellos SR, Boyce PD, Smith LP (1993) Methods for the flocculation of coal fines and
insoluble metals in coal mine waters. US Patent 4,183,57558. Roux DG, Ferreira D, Hundt HL, Malan E (1975) Structure, stereochemistry, and reactivity
of natural condensed tannins as basis for their extended industrial application. Appl PolymSymp 1:335–353
59. Tramontini M, Angiolini L (1994) Mannich bases. Chemistry and uses. CRC Press, BocaRaton
60. Pizzi A (1994) Advanced wood adhesives technology. Marcel Dekker, New York61. Roussy J, Chastellan P, Van Vooren M, Guibal E (2005) Treatment of ink-containing
wastewater by coagulation/flocculation using biopolymer. Water SA 31:369–37662. Polasek P, Mutl S (2002) Cationic polymers in water treatment. Part 1: Treatability of water
with cationic polymers. Water SA 28:69–8263. Graham N, Gang F, Fowler G, Watts M (2008) Characterisation and coagulation performance
of a tannin-based cationic polymer: a preliminary assessment. Coll Surf A 327:9–1664. Graham N, Gang F, Fowler G, Watts M, Camm R (2008) Evaluation of a tannin-based
cationic polymer as a coagulant for coloured humic water. J Water Supply Res Technol AQUA58:75–84
65. Lamb LH, Decusati OG (2002) Manufacturing process for quaternary ammonium tannate, avegetable coagulating and flocculating agent. US Patent 6,478,986 B1
66. Tondi G, Zhao W, Pizzi A, Du G, Fierro V, Celzard A (2009) Tannin-based rigid foams: asurvey of chemical and physical properties. Bioresour Technol 100:5162–5169
67. Zhao W, Fierro V, Pizzi A, Du G, Celzard A (2010) Effect of composition and processingparameters on the characteristics of tannin-based rigid foams. Part II: Physical properties.Mater Phys Chem 123:210–217
68. Kim Y-H, Nakano Y (2005) Adsorption mechanism of palladium by redox within condensed-tannin gel. Water Res 39:1324–1330
69. Nakano Y, Takeshita K, Tsutsumi T (2001) Adsorption mechanism of hexavalent chromiumby redox within condensed-tannin gel. Water Res 35:496–500
70. Tondi G, Oo CW, Pizzi A, Thevenon MF (2008) Metal absorption of tannin-based rigid foams.Ind Crop Prod 29:336–340

374 J. Sanchez-Martın and J. Beltran-Heredia
71. Vazquez G, Antorrena J, Gonzalez J, Doval MD (1994) Adsorption of heavy metal ions bychemically modified Pinus pinaster bark. Bioresour Technol 48:251–255
72. Vazquez G, Gonzalez-Alvarez J, Freire S, Lopez-Lorenzo ML, Antorrena G (2002) Removalof cadmium and mercury ions from aqueous solution by sorption on treated Pinus pinasterbark: kinetics and isotherms. Bioresour Technol 82:247–251
73. Sanchez-Martın J, Beltran-Heredia J, Carmona-Murillo C (2011) Adsorbents from Schinopsisbalansae: optimisation of significant variables. Ind Crop Prod 33:409–417
74. Sanchez-Martın J, Gonzalez-Velasco M, Beltran-Heredia J, Gragera-Carvajal J, Salguero-Fernandez J (2010) Novel tannin-based adsorbent in removing cationic dye (Methylene Blue)from aqueous solution. Kinetic and equilibrium studies. J Hazard Mater 174:9–16
75. Yurtsever M, Sengil IA (2009) Biosorption of Pb(II) ions by modified quebracho tannin resin.J Hazard Mater 63:58–64
76. Broin M, Santaella C, Cuine S, Kokou K, Peltier G, Joet T (2002) Flocculent activityof a recombinant protein from Moringa oleifera Lam. seeds. App Microbiol Biotechnol60:114–119
77. Kwaambwa HM, Maikokera R (2007) A fluorescence spectroscopic study of a coagulatingprotein extracted from Moringa oleifera seeds. Coll Surf B 60:213–220
78. Ndabigengesere A, Narasiah KS, Talbot BG (1995) Active agents and mechanism ofcoagulation of turbid waters using Moringa oleifera. Water Res 29:703–710
79. Okuda T, Baes AU, Nishijima W, Okada M (2001) Coagulation mechanism of salt solution-extracted active component in Moringa oleifera seeds. Water Res 35:830–834
80. Okuda T, Baes AU, Nishijima W, Okada M (2001) Isolation and characterization of coagulantextracted from Moringa oleifera seed by salt solution. Water Res 35:405–410
81. Beltran-Heredia J, Sanchez-Martın J (2008) Azo dye removal by Moringa oleifera seedextract coagulation. Color Technol 124:310–317
82. Beltran-Heredia J, Sanchez-Martın J, Delgado-Regalado A, Jurado-Bustos C (2009) Naturalcoagulants in removing Alizarin Violet 3R anthraquinonic dye. J Hazard Mater 170:43–50
83. Beltran-Heredia J, Sanchez-Martın J, Delgado-Regalado A (2009) Removal of CarmineIndigo dye with Moringa oleifera seed extract. Ind Eng Chem Res 48:6512–6520
84. Merta J, Stenius P (1995) Interactions between cationic starch and anionic surfactants. CollPolym Sci 273:974–983
85. Beltran-Heredia J, Sanchez-Martın J (2009) Removal of sodium lauryl sulfate by coagula-tion/flocculation with Moringa oleifera seed extract. J Hazard Mater 164:713–719
86. Gu T, Zhu B-Y (1990) The S-type isotherm equation for adsorption of nonionic surfactants atthe silica gel-water interface. Coll Surf 44:81–87
87. Holmberg K, Jonsson B, Kronberg B, Lindman B (2003) Surfactants and polymers in aqueoussolution. Wiley, Chichester
88. Palma G, Freer J, Baeza J (2003) Removal of metal ions by modified Pinus radiata bark andtannins from water solutions. Water Res 37:4974–4980
89. Beltran-Heredia J, Sanchez-Martın J (2008) Removing heavy metals from polluted surfacewater with a tannin-based flocculant agent. J Hazard Mater 165:1215–1218
90. Frankenthal RPC (1963) Handbook of analytical chemistry. McGraw-Hill, New York91. Sikka P (1991) Strategies for technology development in India. Technovation 11:445–45292. Brown D (1987) Effects of colorants in the aquatic environment. Ecotoxicol Environ Saf
13:139–14793. Allegre C, Maisseu M, Charbit F, Moulin P (2004) Coagulation, flocculation and decantation
of dye house effluents: concentrated effluents. J Hazard Mater 116:57–6494. Beltran-Heredia J, Sanchez-Martın J, Frutos-Blanco G (2009) Schinopsis balansae tannin-
based flocculant in removing sodium dodecylbenzene sulfonate. Sep Purif Technol67:292–303
95. Beltran-Heredia J, Sanchez-Martın J, Solera-Hernandez C (2009) Removal of sodiumdodecylbenzene sulfonate from water by means of a new tannin-based coagulant: optimisationstudies through design of experiments. Chem Eng J 153:56–61
96. Rosen MJ (2004) Surfactants and interfacial phenomena. Wiley, New Jersey

12 Nature Is the Answer: Water and Wastewater Treatment. . . 375
97. Esumi K, Ueno M (2003) Structure-performance relationships in surfactants. Marcel Dekker,New York
98. Lindert AT, Wolpert SM (1990) Tannin Mannich adducts for improving corrosion resistanceof metals. US Patent 4,944,812
99. Hemingway RW, Laks PE (1992) Preparation and performance of tannin based flocculants. In:Biogenesis, chemical properties and significance. Second North American tannin conferenceon plant polyphenols. Plenum Press, New York
100. Kim YH (1995) Coagulants and flocculants. Theory and practice. Tall Oak Publishing,Littleton
101. Streit W, Fengel D (1994) Purified tannins from Quebracho colorado. Phytochemistry34:481–484
102. Vivas N, Nonier MF, Vivas de Gaulejac N, Absalon C, Bertrand A, Mirabel M (2004) Differ-entiation of proanthocyanidin tannins from seeds, skins and stem of grapes (Vitis vinifera) andheartwood of quebracho (Schinopsis balansae) by matrix-assisted laser desorption/ionizationtime-of-flight mass spectrometry and thiacidolysis/liquid chromatography/electrospray ion-ization mass spectrometry. Anal Chim Acta 513:247–256
103. Nazaroff WW, Alvarez-Cohen L (2001) Environmental engineering science. Wiley, New York104. Beltran-Heredia J, Sanchez-Martın J, Gomez-Munoz MC (2010) New coagulant agents from
tannin extracts: preliminary optimisation studies. Chem Eng J 162:1019–1025105. Ozacar M, Sengil A (2001) Effectiveness of tannins obtained from Valonia as a coagulant aid
for dewatering of sludge. Water Res 34:1407–1412106. Ozacar M, Sengil A (2003) Evaluation of tannin biopolymer as a coagulant aid for coagulation
of colloidal particles. Coll Surf A 229:85–96107. Ayranci E, Duman O (2007) Removal of anionic surfactants from aqueous solutions by
adsorption onto high area activated carbon cloth studied by in situ UV spectroscopy. J HazardMater 148:75–82
108. Sanchez-Martın J, Beltran-Heredia J, Gibello-Perez P (2011) Adsorbent biopolymers fromtannin extracts for water treatment. Chem Eng J 168:1241–1247
109. Vazquez G, Gonzalez-Alvarez J, Freire S, Lopez-Suevos F, Antorrena G (2001) Characteris-tics of Pinus pinaster bark extracts obtained under various extraction conditions. Eur J WoodWood Prod 59:451–456
110. Dogan M, Abak H, Alkan M (2009) Adsorption of methylene blue onto hazelnut shell:kinetics, mechanisms and activation parameters. J Hazard Mater 164:172–181
111. Kumar KV, Porkodi K, Rocha F (2008) Isotherms and thermodynamics by linear andnon-linear regression analysis for the sorption of methylene blue onto activated carbon:comparison of various error functions. J Hazard Mater 151:794–804
112. Kumar KV, Sivanesan S (2006) Pseudo second order kinetics and pseudo isotherms formalachite green onto activated carbon: comparison of linear and non-linear regressionmethods. J Hazard Mater 136:721–726
113. Boni A, Ferrero G (1997) Introduction to development cooperation. Politechnical Universityof Valencia, Valencia, Spain

Chapter 13Polysaccharide-Based MacromolecularMaterials for Decolorization of Textile Effluents
Vandana Singh, Tulika Malviya, and Rashmi Sanghi
13.1 Introduction
Dyes are highly dispersible aesthetic pollutants contributing to aquatic toxicity.Reminiscent or unspent dye materials are mainly responsible for the coloredeffluents from industries, and its removal is therefore a necessary and inevitablestep for the recycling and disposal of the textile industrial effluents prior to it beingdischarged into sewers. As most of the dyes are highly stable molecules which resistdegradation by light, chemical, biological, and other treatment methods, the textilewaste containing dye pollutant are difficult to treat and pose a great challenge to theexisting conventional wastewater treatment techniques. The high cost and toxic na-ture of the synthetic chemicals used in most of the conventional treatments is a majordrawback whereby the demand for the development of alternative environment-friendly treatment methods is on the rise. In recent years, usage of natural polymericmaterials to treat dye effluents has drawn considerable attention because theyare renewable, biodegradable, nontoxic, and potentially environmentally friendly.Several polysaccharides and their derivatives have been utilized in conventionalwater treatment techniques like adsorption and coagulation–flocculation. Water-soluble polysaccharides are used for coagulation–flocculation, while insolublepolysaccharide-/polysaccharide-derived materials such as cross-linked polysaccha-rides, polysaccharide composites, and chemically modified polysaccharides areused as adsorbents through which passive dye sequestration is feasible with manyadvantages over conventional techniques. To overcome the requirement of large
V. Singh (�) • T. MalviyaUniversity of Allahabad, Allahabad 211002, Indiae-mail: [email protected]; [email protected]
R. SanghiIndian Institute of Technology, Kanpur, UP 208016, Indiae-mail: [email protected]; [email protected]
S.K. Sharma and R. Sanghi (eds.), Advances in Water Treatment and PollutionPrevention, DOI 10.1007/978-94-007-4204-8 13,© Springer ScienceCBusiness Media Dordrecht 2012
377

378 V. Singh et al.
dosages of polysaccharide flocculants and to improve the stability and strength offlocs obtained with polysaccharide flocculants, attempts have been made to suitablytailor or modify the properties of the polysaccharides in obtaining macromolecularmaterials having high shear stability and improved shelf life. Such shear stable andcontrolled biodegradable flocculants are the most sought flocculants for treating theindustrial effluents and mineral-processing wastes.
13.2 Synthetic Dyes
Natural dyes are plant-sourced colored substances which are isolated from fruits,berries, bark, leaves, root, and wood of several plants. As the isolation andprocessing processes of natural dyes are time demanding and often difficult, theuse of synthetic dyes is more popular in the industry. Though synthetic dyes aretoxic, they have lower cost as compared to their natural counterparts and are able toimpart stable and bright colors to the dyed substrates. Dyes are mostly applied to asubstrate in an aqueous solution. Many synthetic dyes are now known which havealmost replaced the traditional natural dyes because of their quite low cost, vastcolor range, and good color stability.
Dyes can be classified according to the procedures used in the dying processes[1] and on the basis of the chromophoric groups they have, such as acridinedyes, anthraquinone dyes, arylmethane dyes, azo dyes, nitro dyes, nitroso dyes,phthalocyanine dyes, quinone-imine dyes, indamines, xanthine, and fluorene dyes,and their toxicity is related with their structure. Structure and dyeing details of somepopular dyes are summarized in Table 13.1 and Fig. 13.1a,b.
13.3 Dye Removal from Waste Water
Colored effluents from dye-using industries contain unspent toxic synthetic dyeswhich are frequently used by industries due to their broad color range and cost-effectiveness. Improper disposal of such effluents can pose major environmental andhealth threat; thus, decolorization of such effluents becomes an integral step of thewaste treatment process and is performed before such effluents can be dischargedinto the receiving water body. Dyestuffs are mostly highly structured polymers withlow or no biodegradability [12, 13], and the color removal mostly involves thebreaking of the conjugated bond in dye molecules [14] for which many chemicaltreatment processes such as membrane separation [11], oxidation or ozonation [13,15], electrocoagulation, chemical precipitation, adsorption by activated carbon [16],and chemical [17, 18] and photocatalytic oxidation [19] are commonly employed.Although effective, these methods are expensive and involve secondary pollutioneffects.

13 Polysaccharide-Based Macromolecular Materials for Decolorization. . . 379
Tab
le13
.1So
me
impo
rtan
tdye
type
san
dth
eir
appl
icat
ions
S.N
o.Ty
peof
dye
Stru
ctur
eD
ying
subs
trat
esD
yeba
thR
efer
ence
1.A
cid
dyes
Sodi
umor
amm
oniu
msa
ltof
asu
lfon
ic,c
arbo
xyli
c,or
phen
olor
gani
cac
id
For
colo
ring
amph
oter
icfib
ers
such
assi
lk,w
ool,
nylo
n,an
dm
odifi
edac
ryli
cfib
ers
Neu
tral
toac
id[2
]
2.B
asic
dyes
Aco
lore
dca
tion
com
bine
dw
ith
aco
lorl
ess
anio
nA
cryl
icfib
ers
and
pape
r.O
ccas
iona
lly
for
dyin
gw
ool
and
silk
fiber
s
Aci
d[3
]
3.D
irec
tdye
sPl
anar
,hig
hly
conj
ugat
edm
olec
ular
stru
ctur
esth
atal
soco
ntai
non
eor
mor
ean
ioni
csu
lfon
ate
grou
p
Hot
wat
erdy
esfo
rdy
ing
cott
on,
pape
r,le
athe
r,w
ool,
silk
,and
nylo
n
Sodi
umch
lori
deor
sodi
umsu
lfat
eis
adde
dto
the
dye
bath
s[4
]
4.M
orda
ntdy
esA
saz
ody
esan
dan
thra
quin
one
Cot
ton
and
woo
lTa
nnic
acid
,ole
ican
dst
eari
cac
ids,
and
mor
dant
s,e.
g.,s
olub
lesa
lts
ofch
rom
ium
,alu
min
um,
iron
,cop
per,
and
tin
[5]
5.V
atdy
esA
nthr
aqui
nono
idan
dth
io-i
ndig
oid
clas
sof
dyes
Dye
cott
onw
ool,
asw
ella
sot
her
fiber
sA
lkal
ine
liqu
or[6
]
6.R
eact
ive
dyes
Hav
ing
subs
titu
ents
wit
hch
rom
opho
ric
grou
p,e.
g.,
halo
hete
rocy
cle
oran
activ
ated
doub
lebo
nd
Cot
ton
and
othe
rce
llul
ose
fiber
s–
[7]
7.D
ispe
rse
dyes
Smal
l,pl
anar
,and
noni
onic
,wit
hpo
lar
func
tion
algr
oups
like
–NO
2an
d–C
N
Poly
este
r,to
som
eex
tent
for
nylo
n,ce
llul
ose
tria
ceta
te,a
ndac
ryli
cfib
ers
–[8
]
8.A
zody
esD
iazo
ortr
iazo
grou
ps[9
,10]
9.Su
lfur
dyes
Cot
ton
Sodi
umsu
lfide
orso
dium
hydr
osul
fite
[11]

380 V. Singh et al.
N
N
OH
NHAc
SO3Na
SO3Na
(A)
a
b
H3C NC+H2CH3
2C1
C
N N N N
N
N
N N
CH CH3
+
+
CH3CH3
CH3 CH3
NH3NH2
NaO3SNaO3S
CuCuOOO
O
O
O
O
NH2 NH2
NH2HN
(H)
(F)
(I)
(G)
(E)
(D)
(B)
O
OHOH N
O
O
O
NHCH3
NHCH3CH2OH
C
ONa
OH
N
NNN N
SO3NaSO3Na
SO3Na
SO3CH2SO3Na
SO3Na
CH3
CH3
Cl
Cl
Cl
C
C C
NH
HO
CH3
CH3
(C)
H3C
H3C
H3C
H3C
NaO3S
NaO3S
Fig. 13.1 (a) Structures of some of the acid and basic dyes: (A) Acid Red G; (B) Acid LightYellow 2G; (C) Methyl Green; (D) Methyl Violet; (b) Chemical structure of (E) Direct Blue 218;(F) Mordant Red 11; (G) Mordant Yellow; (H) Reactive Blue; (I) Disperse Blue

13 Polysaccharide-Based Macromolecular Materials for Decolorization. . . 381
As a step toward utilization of environment-friendly and cost-effective tech-niques, naturally occurring polysaccharides and their derivatives have been uti-lized in conventional water treatment techniques like adsorption and coagulation–flocculation. The wastewater may be considered safe to human health when thecolored impurities are removed from it which can be done either by coagulation oradsorption. Natural seed gums are good alternatives to the conventional chemicalcoagulants as their use has lesser environmental impact. The polysaccharides mayor may not be water soluble and based on their solubility, the method of choice couldbe either adsorption or coagulation. Water-soluble polysaccharide solutions areused for coagulation–flocculation, while insoluble polysaccharide-/polysaccharide-derived materials such as cross-linked polysaccharides, polysaccharide composites,and chemically modified polysaccharides find application as adsorbents.
13.3.1 Coagulation–Flocculation
In wastewater treatment process, the coagulation and flocculation are used toseparate suspended solids from water. Coagulation is the destabilization of colloidsby neutralizing the forces that keep them apart, while flocculation is the actionof polymers to form bridges between the flocs and bind the particles into largeagglomerates or clumps [20]. For the primary treatment of wastewater, coagulation–flocculation [18] chemical method is usually employed where alum [21] andpolyaluminium chloride (PAC) [22] are commonly used as coagulants though manyother organic and inorganic flocculants are known for treatment of colored effluents.The effectiveness of these coagulants is highly pH dependent, and the finishedwater thus obtained has a contamination of residual aluminum. Moreover, theprocess results into a significant amount of sludge which further complicates thehandling and disposal procedures. The cost of importing alum and other requiredchemicals for conventional treatment processes may often be detrimental andsometimes prohibitive for developing countries. Currently, polymeric flocculants,synthetic as well as natural, have become more acceptable in industrial effluenttreatment processes because of their inertness to pH changes, handling comfort andeffectiveness.
Synthetic polymers behave as effective flocculants due to their versatile tai-lorability, but they normally have poor shear stability. Economically viable alter-native of these polymeric flocculants may be the natural polymers [23, 24] whichare locally grown and harvested [25, 26]. These are low-cost, nontoxic, and highlybiodegradable materials endowed with sufficient shear stability. Since the timeimmemorial, the use of natural coagulants for water clarification is known, e.g., theseeds of the Nirmali [27] and seeds of Moringa oleifera [28] tree are known toclarify turbid surface water. Seed extracts from Nirmali (Strychnos potatorum),tamarind (Tamarindius indica), guar (Cyamopsis psoraloides), red sorella (Hibiscussabdariffa), fenugreek (Trigonella foenum), and lentils (Lens esculenta) behaveas effective coagulant aids at high raw water turbidities and can reduce required

382 V. Singh et al.
alum doses by 40–50% [27]. Cassia tora and Cassia angustifolia polysaccharideswhich are structurally related to guar gum have also been utilized as coagulant aids[23, 29]. These alternative naturally occurring coagulants have several advantagesover those synthesized conventionally like alum. Their use considerably reduces thesludge volume in comparison to what is produced with alum; additionally, thenatural alkalinity is not consumed during the treatment process.
Natural coagulants extracted from plants or animals [30] are thus workablealternatives to synthetic polyelectrolytes because of their biodegradability andbiocompatibility. Their use is safe to human health, and they have a wider effectivedosage range for flocculating various colloidal suspensions. They are also cost-effective as they are isolated and harvested from locally grown plants. It has alsobeen possible to develop efficient, shear stable, and less biodegradable flocculantsby modifying the synthetic polymers by grafting, e.g., grafting of poly(acrylamide)onto the rigid backbone of the natural polysaccharides [31].
13.3.2 Adsorption
In removing contaminants from the effluent of dye-using industries, adsorptionmethod is very effective as it can completely remove dyes even from dilutedsolution. Insoluble materials can be used as adsorbents for dyes and other pollutantsunder aqueous conditions. The removal is either physisorption or chemisorptiondepending upon the adsorbent type and structure. Besides conventional sorbentssuch as fly ash, carbon, and silica gels, many biosorbents have been developedfor the removal of dyes from the effluents. Commercially available sorbentsare expensive, besides their regeneration produce small additional effluent. Thiswarranted the utilization of several biosorbents for dye removal. Biosorptionis a rapid phenomenon of passive dye sequestration by the adsorbents developedfrom biomass. Numerous cost-effective biosorbents have been worked out [32] asalternatives of conventional adsorbents.
Removal of dyes through these biosorbents has many advantages compared withconventional techniques [33]. Among other, polysaccharide-derived sorbents arevery effective in dye removal from wastewater. Binding sites in these sorbentsmay be either the appropriate functional groups, e.g., grafted polysaccharides orthe porosity, e.g., polysaccharide clay or silica composites. Various polysaccharideshave been converted to insoluble materials which can be used under aqueousconditions as sorbents or certain water-soluble polysaccharides may find suchapplication as such, e.g., chitosan (insoluble at neutral pH), cellulose, etc. Cross-linking of the polysaccharide macromolecules is the one of the most commonway to turn them insoluble for such applications. This can also be achieved byintroducing synthetic polymeric graft chains whereby solubility of a polysaccharidemay be tailored for the targeted adsorption application. Traditional dye adsorbentsare bauxite and Fuller’s earth.

13 Polysaccharide-Based Macromolecular Materials for Decolorization. . . 383
This chapter summarizes the use of polysaccharides and polysaccharide-derivedmacromolecular materials in dye removal from industrial wastes along with adetailed discussion on the advantages of using these materials for the remediationof industrial wastes over conventional polymeric materials. The discussion has beensubdivided polysaccharide-wise for easy understanding and clarity. The followingsection presents a brief description of polysaccharides.
13.4 Polysaccharides
Polysaccharides are stereoregular, abundant natural polymers of sugars with uniquebiological and chemical properties. They are biocompatible, nontoxic, biodegrad-able biopolymers, possessing high chemical reactivity, polyfunctionality, chirality,and chelating properties. The polysaccharide materials can be exploited for thefabrication of excellent adsorbents [34] as they possess (1) hydroxyl groupswhich makes them hydrophilic, (2) a large number of reactive functional groups(acetamido, primary amino, and/or hydroxyl groups) depending upon the polysac-charide type, and (3) flexible structure of the polysaccharide chain.
Among the known polysaccharides, starch is the most abundant. It is known toexist in nature as energy reserve for living plants as the mixtures of two polyglucans,amylopectin and amylose; both of them are homoglycans as they contain only asingle type of carbohydrate, glucose. Other important and abundant polysaccharidesare the chitin, chitosan, and cellulose. Both starch and chitin are safe for humans andpossess several characteristics and advantages that are suitable for their exploitationin deriving excellent materials for industrial use [35]. The type of derivatization ischosen depending upon the desired application of the final material. In deriving aflocculant for wastewater or a derivative which can be used as additive in papermanufacturing, a random conversion of hydroxyl groups of starch to aminopropyl[36], hydroxyalkyl [37], or betaine [38] is done, while for the adsorbent resins arigid macromolecular structure is necessary.
Like chitosan and starch, guar gum and other nonconventional galactomannanshave also been utilized for water remediation application such as metal ionand dye removal from wastewater. Galactomannans are water-soluble hydrophilicheterobiopolymers of galactose and mannose. The ratio of galactose to mannose inguar gum is 1:2 while this ratio varies in other nonconventional seed gums isolatedfrom Cassia and Ipomoea plants. For particular genera, this ratio varies from speciesto species and also with climatic distribution of the source plant. In the recent pastmany of the Cassia polysaccharides [23, 31] have been evaluated for dye removalfrom wastewater in their natural as well as in derived form.

384 V. Singh et al.
H
H
NH2
NH2CH3
O
C y
NH2n
NH2H
H
H
H
H
H H
H
H
H H
H
H
O
O
OO O
x
O
O
O
OO
OHOH
OH H OH
OHHO
OH
HO
HO
HO HOHN
HO
Fig. 13.2 Chemical structure of chitosan and chitin
13.4.1 Chitin and Chitosan
Chitin (Fig. 13.2) is the exoskeletons material of molluscs and insects and consti-tutes the cell wall of some fungi. It is the main component in the shells of crus-taceans, such as shrimp, crab, and lobster, and is the characteristic polysaccharideof several important phyla, e.g., Arthropoda, Annelida, Mollusca, and Coelenter-ata and of many fungi such as ascomycetes, zygomycetes, basidiomycetes, anddeuteromycetes. The polymer contains 2-acetamido-2-deoxy-ˇ-D-glucose linkedthrough a ˇ(1 ! 4) linkage. It is structurally related to cellulose and differs fromcellulose in having acetamido group at position C-2 in place of hydroxyl groupspresent in cellulose. Chitin may now be produced commercially at low cost sincesuch wastes (shrimp, lobster, crab shells) are abundantly available in nature.
Much attention has been paid to chitosan as a potential polysaccharide resource[39] for deriving macromolecular materials effective in wastewater treatment. Therehave been tremendous efforts for preparing functional derivatives of chitosanthrough chemical modifications [40–43]; however, only few among these are knownto dissolve in conventional organic solvents. In column studies, powder form orflakes of chitin and chitosan is mostly used in which, after certain time, there is asignificant drop in the column pressure [44], and to avoid this drop, the use of chitinand chitosan beads is preferred.
Chitosan (Fig. 13.2) is derived from chitin through N-deacetylation, and therehas been recent attraction for this material in deriving macromolecular materialsof interest in water remediation. Though presence of amino group makes thispolysaccharide very versatile for chemical modifications and cross-linking, aminogroups restrict water solubility of the biopolymer at neutral pH. It is only soluble inaqueous solutions of some acids and through some selective N-acylations [45].

13 Polysaccharide-Based Macromolecular Materials for Decolorization. . . 385
13.4.1.1 Chitosan-Derived Materials
Chitosan and chitin are among the most used polysaccharides for water remediationapplication. These polysaccharides in their native or derived form have high affinityfor many classes of dyes [46]. These bioadsorbents being versatile materials havebeen used in different forms, from flake types to gels, bead types, or fibers. Thoughseveral disadvantages are associated with the use of natural chitin and chitosan, theiruse for water remediation is very well reported. The adsorption properties of thesenatural polysaccharides depend on the chitin source from which chitosan is derived,its degree of N-acetylation, molecular weight, and solution properties, and alsovary with crystallinity, affinity for water, percent deacetylation, and amino groupcontent [47]. All these parameters, as determined by the selection of the preparationconditions, control of the swelling and diffusion properties of the biopolymer thatfinally influence the characteristics of the biomaterials. Performance is dependenton the type of material used, and the efficiency of adsorption depends on theaccessibility of sorption sites. The dye uptake by chitin and chitosan is stronglypH dependent. Complicated structures of dyes are the deciding factor for uptakeof the dyes by these polysaccharide materials [48]. The dye uptake mechanism ismostly controlled by intraparticle diffusion [49] though reports on ion-exchangemechanisms are also proposed. The major adsorption site of chitosan is a primaryamine group which is easily protonated to form –NH3
C in acidic solutions. Thestrong electrostatic interaction between the NH3
C groups and dye anions can beused to explain the sorption mechanism [50]. The degree of adsorption by chitosanis different for different dyes depending upon their chemical structures [48]. Ingeneral, chitosan-based materials have been established as promising biosorbentsfor adsorption processes.
Chitosan can remove dissolved dyes from aqueous solutions in single systemsof dyes [48, 51, 52], especially in the removal of acid [48] and reactive dyes [49].Maximum adsorption capacities of chitosan [48] for acid orange 12, acid orange10, acid red 73, and acid red 18 dyes have been evaluated to be 973.3, 922.9,728.2, and 693.2 mg/g, respectively. Mahmoodi et al. [53] studied dye removal fromcolored textile wastewater using chitosan in single as well as binary dye systems.The removal of combination of Direct Red 23 and Acid Green 25 has been studied[53] by evaluating chitosan as an effective biosorbent for the removal of anionicdyes. The adsorption kinetics of dyes followed a pseudo-second-order kinetic modelat various pH values. The biopolymer was suitable for decolorizing acidic-coloredtextile wastewater having low concentration of the dyes.
Though both chitosan beads and flakes are effective in adsorbing dyes fromaqueous solution, chitosan beads show better results and faster kinetics [49, 54].Performance of the chitosan also depends on the source of fishery wastes fromwhich it has been derived. The maximum adsorption capacity for Reactive Red222 by chitosan flakes and beads have been showed to be 293 and 1103 mg/g,respectively. Owing to high performance of chitosan in bead form, chitosan beadshave been extensively used for the removal of dyes [49, 54–57]. The high surface

386 V. Singh et al.
area of chitosan beads as compared to flakes explains the better performanceof the beads. In general, both batch-contacting and column processes have beenundertaken for the dye removal using chitosan [58]. Chitosan nanoparticles (particlesize D 180 nm; degree of deacetylation D 74%) have been used for the removal[51] of Acid Green 27 (AG27), from an aqueous solution. The dye concentrationat equilibrium (Qe, mg/g) was calculated using the weight of the nanoparticles inthe mixed solution (Qes) and the weight of chitosan in the nanoparticles (Qep). TheLangmuir monolayer adsorption capacity (Q0) with Qes and Qep was found to be1051.8 and 2103.6 mg/g, respectively, which were much ahead of micron-sizedchitosan.
13.4.1.2 Chitin Gels
Chitin gels obtained by N-acetylation of chitosan in water–alcohol mixtures [59]have also been used in the dye removal, e.g., as Acid Blue 74, Reactive Violet5, or Direct Red 28. Three kinds of transport mechanisms were investigated: (1)the sorption of solutes interacting with chitin, (2) the desorption of solutes withoutsignificant interaction with the chitin, and (3) osmosis phenomena. The sorption ofAcid Blue 74 and Reactive Violet 5 depended on the charge density of the polymernetwork which was governed by the degree of association, pH, and the dielectricconstant of the media. The sorption of Direct Red 28 has been attributed to thehydrophobic interactions and H-bonding at the extreme surface of the gel.
13.4.1.3 Chitosan-Derived Materials
Several derivatives of chitosan are known for effective removal of dyes fromwastewater. Chitosan biomolecule is usually modified to obtain improved solubilityin acidic and alkaline media in addition to solubility in some of the organic solvents.Many such modifications usually target for increase in the temperature and pHdependence of the dye adsorption. Most frequent and common method for chitosanmodification is its cross-linking that enhances the performance of this biopolymerwhile maintaining its properties and original characteristics. Chemical modificationin general improves the performance of chitosan besides increasing sorptionselectivity, diffusion properties, and sensitivity to environmental conditions. Someof the common chitosan derivatives that have been utilized for dye removal are beingsummarized below.
Cross-Linked Chitosan
As chitosan is soluble in acidic media (due to its amino groups), its use as adsorbentunder aqueous acidic conditions is not feasible. To change its solubility, many

13 Polysaccharide-Based Macromolecular Materials for Decolorization. . . 387
O
O
O
O
O
N
N
O
O O
O
O
OO
O
O
O
O
O
O O
O
OH
OH
OH
OH
OH
NH2
NH2
NH
OH
OH
OH
OH
HNO
O
OH
OH
OH
OH
a
c
b
Fig. 13.3 Schematic representation of cross-linked chitosan beads: Chitosan-EPI, Chitosan-GLA,Chitosan EDGE (Reprinted from Crini et al. [60]. With kind permission of © Elsevier)
physical and chemical methods have been used, and among the various possibleroutes for modifying chitosan properties for the target application, cross-linkingis the best option. Modification of the chitosan through cross-linking is known tobe an inexpensive and easy route for fabricating chitosan-based biosorbents. Oncross-linking, chitosan turns insoluble in aqueous acidic or alkaline media andmost of the organic solvents. Such cross-linked derivatives are more resistant totemperature and low-pH conditions as compared to the native chitosan. It hasbeen reported that cross-linked chitosan macromolecular materials perform well indye removal as they are least affected by the environmental conditions [34]. Thebiomolecule has been cross-linked in the bead form using three common cross-linking agents, e.g., glutaraldehyde, epichlorohydrin, or ethylene glycol diglycidylether [50, 61, 62] (Fig.13.3). Among these three cross-linked chitosan beads, thechitosan–epichlorohydrin beads [62] show best performance for dye uptake. Cross-linked chitosan beads show outstanding removal capabilities for direct dyes and

388 V. Singh et al.
exhibit excellent performance for adsorption of anionic dyes when compared toactivated carbon (�3–15 times better) at the same pH [50], while cross-linkedchitosan show low affinity for cationic (basic) dyes.
A novel biosorbent, more hydrophilic than synthetic resins, has been developedwhere cyclodextrins and chitosan have been combined with several spacer armswithout affecting the selectivity of both biopolymers. This biosorbent has been usedfor the decontamination of effluents containing the textile dyes [63]. The chitosan–cyclodextrin beads were characterized by a rate of sorption, and their efficiencywas superior to that of the parent polysaccharide chitosan bead without CD andof the cross-linking cyclodextrin–epichlorohydrin gels. The maximum adsorptioncapacities of cross-linked cyclodextrin and chitosan, cyclodextrin mixed sorbentsfor Acid Blue 25 were 249, 88, and 77.4 mg/g, respectively.
Chemically Modified Chitosan
Though cross-linked chitosan has tremendous use in adsorbing anionic dyes, it is notof much help in the removal of cationic dyes. Useful adsorbents for cationic dyeshave been derived by modification of chitosan functional groups such as enzymaticgrafting of carboxyl groups [64]. The presence of carboxylic acid functional groupsat grafted chitosan beads offer more surface polarity and sorption site density toimprove the sorption selectivity of the basic dyes.
In general, grafting increases the efficiency of chitosan macromolecule (CTS)toward dye uptake especially the cationic dyes [64]. Four kinds of phenolderivatives: 4-hydroxybenzoic acid (BA), 3,4-dihydroxybenzoic acid (DBA),3,4-dihydroxyphenyl-acetic acid (PA), and hydrocaffeic acid (CA) have beengrafted at chitosan using tyrosinase enzyme. The grafting was followed by takingFTIR spectra of the graft copolymers. The carboxyl groups content in the graftedchitosan were measured to be 46.36 for BA, 70.32 for DBA, 106.44 for PA,and 113.15 for CA. In a batch adsorption experiment, these modified chitosansproved efficient in removing cationic dyes such as crystal violet (CV) at pH 7 andBismarck brown Y (BB) at pH 9 at 30ıC. Unilayer adsorption was established forthe adsorption where the maximum adsorption capacities for both the dyes were inthe following order: CTS-CA>CTS-PA>CTS-DBA>CTS-BA.
Vinyl modification of chitosan (Fig. 13.4) also proved very useful forderiving bioadsorbents from chitosan. Poly(methyl methacrylate)- [65] andpoly(acrylamide)- [66] grafted chitosan have been evaluated for removing dyes.Chitosan-graft-poly(methyl methacrylate) (Ch-g-PMMA) proved efficient inadsorbing anionic azo dyes such as Procion Yellow MX, Remazol BrilliantViolet, and Reactive Blue H5G. The copolymer showed better performance thannative chitosan in terms of uptake of anionic dyes from synthetic dye solutionsand real textile wastewater. Unlike chitosan, which worked best at pH 4, Ch-g-PMMA worked well in a broad pH range (pH 4–10). The concentration of thedyes and temperature of the adsorption experiment also had a marked effect on

13 Polysaccharide-Based Macromolecular Materials for Decolorization. . . 389
OH
X=CONH2Y = H Polyacrylamide grafts
X=COOMe;Y = Me Polymethylmethacrylate grafts
HO
OH
HO
H2CH2C
H2 H2
X XXX
YY
YY
(A)
(B)
C CC
CCC
NHNH
OO O
H
O
O
Fig. 13.4 Vinyl-graftedchitosan. (A) Chitosan-graft-poly(acrylamide); (B)Chitosan-graft-poly(methylmethacrylate)
the dye uptake. On increasing %G in the copolymer, uptake of the dyes couldbe significantly enhanced which confirmed the role of the graft chains in theremoval mechanism. The dye uptake by the copolymer was fast and could reach theequilibrium in just �3 h. The adsorption equilibrium data for the dye adsorption bestfitted to pseudo-second-order kinetic model indicating chemisorption was takingplace. The adsorbent affinity toward the dyes was in the order violet> yellow> bluefor both chitosan and Ch-g-PMMA.
Another grafted chitosan, chitosan-graft-poly(acrylamide) (Ch-g-PAM) [66] hasalso proved equally effective in the removal of anionic dyes from real textilewaste and synthetic dye solution. This modification also broadened the pH rangeof adsorption (pH 2–8), but adsorption by this copolymer had slightly higherequilibrium time (6 h) than that by Ch-g-PMMA. Chemisorption governed theadsorption, and the copolymers had reusability for almost ten consecutive cycles.Thus, overall, it may be concluded that by introducing vinyl grafts, chitosan may beconverted to useful and effective biosorbent for anionic dyes.
Chitosan Composites
A more recent approach to utilize chitosan for dye removal involves the prepa-ration of chitosan composites [67]. Many chitosan composites have been usedfor dye removal, e.g., chitosan clay composites [67–72], chitosan/polyurethanecomposites [73], chitosan/oil palm ash composites [74], chitosan/silica [75–77], andchitosan/titania composites [78].
Chitosan–Clay Composites
Montmorillonite (a natural phyllosilicate)–chitosan composite showed efficientremoval of Congo red dye [70]. The adsorption property of the composite wasdecided by the optimum molar ratio of chitosan to montmorillonite in the composite.X-ray analysis of the composite revealed intercalation of chitosan macromolecules

390 V. Singh et al.
in between the montmorillonite interlayers which disrupt the crystalline structure ofmontmorillonite. Electrostatic attraction and chemisorption mechanisms were foundto be responsible for the sorption [70]. At low pH values, electrostatic interactionis possible between the protonated amino groups at chitosan and anionic dyes;however, at alkaline pH, the excessive amount of hydroxyl ions compete withthe anionic dyes for the active sites at the composite and reduce the dye uptake.Chemisorption was suggested to be the sorption phenomenon as the adsorptionkinetic data followed pseudo-second-order kinetics. The monolayer adsorptionsuggested as the adsorption equilibrium data could be successfully modeled usingLangmuir isotherm with an Qmax value of 54.52 mg/g.
Chitosan/activated clay composite beads [68] have been fabricated, and it wasfound that the addition of activated clay can enhance the hardness of the chitosanbeads which agglomerate easily to facilitate the separation of the adsorbents fromthe solution without swelling. The adsorption studies of Methylene Blue andreactive dye (RR22) onto chitosan composite revealed that the composites had acomparable adsorption to chitosan beads.
Cross-linked chitosan/bentonite composites [67] have been used to adsorbtartrazine azo dye. Bentonite contains a high proportion of swelling clays consistingof SiO2, Al2O3, CaO, MgO, Fe2O3, Na2O, and K2O [79, 80] and is a 2:1 typealuminosilicate [81]. The chitosan composites, cross-linked with epichlorohydrin,had improved performance as adsorbent over native chitosan composite [34].A cross-linking agent stabilizes chitosan in acid solutions to make it insoluble.It has been established [67] that the pH of the tartrazine played a crucial role inthe adsorption process. As pH was increased, the surface of the adsorbent becamenegatively charged to increase repulsion between tartrazine and the adsorbentsurface which decreased the adsorption capacity of the composite.
Using kaolinite (1:1 aluminosilicate, consisting of SiO2, Al2O3, and H2O) [69]and Fe2O3 [72] a composite bead was prepared. Scanning electron microscope(SEM) and tunneling electron microscope (TEM) images revealed many pores andpleats on the surface of the composites that were attributed to be the active sitesfor dye entrapment. The composites exhibited good adsorption ability for methylorange at pH 6. Addition of anions depressed the adsorption of methyl orange thatwas due to preferred adsorption of anions over methyl orange.
Chitosan/Polyurethane Composites
Chitosan/polyurethane composite [73] has been used for the removal of Violet48 dye. Chitosan can be easily immobilized into the polyurethane matrix foamat 0.25 wt.% of glutaraldehyde concentration [82]. SEM analysis revealed thatthe composite had an open structure [83, 84] which can be responsible for itsaccessibility to acid dyes [82]. It was observed that the adsorption capacity ofneat polyurethane was relatively lower than the composite indicating that the aminegroups of the neat polyurethane are unable to specifically react to an active site ofthe dye.

13 Polysaccharide-Based Macromolecular Materials for Decolorization. . . 391
Chitosan/Oil Palm Ash Composites
Cross-linked chitosan/oil palm composite beads [74] have been used to removeReactive Blue 19 by adsorption. The dye uptake was dependent on pH, at lowerpH the protonated amino groups of chitosan are electrostatically attracted by thenegatively charged dye molecules while at pH >10, the adsorption capacity ofchitosan beads declines because of the decrease in porosity whereby the porediameter makes transfer of dye molecules difficult.
Chitosan/SiO2 Composite
Chitosan/SiO2 and chitin–silica composites have been developed for the removal oftoxic metals and dyes [75–77]. Acid-catalyzed polymerization of tetraethoxysilanein presence of chitosan furnished the sol–gel-derived hybrid composites [76]. Thecomposite was tested for the removal of dyes having different chemical properties,toxicity, and industrial applications like the Remazol Black B, textile and fooddye (Erythrosine B), biological dye (Gentian Violet), and biological and chemicaldye (Neutral Red). The polysaccharides in the form of silica hybrid hydrogels hadcomplete compatibility with the ethanol that was released during the hydrolysisof tetraethoxysilane. In both matrices, chitosan and chitin retain their capabilityof dye removal inside the SiO2 network while the composites at the same timeenjoy the improved mechanical properties in comparison to native polysaccharides.The adsorption was found to be pH dependent which indicated a spontaneouscharge-associated interaction mechanism of dye adsorption. The composite had bothpolysaccharide and silica network affinity for the dyes.
Chitosan/TiO2
TiO2/chitosan microporous composites [78] have been used for adsorption anddegradation of two reactive dyes, Methylene Blue (MB) and Benzopurpurin (BP),from aqueous solutions. An irreversible adsorption that decreases with the increaseof temperature was indicated for these dyes.
Since the traditional methods of extraction of chitin and its conversion to chitosangenerate large quantities of waste, it is difficult to develop chitosan-based materialsas adsorbents at an industrial scale. Though a huge volume of published articlesis available on using chitin and chitosan for dye removal, there has been littleunderstanding on the sorption mechanisms since these articles mostly focus on theevaluation of sorption performances. Mainly ion-exchange interactions, hydropho-bic attraction, and physical adsorption are said to be operating simultaneously inmost of these sorption processes. Wide ranges of chemical structures, pH, saltconcentrations, and presence of ligands often add to the complication.
13.4.1.4 Starch and Cyclodextrins
Starch is a low-cost abundantly available renewable biopolymer which has a widerange of applications in its native and modified form. In its crude form, starch is

392 V. Singh et al.
a mixture of amylose and amylopectin. Amylose is a linear polymer of 1,4-linked˛-D-glucopyranosyl units [85], while amylopectin is a highly branched polymer ofD-glucopyranosyl residues linked together mainly by 1 ! 4 linkages with 1 ! 6bonds at the branch points [86]. Adsorptions by starch based materials are reportedto take place by physical adsorption, complexation, and ion-exchange interactions[87, 88]. Cyclodextrins are the cyclic derivatives of starch; three smallest cyclodex-trins, alpha-cyclodextrin, beta-cyclodextrin, and gamma-cyclodextrin, having six,seven, and eight ˛-1,4-linked D-glucopyranose units, respectively, are well knownand are commercially used. Use of cyclodextrins as low-cost sorbents is wellstudied [87].
Cyclodextrin hydroxyl groups are utilized to cross-link with coupling agents likeepichlorohydrin to form water-insoluble cross-linked networks. As the cross-linkingunits are hydrophilic in nature, the cross-linked cyclodextrins have remarkablyhigh swelling capacity in water, which allow the swelling of their network for afast diffusion of the pollutants. They also contain hydrophobic sites for trappingnonpolar dyes efficiently [87]. Cross-linked starch polymers [88] having aminegroups have also been reported (Fig. 13.5).
The cross-linked polymers have been prepared in one step by reticulation ofstarch-enriched flour using epichlorohydrin with NH4OH. Using this biosorbent,in a column experiment, several hundred ppm of dyes could be effectively removedfrom water. The control of the cross-linking reaction offers control on the material’sproperties in terms of the sorption. The adsorption by this material was highlydependent on pH as protonation of the amine groups on the surface of the sorbent ispossible only at acidic pH.
Amphoteric starch has also been used for dye removal [89–91]. Such starchderivatives being amphoteric (containing cationic or anionic groups) in nature canquickly remove pollutants. Starch has been modified to amphoteric starch deriva-tives [92] having quaternary ammonium and carboxymethyl groups by semidryreaction. These derivatives have been used for cationic and anionic dye uptake andare suitable for both acid and basic dyes. Cross-linked starch was first etherified byreacting with 65% 3-chloro-2-hydroxypropyl trimethylammonium chloride for 2 hat 80ıC in a cylindrically shaped reactor with a mechanical stirrer. The resultingproduct after rinsing and neutralization with 80% ethanol solution containinghydrochloric acid was carboxymethylated using a fixed dose of chloroacetic acidwith 30% water in the whole reaction system at 45ıC. Nitrogen content and thequaternary ammonium groups of the adsorbent have been used for interacting withacid dyes, while basic dyes interact with carboxymethyl groups. It was found thatthe low temperature facilitates the adsorption of acid dyes while the basic dyes havethe highest adsorption capacity at 303 K. Both Langmuir isotherm and Freundlichisotherm models were well applied for the adsorption, and the kinetic study showedthe pseudo-second-order model for the adsorption, indicating chemisorption. Untilnow, there are only limited data on the adsorption of dyes onto amphoteric starch,and this area of investigation need further investigations in terms of their use for theremoval of dyes.

13 Polysaccharide-Based Macromolecular Materials for Decolorization. . . 393
O−O
O
O
O
CH2O [CH2 [CH2
OO
O
OO
CH2OH
CH2OH
OO
OO
O
O
OO
OO
OOO
O
O
O
OO
O
OO
O
OO
O
O
O
N
N
N
N
N
N
N
CH2
CH2
CH2
CH2
CH2CH2
CH2
CH2
CH2CH2
CH2
CH2
CH2CH2
CH2
CH2
CH2CH2
CH2
CH2
CH2]2]n
CH2CH2CH2
CH2
CH2
CH2
CH2
CH2
CH2
CH2
CHOH
CHOH
CHOH CHOH
CHOH
CHOH
HOH2C
CHOH
CHOH
CHOH
CHOH
CHOH
CHOH
CHOH
CHOH
CHOH
CHOH
CH2OH
CH2O
CH2O
CH2O
CH2OHCH2OH
CH2OHCH2OH CH2OH
CH2O
CH2O
CH2O
CH2OH
CH2
CH2
CH2O
CH2O
CH2O
CHOH
CHOH
CHOH
CHOH
HO
OH
OH
OHOH
OH
OH
OH
OH
OHOH
OH
OH
OH OH
OH
OHOH
OH
OH
OH
OH
OH OH OH
OH
OHOH
OH
OH
Fig. 13.5 A possible structure of cross-linked starch containing tertiary amine group (Reprintedfrom Crini et al. [60]. With kind permission of © Elsevier)
In spite of varied characteristics and properties of starch-based derivatives, alimited number of dye adsorption studies using this polysaccharide material havebeen carried.
13.4.1.5 Seed Gums as Coagulants
Using natural seed gums as a replacement coagulant for proprietary coagulants canmeet the need for water and wastewater technology in developing countries which

394 V. Singh et al.
is simple to use, robust, and cheap to both install and maintain. Natural coagulantshave been used for centuries in traditional water treatment practices throughoutcertain areas of the developing world. The utilization of Cyamopsis tetragonolobus(family Leguminosae) seeds for this purpose is an event which has resulted in theemergence of one of the most important plant-based industries of India and hascontributed in its economic development. This galactomannan, known as guar gum,has found varied uses in modern industries throughout the world. Guar has USPublic Health Service approval in potable water treatment as coagulant aid togetherwith alum, ferric sulfate, and lime.
Polymeric flocculants, synthetic as well as natural, because of their naturalinertness to pH changes, low dosage, and easy handling, are becoming popularin industrial effluent treatment. Among natural and synthetic polymers, syntheticpolymers are very effective due to their versatile tailorability, but they have poorshear stability. Natural polymers are of low cost, shear stable, nontoxic, andhighly biodegradable. It has been possible to develop efficient, shear stable, andless biodegradable flocculants by grafting synthetic polymers like polyacrylamidebranches onto the rigid backbone of the natural polysaccharides. The danglinggrafted chains have easy approachability to contaminants in effluents.
Tamarind Gum
Tamarind trees are known to be rich in mucilaginous content. The native tamarindgum and its graft copolymers are widely used as flocculant in color removal [93]of industrial effluents. Poly(acrylamide) grafting increases the shelf life of tamarindseed mucilage though the graft copolymer (Tam-g-PAM) still remains biodegrad-able. Compared to native tamarind gum, Tam-g-PAM showed better flocculationefficiency in the removal of dyes. Tamarind gum-derived flocculants show betterperformance for azo and reactive dyes than basic dyes and are attractive because ofits low cost and biodegradability as compared to other synthetic flocculants.
Psyllium Seed Gum
Psyllium (Plantago ovata) [94] is a profusely branched medicinal plant whose seedhusk [95] has been used as traditional and herbal medicine. The psyllium seeds arecoated with mucilage (10–30%), a gelatinous material which swells upon exposureto moisture. Chemically, Psyllium seed husk is xylan which occurs in associationwith cellulose. The seed husk [96] has been evaluated for the decolorized threedifferent synthetic dyes: direct – Kahi Green (DKG), acidic – Sandolan Red RSNI(ASR), and reactive – Procion Brilliant Blue RS (PBB) dyes at laboratory scale. Itsdose and pH were found two important factors [97] that governed the coagulationmechanism. Psyllium husk proved very effective for the decolorization of anionicdyes when used with polyaluminium chloride.

13 Polysaccharide-Based Macromolecular Materials for Decolorization. . . 395
Removal of color from dye solutions generally takes place by physiochemi-cal mechanisms of coagulation and/or chelation-complexation-type reactions [98]which were found to be mainly of physiochemical nature. The structure of thedyes is such that they may result in a chelation–complex formation with chemicalcoagulants that leads to the formation of insoluble complexes between metal anddye. The complex may either precipitate from solution or may be removed byadsorption onto metal hydroxy species [98]. The color removal was suggested by ag-gregation/precipitation and adsorption of coloring substances onto the polynuclearcoagulant species [99] and onto hydrated flocs [100]. DKG was easily decolorizedby psyllium as coagulant aids whereas the decolorization of ASR was found to bemoderately effective. The reactive dye, which is the most difficult to remove byconventional methods, could also be decolorized to a large extent using the psylliumseed gum. Psyllium gum though much less efficient than PAC when used asa coagulant aid with a very low dose of PAC becomes much effective for thedecolorization of the dyes.
Guar Gum
Traditional water treatment utilizes the natural coagulants [101] for centuries.The galactomannan from seed of Cyamopsis tetragonolobus N.O. Leguminosae ispopular as coagulant, the guar gum increases the size of the floc initially formed bythe coagulant, thereby increasing the rate of setting of solid impurities, reducingsolid carry over to the filters, and increasing periods between backwashes. Inindustrial waters, guar flocculates clays, carbonates, hydroxides, and silica whenused alone or in conjunction with inorganic coagulants. The gum helps in increasingthe size of the flocs which is initially formed by the coagulant. In industrialwaters, guar has been used to flocculate clays, carbonates, hydroxides, and silicaindividually or in conjunction with inorganic coagulants.
Ipomoea Seed Gums
The seed galactomannans of Ipomoea genera N.O. Convolvulaceae have been usedas coagulants and for the decolorizing of textile dye effluents [29]. Physicochemicaland chemical studies showed that the protein-free Ipomoea seed gum exhibits simi-lar behavior to the guar galactomannan. These seed gums on chemical modificationsproduce materials which can be modified to fine products [25, 102] having a broaderspectrum of properties for various industrial applications. The decolorization [103]of three different classes of synthetic dye was undertaken on laboratory scale withIpomoea seed gums and their poly(acrylamide) derivatives [104]. The Ipomoea seedgums from Ipomoea turpethum (IT) [105], Ipomoea dasysperm [24], and Ipomoeaquamocalit (IQ) in comparison to guar gum (GG) [103] have been used for thecoagulation studies. Structure of the repeating units of some of seed gums is shownin Fig. 13.6.

396 V. Singh et al.
a-D-Galp
a-D-Galp
a-D-Galp
a-D-Galp
[4-b-D-Manp-(1
b-D-Manp-(1-[
4)-b-D-Manp 1-]n
4)-b-D-Manp 1-]n
4)-b-D-Manp 1-]n
[4-b-D-Manp-(1
[4-b-D-Manp-(1
4)-b-D-Manp-(1-]2 4)-b-D-Manp-(1-[ 4)-b-D-Manp 1-]2
4)-b-D-Manp (1
1
1
1
1
6
6
6
6
a
b
c
d
Fig. 13.6 Structures of the repeating units of seed gums. (a) Ipomoea turpethum, (b) Ipomoeaquamoclit, (c) Guar gum, (d) Ipomoea turpethum
Coagulation experiments were done with taking conventional coagulant PAC asreference [22]. Among the varied coagulation parameters, coagulation dose andcoagulation pH were found to be the most important factors which influenced thetypes of hydrolysis products and therefore the coagulation mechanism. These seedgums when used as coagulant aid with a very small dose of PAC could effectivelyremove each class of dye as compared to when PAC was used alone.
Ipomoea dasysperma seed gum is a galactomannan polysaccharide having galac-tose to mannose ratio in 1:6 ratio [24]. The seed gum has a branched structure havinga linear chain of ˇ(1 ! 4)-linked mannopyranosyl units to which D-galactose sidechains are attached by ’(1 ! 6) linkages. The decolorization of dye solutions bycoagulation with ID seed gum [24] is dependent largely on the type of dye, pH,and coagulant dosages, pH 9.5 being the optimum. The seed gum showed the mostefficient removal of the direct dyes, while when used with a very low dose of PAC,the utility of the biosorbent was extended for acid as well as Procion dye. The naturalgalactomannans from guar gum and ID gum offer a sustainable method of effluenttreatment, as these gums are low cost and are readily available.

13 Polysaccharide-Based Macromolecular Materials for Decolorization. . . 397
Cassia Seed Gums
Cassia is an abundantly available plant of tropical countries including India.These plants are a good source of mucilages, flavonoids, anthraquinones, andpolysaccharides. C. javahikai seed gum was the first seed gum from Cassiaplant that has been investigated as a coagulant in textile wastewater treatment.Its seed endosperm contains a nonionic, water-soluble galactomannan having 1:2galactose to mannose ratio [106]. Like guar gum, the seed gum has a branchedstructure consisting of a linear chain of ˇ(1 ! 4)-linked mannopyranosyl unitshaving side branches of ˛(1 ! 6)-linked galactose units. C. javahikai (CJ) seedgum [31] and its poly(acrylamide)-grafted (CJG) derivative proved to be efficientcoagulants for the decolorization of direct dyes. In combination with very low doseof PAC, both CJ and CJG were found to be efficient coagulant aids for acid as well asProcion dye. The performance of CJG over CJ was enhanced more so for direct dyes.
13.4.1.6 Polysaccharide Hydrogels
Superabsorbent hydrogel (SH) based on polysaccharides may be used in analternative procedure for removal of some aqueous solutes. The SH are formedof three-dimensional cross-linked polymer networks of flexible chains that areable to absorb and retain water and solute molecules. The high water contentand porous network structure of the hydrogels allow solute diffusion [107] into it.These can be prepared by the copolymerization of polysaccharides with hydrophilicmonomers and polyfunctional monomers, with cross-linkers like bisacrylamide,glutaraldehyde, etc., in the presence of redox initiators. On water immersion,hydrophilic polymer chains of the supra-adsorbent hydrogels are not dissolved intothe aqueous phase as they are cross-linked [108]. Ionic groups at the SH hydrogelscan absorb and trap ionic dyes from wastewater, such as Methylene Blue from anaqueous environment. A reasonably priced and biodegradable SH based on arabicgum (AG) has been [109] obtained by chemically modified AG with acrylamideand sodium acrylate by a copolymerization reaction. To obtain supra-hydrogel, AG5% (m/v) was modified with glycidyl methacrylate. Modified AG, sodium acrylate,and acrylamide were stirred for 15 min in presence of 10 mmol sodium persulfatefor 20 min at 70ıC. The hydrogels were dried using air flow. The maximum MBabsorptions were 48 mg g�1 (98%) for the (1.5–0.5–0.5) hydrogels and 39 mg g�1
(80%) for the (1.0–0.5–0.5) SH. The maximum desorption was 46 mg MB per g(1.5–0.5–0.5) of the hydrogel.
13.5 Conclusion
Dyes are the part and participle of many industries, and residual dye contents in theindustrial effluents are becoming a threat to mankind as there has been high increasein the production and utilization of the dyes in past few decades. For removing

398 V. Singh et al.
dyes from industrial wastes, various techniques are in practice, but still, there is arequirement for the low-cost methodology that can be used universally for all typesof dyes. Adsorption is a method of choice for removing dyes from wastewater incombination with other procedures. High cost of the conventional adsorbents (e.g.,activated carbon) and expensive regeneration procedures is becoming detrimentalfor the commercialization of this method of dye remediation. Due to increasingawareness of environmental protection, the effectiveness and cost of treatmentprocesses for dyes is important, and to ensure this, the use of polysaccharides hasnow emerged as important and fast-growing field. Being low cost and renewable,their use as adsorbent has been encouraged in native or modified forms. Availableliterature revealed that a wide range of nonconventional as well as commercialpolysaccharides can be efficiently exploited as low-cost adsorbents. Among theconventional polysaccharides, the chitosan has been most widely studied for suchpurpose and chitosan-based sorbent demonstrated outstanding removal capabilitiesfor certain dyes in comparison to activated carbon. This area of research howeverneeds more attention in terms of better understanding of the sorption mechanismsand scaling up of the experiments which have been successful on laboratory scaleand to test the established polysaccharide-based adsorbents for real industrial efflu-ents. There is a need of time to develop an adsorbent based on these biorenewablepolysaccharides which can be universally applied to all the dye types under amiableconditions, like pH, temperature, and in presence of other contaminants whichare normally found in the effluents.
References
1. Singh R (2002) Synthetic dyes. Mittal Publication, New Delhi, pp 1–2412. Janos Pavel, Coskun S, Pilarova V, Rejnek J (2009) Removal of basic (methylene blue) and
acid (egacid orange) dyes from waters by sorption on chemically treated wood shavings.Bioresour Technol 100:1450–1453
3. Clarke EA, Anliker R (1980) Organic dyes and pigments. In: Handbook of environmentalchemistry, anthropogenic compounds, part A, vol 3. Springer, New York, pp 181–215
4. Bae JS, Freeman HS (2007) Aquatic toxicity evaluation of new direct dyes to the Daphniamagna. Dye Pigment 73:81–85
5. Akgerman A, Guzel B (2000) Mordant dyeing of wool by supercritical processing. J SupercritFluid 18:247–252
6. Stepankova M, Wiener J, Rusinova K (2011) Decolourization of vat dyes on cotton fabricwith infrared laser light. Cellulose 18:469–478
7. Yuksel E, Gurbulak E, Eyvaz M (2011) Decolorization of a reactive dye solution andtreatment of a textile wastewater by electrocoagulation and chemical coagulation: techno-economic comparison. Environ Prog Sustain Energy (in press)
8. Reife A, Freeman HS (2007) Dyes for polyester: disperse dyes. Chim Oggi 25:38–419. Saratale GD, Chang JS, Govindwar SP (2011) Bacterial decolorization and degradation of
azo dyes: a review. J Taiwan Inst Chem Eng 42:138–15710. Ozyurt M, Atacag H (2003) Biodegradation of azo dyes: a review. Fresenius Environ Bull
12:1294–130211. Chattopadhyay SN, Pan NC, Roy AK, Khan A (2009) Coloration of jute fabric using sulphur
dyes. Int Dye 194:35–39

13 Polysaccharide-Based Macromolecular Materials for Decolorization. . . 399
12. Banat IM, Nigam SP, Marchant R (1996) Microbial decolorization of textile dye containingeffluents: a review. Bioresour Technol 58:217–227
13. Ganesh R, Boardman GD, Michelsen D (1994) Fate of azo dyes in sludges. Water Res28:1367–1376
14. Solozhenko EG, Soboleva NM, Goncharuck VV (1995) Decolorization of azo dyes solutionsby Fentons oxidation. Water Res 29:2206–2210
15. Ibrahim NA, El-Gamal AR, Mahrous F (2008) Improving the environmental aspects ofsulphur dyeing of cotton knitted fabrics. J Nat Fiber 5:238–250
16. Robinson T, McMullan G, Marchant R, Nigam P (2001) Remediation of dyes in textileseffluent: a critical review on current treatment technologies with a proposed alternative.Bioresour Technol 77:247–255
17. Kang SF, Liao CH, Chen MC (2002) Pre-oxidation and coagulation of textile wastewater bythe Fenton process. Chemosphere 46:923–928
18. Lin SH, Peng FC (1996) Continuous treatment of textile wastewater by combined coagulation,electrochemical oxidation and activated sludge. Water Res 30:587–592
19. Arslan I, Akmehmet BI, Tuhkanen T (1999) Oxidative treatment of simulated dyehouseeffluent by UV and near-UV light assisted Fenton’s reagent. Chemosphere 39:2767–2783
20. Zonoozi MH, Moghaddam MR, Arami M (2009) Coagulation/flocculation of dye-containingsolutions using polyaluminium chloride and alum. Water Sci Technol 59:1343–1351
21. Edzwald JK (1993) Coagulation in drinking water treatment: particles, organics and coagu-lants. Water Sci Technol 27:21–35
22. Viraraghavan T, Wimmer CH (1988) Polyaluminium chloride as an alternative to alumcoagulation: a case study. In: Proceedings of Canadian society of civil engineers annualconference, pp 480–498
23. Sanghi R, Bhattacharya B, Singh V (2002) Cassia angustifolia seed gum as an effectivenatural coagulant for decolorisation of dye solutions. Green Chem 4:252–254
24. Sanghi R, Bhattacharya B, Dixit A, Singh V (2006) Ipomoea dasysperma seed gum: aneffective natural coagulant for the decolorization of textile dye solutions. J Environ Manage81:36–41
25. Singh RP, Karmakar GP, Rath SK, Pandey SR, Triphaty T, Panda J, Kanan K, Jain SK, LanNT (2000) Biodegradable drag reducing agents and flocculants based on polysaccharides:materials and applications. Polym Eng Sci 40:46–60
26. Singh RP, Tripathy T, Karmakar GP, Rath SK, Karmakar NC, Pandey SR, Kannan K, Jain SK,Lan NT (2000) Novel biodegradable flocculants based on polysaccharides. Curr Sci 78:798–803
27. Shultz CR, Okun DA (1983) Treating surface waters for communities in developing countries.J Am Water Work Assoc 75:212–219
28. Jahn SAA (1988) Using Moringa seeds as coagulants in developing countries. J Am WaterWork Assoc 6:43–50
29. Joshi VA, Nanoti MV (1999) Lab studies on Tarota as coagulant aid in water treatment. Ind JEnviron Prot 19:451–455
30. Christman RF (1967) Performance of chitosan as polyelectrolyte. Food, Chemical andResearch Corporation, report for Kypro Co., Bellvina, Washington
31. Sanghi R, Bhattacharya B, Singh V (2006) Use of Cassia javahikai seed gum and gum-g-polyacrylamide as coagulant aid for the decolorization of textile dye solutions. BioresourTechnol 97:1259–1264
32. Velmurugan P, Kumar RV, Dhinakaran G (2011) Dye removal from aqueous solution usinglow cost adsorbent. Int J Environ Sci 1:1492–1503
33. Volesky B (1999) Biosorption for the next century. In: Ballester A, Amils R (eds) Bio-hydrometallurgy and the environment toward the mining of the 21st century. Internationalbiohydrometallurgy symposium proceedings, volume B. Elsevier Sciences, Amsterdam, theNetherlands, pp 161–170

400 V. Singh et al.
34. Crini G, Badot PM (2008) Application of chitosan, a natural aminopolysaccharide, for dyeremoval from aqueous solutions by adsorption processes using batch studies: a review of 821recent literature. Prog Polym Sci 39:399–447
35. Chandra R, Rastogi R (1998) Biodegradable polymers. Prog Polym Sci 23:1273–133536. Gonera A, Goclik V, Baum M, Mischnick P (2002) Preparation and structural characterization
of O-aminopropyl starch and amylose. Carbohydr Res 337:2263–227237. Wesslen BK, Wesslen B (2002) Synthesis of amphiphilic amylose and starch derivatives.
Carbohydr Polym 47:303–31138. Rachel A-V, Rinaudo M (2003) Synthesis of starch derivatives with labile cationic groups. Int
J Biol Macromol 31:123–12939. Le TC, Lacroix M, Ispas-Szabo P, Mateescu MA (2003) N-acylated chitosan: hydrophobic
matrices for controlled drug release. J Control Release 93:1–1340. Kim TH, Jiang HL, Jere D, Park IK, Cho MH, Nah JW, Choi YJ, Akaike T, Cho CS (2007)
Chemical modification of chitosan as a gene carrier in vitro and in vivo. Prog Polym Sci32:726–753
41. Li F, Chen W, Tang C, Zhang S (2009) Development of hydrogen peroxide biosensor basedon in situ covalent immobilization of horseradish peroxidase by one-pot polysaccharide-incorporated sol-gel process. Talanta 77:1304–1308
42. Mourya VK, Inamdar NN (2008) Chitosan-modifications and applications: opportunitiesgalore. React Funct Polym 68:1013–1051
43. Wang J, Jin X, Chang D (2009) Chemical modification of chitosan under high-intensityultrasound and properties of chitosan derivatives. Carbohydr Polym 78:175–177
44. Varma AJ, Deshpande SV, Kennedy JF (2004) Metal complexation by chitosan and itsderivatives: a review. Carbohydr Polym 55:77–93
45. Hudson SM, Smith C (1998) Polysaccharide: chitin and chitosan: chemistry and technologyof their use as structural materials. In: Kaplan DL (ed) Biopolymers from renewableresources. Springer, New York, pp 96–118
46. Gupta VK, Suhas (2009) Application of low-cost adsorbents for dye removal – a review.J Environ Manage 90:2313–2342
47. Guibal E (2004) Interactions of metal ions with chitosan-based sorbents: a review. Sep PurifTechnol 38:43–74
48. Wong YC, Szeto YS, Cheung WH, McKay G (2004) Adsorption of acid dyes on chitosan-equilibrium isotherm analyses. Proc Biochem 39:693–702
49. Wu FC, Tseng RL, Juang RS (2000) Comparative adsorption of metal and dye on flake- andbead-types of chitosan prepared from fishery wastes. J Hazard Mater B73:63–75
50. Chiou MS, Ho PY, Li HY (2004) Adsorption of anionic dyes in acid solutions usingchemically cross-linked chitosan beads. Dye Pigment 60:69–84
51. Hu ZG, Zhang J, Chan WL, Szeto YS (2006) The sorption of acid dye onto chitosannanoparticles. Polymer 47:5838–5842
52. Piccin JS, Vieira MLG, Goncalves JO, Dotto GL, Pintoz LAA (2009) Adsorption of FD&CRed No. 40 by chitosan: isotherms analysis. J Food Eng 95:16–20
53. Mahmoodi NM, Salehi R, Arami M, Bahrami H (2011) Dye removal from colored textilewastewater using chitosan in binary systems. Desalination 267:64–72
54. Wu FC, Tseng RL, Juang RS (2001) Enhanced abilities of highly swollen chitosan beads forcolor removal and tyrosinase immobilization. J Hazard Mater B81:167–177
55. Chatterjee S, Chatterjee S, Chatterjee BP, Das AR, Guha AK (2005) Adsorption of a modelanionic dye, eosin Y, from aqueous solution by chitosan hydrobeads. J Colloid Interface Sci288:30–35
56. Chatterjee S, Chatterjee S, Chatterjee BP, Guha AK (2007) Adsorptive removal of congored, a carcinogenic textile dye by chitosan hydrobeads: binding mechanism, equilibrium andkinetics. Colloid Surf A 299:146–152
57. Morais WA, Fernandes ALP, Dantas TNC, Pereira MR, Fonseca JLC (2007) Sorption studiesof a model anionic dye on cross-linked chitosan. Colloid Surf A310:20–31

13 Polysaccharide-Based Macromolecular Materials for Decolorization. . . 401
58. McKay G, Blair HS, Gardner JR (1989) The adsorption of dyes onto chitin in fixed bedcolumn and batch adsorbers. J Appl Polym Sci 28:1499–1544
59. Vachoud L, Zydowicz N, Domard A (2001) Sorption and desorption studies on chitin gels.Int J Biol Macromol 28:93–101
60. Crini G et al (2005) Recent developments in polysaccharide-based materials used asadsorbents in wastewater treatment. Prog Polym Sci 30:38–70
61. Chiou MS, Li HY (2002) Equilibrium and kinetic modelling of adsorption of reactive dye oncross-linked chitosan beads. J Hazard Mater B93:233–248
62. Chiou MS, Li HY (2003) Adsorption behaviour of reactive dye in aqueous solution onchemical cross-linked chitosan beads. Chemosphere 50:1095–1105
63. Martel B, Devassine M, Crini G, Weltrowski M, Bourdonneau M, Morcellet M (2001)Preparation and sorption properties of a beta-cyclodextrin-linked chitosan derivative. J PolymSci Part A: Polym Chem 39:169–176
64. Chao AC, Shyu SS, Lin YC, Mi FL (2004) Enzymatic grafting of carboxyl groups on tochitosan—to confer on chitosan the property of a cationic dye adsorbent. Bioresour Technol91:157–162
65. Singh V, Tripathi DN, Tiwari A, Sanghi R (2006) Microwave synthesized Chitosan graft-poly(methylmethacrylate): an efficient ZnC2 ion binder. Carbohydr Polym 65:35–41
66. Singh V, Sharma AK, Sanghi R (2009) Poly(acrylamide) functionalized chitosan: an efficientadsorbent for azo dyes from aqueous solutions. J Hazard Mater 166:327–335
67. WanNgah WS, Ariff NFM, Hanafiah MAKM (2010) Preparation, characterization, andenvironmental application of cross-linked chitosan-coated bentonite for tartrazine adsorptionfrom aqueous solutions. Water Air Soil Pollut 206:225–236
68. Chang MY, Juang RS (2004) Adsorption of tannic acid, humic acid and dyes from water usingthe composite of chitosan and activated clay. J Colloid Interface Sci 278:18–25
69. Nandi BK, Goswami A, Purkait MK (2009) Adsorption characteristics of brilliant green dyeon kaolin. J Hazard Mater 161:387–395
70. Wang L, Wang A (2007) Adsorption characteristics of congo red onto the chi-tosan/montmorillonite nanocomposite. J Hazard Mater 147:979–985
71. Wang CC, Juang LC, Hsu TC, Lee CK, Lee JF, Huang FC (2004) Adsorption of basic dyesonto montmorillonite. J Colloid Interface Sci 273:80–86
72. Zhu HY, Jiang R, Xiao L (2010) Adsorption of an anionic dye by chitosan/kaolin/ -Fe2O3composites. Appl Clay Sci 48:522–526
73. Won SL, Lee HC, Jeong YG, Min BG, Lee SC (2009) Preparation and acid dye adsorptionbehavior of polyurethane/chitosan composite foams. Fiber Polym 10:636–642
74. Hameed BH, Hasan M, Ahmad AL (2008) Adsorption of reactive dye onto cross-linkedchitosan/oil palm ash composite beads. Chem Eng J 136:164–172
75. Cestari AR, Vieira EF, Pinto AA, Lopes EC (2005) Multistep adsorption of anionic dyeson silica/chitosan hybrid. 1. Comparative kinetic data from liquid- and solid-phase models.J Colloid Interface Sci 292:363–372
76. Copello GJ, Meberta AM, Raineria M, Pesentia MP, Diaza LE (2011) Removal of dyes fromwater using chitosan hydrogel/SiO2 and chitin hydrogel/SiO2 hybrid materials obtained bythe sol–gel method. J Hazard Mater 186:932–939
77. Li F, Li J, Zhang S (2008) Molecularly imprinted polymer grafted on polysaccharidemicrosphere surface by the sol–gel process for protein recognition. Talanta 74:1247–1255
78. Zubieta CE, Messina PV, Luengo C, Dennehy M, Pieroni O, Schulz PC (2008) Reactive dyesremotion by porous TiO2–chitosan materials. J Hazard Mater 152:765–777
79. Holzer L, Munch B, Rizzi M, Wepf R, Marschall P, Graule T (2010) 3D microstructureanalysis of hydrated bentonite with cryo-stabilized pore water. Appl Clay Sci 47:330–342
80. Li Q, Yue QY, Sun HJ, Su Y, Gao BY (2010) A comparative study on the properties,mechanism and process designs for the adsorption of non-ionic or anionic dyes onto cationic-polymer/bentonite. J Environ Manage 91:1601–1611
81. Wei JM, Zhu RL, Zhu JX, Ge F, Yuan P, He HP et al (2009) Simultaneous sorption of crystalviolet and 2-naphthol to bentonite with different CECs. J Hazard Mater 166:195–199

402 V. Singh et al.
82. Lyoo WS, Lee HC, Jeong YG, Min BG, Lee SC (2009) Preparation and acid dyes adsorptionbehavior of polyurethane-chitosan composite foams. Fiber Polym 10:636–642
83. Jang SH, Min BG, Jeong YG, Lyoo WS, Lee SC (2008) Removal of lead ions in aqueoussolution by hydroxyapatite/polyurethane composites foams. J Hazard Mater 152:1285–1292
84. Moises LP, Joao P, Ana PC, Manuela BC, Joao CB (2006) Synthesis and regenerationof polyurethane/adsorbent composites and their characterization by adsorption methods.Micropor Mesopor Mat 89:260–269
85. Buleon A, Colonna P, Planchot V, Ball S (1998) Starch granules: structure and biosynthesis.Int J Biol Macromol 23:85–112
86. Tester RF, Karkalas J, Qi X (2004) Starch-composition, fine structure and architecture.J Cereal Sci 39:151–165
87. Crini G (2003) Studies of adsorption of dyes on beta-cyclodextrin polymer. Bioresour Technol90:193–198
88. Delval F, Crini G, Vebrel J, Knorr M, Sauvin G, Conte E (2003) Starch-modified filters usedfor the removal of dyes from waste water. Macromol Symp 203:165–171
89. Lu W, Yang JZ, Cui CX (2003) Poly(sulfobetaine)s and corresponding cationic polymers.XI. Synthesis and aqueous solution properties of a cationic poly(methyl iodide quaternizedethyl vinyl ether/N, N-dimethylaminopropyl maleamidic acid) copolymer. J Appl Polym Sci89:263–267
90. Xu SM, Feng S, Yue F, Wang JD (2004) Adsorption of Cu(II) ions from an aqueous solutionby cross-linked amphoteric starch. J Appl Polym Sci 92:728–732
91. Xu SM, Feng S, Peng G et al (2005) Removal of Pb(II) by cross-linked amphoteric starchcontaining the carboxymethyl group. Carbohydr Polym 60:301–305
92. Wang JL, Xu SM, Wu RL et al (2006) Adsorption behaviors of acid and basic dyes on cross-linked amphoteric starch. Chem Eng J 117:161–167
93. Mishra A, Bajpai M, Pal S, Agrawal M, Pandey S (2006) Tamarindus indica mucilage andits acrylamide-grafted copolymer as flocculants for removal of dyes. Colloid Polym Sci285:161–168
94. Sandhu JS, Hudson GJ, Kennedy JF (1981) The gel nature and structure of the carbohydrateof isapghula husk ex Plantago ovata Forsk. Carbohydr Res 93:247–259
95. Samuelsen AB, Lund I, Djahromi JM, Paulsen BS, Wold LK, Knutsen SH (1999) Structuralfeatures and anticomplementary activity of some heteroxylan polysaccharide fractions fromthe seeds of Plantago major L. Carbohydr Polym 38:133–143
96. Sanghi R, Bhattacharya B (2005) Psyllium and chitosan as coagulant aids for decolourizationof dye solutions. Water Qual Res J Can 40:97–101
97. Li G, Gregory J (1991) Flocculation and sedimentation of high-turbidity waters. Water Res25:1137–1143
98. Karthikeyan J (1990) A study on colour removal from textile dye waste by chemical treatment.Dissertation, Indian Institute of Technology, Kanpur, India
99. Kace JS, Linford HB (1975) Reduced cost flocculation of a textile dyeing wastewater. J WaterPollut Control Fed 47:1971–1980
100. Rebhun M, Weimberg A, Narkis N (1970) Treatment of wastewater from cotton. Dyeing andfinishing works for reuse. In: Proceedings of the 25th industrial waste conference, PurdueUniversity, West Layfayette, Indiana
101. Sutherland JP, Folkard GK, Mtawali MA, Grant WD (1994) Moringa oleifera as a naturalcoagulant, affordable water supply and sanitation. In: 20th WEDC conference, Colombo, SriLanka, pp 297–299
102. Tripathy T, Bhagat RP, Singh RP (2001) The flocculation performance of grafted sodiumalginate and other polymeric flocculants in relation to iron ore slime suspension. Eur Polym J37:125–130
103. Sanghi R, Bhattacharya B, Singh V (2007) Seed gum polysaccharides and their grafted co-polymers for the effective coagulation of textile dye solutions. React Funct Polym 67:495–502
104. Bajpai UDN, Jain A, Rai S (1990) Grafting of polyacrylamide on to guar gum using K2S2O8
ascorbic acid redox system. J Appl Polym Sci 39:2187–2204

13 Polysaccharide-Based Macromolecular Materials for Decolorization. . . 403
105. Singh V, Srivastava V, Pandey M, Sethi R, Sanghi R (2003) Ipomea turpethum seeds: apotential source of commercial gum. Carbohydr Polym 51:357–359
106. Singh V, Srivastava A, Tiwari A (2009) Structural elucidation, modification and characteriza-tion of seed gum from Cassia javahikai: a nontraditional source of industrial gum. Int J BiolMacromol 45:293–297
107. Amsden B (1998) Solute diffusion within hydrogels. Mechanisms and models. Macro-molecules 31:8382–8395
108. Sannino A, Pappada S, Madaghiele M, Maffezzoli A, Ambrosio L, Nicolais L (2005) Crosslinking of cellulose derivatives and hyaluronic acid with water soluble carbodiimide. Polymer46:11206–11212
109. Paulino AT, Guilherme MR, Reis AV, Campese GM, Muniz EC, Nozaki J (2006) Removalof methylene blue dye from an aqueous media using superabsorbent hydrogel supported onmodified polysaccharide. J Colloid Interface Sci 301:55–62

Chapter 14Wastewater Treatment with ConcomitantBioenergy Production Using MicrobialFuel Cells
Liping Huang, Shaoan Cheng, Daniel J. Hassett, and Tingyue Gu
14.1 Introduction
Wastewater treatment currently requires a significant energy input. Currenttechnology does not recover the chemical energy of organic matter contained inwastewaters even though the energy stored in such wastewaters is not trivial. Forexample, new estimates indicate that domestic wastewater contains 7.6 kJ/L [1].Roughly 2.2–4.4 � 1015 kJ of energy per year is available in wastewaters worldwide.This amount of energy is equivalent to burning 62–124 million tonnes of oil in amodern power station [1]. This estimate would escalate considerably if industrialand agricultural wastewaters were also included. If a significant amount of energyis recovered from wastewaters during treatment, the energy cost of the wastewaterindustry can be greatly reduced. It is even possible to have a net energy gain.
L. Huang (�)Key Laboratory of Industrial Ecology and Environmental Engineering,Ministry of Education (MOE), School of Environmental Science and Technology,Dalian University of Technology, Dalian 116024, Chinae-mail: [email protected]
S. ChengState Key Laboratory of Clean Energy Utilization, Department of Energy Engineering,Zhejiang University, Hangzhou 310027, Chinae-mail: [email protected]
D.J. HassettDepartment of Molecular Genetics, Biochemistry and Microbiology, University of CincinnatiCollege of Medicine, Cincinnati, OH 45267, USAe-mail: [email protected]
T. GuDepartment of Chemical and Biomolecular Engineering, Ohio University, Athens,OH 45701, USAe-mail: [email protected]
S.K. Sharma and R. Sanghi (eds.), Advances in Water Treatment and PollutionPrevention, DOI 10.1007/978-94-007-4204-8 14,© Springer ScienceCBusiness Media Dordrecht 2012
405

406 L. Huang et al.
Although energy from wastewater treatment will unlikely contribute to the gridpower due to the relatively low energy density of wastewaters compared to fuelssuch as ethanol and hydrogen (H2), contribution to a local power supply is possible,especially in remote villages, and also military forward operating bases (FOBs)where fuel costs can be ten times more expensive due to trucking risks in a war zone.
Microorganisms can utilize biodegradable solid wastes and wastewaters toproduce energy. For example, methane (CH4) digesters can convert organic wastesto CH4. An alternative to methane digesters is microbial fuel cells (MFCs), whichcan convert the energy in the organic wastes directly into electricity. A number ofreports have been published on the use of MFCs for treating a variety of wastewatersincluding municipal, swine, and food processing wastewaters; agricultural andsludge wastes; as well as any biodegradable industrial wastewaters [2]. Recently,there is a growing trend in the literature for the use of biocathodes to replacetraditional chemical cathodes. Researchers have attempted optimization of variousMFC parameters including electrode material, electrode potential, substrate type,microorganism metabolism, pH, temperature, ionic strength, as well as reactorarchitecture. The electron-transfer mechanisms from Geobacter sulfurreducens andShewanella oneidensis have been described in great detail in MFC studies. MFCshave also been operated with an externally imposed voltage to produce bioproductssuch as H2 and CH4. This chapter critically reviews the new developments inthree aspects: (1) bioanodes, (2) chemical and biological cathodes for wastesand wastewater treatment, and (3) value-added bioproducts through MFCs andthe broadened MFCs, and a potential “game-changer” in MFC technology usinggenetically engineered “superbug” bacteria as electrogens.
14.2 Bioanode MFCs for Waste and Wastewater Treatment
14.2.1 Wastes and Wastewaters Treated at the Anode
All bacteria must have some source of carbon-containing molecules for the buildingblocks of cellular components including DNA, RNA, protein, and lipid. Autotrophicbacteria can utilize inorganic carbon from carbonate or CO2. Phototrophic bacteriaharvest their energy from light. A chemotroph derives energy from either organicor inorganic compounds. However, the most common and metabolically versatileorganisms are termed heterotrophs. Thus, heterotrophic bacteria would arguably bethe best candidates for the “engines” in MFCs for the treatment of a variety of“practical” wastewaters, such as sewage, brewery, and rendering wastes at the anodein an MFC.
Earlier MFC investigations almost exclusively focused on anodic fuels becauseoxidation of organic carbons occurs in the anodic chamber. Pant et al. [2] presenteda comprehensive review on the oxidation of these substrates. While syntheticwastewater was often used as fuel for MFCs in lab tests due to its ease of controllingloading strength, pH, and conductivity, wastewaters such as municipal [3, 4],

14 Wastewater Treatment with Concomitant Bioenergy Production. . . 407
Municipal wastewaters
e−
H+ H+
e−
Biodegradable wastes & wastewaters
Chemicalcathode
Biocathode
Anode
Cathode
Agriculturalwastes &wastewaters
Aerobic biocathode:Bacteria + O2
Anaerobic biocathode:Bacteria + NO3
−, SO42−,CIO4
−,Trichlorethylene,Tetrachloroethane,2-Chlorophenol, Fumarate,CO2, Cr(VI), Mn(VI)
K3Fe(CN)6, KMnO4,K2Cr2O7, K2S2O8, U(VI),V(V), Cu(II)
O2, O2 + Pt
4-Chlorophenol, Azo dyes,Iopromide
Industrial wastewaters:Food processing wastewatersRecalcitrant wastes &wastewaters
Fig. 14.1 Configuration of diverse wastes and wastewaters treated in MFCs
swine [5], starch processing [6], and brewery wastewaters [7] were tested as fuelsin MFCs for power generation during treatment (Fig. 14.1). Landfill leachateswere also used as a fuel for power generation from MFCs [8–10]. Recently,researchers have used sewage sludge to produce 9 W/m3 of power and enrichedthe hydrophilic fraction of the extracellular biological organic matter by 48–65%,while reducing the hydrophobic acid fraction by 32–15%. They also removed 37%of the dissolved organic carbon and decreased the sludge aromaticity by 66% [11–13]. Lignocellulosic biomass is widely available as agriculture wastes, wood chips,and toilet paper in municipal wastewater. It is a recalcitrant biopolymer, but thesuccess of renewable bioenergy from biomass depends on the successful utilizationof lignocellulosic biomass. With the presence of Clostridium cellulolyticum andClostridium thermocellum, cellulose was able to fuel MFCs via the mediation of H2
produced from cellulose [14]. More recent investigations proved that cellulose andalgae can be directly used as a fuel [15–22] or via the decomposition by cellulaseenzymes [23] (Table 14.1) in MFCs for electricity production using exoelectrogenicbacteria. Further research indicated that more complex lignocellulosic biomass suchas corn stover, wheat straw, and Canna indica can also be degraded at bioanodes, al-though only 22–61% degradation was achieved and the power output was quite low[26, 27] (Table 14.1). Pretreatment by dilute acid can improve the biodegradabilityof these wastes for power production in MFCs [24, 26]. Alternatively, integrationof anaerobic digestion with MFCs can successfully achieve COD removal of grasssilage with simultaneous power production [28]. The products of lignocellulosic

408 L. Huang et al.
Tab
le14
.1C
ellu
lose
and
lign
ocel
lulo
sic
biom
ass
degr
aded
inM
FCs
Type
ofsu
bstr
ate
Type
ofpr
etre
atm
ent
Rea
ctor
,ele
ctro
de,a
ndm
icro
orga
nism
sM
icro
orga
nism
sPo
wer
(W/m
3)
orpo
ised
pote
ntia
lR
efer
ence
s
Chi
tin–
Two-
cham
bere
d,gr
aphi
tefib
eran
ode
and
carb
oncl
oth
cath
ode,
Pt-c
atal
yzed
O2
asan
elec
tron
acce
ptor
Mix
edcu
ltur
e0.
4–0.
6[2
0]
Cel
lulo
se–
Two-
cham
bere
d,ca
rbon
felt
anod
ean
dca
rbon
rod
cath
ode,
Pt-c
atal
yzed
O2
asan
elec
tron
acce
ptor
Clo
stri
dium
cell
ulol
ytic
um,C
.th
erm
ocel
lum
0.2
Vvs
.SH
Ea
[14]
–Tw
o-ch
ambe
red,
carb
onpl
ate
anod
ean
dca
rbon
pape
rca
thod
e,K
3Fe
(CN
) 6as
anel
ectr
onac
cept
or
C.c
ellu
loly
ticu
m,
Geo
bact
ersu
lfur
redu
cens
0.9
[17]
–Tw
o-ch
ambe
red,
carb
oncl
oth
anod
ean
dgr
aphi
tefib
erca
thod
e,K
3Fe
(CN
) 6as
anel
ectr
onac
cept
or
Ent
erob
acte
rcl
oaca
e0.
06[1
9]
–Tw
o-ch
ambe
red,
carb
onpl
ate
both
anod
ean
dca
thod
e,K
3Fe
(CN
) 6as
anel
ectr
onac
cept
or
Mix
edcu
ltur
e1.
2[2
1]
–Tw
o-ch
ambe
red,
grap
hite
fiber
anod
ean
dca
rbon
pape
rca
thod
e,Pt
-cat
alyz
edO
2as
anel
ectr
onac
cept
or
Mix
edcu
ltur
e0.
06[2
3]
Enz
ymat
ichy
drol
ysis
Two-
cham
bere
d,gr
aphi
tefib
eran
ode
and
carb
onpa
per
cath
ode,
Pt-c
atal
yzed
O2
asan
elec
tron
acce
ptor
Mix
edcu
ltur
e0.
6[2
3]
–O
ne-c
ham
bere
d,gr
aphi
tefib
eran
ode
and
carb
oncl
oth
cath
ode,
Pt-c
atal
yzed
O2
asan
elec
tron
acce
ptor
,bat
chop
erat
ion
Mix
edcu
ltur
e0.
3[1
5]
–O
ne-c
ham
bere
d,gr
aphi
tefib
eran
ode
and
carb
oncl
oth
cath
ode,
Pt-c
atal
yzed
O2
asan
elec
tron
acce
ptor
,con
tinu
ous
oper
atio
n
Mix
edcu
ltur
e5.
9[1
6]

14 Wastewater Treatment with Concomitant Bioenergy Production. . . 409
Whe
atst
raw
Hyd
roth
erm
altr
eatm
ent,
liqu
idpa
rtTw
o-ch
ambe
red,
carb
onpa
per
both
anod
ean
dca
thod
e,K
3Fe
(CN
) 6as
anel
ectr
onac
cept
or
Mix
edcu
ltur
e2.
1[2
4]
Cor
nst
over
Stea
mex
plod
ed(n
eutr
alpH
),li
quid
part
One
-cha
mbe
red,
carb
oncl
oth
both
anod
ean
dca
thod
e,Pt
-cat
alyz
edO
2as
anel
ectr
onac
cept
or
Mix
edcu
ltur
e1.
6[2
5]
Stea
mex
plod
ed(a
cidi
cpH
),li
quid
part
One
-cha
mbe
red,
carb
oncl
oth
both
anod
ean
dca
thod
e,Pt
-cat
alyz
edO
2as
anel
ectr
onac
cept
or
Mix
edcu
ltur
e1.
3[2
5]
–O
ne-c
ham
bere
d,ca
rbon
pape
ran
ode
and
carb
oncl
oth
cath
ode,
Pt-c
atal
yzed
O2
asan
elec
tron
acce
ptor
Mix
edcu
ltur
e0.
5[2
6]
Stea
mex
plod
ed(n
eutr
alpH
),so
lid
part
One
-cha
mbe
red,
carb
onpa
per
anod
ean
dca
rbon
clot
hca
thod
e,Pt
-cat
alyz
edO
2
asel
ectr
onac
cept
or
Mix
edcu
ltur
e0.
7[2
6]
Phyt
opla
nkto
n–
One
-cha
mbe
red,
grap
hite
fiber
anod
ean
dca
rbon
clot
hca
thod
e,Pt
-cat
alyz
edO
2
asan
elec
tron
acce
ptor
Mix
edcu
ltur
e27
7[2
2]
Mac
roph
yte
–O
ne-c
ham
bere
d,gr
aphi
tefib
eran
ode
and
carb
oncl
oth
cath
ode,
Pt-c
atal
yzed
O2
asan
elec
tron
acce
ptor
Mix
edcu
ltur
e21
5[2
2]
Aqu
atic
plan
t–
One
-cha
mbe
red,
carb
onpa
per
both
anod
ean
dca
thod
e,Pt
-cat
alyz
edO
2as
anel
ectr
onac
cept
or
Mix
edcu
ltur
e0.
4[2
7]
a SHE
stan
dard
hydr
ogen
elec
trod
e,–
none
pret
reat
ed

410 L. Huang et al.
biomass hydrolysis, glucose and xylose, as well as polyalcohols can fuel MFCswith a maximum power generation of 44 W/m3, Coulombic efficiencies (CEs) of13–28%, and COD removal of 71–92% [29–31, 234].
Furan derivatives and phenolic compounds except 5-hydroxymethyl furfural canonly be co-metabolized in the presence of glucose [32]. Both the type and size ofthe substrates derived from lignocellulosic biomass affect the treatment efficiencyand power generation in MFCs. For example, the size of chitin particles affectedelectricity generation and the composition of the anodic microbial consortia [20].The inoculum type also affects system performance for lignocellulosic biomassutilization. An MFC inoculated with activated sludge of municipal wastewaterefficiently degraded furfural in the absence of glucose, while an MFC inoculatedwith a previously acclimated anolyte of a MFC fed with glucose did not de-grade furfural [33]. In another study, however, an inoculum from an acclimatedmicrobial electrolysis cell used to degrade cellulose efficiently degraded celluloseand provided more electricity than directly degrading paper recycling wastewater[15, 16, 34].
Apart from these, MFCs also have the potential to treat other recalcitrant wastes[227]. These include pyridine [35], indole [36], quinoline [37], and its derivatives,as well as coking wastewater [38] can be efficiently removed or their levelssignificantly reduced by MFCs. Apart from the organic wastes, ammonia removalis a major issue for animal wastewater [39, 40]. Ammonia was removed mainlyby a physicochemical process, although some losses may occur through biologicalnitrification [40]. Kim et al. [40] did not detect anaerobic ammonia oxidizingbacteria in their MFC and concluded that ammonia oxidation did not contributeto electricity generation in their MFC fed with swine wastewater. However, He etal. [39] observed electricity generation from ammonia oxidation although the CEswere relatively low in their rotating-cathode MFCs. Nonetheless, this points to thepossibility of using ammonia oxidation for power generation.
14.2.2 Factors Influencing System Performance
Various operating parameters such as pH, temperature, external resistance, influentCOD, and ionic strength can influence system performances. Electrode character-istics such as electrode material, surface roughness, surface area, and potential, aswell as microbial metabolism, also affect MFC performance. Studies on the impactof these parameters on practical MFC applications and basic bioelectrochemistry inMFCs have been performed.
14.2.2.1 Substrate and Microbial Metabolism
Microbial metabolism can be divided into fermentation and respiration. Cellularfermentation is normally composed of internal oxidation and reduction in which

14 Wastewater Treatment with Concomitant Bioenergy Production. . . 411
closely linked and balanced electron transfer was involved. During this process,microorganisms usually convert substrate to multiple by-products. Microbial res-piration, however, requires external electron acceptors to main electroneutrality.The anode-based electron acceptors have been recently shown to overcome theconstraints and stoichiometrically converted glycerol into ethanol with a metal-reducing bacterium S. oneidensis [41]. Even for the eukaryotic Saccharomycescerevisiae, with the mediation of self-secreted NADH/NADC and FADH/FADC, anefficient glucose metabolism and electricity generation were revealed at a loadingrate ranging from 0.91 to 2.86 kg COD/m3/day [42], indicating a potential methodof using yeast based MFCs for treatment of high strength wastewaters with powergeneration. However, in another study with Clostridium acetobutylicum at a highglucose concentration of 50 g/L and a comparatively high external resistor of 10 k�,the MFC exhibited a bimodal metabolism, resulting in two output voltage stages inwhich the first stage was correlated with acidogenic metabolism (acetate and bu-tyrate production) and the second a solventogenic metabolism (acetone and butanolproduction) [43]. Besides the bacteria, experimental conditions also significantlyimpact microbial metabolism. For example, when the MFCs were independently op-erated at different circuit loads, the anodic bacterial community exhibited significantdifferences when fed with short chain fatty acids [44], and CEs and biomass growthwas lower [45–47] in larger circuit loads. These results indicated that increasingexternal resistance favored fermentative metabolism over anaerobic respiration. Itwas proposed that fermentative and electrogenic microorganisms competed fromsubstrates (electron donors), a higher resistance correlated with decreased utilizationof the substrates by the electrogenic microorganisms and less electricity generation[45, 48]. These results can be also used as a potential platform for controllingelectrogenesis, methanogenesis, and anode microbial community [48].
While external circuit load can orient bacterial metabolism, the type of substratealso affects microbial consortia metabolism and system performance. Based onthe analysis of electron sink with current, biomass, residual organic compounds,H2 and CH4, MFCs fed with non-fermentable (acetate) and fermentable (glucose)electron donors exhibited different electron sink contribution by electrical current(acetate 71%, glucose 49%), biomass (acetate 15%, glucose 26%), and residualorganic compounds (acetate 11%, glucose 18%), respectively, while methane gas(3.7%) was found only in the glucose-fed MFC [49]. Jung and Regan [48] alsoobtained similar results. With a mixed culture, microorganisms did not directlyuse glucose as a fuel for electricity generation but used H2 and acetate of thefermentation products. In this process, methanogens could decrease the electricitygeneration by consuming H2 but also increase fermentation rates [48, 50]. Thiselectrical current-driven microbial metabolism has led to a series of applicationssuch as bioremediation,monitoring of glucose metabolism, and the production ofvalue-added bioproducts from wastewaters (see Sect. 14.5).
The presence of oxygen in the bioanode also affected bacteria by alteringthe electron delivery rate and metabolic pathway utilized. It was initially foundthat the presence of oxygen selected for bacteria with differential expression ofproteins resulting in decreasing electron transfer and electricity generation [51–53].

412 L. Huang et al.
However, Biffinger et al. [54] later reported that the power output of MFCs usingS. onedensis DSP10 with glucose as substrate could actually be promoted byoxygen. Based on this observation with S. oneidensis, Li et al. [55] conducted aseries of experimental comparisons using S. decolorationis NTOU1 as a modelbacterium and concluded that current increased by oxygen was related to theincrease in the overall aerobic metabolic rate, rather than an increase in cell numberor the concentration of the self-secreted endogenous mediator.
14.2.2.2 Electrode Materials
Electrode materials can substantially affect power generation of MFCs. An efficientanodic electrode requires high conductivity, chemical stability, biocompatibility,and catalytic activity. In addition, a highly porous structure should exhibit internalcolonization and strong interaction between the electrode surface and the microbialbiofilm, allowing a better mechanical contact and higher electrical conductivity [56].Various carbon-based materials like carbon foam [57], carbon paper [4], reticulatedvitrified carbon (RVC, [58]), carbon cloth [59, 60], graphite brush [61], graphitegranule [62], and molybdenum carbide [63] have been extensively investigated foranodes. Among these materials, graphite brush and graphite granules both exhibiteda high power production due to their high specific surface areas [61, 62]. Themaximum power of MFCs was proportional to the logarithm of the surface areaof the anode [64]. The COD removal rates measured for both open circuit andclosed circuit operations of MFCs were found to be independent of the variouscarbon anodes used such as graphite, sponge, paper, cloth, felt, fiber, foam, andRVC. However, MFC peak powers varied from a low of 1.3 for RVC to a highof 568 mW/m2 for graphite [65, 66]. The low power output of RVC was mainlydue to the small anodic surface area and high concentration polarizations caused bythe RVC morphology [65, 66]. Ammonium treatment, electrochemical oxidation,and 4(N,N-dimethylamino) benzene diazonium tetrafluoroborate modification canimprove the electrocatalytic activity of the anode due to the formation of functionalgroups of amine, carboxyl, and nitrogen on the anode material surface [67,229]. Bonding materials to the anode can also increase power by facilitatingelectron transfer and improving the adhesion of bacteria [68, 69]. For example,the bonded plain G10 graphite with surface-confined anthraquinone-1,6-disulfonicacid (AQDS) or an incorporated Sb(V) complex, oxidized graphite, and oxidizedgraphite bonded with AQDS can exhibit 1.9–218 times greater kinetic activitiesthan plain G10 graphite without modification [68].
Alternatively, anodes modified with pure “-molybdenum carbide ((Mo2C)) [63]or polymers or multiwall carbon nanotubes (CNTs) [70] can boost the interactionbetween the anodic surface and its microbial biofilm and therefore increases theMFC performance. The promoting effect of CNTs was mainly due to the trans-formation of the irreversible electrochemical behavior of cell surface cytochromes,where electrooxidation was inhibited [71]. A new composite by combining CNT
14 Wastewater Treatment with Concomitant Bioenergy Production. . . 413
with polyaniline (PAN) also showed enhanced electronic properties of anodefor MFC applications [72, 73]. Carbon nanotube-textile (CNT-textile) compositeperformed biocompatible, highly conductive, and open three-dimensional space forefficient substrate transport and internal colonization by a diverse microflora andcan increase maximum current density by 157%, maximum power density by 68%,and energy recovery by 141% compared with the use of the traditional carbon clothanode [56]. In yet another study, a nanostructured fibrillar polypyrrole was foundto perform better than granular polypyrrole, due to the fact that more electrons canbe harvested directly from photosynthetic cultures by a higher redox current and alower interface electron-transfer resistance [74]. The cost-effective energy generatedfrom MFCs can also supply the system of photocatalytic oxidation mediated byTiO2, showing as a synergetic effect on p-nitrophenol degradation [75].
14.2.2.3 Electrode Potential
In the anodic chamber, electrons from substrate oxidation flow from the biofilmto the anode. Microorganisms can harvest some of the energy from substrateoxidation for their own survival and reproduction [76]. In view of this, an electrodepotential can produce a selective pressure for bacterial evolution [48, 77, 78].For example, a strain of G. sulfurreducens obtained under a selective pressureof anodic potential of �0.2 V can produce current densities five times greaterthan the wild-type strain, providing a strategy for the selection of more efficientstrains [78]. Additionally, anode potential also influences the evolution time tomaximal power production, which is related to bacterial growth. However, powerproduction at different set anode potentials resulted in the same value at the endof the experimental period [77, 79], indicating that the set anode potential mainlyregulated the activity and growth of bacteria and not power generation. For example,at different anodic potentials, G. sulfurreducens altered the way they exchangedelectrons with an electrode in response to an applied electrode potential change[80]. Based on the comparison of biomass evolution at various set potentials andthe quantitative analysis between biomass and possible metabolic energy gain(defined by anode potential), a proper set potential can promote the growth ofthis strain and therefore accelerating MFC activation while lowering its internalresistance. These positive enhancements can also be observed during steady-stateMFC operations [80]. However, anodic potentials were highly variable on start-upor current density when different cultures and reactor conditions were used [230].Therefore, it is problematic to conclude that positive results are related to the higheror lower potentials due to the various culture conditions, electrode materials, andbacterial inoculum in the different studies [81, 82]. Much more work is neededto investigate the effects of various potentials on system performance at variousconditions in order to understand the behavior of microbial communities in differentredox environments for wastewater treatment [230].

414 L. Huang et al.
14.2.2.4 pH, Ionic Strength, and Temperature
Equation 14.1 describes electrode potentials as a function of pH at 298 K accordingto the Nernst equation [83]. The net change of potential with a pH change thusfollows Eq. 14.2:
E D E0 � 0:0592pH (14.1)
�E D 0:0592�pH (14.2)
Equation 14.2 shows that a decrease of one pH unit can lower the potentialby 0.0592 V. In the case of complex bioanodic processes, the medium pH canaffect multiple surface properties including cell morphology during cell divisionin planktonic and biofilm culture, cell surface hydrophobicity, and net surfaceelectrostatic charge as well as biofilm structure [84, 85]. Considering the variouschemical reactions on the anode and cathode, the oxidation reactions in the anodicchamber generate protons, and reduction reactions in the cathodic chamber generatehydroxide ion. There is often a pH imbalance because of the resistance by the PEMand, thus, can result in potential and power losses. In the case of the air-cathodesystem, one-chambered MFC with a Pt catalyst, the higher current generationwas achieved at the optimal initial pH of 8–10, not at lower or higher pH [86].In another reported air-cathode, one-chambered MFCs without Pt catalyst, S.cerevisiae exhibited higher power production and substrate degradation at an initialpH of 6.0 than at pH 5.0 or 7.0, mainly due to higher metabolic activities ofthis microorganism at pH 6.0 [42]. Considering the pH imbalance and the effectof pH, phosphate buffer electrolytes are extensively used to decrease potentiallosses and obtain an efficient system performance [7, 15, 30, 52, 59–61, 87].However, the addition of phosphate buffer is not cost-effective and sustainablefor practical wastewater treatment. Phosphate buffer electrolytes can be replacedby CO2/carbonate or CO2/bicarbonate buffered catholyte systems which are cost-effective [88–90]. The pH can be also balanced by flow through the anode to thecathode or a recycling loop between anode and cathode chambers [91–94].
Temperature also has a significant impact on bacterial activities [7, 52, 65, 66,95–97], although most studies have been conducted under mesophilic conditions(e.g., 30ıC). Liu et al. [52] reported that when the temperature was decreased from32ıC to 20ıC, power output was reduced by only 9% in one-chambered, air-cathodeMFCs. In contrast to the above observation, another air-cathode, one-chamberedMFC acclimated at 30ıC exhibited a linearly increasing power production withtemperature, from 10.6 at 4ıC to 31.5 W/m3 at 30ıC while CEs dropped from 31%at 4ıC to 17% at 30ıC [96]. Additionally, MFCs initially operated at 15ıC or higherachieved stable power generations, but the time required to achieve it increasedfrom 50 h at 30ıC to 210 h at 15ıC whereas MFCs did not produce appreciablepower at starting temperatures below 15ıC [96]. While the effect of temperature

14 Wastewater Treatment with Concomitant Bioenergy Production. . . 415
has been extensively investigated in artificial wastewater [52, 96, 97], it has alsobeen evaluated in practical wastewater-fueled MFCs [7, 65, 66, 95]. Increasing thetemperature from 20ıC to 30ıC increased power from 4.3 to 5.1 W/m3 while CODremoval rates and CEs decreased only slightly using brewery wastewater as fuelin single-chambered, air-cathode MFCs run in batch mode (net working volume28 mL) [7]. Similarly, Ahn and Logan [95] examined the effects of temperatureon power generation with domestic wastewater at 23ıC and 30ıC using batch andcontinuous operation modes in one-chambered, air-cathode MFCs. Under the batchoperation mode, a higher power of 10.2 W/m3 was obtained at 30ıC while CODremoval was greater than 88% at both temperatures. Under the continuous operationmode, a COD removal of 25.8% and a higher power density of 12.8 W/m3 atan organic loading rate of 54 g COD/L/d were obtained at 30ıC, implying theimportance of not only temperature but also running mode on practical wastewatertreatment efficiency and power generation. In another report [65, 66], both single-chambered and two-chambered, air-cathode MFCs fueled by barley processingwastewater from a brewery diluted in domestic wastewater and run in batch modeexhibited a substantially increased COD removal and power production with anincrease of temperature from 4ıC to 35ıC (net working volume of two-chambered,200 mL, and one-chambered, 100 mL).
14.2.2.5 Reactor Architecture
Considerable efforts have been devoted to the improvement of reactor architecture inthe pursuit of greater MFC performance [59, 60, 87, 98]. Single- and two-chamberedMFCs are common reactor architectures and have been extensively reviewed byDu et al. [99]. In comparison with two-chambered MFCs that are separated by aPEM, a single-chambered MFC (normally using air/O2 as an electron acceptor)inherently possesses multiple advantages. These include a simple structure, easyinstallation, appropriate electrode space, elimination of PEM, and therefore lowcost, convective flow, low internal resistance, higher power generation, and freeelectron acceptor with high redox potential [15, 16, 30, 59, 60, 62, 231]. In view ofpractical application, scale-up reactor architectures should satisfy the requirementof large amount wastewater treatment with simultaneous power generation. Fourdifferent one-chambered MFCs with various working volumes ranging from 28 mLto 1.6 L are shown in Fig. 14.2. The high costs of Pt catalyst and Nafion bindershave limited their use in MFC scale-up. Efforts have been made to reduce costs byusing cathode catalysts such as metal tetramethoxyphenylporphyrin (TMPP) andmetal phthalocyanine, and substite binders such as Nafion/PTFE mixed binders[101–103]. Practical large-scale MFCs will likely be membrane-less becausemembranes are expensive and easily fouled and they exert a large internal resistance.This will be discussed in Sect. 14.4.

416 L. Huang et al.
Fig. 14.2 Single-chambered air-cathode MFCs with different working volumes of 28 mL(a), 250 mL (b), 1 L (c), and 1.6 L (d) (Reprinted from Cheng and Logan [100] with kindpermission of © Elsevier)
14.2.3 Electron-Transfer Mechanisms
MFCs are capable of directly transforming the chemical energy stored in organicmaterials to electricity via electrochemical reactions associated with biofilm bacteria[104, 105]. These are generated by various microbial consortia, including Gram-negative and Gram-positive bacteria [106] from many microbially rich sourcessuch as sewage sludge, activated sludge, and industrial and domestic effluents.Even the eukaryote S. cerevisiae can perform electron transfer from substratefuels to the anode [42]. A pure culture of Shewanella species (typically MR-1) isfrequently used as a model bioanode catalyst due to its multiple electron-transfermechanisms including outer membrane-bound cytochromes [51], conductive pilifor direct electron transfer [107], and locally secreted (endogenous) or added(exogenous) mediators such as riboflavin and quinones [108–111] (Fig. 14.3 andTable 14.2). By using optically transparent nanoelectrodes and in situ opticalimaging, it had been found that S. oneidensis MR-1 performed electron transfermainly by mediated mechanism, based on the measured currents uncorrelatedwith the number of bacteria on the electrodes [12, 13]. S. decolorationis NTOU1analyzed by the combination of electrochemical and instrumental analysis suchas cyclic voltammetry and high performance liquid chromatography also exhibitedsimilar characters [55].
Members of the Geobacter genus can directly reduce insoluble oxidants includ-ing minerals and electrodes in the absence of soluble extracellular electron-transfermediators. Using cyclic voltammetry, it was defined that the c-type cytochromes Z,B, S, E (a conductive network of bound electron-transfer mediators) and type IVpili (surface-dependent electron conduits) of G. sulfurreducens strains in biofilmspossess the capacity for homogeneous (biofilm/bulk solution) electron transferand/or heterogeneous (biofilm/electrode interface) electron transfer (Table 14.2)[123]. Recently, Pd (0) nanoparticles biologically transformed from Pd(II) cationsby sulfate-reducing bacterium Desulfovibrio desulfuricans and bound to the cell

14 Wastewater Treatment with Concomitant Bioenergy Production. . . 417
H+
H+
e−
e−
e −
Medox
Medred
e−
RD + H+
RD + H+
RD
+ H+
OD
OD
OD
e−
e−
e−
Anode
H+
Fig. 14.3 Schematic of electron-transfer mechanisms at the anode via membrane-bound
cytochromes ( ), conductive pili ( ), and secreted or added mediators ( ). ODoxidized electron donor, RD reduced electron donor
membranes were illustrated to facilitate direct electron transfer from D. desulfu-ricans to the anode [114]. These results provided the first direct electrochemicalevidence for the role of bound electron-transfer mediators as well as bio-derivedmetal nanoparticles bound to the cell membrane in anode-reducing microorganismsand, therefore, are useful to advance strategies to increase the power density ofMFCs.
Except for the electron-transfer mechanisms of outer membrane-bound cy-tochromes and secreted or exogenously added redox mediators frequently re-ported in the literature, the bacterial nanowire electron-transfer mechanism is notthoroughly investigated, except those involving limited observations using scan-ning/transmission electron microscope. Some studies indicated that the formation ofmicrobial pilus nanowires on anodes was required for maximum power production[117], which is associated with enhanced current production in both pure andmixed culture reactors (Table 14.2) [78, 120]. However, in comparison with themodel wild-type strain of G. sulfurreducens, pilA-deficient G. sulfurreducens MA

418 L. Huang et al.
Table 14.2 Anodic electron transfer mechanisms and methods for debottlenecking
Mechanism category Molecules or structures Comments
Direct electrontransfer (DET)
c-type cytochromes andheme proteins [76]
Only monolayer sessile cells donateelectrons to the anode because cellsare poor electron conductors
Shewanella spp. not only have outermembrane cytochromes for directelectron transfer by contact but alsoextrude electrically conductivenanowires as well as produce flavinsas electron shuttles [107, 111–113]
Pili (nanowires) The microbial palladium nanoparticlesfacilitate the direct electron transferbetween Desulfovibrio desulfuricansand the anode [114]
Sessile cells can be linked together in anetwork by pili. Multiple layers ofsessile cells may be able to denoteelectrons [115]
Shewanella oneidensis [107], Geobactersulfurreducens and pilA-deficient G.sulfurreducens MA [78, 116–120].The pilT mutant [121] has more pili toconduct electrons
Genetically engineered superbugs withhyperpiliation will be a majorbreakthrough to alleviate theelectron-transfer bottleneck
Mediated electrontransfer (MET)
Exogenous mediators:neutral red, thionin, andmethyl viologen [99]
Cytotoxicity, cost, and disposal problems
Endogenous mediators:pyocyanin, 2-amino-3-carboxy-1,4-naphthoquinone,riboflavin, flavins,pyocyanin, ACNQ[108–111, 122]
Synergistic microbes secrete them tobenefit the entire biofilm community.Genetically engineered superbugs willsecrete them at sufficiently large localconcentrations
exhibited abundant filaments similar to type IV pili in transmission electron micro-graphs (Table 14.2). This observation indicated that different microbes can producefilaments that appear similar but have a different function(s) [116]. While PilR,an enhancer binding protein, has been recently illustrated to regulate productionand assembly of pili and flagella in G. sulfurreducens [124], direct experimentalevidences of electron transfer along the line of bacterial nanowires were recentlyobtained by using two techniques: (1) a nanofabricated electrode patterned on topof an individual nanowire and (2) using a conductive atomic force microscopy(AFM) tip with a dissimilatory model metal-reducing bacterium of S. oneidensisMR-1 touching various points along a nanowire linked to a metallic electrode [125].

14 Wastewater Treatment with Concomitant Bioenergy Production. . . 419
Fig. 14.4 Schematic diagramof a 24-well microbial fuelcell (MFC) array as shown inHou et al. [126]. Composedof an anode layer (1 anodeelectrode layer, 2 anode welllayer), a proton exchangemembrane (3 PEM), and acathode layer (4 cathode welllayer, 5 cathode electrodelayer)
In MFCs, electron transfer from bacteria to the anode is often a rate-limiting stepin current production. Additional work is needed to investigate the composition ofthese putative nanowires and their roles in bioanode systems.
14.2.4 Use of “Superbugs” to Resolve Electron-TransferBottlenecks
Since the early 1970s, the advent of true cloning techniques, mutagenesis viachemical, transposon, allelic exchange, etc., genome sequencing, and polymerasechain reaction technology have allowed the burgeoning of publications regardingimportant information about a myriad of microbiological processes, metabolicprowess, competitive tendencies, and overall fitness. However, only until the last3–4 years has the MFC field gained significant ground to realize the potentiallyremarkable impact of genetic tools to generate bacteria with significantly greaterelectrogenic properties as well as the production of biogases and useful by-productsof wastewater metabolism.
The major limitations thus far in the generation of “superbugs” is the current“love affair” of many MFC scientists with the known electrogenic organisms suchas Geobacter and Shewanella species. For example, if one plugs in the words“Shewanella,” “Geobacter,” and “microbial fuel cell” into the academic searchengine PUBMED, there are 97 hits as of March 2011. Thus, despite the fairly largenumber of known electrogenic bacteria, the majority of studies involve studies onMFCs powered by these organisms. A recent paper by Hou et al. [126] showedelegantly in a high throughput, 24-well format (Fig. 14.4) that the overall powerdensities of the top electrogenic bacteria varied only modestly (˙10%). Althoughnot at all to be considered a major negative, the metabolic properties of Shewanella

420 L. Huang et al.
and Geobacter species certainly pale with known, highly competitive soil-dwellingorganisms such as species of the genera Actinomyces, Bacillus, Burkholderia, andPseudomonas. Many of the organisms with high electrogenic properties includemembers of the genera Bacillus, Enterobacter, Arthrobacter, Stenotrophomonas,Aeromonas, Shewanella, Paenibacillus, and Pseudomonas.
14.2.4.1 The Future: How We Would Create “Superbug” ElectrogenicBacteria
First thing’s first: enhance the biofilm forming capacity of electrogenic bacteria.Bacteria in the laboratory are typically grown in rich or minimal media and growas what are commonly referred to as planktonic or free-swimming organisms.However, because electrons cannot “swim” in an aqueous solution, for optimalMFC power generation, it would behoove scientists to optimize bacterial structureson the anodic surface where organisms can develop as highly differentiated,three-dimensional structures known as biofilms, a monumental global problem.Biofilms have been studied for more than three decades when the term “biofilm”was actually coined by the “father” of biofilm research, Bill Costerton of theUniversity of Southern California in 1978. There are at least five known stages ofbiofilm development. These include (1) the initial attachment phase, (2) irreversibleattachment, (3) maturation stage I, (4) maturation stage II, and finally (5) dispersion.A number of genes of the soil-dwelling opportunistic pathogen Pseudomonasaeruginosa (PA) are involved in biofilm formation and other features involved inthe process of biofilm development, some of which are listed in Table 14.3. Shownin Fig. 14.5 is a cartoon of the types of biofilms that would be optimized withstrategically engineered genetic manipulations described in detail below.
14.2.4.2 Mutations to Enhance Electrogenesis in MFCs
Mutations that we would generate using hypothesis-driven science to enhanceelectrogenesis in MFCs using the metabolically voracious and genetically tractablefacultative bacterium, P. aeruginosa:
1. Increase the number of type IV pili on the cell surface. In the followingsections, we will use the paradigm of a metabolically robust, biofilm-forming,mediator-generating bacterium, P. aeruginosa, to suggest potential genes thatcould influence the overall electrogenic properties in an MFC system. Anothermeans by which bacteria can enhance the conductivity of metabolically generatedelectrons via normal metabolism is via the synthesis of tiny, hollow, andretractable surface appendages termed type 4 pili that emanate from the surfaceof many bacteria. Relating to the overall efficiency of MFCs, both Shewanellaand Geobacter species have been shown to conduct an electrical current, inpart, through their pili [117, 141]. Both of these bacteria possess 3-start helical

14 Wastewater Treatment with Concomitant Bioenergy Production. . . 421
Table 14.3 Pseudomonas aeruginosa genes known to be involved in biofilm formation,maturation or structure (part of this table from Hassett et al. [127])
Gene PA# Function Biofilm phenotype References
bdlA 1423 Putative chemotaxisregulator
Inability to disperse [128]
crc 5332 Catabolite repressor controlprotein
Dispersed monolayer [129]
cupA1–5 Cup fimbriae Early stages of biofilmformation
[130]
fimL Twitching motility Abnormal biofilmdevelopment
[131]
fimX 4959 Diguanylate cyclaseGGDEF domain
Poor biofilm formation [132]
fliC 1092 Flagellin type B Little or no biofilm [133]lasI 1432 Autoinducer synthase Flat, undifferentiated [134]morA 4601 Motility regulator Poor biofilm formation [135]PA0169 0169 Diguanylate cyclase
GGDEF domainPoor biofilm formation [132]
PA5487 5487 Diguanylate cyclaseGGDEF domain
Poor biofilm formation [132]
pilA 4525 Type IV pilin Little or no biofilm [133]phoQ 1180 Two-component senor Poor biofilm formation [136]pslAB 2231–2 Exopolysaccharide
synthesisAdherence defects [137, 138]
sadB 5346 Biofilmformation/swarming
Reversible/irreversibleattachment
[139]
tpbB 1120 Diguanylate cyclaseGGDEF domain
Poor biofilm formation [140]
assemblages of tiny, type 4 pili that have high homology with the N-terminalregion of the classical type 4 pili of P. aeruginosa. Pili can bind directly with amyriad of inanimate or animate surfaces. Once bound, they can undergo a formof organized movement known as twitching motility (TM). The end of the pilusis very much akin to a grappling hook that binds to a surface allowing for TM totake place, release of the pilus, and repetition of this cycle. Chiang and Burrows[121] have noted a lack of twitching motility and hyperpiliation of pilT mutantbacteria. They also noted that the formation of a robust biofilm is promotedby attachment and cell-to-cell adhesion rather than twitching motility. Thus,reducing twitching motility not only enhances the formation of P. aeruginosabiofilms but also will likely increase the power density of MFCs.
2. Prevent dispersion of PA biofilms. To date, it is now well recognized that thelast stage of biofilm development and maturation is that involving a chemotacticresponse by viable cells within the biofilm. This process is called biofilmdispersion, involving a physical dispersal of bacteria from the biofilm matrix.Biofilm dispersion is now a field of intense interest of late due to the rapidlyidentification of emerging dispersion-related gene products that could one daybecome viable drug targets against this important organism. Many genetic

422 L. Huang et al.
Wild-type
Normal Biofilm Normal Biofilm
pili
ΔfliCΔfliC
ΔfliCΔfliC
ΔfliC
ΔpilTΔpilT
ΔpilTΔpilT
ΔbdlA Δpel/pslΔpel/pslΔrpoS
ΔbdlAΔbdlA
DirectionofFlow
BiofilmDispersion
Biofilm + Chemoattractant/RepellantTo Trigger Dispersion Events
Biofilm
BacteriaSuggested Mutations
BiofilmDispersion
BiofilmDispersion
NoDispersion
NoDispersion
NoDispersion
Normal Biofilm Normal Biofilm Biofilm - Matrix Biofilm - Matrix+ PCN
Fig. 14.5 Schematic diagram of bacterial structure, biofilm formation characteristics, and dis-persion properties of P. aeruginosa strains with single or multiple genetic mutations to optimizeelectrogenic properties in an MFC
determinants involved in biofilm dispersal have been identified by S. Lory andcolleagues at Harvard [132]. These involve a physiological process involvingintracellular signaling via levels of bis-(30-50)-cyclic dimeric GMP (c-di-GMP)mediated by diguanylate cyclases (DGCs) and phosphodiesterases (PDEs).
However, in an MFC, it is advantageous to maintain bacteria in biofilmspresent on the anode surface, thus preventing dispersion, to ensure maximalelectron transfer to anode and hence the current density. In contrast, bacteria thatdisperse from biofilms would decrease the level of electron transfer. Therefore,it is advantageous to utilize bacteria that have a limited ability to disperse frombiofilms. This apparent limitation can be created by constructing genetic mutantslacking proteins responsible for chemotaxis. A P. aeruginosa gene known asbdlA (biofilm dispersion locus) was found by Morgan et al. [128] to be requiredfor bacterial dispersion from biofilms. Thus, bacteria lacking bdlA causes adisruption of a cellular circuit that paralyzes the ability of attached bacteria todetach, thus maximizing sessile cell density on the anode.
3. Limit production of nutrient-restrictive biofilm matrix. Overproduction of thethick matrix of biofilms that is composed mostly of polysaccharide, protein, lipid,and DNA/RNA could arguably significantly impact the overall performance ofan MFC. A less dense exopolymeric matrix surrounding a robust biofilm on ananode surface would have a reduced mass transfer resistance for the nutrientsin the bulk fluid to reach the cells on the anode surface. Davies et al. [134]showed that lasI mutants of PA form thinner, more compact biofilms than theparental strain. Yet the cell density attached to the glass surface is very high,

14 Wastewater Treatment with Concomitant Bioenergy Production. . . 423
Fig. 14.6 Scanning electron micrographs of P. aeruginosa PA14 colonies. (a) PA14 wild type.(b) pelA. Colonies were grown for 7 days at room temperature on 1% agar with 10 g L�1 tryptoneplus 0.2% glycerol. Matrix material appears to surround the wild-type cells in (a) and is absentfrom the pelA mutant sample (Reprinted from Friedman and Kolter [142] with kind permission of© John Wiley and Sons)
thereby adding additional surface attachment properties. These organisms alsodisplay decreased polysaccharide production in the biofilm matrix. Anotherpositive of the lasI mutants is that they overproduce the redox-active antibioticpyocyanin (PCN, discussed below), which has been shown to be mediator ofelectron transfer in previous MFC studies using P. aeruginosa [122]. Othergenes known as pel (for pellicle) and psl (polysaccharide locus) also affectpolysaccharide formation in biofilms. Specifically, Friedman and Kolter [142]were able to show that a pelA mutant of P. aeruginosa PA14 lacked the matrixthat typically encases biofilm bacteria as shown in Fig. 14.6. Therefore, suchmutations could also enhance MFC performance.
4. Inhibit anaerobic respiration. PA can undergo an alternative form of respiratorymetabolism in the absence of oxygen (Fig. 14.7 for aerobic vs. anaerobicrespiration scheme) known as anaerobic respiration or denitrification. NO3
�reductase (NAR) is the first step in the eight-electron reduction of NO3
� toN2. The enzyme is located on the cytoplasmic side of the inner membrane. Therationale behind genetic inactivation of narG is that the electrons generated fromoxidation of carbon molecules at the MFC anode will be directed solely to theanode and not diverted to the task of dissimilatory NO3
� reduction even if NO3�
is present in the wastewaters. In contrast, NO2� reductase (NIR) is the second
step in the overall process of NO3� reduction to nitrogen gas during anaerobic
respiration. NIR catalyzes both the one-electron reduction of NO2� to NO but
also the four-electron reduction of O2 to 2H2O. Therefore, nirS would also beinactivated to ensure that electron flow is maximized through the pili and notthrough anaerobic NO3
� reduction. Inactivation of the nirS gene will also ensurethat the greenhouse gas, nitrous oxide (N2O), is not produced.

424 L. Huang et al.
Fig. 14.7 Aerobic (top) vs. anaerobic (bottom) respiration in PA (a schematic diagram)
5. Maximize production and secretion of electrogenic mediators. P. aeruginosalacking the stationary phase sigma factor RpoS overproduces the blue phenazineantibiotic PCN [143]. Rabaey and colleagues [122] have previously shown thatthe secreted redox-active mediator pyocyanin from P. aeruginosa was essentialfor optimal electrogenesis in an MFC. In addition, a mutant lacking PhzSoverproduced aeruginosins A/B, collectively also referred to as pyorubrin (PR), adeep red pigment. This mutant was found to provide significant power generationeven without added PCN [122, 144].
Thus, because biofilm formation on inanimate surfaces are not entirelyhomogenous, areas upon which cells have died or sloughed off such surfacescould still provide surface area for reduced mediators such as PCN/PR in thesuspensions to fill the electron reduction void left by the uncolonized anodicbacteria.
6. Control rate of cell division. All bacteria reproduce by binary fission and thereplication rate of P. aeruginosa in rich medium is typically less than 30 minat 37ıC. Thus, it is critical to be able to tightly control the cell division rate ofthese organisms at the anodic surface to prevent potential unanticipated problemsassociated with biofilm matrix accumulation, clogging of the MFC or prematurecell death of the bacteria. Thus, yet another genetic modification could be madethrough the stringent control of ftsZ, a gene encoding a protein responsible forcell division. We fully realize that construction of an isogenic ftsZ mutant isnot possible because it is an essential gene [145]. However, the precise controlof the production of FtsZ can be achieved by placing the ftsZ gene under tight
14 Wastewater Treatment with Concomitant Bioenergy Production. . . 425
genetic control using promoter systems that are inducible by low concentrationsof non-metabolizable substrates such as the simple plant sugar, arabinose, andultimately placing the entire construct in the nonessential attB site on the PAchromosome [146] copy with 1% arabinose [147].
7. Increase the rate of substrate oxidation. Uncouplers are compounds that whenadministered to bacteria or mitochondria separate the normally coupled pro-cesses of oxidation and phosphorylation, thereby dissipating the proton gradientfrom the periplasmic space to the cytoplasm. Thus, bacteria treated with theclassical uncoupler, dinitrophenol, will have an equal concentration of protonsin both the periplasmic space and cytoplasm. By dissipating the proton gradient,the rate of substrate oxidation and hence electron flow to the anode will likelyincrease substantially. However, we do not propose the use of a chemicaluncoupler. Rather, we propose using eukaryotic uncoupling proteins. Thesecould include thermogenin, UCXP-1, UCP-2, or UCP-3 under an inducible (e.g.,tet/arabinose) system into an ectopic nonessential site on the chromosome. Werethese uncouplers to be expressed in PA or other bacteria, the rate of substrateoxidation would likely increase dramatically and enhance the power densityof MFCs.
14.3 Biocathode MFCs for Wastes and WastewaterTreatment
14.3.1 Chemical Cathode
In comparison with the extensive investigations on the overall behavior of the MFCanode in the context of MFC performance, events occurring at the cathode have onlyrecently attracted attention. In lab investigations, ferricyanide is a typical electronacceptor used in chemical cathode MFCs due to its small overpotential loss. Thehighest power produced from an MFC using a potassium ferricyanide cathodereached 450 W/m3 [148]. However, using ferricyanide is not feasible in practicalapplications due to its cost and toxicity. Alternatively, some oxidants like Mn(VII),Cr(VI), V(V), Cu(II), and U(VI) widely present in some wastes and wastewater havebeen used as electron acceptors in MFCs due to their comparatively high redoxpotentials [149–154] (Table 14.4). In comparison with hexacyanoferrate, usingMn(VII) increased power production 4.5-fold [153], while using Cr(VI) produceda power of 2.2 W/m3 at a Cr(VI) removal rate of 0.67 mg/L/h [152]. At the sametime, the real electroplating wastewater had been tested as an oxidant in MFCs.A maximum power density of 16 W/m3 with a Cr(VI) removal rate of 8.1 mg/L/hhad been achieved with a Cr(VI) wastewater stream containing 204 mg/L Cr(VI)[149]. Using graphite cathode coated with rutile achieved a Cr(VI) reduction rateof 0.97 mg/L/h with light irradiation in comparison with 0.77 mg/L/h without lightirradiation [150].

426 L. Huang et al.
Tab
le14
.4Po
llut
ants
redu
ced
inM
FCs
wit
hch
emic
alca
thod
es
Type
ofsu
bstr
ate
Ele
ctro
ndo
nor
Rea
ctor
and
elec
trod
eO
pera
tion
mod
eE
lect
ron
acce
ptor
Subs
trat
ede
grad
atio
nra
tea
Pow
er(W
/m3)b
Ref
eren
ces
Nit
rilo
tria
ceti
cac
idN
itri
lotr
iace
tic
acid
,bi
oano
de
Two-
cham
bere
d,gr
aphi
tefe
ltan
ode
and
cath
ode
Bat
chO
218
.40.
0000
576
[155
]
Aci
d Ora
nge
7A
ceta
teTw
o-ch
ambe
red,
gran
ule
grap
hite
anod
ean
dca
thod
e
Ano
dean
dca
thod
eco
ntin
uous
lyfe
dA
cid
Ora
nge
7pH
7.0
36.2
–59.
50.
3–0.
6[1
56]
Nit
robe
nzen
eA
ceta
teTw
o-ch
ambe
red,
gran
ule
grap
hite
anod
ean
dca
thod
e
Ano
lyte
and
cath
olyt
ere
-cir
cula
ted
and
cont
inuo
usly
fed
Nit
robe
nzen
epH
7.0
6.66
0.06
[157
]
Glu
cose
Two-
cham
bere
d,ca
rbon
fiber
brus
han
ode
and
carb
oncl
oth
cath
ode
wit
hPt
cata
lyst
Bat
chan
ode
and
reci
rcul
ated
cath
ode
Nit
robe
nzen
epH
3.0
182.
56.
3[1
58]
iopr
omid
eA
ceta
teTw
o-ch
ambe
red,
gran
ular
grap
hite
anod
ean
dca
thod
e
Ano
lyte
and
cath
olyt
ere
circ
ulat
ed
Iopr
omid
epH
7.0
0.28
–0.8
c[1
59]
p-ch
loro
-ph
enol
Ace
tate
Two-
cham
bere
d,ca
rbon
fiber
anod
ean
dca
thod
e
Bat
chp-
chlo
roph
enol
pH7.
01.
330.
124
[160
]
Cr(
VI)
Ace
tate
Two-
cham
bere
d,gr
aphi
tepl
ate
anod
ean
dca
thod
e
Bat
chC
r(V
I)pH
2.0
0.67
2.2
[152
]
Ace
tate
Two-
cham
bere
d,ca
rbon
felt
anod
ean
dgr
aphi
tepa
per
cath
ode
Bat
chC
r(V
I)pH
2.5
8.1
16[1
49]

14 Wastewater Treatment with Concomitant Bioenergy Production. . . 427
Mn(
VI)
Glu
cose
Two-
cham
bere
d,ca
rbon
pape
ran
ode
and
carb
oncl
oth
cath
ode
Bat
chM
n(V
I)pH
3.6
5.8
2.2
[153
]
Glu
cose
Bus
hing
MFC
,car
bon
pape
ran
ode
and
carb
oncl
oth
cath
ode
Bat
chM
n(V
I)pH
3.6
Not
prov
ided
79.7
[153
]
Se(I
V)
Glu
cose
Sing
le-c
ham
bere
d,ca
rbon
clot
han
ode
and
Pt-c
oate
dca
rbon
clot
hca
thod
e
Bat
chSe
(IV
)pH
7.0
1.26
25[1
61]
Ace
tate
Sing
le-c
ham
bere
d,ca
rbon
clot
han
ode
and
Pt-c
oate
dca
rbon
clot
hca
thod
e
Bat
chSe
(IV
)pH
7.0
0.47
18.4
[161
]
V(V
)G
luco
seTw
o-ch
ambe
red,
carb
onfib
eran
ode
and
cath
ode
Bat
chV
(V)
pH2.
01.
767.
3[2
4,15
4]
Cu(
II)
Ace
tate
Two-
cham
bere
d,gr
aphi
tepl
ate
anod
ean
dgr
aphi
tefo
ilca
thod
e
Con
tinu
ous
Cu(
II)
pH3.
06.
941.
2[1
51]
Ace
tate
Gra
phit
epl
ate
anod
ean
dgr
aphi
tefo
ilca
thod
e
Con
tinu
ous
Cu(
II)C
O2
pH3.
05.
902.
2[1
51]
a Cal
cula
ted
onth
eba
sis
ofne
tcat
hodi
cco
mpa
rtm
ent(
mg/
L/h
)bPo
wer
outp
utca
lcul
ated
onth
eba
sis
ofne
tcat
hodi
cco
mpa
rtm
ent(
W/m
3)
c Setc
atho
dic
pote
ntia
lvs.
stan
dard
hydr
ogen
elec
trod
e(S
HE
)(V
)

428 L. Huang et al.
Recently, Pandit and coworkers [162] studied four types of electron acceptorsin a chemical cathode MFC and found that potassium persulfate was the mostsuitable electron acceptor due to its higher open circuit potential and a longer periodof sustained voltage output although permanganate showed the highest power.Copper ions, often present in the mining and metallurgical industries, can be usedas an oxidant at the cathode in MFCs for electricity production and recovery ofmetallic copper at the cathode [151]. Introducing oxygen in the system increasedthe maximum power density of MFC from 1.2 to 2.2 W/m3 but decreased thecopper recovery from 84% (anaerobic) to 43% (aerobic). This metallurgical MFCtechnology provides a potential strategy for metal recovery with simultaneouswastewater treatment [151]. Besides some oxidative heavy metals, some oxidativeorganics like chlorophenol, azo dyes of Acid Orange 7, nitrobenzene, nitrophenol,and iopromide can also be used as oxidants for reduction at the abiotic cathode[156, 157, 159, 160, 163] (Table 14.4). p-Chlorophenol can be degraded at a rate of1.33 mg/L/h with simultaneous electricity generation of 0.124 W/m3 [160] whilewith the presence of scrap iron, a higher degradation rate of 11.5 mg/L/h forp-nitrophenol and an electricity generation of 0.56 W/m3 were achieved with anabiotic cathode [163]. Combined with the oxidative conditions in the anode andreductive environment in cathode, employing sulfide as an electron donor in theanode chamber and V(V) as an electron acceptor in cathode chamber can achievesulfide oxidation at anode and V(V) reduction at cathode simultaneously [24, 154].This abiotic-cathode MFC provided a proof-of-concept strategy for treating twokinds of wastewater streams at the same time. The efficiency of this system wasinfluenced by the solution pH, catholyte concentrations, dissolved oxygen, andoperation modes (Table 14.4) [154, 156, 157, 159].
With respect to the types of electron acceptors, oxygen is regarded as a betterchoice as its advantages such as sustainability, free availability, and high redoxpotential. However, the overpotential of interfacing electro-catalyzed reactions ofoxygen at the cathode is high in the neutral pH medium in MFCs, resulting inlow power generation and requirement of precious metals such as platinum ascatalysts [164]. Platinum is an effective cathode catalyst, but it is prohibitivelyexpensive. Additionally, polymer coatings and binders are also used to prepareefficient air-cathode MFCs [165]. Some more inexpensive metal materials such aspyrolysed iron(II), phthalocyanine, and cobalt tetramethoxyphenylporphyrin havebeen touted as alternative catalysts for oxygen reduction at air cathodes [102, 166].Recently, manganese-based catalysts prepared by a chemical precipitation methodor an electrochemical deposition method provided a cost-effective material foroxygen reduction in MFCs although its performance was not as good as that of Pt[35, 167]. Besides catalysts, electrode-based materials such as carbon also affect theperformance of the electrode in the presence of heteroatoms (O, H, S, N) bonded onthe surface of carbon particles. For example, carbon cloth cathode and anode bothmodified with carbon nanotubes improved the system performance [70].
Electrodes using carbon powder (Vulcan XC-72R) as catalyst support materialshowed varied performances in oxygen reduction if treated with 5% nitric acid, or0.2N phosphoric acid, or 0.2N potassium hydroxide, or 10% H2O2. HNO3-treated

14 Wastewater Treatment with Concomitant Bioenergy Production. . . 429
Vulcan carbon-supported Pt catalyst demonstrated a higher current density of1,115 mA/m2 than the untreated carbon-supported Pt catalyst [168]. In contrastto using O2 as the electron acceptor, photo-generated electrons at semiconductorconduction band can reduce protons in the catholyte, while the holes in valenceband recombine with the biological electrons generated at the anode, providing thepossibility of solar energy for MFCs [169]. By employing a p-type Cu2O nanowire-arrayed photocathode and S. oneidensis MR-1, Qian et al. [169] successfullyestablished a solar-driven, self-biased microbial photoelectrochemical cell in uti-lizing solar energy for microbial electricity generation, opening new opportunitiesfor microbial/nanoelectronic hybrid devices with possible applications in energyconversion, environmental protection, and biomedical research. However, using asurface-based biofilm is not competitive compared with a volume-based suspensionalgal culture in the utilization of solar energy. Furthermore, solid-state photovoltaicdevices are more practical.
14.3.2 Aerobic Biocathodes
MFCs used for practical applications must be inexpensive and sustainable. Usingbacteria instead of the precious metal Pt or added ferricyanide as cathode catalysts,MFCs with biofilm-catalyzed biocathodes could satisfy these demands and enhancethe economic viability and environmental sustainability of MFC systems. In thisform of MFCs, both the anodic and the cathodic reactions are catalyzed by microbesgrowing as biofilms, are known as full biological MFCs. The biocathode can beboth aerobic and anaerobic depending on the oxidant involved. Aerobic biocathodesusing oxygen or ambient air as a terminal electron acceptor have been extensivelystudied [170–172]. Recently, an aerobic biocathode was used successfully to decol-orize the liquid of azo, dyes and it completely degraded them with simultaneousimproved electricity generation, illustrating its potential application of MFCs forrecalcitrant wastewater treatment and waste remediation [173].
At an aerobic biocathode, oxygen reduction could be catalyzed directly bymicroorganisms or indirectly via mediators such as manganese and Fe2C/Fe3C.However, electron transfer at the biocathode was not likely carried out through pilusnanowires. More research on the electron-transfer mechanism is still needed. Inaddition, a quantitative link between the accepted electrons by microorganisms andthe subsequent oxygen reduction has not yet been fully appreciated because thebacteria inside can reduce oxygen in diverse pathways [174]. Parameters includingcathode potential, mass transfer, and electrode materials were also illustrated tolimit the system performance significantly [175, 232]. System optimization basedon these factors is therefore necessary for an efficient aerobic biocathode.
Biocathode research has attracted much attention in the past couple years.However, the implementation of biocathodes still face several challenges such asthe requirement of dissolved oxygen and the transfer of oxygen from the cathode tothe anode chamber if an aerobic biofilm is used on the cathode and the buildup

430 L. Huang et al.
Fig. 14.8 Configuration of interdependent photosynthetic microbial fuel cells (Redrawn afteroriginal drawing of Malik et al. [180]). A anodic bacteria, B cathodic bacteria, C anaerobicallybacterial dissimilation, D Aerobically bacterial dissimilation, E photosynthetic organisms)
of a pH gradient between anodic and cathodic chambers that adversely affectssystem performance [176]. A sufficiently low air supply to the cathodic chambercan prevent oxygen transfer to the anode to some extent [177]. Repeated inversionof the anode and cathode or changing the anode and cathode alternatively is aneffective way to decrease the oxygen transfer [91]. Considering the requirementof relatively small quantities of dissolved oxygen to sediment MFCs, aerobicbiocathodes may be better applied for sediment MFCs [178, 179]. Using sunlightand an MFC, long-term electricity generation from sunlight without replenishmentof the MFCs reactants was possible because that the reactants of an MFC (organicmatters and oxygen) were internally regenerated by a photosynthetic microbialconsortium whose reactants (carbon dioxide and water) were the products of theMFCs (Fig. 14.8) [180, 181]. Much work is still needed to increase the rate of masstransport at the anode, provide effective microorganisms for high glucose yield,and optimize the design of MFCs with high current densities [180]. When MFCsuse sunlight as the energy input for the sole purpose of generating electricity, theyhave to compete directly with photovoltaic technology that is cheaper and far moreadvanced. Thus, MFCs powered by sunlight will more likely remain as an academiccuriosity or, at best, a tool to study bioelectrochemistry in MFCs.

14 Wastewater Treatment with Concomitant Bioenergy Production. . . 431
Yet another creation used the interaction between mixed heterotrophic bacteriain sediments with plants such as reed manna grass (Glyceria maxima) [182] andrice plants [183, 184] formed a new type of MFC, sediment-type photoMFCs[182], providing a direct correlation between photosynthetic activity and powerproduction. In this form of an MFC, the plants’ photosynthetic process producesrhizodeposits as fuel source in MFCs for electricity generation.
14.3.3 Anaerobic Biocathodes
Because of the limitations of aerobic biocathodes for reductive removal of con-taminants in wastewater, researchers quickly turned to anaerobic biocathodes.Contaminants removed at the anaerobic biocathode include nitrate, sulfate, CO2,Cr(VI), Mn(IV), U(VI), fumarate, perchlorate, trichloroethene, tetrachloroethene,2-chlorophenol [172, 176, 185–193, 227, 233–236], and CO2 [188]. Nitrate hasbeen extensively studied because the standard reduction potential of the NO3
�/N2
couple is relatively high (E00 D C0.74 V), and nitrate is a common pollutant inagricultural runoffs. Biological nitrate reduction was initially demonstrated byremoving electrons from the cathode using a potentiostat-poised half cell [190, 194].Clauwaert and coworkers [170] succeeded in nitrate removal from catholyte in acompletely biological MFC. Optimizing solution chemistry and using a flow loopoperation can improve the efficiency of nitrate reduction [94, 195, 196], in whichthe operational conditions affected bacterial metabolism and biofilm robustness, butnot the phylogenetic affiliation of dominant bacteria [197].
Most people shy away from sulfate reduction in wastewaters by biocathodes,because it has a negative standard potential and more importantly it generateshydrogen sulfide gas that is toxic and has a strong repugnant odor at even verylow concentrations. However, sulfate is a major pollutant in agricultural runoffs.New heterogeneous catalysts are being developed to remove or catalytically converthydrogen sulfide to product(s) with no odor. It is claimed (http://www.swapsol.com)that the Stenger-Wasas process reacts hydrogen sulfide gas with carbon dioxide gason a solid heterogeneous catalyst in an exothermic and kinetically favorable (ator below 25ıC to 150ıC and above, 15–700 psia) reaction that reduces hydrogensulfate to below 4 ppb in a single pass.
Most perchlorate manufactured in the USA is intended for use as an ingredientin solid fuel for missiles and rockets. However, it is now routinely detected inmunicipal water supplies. Using 2,6-anthraquinone disulfonate as a mediator, per-chlorate was indirectly reduced by Dechloromonas agitata strain CKB and Azospirasuillum strain PS [235]. H2 utilization by conventional perchlorate-reducing bacteriaprobably occurred with the applied potential of �0.3 V (vs. standard hydrogenelectrode, SHE) in this system. The perchlorate-reducing bacteria in a denitrifyingbiocathode successfully reduced perchlorate without exogenous electron shuttlesupplementation [192]. The perchlorate-reducing biocathode was mainly composedof putative denitrifying betaproteobacteria that was totally different from the

432 L. Huang et al.
community of a purely denitrifying biocathode that is primarily composed ofputative iron-oxidizing genera [187]. This successful development of a perchlorate-reducing microbial community in a MFC biocathode supplied with nitrate andperchlorate makes this technology potentially suitable for treating water supplies,superfund sites, or industrial wastewaters with co-contaminants of perchlorate andnitrate [187].
Inoculating with a mixture of denitrifying and anaerobic bacteria in a biocathodeMFCs was successfully used to reduce Cr(VI) [233] in lab tests. Therefore, thediverse microbial consortia in wastewater are able to adaptively evolve for thedegradation of various contaminants in fed streams of MFCs [78, 174]. Besidesmetal contaminants, chlorinated compounds like trichloroethene, tetrachloroethene,and 2-chlorophenol were successfully reduced at biocathodes [185, 193, 198].A pure culture of Anaeromyxobacter dehalogenans, previously dechlorinating 2-chlorophenol in conventional biological process [199], performed not only directelectron transfer at the anode using acetate as an electron donor but also directlyaccepted electrons from a cathodic electrode with simultaneous reduction of 2-chlorophenol at a set biocathode potential of �300 mV (vs. SHE). This processprovided a potential strategy for efficient treatment of a variety of contaminantswith microbe-electrode interactions [193]. The reactor architecture and electrodesurface area had substantial effects on the performance of this MFC system.
Two-chambered and H-type architectures with graphite plate cathode and anodewere often used for MFCs with anaerobic biocathodes [233] (Fig. 14.9a). Huanget al. [175] reported that using graphite granules that have a high surface area canimprove Cr(VI) reduction rate and power generation [175] (Fig. 14.9a). An efficienttubular MFC coupled with proper ratio of cathode surface area to anode surfacearea further improved performance of biocathode MFC with Cr(VI) as a terminalelectron acceptor [200] (Fig. 14.9b). An increase in the cathode surface roughnessof the stainless steel cathode electrode colonized by G. sulfurreducens led to anincrease in current by a factor of 1.6 when fumarate was oxidized because the overallcurrent density increased with an increase in biofilm coverage [201].
In the case of CO2 reduction, a light-dependent biocathode can perform bicarbon-ate reduction, providing a potential method for carbon dioxide sequestration [188].With an external potential of less than �0.7 V (vs. Ag/AgCl), carbon dioxide can bereduced to methane by hydrogenophilic methanogenesis at the biocathode via directextracellular electron-transfer mechanisms. This indicates that methane can beproduced by a biocathode in an MFC as a fuel or a value-added product [202, 203].CO2 discharged from the anode can be directly utilized by the algae Chlorellavulgaris at the cathode, increasing a maximum power from 4.1 to 5.6 W/m3.This process demonstrated a potentially effective technology for CO2 emissionreduction with simultaneous voltage output without aeration [204]. Alternatively,C. vulgaris can accept electrons from the cathode via the mediator methylene blueto simultaneously remove CO2 from the atmosphere [237]. The drawback of usingMFCs for CO2 removal is that a surface-based technology rather than a volume-based technology is used in the case of an algal suspension. However, the latterdoes not produce electricity in the removal process.

14 Wastewater Treatment with Concomitant Bioenergy Production. . . 433
R0
PEM
Anode Cathode
Magnetic bar
Tubes for N2gas sparging
Sampling port
Referenceelectrode
Granular graphite
a
b
Fig. 14.9 Two-chambered anaerobic biocathode MFCs: H-type reactor with graphite platecathode or graphite granule cathode (a) and tubular-type reactor with graphite fiber/graphitefelt/graphite granule cathode (b) (Reprinted from Wang et al. [152] with kind permission of© Springer and Huang et al. [200] with kind permission of © Elsevier)

434 L. Huang et al.
Fig. 14.10 Electron-transfer mechanisms at a chemical cathode (a) and a biocathode (b) MFCs
14.3.4 Electron-Transfer Mechanisms for Cathodes
MFCs can be classified as either chemical cathode or biocathode MFCs basedon the catalysts used at the cathode. Chemical cathode MFCs use chemicalcatalysts on the cathode and biocathode MFCs use biofilm bacteria for catalysison the cathode. Accordingly, electrons from a chemical cathode are transferred toelectron acceptors directly or indirectly via the mediation of external added electronmediators with chemical catalysts (Fig. 14.10a). In contrast to chemical cathodes,biocathodes transfer electrons from the cathode substratum to the microorganismsdirectly or indirectly via mediators. But the mechanism for the subsequent electrontransfer from microorganisms to final electron acceptors is still unclear ([174],Fig. 14.10b). In comparison with bioanodes, in which electrons are transferreddirectly or indirectly via mediators or pilus nanowires, the precise mechanismunderlying the exceptional electron transfer of pili in biocathodes has not yetreported. S. putrefaciens can donate electrons to an anode via the extracellularelectron transfer with the help of secreted flavins, menaquinone-related redoxmediators, and outer membrane cytochromes [112, 205, 238, 239]. The organismcan also carry out electron transfer in microbially cathodic oxygen reduction viaan outer membrane-bound redox compound released into the surrounding medium[206]. The mechanism of electron transfer at a biocathode with G. sulfurreducensis different from that at a bioanode with the same bacteria [207, 240]. However,electron-transfer mechanisms between the electrode and S. putrefaciens are not fullyunderstood. It remains unclear whether the electron-transfer mechanism from the

14 Wastewater Treatment with Concomitant Bioenergy Production. . . 435
cathode to this bacterium is similar to that at the anode. Finally, electron transfer inbiocathodes can be revealed by investigating purified proteins that transfer electronsbetween the outer cell surface and the electrodes [123, 241, 242].
14.3.5 Outlook
While biocathodes have attracted much attention during the past few years, thereare still many technological hurdles before their practical application: (1) System-atically studying the effects of parameters such as electrode potential, electrodematerials, solution chemistry, mixed/pure cultures, biofilm thickness, pH, tem-perature, and reactor architecture on the performance of biocathodes is required.Additionally, investigation of the biocathode cost, duration, selectivity, stability,and the compatibility with operational conditions is essential for efficient wasteand wastewater treatment. (2) Much work is needed to overcome the loss oforganic matter in the anode chamber caused by leakage through the membranefrom the anode to the cathode and on reducing pH gradients caused by transportof specific ions with higher concentrations instead of protons through membraneresulting in acidification at the anode and alkaline production at the cathode,especially when two different waste streams are treated at the anode and cathodeseparately [208]. Using a loop to exchange anolyte and catholyte can balancepH gradients and make the biocathodes operationally sustainable [94, 170, 243].Another approach is to create a bioelectrode that can perform anodic and ca-thodic reactions alternately without the transport of protons through the membrane[91, 93]. Further investigations are needed.
14.4 Reactor Design Rationale for PracticalWastewater Treatment
In real-world wastewater treatment, there are several major concerns over the useof membranes. Membranes are a major cost factor in MFC construction. Theireasy fouling makes MFC operational sustainability unlikely attainable. In an idealMFC operation, electrons flow from anode to cathode through an external circuit,and internally, protons flow from the anode to the cathode in an unimpededfashion. If convective flow is permitted for a wastewater stream from anode tothe cathode, the internal resistance will be greatly minimized. However, this is notpossible with a membrane in place. Membrane-less MFCs have been proposed byseveral researchers for wastewater treatment. Figure 14.11 shows an upward flowmembrane-less MFC for wastewater treatment using an air cathode. In this kind ofdesign, upward flow helps oxygen bubbles to move upward to prevent back diffusionof oxygen into the anode region at a cost of energy input for pumping the flow.

436 L. Huang et al.
Fig. 14.11 An upflowmembrane-less MFC with anair cathode. The black dotsindicate sampling locations(Reprinted from Jang et al.[209] with kind permissionof © Elsevier)
Fig. 14.12 A membrane-less MFC with dual anodes and a supplemental oxidant stream
Figure 14.12 is a simplistic membrane-less MFC reactor proposed for wastewatertreatment. This kind of configuration is low cost and low maintenance. Two differentanodes with different biofilm consortia are used: one for digesting simpler moleculessuch as volatile fatty acids and small sugar molecules and the other for digestingcomplicated biomass such as lignocellulosic wastes. The electrode materials shouldbe inexpensive and have large surface areas such as graphite granules. Instead ofusing oxygen, a supplemental feed stream containing a dissolved oxidant such asnitrate can be used. Nitrate is readily available from agricultural runoffs. Coulombicefficiency can be greatly improved if the amount of organic carbons reaching thecathode is small or the cathode biofilm is impaired in utilizing them. Oxidantcontamination of the anode area can be reduced if the wastewater’s bulk-flow rate

14 Wastewater Treatment with Concomitant Bioenergy Production. . . 437
is sufficiently high. The flow direction in such a reactor can be horizontal or evendownward to minimize or eliminate energy input in fluid handling as long as oxidantbackflow is in check. A small amount of organic carbon reaching the cathode willreduce the CEs slightly, but it is actually beneficial for the cathode biofilm torejuvenate itself. The electrodes in Fig. 14.12 are modularized for quick replacementand offline biofilm resetting in order to reduce maintenance costs.
A fast axial flow rate in the simplistic design in Fig. 14.12 is only possible byusing highly efficient biofilms. Such biofilms will likely come from the new researchefforts on “superbugs” that can efficiently digest a large array of organic carbonsin wastewaters much more quickly than existing biofilm bacteria. Geneticallyengineered superbugs will likely be constructed before wild-type superbugs orbiofilm consortia containing superbugs are found.
14.5 Value-Added Products from MXCs
Based on a life-cycle assessment [210], environmental impact is a key driver forthe development of MFC technology. Application of MFC in wastes treatment andremediation of contaminated sites with simultaneous production of value addedby-products is arguably the main research theme for the future. While microbialelectrolysis cells (MECs) are being explored for new value-added products, thenewly developed microbial desalination cells (MDCs) have also substantiallybroadened the applications of MFCs. MFCs and their variants are called MXCs.
14.5.1 Microbial Electrolysis Cells for Value-Added Products
An electrically assisted MFC is a device that produces H2 at the cathode, in whichthe driving force is from the oxidation of organic matter by microorganisms atthe anode and the external power supply [211]. In this form of MFCs, organicmatter degradation occurs, and water is used to supply HC and OH� with aninternal voltage, a process that occurs in microbial electrolysis cells (MECs)[211, 212]. In a MEC, an external voltage must be applied to overcome thethermodynamic barrier. A voltage of 0.14–0.22 V is sufficient for H2 productionin MECs theoretically while a 0.25–0.5 V is actually needed due to electrodeoverpotentials and other losses. In comparison with the theoretical threshold of1.23 V and the actual value of 1.8–2.0 V required for water electrolysis [213],the 0.25–0.5 V for MECs is much lower and results in higher electrical energyefficiency. More importantly, this technology could degrade and utilize variousorganic materials including the large quantity of those in wastewaters. MECs presenta promising technology for wastewater treatment with concomitant bioproductproduction. Diverse reactor architectures with different operation modes, as wellas various anodic and cathodic materials that are the same as those used in MFCs

438 L. Huang et al.
coated with different catalysts such as platinum, Pd/Pt, and biocatalysts (biofilms),have been extensively investigated to improve volumetric efficiency [165, 191,214–216]. MFCs can supply some, if not all, of the needed electricity for MECs.An MEC-MFC combination was successfully demonstrated, in which the powergenerated from an MFC was utilized to offset the electricity needed by an MEC thatproduced biohydrogen [217]. A major challenge for MECs producing biohydrogenis to minimize methanogensis that consumes hydrogen to produce methane whilecompeting for carbon sources with exoelectrogenic microorganisms when singlechamber MECs are used [215, 216]. In another way, the utilization of carbon dioxidefor methane production via hydrogenophilic methanogenesis implied the productionof a value-added product of methane by a biocathode [202, 203].
In a conventional biological system, ethanol was usually produced by microbialreduction of acetate with hydrogen as electron donor. However, in an MEC system,ethanol could be produced by the reduction of acetate at a cathode with anapplied cathode potential of �0.55 V (vs. NHE) and methyl viologen as mediator[218]. MEC system can be also used to produce other value-added matters. Underlaboratory conditions, a liter-scale lamellar bioelectrochemical system produced acaustic solution of 3.4 wt% with a conversion efficiency of 61% (from acetate tocaustic) at the cathode (with a 1.77 V applied cell voltage, 1,015 A/m3 anodevolume). This system was tested for producing caustic using wastewater from abrewing process [219]. With a loop operation of circulating the anodic effluent to thecathode chamber, steroid hormones like dibutyl phthalate, 2-ethylformanilide, and2,5-pyrrolidinedione can be produced at the cathode using Dioscorea zingiberensisprocessing wastewater as a fuel [220]. Crude glycerol is regarded as a waste streamfrom biodiesel production. Glycerol has been tested for power production in single-chambered air-cathode MFC catalyzed by a pure culture of Bacillus subtilis [221].By the biofilm catalysis of a pure culture S. oneidensis, glycerol can be convertedinto ethanol at the anode of an MFC, providing a new approach for renewablebioproduct production [41].
14.5.2 From Oxygen to Hydrogen Peroxide (H2O2)
H2O2, a strong oxidant used in many applications such as in the pulp and paperindustry, textile bleaching, and some chemical syntheses, is currently produced inan energy intensive process. With an external voltage of 0.5 V, a bioelectrochemicalsystem can convert oxygen to H2O2 at the cathode with a rate of 1.9 ˙ 0.2 kgH2O2/m3/day with simultaneous oxidation of organic matters in a wastewater feedstream to the anodic chamber, providing a potential application of such a systemfor H2O2 production utilizing the energy released by oxidation of organic matters[222]. This on-site-produced H2O2 efficiently achieved Cr(VI) reduction [223] anddegradation of azo dyes amaranth [224].

14 Wastewater Treatment with Concomitant Bioenergy Production. . . 439
14.5.3 Microbial Desalination Cells
A proof-of-concept microbial desalination cell (MDC) was composed of threechambers: anode chamber, cathode chamber, and center chamber between twomembranes with an anion exchange membrane facing the anode side and a cationexchange membrane facing the cathode side [188]. In the MDC, current wasproduced through the process of organic carbon oxidization at the anode, oxidantreduction at the cathode, and water desalination at the center chamber, realiz-ing power generation with simultaneous wastewater treatment and desalination.A maximum power density of 31 W/m3 was achieved in this system with simulta-neous 90% removal of the salt in a single desalination cycle [188]. Recently, it wasdemonstrated that by applying a voltage of 0.8 V, this system achieved a maximumH2 production rate of 1.5 m3/m3/d (1.6 mL/h) from the cathode chamber withsimultaneous 98.8% removal of the 10 g/L NaCl from the middle chamber [225].Energy balance calculations showed that it was possible that the energy producedin the form of hydrogen more than offset the energy consumption [226]. Furtherinvestigations are needed to evaluate the performances of larger systems using real-world feed streams.
14.6 Conclusion
MFC-based technologies hold promises for the production of renewable bioenergyand value-added products from waste biomass or wastewaters. They are still ininfancy stages. Much work is needed on biofilm engineering, electrode materials,solution chemistry, and reactor architectures to improve overall performances. Theintegration of MFCs with other technologies will be surely developed for widenedapplications of MFCs. The involvement of multiple disciplines such as mate-rials science, microbiology, genetic engineering, electrochemistry, environmentalengineering, and chemical engineering is needed to make practical MFC-basedtechnologies an economic reality.
Genetically engineered superbug biofilms present a unique opportunity to resolveelectron-transfer bottlenecks at the anode and cathode, to allow a huge array oforganic matters to be digested with increased metabolic rates, resulting in reducedresidence times (i.e., faster flow) and improved CEs in the absence of a membrane.These kinds of biofilms will make the simplistic and low-cost MFC design shownin Fig. 14.12 possible. This new approach may be a game-changer in the MFCtechnology. To assure a high CE of the cell without a membrane, superbug biofilmsfor the bioanode and the biocathode are required. Arguably, the main hurdle isto obtain highly competitive and metabolically voracious bacteria that can devourhundreds of different carbon sources requiring small residence times. We touchedon one such organism, PA, in this review. Being a natural soil-dwelling organism,PA has the “hard-wired” properties of being ultracompetitive. For example, ifone were to place PA and Escherichia coli together, PA would rapidly kill this

440 L. Huang et al.
bacterium and utilize its cellular material for food, especially when starved forphosphate. Still, unlike the well-studied electrogens, Shewanella and Geobacter,the genes involved in biofilm attachment, matrix formation, micro-macrocolonydifferentiation, and dispersion have been well studied in PA. Thus, arguably, themost critical feature of MFC power efficiency is a robust biofilm in the anodicsurface mediated, in part, by numerous conductive pili. Thus, we propose that themost desirable properties of genetically modified electrogens would be (1) robustbiofilm formation on the anode; (2) a limited or an inability to disperse fromthe biofilm once attached; (3) inability to undergo anaerobic respiration, therebynot wasting precious electron flow to the process of denitrification; (4) reductionof the biofilm matrix, thereby increasing nutrient flow to biofilm bacteria; (5)increase mediator (e.g., PCN) secretion, allowing for yet another source of redox-based power generation as well as an antibiotic for competitive fitness; and (6) thepossibility of cloning uncoupler proteins into organisms which would increase therate of oxidation of wastewater substrates. We wish to emphasize that these areonly a few strategic suggestions. However, as more genes are discovered that affectpower generation in electrogenic organisms, additional light will be shed as to evengreater improvements that can be made to push this technology to the next level.Furthermore, there are avenues that have to date been unexplored which includeconsortia of genetically modified bacteria of potentially different genera that coexistin a symbiotic relationship. Such consortia would be particularly beneficial in theevent of either wastewaters with ever-changing nutrient flow or MFCs fed withmultiple different wastewater streams.
Acknowledgments Huang and Cheng gratefully acknowledge financial support from the NaturalScience Foundation of China (Nos. 51178077, 21077017 and 21073163), Science & ResearchProgram of Zhejiang Province (2010 C31014), Open Project of State Key Laboratory of CleanEnergy Utilization (ZJUCEU2010001), Program for Changjiang Scholars and Innovative ResearchTeam in University (IRT0813), and “Energy C X” (2008) key program through Dalian Universityof Technology.
References
1. Heidrich ES, Curtis TP, Dolfing J (2011) Determination of the internal chemical energy ofwastewater. Environ Sci Technol 45:827–32
2. Pant D, Bogaert GV, Diels L, Vanbroekhoven K (2010) A review of the substratesused in microbial fuel cells (MFCs) for sustainable energy production. Bioresour Technol101:1533–1543
3. Liu H, Ramnarayanan R, Logan BE (2004) Production of electricity during wastewatertreatment using a single chamber microbial fuel cell. Environ Sci Technol 38:2281–2285
4. Min B, Logan BE (2004) Continuous electricity generation from domestic wastewater andorganic substrates in a flat plate microbial fuel cell. Environ Sci Technol 38:5809–5814
5. Min B, Kim J, Oh S, Regan J, Logan BE (2005) Electricity generation from swine wastewaterusing microbial fuel cells. Water Res 39:4961–4968
6. Lu N, Zhou S, Zhuang L, Zhang J, Ni J (2009) Electricity generation from starch processingwastewater using microbial fuel cell technology. Biochem Eng J 43:246–251

14 Wastewater Treatment with Concomitant Bioenergy Production. . . 441
7. Feng Y, Wang X, Logan BE, Lee H (2008) Brewery wastewater treatment using air-cathodemicrobial fuel cells. Appl Microbiol Biotechnol 78:873–880
8. Galvez A, Greenman J, Ieropoulos I (2009) Landfill leachate treatment with microbial fuelcells; scale-up through plurality. Bioresour Technol 100:5085–5091
9. Greenman J, Galvez A, Giusti L, Ieropoulos I (2009) Electricity from landfill leachate usingmicrobial fuel cells: comparison with a biological aerated filter. Enzym Microb Technol44:112–119
10. Zhang J, Zhao Q, You S, Jiang J, Ren N (2008) Continuous electricity production fromleachate in a novel upflow air-cathode membrane-free microbial fuel cell. Water Sci Technol57:1017–1021
11. Jiang J, Zhao Q, Zhang J, Zhang G, Lee D (2009) Electricity generation from bio-treatmentof sewage sludge with microbial fuel cell. Bioresour Technol 100:5808–5812
12. Jiang J, Zhao Q, Wei L, Wang K (2010) Extracellular biological organic matters in microbialfuel cell using sewage sludge as fuel. Water Res 44:2163–2170
13. Jiang XC, Hu JS, Fitzgerald LA, Biffinger JC, Xie P, Ringeisen BR, Lieber CM (2010)Probing electron transfer mechanisms in Shewanella oneidensis MR-1 using a nanoelectrodeplatform and single-cell imaging. Proc Natl Acad Sci 107:16806–16810
14. Niessen J, Schroder U, Harnisch F, Scholz F (2005) Gaining electricity from in situoxidation of hydrogen produced by fermentative cellulose degradation. Lett Appl Microbiol41:286–290
15. Huang L, Logan BE (2008) Electricity generation and treatment of paper recycling wastewa-ter using a microbial fuel cell. Appl Microbiol Biotechnol 80:349–355
16. Huang L, Cheng S, Rezaei F, Logan BE (2009) Reducing organic loading in industrialeffluents using microbial fuel cells. Environ Technol 30:499–504
17. Ren Z, Ward TE, Regan JM (2007) Electricity production from cellulose in a microbial fuelcell using a defined binary culture. Environ Sci Technol 41:4781–4786
18. Rezaei F, Richard TL, Brennan RA, Logan BE (2007) Substrate-enhanced microbial fuelcells for improve remote power generation from sediment-based system. Environ Sci Technol41:4053–4058
19. Rezaei F, Xing D, Wagner R, Richard T, Logan BE (2009) Simultaneous cellulose degradationand electricity production by Enterobacter cloacae in a microbial fuel cell. Appl EnvironMicrobiol 75:3673–3678
20. Rezaei F, Richard TL, Logan BE (2009) Analysis of chitin particle size on maximum powergeneration, power longevity, and Coulombic efficiency in solid-substrate microbial fuel cells.J Power Sources 192:304–309
21. Rismani-Yazdi H, Christy AD, Dehority BA, Morrison M, Yu ZT, Tuovinen OH (2007)Electricity generation from cellulose by rumen microorganisms in microbial fuel cells.Biotechnol Bioeng 97:1398–1407
22. Velasquez-Orta SB, Curtis TP, Logan BE (2009) Energy from algae using microbial fuel cells.Biotechnol Bioeng 103:1068–1076
23. Rezaei F, Richard TL, Logan BE (2008) Enzymatic hydrolysis of cellulose coupled withelectricity generation in a microbial fuel cell. Biotechnol Bioeng 101:1163–1169
24. Zhang B, Zhao H, Shi C, Zhou S, Ni J (2009) Simultaneous removal of sulfide andorganics with vanadium(V) reduction in microbial fuel cells. J Chem Technol Biotechnol84:1780–1786
25. Zuo Y, Maness P, Logan BE (2006) Electricity production from steam-exploded corn stoverbiomass. Energy Fuel 20:1716–1721
26. Wang X, Feng Y, Wang H, Ou Y, Yu Y, Ren N, Li N, Wang E, Lee H, Logan BE (2009)Bioaugmentation for electricity generation from corn stover biomass using microbial fuelcells. Environ Sci Technol 43:6088–6093
27. Zang G, Sheng G, Tong Z, Liu X, Teng S, Li W, Yu H (2010) Direct electricity recovery fromCanna indica by an air-cathode microbial fuel cell inoculated with rumen microorganisms.Environ Sci Technol 44:2715–2720

442 L. Huang et al.
28. Catal T, Cysneiros D, O’Flaherty V, Leech D (2011) Electricity generation in single-chambermicrobial fuel cells using a carbon source sampled from anaerobic reactors utilizing grasssilage. Bioresour Technol 102:404–410
29. Catal T, Xu S, Li K, Bermek H, Liu H (2008) Electricity generation from polyalcohols insingle-chamber microbial fuel cells. Biosens Bioelectron 24:849–854
30. Huang L, Logan BE (2008) Electricity production from xylose in fed-batch and continuous-flow microbial fuel cells. Appl Microbiol Biotechnol 80:655–664
31. Huang L, Zeng J, Angelidaki I (2008) Electricity production from xylose using a mediator-less microbial fuel cell. Bioresour Technol 99:4178–4184
32. Catal T, Fan YZ, Li KC, Bermek H, Liu H (2008) Effects of furan derivatives and phenoliccompounds on electricity generation in microbial fuel cells. J Power Sources 180:162–166
33. Luo Y, Liu G, Zhang R, Zhang C (2010) Power generation from furfural using the microbialfuel cell. J Power Sources 195:190–194
34. Cheng S, Kiely P, Logan BE (2011) Pre-acclimation of a wastewater inoculum to cellulosein an aqueous-cathode MEC improves power generation in air-cathode MFCs. BioresourTechnol 102:367–371
35. Zhang C, Li M, Liu G, Luo H, Zhang R (2009) Pyridine degradation in the microbial fuelcells. J Hazard Mater 172:465–471
36. Luo Y, Zhang R, Liu G, Li J, Li M, Zhang C (2010) Electricity generation from indole andmicrobial community analysis in the microbial fuel cell. J Hazard Mater 176:759–764
37. Zhang C, Liu G, Zhang R, Luo H (2010) Electricity production from and biodegradation ofquinoline in the microbial fuel cell. J Environ Sci Health Part A 45:250–256
38. Huang L, Yang X, Quan X, Chen J, Yang F (2010) A microbial fuel cell-electro-oxidationsystem for coking wastewater treatment and bioelectricity generation. J Chem TechnolBiotechnol 85:621–627
39. He Z, Kan J, Wang Y, Huang Y, Mansfeld F, Nealson KH (2009) Electricity productioncoupled to ammonium in a microbial fuel cell. Environ Sci Technol 43:3391–3397
40. Kim JR, Zuo Y, Regan JM, Logan BE (2008) Analysis of ammonia loss mechanisms inmicrobial fuel cells treating animal wastewater. Biotechnol Bioeng 99:1120–1127
41. Flynn JM, Ross DE, Hunt KA, Bond DR, Gralnick JA (2011) Enabling unbalancedfermentations by using engineered electrode-interfaced bacteria. mBio 1:e00190–10
42. Raghavulu SV, Goud RK, Sarma PN, Mohan SV (2011) Saccharomyces cerevisiae as anodicbiocatalyst for power generation in biofuel cell: influence of redox condition and substrateload. Bioresour Technol 102:2751–2757
43. Finch AS, Mackie TD, Sund CJ, Sumner JJ (2011) Metabolite analysis of Clostridiumacetobutylicum: fermentation in a microbial fuel cell. Bioresour Technol 102:312–315
44. Rismani-Yazdi H, Christy AD, Carver SM, Yu Z, Dehority BA, Tuovinen OH (2011) Effectof external resistance on bacterial diversity and metabolism in cellulose-fed microbial fuelcells. Bioresour Technol 102:278–283
45. Katuri KP, Scott K, Head IM, Picioreanu C, Curtis TP (2011) Microbial fuel cells meet withexternal resistance. Bioresour Technol 102:2758–2766
46. Picioreanu C, Head IM, Katuri KP, van Loosdrecht MCM, Scott K (2007) A computationalmodel for biofilm-based microbial fuel cells. Water Res 41:2921–2940
47. Picioreanu C, Katuri KP, Head IM, van Loosdrecht MCM, Scott K (2008) Mathematicalmodel for microbial fuel cells with anodic biofilms and anaerobic digestion. Water SciTechnol 57:965–971
48. Jung S, Regan JM (2011) Influence of external resistance on electrogenesis, methanogen-esis, and anode prokaryotic communities in microbial fuel cells. Appl Environ Microbiol77:564–571
49. Lee HS, Parameswaran P, Kato-Marcus A, Torres CI, Rittmann BE (2008) Evaluation ofenergy-conversion efficiencies in microbial fuel cells (MFCs) utilizing fermentable and non-fermentable substrates. Water Res 42:1501–1510
50. Freguia S, Rabaey K, Yuan Z, Keller J (2008) Syntrophic processes drive the conversion ofglucose in microbial fuel cell anodes. Environ Sci Technol 42:7937–7943

14 Wastewater Treatment with Concomitant Bioenergy Production. . . 443
51. Kim HJ, Park HS, Hyun MS, Chang IS, Kim M, Kim BH (2002) A mediator-less microbialfuel cell using a metal reducing bacterium, Shewanella putrefaciens. Enzym Microb Technol30:145–152
52. Liu H, Cheng SA, Logan BE (2005) Power generation in fed-batch microbial fuel cells asa function of ionic strength, temperature, and reactor configuration. Environ Sci Technol39:5488–5493
53. Wang YF, Cheng SS, Tsujimura S, Ikeda T, Kano K (2006) Escherichia coli-catalyzedbioelectrochemical oxidation of acetate in the presence of mediators. Bioelectrochemistry69:74–81
54. Biffinger JC, Byrd JN, Dudley BL, Ringeisen BR (2008) Oxygen exposure promotes fueldiversity for Shewanella oneidensis microbial fuel cells. Biosens Bioelectron 23:820–826
55. Li SL, Freguiab S, Liu SM, Cheng SS, Tsujimura S, Shirai O, Kano K (2010) Effects ofoxygen on Shewanella decolorationis NTOU1 electron transfer to carbon-felt electrodes.Biosens Bioelectron 25:2651–2656
56. Xie X, Hu L, Pasta M, Wells GF, Kong D, Criddle CS, Cui Y (2011) Three-dimensional car-bon nanotube textile anode for high-performance microbial fuel cells. Nano Lett 11:291–296
57. Chaudhuri SK, Lovley DR (2003) Electricity generation by direct oxidation of glucose inmediatorless microbial fuel cells. Nat Biotechnol 21:1229–1232
58. He Z, Minteer SD, Angenent LT (2005) Electricity generation from artificial wastewater usingan upflow microbial fuel cell. Environ Sci Technol 39:5262–5267
59. Cheng S, Liu H, Logan BE (2006) Increased performance of single-chamber microbial fuelcells using an improved cathode structure. Electrochem Commun 8:489–494
60. Cheng S, Liu H, Logan BE (2006) Increased power generation in a continuous flow MFC withadvective flow through the porous anode and reduced electrode spacing. Environ Sci Technol40:2426–2432
61. Logan BE, Cheng S, Watson V, Estadt G (2007) Graphite fiber brush anodes for increasedpower production in air-cathode microbial fuel cells. Environ Sci Technol 41:3341–3346
62. Liu H, Cheng S, Huang L, Logan BE (2008) Scale-up of membrane-free single-chambermicrobial fuel cells. J Power Sources 179:274–279
63. Zeng L, Zhang L, Li W, Zhao S, Lei J, Zhou Z (2010) Molybdenum carbide as anodic catalystfor microbial fuel cell based on Klebsiella pneumoniae. Biosens Bioelectron 25:2696–2700
64. Dewan A, Beyenal H, Lewandowski Z (2008) Scaling up microbial fuel cells. Environ SciTechnol 42:7643–7648
65. Larrosa-Guerrero A, Scott K, Katuri KP, Godinez C, Head IM, Curtis T (2010) Open circuitversus closed circuit enrichment of anodic biofilms in MFC: effect on performance and anodiccommunities. Appl Microbiol Biotechnol 87:1699–1713
66. Larrosa-Guerrero A, Scott K, Head IM, Mateo F, Ginesta A, Godinez C (2010) Effect oftemperature on the performance of microbial fuel cells. Fuel 89:3985–3994
67. Tang X, Guo K, Li H, Du Z, Tian J (2011) Electrochemical treatment of graphite to enhanceelectron transfer from bacteria to electrodes. Bioresour Technol 102:3558–3560
68. Lowy DA, Tender LM (2008) Harvesting energy from the marine sediment–water interfaceIII. Kinetic activity of quinone- and antimony-based anode materials. J Power Sources185:70–75
69. Saito T, Mehanna M, Wang X, Cusick RD, Feng Y, Hickner MA, Logan BE (2011) Effectof nitrogen addition on the performance of microbial fuel cell anodes. Bioresour Technol102:395–398
70. Tsai HY, Wu CC, Lee CY, Shih EP (2009) Microbial fuel cell performance of multiwallcarbon nanotubes on carbon cloth as electrodes. J Power Sources 194:199–205
71. Peng L, You S, Wang J (2010) Carbon nanotubes as electrode modifier promoting directelectron transfer from Shewanella oneidensis. Biosens Bioelectron 25:1248–1251
72. Mottaghitalab V, Spinks GM, Wallace GG (2005) The influence of carbon nanotubes onmechanical and electrical properties of polyaniline fibers. Synth Met 152:77–80
73. Qiao Y, Li CM, Bao S, Bao Q (2007) Carbon nanotube/polyaniline composite as anodematerial for microbial fuel cells. J Power Sources 170:79–84

444 L. Huang et al.
74. Zou Y, Pisciotta J, Baskakov IV (2010) Nanostructured polypyrrole-coated anode for sun-powered microbial fuel cells. Bioelectrochemistry 79:50–56
75. Yuan SJ, Sheng GP, Li WW, Lin ZQ, Zeng RJ, Tong ZH, Yu HQ (2010) Degradation oforganic pollutants in a photoelectrocatalytic system enhanced by a microbial fuel cell. EnvironSci Technol 44:5575–5580
76. Schroder U (2007) Anodic electron transfer mechanisms in microbial fuel cells and theirenergy efficiency. Phys Chem Chem Phys 9:2619–2629
77. Aelterman P, Freguia S, Keller J, Verstraete W, Rabaey K (2008) The anode potential regulatesbacterial activity in microbial fuel cells. Appl Microbiol Biotechnol 78:409–418
78. Yi H, Nevin KP, Kim BC, Franks AE, Klimes A, Tender LM, Lovley DR (2009) Selectionof a variant of Geobacter sulfurreducens with enhanced capacity for current production inmicrobial fuel cells. Biosens Bioelectron 24:3498–3503
79. Wang X, Feng Y, Ren N, Wang H, Lee H, Li N (2009) Accelerated start-up of two-chambered microbial fuel cells: effect of anodic positive poised potential. Electrochim Acta54:1109–1114
80. Wei J, Liang P, Cao X, Huang X (2010) A new insight into potential regulation on growthand power generation of Geobacter sulfurreducens in microbial fuel cells based on energyviewpoint. Environ Sci Technol 44:3187–3191
81. Mahadevan R, Bond DR, Butler JE, Esteve-Nunez A, Coppi MV, Palsson BO, Schilling CH,Lovley DR (2006) Characterization of metabolism in the Fe (III)-reducing organism Geobac-ter sulfurreducens by constraint-based modeling. Appl Environ Microbiol 72:1558–1568
82. Straub KL, Benz M, Schink B (2001) Iron metabolism in anoxic environments at near neutralpH. FEMS Microbiol Ecol 34:181–186
83. Walczak MM, Dryer DA, Jacobson DD, Foss MG, Flynn NT (1997) pH-dependent redoxcouple: illustrating the Nernst equation using cyclic voltammetry. Environ Sci Technol74:1195–1197
84. Busalmen JP, De Sanchez SR (2005) Electrochemical polarization-induced changes in thegrowth of individual cells and biofilms of Pseudomonas fluorescens (ATCC 17552). ApplEnviron Microbiol 71:6235–6240
85. Luo Q, Wang H, Zhang X, Qian Y (2005) Effect of direct electric current on the cell surfaceproperties of phenol-degrading bacteria. Appl Environ Microbiol 71:423–427
86. He Z, Huang Y, Manohar AK, Mansfeld F (2008) Effect of electrolyte pH on the rate ofthe anodic and cathodic reactions in an air-cathode microbial fuel cell. Bioelectrochemistry74:78–82
87. Cheng S, Logan BE (2007) Ammonia treatment of carbon cloth anodes to enhance powergeneration of microbial fuel cells. Electrochem Commun 9:492–496
88. Fan YZ, Hu HQ, Liu H (2007) Sustainable power generation in microbial fuel cells usingbicarbonate buffer and proton transfer mechanisms. Environ Sci Technol 41:8154–8158
89. Fornero JJ, Rosenbaum M, Cotta MA, Angenent LT (2010) Carbon dioxide addition tomicrobial fuel cell cathodes maintains sustainable catholyte pH and improves anolyte pH,alkalinity, and conductivity. Environ Sci Technol 44:2728–2734
90. Torres CI, Lee HS, Rittmann BE (2008) Carbonate species as OH-carriers for decreasingthe pH gradient between cathode and anode in biological fuel cells. Environ Sci Technol42:8773–8777
91. Cheng KY, Ho G, Cord-ruwisch R (2010) Anodophilic biofilm catalyzes cathodic oxygenreduction. Environ Sci Technol 44:518–525
92. Freguia S, Rabaey K, Yuan Z, Keller J (2008) Sequential anode-cathode configurationimproves cathodic oxygen reduction and effluent quality of microbial fuel cells. Water Res42:1387–1396
93. Strik DPBTB, Hamelers HVM, Buisman CJN (2010) Solar energy powered microbial fuelcell with a reversible bioelectrode. Environ Sci Technol 44:532–537
94. Virdis B, Rabaey K, Yuan Z, Keller J (2008) Microbial fuel cells for simultaneous carbon andnitrogen removal. Water Res 42:3013–3024

14 Wastewater Treatment with Concomitant Bioenergy Production. . . 445
95. Ahn Y, Logan BE (2010) Effectiveness of domestic wastewater treatment using microbial fuelcells at ambient and mesophilic temperatures. Bioresour Technol 101:469–475
96. Cheng S, Xing D, Logan BE (2011) Electricity generation of single-chamber microbial fuelcells at low temperatures. Biosens Bioelectron 26:1913–1917
97. Jadhav GS, Ghangrekar MM (2009) Performance of microbial fuel cell subjected tovariation in pH, temperature, external load and substrate concentration. Bioresour Technol100:717–723
98. Watanabe K (2008) Recent developments in microbial fuel cell technologies for sustainablebioenergy. J Biosci Bioeng 106:528–536
99. Du Z, Li H, Gu T (2007) A state of the art review on microbial fuel cells: a promisingtechnology for wastewater treatment and bioenergy. Biotechnol Adv 25:464–482
100. Cheng S, Logan BE (2011) Increasing power generation for scaling up single-chamber aircathode microbial fuel cells. Bioresour Technol 102:4468–4473
101. Wang X, Feng Y, Liu J, Shi X, Lee H, Li N, Ren N (2010) Power generation using ad-justable Nafion/PTFE mixed binders in air-cathode microbial fuel cells. Biosens Bioelectron26:946–948
102. Yu EH, Cheng S, Scott K, Logan BE (2007) Microbial fuel cell performance with non-Ptcathode catalysts. J Power Sources 171:275–281
103. Zuo Y, Cheng S, Logan BE (2008) Ion exchange membrane cathodes for scalable microbialfuel cells. Environ Sci Technol 42:6967–6972
104. Bullen RA, Arnot TC, Lakeman JB, Walsh FC (2006) Biofuel cells and their development.Biosens Bioelectron 21:2015–2045
105. Logan BE, Regan JM (2006) Microbial fuel cells: challenges and applications. Environ SciTechnol 40:5172–5180
106. Cournet A, Delia ML, Bergel A, Roques C, Berge M (2010) Electrochemical reduction ofoxygen catalyzed by a wide range of bacteria including Gram-positive. Electrochem Commun12:505–508
107. Gorby YA, Yanina S, McLean JS, Rosso KM, Moyles D, Dohnalkova A, Beveridge TJ, ChangIS, Kim BH, Kim KS, Culley DE, Reed SB, Romine MF, Saffarini DA, Hill EA, Shi L, EliasDA, Kennedy DW, Pinchuk G, Watanabe K, Ishii SI, Logan BE, Nealson KH, Fredrickson JK(2006) Electrically conductive bacterial nanowires produced by Shewanella oneidensis strainMR-1 and other microorganisms. Proc Natl Acad Sci 103:358–363
108. Marsili E, Baron DB, Shikhare ID, Coursolle D, Gralnick JA, Bond DR (2008) Shewanella se-cretes flavins that mediate extracellular electron transfer. Proc Natl Acad Sci 105:3968–3973
109. Newton GJ, Mori S, Nakamura R, Hashimoto K, Watanabe K (2009) Analyses ofcurrent-generating mechanisms of Shewanella loihica PV-4 and Shewanella oneidensis MR-1in microbial fuel cells. Appl Environ Microbiol 75:7674–7681
110. Pham TH, Boon N, De Maeyer K, Hofte M, Rabaey K, Verstraete W (2008)Use of Pseudomonas species producing phenazine-based metabolites in the anodesof microbial fuel cells to improve electricity generation. Appl Microbiol Biotechnol.doi:10.1007/s00253-008-1619-7. 80:985-993
111. von Canstein H, Ogawa J, Shimizu S, Lloyd JR (2008) Secretion of flavins by Shewanellaspecies and their role in extracellular electron transfer. Appl Environ Microbiol 74:615–623
112. Kim BH, Kim HJ, Hyun MS, Park DH (1999) Direct electrode reaction of Fe(III)-reducingbacterium, Shewanella putrefaciens. J Microbiol Biotechnol 9:127–131
113. Myers CR, Myers JM (1992) Localization of cytochromes to the outer membrane ofanaerobically grown Shewanella putrefaciens MR-1. J Bacteriol 174:3429–3438
114. Wu X, Zhao F, Rahunen N, Varcoe JR, Avignone-Rossa C, Thumser AE, Slade RCT (2011)A role for microbial palladium nanoparticles in extracellular electron transfer. Angew ChemInt Ed 50:427–430
115. Reguera G, McCarthy KD, Mehta T, Nicoll JS, Tuominen MT, Lovley DR (2005) Extracel-lular electron transfer via microbial nanowires. Nature 435:1098–1101

446 L. Huang et al.
116. Klimes A, Franks AE, Glaven RH, Tran H, Barrett CL, Qiu Y, Zengler K, Lovley DR (2011)Production of pilus-like filaments in Geobacter sulfurreducens in the absence of the type IVpilin protein PilA. FEMS Microbiol Lett 310:62–68
117. Reguera G, Nevin KP, Nicoll JS, Covalla SF, Woodard TL, Lovley DR (2006) Biofilm andnanowire production leads to increased current in Geobacter sulfurreducens fuel cells. ApplEnviron Microbiol 72:7345–7348
118. Reguera G, Pollina RB, Nicoll JS, Lovley DR (2007) Possible nonconductive role ofGeobacter sulfurreducens pilus nanowires in biofilm formation. J Bacteriol 189:2125–2127
119. Richter H, McCarthy K, Nevin KP, Johnson J, Rotello V, Lovley DR (2008) Electricitygeneration by Geobacter sulfurreducens attached to gold electrodes. Langmuir 24:4376–4379
120. Tremblay PL, Summers ZM, Glaven RH, Nevin KP, Zengler K, Barrett CL, Qiu Y, PalssonBO, Lovley DR (2011) A c-type cytochrome and a transcriptional regulator responsible forenhanced extracellular electron transfer in Geobacter sulfurreducens revealed by adaptiveevolution. Environ Microbiol 13:13–23
121. Chiang P, Burrows LL (2003) Biofilm formation by hyperpiliated mutants of Pseudomonasaeruginosa. J Bacteriol 185:2374–2378
122. Rabaey K, Boon N, Hofte M, Verstraete W (2005) Microbial phenazine production enhanceselectron transfer in biofuel cells. Environ Sci Technol 39:3401–3408
123. Richter H, Nevin KP, Jia H, Lowy DA, Lovley DR, Tender LM (2009) Cyclic voltammetryof biofilms of wild type and mutant Geobacter sulfurreducens on fuel cell anodes indicatespossible roles of OmcB, OmcZ, type IV pili, and protons in extracellular electron transfer.Energy Environ Sci 2:506–516
124. Krushkal J, Juarez K, Barbe JF, Qu Y, Andrade A, Puljic M, Adkins RM, Lovley DR, UekiT (2010) Genome-wide survey for PilR recognition sites of the metal-reducing prokaryoteGeobacter sulfurreducens. Gene 469:31–44
125. El-Naggar MY, Wanger G, Leung KM, Yuzvinsky TD, Southam G, Yang J, Lau WM, NealsonKH, Gorby YA (2010) Electrical transport along bacterial nanowires from Shewanellaoneidensis MR-1. Proc Natl Acad Sci 107:18127–18131
126. Hou H, Li L, Cho Y, de Figueiredo P, Han A (2009) Microfabricated microbial fuel cell arraysreveal electrochemically active microbes. PLoS One 4:e6570
127. Hassett DJ, Korfhagen TR, Irvin TR, Schurz MJ, Sauer K, Lau GW, Sutton MD, Yu H,Hoiby N (2010) Pseudomonas aeruginosa biofilm infections in cystic fibrosis: insights intopathogenic processes and treatment strategies. Expert Opin Ther Targets 14:117–130
128. Morgan R, Kohn S, Hwang SH, Hassett DJ, Sauer K (2006) BdlA, a chemotaxis regulatoressential for biofilm dispersion in Pseudomonas aeruginosa. J Bacteriol 188:7335–7343
129. O’Toole GA, Gibbs KA, Hager PW, Phibbs PV Jr, Kolter R (2000) The global carbonmetabolism regulator Crc is a component of a signal transduction pathway required for biofilmdevelopment by Pseudomonas aeruginosa. J Bacteriol 182:425–431
130. Vallet I, Olson JW, Lory S, Lazdunski A, Filloux A (2001) The chaperone/usher pathways ofPseudomonas aeruginosa: identification of fimbrial gene clusters (cup) and their involvementin biofilm formation. Proc Natl Acad Sci 98:6911–6916
131. Whitchurch CB, Beatson SA, Comolli JC, Jakobsen T, Sargent JL, Bertrand JJ, West J,Klausen M, Waite LL, Kang PJ, Tolker-Nielsen T, Mattick JS, Engel JN (2005) Pseudomonasaeruginosa fimL regulates multiple virulence functions by intersecting with Vfr-modulatedpathways. Mol Microbiol 55:1357–1378
132. Kulasakara H, Lee V, Brencic A, Liberati N, Urbach J, Miyata S, Lee DG, Neely AN,Hyodo M, Hayakawa Y, Ausubel FM, Lory S (2006) Analysis of Pseudomonas aeruginosadiguanylate cyclases and phosphodiesterases reveals a role for bis-(30-50)-cyclic-GMP invirulence. Proc Natl Acad Sci 103:2839–2844
133. O’Toole GA, Kolter R (1998) Flagellar and twitching motility are necessary for Pseudomonasaeruginosa biofilm development. Mol Microbiol 30:295–304
134. Davies DG, Parsek MR, Pearson JP, Iglewski BH, Costerton JW, Greenberg EP (1998)The involvement of cell-to-cell signals in the development of a bacterial biofilm. Science280:295–298
14 Wastewater Treatment with Concomitant Bioenergy Production. . . 447
135. Choy WK, Zhou L, Syn CK, Zhang LH, Swarup S (2004) MorA defines a new class ofregulators affecting flagellar development and biofilm formation in diverse Pseudomonasspecies. J Bacteriol 186:7221–7228
136. Gooderham WJ, Gellatly SL, Sanschagrin F, McPhee JB, Bains M, Cosseau C, LevesqueRC, Hancock REW (2009) The sensor kinase PhoQ mediates virulence in Pseudomonasaeruginosa. Microbiology 155:699–711
137. Ma L, Jackson KD, Landry RM, Parsek MR, Wozniak DJ (2006) Analysis of Pseudomonasaeruginosa conditional psl variants reveals roles for the psl polysaccharide in adhesion andmaintaining biofilm structure postattachment. J Bacteriol 188:8213–8221
138. Ma L, Lu H, Sprinkle A, Parsek MR, Wozniak DJ (2007) Pseudomonas aeruginosa Psl is agalactose- and mannose-rich exopolysaccharide. J Bacteriol 189:8353–8356
139. Caiazza NC, O’Toole GA (2004) SadB is required for the transition from reversible to irre-versible attachment during biofilm formation by Pseudomonas aeruginosa PA14. J Bacteriol186:4476–4485
140. Ueda A, Wood TK (2009) Connecting quorum sensing, c-di-GMP, pel polysaccharide, andbiofilm formation in Pseudomonas aeruginosa through tyrosine phosphatase TpbA (PA3885).PLoS Pathog 5:e1000483
141. Debabov VG (2008) Electricity from microorganisms. Mikrobiologiia 77:149–157142. Friedman L, Kolter R (2004) Genes involved in matrix formation in Pseudomonas aeruginosa
PA14 biofilms. Mol Microbiol 51:675–690143. Suh SJ, Silo-Suh L, Woods DE, Hassett DJ, West SE, Ohman DE (1999) Effect of
rpoS mutation on the stress response and expression of virulence factors in Pseudomonasaeruginosa. J Bacteriol 181:3890–3897
144. Mavrodi DV, Bonsall RF, Delaney SM, Soule MJ, Phillips G, Thomashow LS (2001)Functional analysis of genes for biosynthesis of pyocyanin and phenazine-1-carboxamidefrom Pseudomonas aeruginosa PAO1. J Bacteriol 183:6454–6465
145. Paradis-Bleau C, Sanschagrin F, Levesque RC (2005) Peptide inhibitors of the essential celldivision protein FtsA. Protein Eng Des Sel 18:85–91
146. Hoang TT, Kutchma AJ, Becher A, Schweizer HP (2000) Integration-proficient plasmids forPseudomonas aeruginosa: site-specific integration and use for engineering of reporter andexpression strains. Plasmid 43:59–72
147. Qiu D, Damron FH, Mima T, Schweizer HP, Yu HD (2008) PBAD-based shuttle vectors forfunctional analysis of toxic and highly regulated genes in Pseudomonas and Burkholderiaspp. and other bacteria. Appl Environ Microbiol 74:7422–7426
148. Rabaey K, Lissens G, Siciliano SD, Verstraete W (2003) A microbial fuel cell capable ofconverting glucose to electricity at high rate and efficiency. Biotechnol Lett 25:1531–1535
149. Li Z, Zhang X, Lei L (2008) Electricity production during the treatment of real electroplatingwastewater containing Cr6C using microbial fuel cell. Process Biochem 43:1352–1358
150. Li Y, Lu A, Ding H, Jin S, Yan Y, Wang C, Zen C, Wang X (2009) Cr(VI) reduction atrutile-catalyzed cathode in microbial fuel cells. Electrochem Commun 11:1496–1499
151. Ter Heijne A, Liu F, Van der Weijden R, Weijma J, Buisman CJN, Hamelers HVM (2010)Copper recovery combined with electricity production in a microbial fuel cell. Environ SciTechnol 44:4376–4381
152. Wang G, Huang L, Zhang Y (2008) Cathodic reduction of hexavalent chromium [Cr(VI)]coupled with electricity generation in microbial fuel cells. Biotechnol Lett 30:1959–1966
153. You S, Zhao Q, Zhang J, Jiang J, Zhao S (2006) A microbial fuel cell using permanganate asthe cathodic electron acceptor. J Power Sources 162:1409–1415
154. Zhang B, Zhou S, Zhao H, Shi C, Kong L, Sun J, Yang Y, Ni J (2010) Factors affectingthe performance of microbial fuel cells for sulfide and vanadium (V) treatment. BioprocessBiosyst Eng 33:187–194
155. Jang JK, Chang IS, Moon H, Kang KH, Kim BH (2006) Continuous determination ofbiochemical oxygen demand using microbial fuel cell type biosensor. Biotechnol Bioeng95:772–774

448 L. Huang et al.
156. Mu Y, Rabaey K, Rozendal R, Yuan Z, Keller J (2009) Decolorization of azo dyes inbioelectrochemical systems. Environ Sci Technol 43:5137–5143
157. Mu Y, Rozendal R, Rabaey K, Keller J (2009) Nitrobenzene removal in bioelectrochemicalsystems. Environ Sci Technol 43:8690–8695
158. Li J, Liu G, Zhang R, Luo Y, Zhang C, Li M (2010) Electricity generation by two types ofmicrobial fuel cells using nitrobenzene as the anodic or cathodic reactants. Bioresour Technol101:4013–4020
159. Mu Y, Radjenovic J, Shen JY, Rozendal RE, Rabaey K, Keller J (2011) Dehalogenationof iodinated X-ray contrast media in a bioelectrochemical system. Environ Sci Technol45:782–788
160. Gu HY, Zhang XW, Li ZJ, Lei LC (2007) Studies on treatment of chlorophenol-containingwastewater by microbial fuel cell. Chin Sci Bull 52:3448–3451
161. Catal T, Bermek H, Liu H (2009) Removal of selenite from wastewater using microbial fuelcells. Biotechnol Lett 31:1211–1216
162. Pandit S, Sengupta A, Kale S, Das D (2011) Performance of electron acceptors in catholyteof a two-chambered microbial fuel cell using anion exchange membrane. Bioresour Technol102:2736–2744
163. Zhu X, Ni J (2009) Simultaneous processes of electricity generation and p-nitrophenoldegradation in a microbial fuel cell. Electrochem Commun 11:274–277
164. Freguia S, Rabaey K, Yuan Z, Keller J (2007) Non-catalyzed cathodic oxygen reduction atgraphite granules in microbial fuel cells. Electrochim Acta 53:598–603
165. Watson VJ, Saito T, Hickner MA, Logan BE (2011) Polymer coatings as separator layers formicrobial fuel cell cathodes. J Power Sources 196:3015–3025
166. Zhao F, Harnisch F, Schroder U, Scholz F, Bogdanoff P, Herrmann I (2005) Application ofpyrolysed iron(II) phthalocyanine and CoTMPP based oxygen reduction catalysts as cathodematerials in microbial fuel cells. Electrochem Commun 7:1405–1410
167. Liu XW, Sun XF, Huang YX, Sheng GP, Zhou K, Zeng RJ, Dong F, Wang SG, XuAW, Tong ZH, Yu HQ (2010) Nano-structured manganese oxide as a cathodic catalyst forenhanced oxygen reduction in a microbial fuel cell fed with a synthetic wastewater. WaterRes 44:5298–5305
168. Duteanu N, Erable B, Senthil Kumar SM, Ghangrekar MM, Scott K (2010) Effect ofchemically modified Vulcan XC-72R on the performance of air-breathing cathode in a single-chamber microbial fuel cell. Bioresour Technol 101:5250–5255
169. Qian F, Wang G, Li Y (2010) Solar-driven microbial photoelectrochemical cells with ananowire photocathode. Nano Lett 10:4686–4691
170. Clauwaert P, Van Der Ha D, Boon N, Verbeken K, Verhaege M, Rabaey K, Verstraete W(2007) Open air biocathode enables effective electricity generation with microbial fuel cells.Environ Sci Technol 41:7564–7569
171. Nguyen TA, Lu Y, Yang X, Shi X (2007) Carbon and steel surfaces modified by Leptothrixdiscophora SP-6: characterization and implications. Environ Sci Technol 41:7987–7996
172. Rhoads A, Beyenal H, Lewandowski Z (2005) Microbial fuel cell using anaerobic respirationas an anodic reaction and biomineralized manganese as a cathodic reactant. Environ SciTechnol 39:4666–4671
173. Sun J, Bi Z, Hou B, Cao Y, Hu Y (2011) Further treatment of decolorization liquid of azo dyecoupled with increased power production using microbial fuel cell equipped with an aerobicbiocathode. Water Res 45:283–291
174. Lovley DR (2008) The microbe electric: conversion of organic matter to electricity. Curr OpinBiotechnol 19:564–571
175. Huang L, Chen J, Quan X, Yang F (2010) Enhancement of hexavalent chromium reductionand electricity production from a biocathode microbial fuel cell. Bioprocess Biosyst Eng33:937–945
176. Huang L, Regan JM, Quan X (2011) Electron transfer mechanisms, new applications, andperformance of biocathode microbial fuel cells. Bioresour Technol 102:316–323

14 Wastewater Treatment with Concomitant Bioenergy Production. . . 449
177. Rodrigo MA, Canizares P, Lobato J (2010) Effect of the electron-acceptors on the perfor-mance of a MFC. Bioresour Technol 101:7014–7018
178. Dumas C, Mollica A, Feron D, Basseguy R, Etcheverry L, Bergel A (2007) Marine microbialfuel cell: use of stainless steel electrodes as anode and cathode materials. Electrochim Acta53:468–473
179. Schamphelaire LD, Boeckx P, Verstraete W (2010) Evaluation of biocathodes in freshwaterand brackish sediment microbial fuel cells. Appl Microbiol Biotechnol 87:1675–1687
180. Malik S, Drott E, Grisdela P, Lee J, Lee C, Lowy DA, Gray S, Tender LM (2009) Aself-assembling self-repairing microbial photoelectrochemical solar cell. Energy Environ Sci2:292–298
181. He Z, Shao H, Angenent LT (2007) Increased power production from a sediment microbialfuel cell with a rotating cathode. Biosens Bioelectron 22:3252–3255
182. Strik DPBTB, Hamelers HVM, Snel JFH, Buisman CJN (2008) Green electricity productionwith living plants and bacteria in a fuel cell. Int J Energy Res 32:870–876
183. De Schamphelaire L, Van den Bossche L, Dang HS, Hofte M, Boon N, Rabaey K, VerstraeteW (2008) Microbial fuel cells generating electricity from rhizo deposits of rice plants. EnvironSci Technol 42:3053–3058
184. Kaku N, Yonezawa N, Kodama Y, Watanabe K (2008) Plant/microbe cooperation forelectricity generation in a rice paddy field. Appl Microbiol Biotechnol 79:43–49
185. Aulenta F, Catervi A, Majone M, Panero S, Reale P, Rossetti S (2007) Electron transferfrom a solid-state electrode assisted by methyl viologen sustains efficient microbial reductivedechlorination of TCE. Environ Sci Technol 41:2554–2559
186. Aulenta F, Canosa A, Reale P, Rossetti S, Panero S, Majone M (2009) Microbial reductivedechlorination of trichloroethene to ethene with electrodes serving as electron donors withoutthe external addition of redox mediators. Biotechnol Bioeng 103:85–91
187. Butler CS, Clauwaert P, Green SJ, Verstraete W, Nerenberg R (2010) Bioelectrochemicalperchlorate reduction in a microbial fuel cell. Environ Sci Technol 44:4685–4691
188. Cao X, Huang X, Liang P, Xiao K, Zhou Y, Zhang X, Logan BE (2009) A new method forwater desalination using microbial desalination cells. Environ Sci Technol 43:7148–7152
189. Clauwaert P, Rabaey K, Aelterman P, Schamphelaire LD, Pham TH, Boeckx P, Boon N,Verstraete W (2007) Biological denitrification in microbial fuel cells. Environ Sci Technol41:3354–3360
190. Park H, Kim DK, Choi YJ, Park D (2005) Nitrate reduction using an electrode as directelectron donor in a biofilm-electrode reactor. Process Biochem 40:3383–3388
191. Rozendal RA, Jeremiasse AW, Hamelers HVM, Buisman CJN (2008) Hydrogen productionwith a microbial biocathode. Environ Sci Technol 42:629–634
192. Shea C, Clauwaert P, Verstraete W, Nerenberg R (2008) Adapting a denitrifying biocathodefor perchlorate. Water Sci Technol 58:1941–1946
193. Strycharz SM, Gannon SM, Boles AR, Franks AE, Nevin KP, Lovley DR (2010) Reductivedechlorination of 2-chlorophenol by Anaeromyxobacter dehalogenans with an electrodeserving as the electron donor. Environ Microbiol Rep 2:289–294
194. Gregory KB, Bond DR, Lovley DR (2004) Graphite electrodes as electron donors foranaerobic respiration. Environ Microbiol 6:596–604
195. Chen GW, Choi SJ, Lee TH, Lee GY, Cha JH, Kim CW (2008) Application of biocathode inmicrobial fuel cells: cell performance and microbial community. Appl Microbiol Biotechnol79:379–388
196. Clauwaert P, Desloover J, Shea C, Nerenberg R, Boon N, Verstraete W (2009) Enhanced ni-trogen removal in bio-electrochemical systems by pH control. Biotechnol Lett 31:1537–1543
197. Wrighton KC, Virdis B, Clauwaert P, Read ST, Daly RA, Boon N, Piceno Y, AndersenGL, Coates JD, Rabaey K (2010) Bacterial community structure corresponds to performanceduring cathodic nitrate reduction. ISME J 4:1443–1455
198. Aulenta F, Reale P, Canosa A, Rossetti S, Panero S, Majone M (2010) Characterization of anelectro-active biocathode capable of dechlorinating trichloroethene and cis-dichloroethene toethane. Biosens Bioelectron 25:1796–1802

450 L. Huang et al.
199. Sanford RA, Cole JR, Tiedje JM (2002) Characterization and description of Anaeromyxobac-ter dehalogenans gen. nov., sp. nov., an aryl-halorespiring facultative anaerobic myxobac-terium. Appl Environ Microbiol 68:893–900
200. Huang L, Chai X, Cheng S, Chen G (2011) Evaluation of carbon-based materials in tubularbiocathode microbial fuel cells in terms of hexavalent chromium reduction and electricitygeneration. Chem Eng J 166:652–661
201. Pons L, Delia ML, Bergel A (2011) Effect of surface roughness, biofilm coverage andbiofilm structure on the electrochemical efficiency of microbial cathodes. Bioresour Technol102:2678–2683
202. Cheng S, Xing D, Call D, Logan BE (2009) Direct biological conversion of electrical currentinto methane by electromethanogenesis. Environ Sci Technol 43:3953–3958
203. Villano M, Aulenta F, Ciucci C, Ferri T, Giuliano A, Majone M (2010) Bioelectrochemicalreduction of CO2 to CH4 via direct and indirect extracellular electron transfer by ahydrogenophilic methanogenic culture. Bioresour Technol 101:3085–3090
204. Wang X, Feng Y, Liu J, Lee H, Li C, Li N, Ren N (2010) Sequestration of CO2 dischargedfrom anode by algal cathode in microbial carbon capture cells (MCCs). Biosens Bioelectron25:2639–2643
205. Kim BH, Ikeda T, Park HS, Kim HJ, Hyun MS, Kano K, Takagi K, Tatsumi H (1999)Electrochemical activity of an Fe(III)-reducing bacterium, Shewanella putrefaciens IR-1, inthe presence of alternative electron acceptors. Biotechnol Tech 13:475–478
206. Freguia S, Tsujimura S, Kano K (2010) Electron transfer pathways in microbial oxygenbiocathodes. Electronchim Acta 55:813–818
207. Strycharz SM, Glaven RH, Coppi MV, Gannon SM, Perpetua LA, Liu A, Nevin KP, LovleyDR (2011) Gene expression and deletion analysis of mechanisms for electron transfer fromelectrodes to Geobacter sulfurreducens. Bioelectrochemistry 80:142–150
208. Sleutels THJA, Hameler HVM, Rozendal RA, Buisman CJN (2009) Ion transport resistancein microbial electrolysis cells with anion and cation exchange membranes. Int J HydrogEnergy 34:3612–3620
209. Jang JK, Pham TH, Chang IS, Kang KH, Moon H, Cho KS, Kim BH (2004) Constructionand operation of a novel mediator- and membrane-less microbial fuel cell. Process Biochem39:1007–1012
210. Foley JM, Rozendal RA, Hertle CR, Lant PA, Rabaey K (2010) Life cycle assessment ofhigh-rate anaerobic treatment, microbial fuel cells, and microbial electrolysis cells. EnvironSci Technol 44:3629–3637
211. Rozendal RA, Hamelers HVM, Euverink GJW, Metz SJ, Buisman CJN (2006) Principle andperspectives of hydrogen production through biocatalyzed electrolysis. Int J Hydrog Energy31:1632–1640
212. Rozendal RA, Hamelers HVM, Molenkamp RJ, Buisman CJN (2007) Performance of singlechamber biocatalyzed electrolysis with different types of ion exchange membranes. WaterRes 41:1984–1994
213. Cheng H, Scott K, Ramshaw C (2002) Intensification of water electrolysis in a centrifugalfield. J Electrochem Soc 149:D172–D177
214. Ambler JR, Logan BE (2011) Evaluation of stainless steel cathodes and a bicarbonate bufferfor hydrogen production in microbial electrolysis cells using a new method for measuring gasproduction. Int J Hydrog Energy 36:160–166
215. Call D, Logan BE (2008) Hydrogen production in a single chamber microbial electrolysis cell(MEC) lacking a membrane. Environ Sci Technol 42:3401–3406
216. Tartakovskya B, Manuel MF, Neburchilov V, Wang H, Guiot SR (2008) Biocatalyzedhydrogen production in a continuous flow microbial fuel cell with a gas phase cathode.J Power Sources 182:291–297
217. Sun M, Sheng G, Zhang L, Xia C, Mu Z, Liu X, Wang H, Yu H, Qi R, Yu T, Yang M (2008) AnMEC-MFC-coupled system for biohydrogen production from acetate. Environ Sci Technol42:8095–8100

14 Wastewater Treatment with Concomitant Bioenergy Production. . . 451
218. Steinbusch KJJ, Hamelers HVM, Schaap JD, Kampman C, Buisman CJN (2010) Bio-electrochemical ethanol production through mediated acetate reduction by mixed cultures.Environ Sci Technol 44:513–517
219. Rabaey K, Butzer S, Brown S, Keller J, Rozendal R (2010) High current generation coupledto caustic production using a lamellar bioelectrochemical system. Environ Sci Technol44:4315–4321
220. Li H, Ni J (2011) Treatment of wastewater from Dioscorea zingiberensis tubers used forproducing steroid hormones in a microbial fuel cell. Bioresour Technol 102:2731–2735
221. Nimje VR, Chen CY, Chen CC, Chen HR, Tseng MJ, Jean JS, Chang YF (2011) Glyceroldegradation in single-chamber microbial fuel cells. Bioresour Technol 102:2629–2634
222. Rozendal RA, Leone E, Keller J, Rabaey K (2009) Efficient hydrogen peroxide generationfrom organic matter in a bioelectrochemical system. Electrochem Commun 11:1752–1755
223. Liu L, Yuan Y, Li F, Feng C (2011) In-situ Cr(VI) reduction with electrogenerated hydrogenperoxide driven by iron-reducing bacteria. Bioresour Technol 102:2468–2473
224. Fu L, You S, Zhang G, Yang F, Fang X (2010) Degradation of azo dyes using in-situ Fentonreaction incorporated into H2O2-producing microbial fuel cell. Chem Eng J 160:164–169
225. Luo H, Jenkins PE, Ren Z (2011) Concurrent desalination and hydrogen generation usingmicrobial electrolysis and desalination cells. Environ Sci Technol. doi:10.1021/es1022202.45:340-344
226. Mehanna M, Kiely PD, Call DF, Logan BE (2010) Microbial electrodialysis cell for simulta-neous water desalination and hydrogen gas production. Environ Sci Technol 44:9578–9583
227. Huang L, Cheng S, Chen G (2011) Bioelectrochemical systems for efficient recalcitrantwastes treatment. J Chem Technol Biotechnol 86:481–491
228. Zhang Y, Min B, Huang L, Angelidaki I (2009) Generation of electricity and analysis ofmicrobial communities in wheat straw biomass-powered microbial fuel cells. Appl EnvironMicrobiol 75:3389–3395
229. Cheng SA, Logan BE (2007) Ammonia treatment of carbon cloth anodes to enhance powergeneration of microbial fuel cells. Electrochem Commun 9:492–496
230. Wagner RC, Call DI, Logan BE (2010) Optimal set anode potentials vary in bioelectro-chemical systems. Environ Sci Technol 44:6036–6041
231. Cheng SA, Logan BE (2007) Ammonia treatment of carbon cloth anodes to enhance powergeneration of microbial fuel cells. Electrochem Commun 9:492–496
232. You SJ, Ren NQ, Zhao QL, Wang JY, Yang FL (2009) Power generation and electrochemicalanalysis of biocathodemicrobial fuel cell using graphite fiber brush as cathode material. FuelCells 9:588–596
233. Tandukar M, Huber SJ, Onodera T, Pavlostathis SG (2009) Biological chromium(VI)reduction in the cathode of a microbial fuel cell. Environ Sci Technol 43:8159–8165
234. Gregory KB, Lovley DR (2005) Remediation and recovery of uranium from contaminatedsubsurface environments with electrodes. Environ Sci Technol 39:8943–8947
235. Thrash JC, Trump JI, Weber KA, Miller E, Achenbach LA, Coates JD (2007) Electrochemicalstimulation of microbial perchlorate reduction. Environ Sci Technol 41:1740–1746
236. Thrash JC, Coates JD (2008) Review: direct and indirect electrical stimulation of microbialmetabolism. Environ Sci Technol 42:3921–3931
237. Powell EE, Mapiour ML, Evitts RW, Hill GA (2009) Growth kinetics of Chlorella vulgarisand its use as a cathodic half cell. Bioresour Technol 100:269–274
238. Fredrickson JK, Romine MF, Beliaev AS, Auchtung JM, Driscoll ME, Gardner TS, NealsonKH, Osterman AL, Pinchuk G, Reed JL, Rodionov DA, Rodrigues JLM, Saffarini DA, SerresMH, Spormann AM, Zhulin IB, Tiedje JM (2008) Towards environmental systems biology ofShewanella. Nat Rev Microbiol 6:592–603
239. Newman DK, Kolter R (2000) A role for excreted quinones in extracellular electron transfer.Nature 405:94–97
240. Dumas C, Basseguy R, Bergel A (2008) Microbial electrocatalysis with Geobacter sulfurre-ducens biofilm on stainless steel cathodes. Electrochim Acta 53:2494–2500

452 L. Huang et al.
241. Voordeckers JW, Kim BC, Izallalen M, Lovley DR (2010) Role of Geobacter sulfurreducensouter-surface c-type cytochromes in the reduction of soil humic acid and anthraquinone-2,6-disulfonate. Appl Environ Microbiol 76:2371–2375
242. Eggleston CM, Voros J, Shi L, Lower BH, Droubay TC, Colberg PJS (2008) Binding anddirect electrochemistry of OmcA, an outer-membrane cytochrome from an iron reducingbacterium with oxide electrodes: a candidate biofuel cell system. Inorg Chim Acta 361:769–777
243. Freguia S, Rabaey K, Yuan Z, Keller J (2008) Sequential anode-cathode configurationimproves cathodic oxygen reduction and effluent quality of microbial fuel cells. Water Res42:1387–1396

Index
AAcid black, 70, 81, 147, 166, 315Acid red 88 (AR88), 281, 307, 311, 312, 350Acoustic microstreaming, 181, 289, 304Activated sludge, 8, 47, 48, 56, 58, 60, 66, 73,
81, 178, 410, 416Adsorbate, 9, 68, 72, 108, 109, 114, 121, 181,
369Adsorbent, 9–13, 24–26, 68–73, 83, 97, 103,
105, 111, 114, 121, 122, 124, 125, 128,150, 181, 228, 345, 346, 348, 349,354, 363–371, 377, 381–383, 385, 386,388–392, 397, 398
Adsorption, 5, 60, 67, 95, 147, 178, 203,231–261, 270, 303, 342, 377
Adsorption-flocculation, 203, 228–229Advanced oxidation technologies (AOT),
278–284, 305, 309Advance oxidation processes (AOP), 17, 18,
51, 73–76, 85, 148, 150, 178, 190, 304Aerobic, 8, 13, 14, 46, 79–84, 147, 149, 179,
412, 423, 424, 429–431Agglomeration, 153, 160, 204, 248Aggregates breakage, 217, 218, 221Aggregation-fragmentation, 216Alazine, 309, 313Amphoteric polymer, 347Anaerobic, 13, 46, 79, 80, 82, 84, 179, 407,
410, 411, 423, 424, 428–434, 440Anaerobic digestion biotechnology, 179Anaerobic treatment, 79, 80, 82, 84Anionic dye, 69, 70, 72, 350, 355, 371,
388–390, 392Anionic polymer, 208–210, 214–216, 225AOP. See Advance oxidation processes (AOP)Aqueducts, 37–52Arsenic, 4–5
Auxochromes, 65Azo dye (s), 13, 80–82, 147–171, 179, 187,
278, 295, 307, 340, 350, 351, 355, 378,379, 388, 428, 429, 438
BBackground electrolyte-assisted
sonoelectrolysis (BEA-SECT),295, 315, 317, 323, 325, 329, 330
Bacterial treatment, 80BAFs. See Biological aerated filters (BAFs)Band gap, 151, 152, 154, 155Basic blue 9, 308BEA-SECT. See Background electrolyte-
assisted sonoelectrolysis (BEA-SECT)Bioaccumulation, 3, 5, 9, 81, 82, 108, 177,
179, 234Bioattenuation, 179Bioaugmentation, 179Biobleaching, 179Biocathode, 406, 425–435, 438, 439Biodegradation, 8, 13, 62, 81, 82, 147, 179,
306Biodeterioration, 179Bioenergy, 14, 80, 405–440Biological aerated filters (BAFs), 47–48Biological materials, 6, 72, 96, 99, 119, 129Biological treatment, 5, 8, 13, 14, 45–47, 51,
67, 79, 85, 150–151, 179, 305Biopulping, 179Bioremediation, 8–17, 109, 151, 178–179, 411Biosorption, 8–12, 72, 81, 82, 96, 97, 99, 100,
102–131, 179, 382Biostimulation, 179Biotransformation, 179Blackfoot disease, 4
S.K. Sharma and R. Sanghi (eds.), Advances in Water Treatment and PollutionPrevention, DOI 10.1007/978-94-007-4204-8,© Springer ScienceCBusiness Media Dordrecht 2012
453

454 Index
Boron removal, 203, 228–229Bridging attraction, 204, 206, 208, 210,
219–222, 224, 225, 362, 364Brilliant Red X-3B, 82, 315
CCadmium (Cd), 5, 6, 9, 10, 17, 95, 98, 100,
103, 105, 110–114, 116, 118, 120–126,128, 234, 245
Carbon nanotubes, 25–26, 412, 413, 428Cationic dye, 67, 75, 77, 83, 156, 157, 371, 388Cationic polymer, 207, 208, 210, 212–214,
216, 225, 241Cationic red X-GRL, 330Cavitation, 18, 19, 76, 181, 268–270, 272, 275,
277–279, 281, 282, 289, 294, 295, 304,311, 315, 324, 329, 330
Cavity design, 184Cd. See Cadmium (Cd)Chemical oxygen demand (COD), 26, 51, 59,
60, 62, 66, 69, 75, 78–80, 83–85, 182,211–216, 228, 229, 293, 329, 342, 407,410–412, 415, 424
Chemical reaction, 23, 71, 73, 104, 124, 180,184, 267, 268, 285, 289, 296, 304, 329,414, 416
Chemical treatment, 67, 74, 85, 95, 97, 150,203, 306
Chitin, 111, 117, 383–397, 408, 410Chitosan, 79, 111, 117, 382–397Chlorinated hydrocarbons, 3, 75Chromium, 5, 6, 10–12, 102, 103, 113, 114,
340, 379Chromophores, 7, 65Coagulation, 5, 60, 73, 147, 178, 203, 231–261,
340, 377Coagulation-flocculation, 78–79, 83–85, 203,
207–216, 224, 225, 377, 381–382COD. See Chemical oxygen demand (COD)Collision efficiency, 217–222Collision frequency, 217, 218, 221, 222Colour, 65–85Composting, 179, 188Congo red (CR), 27, 71, 147, 308, 310, 311,
389Constructed wetland treatment technology, 16Copper, 2, 5, 6, 74, 109, 116, 125, 126, 128,
182, 234, 277, 288, 291, 292, 319–321,379, 428
Cost analysis, 209, 215–216Cyclodextrins, 388, 392
DDegradation, 16, 74, 130, 147–171, 177–193,
268, 303, 377, 407Dichloroethylene (DCE), 319–321, 324–326,
3282,4-Dichlorophenol, 183, 3182,4-Dichlorophenoxyacetic acid2,4-Dichlorophenoxyacetic acid (2,4-D), 179,
191, 318, 330Diclofenac (DF), 309, 312, 3131,3-Dinitrobenzene, 3294,6-Dinitro-o-cresol (DNOC), 3302,4-Dinitrotoluene, 318, 329Direct flocculation, 201–229Disinfection, 17, 50, 238, 291DLVO theory, 205, 206Dodecylbenzene-sulfonate (DBS), 305, 306,
309, 314, 341, 357, 358Dual polymer system, 208, 214–215, 225, 227Dyes, 7, 147–171, 179, 272, 305, 339, 377, 428
and pigments, 65–85degradation, 310
Dyestuff, 13, 186, 187, 210, 305, 378Dynamic scaling, 221–222
EElectrical double layer repulsion, 202, 219,
220Electrochemical treatment, 95, 295, 305Electro-Fenton degradation, 330Electromagnetic, 23, 184Electron transfer mechanism, 406, 416–419,
429, 432, 434–435Emulsion liquid membrane (ELM), 77Environmental remediation, 23, 180, 181, 184,
269–274, 285, 294, 303, 306, 329
FFenton degradation, 330Fenton’s process, 329Flocculation, 78–79, 201–229Formetanate hydrochloride, 309Freundlich isotherm, 10, 11, 70–73, 104, 105,
117, 123, 124Fungal treatment, 80–82
GGesaprim, 309, 313Green chemistry, 9, 180

Index 455
Green technology, 178, 180, 193Groundwaters, 2, 4, 5, 15, 16, 24, 26, 27, 45,
55, 66, 180, 186, 234, 306, 342
HHalogenated hydrocarbons degradation, 306Heavy metals, 3, 67, 95–131, 186, 232, 291,
342, 428Herbicides degradation, 177, 179, 181, 185,
186, 188Humic substance, 232–233, 241, 243–261Hydrogels, 391, 397Hydrophobicity, 28, 159, 233, 304, 414
IIbuprofen (IBP), 308, 312Illicit drugs
amphetamine-like stimulants, 58, 60benzoylecgonine, 56cannabinoids, 59, 62cocaine, 56–57, 60ketamine, 59, 62LSD, 59, 62opiates, 59–62
Industrial effluents, 5, 7, 13, 16, 17, 27, 65–85,189, 340, 377, 378, 381, 394, 397
Industrial microwave ovens, 181Inorganic coagulant, 203, 207, 219, 242, 395Ion exchange, 5, 8, 9, 24, 25, 67, 68, 71–73,
95, 99, 116, 123, 126, 130, 385, 391,392, 439
LLangmuir isotherm, 10–12, 27, 69–73, 104,
105, 117, 123, 124, 390, 392Lead (Pb), 5, 7, 9, 12, 17, 26, 42, 56, 63, 100,
111–113, 115–118, 120–122, 125, 126,128, 157, 208, 238, 241, 288, 291, 295,311, 320, 321, 325, 347
Lignin modifying enzymes (LME), 15Liquid–liquid extraction, 76–77Lissamine Green B, 315Low-cost adsorbent, 69, 72, 83, 398
MMacromolecular materials, 377–398Macrophytes, 16–17, 48, 409Magnetic nanoparticles, 26Malachite green (MG), 82, 186, 308Maxilion Blue 5G, 314, 315
MB. See Methylene blue (MB)MCP. See Monocrotophos (MCP)Mechanisms for flocculation, 206–207Meldola blue (MDB), 330Membrane, 5, 63, 67, 95, 150, 178, 231–261,
287, 321, 378, 415Mesopore, 158, 159, 161, 162Metallic nanoparticles, 131Methylene blue (MB), 22, 27, 69–73, 76, 154,
186, 191, 307, 308, 312, 315, 351,363–367, 390, 391, 397, 432
Methylene orange (MO), 166–168, 170, 308Microbial fuel cell, 14, 405–440Microbial remediation, 13–14Microflocs, 203, 204, 208, 210Microorganisms, 9, 13, 24, 27, 47, 52, 67, 79,
81, 96, 99, 102, 103, 109, 110, 116,121, 127–128, 151, 178, 235, 236, 239,304, 406, 408, 411, 413, 414, 417, 429,430, 434, 437, 438
Micropollutants, 3Microwave cavity, 23, 184Microwaves, 8, 23–24, 177–193Microwave technology, 23–24, 190MO. See Methylene orange (MO)Modeling and simulation, 203, 216–222Monocrotophos (MCP), 309, 313, 314Moringa oleifera, 79, 338, 344–346, 349–354,
370, 371, 381
NNanocatalyst, 24, 25Nanochemistry, 24Nanocrystal(s), 25, 26, 127, 147–171Nanofiltration membranes, 27–28, 178, 234Nanotechnology, 24–28, 63, 154Naphthol blue black (NBB), 278, 307, 310Natural coagulants, 78, 345, 349–363, 381,
382, 394, 395NBB. See Naphthol blue black (NBB)Nickel, 5–7, 114, 121–123, 125, 126, 192,
315Nitrocompounds degradation, 318Nonionic polymer, 208Nonylphenol ethoxylate (NPE), 189, 309, 314
OOrange G (OG), 307, 311Organic contaminants, 17, 24, 83, 179–181,
185–192, 282, 304, 305Organic polymer, 203, 208Orthokinetic aggregation, 218

456 Index
Ozonation, 20, 23, 60, 62, 63, 73, 75, 85, 147,178, 190, 238, 279, 305, 327, 329, 378
PPalm oil mill effluent (POME), 209–216Pb. See Lead (Pb)Perchloroethylene (PCE), 3, 295, 318–328Perfluorooctane sulfonate (PFOS), 19Perfluorooctanoate (PFOA), 19Persistent organic pollutants (POPs), 3, 4, 181Pesticides degradation, 313PFOA. See Perfluorooctanoate (PFOA)PFOS. See Perfluorooctane sulfonate (PFOS)Pharmaceuticals degradation, 307, 312, 313Phenol, 27, 75, 83, 183, 191, 192, 272, 276,
277, 279, 294, 315–317, 347, 379, 388Phenolic derivatives degradation, 315–318Photocatalysis, 22, 23, 26, 74, 76, 84, 147, 148,
150–159, 190, 193, 278–279, 281, 294,296, 303–305, 307, 309–314, 327
Photocatalytic degradation, 151–157, 166–168,170, 171, 178, 191, 281, 310, 313, 314,327
Photocatalytic water treatment technology, 17Photoelectrocatalysis, 178Physical treatment, 68, 79, 150Physicochemical methods, 8, 73–74, 97Phytoremediation, 15–17, 179Platinum (Pt), 95, 101, 112, 154, 164, 166–167,
169, 171, 289, 309, 314, 316, 408, 409,414, 415, 426–429, 438
Pollutant, 2–9, 13, 14, 17–24, 26, 27, 46,51–52, 66, 67, 78, 81, 99, 126, 148, 150,151, 177–193, 232, 267–269, 272–275,277–281, 290, 292, 294–296, 303–331,338, 340, 342, 353, 355, 361–363, 366,377, 382, 392, 426, 431
Polycyclic aromatic hydrocarbons (PAHs), 2,3, 14, 25, 181, 182, 185–188
Polysaccharides, 96, 101, 109, 110, 117, 119,377–398, 422, 423
POME. See Palm oil mill effluent (POME)POPs. See Persistent organic pollutants (POPs)Population balance model (PBM), 203,
216–218, 221, 222Pretreatment, 13, 27, 28, 39, 67, 69, 78, 98,
110, 113, 130, 150, 207–216, 232,236–242, 407, 408
Procion Blue, 84, 315Pseudo-first order model, 104, 118Pseudo-second order model, 392Pt. See Platinum (Pt)
RReaction pathways, 23, 184, 304, 311, 318Reactive black 5 (RB5), 73, 81, 307Reactive Blue 19, 75, 315, 391Reactive Brilliant X-3B, 315Reactive red 198, 308Recalcitrant waste, 410Removal of illicit drugs
drinking water, 55–63wastewater, 55–63
Rhodamine B, 26, 77, 274, 275, 315
SSandolan Yellow, 314, 315Sediments, 15, 16, 39, 180, 185, 186, 430, 431Seed gums, 381, 383, 393–397Septic tanks, 46SERS analysis. See Surface-enhanced Raman
spectroscopy (SERS) analysisSewers, 7, 38–45, 50, 185, 377Single polymer system, 208, 209, 212–214,
225, 226SLM. See Supported liquid membrane (SLM)Sol-gel, 26, 27, 159–164, 167–169, 171Sonochemical degradation, 268, 280, 331Sonochemistry, 180–181, 267, 268, 304, 306Sonoelectrochemical treatment, 285, 289–294,
318, 325–327, 331Sonoelectrochemistry, 296, 306, 316, 318, 329Sonoelectro-Fenton degradation, 330Sono-Fenton degradation, 330Sonolysis, 19, 22, 23, 190, 278–279, 294, 304,
310, 312–314, 325Sonophotocatalysis, 22, 294, 296, 307–309,
311–314, 330Sonophotocatalytic degradation, 294, 306–314Sonophotochemistry, 267–296, 303–331Sonophotoeletrocatalysis, 328, 329SrTiO3, 151–154, 163, 166, 168–171SrTixZr1-xO3, 170Stabilized colloidal suspensions, 204–206Starch, 383, 391–393, 407Supported liquid membrane (SLM), 76, 77Surface-enhanced Raman spectroscopy
(SERS) analysis, 319Surfactants, 19, 67, 77, 160–163, 168, 169,
272, 305–307, 309, 314, 339–343, 345,347, 353–355, 357–359, 361–364, 371
degradation, 314Sustainable water treatment, 3, 8, 17Synergistic effect or synergic index, 22, 190,
281, 307–309, 312, 313, 327, 330

Index 457
Synthetic dyes, 7, 8, 13, 66, 75, 82, 340, 378,388, 389, 394, 395
TTextile effluents, 7, 83, 186, 187, 377–398Thermal properties, 184Thermolysis, 18, 19, 83, 85, 181TiO2, 17, 22, 24, 26, 51, 76, 148, 151–153,
163–168, 190, 191, 193, 278, 282–284,303, 307–314, 328, 331, 391, 413
TiO2 photocatalystscatalysts, 17effect of additives, 273, 311effect of dissolved gases, 311effect of light, 312effect of pH, 72, 102–103, 119–121,
125–126, 314effect of ultrasound power, 311
Toxic contaminants, 75, 178Toxicity, 5–7, 9, 15, 17, 66, 75, 85, 129, 130,
151, 187, 234, 297, 305, 318, 325, 342,377, 378, 391, 425
Trichloroacetic acid, 318Trichloroethylene (TCE), 3, 20, 25, 320, 321,
324–326, 328Trickling sand filter, 46–47, 57Trupocor Red, 315
UUF membrane, 234, 235, 239, 240, 243, 244,
254Ultrasonic irradiation, 22, 74, 76, 182, 272,
282, 284, 292, 304, 316, 318, 330
Ultrasonic reactor, 269–274Ultrasound, 17–23, 76, 180–183, 267–272,
274, 277–279, 281–296, 307–313, 315,316, 318, 325, 326, 329, 330
VValue-added product, 432, 437–439Van Der Waals Energy, 219–220, 222Vermicomposting, 179
WWastes, 2, 5, 9–13, 17, 37, 38, 44, 45, 52, 67,
69, 70, 72, 79, 80, 85, 96, 99, 111, 115,116, 130, 177, 188, 305, 345, 370, 377,378, 389, 391, 406–425, 429, 435, 438,439
Wastewaters, 3, 4, 37–52, 55–63, 66, 95, 147,177, 201–229, 234, 267–296, 303, 342,378–383, 405
Wastewater treatment, 14, 16, 17, 24–28,37–52, 55–63, 66–69, 72, 78–83, 85,103, 128–130, 185, 201–229, 267, 268,275, 278, 291, 294, 304, 337–371, 377,381, 384, 397, 405–440
Wet air oxidation, 25, 83White-rot fungi (WRF), 14
ZZinc (Zn), 5, 7, 9, 17, 95, 98, 100, 108, 109,
111, 112, 114, 116, 118, 119, 121,124–126, 128, 191, 234, 245–248,252–255, 291