ad*views - nielsenen-us.nielsen.com/sitelets/cls/documents/adviews/adviews...4 visit or call...
TRANSCRIPT

A D*VI EWSSUMMARY DATABASE2015
2 VISIT http://en-us.nielsen.com/sitelets/cls/adviews.html OR CALL 1-800-423-4511
AD*VIEWS: SUMMARY DATABASE
Effective May 11, 2015, a Summary Database will be included in the Ad*Views application. This database allows users
to run reports at a summary level with a fast turn-around time. In addition, users will be able to pivot/manipulate their
summary reporting output. The Summary Database can be accessed via the Report Type page within Ad*Views. Simply log
into Ad*Views, navigate to the Report Type page and click on the radio button next to Summary.
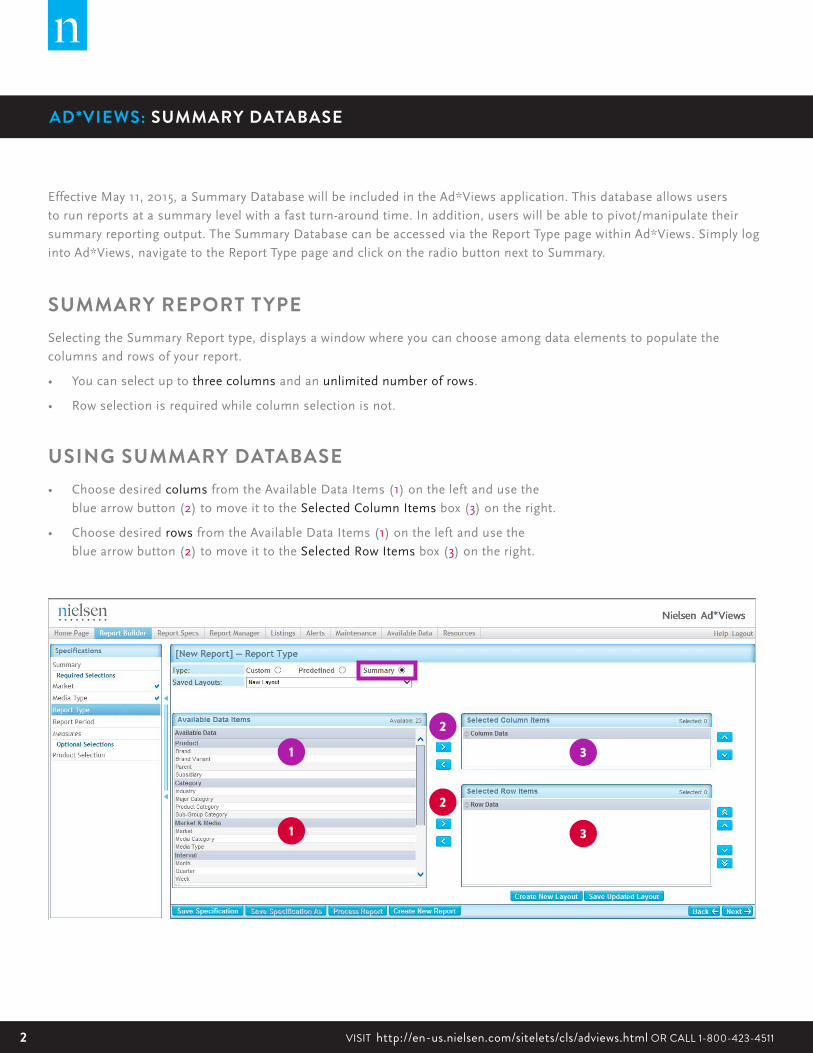
SUMMARY REPORT TYPE Selecting the Summary Report type, displays a window where you can choose among data elements to populate the
columns and rows of your report.
• You can select up to three columns and an unlimited number of rows.
• Row selection is required while column selection is not.
USING SUMMARY DATABASE• Choose desired colums from the Available Data Items (1) on the left and use the
blue arrow button (2) to move it to the Selected Column Items box (3) on the right.
• Choose desired rows from the Available Data Items (1) on the left and use the
blue arrow button (2) to move it to the Selected Row Items box (3) on the right.
1
1
2
3
2
3
3Copyright © 2015 The Nielsen Company
AD*VIEWS: SUMMARY DATABASE
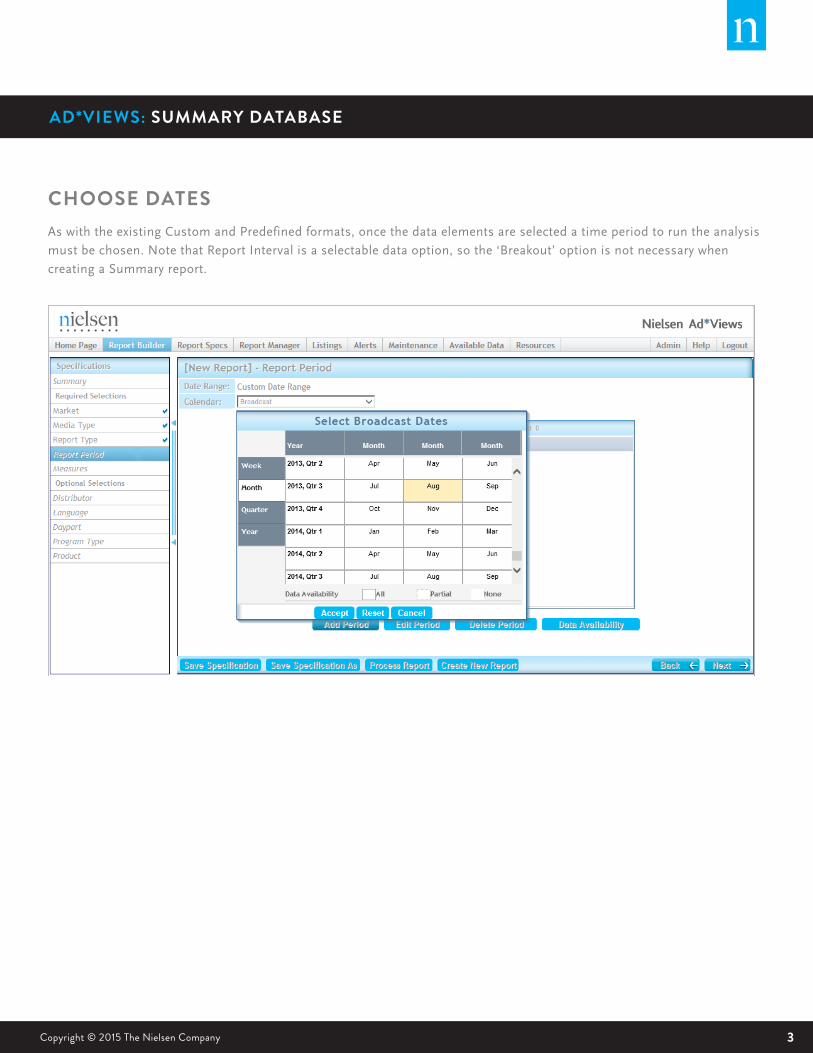
CHOOSE DATESAs with the existing Custom and Predefined formats, once the data elements are selected a time period to run the analysis
must be chosen. Note that Report Interval is a selectable data option, so the ‘Breakout’ option is not necessary when
creating a Summary report.

4 VISIT http://en-us.nielsen.com/sitelets/cls/adviews.html OR CALL 1-800-423-4511
AD*VIEWS: SUMMARY DATABASE
CHOOSE MEASURESThe selection of measures differs from either the Custom or Predefined Report formats. The Summary database allows
a measure to be selected, providing it is a valid measure, for at least one media type selected for reporting.
Media for which that selected measure is not applicable will appear blank in the output.
PROCESS REPORTClick the Process Report button and your output will open in the same window.
AD*VIEWS: SUMMARY DATABASE

5Copyright © 2015 The Nielsen Company
AD*VIEWS: SUMMARY DATABASE AD*VIEWS: SUMMARY DATABASE
REPORT OUTPUTThe Report Viewer displays in the same window after you click the Process Report button. There is a Dimensions column
on the left-hand side of the window that contains a list of all available items you can add into your report layout. Using this
column in the Report Viewer allows you to edit the report layout.
6 VISIT http://en-us.nielsen.com/sitelets/cls/adviews.html OR CALL 1-800-423-4511
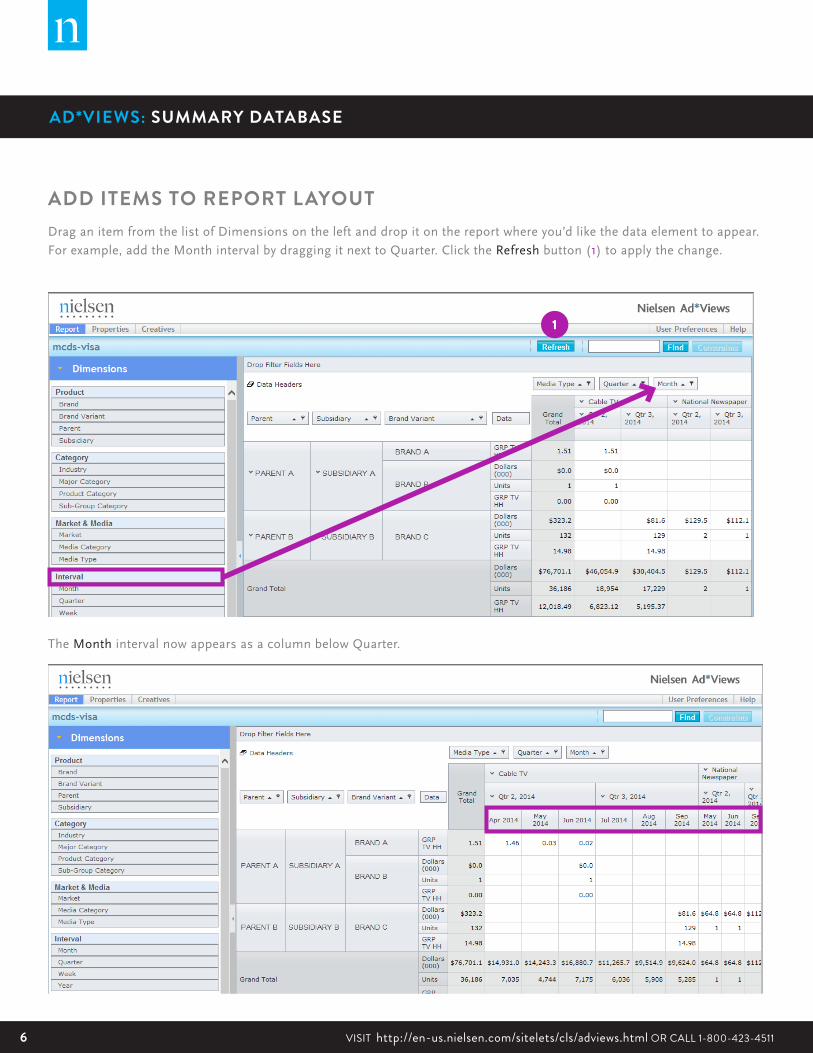
ADD ITEMS TO REPORT LAYOUTDrag an item from the list of Dimensions on the left and drop it on the report where you’d like the data element to appear.
For example, add the Month interval by dragging it next to Quarter. Click the Refresh button (1) to apply the change.
The Month interval now appears as a column below Quarter.
AD*VIEWS: SUMMARY DATABASE
1
AD*VIEWS: SUMMARY DATABASE
7Copyright © 2015 The Nielsen Company
AD*VIEWS: SUMMARY DATABASE AD*VIEWS: SUMMARY DATABASE
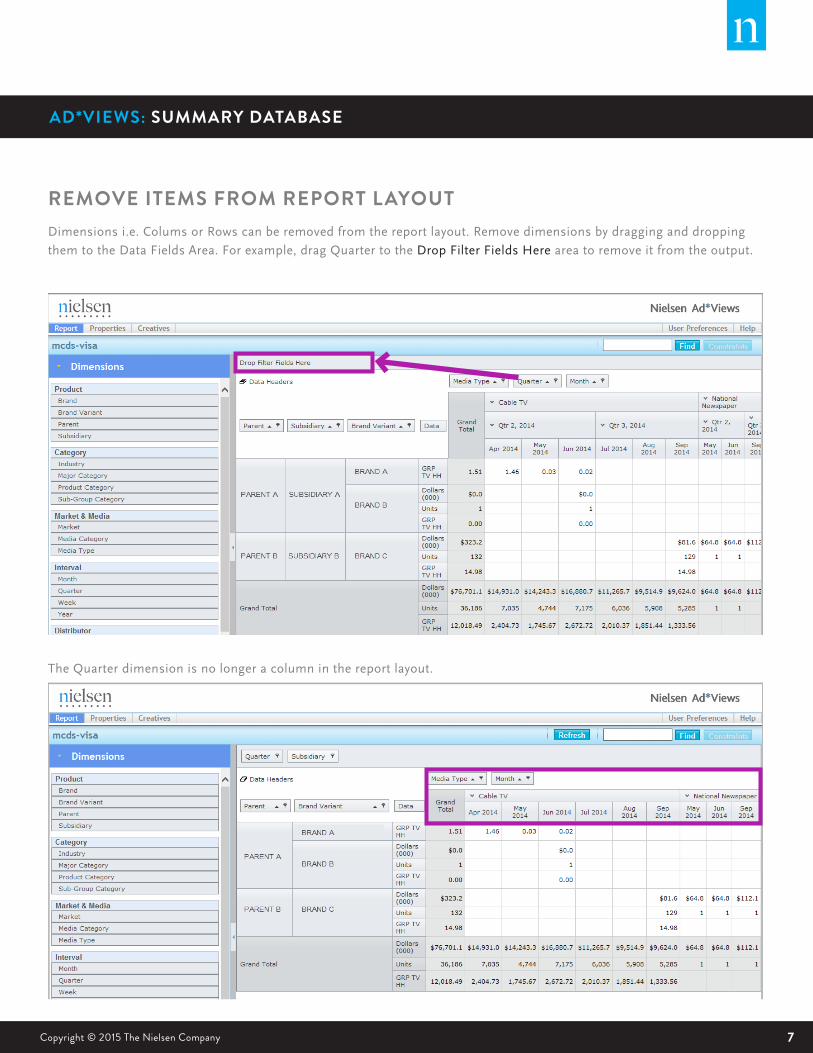
REMOVE ITEMS FROM REPORT LAYOUTDimensions i.e. Colums or Rows can be removed from the report layout. Remove dimensions by dragging and dropping
them to the Data Fields Area. For example, drag Quarter to the Drop Filter Fields Here area to remove it from the output.
The Quarter dimension is no longer a column in the report layout.

8 VISIT http://en-us.nielsen.com/sitelets/cls/adviews.html OR CALL 1-800-423-4511
ADD/REMOVE DATA ELEMENTS FROM REPORT OUTPUTIn addition to being able to move Dimensions on and off of the report output, you can do the same with data elements.
To remove a data element, hover over the (1) Data Headers label to reveal all existing data elements in the report output.
Drag an item such as Dollars to the (2) Drop Filter Fields Here area to remove it from the output.
AD*VIEWS: SUMMARY DATABASE
1
2
AD*VIEWS: SUMMARY DATABASE

9Copyright © 2015 The Nielsen Company
ADD/REMOVE DATA ELEMENTS FROM REPORT OUTPUTNotice the Dollars are removed from the report output.
To return Dollars to the report output, simply drag Dollars back to the Data Headers area.
AD*VIEWS: SUMMARY DATABASE AD*VIEWS: SUMMARY DATABASE

10 VISIT http://en-us.nielsen.com/sitelets/cls/adviews.html OR CALL 1-800-423-4511
CREATIVES TABA Creatives tab displays at the top left when a media which contains creative is included in your report specification.
Creatives are provided without having to include creative description as a reportable data element.
AD*VIEWS: SUMMARY DATABASE

11Copyright © 2015 The Nielsen Company
AD*VIEWS: SUMMARY DATABASE AD*VIEWS: SUMMARY DATABASE
CREATIVESClick the Creatives tab, and choose a Creative Description. Creative can be viewed and downloaded using the Download
button at the bottom left of the window.
12 VISIT http://en-us.nielsen.com/sitelets/cls/adviews.html OR CALL 1-800-423-4511
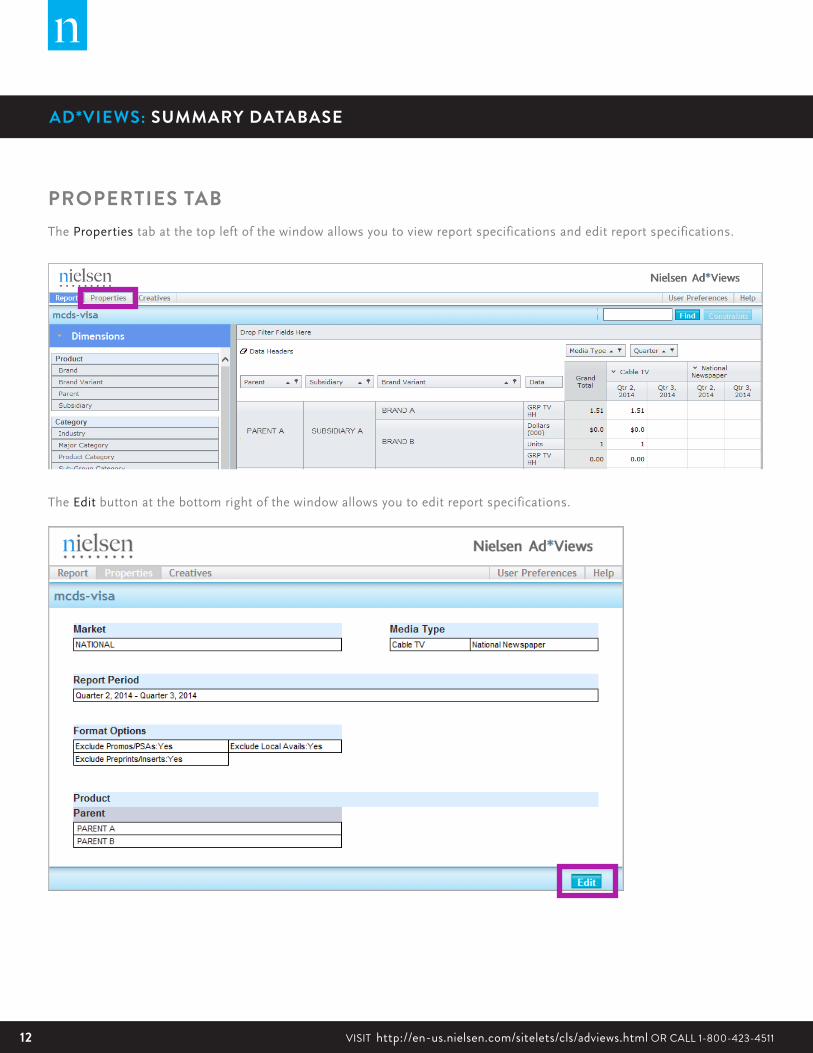
PROPERTIES TABThe Properties tab at the top left of the window allows you to view report specifications and edit report specifications.
The Edit button at the bottom right of the window allows you to edit report specifications.
AD*VIEWS: SUMMARY DATABASE

13Copyright © 2015 The Nielsen Company
EDIT REPORT SPECIFICATIONAfter you click the Edit button, a pop-up window appears alerting you to the browser window/tab that also opened.
AD*VIEWS: SUMMARY DATABASE AD*VIEWS: SUMMARY DATABASE
14 VISIT http://en-us.nielsen.com/sitelets/cls/adviews.html OR CALL 1-800-423-4511
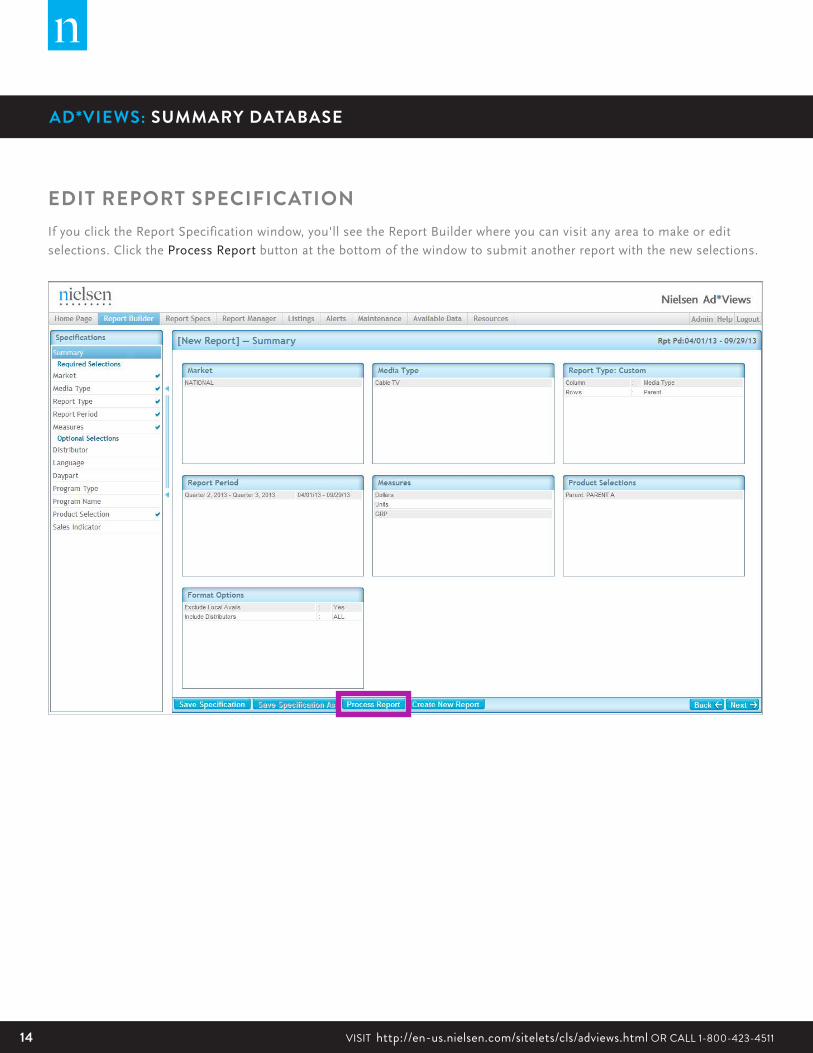
EDIT REPORT SPECIFICATIONIf you click the Report Specification window, you'll see the Report Builder where you can visit any area to make or edit
selections. Click the Process Report button at the bottom of the window to submit another report with the new selections.
AD*VIEWS: SUMMARY DATABASE

15Copyright © 2015 The Nielsen Company
CONVERT CUSTOM REPORT TO A SUMMARY REPORTIt is possible to convert a previously run Custom report to the Summary format. Go to Report Manager, and highlight the
Custom Report you’d like to convert to a Summary Report.
The Report Specification page appears. Click Report Type from the Specifications list on the left-hand side.
Select the Summary radio button. The column and row fields are populated with your previously defined Custom report
selections. You may add additional elements or not. Click the Process Report button and your report specification will be
submitted and a Summary report will be generated.
AD*VIEWS: SUMMARY DATABASE AD*VIEWS: SUMMARY DATABASE

16 VISIT http://en-us.nielsen.com/sitelets/cls/adviews.html OR CALL 1-800-423-4511
ABOUT NIELSEN Nielsen Holdings N.V. (NYSE: NLSN) is a global information and
measurement company with leading market positions in marketing
and consumer information, television and other media measurement,
online intelligence, mobile measurement, trade shows and related
properties. Nielsen has a presence in approximately 100 countries, with
headquarters in New York, USA and Diemen, the Netherlands.
For more information, visit www.nielsen.com.
Copyright © 2015 The Nielsen Company. All rights reserved. Nielsen and
the Nielsen logo are trademarks or registered trademarks of CZT/ACN
Trademarks, L.L.C. Other product and service names are trademarks or
registered trademarks of their respective companies.