aei political report — insiders and outsiders: what americans are telling the pollsters
DESCRIPTION
AEI Political Report — Insiders and outsiders: What Americans are telling the pollstersTRANSCRIPT

Insiders and Outsiders: What Americans Are Telling the Pollsters Commentators have dubbed this the “summer of the political outsider” because of the popularity of Donald Trump and Ben Carson. In 1987, 35 percent said they would rather have a presidential candidate whose political experience was mostly outside of Washington. This spring, 56 percent gave that response. In another question, however, 52 percent said they would be less likely to support a presidential candidate who has never held elected office.
Q: Would you rather have . . . ?
A presidential candidate whose Someone whose experience political experience was mostly was mostly in the government outside of Washington in Washington 35% 1987 49% 40 1991 46 48 1999 31 56 2015 32
Note: Asked of registered voters. In 1991, question wording was “inside the federal government in Washington” rather than “in the government in Washington.”Source: CBS News/New York Times, latest that of April–May 2015.
Q: Thinking about presidential elections, we’d like to know how you generally feel about some different traits. First, would you be more likely or less likely to support a candidate for president who. . . ?
2014 2011 2007Has been an elected official in Washington for many years More likely to support 19% 26% 35% Less likely to support 30 25 15 Wouldn’t matter 48 46 45
Has never held elected office before More likely to support 9% 9% 7% Less likely to support 52 51 56 Wouldn’t matter 37 38 35
Has been a business executive More likely to support 33% 35% 28% Less likely to support 13 14 13 Wouldn’t matter 53 49 56
Note: In 2014, 46 percent of Republicans said they would be more likely to support a candidate who has been a business executive, 5 percent said less likely, and 47 percent said it wouldn’t matter. Of Democrats, 18 percent said they would be more likely to support such a candidate, 20 percent said less likely, and 60 percent said it wouldn’t matter.Source: Pew Research Center, latest that of April 2014.
Volume 11, Issue 9 • October 2015A M o n t h l y P o l l C o M P i l A t i o n
A M E R I C A N E N T E R P R I S E I N S T I T U T E1150 Seventeenth Street, NW, Washington, DC 20036 • 202.862.5800 • www.aei.org
IN THIS ISSUE: Insiders and Outsiders (Pages 1–3) The Economy, Seven Years Later (Pages 4–6) • Income Inequality (Pages 7–12)

AEI, 1150 Seventeenth Street, NW, Washington, DC 20036 • 202.862.5800 • www.aei.org 2
(Continued from the previous page)In 2007, 18 percent of Republicans told Pew they would be less likely to support a presidential candidate who had been an elected official in Washington. By 2014, that response had doubled. Democrats’ responses doubled, too, from a lower 10 to 20 percent. Question wording is always important. Forty-six percent of registered voters in a September 2015 Quin-nipiac poll said someone who has experience in Washington would better help a candidate serve effectively as president (48 percent said an outsider perspective would). In a September ABC News/Washington Post poll, however, 56 percent said they would like to see someone with experience in how the political system works as the next president (40 percent said they wanted someone from the outside). Republicans and Democrats differed sharply on these questions. In a CBS News/New York Times question asked of primary voters who expressed preference for a particular candidate, 63 percent of Republicans and 56 percent of Democrats said it was too early to say for sure that their minds were made up about who they would support.
Q: Thinking about presidential elections, we’d like to know how you generally feel about some different traits. First, would you be more likely or less likely to support . . . ?
A presidential candidate who has been an elected official in Washington for many years
————————Republicans———————— ————————Democrats————————
Less Wouldn’t Less Wouldn’t More likely likely matter More likely likely matter 40% 18% 37% 2007 39% 10% 48% 25 34 38 2011 29 15 52 15 36 46 2014 26 20 53
Source: Pew Research Center, latest that of April 2014.
Q: If you had to choose, which type of experience do you think would better help a candidate serve effectively as president . . . ? Someone who has Someone who is a experience in Washington Washington outsider 46% Total 48%
23 Republicans 72 81 Democrats 15
Note: Asked of registered voters. In a 2011 Associated Press/GfK online survey of national adults that asked the same question, 56 percent said someone who has experience in Washington, and 42 percent said a Washington outsider. In that survey, Republicans were evenly split, with 48 percent giving each response. Source: Quinnipiac University, September 2015.
Q: When thinking about the kind of person you’d like to see as the next president, which of these is more important to you . . . ? Someone with experience in Someone from outside the how the political system works existing political establishment 56% Total 40%
36 Republicans 58 73 Democrats 24
Source: ABC News/Washington Post, September 2015.
(Continued on the next page)

AEI, 1150 Seventeenth Street, NW, Washington, DC 20036 • 202.862.5800 • www.aei.org 3
Politics as a Life’s WorkAs many pollsters have noted, dissatisfaction with the way Washington is working is approaching or exceeding Watergate-era levels. This sentiment is embodied in opinions of politics as a profession over time, which has never been very attractive to the general public. Few Americans say they would like their children to pursue a political career. In 1943, when the National Opinion Research Center asked people whether they would want a son to choose politics as a life’s work, only 17 percent said they would. In 2013, 25 percent in a Gallup survey said they would like a son to go into politics. Recent results for daughters are not significantly different.
Q: On the whole, would you say you are . . . ?
Note: In 1991, question word-ing was “the way the nation is governed.”Source: The Gallup Organiza-tion, latest that of September 2014.
Q: If you had a son just getting out of school would you like to see him go into politics as a life work? (NORC, 1943, 1945)
Q: If you had a son or daughter, would you like to see him or her go into poli-tics as a life’s work when he or she gets out of school? (Pew, 1997)
Q: If you had a son or daughter just getting out of school, would you like to see him or her pursue a career in politics, or not? (Pew, 2010)
Q: If you had a son, would you like to see him go into politics as a life’s work? (Gallup*)
Note: *Question wording for Gallup’s December 1944–January1945 and 1955 to 1965 surveys was “If you had a son, would you like to see him go into politics as a life’s work, when he gets out of school?” Data for Gallup’s 1993 to 2013 surveys use only data from a subset of cases asked about son first. When respondents in 1993, 1994, 1995 and 2013 were asked a question about their daughter going into politics before the question about their son, “yes” responses to both questions were higher. In Gallup’s 2013 survey, average responses to questions asked about a son, a daughter, and a child were identical, with 31 percent saying they would like their child to go into politics and 64 saying they would not.Source: National Opinion Research Center, November 1943, November 1945; The Gallup Organization, December 1944–January 1945 to 1973, 1993 to 1994, and June 2013; Pew Research Center, October 1997 and March 2010.
0
10
20
30
40
50
60
70
80
90
100
1971
1973
1975
1977
1979
1981
1983
1985
1987
1989
1991
1993
1995
1997
1999
2001
2003
2005
2007
2009
2011
2013
Satisfied with the way the nation is being governed
Dissatisfied
37% 54%
72%
27%
0
10
20
30
40
50
60
70
80
90
100
1943 1948 1953 1958 1963 1968 1973 1978 1983 1988 1993 1998 2003 2008 2013
17%
69% 70%
25%
No, would not like to see child go into politics
Yes, would
AEI, 1150 Seventeenth Street, NW, Washington, DC 20036 • 202.862.5800 • www.aei.org 4
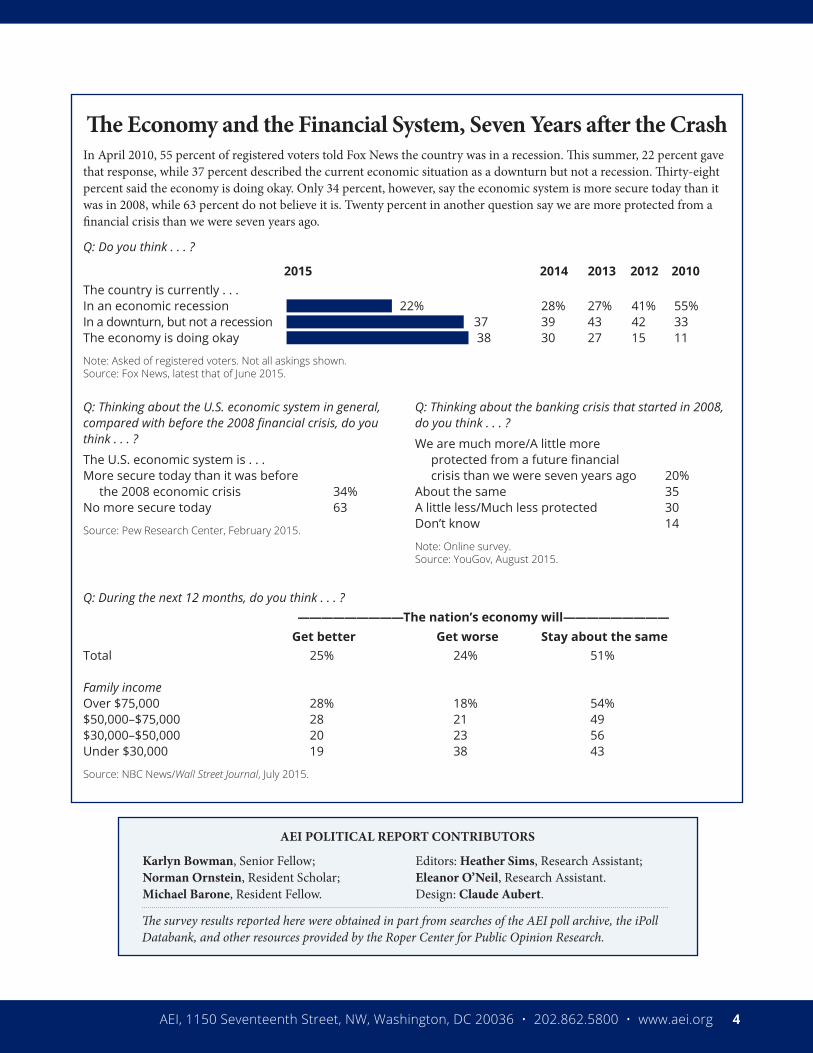
The Economy and the Financial System, Seven Years after the CrashIn April 2010, 55 percent of registered voters told Fox News the country was in a recession. This summer, 22 percent gave that response, while 37 percent described the current economic situation as a downturn but not a recession. Thirty-eight percent said the economy is doing okay. Only 34 percent, however, say the economic system is more secure today than it was in 2008, while 63 percent do not believe it is. Twenty percent in another question say we are more protected from a financial crisis than we were seven years ago.
Q: Do you think . . . ?
2015 2014 2013 2012 2010 The country is currently . . .In an economic recession 22% 28% 27% 41% 55%In a downturn, but not a recession 37 39 43 42 33The economy is doing okay 38 30 27 15 11
Note: Asked of registered voters. Not all askings shown.Source: Fox News, latest that of June 2015.
Q: During the next 12 months, do you think . . . ? —————————The nation’s economy will————————— Get better Get worse Stay about the sameTotal 25% 24% 51%
Family incomeOver $75,000 28% 18% 54%$50,000–$75,000 28 21 49$30,000–$50,000 20 23 56Under $30,000 19 38 43
Source: NBC News/Wall Street Journal, July 2015.
Q: Thinking about the U.S. economic system in general, compared with before the 2008 financial crisis, do you think . . . ?
The U.S. economic system is . . .More secure today than it was before the 2008 economic crisis 34%No more secure today 63
Source: Pew Research Center, February 2015.
Q: Thinking about the banking crisis that started in 2008, do you think . . . ?
We are much more/A little more protected from a future financial crisis than we were seven years ago 20% About the same 35 A little less/Much less protected 30Don’t know 14
Note: Online survey.Source: YouGov, August 2015.
AEI POLITICAL REPORT CONTRIBUTORS
Karlyn Bowman, Senior Fellow; Norman Ornstein, Resident Scholar; Michael Barone, Resident Fellow.
Editors: Heather Sims, Research Assistant; Eleanor O’Neil, Research Assistant. Design: Claude Aubert.
The survey results reported here were obtained in part from searches of the AEI poll archive, the iPoll Databank, and other resources provided by the Roper Center for Public Opinion Research.

AEI, 1150 Seventeenth Street, NW, Washington, DC 20036 • 202.862.5800 • www.aei.org 5
A Partial Recovery: Jobs and IncomesPeople’s opinions about job opportunities where they live have returned to pre-recession levels, but more still say jobs are difficult to find than say there are plenty of jobs available. In a separate question, two-thirds of Americans told Pew earlier this year that the job situation had either fully or partially recovered. Fifty-six percent felt that way about house-hold incomes. Opinions of both jobs and incomes bulk in the partially recov-ered category, though this is a clear improvement from two years ago, when Pew first asked these questions.
Q: Thinking now about job opportunities where you live, would you say . . . ?
Note: Asked of registered voters in October 2012 and of a half sample in August 2014 and May 2015.Source: Pew Research Center and ABC News/Washington Post, latest that of May 2015.
Q: Thinking about the recession that began in 2008, please tell me whether you think each of the following has fully recovered from the recession, partially recovered, or hardly recovered at all.
————————2015———————— ————————2013————————
Fully/Partially Hardly recovered Fully/Partially Hardly recovered recovered at all recovered at allThe job situation Total 67% 32% 47% 52%
Family income $100,000 or more 74 26 52 48 $75,000–$99,999 78 22 50 50 $30,000–$74,999 67 32 50 49 Less than $30,000 61 39 42 56
Household incomes Total 56% 42% 44% 54%
Family income $100,000 or more 65 33 52 46 $75,000–$99,999 64 35 36 62 $30,000–$74,999 57 42 45 54 Less than $30,000 50 48 42 56
Note: Not all categories shown. Source: Pew Research Center, latest that of February 2015.
(Continued from the previous page)
0
10
20
30
40
50
60
70
80
90
100
2001 2002 2003 2004 2005 2006 2007 2008 2009 2010 2011 2012 2013 2014 2015
There are plenty of jobs available in your community
Jobs are difficult to find
44% 42%
53% 40%

AEI, 1150 Seventeenth Street, NW, Washington, DC 20036 • 202.862.5800 • www.aei.org 6
Your Personal Finances: Better but Not BackAs the graph below shows, people’s ratings of their personal financial situations and of general economic conditions have improved since the recession, but they are still not as high as they were before its onset. In a Pew poll from earlier this year, 30 percent said the recession had a major effect on their personal financial situation and their finances had not yet recovered from it. About the same proportion said the recession had a major effect on them but that their finances had mostly recovered.
Q: How would you rate your own personal financial situation?
Q: Thinking about the nation’s economy, how would you rate economic conditions in this country today?
Note: Personal financial situation question asked of registered voters in September 2006 and of a half sample in December 2013.Source (personal financial situation): US News, PSRA/Newsweek, Pew Research Center/USA Today, Pew Research Center, latest that of February 2015; (economic conditions today): Pew Research Center/USA Today, Pew Research Center, latest that of February 2015.
Q: Overall, which of the following best describes how the recession affected your own personal financial situation?
----------Recession’s effect on your personal financial situation----------
Major effect, Major effect, Did not have a have not recovered mostly recovered major effectTotal 30% 29% 40%
Family income$100,000 or more 14% 36% 50%$75,000–$99,999 27 33 40$30,000–$74,999 29 31 39Less than $30,000 38 24 36
Note: Total responses to this question have changed only slightly since Pew first asked it in February 2011. Then, 36 percent said the recession had a major effect on their finances and had not recovered, 25 percent said the recession had a major effect but had mostly recovered, and 37 percent said the recession did not have a major effect on their personal finances.Source: Pew Research Center, February 2015.
0
10
20
30
40
50
60
70
50%
31%
43%
25%
My own personal financial situation is in excellent/good shape
The economic conditionsin this country today arein excellent/good shape
2003 2004 2005 2006 2007 2008 2009 2010 2011 2012 2013 2014 2015
In Pew’s latest askings of the questions above, 37 percent rated their own personal financial situation as only fair, while about one out of five rated their situation as being in poor shape. Forty-three percent rated the coun-try’s economic conditions as only fair, while 31 percent said they were in poor shape.

AEI, 1150 Seventeenth Street, NW, Washington, DC 20036 • 202.862.5800 • www.aei.org 7
Is the Deck Stacked? Views on Income InequalityA common refrain from Republicans and Democrats in the 2016 campaign is that the “deck is stacked against ordinary Americans.” The polls we feature in the following pages show what Americans think about opportunity and income inequality in this country. People believe it is possible to start out poor and become rich. More people say the economic system is basically fair than say it is basically unfair, although the division of opinion is close. These responses notwith-standing, Americans say the system generally favors the wealthy today and that it’s mainly just a few people at the top who can get ahead. Identical proportions of blacks and whites (59 percent) gave that response in July.
Q: Do you think . . . ?
Source: CBS News, New York Times, and CBS News/New York Times, latest that of December 2014.
Q: Do you think . . . ?
The economic system in the United States is . . .Basically fair since all Americans have an equal opportunity to succeed 52%Basically unfair since not all Americans have an equal opportunity to succeed 45
Source: New York Times, December 2014.
Q: Do you think . . . ?
The U.S. economic system generally favors the wealthy 68%Is fair to most Americans 27
Note: In 2014, the responses were 71 and 24 percent, respectively.Source: ABC News/Washington Post, July 2015.
Q: Which comes closer to your view . . . ?
In today’s economy . . . Everyone has a fair chance to get ahead in the long run 35%It’s mainly just a few people at the top who have a chance to get ahead 61
Source: CBS News/New York Times, May 2015.
0
10
20
30
40
50
60
70
80
90
100
1982 1984 1986 1988 1990 1992 1994 1996 1998 2000 2002 2004 2006 2008 2010 2012 2014
57%
38%
64%
33%
It is still possible to start out poor in this country, work hard, and become rich
It is not still possible
In the May 2015 CBS News/New York Times poll, 64 percent of those making less than $50,000 said it is mainly just a few at the top who have a chance to get ahead, as did 58 percent of those in the $50,000–$100,000 bracket and 54 percent of those earning more than $100,000. In a July 2015 CBS News/New York Times poll, 59 percent of whites and, separately, blacks said just a few people at the top have a chance to get ahead in today’s economy. Thirty-seven percent of whites and 39 percent of blacks said everyone has a fair chance.

AEI, 1150 Seventeenth Street, NW, Washington, DC 20036 • 202.862.5800 • www.aei.org 8
The Gap between Rich and PoorIn the next three pages, we provide different poll-based perspectives about the gap between the rich and the poor. In Gallup’s trend, a majority consistently express satisfaction with the opportunity for someone in America to get ahead by working hard. In 2014 and 2015, people were much less satisfied with the way wealth and income are distributed in the U.S. A bare majority say the gap is a major problem, and a large number in another question say it’s getting larger.
Q: Next, I’m going to read some aspects of life in America today. For each one, please say whether you are . . . ?
Source: The Gallup Organization, latest that of January 2015.
Q: Thinking about the income gap between wealthy Americans and those who are less well-off, do you think . . . ?
Income gap is a major problem 51%A problem, but not a major one 32Not a problem 15
Source: ABC News/Washington Post, January 2015.
Q: Do you think . . . ?
The gap between the rich and the poor in the U.S. is . . .Getting larger 67%Getting smaller 5Has stayed the same 25
Note: In the June 2015 The Atlantic/Aspen Institute survey, 66 percent said they expected the wealth gap to grow in the next 10 years while 16 percent said they expect it to shrink.Source: CBS News/New York Times, May 2015.
0
10
20
30
40
50
60
70
80
90
100
2001 2002 2003 2004 2005 2006 2007 2008 2009 2010 2011 2012 2013 2014 2015
76%
60%
Very/Somewhat satisfied with the opportunity for a person in this nation to get ahead by working hard
In 2014 and 2015, the two years Gallup has asked about satisfaction with wealth distribu-tion, about 31 percent were very or somewhat satisfied with the way wealth and income are distributed in the U.S. Both years, 67 percent were very or somewhat dissatisfied.
v
(Continued on the next page)

AEI, 1150 Seventeenth Street, NW, Washington, DC 20036 • 202.862.5800 • www.aei.org 9
Opportunity Trumps IncomeBy a healthy margin, people are more concerned about opportunity—middle and working class Americans not being able to get ahead—than they are about the income gap. Most people don’t see the gap as a problem as long as they are able to provide the life they want for themselves and their families.
Q: Which concerns you more . . . ?
---------------------------------------------------------------Concerns you more-----------------------------------------------------------------
The income gap between Middle and working class the wealthiest Americans Americans not being able and the rest of the country to get ahead financially 28% National 68%
37 Democrats 58 15 Republicans 81
32 Men 63 25 Women 72
39 18–34 59 22 35–49 71 27 50–64 69 21 65+ 75
34 Under $30,000 66 29 $30,000–$49,999 66 25 $50,000–$74,999 69 29 $75,000+ 66
Source: NBC News/Wall Street Journal, April 2015.
Q: Which of the following is closer to your view . . . ?
As long as I am able to provide the life The concentration of wealth I want for myself and my family, and privilege within the top it doesn’t matter if others are 1 percent of American society substantially wealthier than I is a problem 64% National 36%
63 30 or younger 37 60 31–50 40 68 51–64 32 70 65 and older 30
67 White 33 66 African-American 34 54 Hispanic 46Source: Burson-Marsteller/Penn, Schoen, Berland/The Atlantic/Aspen Institute, June 2015. (Continued on the next page)
AEI, 1150 Seventeenth Street, NW, Washington, DC 20036 • 202.862.5800 • www.aei.org 10
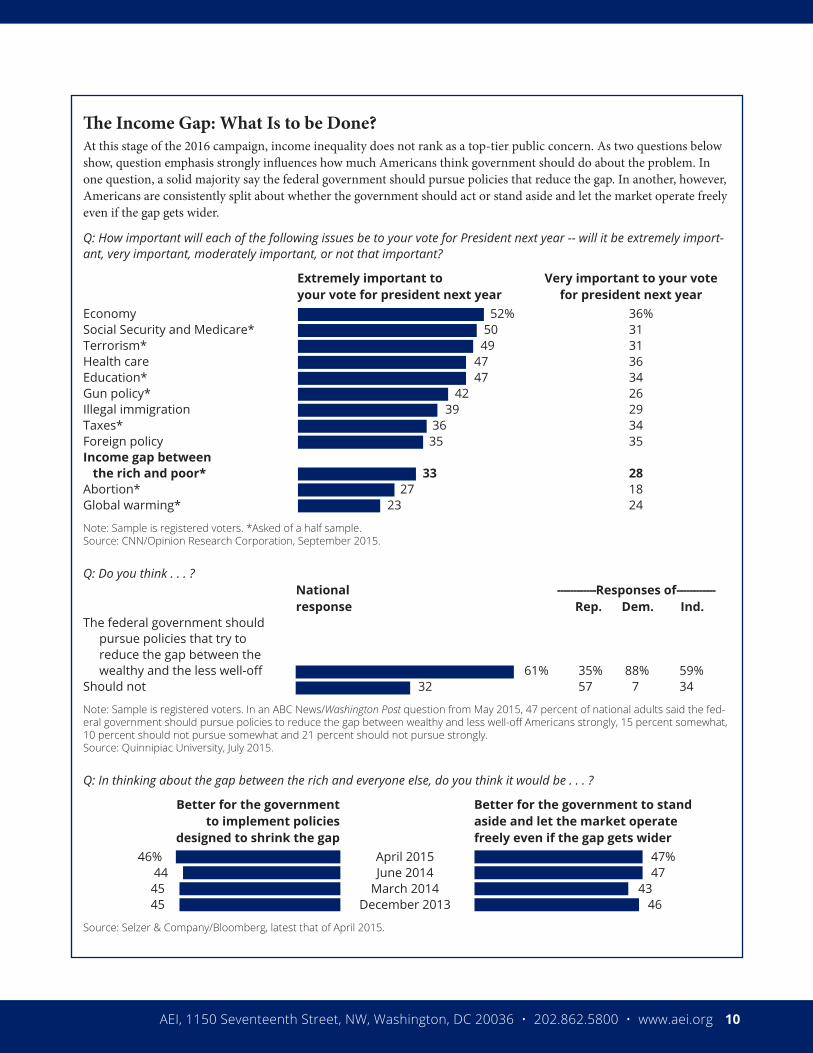
The Income Gap: What Is to be Done?At this stage of the 2016 campaign, income inequality does not rank as a top-tier public concern. As two questions below show, question emphasis strongly influences how much Americans think government should do about the problem. In one question, a solid majority say the federal government should pursue policies that reduce the gap. In another, however, Americans are consistently split about whether the government should act or stand aside and let the market operate freely even if the gap gets wider.
Q: How important will each of the following issues be to your vote for President next year -- will it be extremely import-ant, very important, moderately important, or not that important?
Extremely important to Very important to your vote your vote for president next year for president next year Economy 52% 36%Social Security and Medicare* 50 31Terrorism* 49 31Health care 47 36Education* 47 34Gun policy* 42 26Illegal immigration 39 29Taxes* 36 34Foreign policy 35 35Income gap between the rich and poor* 33 28Abortion* 27 18Global warming* 23 24
Note: Sample is registered voters. *Asked of a half sample.Source: CNN/Opinion Research Corporation, September 2015.
Q: Do you think . . . ? National ------------Responses of------------ response Rep. Dem. Ind.The federal government should pursue policies that try to reduce the gap between the wealthy and the less well-off 61% 35% 88% 59%Should not 32 57 7 34
Note: Sample is registered voters. In an ABC News/Washington Post question from May 2015, 47 percent of national adults said the fed-eral government should pursue policies to reduce the gap between wealthy and less well-off Americans strongly, 15 percent somewhat, 10 percent should not pursue somewhat and 21 percent should not pursue strongly. Source: Quinnipiac University, July 2015.
Q: In thinking about the gap between the rich and everyone else, do you think it would be . . . ?
Better for the government Better for the government to stand to implement policies aside and let the market operate designed to shrink the gap freely even if the gap gets wider 46% April 2015 47% 44 June 2014 47 45 March 2014 43 45 December 2013 46
Source: Selzer & Company/Bloomberg, latest that of April 2015.
AEI, 1150 Seventeenth Street, NW, Washington, DC 20036 • 202.862.5800 • www.aei.org 11
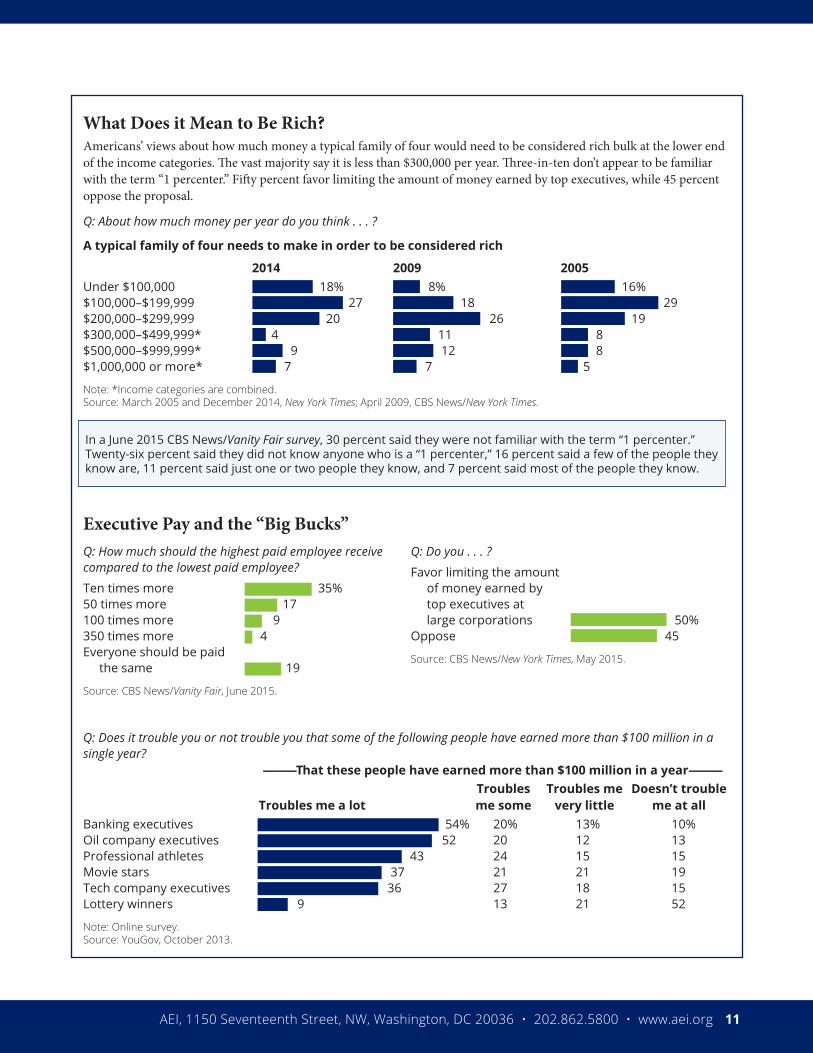
What Does it Mean to Be Rich?Americans’ views about how much money a typical family of four would need to be considered rich bulk at the lower end of the income categories. The vast majority say it is less than $300,000 per year. Three-in-ten don’t appear to be familiar with the term “1 percenter.” Fifty percent favor limiting the amount of money earned by top executives, while 45 percent oppose the proposal.
Q: About how much money per year do you think . . . ?
A typical family of four needs to make in order to be considered rich
2014 2009 2005Under $100,000 18% 8% 16%$100,000–$199,999 27 18 29$200,000–$299,999 20 26 19$300,000–$499,999* 4 11 8$500,000–$999,999* 9 12 8$1,000,000 or more* 7 7 5
Note: *Income categories are combined. Source: March 2005 and December 2014, New York Times; April 2009, CBS News/New York Times.
Executive Pay and the “Big Bucks”
Q: Does it trouble you or not trouble you that some of the following people have earned more than $100 million in a single year? ———That these people have earned more than $100 million in a year——— Troubles Troubles me Doesn’t trouble Troubles me a lot me some very little me at allBanking executives 54% 20% 13% 10%Oil company executives 52 20 12 13Professional athletes 43 24 15 15Movie stars 37 21 21 19Tech company executives 36 27 18 15Lottery winners 9 13 21 52
Note: Online survey.Source: YouGov, October 2013.
Q: How much should the highest paid employee receive compared to the lowest paid employee?
Ten times more 35%50 times more 17100 times more 9350 times more 4Everyone should be paid the same 19
Source: CBS News/Vanity Fair, June 2015.
Q: Do you . . . ?
Favor limiting the amount of money earned by top executives at large corporations 50%Oppose 45
Source: CBS News/New York Times, May 2015.
In a June 2015 CBS News/Vanity Fair survey, 30 percent said they were not familiar with the term “1 percenter.” Twenty-six percent said they did not know anyone who is a “1 percenter,” 16 percent said a few of the people they know are, 11 percent said just one or two people they know, and 7 percent said most of the people they know.
AEI, 1150 Seventeenth Street, NW, Washington, DC 20036 • 202.862.5800 • www.aei.org 12
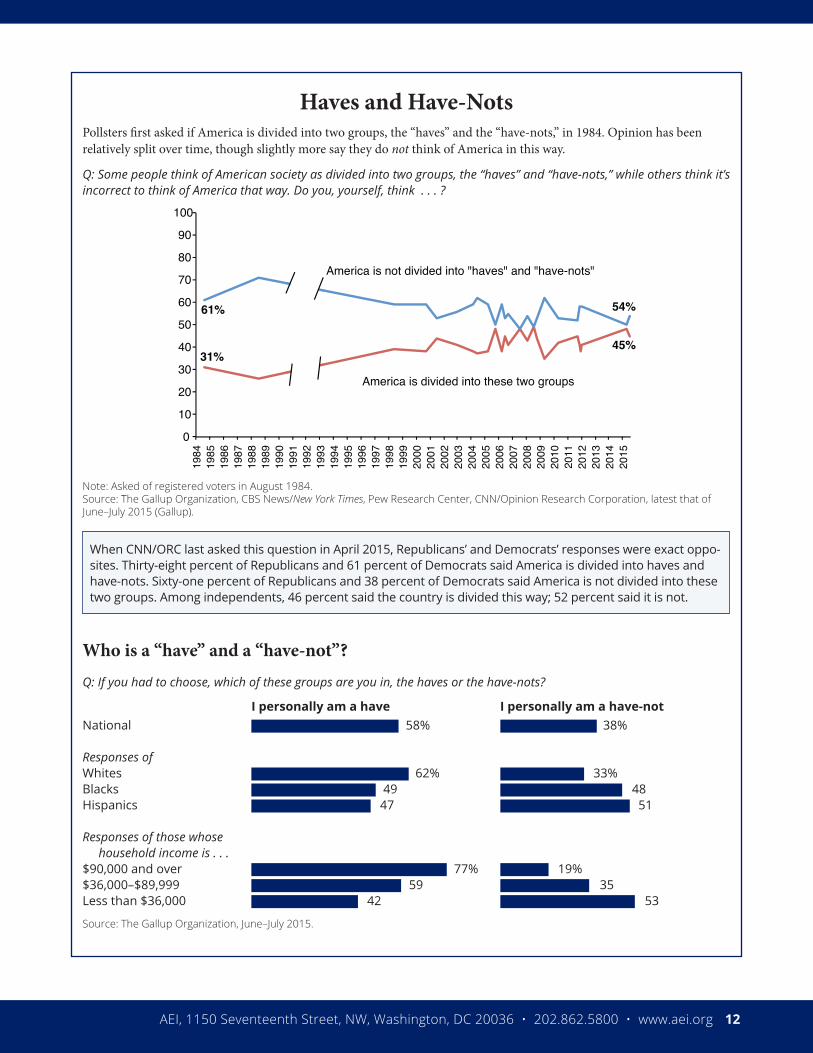
Haves and Have-NotsPollsters first asked if America is divided into two groups, the “haves” and the “have-nots,” in 1984. Opinion has been relatively split over time, though slightly more say they do not think of America in this way.
Q: Some people think of American society as divided into two groups, the “haves” and “have-nots,” while others think it’s incorrect to think of America that way. Do you, yourself, think . . . ?
Note: Asked of registered voters in August 1984.Source: The Gallup Organization, CBS News/New York Times, Pew Research Center, CNN/Opinion Research Corporation, latest that of June–July 2015 (Gallup).
Who is a “have” and a “have-not”?
Q: If you had to choose, which of these groups are you in, the haves or the have-nots?
I personally am a have I personally am a have-notNational 58% 38%
Responses ofWhites 62% 33%Blacks 49 48Hispanics 47 51
Responses of those whose household income is . . .$90,000 and over 77% 19%$36,000–$89,999 59 35Less than $36,000 42 53
Source: The Gallup Organization, June–July 2015.
When CNN/ORC last asked this question in April 2015, Republicans’ and Democrats’ responses were exact oppo-sites. Thirty-eight percent of Republicans and 61 percent of Democrats said America is divided into haves and have-nots. Sixty-one percent of Republicans and 38 percent of Democrats said America is not divided into these two groups. Among independents, 46 percent said the country is divided this way; 52 percent said it is not.
0
10
20
30
40
50
60
70
80
90
100 19
84
1985
19
86
1987
19
88
1989
19
90
1991
19
92
1993
19
94
1995
19
96
1997
19
98
1999
20
00
2001
20
02
2003
20
04
2005
20
06
2007
20
08
2009
20
10
2011
20
12
2013
20
14
2015
61%
31%
54%
45%
America is divided into these two groups
America is not divided into "haves" and "have-nots"