aeration and mode of nutrient delivery affects growth of peas in a
TRANSCRIPT
AERATION AND MODE OF NUTRIENT DELIVERY AFFECTS GROWTH OFPEAS IN A CONTROLLED ENVIRONMENT
by
Joseph Francis Romagnano
A Thesis
Submitted to the Faculty
of the
WORCESTER POLYTECHNIC INSTITUTE
in partial fulfillment of the requirements for the
Degree of Master of Science
In
Biotechnology
December 2003
APPROVED:
________________________________ __________________________________Dr. Pamela J. Weathers, Major Advisor Dr. Jill Rulfs, Interim Head of Department
__________________________________Dr. Ronald Cheetham, Committee Member
_______________________________Dr. John Sullivan, Committee Member
i
Abstract
The development of a plant growth chamber capable of sustaining plant growth
over multiple generations is a necessary step towards the attainment of a Controlled
Ecological Life Support System (CELSS). The studies herein examine the effects of
aeration abilities and rates on plants grown in three model nutrient delivery systems
during germination and over the life-cycle of the plant. These studies are the first time a
porous tube nutrient delivery system was compared to another active nutrient mist
delivery system. During germination an indicator of hypoxic stress, alcohol
dehydrogenase (ADH) activity, was measured and was more affected by aeration rate
than mode of nutrient delivery. Over the life-cycle of the plant, however, plants grown in
the porous tube system had the least ADH activity and the highest levels of shoot (leaf +
stem), root and leaf biomass. None of the plants in any system, however, produced viable
seed. This study highlights the need to optimize aeration capabilities in the root zone of
enclosed chambers.

ii
Acknowledgements
Contrary to popular image, even the scientist toiling alone late into the night is not
so isolated that he owes no thanks to anyone. As such, I owe a debt of gratitude to many
people who, directly or indirectly, supported me and helped further my work in this
undertaking. First and foremost, thanks must go to the members of my family. There has
been one person who has been with me from the beginning, mom, thank you from the
bottom of my heart. From growing corn plants in Tupperware, and FedExed books on
Biosphere II, to home-built jerry-rigged hydroponics systems in the basement, you’ve
shown support and tolerance for the often-strange activities of your son. You’ve been the
best mom a son could ask for, even if the road has, at times, been rocky.
Special thanks must also go to my Grandmother and Grandfather. Thank you for
allowing me to spread gas chromatography data across your living room. Thank you for
the cookies. Thank you for your kind words of support and encouragement. Thank you
for the summer adventures that piqued the curiosity that led to my interest in science.
A special debt is owed to the head of my graduate committee and my academic
advisor of six years, Dr. Pamela Weathers. I am fully aware of the risk you took in
allowing a student whose research interests were so different from your own into your
lab, thank you. For the faith you have showed in my work, the support you sought on my
behalf and the prods when needed, thank you. Finally, for the open doors, the
camaraderie and the best baked beans ever, thank you.
Thanks must also go to those lab members who have been a countless wealth of
friendship and information. Melissa, you’ve been a friend, confidant, companion and
fountain of information. Thank you for listening to my crazy ideas and helping them take

iii
form. Mel, Tim, Tara, Fred and YooJeong, thank you accepting me into the lab and
answering my hundreds of questions those first few days.
Many thanks must also be given to those other members of the WPI faculty and
staff who have also given me help and support. Thanks to John Sullivan and Ron
Cheetham who served as members of my graduate committee. Paula Moravek deserves
special recognition for her outstanding abilities to find obscure pieces of equipment and
listening to the everyday complaints of a sleepy grad student. Special thanks are also
accorded to JoAnn Whitefleet-Smith who provided physical support and aid in
developing methods.
Special thanks must also go to those outside researchers who have provided
valuable support and insight. Mary Musgrave, University of Connecticut, provided
valuable comments, information, and reviews of some portions of this thesis. Tom
Dreschel, Gary Stutte, and Oscar Monje of Dynamac Corporation at Kennedy Space
Center provided valuable information, porous tubes, and sample substrate material.
Marshall Porterfield of the University of Missouri also provided valuable insight and
guidance.
Finally, to those whom I’ve forgotten and did not record here, you have my
apologies and also my thanks. It has been a good long slog but I’ve enjoyed every
minute of it and I wouldn’t change one thing, thank you all.
iv
Table of Contents
Abstract i
Acknowledgements ii
Table of Contents iv
List of Tables vi
List of Figures vi
Introduction 1
Growing plants in microgravity 3
Plant growth systems previously used in microgravity 4
Oxygen and ADH activity 6
Ethylene and its indicators 7
CO2 in the enclosed environment 9
Objectives 11
Chapter 1: Germination Studies 12
Summary 12
Introduction 13
Materials and Methods 15
Results 20
Discussion 25
Acknowledgements 27
v
Chapter 2: Life Cycle Study 28
Summary 28
Introduction 29
Materials and Methods 33
Results 39
Discussion 45
Acknowledgements 49
Conclusions and Future Work 50
References 53
Appendices 57
Appendix A: Schematic of System Configurations 58
Appendix B: Gas Analysis Protocols 60
Appendix C: Buffer, Extraction and ADH Assay 66
Appendix D: Bradford Protein Assay Protocol 71

vi
List of Tables
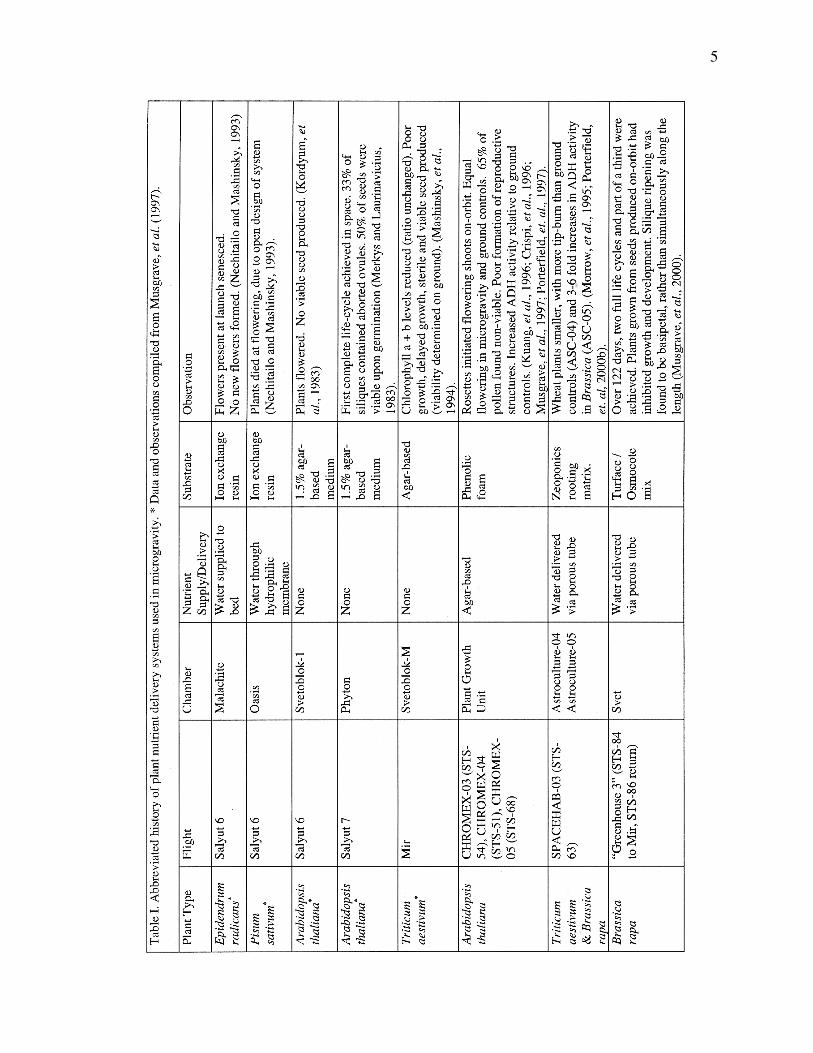
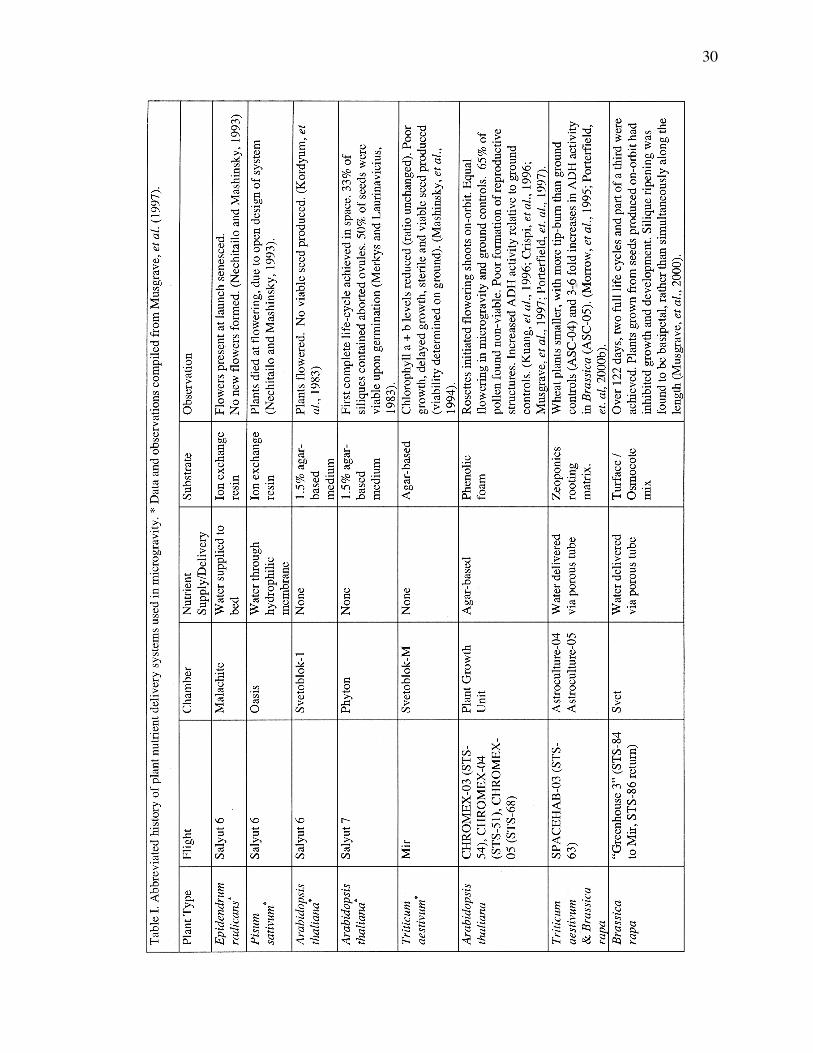
Table 1. Abbreviated history of plant nutrient delivery systems used in microgravity.
p. 5, 30
List of Figures
Figure 1. Empty experimental and control nutrient delivery systems used in short culture
trough experiments. p. 15
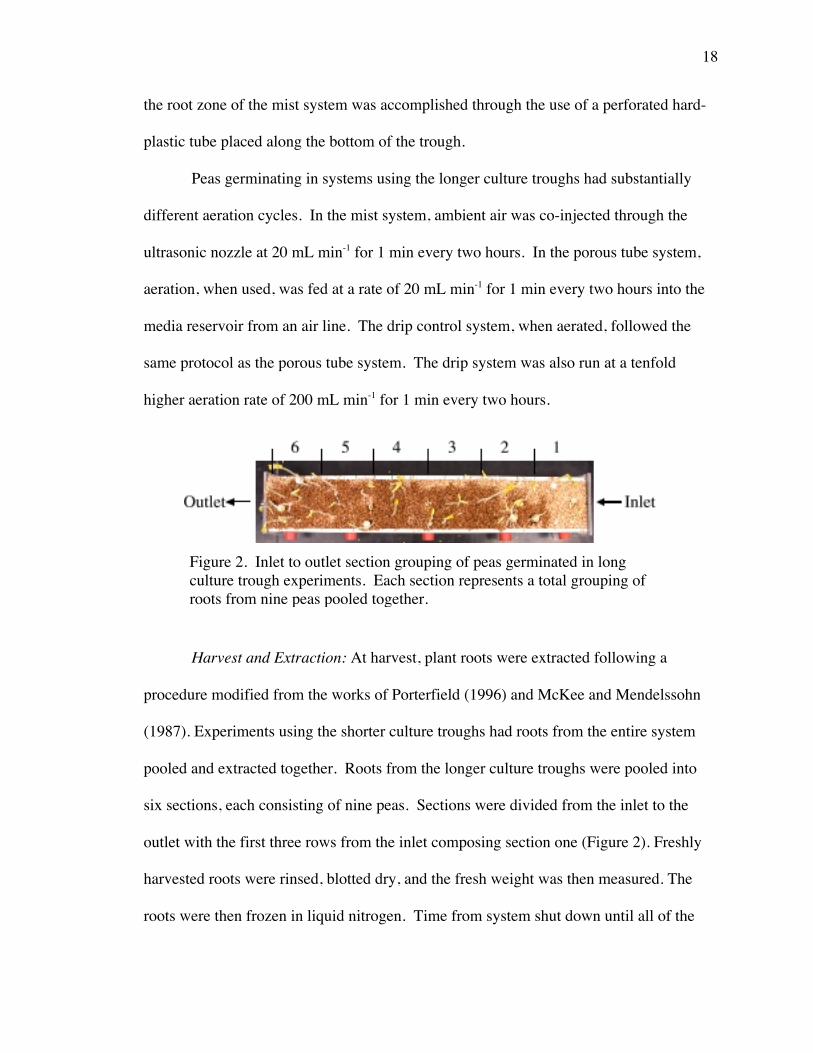
Figure 2. Inlet to outlet section grouping of peas germinated in long culture trough
experiments. p. 18
Figure 3. Growth and ADH responses of germinated pea roots in the short culture
vessels. p. 22
Figure 4. Growth and ADH responses of germinated pea roots in the long culture vessels.
p. 24
Figure 5. Experimental system and plant morphology. p. 34
Figure 6. Biomass and hypoxic stress of peas harvested after 40 days growth from drip,
mist and porous tube systems. p. 41
Figure 7. Shoot morphology and chlorophyll content of peas harvested after 40 days
growth from drip, mist and porous tube systems. p. 43
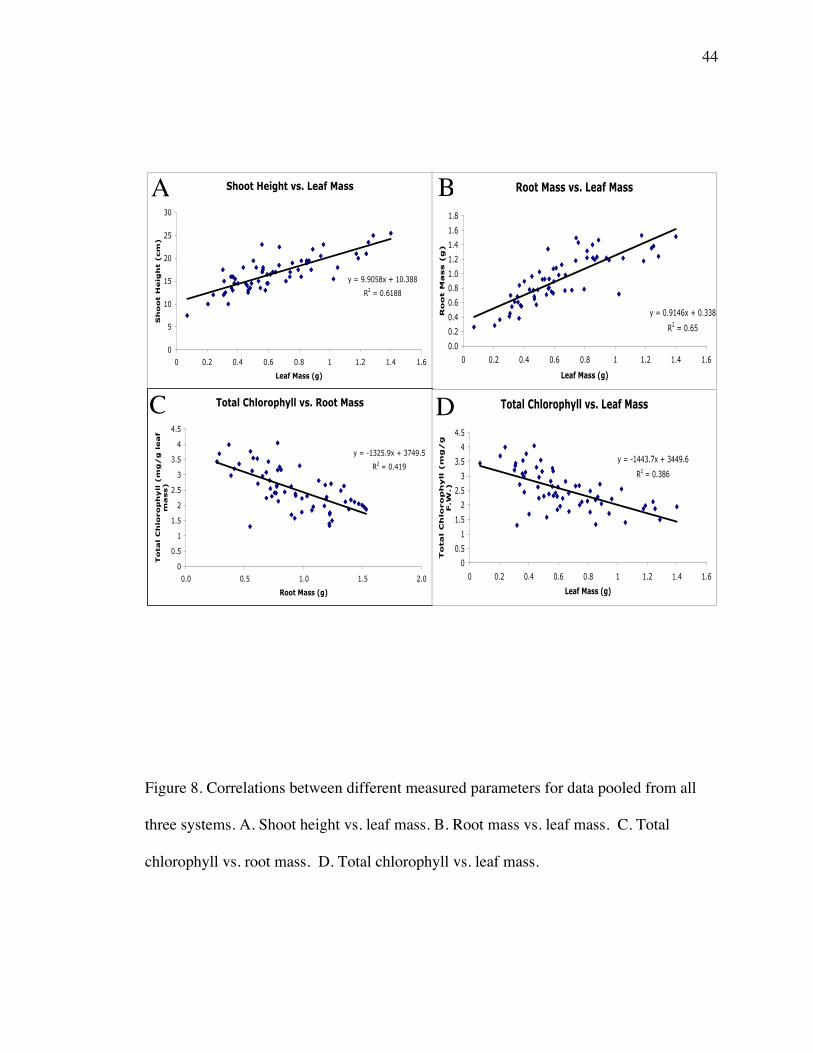
Figure 8. Correlations between different measured parameters for data pooled from all
three systems. p. 44
Figure 9. Timeline of developmental milestones. p. 45
vii
Figure 10. Schematic of equipment and connections used for various modes of nutrient
delivery. p. 59
Figure 11. Example chromatogram of an ethylene standard. p. 62
Figure 12. Printout of HWD GC methods section for CO2 detection. p. 63
Figure 13. Printout of HWD GC chromatogram for CO2 standard. p. 64
1
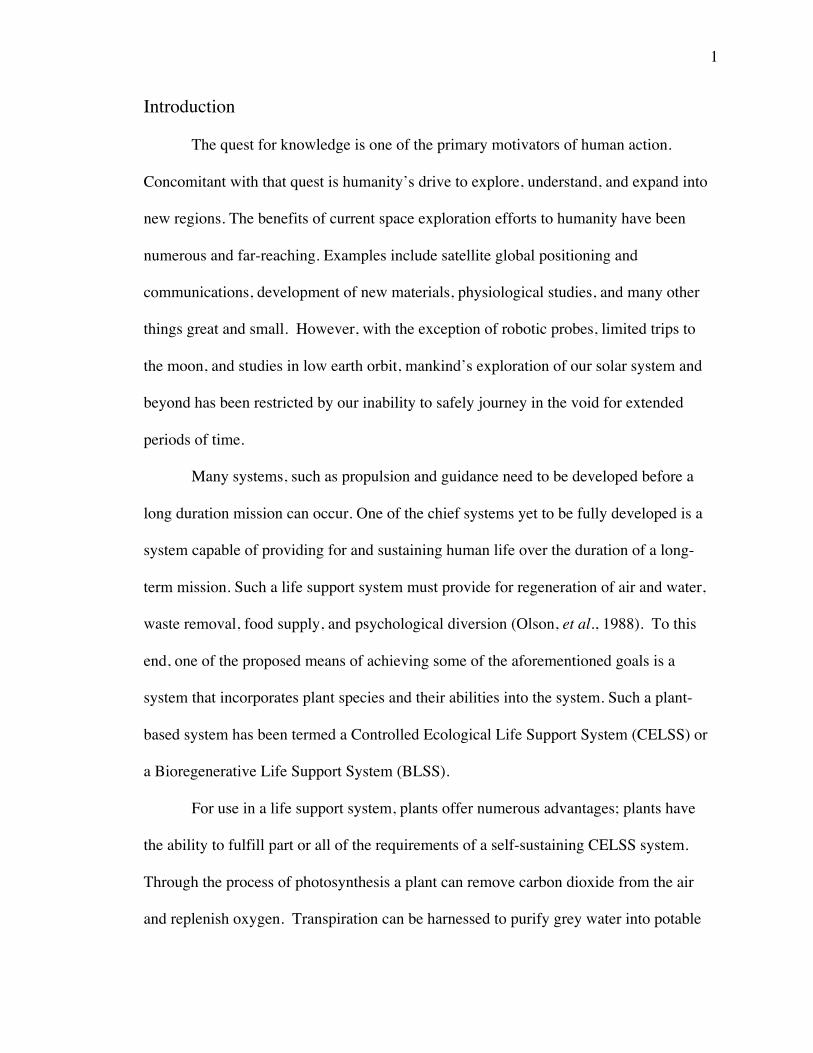
Introduction
The quest for knowledge is one of the primary motivators of human action.
Concomitant with that quest is humanity’s drive to explore, understand, and expand into
new regions. The benefits of current space exploration efforts to humanity have been
numerous and far-reaching. Examples include satellite global positioning and
communications, development of new materials, physiological studies, and many other
things great and small. However, with the exception of robotic probes, limited trips to
the moon, and studies in low earth orbit, mankind’s exploration of our solar system and
beyond has been restricted by our inability to safely journey in the void for extended
periods of time.
Many systems, such as propulsion and guidance need to be developed before a
long duration mission can occur. One of the chief systems yet to be fully developed is a
system capable of providing for and sustaining human life over the duration of a long-
term mission. Such a life support system must provide for regeneration of air and water,
waste removal, food supply, and psychological diversion (Olson, et al., 1988). To this
end, one of the proposed means of achieving some of the aforementioned goals is a
system that incorporates plant species and their abilities into the system. Such a plant-
based system has been termed a Controlled Ecological Life Support System (CELSS) or
a Bioregenerative Life Support System (BLSS).
For use in a life support system, plants offer numerous advantages; plants have
the ability to fulfill part or all of the requirements of a self-sustaining CELSS system.
Through the process of photosynthesis a plant can remove carbon dioxide from the air
and replenish oxygen. Transpiration can be harnessed to purify grey water into potable
2
water. Generational growth of crop plants ensures a continuous source of fresh food
essential for the maintenance of proper nutrition. In order to minimize the need to carry
extra seed mass or the need for a re-supply mission, it is exceptionally important that the
plant growth chamber of a CELSS system be able to support production of viable seed in
order to provide the next crop generation As such, the ability to grow and maintain crops
in a microgravity environment is a necessary and key step towards obtaining a complete
CELSS system (Dreschel, et al., 1994).
Technologies developed for use in a CELSS system, in addition to use in space,
have the potential to also benefit those on Earth. Modification of organic waste for use as
nutrient stocks, the ability to grow plants in a highly dense manner, conversion of
wastewater into potable water, clearance of excess carbon dioxide, and subsequent
replenishment of oxygen are end products that can be adapted for use on the ground.
Furthermore, once stable, controlled growth of plants in microgravity is achieved, the
door is opened to new studies about the fundamental physiology of plants.
Information gained from studies used to develop those technologies may lead to
additional spin-off technologies. The data herein, can be used to further our
understanding of responses of plants to hypoxic stress. In addition to comparing two
active modes of nutrient delivery over the life cycle of a plant, variations in the aeration
abilities and rates fed into the root zone were also tested. Similar aeration applied to a
farmer’s flooded field, for instance, may temporarily alleviate hypoxic stress, lessening
the likelihood of crop loss. Understanding media aeration and its impact in the root zone
is also applicable to dense root beds commonly found in hydroponic systems. Root zone

3
optimization of nutrient flow and gas exchange can lead to more productive plants thus
lowering operating costs.
Growing Plants in Microgravity
Conventional hydroponic systems, while effective on the ground, are not readily
adapted for use in a microgravity environment. Growing plants in an enclosed and
controlled environment dictates that many plant needs must be serviced artificially.
Specifically, light, air, temperature, humidity, nutrients and the removal of wastes must
all be taken into account (Heathcote, et al., 1996).
Lack of a gravity vector greatly affects the movement and availability of
metabolic gases (O2, CO2, C2H4) and liquid nutrient media to plant tissues in both root
and shoot zones (for reviews, Monje, et al., 2003; Porterfield, et al., 2003). In the shoot
and root zones of a nutrient delivery system’s culture chamber, buoyancy-driven
convection currents are not present (Porterfield, 2002; Bingham et al., 1996; Bingham et
al., 1997; Jones and Or 1998; Salisbury, F.B., 1997; Yendler et al., 1995). Under normal
gravity conditions such currents are responsible for the replenishment of metabolic gasses
around plant tissues. When these currents are absent poor gas exchange occurs which
results in the formation of stagnant air pockets around plant tissues subsequently resulting
in poor plant growth and development (Monje, et al., 2003; Porterfield, et al., 2003;
Porterfield, 2002; Porterfield, et al., 1997; Musgrave, et al., 1998).
As was first demonstrated in the Chromex series of experiments, the addition of a
fan to circulate air in the shoot zone greatly reduced the stress induced by poor gas
exchange in plant shoots (Musgrave, et al., 1998). The roots of plants from the same
experiment, however, had significantly greater amounts of hypoxic stress compared to
4
normal gravity controls (Porterfield, et al., 1997). Nutrient delivery systems for use in
space must account for water’s surface tension and lack of gravity-induced flow.
Therefore, conventional hydroponic and aeroponic nutrient delivery systems are not
feasible (Levine, et al., 2001).
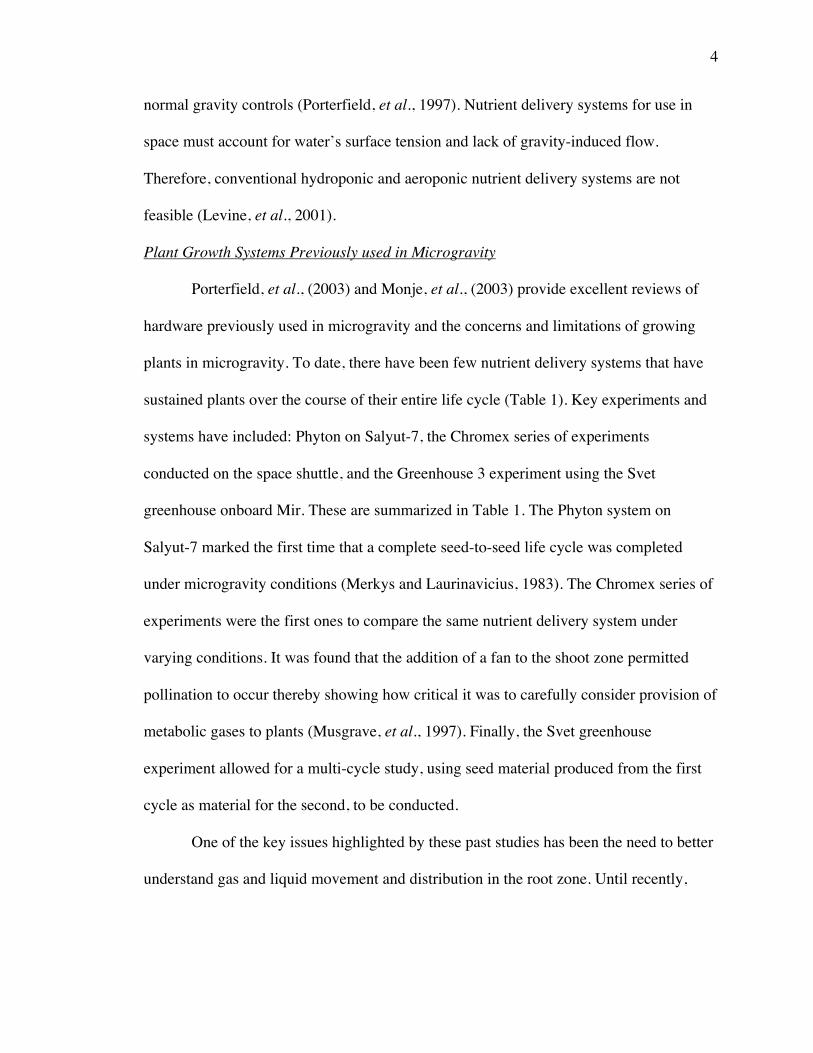
Plant Growth Systems Previously used in Microgravity
Porterfield, et al., (2003) and Monje, et al., (2003) provide excellent reviews of
hardware previously used in microgravity and the concerns and limitations of growing
plants in microgravity. To date, there have been few nutrient delivery systems that have
sustained plants over the course of their entire life cycle (Table 1). Key experiments and
systems have included: Phyton on Salyut-7, the Chromex series of experiments
conducted on the space shuttle, and the Greenhouse 3 experiment using the Svet
greenhouse onboard Mir. These are summarized in Table 1. The Phyton system on
Salyut-7 marked the first time that a complete seed-to-seed life cycle was completed
under microgravity conditions (Merkys and Laurinavicius, 1983). The Chromex series of
experiments were the first ones to compare the same nutrient delivery system under
varying conditions. It was found that the addition of a fan to the shoot zone permitted
pollination to occur thereby showing how critical it was to carefully consider provision of
metabolic gases to plants (Musgrave, et al., 1997). Finally, the Svet greenhouse
experiment allowed for a multi-cycle study, using seed material produced from the first
cycle as material for the second, to be conducted.
One of the key issues highlighted by these past studies has been the need to better
understand gas and liquid movement and distribution in the root zone. Until recently,
5
6
nutrients have been delivered into the root zone in a passive manner and work has
primarily been directed towards optimizing conditions in the shoot zone. The Phyton
system and the Plant Growth Unit both used agar-based nutrients and, in the case of the
Chromex experiments, a phenolic foam substrate (Merkys and Laurinavicius, 1983;
Kuang, et al., 1996). More recent systems, such as the AstrocultureTM and the Svet
greenhouse have used porous tubes buried in a granular substrate like Turface (Morrow,
et al., 1995; Porterfield, et al. 2000b; Musgrave, et al., 2000).
Movement of liquids through a granular substrate has been the subject of many
studies (Bingham et al., 1996; Bingham et al., 1997; Jones and Or 1998; Salisbury, F.B.,
1997; Yendler et al., 1995). Currently, it is believed that as liquid media moves radially
outward from a porous tube into the surrounding substrate, pockets of air become trapped
against the wall of the culture vessel enclosing the plant root zone (Monje, et al., 2003).
When plant roots penetrate these pockets and deplete them of gasses necessary for the
maintenance of metabolism, particularly oxygen, roots become stressed and contribute to
an overall reduction in plant health (Porterfield, et al., 1997, Monje, et al., 2003;
Porterfield, et al., 2003). Due to these observed problems there is a need for the
development of ground-based systems that can mimic conditions encountered in
microgravity (Levine, et al., 2001).
Oxygen and ADH Activity
Oxygen is necessary for normal maintenance of the Krebs cycle and electron
transport chain (Moore, et al., 1998). When plentiful, oxygen serves as the ultimate
electron acceptor in the electron transport chain, allowing for the regeneration of NAD+
from NADH. Under normoxic conditions, NAD+ is used by triose phosphate
7
dehydrogenase to oxidize glyceraldehyde-3-phosphate to 1,3-bisphosphoglyceric acid.
Under hypoxic or anoxic conditions, however, regeneration of NAD+ is not readily
completed, leading to a breakdown of the glycolytic pathway (Moore, et al., 1998).
Other electron acceptors must, therefore, be used to regenerate NADH to NAD+
and fermentative metabolism is initiated. Rather than undergoing conversion to acetyl-
CoA and entering into the Krebs cycle, pyruvic acid is converted via pyruvate
decarboxylase to acetaldehyde. As a final step, acetaldehyde conversion into ethanol is
catalyzed by alcohol dehydrogenase (ADH). During the catalysis, the hydrogen of
NADH is removed and NAD+ is thus regenerated (Moore, et al., 1998). Due to the fact
that ADH activity correlates with relative amounts of root hypoxia, and its activity can be
readily calculated by measuring the decrease of NADH in a spectrophotometric reaction,
ADH serves as an ideal indicator of hypoxic stress (McKee and Mendelssohn, 1987;
Appendix C).
Ethylene and its Indicators
Under conditions of normal aeration and gas exchange, ethylene is a plant
hormone that is responsible for the development and maturation of flowers and fruit as
well as controlling the abscission of fruit and leaves (Moore, et al., 1998). In an enclosed
environment with poor gas exchange, such as that experienced by plants in microgravity,
ethylene concentrations can accumulate and inhibit flowering. As ethylene concentrations
increase, fruit and flowers that would normally develop are negatively affected, resulting
in the onset of premature senescence, particularly of flowers (Beyer, 1976). This response
to ethylene is similar to reproductive problems observed during the Chromex series of
experiments (Kuang, et al., 1996; Musgrave, et al., 1997). It was reported that the
8
reproductive organs, particularly flowers and siliques, were incapable of producing either
fruit or viable seed in Arabidopsis (Table 1).
Other adverse effects of increased ethylene concentrations have been documented.
In Lactuca sativa increased ethylene concentrations significantly reduced overall dry
weight and enhanced the number of leaves while reducing overall leaf size and dry
weight (Mortensen, 1988). Also, waterlogging of the root zone, coupled with the onset of
hypoxic conditions, is known to lead to the build-up of small amounts of ethylene in root
tissues. The trapped ethylene stimulates cellulase and pectinase resulting in the
breakdown of cell walls and the formation of aerenchyma which help to facilitate the
diffusion of oxygen into surrounding root tissue (Moore, et al., 1998).
It has been suggested that ethylene acts as part of a signal pathway indicating
hypoxia in roots (Drew, et al., 1997). Besides formation of aerenchyma, waterlogging in
roots also stimulates the conversion of ethylene precursors in the shoot, resulting in the
onset of epinasty (Moore, et al., 1998). Under anoxic conditions, however, ethylene
production is blocked due to the absence of at least a small amount of free oxygen for the
conversion of ACC (ethylene precursor) to ethylene (Drew, et al., 1997). Furthermore,
germinating shoots have been shown to produce increased ethylene levels when
encountering mechanical barriers (Schwarzbach, et al., 1991). It is, therefore, not
unreasonable to expect that ethylene levels may also increase when roots encounter
mechanical barriers.
Due to the above effects of ethylene, levels of this gas have been specified at less
than 5 ppb for the Plant Research Unit (PRU) to be developed for use in the international
space station (Heathcote, et al., 1996). In order to sustain such low amounts of ethylene,
9
care must be taken to design growth culture systems that can maintain a well oxygenated
root zone that is minimally waterlogged, and large enough in size to contain the roots of
mature plants of any of the CELSS candidate crops.
CO2 in the enclosed environment
Carbon dioxide, in addition to its use in photosynthesis, also influences stomatal
conductance and transpiration rates (Moore, et al., 1998; Wheeler, et al., 1999). Although
decreased CO2 levels, particularly in the interior of leaves, are responsible for stomatal
opening and transpiration increases (Moore, et al., 1998), a greater amount of research
has been devoted to CO2 enriched atmospheres similar to those in enclosed chambers.
One of the primary goals of CELSS research is to use the photosynthetic pathway in
plants to fix CO2 from stale incoming cabin air and replenish it with O2 released from the
plant. Another chief goal is to use transpiration as a way to filter and purify water from
waste sources. Thus, CO2 availability, particularly with a widely fluctuating source such
as cabin air, must be accounted for in the design of a plant growth chamber. For
example, from May to September of 1997 CO2 concentrations in the cabin of Mir varied
from 2,000-10,000 ppm (Monje, et al., 2003). In the Chromex series of experiments
supplemental CO2 was provided to the plants (up to 302 µl l-1), contributing to premature
reproductive organ development (Musgrave, et al., 1997). Also, studying plant responses
to varying CO2 levels, particularly increased concentrations, can provide insight into
plant responses under global warming conditions.
Besides photosynthesis, carbon dioxide also affects root growth. The effects of
increased CO2 availability on roots have been studied in cultures of beet and safflower
hairy roots grown in an enclosed culture system (DiIorio, et al., 1992), and in whole
10
plants (Weathers and Zobel, 1992). In the cultures of beet and safflower hairy roots, it
was found that an increase in dry weight was effected by an increase in CO2 availability
up to 1.3,1.5% CO2, respectively. Past that point (1.6 or 2.0% for beets and safflower,
respectively) the mass increase was significantly less and ultimately negligible (DiIorio,
et al., 1992). This suggests that, for roots, an optimal CO2 concentration exists and, once
levels go beyond that point detrimental effects are seen. For example, in whole plants, an
increase of CO2 concentrations in the root zone to 45% was found both to be beneficial
when applied for a short period of time and, when applied for longer than a few hours,
growth was inhibited (Weathers and Zobel, 1992). Long term treatments in the root zone
with CO2 concentrations from 0.1-0.5%, however, showed a 20-25% stimulation in
growth (Weathers and Zobel, 1992).
Dwarf wheat plants grown in the superoptimal CO2 concentrations (350-10,000
µmol mol-1 range) used by Reuveni and Bugbee (1997) showed a decrease in seed yield,
harvest index, mass per seed and number of seeds per head as CO2 levels increased. Also,
it was found that photosynthetic and dark respiration rates decreased by 8% and 25%,
respectively, when CO2 levels were raised to 2600 µmol mol-1 CO2. Furthermore, high
CO2 concentrations did not correlate with ethylene production by flag leaves or wheat
heads (Reuveni and Bugbee, 1997).
The studies herein mark the first time plants grown using a porous tube system
have been compared to another system also capable of actively delivering nutrients.
These, comparisons should provide valuable insight into potential benefits and drawbacks
not readily apparent when compared to passive delivery systems. Finally, since aeration

11
is provided strictly through the root zone, the impacts of that provision on shoot and
overall plant health can also be examined.
Objectives
In order to better understand the impacts of mode of nutrient delivery and media
aeration in the root zone, two studies were undertaken. The first sought to understand
how changing aeration rates delivered to the root zone would impact root health during
germination irrespective of mode of nutrient delivery. The second sought to understand if
the mode of nutrient delivery into the root zone would affect not only root health but
shoot health as well.
Organization of Thesis
Due to the fact that both studies were self-contained this thesis is organized into
chapters dedicated to each specific study and consisting of each manuscript as it is to be
submitted for publication.
12
Chapter 1: Germination Studies*
Media aeration affects hypoxic stress in germinating pea roots more thanmode of media delivery.
SUMMARY
To grow plants in microgravity, porous tubes have been used to deliver liquid media into
root zones of nutrient delivery systems. Growth has, however, been less than desirable.
The lack of a gravity vector likely leads to the formation of stagnant air pockets and
inadequate gas availability to the roots. Effects of media aeration have been overlooked.
We have compared substrate-based nutrient delivery systems using a mist or porous tube to
feed germinating peas. Roots from peas germinated in mist and porous tube systems using
a 15.2 cm long culture trough were compared against normoxic and hypoxic controls. Of
the two experimental and two control systems, the mist system yielded the greatest fresh
root mass per germinated seed. To measure hypoxic stress alcohol dehydrogenase (ADH)
activity of the roots was assayed. ADH activity of roots grown in the mist, porous tube, and
normoxic controls were all approximately 10% of the activity measured in the hypoxic
control. When the culture trough was scaled in length threefold, mist and porous tube
systems supported about the same amount of root biomass. ADH activity, however, varied
greatly between modes of nutrient delivery and level of aeration. Roots grown in porous
tube and drip systems showed slightly less hypoxic stress than roots from an equivalently
aerated system. These results suggest that both the type of nutrient delivery system and
media aeration are important in alleviating hypoxic stress in the root zone.
* This section submitted for publication.
13
INTRODUCTION
Understanding the various stresses whole plants encounter when subjected to
culture in an artificial environment is crucial to the design and implementation of a
bioregenerative life support system that will use plants to provide food, recycle water and
replenish oxygen. Successful development of a plant culture system that is capable of
supporting generational crop growth in a spaceflight environment is a necessary step if a
Controlled Ecological Life Support System (CELSS) is to be realized (Dreschel et. al,
1994). The microgravity environment presents several challenges for the design of a
plant growth system. Light, air, temperature, humidity, nutrient delivery and the removal
of wastes must all be taken into account (Heathcote et. al, 1996). Due to water’s high
surface tension and tendency to stick to itself under microgravity conditions,
conventional hydroponic and aeroponic nutrient delivery systems are not feasible (Levine
et. al, 2001). The successful nutrient delivery system must be able to deliver a reliable
nutrient flow without adding stress to the plants in the system.
Active nutrient delivery systems used to date have employed porous tubes that
exploit capillary action and system pressure (positive or negative) to control the delivery
of liquid media into surrounding substrate (Dreschel et. al, 1994; Porterfield 1996;
Tibbitts, 1995; Duffie et. al 1995; Turner et. al, 1999). To date, porous tube nutrient
delivery systems (with or without a surrounding substrate) have been the only active
nutrient delivery systems used in space (Porterfield et. al, 2003). While progress has been
made in optimizing conditions in the shoot zone, stress in the root zone, particularly due
to hypoxia, has been difficult to eliminate (Monje et. al, 2003).
14
Hypoxia has been shown to occur in the roots of plants grown in several different
microgravity experiments (Porterfield et al., 1994). It is hypothesized that as liquid media
is drawn from the porous tube into the surrounding substrate, air/liquid boundary layers
form causing the formation of air pockets (Monje, et. al, 2003). Thus, roots penetrating
these trapped air pockets deplete them of the oxygen necessary to maintain aerobic
metabolism thereby leading to the depletion of bioavailable oxygen in the media (Monje,
et. al, 2003). Therefore a system that is capable of providing not only aerated media but
also preventing the formation of trapped air pockets should be able to effectively reduce
or eliminate hypoxic stress in roots of plants grown in microgravity conditions. A mist-
based nutrient delivery system in which liquid media and oxygen can be concurrently
delivered has the potential to fulfill these requirements.
Mist-based systems have the potential to optimize conditions in the root-zone as
well as to increase gas exchange between the root and shoot zones. Mist bioreactors have
been shown to have several advantages over conventional bioreactors (Weathers et. al,
1999; Kim, et. al, 2002). One of the major advantages of mist systems is the ability to
control the gas mixture entering into the culture vessel (Weathers et. al, 1997). In cultures
of transformed roots, advantages of mist systems over conventional systems have been
demonstrated for both O2 (Weathers et. al, 1999) and CO2 controlled gas levels (DiIorio
et. al, 1992). We considered, therefore, that a nutrient delivery system using an ultrasonic
nozzle has the potential to offer these same advantages to plant roots suffering from
hypoxia in microgravity.
In this study, we compare two substrate-based systems employing different
modes of nutrient delivery: a mist and a porous tube. We measured root growth and
15
alcohol dehydrogenase (ADH) activity of germinating pea roots in response to changes in
aeration rate.
MATERIALS AND METHODS
Culture Systems
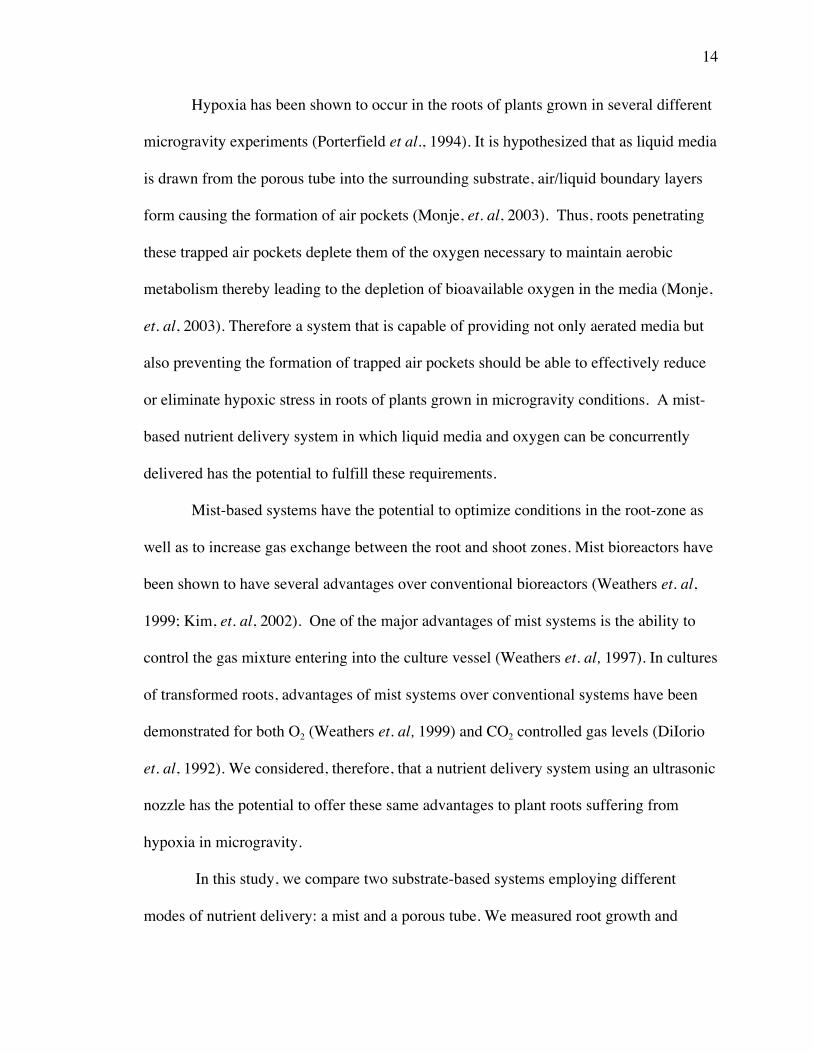
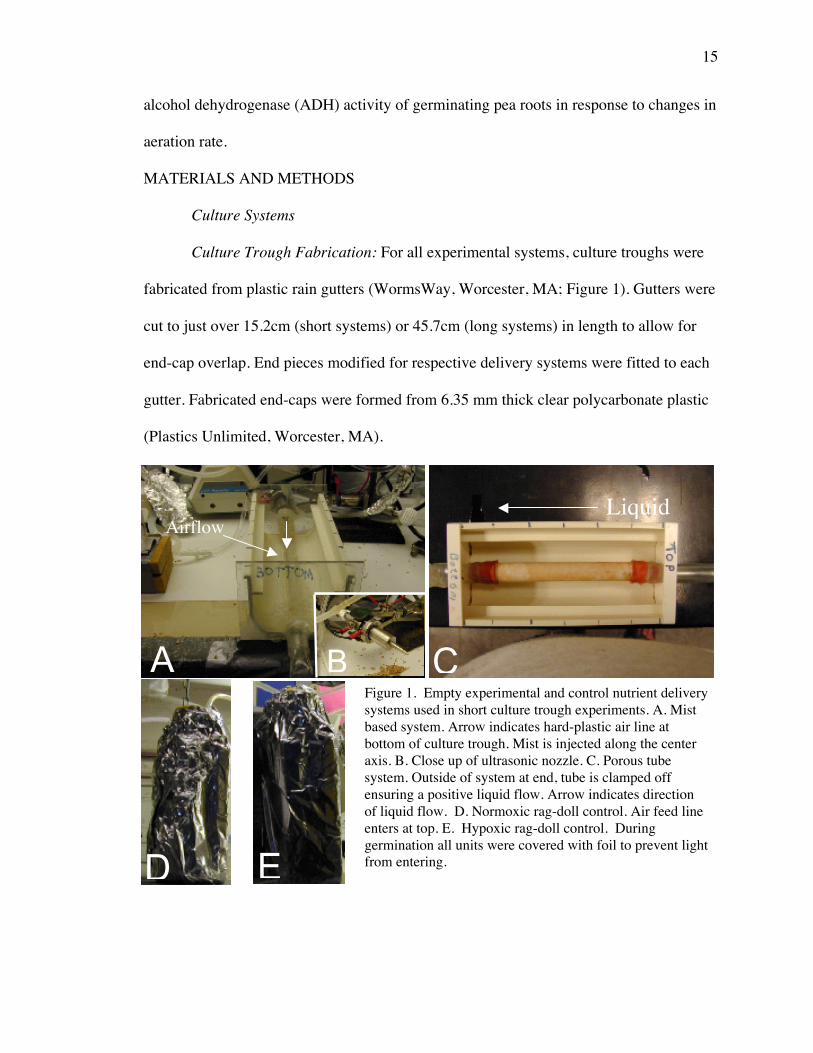
Culture Trough Fabrication: For all experimental systems, culture troughs were
fabricated from plastic rain gutters (WormsWay, Worcester, MA; Figure 1). Gutters were
cut to just over 15.2cm (short systems) or 45.7cm (long systems) in length to allow for
end-cap overlap. End pieces modified for respective delivery systems were fitted to each
gutter. Fabricated end-caps were formed from 6.35 mm thick clear polycarbonate plastic
(Plastics Unlimited, Worcester, MA).
E
DE
D
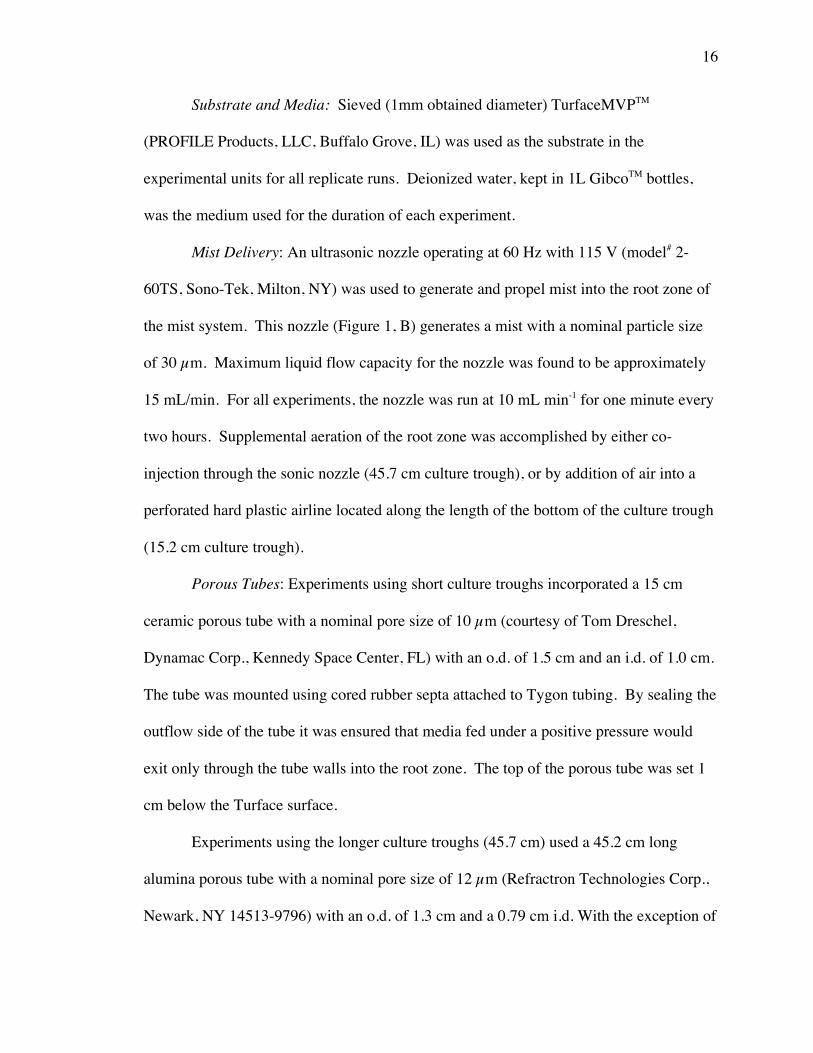
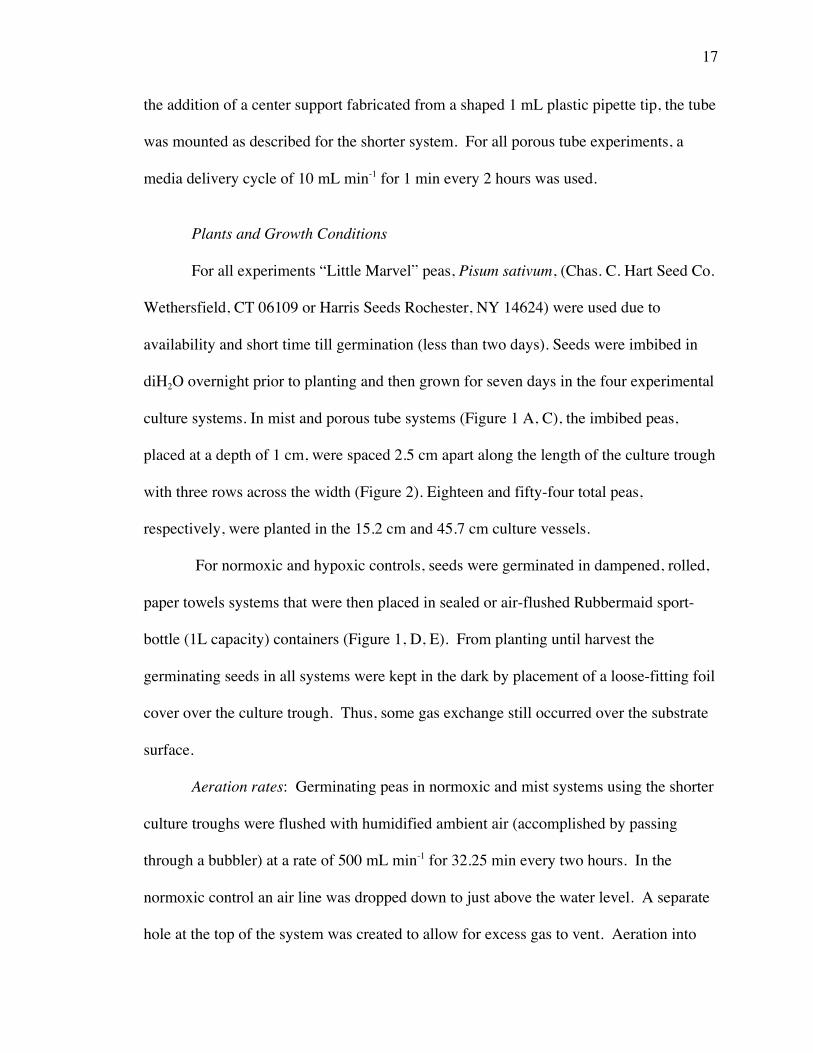
Figure 1. Empty experimental and control nutrient deliverysystems used in short culture trough experiments. A. Mistbased system. Arrow indicates hard-plastic air line atbottom of culture trough. Mist is injected along the centeraxis. B. Close up of ultrasonic nozzle. C. Porous tubesystem. Outside of system at end, tube is clamped offensuring a positive liquid flow. Arrow indicates directionof liquid flow. D. Normoxic rag-doll control. Air feed lineenters at top. E. Hypoxic rag-doll control. Duringgermination all units were covered with foil to prevent lightfrom entering.
LiquidAirflow
A CB
D E
16
Substrate and Media: Sieved (1mm obtained diameter) TurfaceMVPTM
(PROFILE Products, LLC, Buffalo Grove, IL) was used as the substrate in the
experimental units for all replicate runs. Deionized water, kept in 1L GibcoTM bottles,
was the medium used for the duration of each experiment.
Mist Delivery: An ultrasonic nozzle operating at 60 Hz with 115 V (model# 2-
60TS, Sono-Tek, Milton, NY) was used to generate and propel mist into the root zone of
the mist system. This nozzle (Figure 1, B) generates a mist with a nominal particle size
of 30 µm. Maximum liquid flow capacity for the nozzle was found to be approximately
15 mL/min. For all experiments, the nozzle was run at 10 mL min-1 for one minute every
two hours. Supplemental aeration of the root zone was accomplished by either co-
injection through the sonic nozzle (45.7 cm culture trough), or by addition of air into a
perforated hard plastic airline located along the length of the bottom of the culture trough
(15.2 cm culture trough).
Porous Tubes: Experiments using short culture troughs incorporated a 15 cm
ceramic porous tube with a nominal pore size of 10 µm (courtesy of Tom Dreschel,
Dynamac Corp., Kennedy Space Center, FL) with an o.d. of 1.5 cm and an i.d. of 1.0 cm.
The tube was mounted using cored rubber septa attached to Tygon tubing. By sealing the
outflow side of the tube it was ensured that media fed under a positive pressure would
exit only through the tube walls into the root zone. The top of the porous tube was set 1
cm below the Turface surface.
Experiments using the longer culture troughs (45.7 cm) used a 45.2 cm long
alumina porous tube with a nominal pore size of 12 µm (Refractron Technologies Corp.,
Newark, NY 14513-9796) with an o.d. of 1.3 cm and a 0.79 cm i.d. With the exception of
17
the addition of a center support fabricated from a shaped 1 mL plastic pipette tip, the tube
was mounted as described for the shorter system. For all porous tube experiments, a
media delivery cycle of 10 mL min-1 for 1 min every 2 hours was used.
Plants and Growth Conditions
For all experiments “Little Marvel” peas, Pisum sativum, (Chas. C. Hart Seed Co.
Wethersfield, CT 06109 or Harris Seeds Rochester, NY 14624) were used due to
availability and short time till germination (less than two days). Seeds were imbibed in
diH2O overnight prior to planting and then grown for seven days in the four experimental
culture systems. In mist and porous tube systems (Figure 1 A, C), the imbibed peas,
placed at a depth of 1 cm, were spaced 2.5 cm apart along the length of the culture trough
with three rows across the width (Figure 2). Eighteen and fifty-four total peas,
respectively, were planted in the 15.2 cm and 45.7 cm culture vessels.
For normoxic and hypoxic controls, seeds were germinated in dampened, rolled,
paper towels systems that were then placed in sealed or air-flushed Rubbermaid sport-
bottle (1L capacity) containers (Figure 1, D, E). From planting until harvest the
germinating seeds in all systems were kept in the dark by placement of a loose-fitting foil
cover over the culture trough. Thus, some gas exchange still occurred over the substrate
surface.
Aeration rates: Germinating peas in normoxic and mist systems using the shorter
culture troughs were flushed with humidified ambient air (accomplished by passing
through a bubbler) at a rate of 500 mL min-1 for 32.25 min every two hours. In the
normoxic control an air line was dropped down to just above the water level. A separate
hole at the top of the system was created to allow for excess gas to vent. Aeration into
18
the root zone of the mist system was accomplished through the use of a perforated hard-
plastic tube placed along the bottom of the trough.
Peas germinating in systems using the longer culture troughs had substantially
different aeration cycles. In the mist system, ambient air was co-injected through the
ultrasonic nozzle at 20 mL min-1 for 1 min every two hours. In the porous tube system,
aeration, when used, was fed at a rate of 20 mL min-1 for 1 min every two hours into the
media reservoir from an air line. The drip control system, when aerated, followed the
same protocol as the porous tube system. The drip system was also run at a tenfold
higher aeration rate of 200 mL min-1 for 1 min every two hours.
Harvest and Extraction: At harvest, plant roots were extracted following a
procedure modified from the works of Porterfield (1996) and McKee and Mendelssohn
(1987). Experiments using the shorter culture troughs had roots from the entire system
pooled and extracted together. Roots from the longer culture troughs were pooled into
six sections, each consisting of nine peas. Sections were divided from the inlet to the
outlet with the first three rows from the inlet composing section one (Figure 2). Freshly
harvested roots were rinsed, blotted dry, and the fresh weight was then measured. The
roots were then frozen in liquid nitrogen. Time from system shut down until all of the
Figure 2. Inlet to outlet section grouping of peas germinated in longculture trough experiments. Each section represents a total grouping ofroots from nine peas pooled together.
19
roots were frozen was kept under an hour. If roots were not immediately extracted, they
were stored at –80˚C until further processing was possible.
To facilitate disruption, frozen roots were re-dipped in liquid nitrogen just prior to
grinding in a mortar and pestle using 2-4 mL of Tris breaking buffer per gram of root
tissue. The breaking buffer, brought to pH 7.5, consisted of: 20 mM Tris, 10 mM MgCl2,
40 mM dithiothreitol and 4% (w/v) polyvinylpyrrolidone (MW 40,000). After grinding,
the resulting homogenate was then centrifuged at 26,000 g for 15 minutes. The
supernatant was decanted into a clean test tube and stored at –80˚C until assayed for
ADH activity.
Assays: The ADH assay was modified from McKee and Mendelssohn (1987),
Porterfield (1996) and Sigma Aldrich (quality-control document, product A3263) with
stock reagents as follows: 50 mM sodium diphosphate adjusted to pH 8.8 using
phosphoric acid (SPP), 19.8 mM acetaldehyde (acetaldehyde) and 7.5 mM β-NADH
(NADH). SPP can be prepared and stored at 4˚C for long periods of time. NADH stock
solution has a useful life of 1-2 weeks if stored at 4˚C. Acetaldehyde should be prepared
the day of the assay. During the course of the assay NADH and SPP can be kept at room
temperature, but acetaldehyde and crude extracts are kept on ice.
One unit of ADH activity is defined as 1 µmol NADH oxidized min-1 mg-1 soluble
protein at 25˚C (McKee and Mendelssohn, 1987). NADH oxidation is measured as a
decrease in absorbance at 340 nm over a course of six minutes. An extinction coefficient
of 6.22 (Sigma-Aldrich) was used in calculating the enzyme’s specific activity. Total
protein was measured using the Bradford (1976) assay.
20
All assays were run using a Hitachi U-2001 dual-beam spectrophotometer and a
final reaction volume of 1 mL. Sample measurement consisted of the following mixtures:
in reference cell, 934 µL SPP, 33 µL acetaldehyde, 33 µL NADH; in the sample cell,
acetaldehyde and NADH volumes were the same and 868 µL of SPP and 66 µL of crude
enzyme extract were used. Reagents were mixed before enzyme extract was added.
Only data from the linear portion (defined as an r2 value > 0.95 ) of the assay was used to
calculate initial velocity and specific activity. All reagents were obtained from Sigma-
Aldrich (St. Louis, MO).
Data Analysis
Except where noted, the data presented are the result of two independent replicate
runs for each experimental system. Section number indicates a group’s position, not
distance, from inlet to outlet. Data from each experiment were gathered and entered into
Microsoft Excel (Microsoft, Redmond, WA) and analyzed using the data analysis
expansion pack.
RESULTS
Given the problem of providing adequate oxygenation to the roots of plants
growing in microgravity and the capability of the mist bioreactor to reduce this problem
we considered that a mist-based system using an ultrasonic nozzle may reduce hypoxic
stress experienced by plants growing in a ground-based nutrient delivery system. To this
end, roots of germinated peas experiencing less hypoxic stress should have higher
biomass yields and lower specific ADH activity compared to roots experiencing greater
amounts of hypoxia.

21
Root Growth
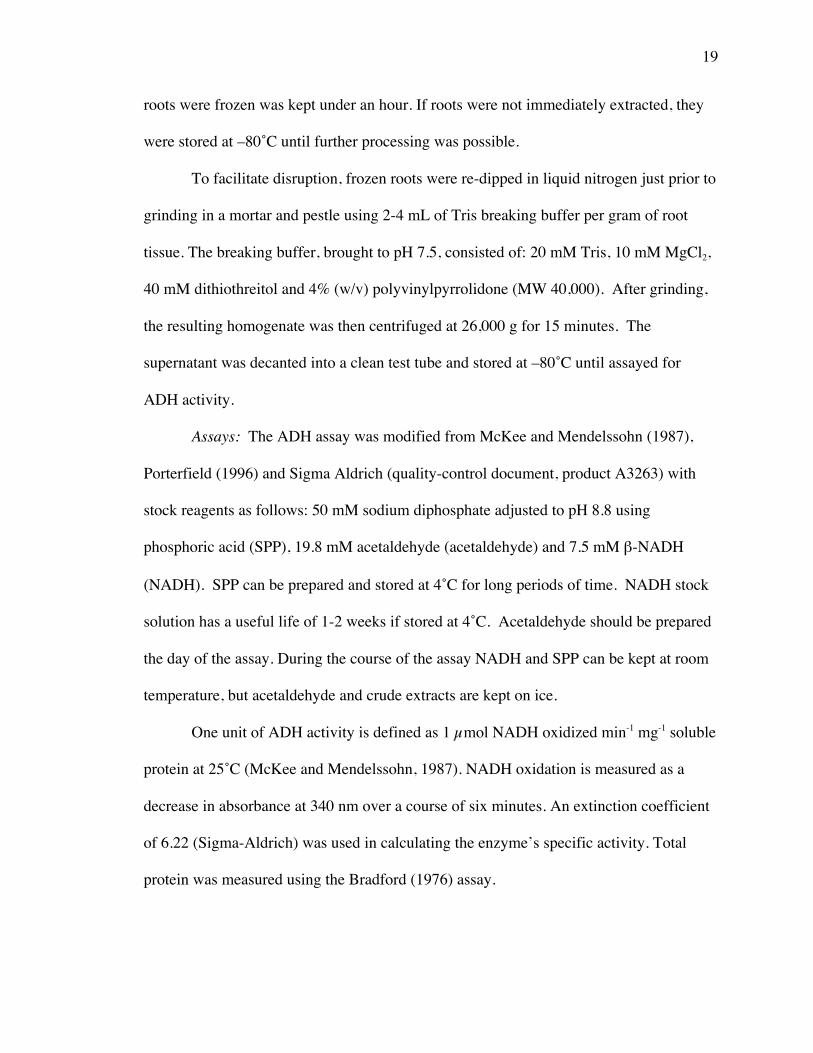
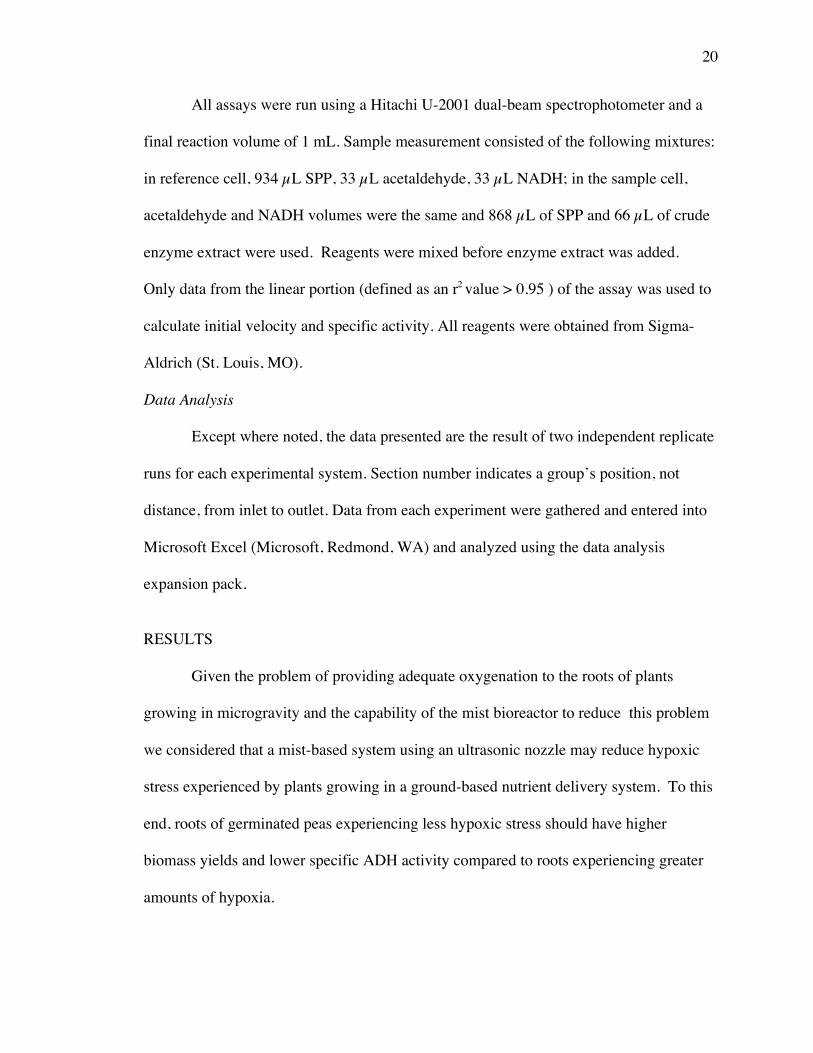
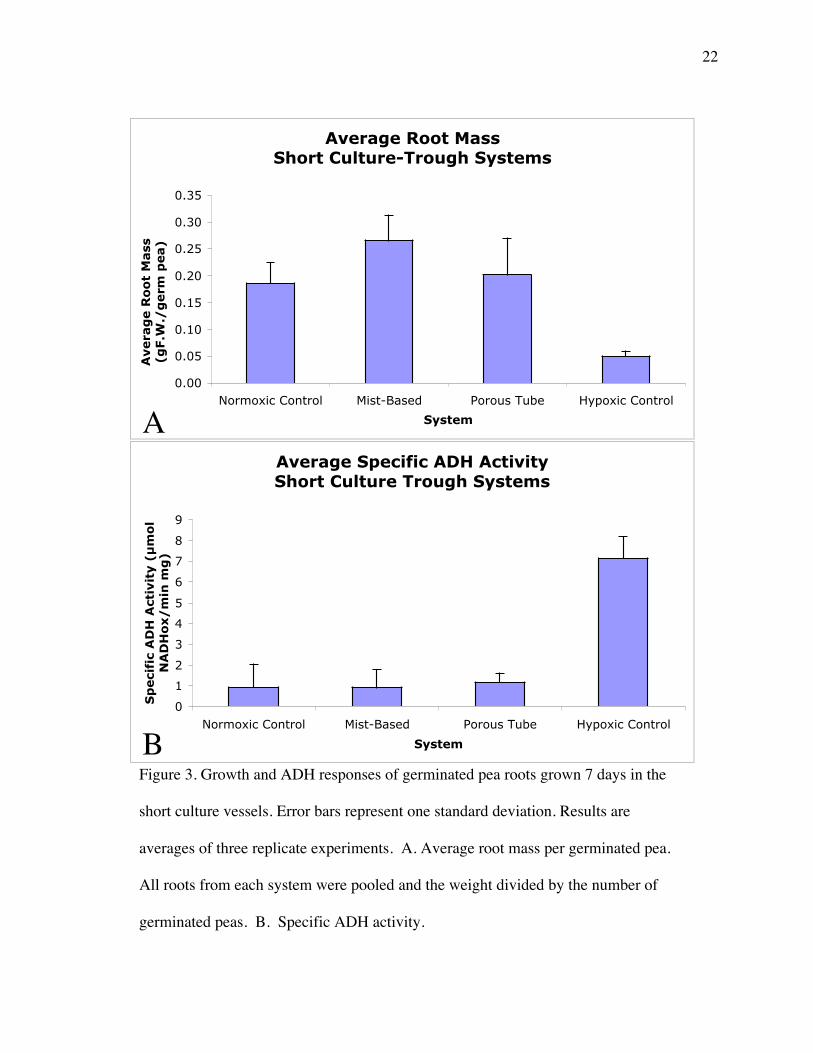
Roots harvested from the mist delivery system had the highest overall fresh
weight per germinated pea (Figure 3A). Roots harvested from the mist and porous tube
systems both had greater root mass than hypoxic and normoxic controls. As expected,
roots in the normoxic control had a higher fresh weight per germinated pea than the
hypoxic control (Figure 3A).
To determine if use of a mist for nutrient delivery was practical in a scaled-up
culture system, we tripled the length of the initial culture trough. We also altered
aeration rates in the porous tube and drip control systems to ascertain if an increase in
aeration, although fed into the media reservoir and not directly into the root zone, would
alter root growth and hypoxic stress. There were no statistically significant differences in
growth of roots taken from either the porous tube or the mist-based systems. Indeed, root
mass per germinated pea was comparable for all nutrient delivery systems and sections
therein (Figure 4A). Furthermore, there was no apparent gradient, which might be seen as
an upward or a downward trend in root growth as one compared peas from the inlet to the
outlet of each of the scaled-up systems (Figure 4A).
Hypoxic Stress
Roots were assayed for ADH activity to determine their relative response to
hypoxic stress. We first measured responses of roots grown in the short culture systems.
Although not statistically significant, roots harvested from the mist system showed
slightly lower ADH activity than roots grown in the porous tube system (Figure 3B)
suggesting better aeration occurred via misting. Roots in hypoxic and normoxic controls
had the expected high and low levels of ADH activity, respectively (Figure 3B). Roots
22
Figure 3. Growth and ADH responses of germinated pea roots grown 7 days in the
short culture vessels. Error bars represent one standard deviation. Results are
averages of three replicate experiments. A. Average root mass per germinated pea.
All roots from each system were pooled and the weight divided by the number of
germinated peas. B. Specific ADH activity.
Average Root MassShort Culture-Trough Systems
0.00
0.05
0.10
0.15
0.20
0.25
0.30
0.35
Normoxic Control Mist-Based Porous Tube Hypoxic Control
System
Avera
ge R
oo
t M
ass
(g
F.W
./g
erm
pea)
Average Specific ADH ActivityShort Culture Trough Systems
0
1
2
3
4
5
6
7
8
9
Normoxic Control Mist-Based Porous Tube Hypoxic Control
System
Sp
eci
fic
AD
H A
ctiv
ity (µ
mo
l N
AD
Ho
x/
min
mg
)
A
B
23
grown in the mist and porous tube systems had ADH activities more similar to the
normoxic control than the hypoxic control (Figure 3B).
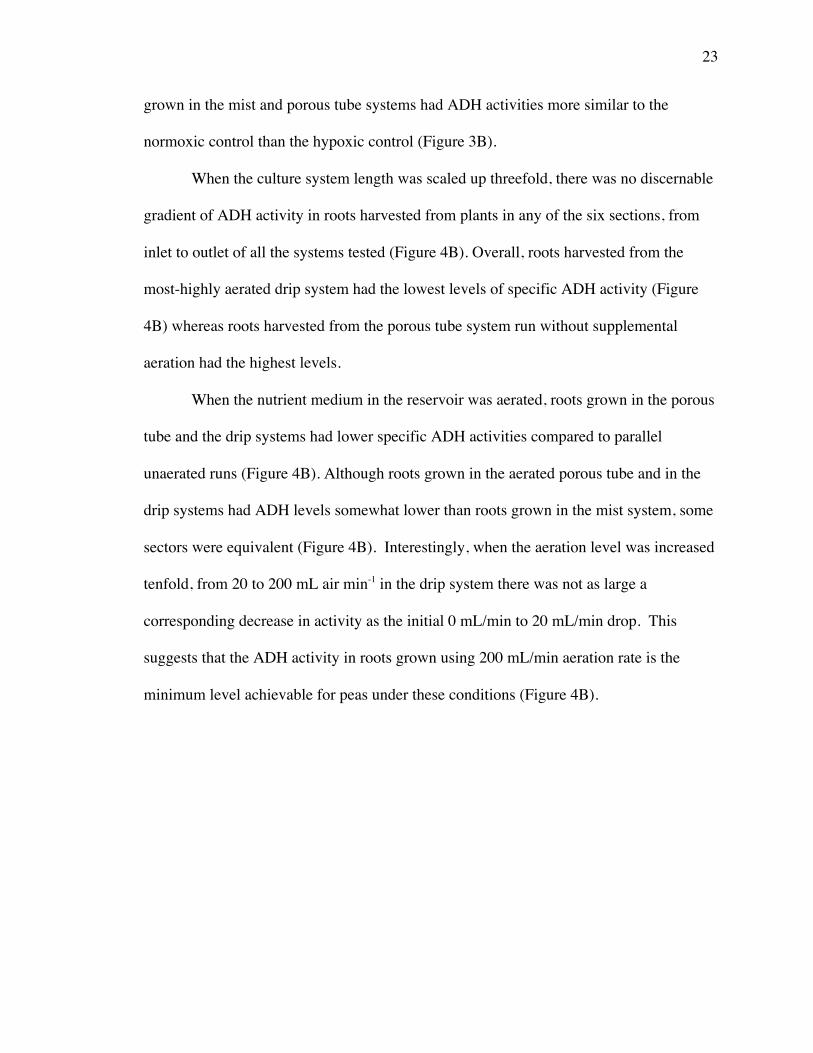
When the culture system length was scaled up threefold, there was no discernable
gradient of ADH activity in roots harvested from plants in any of the six sections, from
inlet to outlet of all the systems tested (Figure 4B). Overall, roots harvested from the
most-highly aerated drip system had the lowest levels of specific ADH activity (Figure
4B) whereas roots harvested from the porous tube system run without supplemental
aeration had the highest levels.
When the nutrient medium in the reservoir was aerated, roots grown in the porous
tube and the drip systems had lower specific ADH activities compared to parallel
unaerated runs (Figure 4B). Although roots grown in the aerated porous tube and in the
drip systems had ADH levels somewhat lower than roots grown in the mist system, some
sectors were equivalent (Figure 4B). Interestingly, when the aeration level was increased
tenfold, from 20 to 200 mL air min-1 in the drip system there was not as large a
corresponding decrease in activity as the initial 0 mL/min to 20 mL/min drop. This
suggests that the ADH activity in roots grown using 200 mL/min aeration rate is the
minimum level achievable for peas under these conditions (Figure 4B).
24
Average Root Fresh WeightLong Culture Trough Experiments
0.000
0.050
0.100
0.150
0.200
0.250
0.300
0.350
0 1 2 3 4 5 6
Section
Ro
ot
F.W
. p
er
germ
. p
ea (
g)
0mL Air Porous Tube0mL Air Drip Control20mL Air 30µm Mist200 mL Air Drip 20mL Air Drip20mL Air Porous Tube
Specific ADH Activity Long Culture Trough Experiments
0.0
5.0
10.0
15.0
20.0
25.0
30.0
0 2 4 6
Section
Sp
eci
fic
AD
H A
ctiv
ity
(µm
olN
AD
Ho
x/
min
mg
p
rote
in)
0mL Air Porous Tube
0mL Air Drip
20mL Air 30µm Mist
200mL Air Drip
20mL Air Drip
20mL Air PorousTube
A
BInlet
Inlet
Outlet
OutletFigure 4. Growth and ADH responses of germinated pea roots after 7 days in thelong culture vessels. Data represent the average of two replicate experiments.Vertical bars indicate the high and the low points from the average. Each pointrepresents a pooling of roots from nine peas in each section. A. Root fresh weightper germinated pea. B. Specific ADH activity.
25
DISCUSSION
To our knowledge this is the first report of an active nutrient delivery system that
is suitable for use in microgravity and does not use a porous tube (Porterfield, et. al,
2003). A decrease in root hypoxia, as measured by ADH activity, relative to roots in the
porous tube system was seen in pea roots grown in the mist-based system. There are
three principle differences between the porous tube and mist-based systems. First, the
ultrasonic nozzle of the mist-based system is capable of co-injecting gas with the liquid
media. This allows for direct manipulation of gas flow and composition into the root
zone. Second, the generation and propulsion of aerated mist into the substrate should
inhibit the formation of stagnant air pockets. Finally, increased surface-to-volume ratios
of the fine mist droplets should also allow for enhanced air transport capabilities when
compared to bulk liquid transport through a porous tube.
It has been hypothesized that as capillary action radially draws liquid into the
root zone, stagnant air pockets form as the liquid media seals off pockets of gas (Monje,
et. al, 2003). Aeration of the media fed into the root zone, however, should not be
overlooked. Recent surveys of nutrient delivery systems demonstrate that, to date,
studies have chiefly relied on passively using temperature to control the content of
dissolved oxygen. No effort has been directed into actively enriching the oxygen content
of media (Porterfield, et. al, 2003; Monje, et. al, 2003). Our data, particularly from roots
in the long culture vessels (Figure 4B), suggest that mode of media delivery into the root
zone may not wholly be responsible for hypoxic stress. This is seen particularly in the
great decrease in specific ADH activity in roots from the porous tube and drip systems
when provided with some supplemental aeration.
26
Despite a tenfold increase in aeration rate, roots in the drip system did not show
proportionate decreases in ADH activity (Figure 4B). Thus, although media aeration can
play a role in alleviating hypoxic stress, it is limited in its ability to solve all media-
transport issues. Also, in spite of being aerated, it is possible that trapped air pockets will
still form if a delivery system cannot provide for adequate media exchange through the
root zone. In addition to studying movement of liquids through the substrate, future work
should also measure dissolved oxygen content of media entering and leaving the root
zone. Furthermore, as suggested by Poerterfield et al. (2000b) it is also important to
measure not only delivered oxygen but also biologically available oxygen to determine
what gas is actually accessible to the roots.
Although this report shows a reduction of hypoxic stress in roots from plants
grown in aerated systems, these promising results should be viewed as valid only for the
first week of germination. It remains to be seen if reduction in hypoxic stress indicators
in the roots can be maintained over the full lifespan of the plants. Also, it remains
unclear if overall plant health and development will be affected by altering the mode and
level of gas delivered to the roots. Issues relating to mode of nutrient delivery, not
supplemental aeration, may also arise when growth extends beyond a week.

27
ACKNOWLEDGEMENTS
The authors would like to thank Mary Musgrave (University of Connecticut) and
Marshall Porterfield (University of Missouri) for insight and guidance, and Tom Dreschel
and Gary Stutte (Dynamac Corporation) for the donation of porous tubes and technical
specifications. Finally, thanks to Melissa Towler, Timothy Iskra and other members of
WPI’s plant research group for comments, techniques and support. Financial support
from WPI is greatly appreciated.
28
Chapter 2: Life Cycle Study*
Evaluation of various modes of nutrient delivery over the lifespan of peasgrown in a controlled environment
SUMMARY
In a previous study it was shown during the first week of germination that media
aeration affected shoot health more than mode of media delivery. The purpose of this
study was to evaluate pea plant responses to various modes of nutrient delivery over the
life cycle of the plant. Earligreen peas, a dwarf variety, were grown in sealed culture
vessels that were well aerated but only via three different modes of nutrient delivery into
the surrounding substrate of the root zone: mist, porous tube and a drip control.
Measurements recorded for each system included fresh weight (roots, shoots, leaves),
hypoxic stress of the roots and chlorophyll content. Of the three systems, plants grown in
the porous tube system consistently had the highest levels of biomass and the lowest
levels of hypoxic stress. Plants grown in the porous tube system also had the lowest total
chlorophyll and a chlorophyll a/b ratio similar to the mist system. No plants produced
fully mature seed. This study marks the first time the porous tube system has been
compared with another active nutrient delivery system over the life cycle of a chosen
species.
* This section submitted for publication.

29
INTRODUCTION
To sustain a long-term mission in an enclosed environment, it is necessary to
provide food, recycle air and water, and maintain the psychological wellbeing of the
humans residing in the environment. This is the primary goal in the development of a
controlled ecological life support system (CELSS) (Monje et al., 2003; Porterfield, et. al,
2003). The development of such a system necessitates growing plants in an enclosed and
highly regulated environment. Factors that must be considered in the design of such an
environment include light, air, temperature, humidity, nutrient delivery, and waste
removal (Heathcote et. al, 1996). In the root zone, water’s high surface tension and
cohesiveness under microgravity conditions rules out conventional hydroponic and
aeroponic nutrient delivery systems (Levine et. al, 2001). In both the shoot and root
zones understanding gas flow, particularly the movements of oxygen, carbon dioxide and
ethylene, is especially important.
In microgravity, the lack of a significant gravity vector is responsible for the
absence of buoyancy-driven convection currents that under normal gravity are
responsible for the delivery of oxygen and carbon dioxide to plant tissues (Porterfield et.
al, 1997, Monje et al. 2003). Under microgravity conditions it is thought that boundary
layers depleted of CO2 and O2 form around plant tissues and limit the access of those
gases to the plant tissue (Monje et al., 2003, Porterfield, 2002). Data from spaceflight
studies using Arabidopsis have shown various problems in the shoot zone that affect
normal reproductive organ development (Kuang et. al, 1996; Musgrave et. al, 1997)
when compared to ground controls (Table 1). These problems include:
flower/reproductive organ senescence, decreased biomass, deformed reproductive organs,
30

31
unviable pollen and seed, decreased chlorophyll a and b levels (but no change in ratio),
and increased ADH activity and transcription (Table 1). A number of these problems are
related to poor gas exchange both in the root and shoot zones.
The poor gas exchange around shoots in microgravity is readily obviated
by facilitating air exchange using a fan as shown in the CHROMEX series of experiments
(Table 1). It is still necessary, however, to monitor and control levels of CO2 and ethylene
as shown in the Svet series of experiments where wide fluctuations in CO2 levels were
observed despite use of a fan in the shoot zone (Musgrave, et al. 2000).
Although progress has been made in eliminating gas flow problems in the shoot
zone, plant stress caused by poor aeration in the root zone has been difficult to avoid
(Monje et. al, 2003). Prior to the introduction of porous tube based systems most nutrient
delivery systems relied upon nutrient-charged agar gel or fibrous ion exchange resins to
provide nutrient delivery and root support (Table 1). Problematic to the use of agar gel
and resin exchange systems was the low redox potential of the agar media coupled with
the lack of media exchange capabilities (Porterfield, et al., 1997). The porous tube
systems now in use provide a means for uniformly distributing media across the root
zones of nutrient delivery systems. However, as the liquid moves radially outward from
the tube into the surrounding substrate, it is likely that trapped air pockets form that
subsequently become depleted of oxygen when penetrated by roots (Monje, et al., 2003).
It is thought that the hypoxic stress experienced by roots grown in porous tube systems
contributed to the overall decrease in health of plants grown in microgravity (Monje, et
al., 2003; Porterfield, et al., 2000b). Indeed, hypoxia in roots, as measured by alcohol
dehydrogenase (ADH) specific activity was elevated in roots from plants grown in
32
microgravity compared to ground controls (Porterfield et. al, 1997; Porterfield et. al,
2000 a, b; Monje et. al, 2003).
A nutrient delivery system that uses a mist to facilitate penetration of nutrient
media across the entire cross-section of the root zone may inhibit the formation of
stagnant air pockets thus leading to a decrease in hypoxic stress in roots. Indeed, hypoxic
stress, as measured by ADH expression and activity, was eliminated when nutrient mists
were fed to dense beds of roots (Weathers et al, 1999). Besides elimination of hypoxia,
another benefit of a mist-based system is control of gas composition fed into the root
zone (DiIorio, et al., 1992; Weathers, et al., 1997, Wyslouzil, B.E., et al., 2000). For
example, roots of many plant species grow best in air enriched with low levels of CO2
(Weathers and Zobel, 1992; DiIorio, et al., 1992).
In a previous study (Romagnano and Weathers, 2004) we examined growth and
hypoxic stress of peas germinated in mist and porous tube nutrient delivery systems.
Although, roots from germinated peas grown in the mist and porous tube systems
produced similar amounts of biomass, roots from the porous tube system showed more
hypoxic stress than those from the mist system. Supplemental aeration of the medium
reservoir of the porous tube system, which is difficult at best under microgravity
conditions, eliminated the disparity in hypoxic stress between the modes of nutrient
delivery. Here we use the conditions established from that work to study the impact that
the mode of delivery of both gas and liquid nutrients to the root zone has on peas over the
course of their life cycle. This is the first study that compares full life cycle plant growth
in a porous tube system to growth in another active nutrient delivery system.
33
MATERIALS AND METHODS
Culture Systems
Culture Trough Fabrication: For all experimental systems, culture troughs were
fabricated from plastic rain gutters (WormsWay, Worcester, MA; Figure 1 A). Gutters
were cut to just over 45.7 cm in length to allow for end-cap overlap. End pieces modified
for respective delivery systems were fitted to each gutter. Fabricated end-caps were
formed from 6.35 mm thick clear polycarbonate plastic (Plastics Unlimited, Worcester,
MA).
Substrate and Media: Sieved (1 mm obtained diameter) TurfaceMVPTM
(PROFILE Products, LLC, Buffalo Grove, IL) was used as the substrate in the
experimental units for all replicate runs. One quarter strength Hoagland’s solution, kept
in 1L GibcoTM bottles, was the medium used for the duration of each experiment.
Drip Control: Liquid media propelled using a peristaltic pump was dripped from
a tube located at one end of the culture trough and at 1 cm depth into the system and
allowed to freely flow to the drain. Media was fed at a rate of 10 ml min-1 for 1 min every
two hours.
Mist Delivery: An ultrasonic nozzle operating at 60 Hz with 115 V (model# 2-
60TS, Sono-Tek, Milton, NY) was used to generate and propel mist into the root zone of
the mist system. This nozzle (Figure 5, A at inlet) generates a mist with a nominal
particle size of 30 µm. Maximum liquid flow capacity for the nozzle was found to be
approximately 15 mL min-1. For all experiments, the nozzle was run at 10 mL min-1 for
one minute every two hours. Aeration of the root zone was accomplished by co-injection
of ambient air (see below) through the sonic nozzle.
34
A
B C
Shoot Enclosure
Septa
InletOutlet
90˚ Bend
Pod
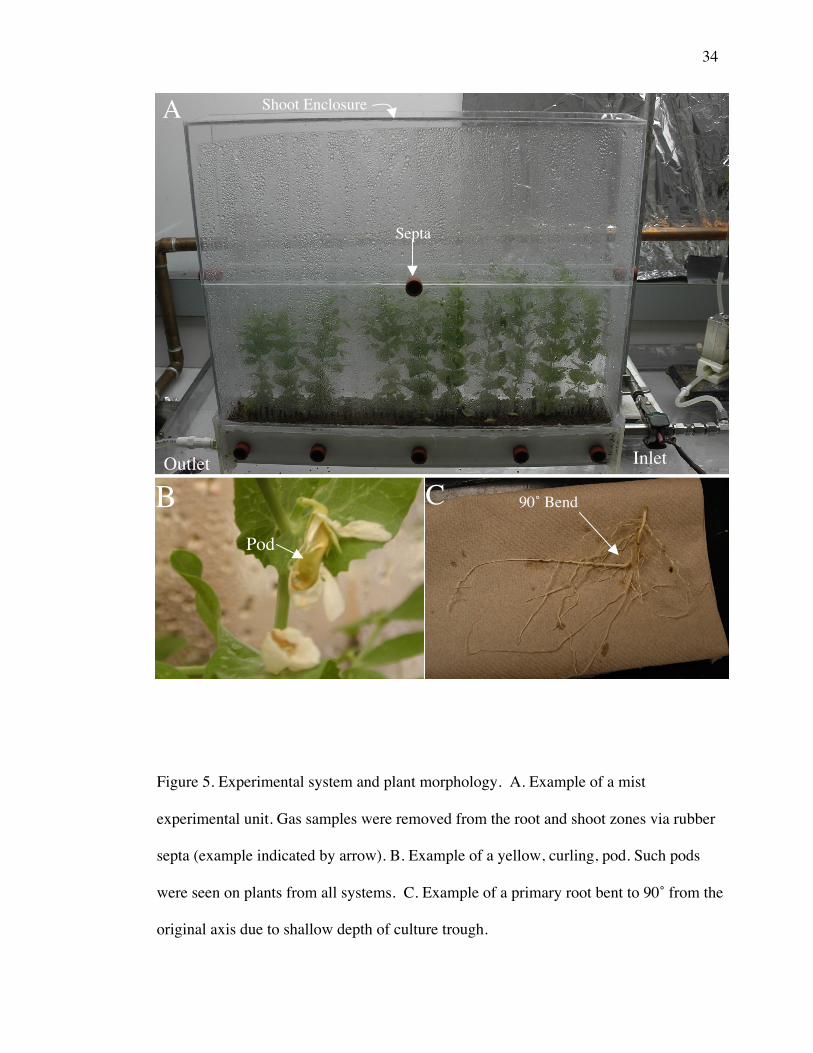
Figure 5. Experimental system and plant morphology. A. Example of a mist
experimental unit. Gas samples were removed from the root and shoot zones via rubber
septa (example indicated by arrow). B. Example of a yellow, curling, pod. Such pods
were seen on plants from all systems. C. Example of a primary root bent to 90˚ from the
original axis due to shallow depth of culture trough.
35
Porous Tube: Culture troughs with a length of 45.7 cm used a 45.2 cm alumina
porous tube with a nominal pore size of 12 µm, o.d. of 1.3 cm, and a 0.79 cm i.d.
(Refractron Technologies Corp., Newark, NY 14513-9796). By sealing the outflow end
of the tube it was ensured that media fed under a positive pressure would exit only
through the tube walls into the root zone. The top of the porous tube was set 1 cm below
the TurfaceTM surface. A center support fabricated from a shaped 1 mL plastic pipette tip
was used to stabilize the tube in the trough. A media delivery cycle of 10 mL min-1 for 1
min every 2 hours was used.
Plants and Growth Conditions
For all experiments “Earligreen” peas (Western Regional Plant Introduction
Station, Acession # 365417, Pullman, WA) were used due to their dwarf size (~25 cm)
and defined morphology. Seeds were imbibed in diH2O overnight prior to planting and
then grown for forty days in the three experimental culture systems. In mist and porous
tube systems (Figure 5 A, C), the imbibed peas, placed at a depth of 1 cm, were spaced
2.5 cm apart along the length of the culture trough as a single row down the center axis
(Figure 2). In total, eleven peas were planted in each system and grown in a temperature
controlled room at 20˚C and 50% relative humidity.
Light was continuously provided by six 1500 watt fluorescent bulbs suspended
directly above the experimental systems. Light intensity at the surface of the Turface in
the culture trough was 500 µmol m-2 s-1.
Developmental Milestones: The day a particular life cycle milestone was
achieved was recorded during the course of the experiments. The milestones were:
germination, first leaves, mature tendrils, flowering, pod formation, and mature pods.
36
Germination was defined as that time when the cotyledon was first visible above the
substrate. First leaves were recorded after they had unfolded from the shoot. Mature
tendrils were defined only as those tendrils that had a tripartite differentiation. Flowering
was recorded as the first opening of the first flower bud. Pod formation was noted as
soon as the pod emerged from the fertilized flower. Finally, pods were considered
mature only if they had swollen and contained mature seed. Mature seeds were
subsequently harvested and germinated to determine viability.
Aeration rates: In the mist system, ambient air was co-injected through the
ultrasonic nozzle at 200 mL min-1 for 1 min every two hours. In the porous tube and drip
control systems ambient air was fed at a rate of 200 mL min-1 for 1 min every two hours
into the media reservoir from an air line. The aeration rate was chosen based on previous
germination studies (Romagnano and Weathers, 2004). To simulate the poor gas
exchange in microgravity the shoot zone was sealed using clear boxes fabricated from
3.17 mm thick polycarbonate (Plastics Unlimited, Worcester, MA). Chamber height was
30 cm. The chamber was sealed to the culture trough using aquarium safe 100% silicone
glue (DAP, Inc, Baltimore, MD). Although convection currents would still be present, the
only gas entering into the experimental troughs would be that gas transported by the
nutrient delivery system into the root zone. Thus, the data generated would mainly be the
result of differences in modes of media delivery rather than aeration effects. Septa for the
gas samples were placed as shown in Figure 5A: half way up the shoot zone enclosure
and along one side of the culture trough at 1 cm below the lip.

37
Harvest and Extraction
Roots: Plant roots were harvested and extracted following a procedure modified
from the works of Porterfield (1996) and McKee and Mendelssohn (1987). The roots
from individual plants were harvested from each culture system, assigned a plant number
from inlet to outlet, rinsed, blotted, and the fresh weight recorded. The roots were then
frozen in liquid nitrogen. Time from system shut down until all of the roots were frozen
was kept under an hour. If roots were not immediately extracted, they were stored at
–80˚C until further processing was possible.
To facilitate disruption, frozen roots were re-dipped in liquid nitrogen just prior to
grinding in a mortar and pestle using 2-4 mL of Tris breaking buffer per gram of root
tissue. The breaking buffer, pH 7.5, consisted of: 20 mM Tris, 10 mM MgCl2, 40 mM
dithiothreitol and 4% (w/v) polyvinylpyrrolidone (MW 40,000). After grinding, the
resulting homogenate was centrifuged at 26,000 g for 15 minutes. The supernatant was
decanted into a clean test tube and stored at –80˚C until assayed for ADH activity.
Shoots: Prior to root harvesting, shoots were removed from their root systems at
the transition region. Shoot height and weight were recorded along with any
measurements for pods. Shoots were then individually wrapped in aluminum foil,
immersed in liquid nitrogen and then transferred to a –80˚C freezer for storage until
chlorophyll assays were performed.
38
Assays
Root Hypoxia: The ADH assay was modified from McKee and Mendelssohn
(1987), Porterfield (1996),and Sigma Aldrich (quality-control document, product A3263),
and described in detail in Romagnano and Weathers (2004).
Chlorophyll: Prior to assay, shoots were removed from storage and thawed.
Number of leaves and leaf weight were recorded before the leaves were ground in a
mortar and pestle containing fine glass beads (< 1 mm diameter, enough to cover the
bottom) and 100% acetone (≈ 5 mL to start). Extraction was done in a darkened room to
prevent photobleaching of the chlorophyll. The acetone extract was then vacuum filtered
through Whatman #1 filter paper into a clean flask. Tissue was exhaustively extracted
until the ground material either turned completely white or freshly added acetone no
longer tinted green when ground with the leaves. Crude extract was then transferred
from the filtrate flask into a graduated cylinder. After the flask was rinsed three times
with acetone (using a squirt bottle to “spray” the sides), the final volume of the acetone
extract was measured. A 1:20 or 1:40 dilution of the extract with acetone was performed
and the O.D. of the resulting solution was measured at 664 nm, 647 nm, 630 nm and
chlorophyll a and b content calculated with an additional turbidity correction at 730 nm
according to (Jensen, 1978).
Gas Analyses
Ethylene: A Perkin-Elmer Sigma 3 gas chromatograph using a flame ionization
detector coupled with a poropak-N column (Supelco, Inc.) was used to separate ethylene
from 200 µL air samples drawn from either the shoot or root zone (Figure 5A). Carrier
gas flow-rate was 15 ml/min. The limit of detection was 7 ppm. Retention time for the

39
ethylene standard was at 0.83 min ± 0.005 min. Air samples were drawn using a 1 mL
syringe with 26 ga needle (Becton-Dickenson) from rubber septa located in the root and
shoot zone walls (Figure 5A). A Hewlett-Packard numerical integrator was used to record
peak data from the detector. Triplicate samples were taken just after media/air cycling
occurred in individual systems.
CO2 and O2: A Perkin-Elmer 8500 gas chromatograph using a hot wire detector
coupled to a Carboxen 1000 (Supelco, Inc) molecular sieve column was used to separate
and detect CO2 and O2. Aliquots of 200 µL samples were taken as described for ethylene.
Retention times for O2 and CO2 were 2.14 and 8.45 min ±0.05 min, respectively. Limits
of detection were 0.4% and 0.2% for O2 and CO2, respectively.
Data Analysis
The data presented are the result of two independent replicate runs for each
experimental system. Plant number indicates a plant’s position, not distance, from inlet to
outlet. Data from each experiment were gathered and entered into Microsoft Excel
(Microsoft, Redmond, WA) and analyzed using the data analysis expansion pack.
RESULTS
In evaluating pea plant responses to various modes of nutrient delivery over the
life cycle of the plant, we observed that, overall, plants grown in the porous tube system
were healthier and more productive than those grown in the other two systems. In no
case, however, did plants in any of the three systems produce mature seed.
Biomass/Morphology: Plants grown in the porous tube system had the highest
amount of shoot, root and leaf biomass (Figure 6 A, B, C). Whereas plants grown in the

40
drip and porous tube systems showed a steady decrease in shoot, root and leaf biomass
from inlet to outlet, plants grown in the porous tube system maintained a fairly uniform
biomass across the total length of the system (Figure 6 A, B, C) indicating that a more
uniform distribution of nutrients occurred via the porous tube. A similar trend was also
observed for shoot height and number of leaves (Figure 7 A, B). When data from all three
experimental systems are pooled, a general positive correlative trend was seen for shoot
height and leaf mass and also between root mass and leaf mass (Figure 8 A, B).
Achievement of Life Cycle Milestones: Through the first week of growth, plants
grown in the various delivery systems were consistent in time to germination and
emergence of first leaves (Figure 9). Beginning with tendril differentiation, however,
plants growing in the porous tube system began to show a delay in development when
compared to their counterparts in the mist and drip systems, 15 d on average compared to
11 d and 12 d for mist and drip systems, respectively (Figure 9). This delay carries
through to flowering and pod development. No plant in any system, however, produced
fully mature pods with set seed (Figure 9). This is interesting considering that plants
previously grown using a similar system but with an open shoot zone achieved mature
seed in 40 days (data not shown).
Hypoxic stress: Consistent with the higher biomass produced, plants grown in the
porous tube system had the lowest amount of specific ADH activity in their roots (Figure
6 D) indicating that they had the least hypoxic stress overall. Roots from plants grown in
the mist system and the drip controls showed increasing ADH activity, respectively
(Figure 6 D). In contrast to biomass, which decreased from inlet to outlet in plants from
the mist and drip systems, no apparent gradient in ADH activity was present. Low ADH

41
levels also appeared to correlate with higher biomass (leaf, shoot+leaf, and root) levels.
The decreasing pattern in biomass, porous tube > mist > drip systems, mirrored the
increasing ADH activity, porous tube<mist<drip. No correlative trends were seen
between ADH and chlorophyll, root mass, shoot mass, leaf mass, number of leaves or
shoot height (data not shown).
Figure 6. Biomass and hypoxic stress of peas harvested after 40 days growth from
drip, mist and porous tube systems. A, Average shoot (stem + leaves) fresh weight (g).
B. Average root fresh weight (g). C. Average leaf mass (g). D. Average specific ADH
activity. Bars mark high and low difference from the average of two independent
replicate experiments. Plant # is indicative of position from inlet, not distance.
ADH Activity
0
2
4
6
8
10
12
14
16
18
20
0 2 4 6 8 10
Plant #
Sp
ecif
ic A
DH
Acti
vit
y
(µ
mo
lNA
DH
ox/
min
mg
pro
tein
)
Drip
Mist
Porous Tube
Leaf Mass
0.00
0.20
0.40
0.60
0.80
1.00
1.20
1.40
1.60
0 2 4 6 8 10 12
Plant #
Leaf
Mass (
g)
Mist
Drip
Porous Tube
Root Fresh Wt.
0.0
0.2
0.4
0.6
0.8
1.0
1.2
1.4
1.6
1.8
0 2 4 6 8 10
Plant #
Ro
ot
Fre
sh W
eig
ht
(g)
Mist System
Drip Control
Porous Tube
Shoot F.W.
0.0
0.5
1.0
1.5
2.0
2.5
3.0
3.5
0 2 4 6 8 10
Plant #
Avg
. F.W
. (g
)
Sonic Nozzle
Drip Control
Porous Tube
A B
C DInlet
Inlet Inlet
InletOutlet
Outlet Outlet
Outlet

42
Chlorophyll: Specific chlorophyll levels increased in plants from all systems
from inlet to outlet (Figure 7 C). This increase is mirrored in both chlorophyll a and b
levels (data not shown) and is in contrast to what was observed for biomass (Figure 6 A,
B, C). Although the chlorophyll a/b ratio remained constant for leaves from all systems
across the length of the culture trough, the ratio in shoots from the drip system was higher
than from either the mist or porous tube systems (Figure 7 D). When total chlorophyll
levels from all the systems were pooled and compared with root and leaf weights, there
were generally negative correlation trends (Figure 8 C, D).
Gas Analyses
No ethylene was detectable in any system at any time before harvest. Although
analysis at harvest time showed possible trace levels of ethylene (~7ppm), the data were
not conclusive. Physiological indicators of ethylene, however, were observed and
included shortening of stressed shoots, leaf and flower senescence, and shortened,
yellow, curled pods (Figure 5 B). No changes from ambient (i.e., ~21% O2, ~0.1% CO2)
in either oxygen or carbon dioxide levels were observed in any of the systems in either
the root or shoot zones at any time. However, since samples were taken just after the
addition of nutrients and air into the root zone it is possible that this stability in gas levels
is the result of flushing rather than any physiological responses.

43
Figure 7. Shoot morphology and chlorophyll content of peas harvested after 40 days
growth from drip, mist and porous tube systems. A. Average shoot height (cm). B.
Average number of leaves per plant. C. Total chlorophyll content (mg gF.W.-1). D. chl a/
chl b ratio. Bars mark high and low difference from the average of two independent
replicate experiments.
Shoot Height
0
5
10
15
20
25
30
0 2 4 6 8 10
Plant #
Sh
oo
t H
eig
ht
(cm
)
Mist
Drip
Porous Tube
Total Chlorophyll
0.0
0.5
1.0
1.5
2.0
2.5
3.0
3.5
4.0
4.5
0 2 4 6 8 10
Plant #
To
tal C
hlo
ro
ph
yll
(m
g/
gF.W
.)
Mist
Drip
Porous Tube
#Leaves
0
20
40
60
80
100
120
140
0 2 4 6 8 10
Plant #
# L
eaves
MistDripPorous Tube
Chl. a/Chl. b Ratio
0.0
1.0
2.0
3.0
4.0
5.0
6.0
0 2 4 6 8 10
Plant #
Ch
l. a
/ C
hl.
b R
atio
MistDripPorous Tube
A B
C DInlet
Inlet Inlet
InletOutlet
Outlet Outlet
Outlet
44
Shoot Height vs. Leaf Mass
y = 9.9058x + 10.388
R2 = 0.6188
0
5
10
15
20
25
30
0 0.2 0.4 0.6 0.8 1 1.2 1.4 1.6
Leaf Mass (g)
Sh
oo
t H
eig
ht
(cm
)
Root Mass vs. Leaf Mass
y = 0.9146x + 0.338
R2 = 0.65
0.0
0.2
0.4
0.6
0.8
1.0
1.2
1.4
1.6
1.8
0 0.2 0.4 0.6 0.8 1 1.2 1.4 1.6
Leaf Mass (g)
Ro
ot M
ass (
g)
Total Chlorophyll vs. Root Mass
y = -1325.9x + 3749.5
R2 = 0.419
0
0.5
1
1.5
2
2.5
3
3.5
4
4.5
0.0 0.5 1.0 1.5 2.0
Root Mass (g)
To
tal C
hlo
ro
ph
yll (
mg
/g
leaf
mass)
Total Chlorophyll vs. Leaf Mass
y = -1443.7x + 3449.6
R2 = 0.386
0
0.5
1
1.5
2
2.5
3
3.5
4
4.5
0 0.2 0.4 0.6 0.8 1 1.2 1.4 1.6
Leaf Mass (g)
To
tal C
hlo
ro
ph
yll (
mg
/g
F.W
.)
A
C D
B
Figure 8. Correlations between different measured parameters for data pooled from all
three systems. A. Shoot height vs. leaf mass. B. Root mass vs. leaf mass. C. Total
chlorophyll vs. root mass. D. Total chlorophyll vs. leaf mass.

45
DISCUSSION
In order to simulate poor gas exchange conditions found in microgravity, the
environment of the plant growth chamber was sealed to prevent free gas exchange. This
allowed for an examination of the capabilities of the nutrient delivery systems to support
plant life by feeding gases only through the root zone irrespective of poor conditions in
the shoot zone. Furthermore, this work supplements previous studies, such as the
Chromex series of experiments and their ground-based follow-ups, in which the mode of
nutrient delivery was constant but aeration in the shoot zone varied (Musgrave, et al.,
1998; Crispi, et al., 1996; Porterfield, et al., 2000 b).
Taken together, data from the root and shoot biomass coupled with ADH activity
indicated that, in general, plants growing in the porous tube system were more productive
and suffered less hypoxic stress than those growing in the other two systems (Figure 2).
Furthermore, it appears that the porous tube system is better able to maintain uniform
Figure 9. Timeline of Developmental Milestones. G, germination; L, appearance of first
leaves; T, mature tendrils; F, flowering; P, pod formation; MP, mature pods. Superscripts
for P and MP symbols in the greenhouse row indicate average day observed. Open
chamber indicates plants grown in culture vessel in climate-control chamber with no
shoot zone enclosure and passive water-on-demand nutrient delivery.
46
plant growth than the other systems suggesting that there is a more homogenous
distribution of nutrients from inlet to outlet (Figures 2, 3 A, B). These results agree with
the original characterization of the system by Porterfield using dwarf wheat (Porterfield,
1996).
Although ethylene was barely detected analytically (7 ppm), physiological
evidence of its presence was seen. Plants that were more hypoxically stressed were
shorter, had senesced leaves and flowers, and produced pods that remained short,
yellowed and curled. Indeed the short, yellow, curled pea pod is strongly reminiscent of
the classic “triple response” assay originally described by Neljubow (1901) and used as a
bioassay for ethylene until the advent of gas chromatography. The premature senescence
of flowers and leaves seen in plants from all our experimental systems are also classic
ethylene symptoms documented by Beyer (1976). Also, the fact that developmental
milestones were attained later in plants from the porous tube system suggests that
premature aging in plants from the mist and drip systems could have been brought on by
hypoxic stress coupled with higher ethylene production.
Hypoxic stress alone may not be the only source of premature ethylene evolution.
The physical shape and depth of the root zone, particularly mechanical barriers, may play
a role in exacerbating excess ethylene production. Indeed, many of the primary roots
from plants in all systems were bent 90˚ from the vertical axis to subsequently travel
along the bottom of the culture trough (Figure 1 C). This is consistent with changes in
morphology seen by Schwarzbach et al. (1991) who observed increased ethylene
production by germinating pea seedlings when their shoots encountered a plexiglass
barrier. It is, thus, conceivable, that the bent roots (Figure 1C) harvested in these
47
experiments could be producing ethylene as a stress response. Although good
oxygenation would be expected in a shallow root zone it may be obviated by root
bending resulting in production of ethylene that disrupts reproductive development.
In addition to physical size requirements, attention must also be paid to obstacles
in the root zone. The porous tube, while ensuring a uniform distribution of medium into
the surrounding substrate, also presents a significant barrier for germinating radicles to
grow around; it also complicates root harvest. The latter point is relevant when one
considers an astronaut with limited time who must efficiently remove an old crop and
plant a new one. Although the mechanical barrier is not contributing to hypoxic stress, it
may be contributing to the overall concentration of ethylene in the system as evinced by
observed physiological indicators of ethylene.
There have been a number of studies to determine how liquid media moves out of
the porous tube into the surrounding substrate under microgravity conditions (Bingham et
al., 1996; Bingham et al., 1997; Jones and Or 1998; Salisbury, F.B., 1997; Yendler et al.,
1995). Liquid media flow experienced by plants growing under the normal gravity
conditions in which these experiments were conducted should be different than flows
under microgravity conditions. As such, benefits that the mist-based system could
potentially deliver, particularly the ability to directly inject and control gas composition
in the root zone (DiIorio, et al, 1992; Weathers, et al., 1997; Weathers et al., 1999;
Wyslouzil, et al., 2000) may not have become evident. For example, beet roots grown
under a controlled atmosphere with slightly elevated levels of CO2 attained a higher
biomass than those grown with a decreased level (DiIorio, et al., 1992; Weathers and
Zobel, 1992). Also considering that unused media could freely drain from the culture

48
vessels the formation of stagnant air or media pockets probably did not occur which is in
contrast to what likely occurs in microgravity (Porterfield, 2002). Furthermore, mist
penetration into the root-zone is likely to be affected by variations in the gravity vector.
Experiments under microgravity conditions would be more likely to truly ascertain the
performance capabilities of each system.
By using culture vessels with sealed shoot zones, this study shows that we
designed a good ground-based system for testing and developing more effective nutrient
delivery systems for growing plants in microgravity. This design allowed analysis of
plant growth where only root zone aeration was directly controlled. To our knowledge,
this is also the first time the porous tube system has been directly compared to another
active nutrient delivery system over the complete life cycle of a chosen plant species.
Although, in terms of ADH activity and biomass yields, the porous tube out-performed
the mist and drip control systems, the method used here to aerate the media fed into
porous tube system is not practical for use in microgravity and remains to be improved.
This study should be used as a starting point for refining methods of nutrient
delivery aimed at eliminating the formation of stagnant air and media pockets in the root
zones of plant systems used in microgravity. Microgravity studies in which multiple
modes of nutrient delivery are employed should provide insight not only into factors
affecting plant stress but also data for use in models of fluid movement through substrate
in microgravity.

49
ACKNOWLEDGEMENTS
The authors would like to thank Mary Musgrave (University of Connecticut) and
Marshall Porterfield (University of Missouri) for insight and guidance and Tom Dreschel
and Gary Stutte (Dynamac Corporation) for technical specifications and support. Finally,
thanks to Melissa Towler, Timothy Iskra, and other members of WPI’s plant research
group for comments, techniques and support. Financial support from WPI throughout the
course of this study is greatly appreciated.
50
CONCLUSIONS AND FUTURE WORK
The goal of this work was to understand how hypoxic stress experienced by plants
is impacted not only by mode of nutrient delivery but also by varying aeration rates into
the root zone. To this end, two studies were conducted. Both studies were the first time
that growth of plants in a porous tube system was compared to other active nutrient
delivery systems. The first study, presented in chapter one, sought to examine how
altering mode of nutrient delivery and aeration rates affected biomass and ADH activities
of germinating pea roots.
Effects of altering the length of the culture trough were also examined and
compared against hypoxic and normoxic controls. Roots grown using different modes of
nutrient delivery in short culture vessels all had comparable levels of biomass. ADH
levels for roots grown in the mist and porous tube systems were comparable to each other
and the normoxic control. When the length of the culture vessel was scaled up three-fold,
root biomass levels remained consistent not only between roots grown using the different
nutrient delivery systems, but also, with the exception of roots from the hypoxic control,
with roots from short culture trough systems. ADH levels from roots grown in all modes
of nutrient delivery were markedly higher in plants from the culture troughs than those
grown in short troughs. Roots grown using the porous tube system in its native
configuration (i.e., without aeration) had the highest levels of ADH activity. With the
addition of a moderate amount of aeration, however, ADH activities dropped to levels
comparable to the mist system. Addition of aeration (20 mL/min) to the drip control
system also resulted in greatly reduced ADH activity levels. A further increase in aeration
to the drip control system (200 ml/min), resulted in a decrease of ADH activity, although
51
it was not as great as the drop seen with the lower (20 mL/min) aeration rate. This also
suggests that other factors in the root zone, such as waterlogging or vessel size, may
contribute to hypoxic stress. These results demonstrated that the addition of aeration into
the root zone could effectively reduce amounts of hypoxic stress. The short length of time
that the peas were grown, however, did not allow for comparisons of plant health in the
shoot zone.
The second study sought to compare both shoot and root development among the
three modes of nutrient delivery. Unique to this study was the fact that the shoot zone in
the plant growth chamber was sealed and that aeration was provided strictly through the
root zone at the maximum rate (200 mL/min) used in the previous study. At harvest,
plants from the porous tube system had the highest shoot, root and leaf fresh weights, and
the lowest levels of ADH activities. Shoot height, number of leaves and total chlorophyll
levels were all roughly similar to each other. There was also a notable delay in reaching
the life cycle milestones of plants from the porous tube; this parallels a similar delay
observed for plants grown in the greenhouse or with an open shoot zone. Measured levels
of oxygen, and carbon dioxide did not deviate from ambient during the course of the
study. Ethylene was barely detected at analytical limits (~7ppm), and then only at
harvest.
Although plants from the porous tube system showed increased growth and lower
ADH levels, the mechanism used to aerate the medium reservoir is not feasible for use in
microgravity. During the course of the second study, no mature pods or seed were
produced. This problem may be eliminated when aeration is applied to both shoot and

52
root zones. More research is needed to determine optimal plant-growth conditions not
only for this species, but also for other CELSS candidate crop plants.
Once we have gained more practical knowledge and experience with optimized
nutrient delivery systems a key element of a bioregenerative life support system will be
attained. A complete system, however, still requires the integration of more elements.
For instance, the conversion of waste liquids into usable nutrient media still needs to be
integrated. Also, the disposal of solid organic matter (such as non-edible plant tissue),
and its subsequent conversion into available nutrients also needs to be pursued. Long
duration missions need to be designed so that even packaging materials can be converted
into a usable supply of nutrients. Spin-off technologies developed for CELSS projects
can also be used to handle waste processes on a large scale. Only when these goals are
achieved will we truly be able to break the bonds that tie us to mother Earth and set sail
(solar or otherwise) to the stars.

53
REFERENCES
Beyer, EM. 1976. A potent inhibitor of ethylene action in plants. Plant Physiology.58: 268-271.
Bingham, G.E., Jones, S.B., Or, D., Podolskie, I., Levinskikh, M.A., Sychev, V., Ivanova,T., Kostov, P., Sapunova, S, Dandolov, I, Bubenheim, D.B., and Jahns, G. 1997.Microgravity effects on water supply and substrate properties in porous matrixroot support systems. 48th International Astronautical Congress, Turin, Italy,October 6-10. Reprint IAF/IAA-97-G.3.03
Bingham, G.E., Jones, S.B., Podolski, I., and Yendler, B. 1996. Porous substrate waterrelations observed during the greenhouse in flight experiment (MIR Space Station– 1995), SAE Technical Paper Series: 961547
Bradford MM. 1976. A rapid and sensitive method for the quantification of microgramquantities of protein utilizing the principle of protein dye binding. AnalyticalBiochemistry 72: 248-254.
Crispi, M.L., Porterfield, D.M., Murgia, M., Musgrave, M.E. 1996. Role of metabolicgases in reproductive failure under spaceflight conditions: ground based studieswith Arabidopsis. S.A.E. Transactions 105: 311-315.
DiIorio, A.A., Cheetham, R.D., Weathers, P.J. 1992. Carbon dioxide improves thegrowth of hairy roots cultured on solid medium and in nutrient mists. AppliedMicrobiology and Biotechnology 37:463-467.
Dreschel, T.W., Brown, C.S., Piastuch, W.C., Hinkle, C.R., Knott, W.M. 1994. Poroustube nutrient delivery system development: a device for nutrient delivery inmicrogravity. Advances in Space Research 14: 47-51.
Drew, MC. 1997. Oxygen deficiency and root metabolism: injury and acclimation underhypoxia and anoxia. Annual Review Plant Physiology Plant Molecular Biology48:223-250.
Duffie, N.A., Zhou, W., Morrow, R.C., Bula, R.J., Tibbitts, T.W., Wranovsky, S.R.,Macaulay, P.D. 1995. Control and monitoring of the environmental parameters inthe astroculture flight experiment. SAE Technical Paper Series. 951627.
Heathcote D.G., Brown C.S., Goins G.D., Kliss, M., Levine, H., Lomax, P.A., Porter,R.L., Wheeler R. 1996. The plant research unit: long-term plant growth supportfor space station. Proceedings. 6th European Symposium On Life-SciencesResearch in Space. ESA SP-390.
54
Jensen, A. 1978. Chlorophylls and carotenoids. In: Hellebust JA, Craigie JS, eds.Handbook of phycological methods: physiological and biochemical methods.Cambridge University Press: Cambridge, pp. 59-70.
Jones, S.B. and Or, D. 1998. Microgravity effects on water flow and distribution inunsaturated porous media; analyses of flight experiments. Water ResourceResearch 35: 929-942.
Kim, Y., Weathers, P.J., Wyslouzil, B.E. 2002 The growth of Artemisia annua hairyroots in liquid and gas phase reactors. Biotechnology and Bioengineering 80:454-464
Kordyum, E.L., Sytnik, K.M., Chernyaeva, I.I. 1983. Peculiarities of genital organformation in Arabidopsis thaliana (L.) Heynh. under spaceflight conditions.Advances in Space Research 3: 247-250.
Kuang, A., Musgrave, M.E., Matthews, S.W. 1996. Modification of reproductivedevelopment in Arabidopsis thaliana under spaceflight conditions. Planta. 198:588-594.
Levine, HG, Piastuch, WC, Dreschel, TW. 2001. Development of a microgravity-ratedhydroponic plant culture apparatus. Personal communication. DynamacCorporation. Kennedy Space Center, FL 32899.
Levine, H.G., Piastuch, W.C., Dreschel, T.W. 1999. Development of a microgravity-ratedhydroponic plant culture apparatus. Proceedings 36th Space Congress. 295-302.
Mashinsky, A., Ivanova, I., Derendyaeva, T., Nechitailo, G., Salisbury, F. 1994. “Fromseed-to-seed” experiment with wheat plants under space-flight conditions.Advances in Space Research 14: 13-19.
McKee, K.L., Mendelssohn, I.A. 1987. Root metabolism in the black mangrove(Avicennia germinans (L.) L): response to hypoxia. Environmental andExperimental Botany. 27: 147-156.
Merkys, A.I., Laurinavicius, R.S. 1983. Complete cycle of individual development ofArabidopsis thaliana (L.) Heynh. plants on board the Salyut-7 orbital station.Doklady Akademii Nauk SSSR 271: 509-512.
Monje, O., Stutte, G.W., Goins G.D., Porterfield, D.M. and Bingham, G.E. 2003.Farming in Space: Environmental and Biophysical Concerns. Advances in SpaceResearch. 31(1): 151-167.
Moore, R, Clark, WD, Vodopich DS. 1998. Botany. WCB/McGraw-Hill.

55
Morrow, R.C., Duffie, N.A., Tibbits, T.W., Bula, R.J., Barta, D.J., Ming, D.W., Wheeler,R.M., Porterfield, D.M. 1995. Plant responses in the AstrocultureTM flightexperiment unit. SAE Technical Paper Series: 951624.
Mortensen, LM. 1989. Effect of ethylene on growth of greenhouse lettuce at differentlight and temperature levels. Scientia horticulturae (Amsterdam). 39 (2).
Musgrave, M.E., Kuang, A., Matthews, S.W. 1997. Plant reproduction duringspaceflight: importance of the gaseous environment. Planta. 203: S177-S184.
Musgrave, M.E., Kuang, A., Xiao, Y., Stout, S.C., Bingham, G.E., Briarty, L.G.,Levinskikh, M.A., Sychev, V.N., Podolski, I.G. 2000. Gravity independence ofseed-to-seed cycling in Brassica rapa. Planta 210: 400-406.
Musgrave,ME, Kuang, A, Brown, C.S., Matthews, S.W. 1998. Changes in Arabidopsisleaf ultrastructure, chlorophyll and carbohydrate content during spaceflightdepends on ventilation. Annals of Botany. 81: 503-512.
Nechitailo, G.S., Mashinsky, A.L.. 1993. Space biology: studies at orbital stations. MirPublishers, Moscow. pp. 324-330.
Neljubow, D.N. 1901. Uber die horizontale nutation der stengel von Pisum sativum undeiniger anderere pflanzen. Pflanzen Beitrage und Botanik Zentralblatt 10: 128-138.
Olson, RL, Oleson, MV, Slavin, TJ. 1988. CELSS for advanced manned missions.HortSci. 23: 275-286.
Porterfield, D.M., Crispi, M.L., Musgrave, M.E. 1997. Changes in soluble sugar, starchand alcohol dehydrogenase in Arabidopsis thaliana exposed to N2 dilutedatmospheres. Plant Cell Physiology. 38: 1354-1358.
Porterfield, D.M., Daugherty, C.J., Matthews, S.W., Musgrave, M.E. 1994. Evidence ofhypoxia in the roots of Arabidopsis thaliana during spaceflight. American Societyof Gravitational and Space Biology Bulletin. 8: 14.
Porterfield, D.M., Dreschel, T.W., and Musgrave, M.E.. 2000a. A ground-basedcomparison of nutrient delivery technologies originally developed for growingplants in the spaceflight environment. HortTechnology 10: 179-185.
Porterfield, D.M., Monje, O., Stutte, G.W., and M.E. Musgrage. 2000b. Rootzonehypoxic responses result from inhibition of gravity dependant oxygen transport inmicrogravity. Gravitational and Space Biology Bulletin 14: 50.
56
Porterfield, D.M., Neichitailo, G.S., Mashinski, A.L. and Musgrave, M.E. 2003.Spaceflight Hardware for Conducting Plant Growth Experiments in Space: TheEarly Years 1960-2000. Advances in Space Research. 31: 183-193.
Porterfield, D.M. 1996. Characterization of physiological changes in roots grown inspaceflight conditions: a comparison of nutrient delivery technologies. DoctoralDissertation. Department of Plant Pathology and Crop Physiology. LouisianaState University.
Porterfield, D.M. 2002. The biophysical limitations in physiological transport andexchange in plants grown in microgravity. Journal of Plant Growth Regulation,21: 177-190.
Reuveni, J, Bugbee, B. 1997. Very high CO2 reduces photosynthesis, dark respiration andyield in wheat. Annals of Botany. 80: 539-546.
Romagnano, J, Weathers, P.J. 2004. Media aeration affects hypoxic stress in germinatingpea roots more than mode of media delivery. Submitted for publication.
Salisbury, F.B. 1997. Growing super-dwarf wheat in space station Mir. Life SupportBiosphere Science. 4: 155-166.
Schwarzbach, D.A., Woltering, E.J. and Saltveit, M.E. 1991. Behavior of etiolated peas(Pisum sativum cv Alaska) when obstructed by a mechanical barrier. PlantPhysiology, 98: 769-773.
Tibbitts, T.W., Cao, W., Frank, T. 1995. Development of a siphon system with poroustubes for maintaining a constant negative water pressure in a rooting matrix.Biotronics. 24: 7-14.
Turner, M., Lomax, P., Kelly, A., Porter, R., Cobb, M., Heathcote, D. 1999.Development of the plant research unit for use on space station. SAE TechnicalPapers. 951623.
Weathers, P.J., Wyslouzil, B.E., Whipple, M. 1997. Laboratory-scale studies of nutrientmist reactors for culturing hairy roots. Hairy Roots. (P.M. Doran, ed.) Gordan &Breach/Harwood Academic, U.K. 191-200.
Weathers, P.J., Wyslouzil, B.E., Wobbe, K.K., Kim, Y.J., Yigit, E. 1999. Workshop onbioreactor technology: the biological response of hairy roots to O2 levels inbioreactors. In Vitro Cellular and Developmental Biology Plant. 35: 286-289.
Weathers, P.J., Zobel, R.W. 1992. Aeroponics for the culture of organisms, tissues andcells. Biotechnology Advances 10: 93-115.
57
Wheeler, R.M., Mackowiak, C.L., Yorio, N.C., and Sager, J.C. 1999. Effects of CO2 onstomatal conductance: Do stomata open at very high CO2 concentrations. Annalsof Botany 83: 243-251.
Wyslouzil, B.E., Waterbury, R.G., Weathers, P.J. 2000. The growth of single roots ofArtemisia annua in nutrient mist reactors. Biotechnology and Bioengineering 70:143-150.
Yendler, B., Bingham, G.E., Jones, S.B, and Podolsky, I. 1995. Moisture sensor for usein microgravity. SAE Technical Paper Series: 951471.

58
Appendix ASchematic of System Configurations
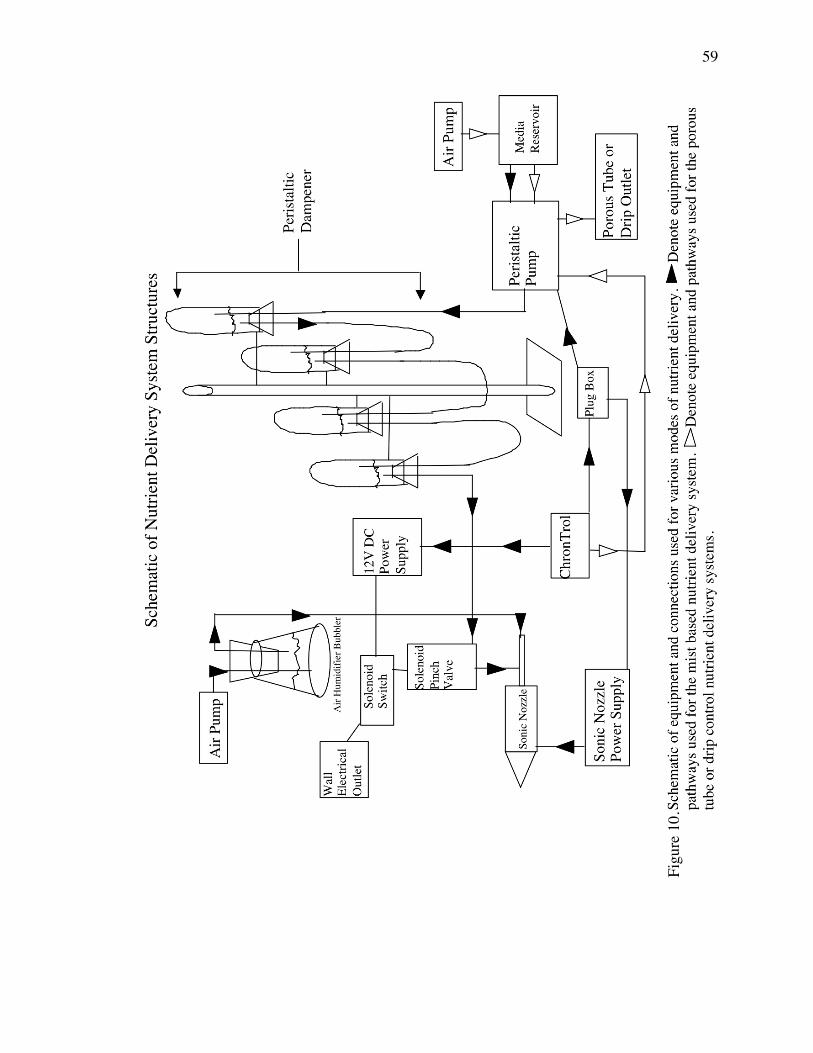
59
Figu
re 1
0.

60
Appendix BGas Analysis Protocols

61
EthylenePerkin Elmer Sigma 3 FID Gas Chromatograph
1. Close oven lid.
2. Turn Power “ON”.
3. Turn Recorder Power “ON”.
4. Hold “Zone Temp” button down, while pressing in sequence:“CE MOD”, “1”, “0”, “0” and “ENTER”.
5. Hold “Init Temp” button down, while pressing in sequence:“CE MOD”, “5”, “0” and “ENTER”.
6. Hold “Final Temp” button down, while pressing in sequence:“CE MOD”, “5”, “0” and “ENTER”.
7. Hold “Init Time” button down while pressing in sequence:“CE MOD”, “0”, “0”, “0” and “ENTER”.
8. Turn on all three gas regulators:Ultrazero air, 50psi ; Hi Pure N2, 80psi ; H2, 30psi all at regulator.
9. For C2H2: set carrier flow 15 ml/min for column A . Column: Poropak N.
10. Wait until all three “Not Ready” lights go off. (about 5 minutes)
11. Pull “Hydrogen A” toggle switch towards you (open) and leave it open for about15s. Close it again by pushing it back. Press “Ignite A” button while openingtoggle switch again. You should hear a definite POP and the pen should jump.
12. Confirm ignition: Open panel to right of injector ports and hold smooth metalsurface in front of each vent. Condensation on metal indicates ignition. If it is notlit, close toggle switch and repeat ignition process (# 11 above).
13. Wait 30 minutes, or until all “Not Ready” lights go off, then press “ready” button.
14. Turn on numerical integrator. Assay time is 1 minute. Set the integrator to thefollowing parameters: Stop, 1 min; Threshold 1. All other settings are integratordefault.
15. Rinse out 100µL Gas-Tight syringe with dH2O to check for free flow.

62
16. Inject 200µL into upper injection port. Ethylene comes off at approx. 0.8 min,(see example chromatogram).
To Turn off GC (Approx. 10 minutes after last peak)
1. Put syringe away in drawer.
2. Turn off integrator.
3. Close Hydrogen A toggle switch (push back).
4. Turn power “OFF”.
5. Close all gas regulators tightly. Hydrogen won’t go all the way off immediately(the needle will eventually fall), but it doesn’t matter. Compressed air must go allthe way off, as judged by needle on 0-4000 regulator gauge (i.e. needle must go to0).
Notes
C2H2: polarity – atten. x 1. range x 1 detector A.
Figure 11. Example chromatogram of an ethylene standard.

63
Figure 12. Printout of HWD GCmethods section for CO2detection.
Oxygen and Carbon Dioxide
Perkin Elmer 8500 HWD Gas Chromatograph
Assumes instruction manual read and some basic software navigation skills. Adaptedfrom “Application Note 10” by Supelco, Inc.
1. Turn on GP-100 printer.
2. Check septa for holes.
3. Turn on Helium tank (92 psi line pressure, no less than 500 psi in tank)
4. In “Carrier Gas” control panel:
a. Supply off onb. Column A mode flow pressurec. Column B mode flow pressure
5. Turn machine on, wait till initialization is over.
6. Press F6 “Recall Method,” select #5 “carboxen 3” and press enter.
7. Check that method matches sample (press “accept section” to move to nextsection)

64
8. When satisfied, press F1 “Accept Method” when in Section 1 of Methods section.This brings you to the run-screen.
9. Press “InstTerm” button to call up “Terminal Functions” screen.
10. Select F6 “Plot/Replot” to call up “Plot Control” screen.
a. Set “Attn” (attenuation) to 8b. Set “Plot Run” to NOc. Press “InstTerm” button to accept changes and bring back to run-screen.
11. Run protocol without injection twice to clean & purge the column. Start run bypressing “run” button.
12. Once baseline has settled, run air sample spiked with CO2.
a. Inject 200 µL sample into column “A” and press “Run” button.
13. Machine automatically stops sampling at indicated time.
14. Report screen is automatically displayed at end of run. Select F3 “PrintReports”to print a copy of the report.
15. Press F8 “Return to Index” to go back to the “Terminal Functions” screen.
a. Select F6 “Plot/Replot” to go to the “Plot Control” screen.b. Press the “Page” key to go to the replot screen.c. Select F6 “Replot on P/P” to print a chromatogram of the sample.
Example chromatogram is from a 500 µL air sample from an aerial port.Oxygen and Nitrogen do not completely resolve. At an attenuation of 8 O2and N2 peaks are off-scale.
Figure 13. Printout of HWD GCchromatogram for CO2 standard.

65
d. You MUST be in front of printer while chromatogram is printing!!! Ifprinting stops, rapidly turn printer off and on to continue. If you miss andthe printer stops too long you will have to shut the entire machine off andstart over!
16. Press “InstTerm” to go back to run screen. Repeat 12a-15 for each sample.
17. To shut down machine from run screen:
a. Press “InstTerm” to call up “Terminal Functions” screen.b. Select F1 “Method” to go to the “Current Method” screen.c. Press F3 “Modify Section 1”d. Press number 0 on numeral keypad and then F8 “HWD Range” to stop
current from running through the detector. THIS IS IMPORTANT, as itwill keep the wires in the HWD detector from breaking.
18. Turn power off, reverse “carrier gas” switches, turn tank off, turn printer off.

66
Appendix CBuffer, Extraction, and ADH Assay
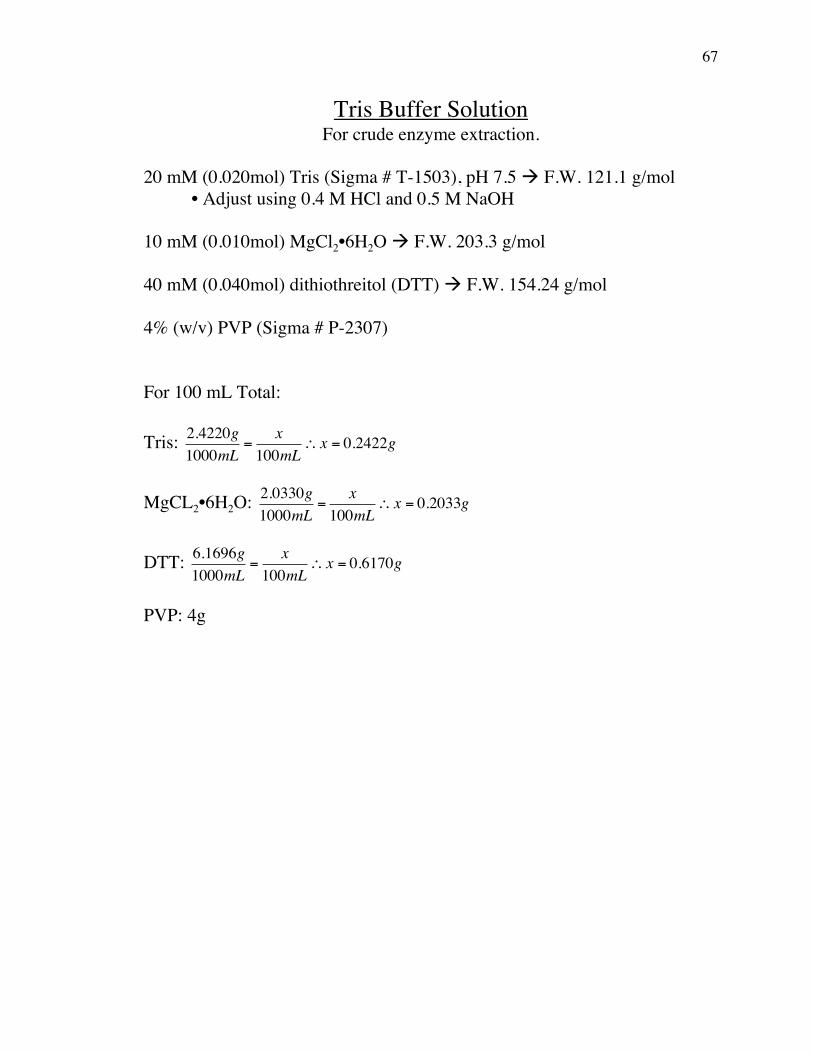
67
Tris Buffer SolutionFor crude enzyme extraction.
20 mM (0.020mol) Tris (Sigma # T-1503), pH 7.5 F.W. 121.1 g/mol• Adjust using 0.4 M HCl and 0.5 M NaOH
10 mM (0.010mol) MgCl2•6H2O F.W. 203.3 g/mol
40 mM (0.040mol) dithiothreitol (DTT) F.W. 154.24 g/mol
4% (w/v) PVP (Sigma # P-2307)
For 100 mL Total:
Tris:
€
2.4220g1000mL
=x
100mL∴ x = 0.2422g
MgCL2•6H2O:
€
2.0330g1000mL
=x
100mL∴ x = 0.2033g
DTT:
€
6.1696g1000mL
=x
100mL∴ x = 0.6170g
PVP: 4g
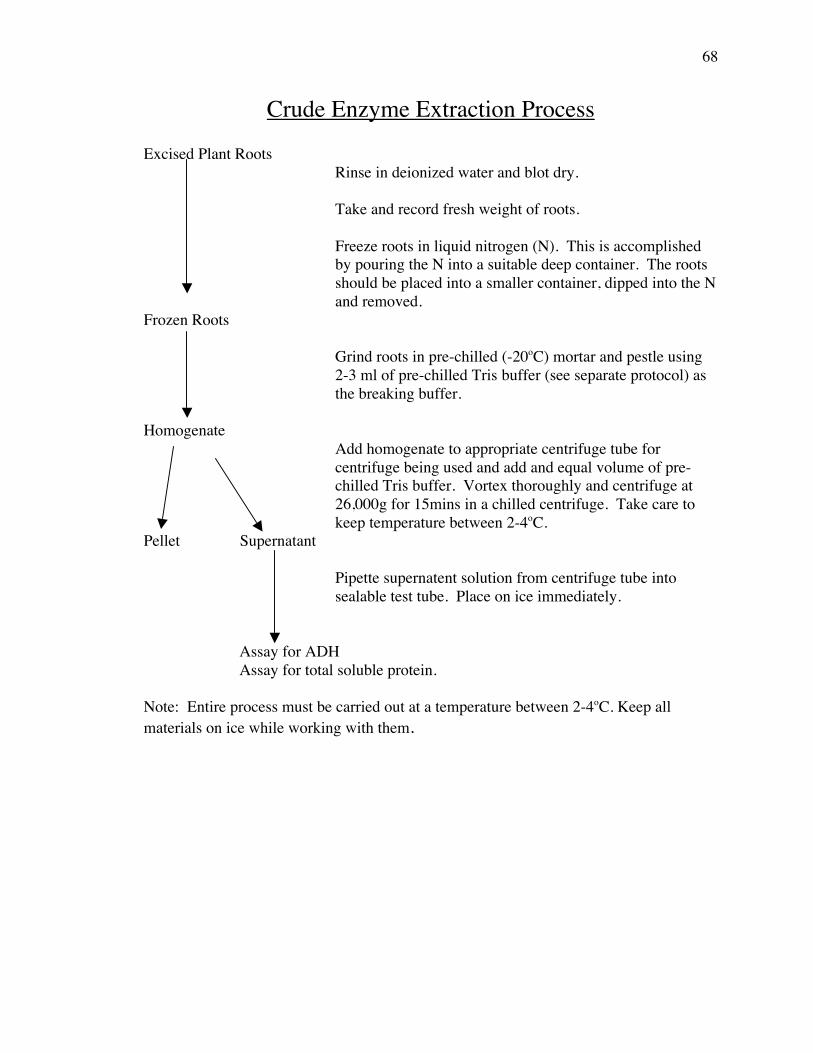
68
Crude Enzyme Extraction Process
Excised Plant RootsRinse in deionized water and blot dry.
Take and record fresh weight of roots.
Freeze roots in liquid nitrogen (N). This is accomplishedby pouring the N into a suitable deep container. The rootsshould be placed into a smaller container, dipped into the Nand removed.
Frozen Roots
Grind roots in pre-chilled (-20oC) mortar and pestle using2-3 ml of pre-chilled Tris buffer (see separate protocol) asthe breaking buffer.
HomogenateAdd homogenate to appropriate centrifuge tube forcentrifuge being used and add and equal volume of pre-chilled Tris buffer. Vortex thoroughly and centrifuge at26,000g for 15mins in a chilled centrifuge. Take care tokeep temperature between 2-4oC.
Pellet Supernatant
Pipette supernatent solution from centrifuge tube intosealable test tube. Place on ice immediately.
Assay for ADHAssay for total soluble protein.
Note: Entire process must be carried out at a temperature between 2-4oC. Keep allmaterials on ice while working with them.
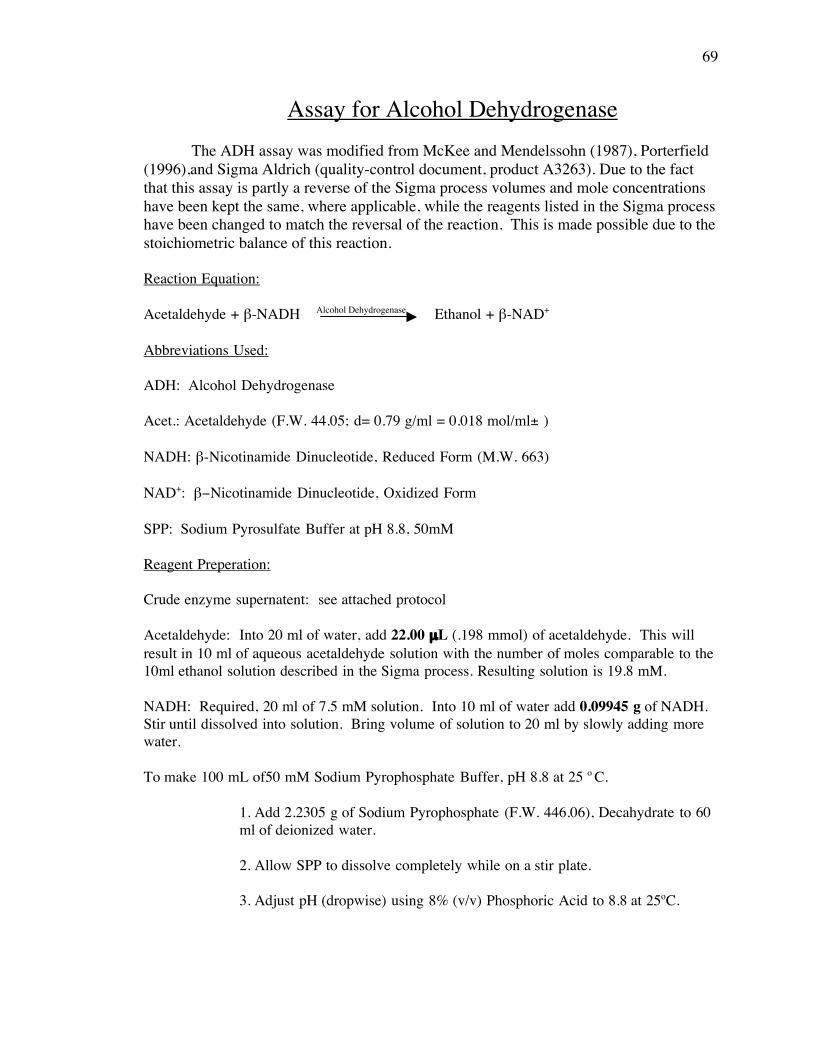
69
Assay for Alcohol DehydrogenaseThe ADH assay was modified from McKee and Mendelssohn (1987), Porterfield
(1996),and Sigma Aldrich (quality-control document, product A3263). Due to the factthat this assay is partly a reverse of the Sigma process volumes and mole concentrationshave been kept the same, where applicable, while the reagents listed in the Sigma processhave been changed to match the reversal of the reaction. This is made possible due to thestoichiometric balance of this reaction.
Reaction Equation:
Acetaldehyde + β-NADH Alcohol Dehydrogenase Ethanol + β-NAD+
Abbreviations Used:
ADH: Alcohol Dehydrogenase
Acet.: Acetaldehyde (F.W. 44.05; d= 0.79 g/ml = 0.018 mol/ml± )
NADH: β-Nicotinamide Dinucleotide, Reduced Form (M.W. 663)
NAD+: β−Nicotinamide Dinucleotide, Oxidized Form
SPP: Sodium Pyrosulfate Buffer at pH 8.8, 50mM
Reagent Preperation:
Crude enzyme supernatent: see attached protocol
Acetaldehyde: Into 20 ml of water, add 22.00 µL (.198 mmol) of acetaldehyde. This willresult in 10 ml of aqueous acetaldehyde solution with the number of moles comparable to the10ml ethanol solution described in the Sigma process. Resulting solution is 19.8 mM.
NADH: Required, 20 ml of 7.5 mM solution. Into 10 ml of water add 0.09945 g of NADH.Stir until dissolved into solution. Bring volume of solution to 20 ml by slowly adding morewater.
To make 100 mL of50 mM Sodium Pyrophosphate Buffer, pH 8.8 at 25 o C.
1. Add 2.2305 g of Sodium Pyrophosphate (F.W. 446.06), Decahydrate to 60ml of deionized water.
2. Allow SPP to dissolve completely while on a stir plate.
3. Adjust pH (dropwise) using 8% (v/v) Phosphoric Acid to 8.8 at 25oC.
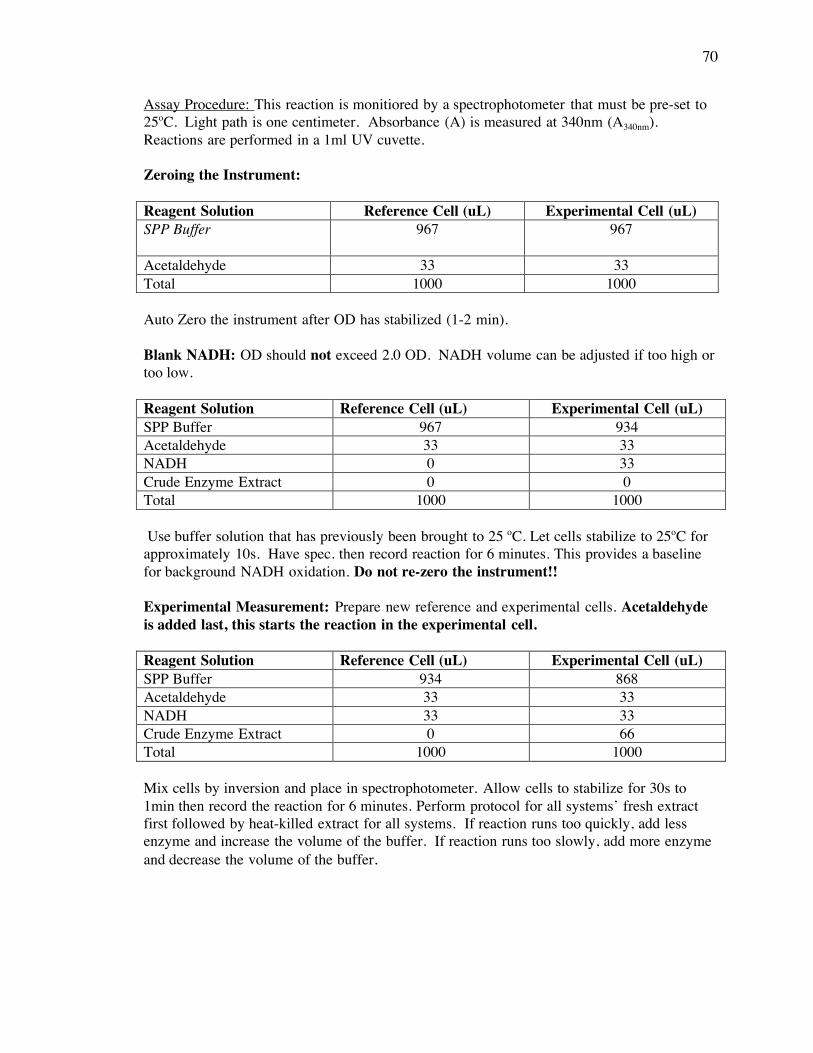
70
Assay Procedure: This reaction is monitiored by a spectrophotometer that must be pre-set to25oC. Light path is one centimeter. Absorbance (A) is measured at 340nm (A340nm).Reactions are performed in a 1ml UV cuvette.
Zeroing the Instrument:
Reagent Solution Reference Cell (uL) Experimental Cell (uL)SPP Buffer 967 967
Acetaldehyde 33 33Total 1000 1000
Auto Zero the instrument after OD has stabilized (1-2 min).
Blank NADH: OD should not exceed 2.0 OD. NADH volume can be adjusted if too high ortoo low.
Reagent Solution Reference Cell (uL) Experimental Cell (uL)SPP Buffer 967 934Acetaldehyde 33 33NADH 0 33Crude Enzyme Extract 0 0Total 1000 1000
Use buffer solution that has previously been brought to 25 oC. Let cells stabilize to 25oC forapproximately 10s. Have spec. then record reaction for 6 minutes. This provides a baselinefor background NADH oxidation. Do not re-zero the instrument!!
Experimental Measurement: Prepare new reference and experimental cells. Acetaldehydeis added last, this starts the reaction in the experimental cell.
Reagent Solution Reference Cell (uL) Experimental Cell (uL)SPP Buffer 934 868Acetaldehyde 33 33NADH 33 33Crude Enzyme Extract 0 66Total 1000 1000
Mix cells by inversion and place in spectrophotometer. Allow cells to stabilize for 30s to1min then record the reaction for 6 minutes. Perform protocol for all systems’ fresh extractfirst followed by heat-killed extract for all systems. If reaction runs too quickly, add lessenzyme and increase the volume of the buffer. If reaction runs too slowly, add more enzymeand decrease the volume of the buffer.

71
Appendix DBradford Protein Assay Protocol
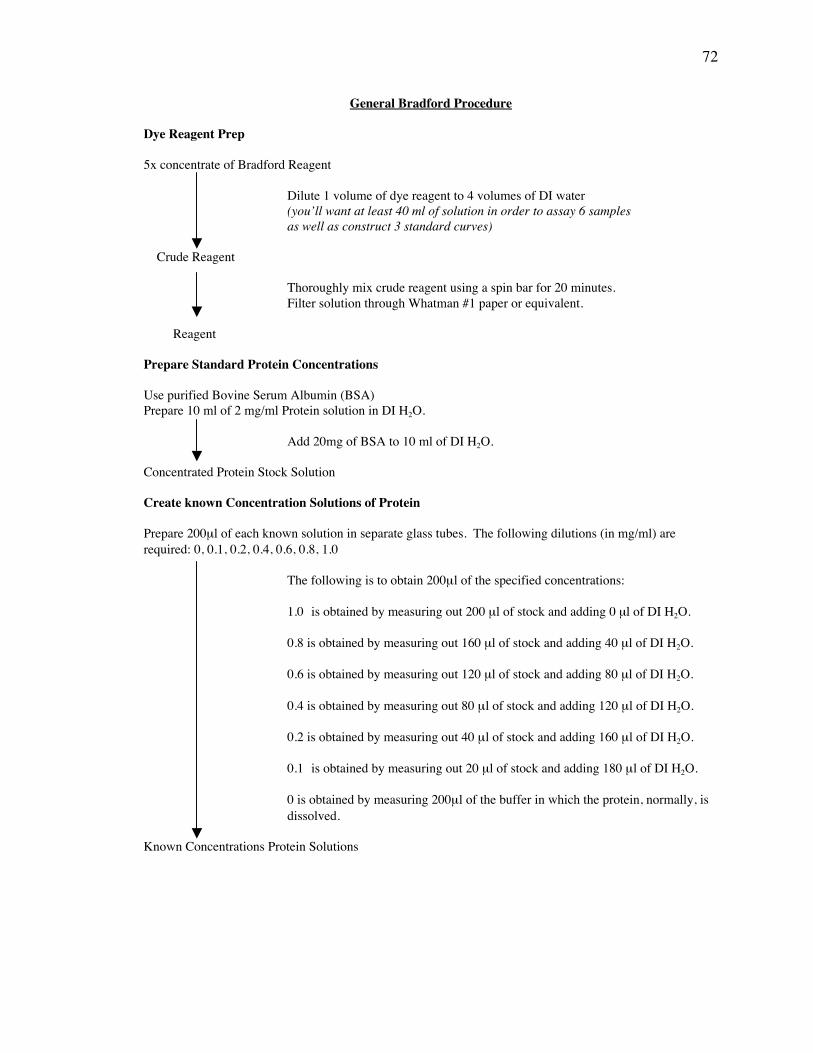
72
General Bradford Procedure
Dye Reagent Prep
5x concentrate of Bradford Reagent
Dilute 1 volume of dye reagent to 4 volumes of DI water(you’ll want at least 40 ml of solution in order to assay 6 samplesas well as construct 3 standard curves)
Crude Reagent
Thoroughly mix crude reagent using a spin bar for 20 minutes.Filter solution through Whatman #1 paper or equivalent.
Reagent
Prepare Standard Protein Concentrations
Use purified Bovine Serum Albumin (BSA)Prepare 10 ml of 2 mg/ml Protein solution in DI H2O.
Add 20mg of BSA to 10 ml of DI H2O.
Concentrated Protein Stock Solution
Create known Concentration Solutions of Protein
Prepare 200µl of each known solution in separate glass tubes. The following dilutions (in mg/ml) arerequired: 0, 0.1, 0.2, 0.4, 0.6, 0.8, 1.0
The following is to obtain 200µl of the specified concentrations:
1.0 is obtained by measuring out 200 µl of stock and adding 0 µl of DI H2O.
0.8 is obtained by measuring out 160 µl of stock and adding 40 µl of DI H2O.
0.6 is obtained by measuring out 120 µl of stock and adding 80 µl of DI H2O.
0.4 is obtained by measuring out 80 µl of stock and adding 120 µl of DI H2O.
0.2 is obtained by measuring out 40 µl of stock and adding 160 µl of DI H2O.
0.1 is obtained by measuring out 20 µl of stock and adding 180 µl of DI H2O.
0 is obtained by measuring 200µl of the buffer in which the protein, normally, isdissolved.
Known Concentrations Protein Solutions
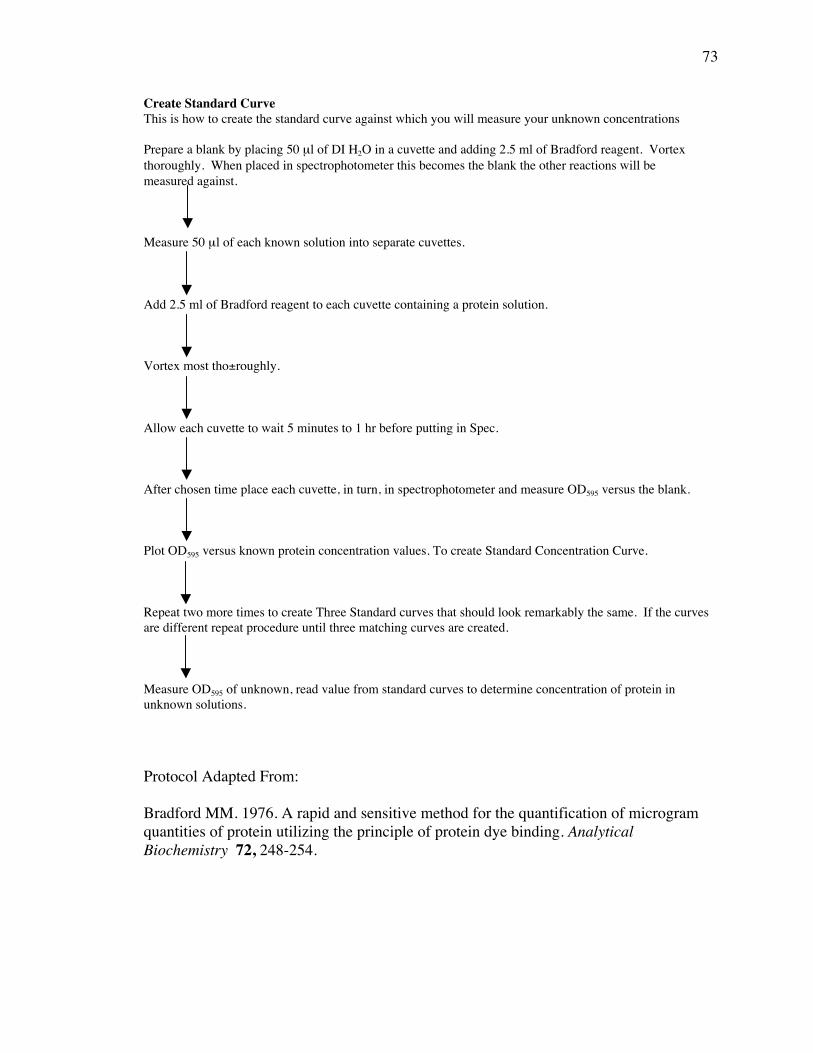
73
Create Standard CurveThis is how to create the standard curve against which you will measure your unknown concentrations
Prepare a blank by placing 50 µl of DI H2O in a cuvette and adding 2.5 ml of Bradford reagent. Vortexthoroughly. When placed in spectrophotometer this becomes the blank the other reactions will bemeasured against.
Measure 50 µl of each known solution into separate cuvettes.
Add 2.5 ml of Bradford reagent to each cuvette containing a protein solution.
Vortex most tho±roughly.
Allow each cuvette to wait 5 minutes to 1 hr before putting in Spec.
After chosen time place each cuvette, in turn, in spectrophotometer and measure OD595 versus the blank.
Plot OD595 versus known protein concentration values. To create Standard Concentration Curve.
Repeat two more times to create Three Standard curves that should look remarkably the same. If the curvesare different repeat procedure until three matching curves are created.
Measure OD595 of unknown, read value from standard curves to determine concentration of protein inunknown solutions.
Protocol Adapted From:
Bradford MM. 1976. A rapid and sensitive method for the quantification of microgramquantities of protein utilizing the principle of protein dye binding. AnalyticalBiochemistry 72, 248-254.

74
t