aerocapture performance analysis of a venus … · aerocapture performance analysis of a venus...
TRANSCRIPT

Aerocapture Performance Analysis of a Venus Exploration Mission
Brett R. Starr* and Carlos H. Westhelle,†
NASA’s Langley Research Center, Hampton, Virginia, 23681-2199 NASA’s Johnson Space Center, Houston, Texas, 77058
A performance analysis of a Discovery Class Venus Exploration Mission in which aerocapture is used to capture a spacecraft into a 300km polar orbit for a two year science mission has been conducted to quantify its performance. A preliminary performance assessment determined that a high heritage 70° sphere-cone rigid aeroshell with a 0.25 lift to drag ratio has adequate control authority to provide an entry flight path angle corridor large enough for the mission’s aerocapture maneuver. A 114 kg/m2 ballistic coefficient reference vehicle was developed from the science requirements and the preliminary assessment’s heating indicators and deceleration loads. Performance analyses were conducted for the reference vehicle and for sensitivity studies on vehicle ballistic coefficient and maximum bank rate. The performance analyses used a high fidelity flight simulation within a Monte Carlo executive to define the aerocapture heating environment and deceleration loads and to determine mission success statistics. The simulation utilized the Program to Optimize Simulated Trajectories (POST) that was modified to include Venus specific atmospheric and planet models, aerodynamic characteristics, and interplanetary trajectory models. In addition to Venus specific models, an autonomous guidance system, HYPAS, and a pseudo flight controller were incorporated in the simulation. The Monte Carlo analyses incorporated a reference set of approach trajectory delivery errors, aerodynamic uncertainties, and atmospheric density variations. The reference performance analysis determined the reference vehicle achieves 100% successful capture and has a 99.87% probability of attaining the science orbit with a 90 m/s ∆V budget for post aerocapture orbital adjustments. A ballistic coefficient trade study conducted with reference uncertainties determined that the 0.25 L/D vehicle can achieve 100% successful capture with a ballistic coefficient of 228 kg/m2 and that the increased ballistic coefficient increases post aerocapture ∆V budget to 134 m/s for a 99.87% probability of attaining the science orbit. A trade study on vehicle bank rate determined that the 0.25 L/D vehicle can achieve 100% successful capture when the maximum bank rate is decreased from 30 deg/s to 20 deg/s. The decreased bank rate increases post aerocapture ∆V budget to 102 m/s for a 99.87% probability of attaining the science orbit.
* Aerospace Engineer, Exploration Systems Engineering Branch, 100 NASA Rd, MS489, Member AIAA † Aerospace Engineer, Aeroscience and Flight Mechanics Division, 2101 NASA Parkway, Member AIAA
American Institute of Aeronautics and Astronautics
1
https://ntrs.nasa.gov/search.jsp?R=20050232788 2018-07-03T11:37:57+00:00Z

Nomenclature AFE = Aeroassist Flight Experiment C.G. = Center of gravity CA = Aerodynamic axial force coefficient CN = Aerodynamic normal force coefficient DOF = Degrees of Freedom GRAM = Global Reference Atmospheric Model HYPAS = Hybrid Predictor-corrector Aerocapture Scheme JPL = Jet Propulsion Laboratory L = Aerodynamic reference length L/D = lift to drag ratio POST = Program to Optimize Simulated Trajectories TPS = Thermal Protection System VIRA = Venus International Reference Atmosphere αtrim = Trim angle of attack ∆V = Change in velocity
I. Introduction n analysis of a Discovery Class Venus Exploration Mission in which aerocapture is used to place a spacecraft into a 300km polar orbit for a two year science mission has been conducted to quantify the performance of a
70° sphere-cone aeroshell configuration used for the aerocapture portion of the mission. The Venus exploration mission has science scoped for NASA’s Discovery Program and science priorities derived from sources such as the Solar System Exploration Decadal Survey and the prime-investigators of the Discovery Program proposals for Venus missions. Venus planetary rotation provides full longitudinal coverage, allowing for in-depth exploration of the planet with a proposed IR imaging spectrometer with 200m resolution, microwave radiometer, and low-energy neutral and charged particle detectors.
A
The analysis studied launch dates of October 21st to November 11th, 2013, using a Delta 2925H-10 launch vehicle. The mission transit time is 159 days in a Type I trajectory. Arrival at Venus is April 7th, 2014 with an arrival entry velocity of 11.25 km/s.
A. Aerocapture Overview Aerocapture is a form of aeroassist used to insert a spacecraft into a desired orbit at targets with an atmosphere. Aerocapture uses aerodynamic forces to dissipate the hyperbolic approach energy to an energy level needed to reach a target apoapsis after making a single pass through the atmosphere. An active guidance system must be used during the aeropass to compensate for uncertainties in entry flight path angle, atmospheric density, and aerodynamics. This is achieved by applying bank maneuvers through the flight and targeting an atmospheric exit velocity needed to achieve the desired apoapsis. After exiting the atmosphere, propulsive maneuvers are required to put the spacecraft on a phasing orbit and to attain
12
6
7 8
Hyperbolic Approach Trajectory
Atmospheric Entry Interface
Atmosphere Exit
Circularization Maneuver
Science Orbit
3
45
Periapsis
Begin Bank Angle
Modulation
End Bank Angle Modulation
PeriapsisRaise
AtmosphericExit Orbit
Transfer Orbit
12
6
7 8
Hyperbolic Approach Trajectory
Atmospheric Entry Interface
Atmosphere Exit
Circularization Maneuver
Science Orbit
3
45
Periapsis
Begin Bank Angle
Modulation
End Bank Angle Modulation
PeriapsisRaise
AtmosphericExit Orbit
Transfer Orbit
Figure 1, Aerocapture Maneuver
American Institute of Aeronautics and Astronautics
2

the desired science orbit. These maneuvers include a periapsis raise and any needed adjustments in apoapsis, inclination, and longitude of ascending node. The aerocapture maneuver is illustrated in Fig 1.
II. Simulation of Aerocapture Orbit Insertion A high fidelity 3 DOF simulation of the aerocapture maneuver used to insert the spacecraft into its phasing orbit was developed in the Program to Optimize Simulated Trajectories, POST1. The aerocapture trajectory was simulated from the navigation delivery point, nominally 60 seconds before atmospheric interface, to atmospheric exit. The simulation determined the spacecraft’s trajectory through Venus’ atmosphere and tracked key design parameters such as heating, deceleration loads, and post-aerocapture circularization ∆V required for the periapsis raise and apoapsis adjustments. The simulation was run in a Monte Carlo fashion using uncertainties in the delivery point, spacecraft aerodynamics, and atmospheric density to provide statistical data for the design parameters. The simulation incorporated delivered states, aerodynamics, guidance, and control models specifically developed for the aeroshell, and a model of Veimplemented into the simulation. A brief descriptio
B. Atmospheric Model An engineering type model of Venus’ atmosphdeveloped at NASA’s Marshall Space Flight Ceprovided atmospheric state properties composition. The model, named Venus-GR(global reference atmospheric model), is engineering level model similar to Mars-GRATitan-GRAM, and Neptune GRAM.3,4 VenGRAM’s state and composition properties were baon data from the Venus International RefereAtmosphere (VIRA)5, as well as other data sousuch as Hunten’s “Venus”,6 and Marov’s “The PlVenus.”7
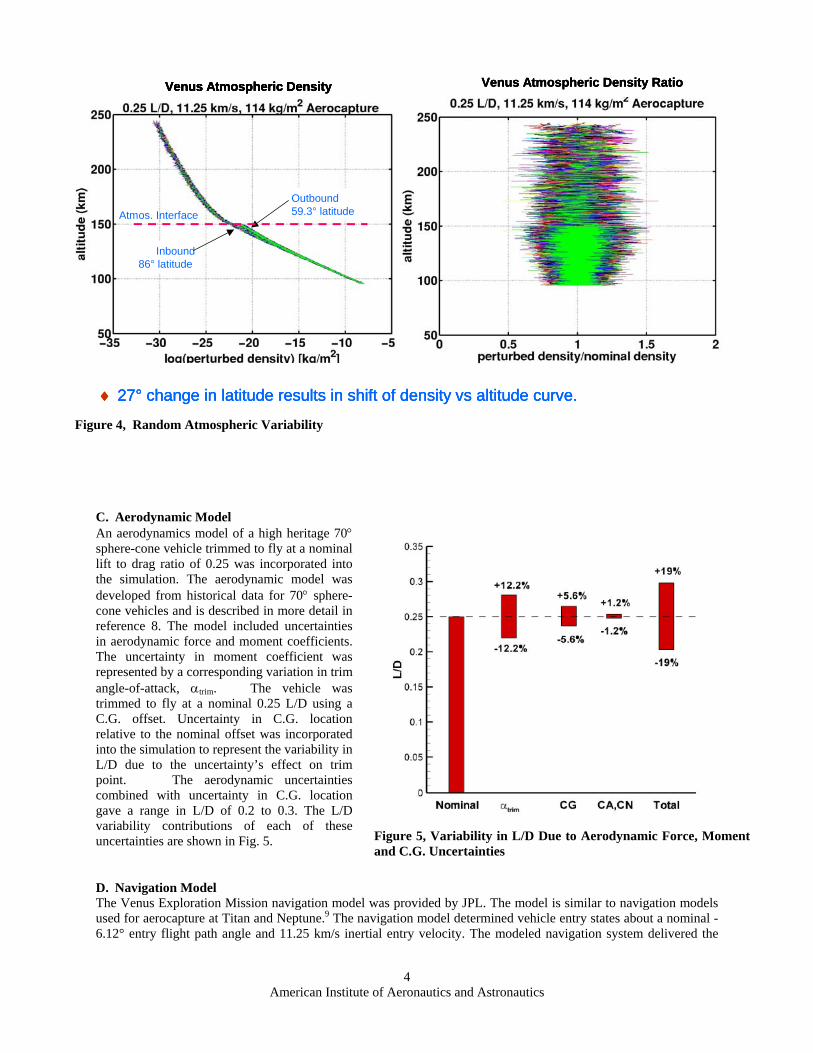
At aerocapture altitudes, the Venus atmospherecharacterized by a small scale height, i.e. rapid chaof density with respect to altitude. Fig. 3 shVenus’s density versus altitude along with oaerocapture targets. Venus-GRAM provatmospheric state properties randomly perturbed abthe mean as a function of altitude, latitude, longitand time-of-day. Figure 4 shows the randatmospheric variability as a function altitude latitude.
American Institute
Figure 2, Models Implemented Into Simulation
nus’ atmosphere (Venus-GRAM). Figure 2 depicts the models n of each model follows.
ere nter and AM
an M2, us-sed nce rces anet
is nge ows ther ides out
ude, om and
Figure 3, Venus Atmospheric Scale Height versus Other Targets
Source : C.G. Justus
of Aeronautics and Astronautics
3
Venus Atmospheric Density RatioVenus Atmospheric Density
Outbound59.3° latitude
Inbound86° latitude
Atmos. Interface
♦ 27° change in latitude results in shift of density vs altitude curve.
Venus Atmospheric Density RatioVenus Atmospheric Density
Outbound59.3° latitude
Inbound86° latitude
Atmos. Interface
♦ 27° change in latitude results in shift of density vs altitude curve.
Venus Atmospheric Density RatioVenus Atmospheric Density
Outbound59.3° latitude
Inbound86° latitude
Atmos. Interface
Venus Atmospheric Density
Outbound59.3° latitude
Inbound86° latitude
Atmos. InterfaceOutbound59.3° latitude
Inbound86° latitude
Atmos. Interface
♦ 27° change in latitude results in shift of density vs altitude curve. Figure 4, Random Atmospheric Variability
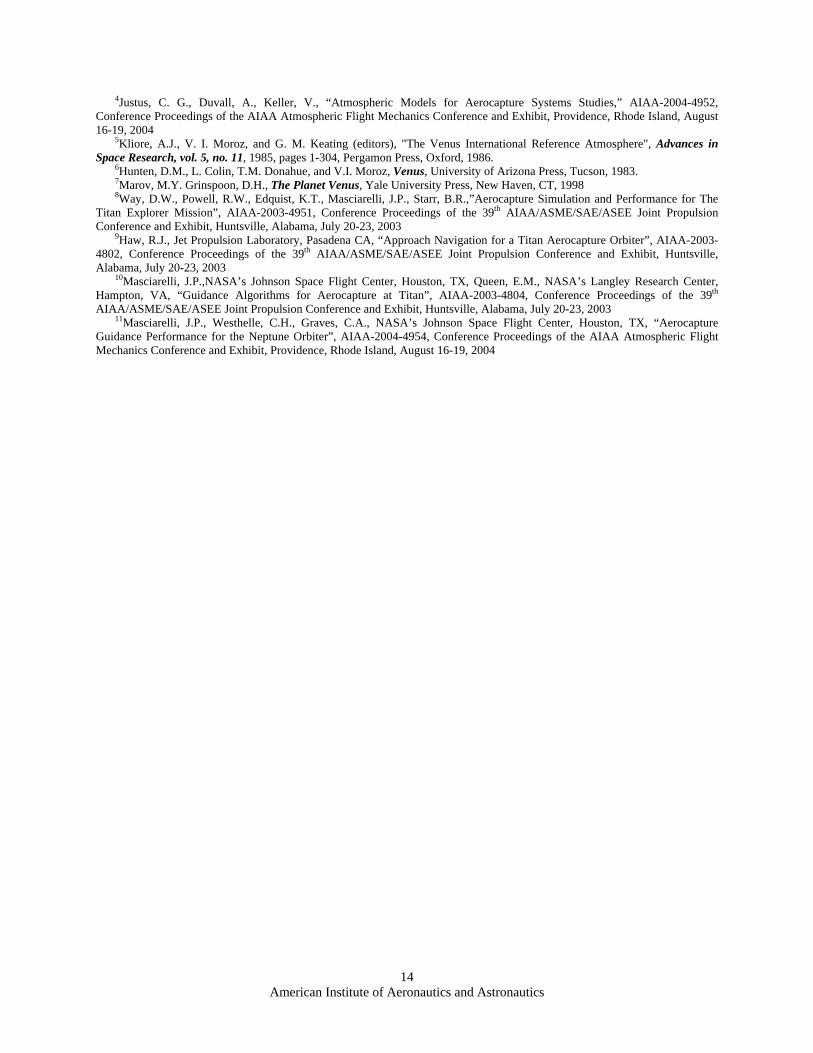
C. Aerodynamic Model An aerodynamics model of a high heritage 70° sphere-cone vehicle trimmed to fly at a nominal lift to drag ratio of 0.25 was incorporated into the simulation. The aerodynamic model was developed from historical data for 70° sphere-cone vehicles and is described in more detail in reference 8. The model included uncertainties in aerodynamic force and moment coefficients. The uncertainty in moment coefficient was represented by a corresponding variation in trim angle-of-attack, αtrim. The vehicle was trimmed to fly at a nominal 0.25 L/D using a C.G. offset. Uncertainty in C.G. location relative to the nominal offset was incorporated into the simulation to represent the variability in L/D due to the uncertainty’s effect on trim point. The aerodynamic uncertainties combined with uncertainty in C.G. location gave a range in L/D of 0.2 to 0.3. The L/D variability contributions of each of these uncertainties are shown in Fig. 5.
D. Navigation Model The Venus Exploration Mission navigation model used for aerocapture at Titan and Neptune.9 The na6.12° entry flight path angle and 11.25 km/s inert
American Institute
Figure 5, Variability in L/D Due to Aerodynamic Force, Moment and C.G. Uncertainties
was provided by JPL. The model is similar to navigation models vigation model determined vehicle entry states about a nominal -ial entry velocity. The modeled navigation system delivered the
of Aeronautics and Astronautics
4

spacecraft to atmospheric interface with a 3σ dispersion of ±0.28° about the nominal entry flight path angle. Figure 6 shows the dispersion in entry flight path angle and entry velocity.
Figure 6, Dispersion in Entry Flight Path Angle and Velocity
E. Guidance Algorithm The Hybrid Predictor-corrector Aerocapture Scheme (HYPAS) aerocapture guidance algorithm developed at Johnson Space Center provided autonomous guidance for the simulation. This scheme is considered hybrid in that it combines an Apollo type control equation with real-time generated trajectory parameters as opposed to pre-computed reference trajectory parameters. The desired trajectory parameters are computed through a predictive technique using closed form analytical equations rather than numerically estimated values. This algorithm has been developed and matured during the past 15 years. In addition, significant insight has been gained from working the system-level issues during the AFE design, development and testing program, as well as various mission specific challenges encountered in the non-Earth planets. References 10 and 11 describe the algorithm and its performance for mission specific challenges at Titan and Neptune. The HYPAS algorithm guides a lifting vehicle through the atmosphere to a desired exit apoapsis altitude and inclination or orbital-plane using only bank-angle as the control. The guidance is an analytic predictor-corrector algorithm based on deceleration due to drag and altitude-rate error feedback. Inputs to the algorithm are the current position, velocity, sensed acceleration and body attitude. The algorithm outputs the commanded bank angle. The algorithm is adaptable to a wide range of initial state vectors, vehicle lift-to-drag ratios and ballistic coefficients, planetary atmospheres, and desired target conditions. The HYPAS algorithm consists of two phases. In the first phase, the capture phase, bank angle commands are generated to stabilize the trajectory and drive the vehicle toward the equilibrium glide conditions, where aerodynamic forces, gravity, and centripetal forces are balanced. When the vehicle decelerates to a specified velocity, the second, or exit phase, begins. In the exit phase, the velocity vector at the atmospheric exit altitude is analytically predicted at each guidance computational cycle, based on a real-time calculated altitude rate profile. This altitude rate profile is corrected on subsequent computation cycles. Bank angle commands are then generated so that the altitude rate profile is followed, and the velocity vector achieved at the exit altitude will produce an orbit with the desired apoapsis. This two-phase approach allows separate tuning of initialization constants to minimize heating and loads, maximize exit performance, and maximize overall robustness. Bank reversals are performed periodically to achieve a target orbit inclination and/or node. The lateral logic in the guidance algorithm uses an inclination or wedge angle deadband which is a function of inertial velocity. Whenever the lateral error exceeds this deadband, a bank reversal is commanded. The direction of the bank reversal is selected
American Institute of Aeronautics and Astronautics
5

as a function of the current flight phase, the difference between the desired and current altitude rate, and the angular distance from the current to desired bank angle.
F. Control Model A 3-DOF Pseudo controller developed at Langley Research Center was used to approximate the attitude dynamics of a 6 DOF system. The controller analytically calculated the time and angular travel required to reach the guidance commanded attitude. Once calculated, the controller ramped the bank angle to the commanded value using a user defined maximum acceleration/deceleration and maximum attitude rate. The maximum acceleration and rates are defined such that the 3-DOF response is a good approximation of the 6-DOF system. This approach has provided good agreement with 6-DOF systems in previous simulations. Figure 7 shows the bank response to a bank command for the 3-DOF controller.
III. Monte CarThe vehicle performance was quantified by statistical 2000 individual aerocapture simulations with randomNeptune’s atmosphere. A Monte Carlo executive scripand coordinated simultaneous execution of the simuVarious post processing scripts were used to determinMonte Carlo analysis and to generate plots. A preliminary performance analysis determined that a at a nominal lift to drag ratio of 0.25 provided an entry uncertainties at its lower bound of L/D. A reference vehscience requirements and the heating indicators and despacecraft mass and aeroshell TPS and structural massresulted in a reference vehicle with a 114 kg/m2 ballistic Monte Carlo analyses were performed for the referenceset of delivery, atmospheric, and aerodynamic uncertainavigation, current knowledge of Venus atmosphere areference uncertainties are listed in Table 1. The firballistic coefficient due to possible mass growth or increased 100% from 114 kg/m2 to 228 kg/m2 to encreference maximum bank rate of 30°/s was used indetermined the effect of reducing the user specified maof 20°/s. The sensitivity studies are summarized in Tabl
American Institute of A
Figure 7, 3-DOF Controller Bank Response
lo Analyses data from Monte Carlo Analyses. The analyses consisted of perturbations in arrival states, vehicle aerodynamics and t created simulation input files with generated perturbations lations on multiple processors across multiple computers. e the statistical parameters for the 2000 simulations in each
high heritage 70° sphere-cone rigid aeroshell trimmed to fly corridor large enough to accommodate entry flight path angle icle with a 2.65m diameter was developed using the mission celeration load determined in the preliminary analysis. The required for the heating environment and deceleration load coefficient.
vehicle and for two sensitivity case studies using a reference nties. Reference uncertainties were based on state of the art nd computational fluid dynamics analysis respectively. The st sensitivity study determined the effect of increasing the aeroshell diameter change. The ballistic coefficient was
ompass any expected increases in ballistic coefficient. The the first sensitivity study. The second sensitivity study
ximum bank rate from 30°/s to a more historically used value e 2.
eronautics and Astronautics
6

Table 1, Monte Carlo Reference Uncertainties
Category Variable Nominal ±3σ or min/max Distribution Delivery State X position 66.14 km From covariance Correlated Y position 224.88 km From covariance Correlated Z position -6290.16 km From covariance Correlated X velocity -3.13 km/s From covariance Correlated Y velocity -10.63 km/s From covariance Correlated Z velocity 1.47km/s From covariance Correlated Atmosphere Random Pertubation seed 1 1 to 9999 Uniform Aerodynamics Trim angle of attack -16.0 deg ±2.0 deg Normal CA 1.48 ±3.0% Normal CN -0.05 ±5.0% Normal Mass Properties
Axial C.G. (Xcg/L) 0.20 ±0.012% Normal Radial C.G. (Zcg/L) 0.02 ±0.003% Normal
Table 2, Sensitivity Case Studies
Case Ballistic Coefficient Max Bank Rate Reference 114.0 kg/m2 30deg/s Increased Ballistic Coefficient 228.0 kg/m2 30 deg/s Decreased Max. Bank Rate 114.0 kg/m2 20 deg/s
IV. Results
A. Reference Case In the reference case, a Monte Carlo analysis of the 114 kg/m2 ballistic coefficient vehicle with the reference set of uncertainties was performed. The guidance compensates the uncertainties in atmospheric density, entry flight path angle, and aerodynamics by using the spacecraft’s available control authority. Dispersions in apoapsis altitude at atmospheric exit result when the spacecraft’s control authority is insufficient to compensate for the uncertainties. Due to the small scale height of the Venus atmosphere, a maximum bank rate of 30 deg/s was used for the reference vehicle. The higher bank rate limit gave the vehicle more control authority by reaching the guidance commanded attitude sooner and utilizing the atmospheric density at higher dynamic pressures. Figure 9 shows the reference case dispersion in apoapsis and periapsis altitude. For the reference uncertainties, 100% of the cases successfully captured with a 50th percentile apoapsis altitude of 302.6 km and an apoapsis altitude dispersion of 6.34 km between the 0.13 percentile and 99.87 percentile.
American Institute of Aeronautics and Astronautics
7

T
T9o
Figure 9, Reference Vehicle Dispersion in Apoapsis and Periapsis
able 3 summarizes the targeting statistics for the reference case.
he9.8f th
Table 3. Reference Targeting Statistics
Targeting Statistic Number of Cases 2001
Number Captured 0.13 Percentile 50.0 Percentile 99.87 Percentile Maximum Apoapsis Minimum Apoapsis Maximum Periapsis Minimum Periapsis2001 (100%)299.5 km 302.6 km 305.8 km 309.4 km 299.1 km 52.6 km -11.9 km
reference vehicle required an 89.6 m/s post aerocapture circularization ∆V to reach the science orbit with a 7% probability. The 99.87 percentile deceleration load for the reference case was 15.3 Earth g’s. A histogram e ∆V results and histogram of peak deceleration experienced during the aeropass is shown in Figure 10.
American Institute of Aeronautics and Astronautics
8

Figure 10, ∆V and Peak Deceleration Histograms
B. Increased Ballistic Coefficient Case In this case, the vehicle ballistic coefficient was doubled to 228 kg/m2 to determine the sensitivity of the 0.25 L/D vehicle performance to possible mass growth and/or aeroshell diameter change. The 100% increase is expected to more than encompass possible ballistic coefficient increases. The reference set of uncertainties was used in this sensitivity analysis. The Monte Carlo analysis determined that the 0.25 L/D aeroshell has the control authority to capture 100% of the cases with the increased ballistic coefficient and that the dispersion between the 0.13 percentile and 99.87 percentile apoapsis altitude is approximately the same as that of the reference vehicle, 6.1 km compared to 6.3 km of the reference vehicle. However, the increase in ballistic coefficient resulted in a 3.6 times larger dispersion in periapsis altitude. Figure 11 shows a comparison of the 114 kg/m2 and 228 kg/m2 vehicle’s dispersion in apoapsis and periapsis altitude. The lower periapsis altitudes are due to the higher ballistic coefficient vehicle flying deeper into the atmosphere to obtain the necessary drag and exiting lift up to meet the apoapsis altitude target.
American Institute of Aeronautics and Astronautics
9

T
Tpshan
Figure 11, Comparison of Apoapsis vs. Periapsis Dispersions, Increased Ballistic Coefficient vs. Reference Ballistic Coefficient
able 4 gives a comparison of the reference and increased ballistic coefficient targeting statistics
heercowd
Table 4. Comparison of Increased Ballistic Coefficient and Reference Ballistic Coefficient Targeting Statistics
Targeting Statistic 228 kg/m2 114 kg/m2 (Reference)
Number of Cases 2001 2001
Number Captured 0.13 Percentile 50.0 Percentile 99.87 Percentile Maximum Apoapsis Minimum Apoapsis Maximum Periapsis Minimum Periapsis2001 (100%)300.0 km 301.7km 306.1 km 309.9 km 299.2 km 54.5 km -177.3 km
2001 (100%) 299.5 km 302.6 km 305.8 km 309.4 km 299.1 km 52.6 km -11.9 km
lower periapsis altitudes result in larger post aerocapture ∆V. The increased ballistic coefficient’s 99.87 entile post aerocapture circularization ∆V was 134 m/s, a 49% increase over the reference vehicle. Figure 12 s a comparison of post aerocapture circularization ∆V histograms. Table 5 gives a comparison of the reference
increased ballistic coefficient post aerocapture circularization ∆V statistics.
American Institute of Aeronautics and Astronautics
10

Figure 12, Comparison of Post Aerocapture Circularization Delta-V, Increased Ballistic Coefficient vs. Reference Ballistic Coefficient
C. In taerothe periperc11.3scalerroflyinapo
Table 5. Comparison of Increased Ballistic Coefficient and Reference Ballistic Coefficient Post Aerocapture Circularization ∆V Statistics
∆V Statistic 228 kg/m2 114 kg/m2 (Reference) (m/s) (m/s) 0.13 Percentile 73.0 72.5
50.0 Percentile 99.87 Percentile Maximum ∆V Minimum ∆V85.6 133.8 141.1 72.7
77.9 89.6 90.6 72.2
Decreased Bank Rate Case his case, the pseudo controller’s maximum bank rate was reduced to 20 deg/s, a value typically used at other capture targets, to determine the lower rate’s effect on performance. The Monte Carlo analysis determined that 0.25 L/D vehicle can successfully capture 100% of the cases at the lower maximum bank rate. The apoapsis and apsis dispersions increase as a result of the lower limit. The apoapsis dispersion between the 0.13 and 99.87 entiles increases 4.5 km to 10.8 km. The periapsis dispersion between the 0.13 and 99.87 percentiles increases km to 75.8 km. The periapsis altitudes also shift lower as a result of the lower bank rate limit. Due to the small e height of the atmosphere, the slower bank rate does not allow the vehicle to respond fast enough to altitude rate r. For many cases, bank maneuvers do not keep up with the rate of density increase resulting in the vehicle g deeper in the atmosphere than needed and exiting lift up thus lowering the periapsis. Figure 13 shows the
apsis and periapsis altitude dispersions.
American Institute of Aeronautics and Astronautics
11

Th
The lo∆V in
Figure 13, Comparison of Apoapsis vs.Periapsis Dispersions, Decreased Max Bank Rate vs. Reference Max Bank Rate
e apoapsis and periapsis altitude dispersion statistics are compared to the reference case in table 6.
wcre
Table 6. Comparison of Decreased Max Bank Rate and Reference Max Bank Rate Targeting Statistics
Targeting Statistic 20 deg/sec 30 deg/sec (Reference)
Number of Cases 2001 2001
Number Captured 0.13 Percentile 50.0 Percentile 99.87 Percentile Maximum Apoapsis Minimum Apoapsis Maximum Periapsis Minimum Periapsis2001 (100%)295.0 km 301.7km 305.8 km 309.0 km 293.9 km 25.3 km -50.5 km
2001 (100%) 299.5 km 302.6 km 305.9 km 309.4 km 299.1 km 52.6 km -11.9 km
er periapsis altitudes increase post aerocapture ∆V. The 99.87 percentile post aerocapture circularization ases 14% to 102 m/s. The post aerocapture ∆V histogram is compared to the reference case in figure 14.
American Institute of Aeronautics and Astronautics
12

Figure 14, Comparison of Post Aerocapture Circularization ∆V, Decreased Max Bank Rate vs. Reference Max Bank Rate
Table 7 gives a comparison of the reference and decreased maximum bank rate post aerocapture circularization ∆V statistics.
Table 7. Comparison of Decreased Max Bank Rate and Reference Max Bank Rate Post Aerocapture Circularization ∆V Statistics
∆V Statistic 20 deg/s 30 deg/s (Reference) (m/s) (m/s) 0.13 Percentile 50.0 Percentile 99.87 Percentile Maximum ∆V Minimum ∆V
73.0 85.6 133.8 141.1 72.7
72.5 77.9 89.6 90.6 72.2
V. Conclusions
The 0.25 L/D has sufficient control authority to successfully capture 100% of the Monte Carlo cases for the reference vehicle and all sensitivity studies performed when run with the reference set of uncertainties. The reference vehicle has a 99.87% probability of attaining the science orbit with a 90 m/s post aerocapture circularization ∆V budget. Increasing the vehicle ballistic coefficient to 228 kg/m2 does not degrade targeting performance but does increase post aerocapture in-plane circularization ∆V 49% from 90 m/s to 134 m/s. Decreasing the pseudo controller’s maximum bank rate decreases the targeting performance with a 4.5 km increase in apoapsis dispersion and also increases post aerocapture in-plane circularization ∆V 14% from 90 m/s to 102 m/s.
VI. References 1Bauer, G.L., Cornick, D.E., and Stevenson, R., “Capabilities and Applications of the Program to Optimize Simulated
Trajectories (POST),” NASA CR-2770, February 1977. 2 Justus, C.G., Computer Sciences Corp., Huntsville, AL, Johnson, D.L., Marshall Space Flight Center, Huntsville, AL,
“Mars Global Reference Atmospheric Model 2001 Version (Mars-GRAM 2001) Users Guide”, NASA/TM-2001-210961, Huntsville, AL, 2001
3Justus, C.G., Duvall, A., Computer Sciences Corp, Huntsville, AL; D. Johnson, NASA Marshall Space Flight Center, Huntsville, AL, “Engineering-Level Model Atmospheres for Titan and Neptune,” AIAA-2003-4803, Conference Proceedings of the 39th AIAA/ASME/SAE/ASEE Joint Propulsion Conference and Exhibit, Huntsville, Alabama, July 20-23, 2003
American Institute of Aeronautics and Astronautics
13
4Justus, C. G., Duvall, A., Keller, V., “Atmospheric Models for Aerocapture Systems Studies,” AIAA-2004-4952, Conference Proceedings of the AIAA Atmospheric Flight Mechanics Conference and Exhibit, Providence, Rhode Island, August 16-19, 2004
5Kliore, A.J., V. I. Moroz, and G. M. Keating (editors), "The Venus International Reference Atmosphere", Advances in Space Research, vol. 5, no. 11, 1985, pages 1-304, Pergamon Press, Oxford, 1986.
6Hunten, D.M., L. Colin, T.M. Donahue, and V.I. Moroz, Venus, University of Arizona Press, Tucson, 1983. 7Marov, M.Y. Grinspoon, D.H., The Planet Venus, Yale University Press, New Haven, CT, 1998 8Way, D.W., Powell, R.W., Edquist, K.T., Masciarelli, J.P., Starr, B.R.,”Aerocapture Simulation and Performance for The
Titan Explorer Mission”, AIAA-2003-4951, Conference Proceedings of the 39th AIAA/ASME/SAE/ASEE Joint Propulsion Conference and Exhibit, Huntsville, Alabama, July 20-23, 2003
9Haw, R.J., Jet Propulsion Laboratory, Pasadena CA, “Approach Navigation for a Titan Aerocapture Orbiter”, AIAA-2003-4802, Conference Proceedings of the 39th AIAA/ASME/SAE/ASEE Joint Propulsion Conference and Exhibit, Huntsville, Alabama, July 20-23, 2003
10Masciarelli, J.P.,NASA’s Johnson Space Flight Center, Houston, TX, Queen, E.M., NASA’s Langley Research Center, Hampton, VA, “Guidance Algorithms for Aerocapture at Titan”, AIAA-2003-4804, Conference Proceedings of the 39th AIAA/ASME/SAE/ASEE Joint Propulsion Conference and Exhibit, Huntsville, Alabama, July 20-23, 2003
11Masciarelli, J.P., Westhelle, C.H., Graves, C.A., NASA’s Johnson Space Flight Center, Houston, TX, “Aerocapture Guidance Performance for the Neptune Orbiter”, AIAA-2004-4954, Conference Proceedings of the AIAA Atmospheric Flight Mechanics Conference and Exhibit, Providence, Rhode Island, August 16-19, 2004
American Institute of Aeronautics and Astronautics
14