aerosol properties associated with air masses arriving into the north
TRANSCRIPT

Atmos. Chem. Phys., 10, 8413–8435, 2010www.atmos-chem-phys.net/10/8413/2010/doi:10.5194/acp-10-8413-2010© Author(s) 2010. CC Attribution 3.0 License.
AtmosphericChemistry
and Physics
Aerosol properties associated with air masses arriving into theNorth East Atlantic during the 2008 Mace Head EUCAARIintensive observing period: an overview
M. Dall’Osto 1, D. Ceburnis1, G. Martucci1, J. Bialek1, R. Dupuy1, S. G. Jennings1, H. Berresheim1, J. Wenger2,R. Healy2, M. C. Facchini3, M. Rinaldi 3, L. Giulianelli 3, E. Finessi3, D. Worsnop4,5, M. Ehn5, J. Mikkil a5,M. Kulmala 5, and C. D. O’Dowd1
11School of Physics & Centre for Climate & Air Pollution Studies, National University of Ireland Galway, Ireland2Department of Chemistry, University College Cork, Cork, Ireland3Istituto di Scienze dell’Atmosfera e del Clima Via Gobetti 101, 40129 Bologna, Italy4Aerodyne Inc., Boston, USA5Department of Physics, University of Helsinki, Helsinki, Finland
Received: 31 October 2009 – Published in Atmos. Chem. Phys. Discuss.: 10 December 2009Revised: 9 April 2010 – Accepted: 17 April 2010 – Published: 7 September 2010
Abstract. As part of the EUCAARI Intensive Observing Pe-riod, a 4-week campaign to measure aerosol physical, chem-ical and optical properties, atmospheric structure, and cloudmicrophysics was conducted from mid-May to mid-June,2008 at the Mace Head Atmospheric Research Station, lo-cated at the interface of Western Europe and the N. E. At-lantic and centered on the west Irish coastline. During thecampaign, continental air masses comprising both young andaged continental plumes were encountered, along with polar,Arctic and tropical air masses. Polluted-continental aerosolconcentrations were of the order of 3000 cm−3, while back-ground marine air aerosol concentrations were between 400–600 cm−3. The highest marine air concentrations occurred inpolar air masses in which a 15 nm nucleation mode, with con-centration of 1100 cm−3, was observed and attributed to openocean particle formation. Continental air submicron chem-ical composition (excluding refractory sea salt) was domi-nated by organic matter, closely followed by sulphate mass.Although the concentrations and size distribution spectralshape were almost identical for the young and aged continen-
Correspondence to:C. D. O’Dowd([email protected])
tal cases, hygroscopic growth factors (GF) and cloud conden-sation nuclei (CCN) to total condensation nuclei (CN) con-centration ratios were significantly less in the younger pol-lution plume, indicating a more oxidized organic componentto the aged continental plume. The difference in chemicalcomposition and hygroscopic growth factor appear to resultin a 40–50% impact on aerosol scattering coefficients andAerosol Optical Depth, despite almost identical aerosol mi-crophysical properties in both cases, with the higher valuesbeen recorded for the more aged case. For the CCN/CN ratio,the highest ratios were seen in the more age plume. In marineair, sulphate mass dominated the sub-micron component, fol-lowed by water soluble organic carbon, which, in turn, wasdominated by methanesulphonic acid (MSA). Sulphate con-centrations were highest in marine tropical air – even higherthan in continental air. MSA was present at twice the con-centrations of previously-reported concentrations at the samelocation and the same season. Both continental and marineair exhibited aerosol GFs significantly less than ammoniumsulphate aerosol pointing to a significant organic contributionto all air mass aerosol properties.
Published by Copernicus Publications on behalf of the European Geosciences Union.
8414 M. Dall’Osto et al.: Aerosol properties associated with air masses
1 Introduction
Atmospheric aerosols affect air quality and climate. In termsof air quality, aerosols influence human health, leading to in-creased mortality ratess and deteriorate visibility (e.g. Popeand Dockery, 2006; Hand and Malm, 2007). In terms of cli-mate, regional haze layers contribute to the direct radiativeforcing (the direct radiative effect), directly reducing incom-ing solar energy, and indirectly (the indirect radiative effect)reducing incoming solar energy through the modificationof cloud reflectance (Intergovernmental Panel on ClimateChange (IPCC), 2007). In the IPCC climate assessment, em-phasis was placed on the complexity of the combined directand indirect forcing from both aerosols and gases as well ason the importance of improving our understanding of the rolethat each of these components plays in radiative forcing inan integrated system. Recent work has also suggested thataerosols have been masking the real climate sensitivity togreenhouse gas warming, pointing to an even more impor-tant role for aerosols in climate than originally anticipated(Andreae et al., 2005). Such knowledge would reduce theuncertainty in current estimates of radiative forcing and en-able a better prediction of the effects of anthropogenic activ-ity on global change. Acquisition of such knowledge is thecentral aim of the European Commission Framework 7 Inte-grated Project EUCAARI (European Aerosol Cloud Climateand Air Quality Interactions).
EUCAARI (Kulmala et al., 2009) has two overarching ob-jectives:Objective 1: reduction of the current uncertainty ofthe impact of aerosol particles on climate by 50% and quan-tification of the relationship between anthropogenic aerosolparticles and regional air quality;andObjective 2: quantifi-cation of the side effects of European air quality directiveson global and regional climate, and provide tools for futurequantifications for different stakeholders.
The project focuses on the areas of greatest uncertaintyand in doing so will identify and quantify the processesand sources governing global and regional aerosol concen-trations; quantify the physico-chemical properties of atmo-spheric aerosols; and quantify the feedback processes thatlink climate change and atmospheric aerosol concentrationswith emphasis on the production and loading of naturalaerosols and their precursors.
As part of achieving these objectives, there are twoflavours of field study programmes within Europe center-ing on the following atmospheric supersites: Mace Head(Ireland), Vavihill (Sweden), Melpitz and Hohenpeissenberg(Germany), Hyytiala and Pallas, (Finland), K-Puzta (Hun-gary), Jungfraujoch (Switzerland), Puy de Dome (France),Cabauw (Netherlands), Finokalia (Greece), Kosetice (ChechRepublic) and San Pietro Capofiume (Italy). The first ofthese activities was a 12-month (over 2008) period of ad-vanced aerosol measurements at all the above stations. Thesecond of these activities was the Intensive Observing Pe-riod (15 May 2008–15 June 2008) where all stations are
equipped with the most advanced instrumentation availableto be deployed at as many stations as possible. In addition,a suite of research aircraft concentrated on various aerosol-cloud experiments primarily located at Cabauw, and airborneLagrangian studies connecting transects between some of theabove supersites as the meteorological and transport oppor-tunities arose.
This study reports on the results of the aerosol characteri-zation studies associated with the Mace Head EUCAARI In-tensive Observing Period. Mace Head is uniquely locatedon the interface between the N. E. Atlantic and Europe, thusenabling sampling of both the cleanest air entering into Eu-rope along with some of the most polluted air being exportedout of Europe into the North Atlantic. A description of thestation, facilities and history of key results can be found inJennings et al. (2003) and O’Connor et al. (2009).
A wide range of aerosol and meteorological measure-ments were conducted during the intensive campaign as fol-lows: meteorological vertical structure (microwave profilerand ceilometer); cloud physics and structure (mm radar),aerosol optical depth (precision filter radiometer; aerosolabsorption (Multi-Angle Absorption Photometer), aerosolscattering (nephelometer), aerosol microphysics (condensa-tion particle counters and scanning mobility particle sizers),aerosol hygroscopic growth (Hygroscopicity Tandem Differ-ential Mobility Analyser), cloud condensation nuclei, off-line aerosol chemistry (impactors with Nuclear MagneticResonance and ion-chromatography) and on-line aerosolchemistry (Aerosol Mass Spectrometry).
During the campaign a range of clean marine and pollutedcontinental air mass categories were encountered and the keyaerosol properties associated with these particular air massesare documented and reported here. The results from such arange of instrumentation are likely to be of significant inter-est to both the process-modelling community and the large-scale modeling community.
2 Methods
2.1 The Mace Head Atmospheric Research Station
The Mace Head Atmospheric Research Station is located inConnemara, County Galway on the Atlantic Ocean coast-line of Ireland at 53◦ 19′36′′ N, 9◦ 54′14′′ W and offers aclean sector from 190◦ through west to 300◦. Meteorologi-cal records show that on average, over 60% of the air massesarrive at the station in the clean sector (Jennings et al., 2003).Air is sampled at 10 m height from a main air inlet positionedat 80–120 m from coast line depending on tide (available at:http://www.macehead.org).
Atmos. Chem. Phys., 10, 8413–8435, 2010 www.atmos-chem-phys.net/10/8413/2010/

M. Dall’Osto et al.: Aerosol properties associated with air masses 8415
2.2 Meteorological instrumentation
Basic meteorological parameters such as wind speed, di-rection, relative humidity, atmospheric pressure, precipita-tion, global radiation, UV-radiation are measured at the 10 mheight level, with some duplication at 22 m. Micrometeo-rological fluxes are also determined at the 22 m level. Toenhance aerosol and cloud observing capabilities a suite ofthree synergetic remote sensors have been installed at theMace Head Atmospheric Station and have been operationalsince May 2008.
Temporal and spatial aerosol mixing and dispersion withinthe marine boundary layer, along with cloud developmentand structure are monitored by a Jenoptik CHM15K Lidarceilometer (λ = 1064 nm), a RPG-HATPRO multi-channelmicrowave profiler, and a MIRA36, 35 GHz K-band Dopplercloud radar. The three instruments together allow synergeticquantification of cloud microphysics (Frisch et al., 1998;Boers et al., 2000, 2006; Brandau et al., 2009); however,microphysical products are still under development and arebeyond the scope of this study. In this study, the microwaveprofiler, through gradients in the specific humidity profiles,and the Lidar-Ceilometer, through the gradients in aerosolbackscatter profiles are used to remotely-sense boundarylayer structure. Often in this N. E. Atlantic region the bound-ary layer comprises more than one layer, typically two butsometimes more (Kunz et al., 2002). Terminology is oftena problem so here we define the layer nearest the surface,which is typically well mixed, as the surface mixed layer(SML), noting that this layer can deviate from being well-mixed (i.e. neutral stability), and the layer occupying the re-gion below the Free Troposphere inversion as the decoupledresidual or convective (DRC) layer. Results are presentedfor the vertical extent of the SML inversion and the DRC (orFree Troposphere) inversion level.
The ground-based remote sensing instruments for part ofthe recommended CLOUDNET suite of sensors that couldultimately be used to derive detailed cloud microphysics suchas liquid water content, effective radius and cloud dropletnumber concentration (Illingworth et al., 2007). Althoughsome initial microphysical results are presented at the endof this study, the methods for microphysical retrievals arebeyond the scope of this work.
In-situ and remotely-sensed meteorology was compli-mented by NOAA Hysplit air mass back trajectories andMODIS ocean products such as sea-surface temperature andchlorophyll-a maps.
2.3 Aerosol microphysics
The on-line aerosol analysers sampled from a 10 m height10 cm diameter laminar flow community duct with a 50%size cut at 500 nm (Kleefeld et al., 2002). Total particle con-centrations at sizes larger than 3 and 10 nm diameter weresampled using a Thermo Systems Inc. (TSI) Condensation
Particle Counter (CPC) 3025 and 3010, respectively. Sizedistributions were sampled using a TSI nano-Scanning Mo-bility Particle Sizer (SMPS) between 3 and 20 nm, scanningevery 30 s, and a standard SMPS operating 10-min size dis-tribution scans between 20 and 500 nm (Wang and Flagan,1990).
The CPC bank is composed of a standard TSI CPC 3025with a particle diameter size cutoff of 3 nm and a TSI CPC3010 with a 10 nm cutoff diameter. Data acquisition timeresolution for the CPC bank was set to 1 Hz. The CPC3025was diluted by a factor of 16:1 to avoid saturation of the CPCtotal number concentration in excess of 100 000 cm−3 (Yoonet al., 2005). It is possible to detect number concentration ofultrafine particles up to 1.7×106 cm−3 with the aid of thiscalibrated dilution system.
Aerosol scattering coefficient measurements were per-formed by a TSI Inc. 3563 3-wavelength integrating neph-elometer (Bodhaine et al., 1991; Heintzenberg and Charlson,1996). This instrument is designed to measured aerosol lightscattering coefficient with a sampling frequency of 1 Hz at 3wavelengths (450, 550 and 700 nm) with two ranges of an-gular integration: (7◦–170◦) to determine the total scatter-ing coefficient sp and 90◦–170◦ for the assessment of hemi-spheric backscattering. The instrument was regularly cali-brated using CO2 and particle free air during the 30-monthperiod of measurements. Moreover, an automatic zero cali-bration with particle free air was performed every 60 min forsetting the instrument zero. Due to internal heating of thenephelometer, aerosols were sampled at an average relativehumidity of 35± 5%.
AOD (Aerosol Optical Depth) measurements at wave-lengths centered at 368, 412, 501, and 862 nm were madeat 2 min intervals using a Precision Filter Radiometer (PFR)(Wehrli, 2004). The precision of the PFR instrument is es-timated to be approximately 0.01 optical depth (McArthuret al., 2003) across all channels. Cloud-screening of theAOD measurements is carried out by implementation of theAERONET cloud-screening algorithm (Smirnov et al., 2000)along with an additional filter, which flags all measurementsif the AOD in the infrared channel is greater than 2. Theprocedures are outlined in Mulcahy et al. (2009).
Aerosol absorption (and Black Carbon mass) was mea-sured using both a McGee Scientific Aethalometer AE-16and a Multi-Angle Absorption Photometer (MAAP). Cloudcondensation nuclei (CCN) concentration was determinedusing a Droplet Measurements Technology CCN counter(Lance et al., 2006) operated at supersatuations of 0.1%,0.25%, 0.5% and 1%.
Hygroscopic properties of aerosol were measured usinga Hygroscopic Tandem Differential Mobility Analyzer (H-TDMA), as described in Nilsson et al. (2009); Liu andPui 1978; and Rader and McMurry (1986). The determina-tion of particles growth factor (GF) is done by comparison ofsizes of particles in their dry and humidified state. A higherGF indicates more hygroscopic particles resulting from a
www.atmos-chem-phys.net/10/8413/2010/ Atmos. Chem. Phys., 10, 8413–8435, 2010

8416 M. Dall’Osto et al.: Aerosol properties associated with air masses
higher affinity for water. The typical setup of any TDMAconsists of two DMAs: the first DMA selects a monodis-perse aerosol size distribution and the second DMA scansthrough a range of sizes to determine changes in particle sizeafter the particles have been humidified. The Mace HeadH-TDMA incorporates a dry DMA (RH = 40%), a nafion hu-midifier, and a second DMA placed in a temperature con-trolled box for stabilization of the relative humidity. In thehumidifier, the aerosol sample is humidified to 90% relativehumidity. GFs are determined for dry size particles of 35,50, 75, 110 and 165 mn. Because the raw data obtained withthe H-TDMA (i.e the Growth Factor Measured DistributionFunction – MDF) is a smoothed and skewed integral imageof the real GF probability density function (GF-PDF), an in-version algorithm is used to retrieve the GF-PDF. This al-lows showing the correct shape of GF-PDF in detail (Gyselet al., 2009). The Mace Head H-TDMA follows the EU-SAAR standard installation and accuracy as summarized inNilsson et al. (2009) where the GFs and GF standard devia-tions for the 5 operational dry sizes of ammonium sulphate.The GF standard deviation is less than 2% for all sizes andthe GFs for 35, 50, 75, 110, 165 nm particles are 1.62, 1.67,1.69. 1.71. and 1.73 respectively and were found to be withina growth factor deviation of± 0.05 compared to previousrecored data (Tang and Munkelwitz, 1994). Unfortunately,as a first deployment of the instrument at Mace Head, themaximum GF range was limited to 2 due to arching withinthe instrument and consequently, the instrument could notdetect higher GFs.
2.4 Aerosol mass spectrometry
In recent years aerosol mass spectrometry has become avail-able as a powerful tool for the on-line chemical characteriza-tion of individual aerosol particles (Murphy, 2007) or smallaerosol ensembles (Canagaratna et al., 2007). Two on-lineaerosol mass spectrometers were operated at the measure-ment site, an ATOFMS (Model 3800-100, TSI, Inc.) anda HR-ToF-AMS (Aerodyne Research, Inc.). The ATOFMScollects bipolar mass spectra of individual aerosol particles.Ambient aerosol is focused into a narrow particle beam forsizes between 100 nm and 3 µm. Using a 2-laser velocime-ter particle sizes are determined from particle velocity af-ter acceleration into the vacuum. In addition, the lightscattered by the particles is used to trigger a pulsed highpower desorption and ionization laser (λ = 266 nm, about1 mJ/pulse) which evaporates and ionizes the particle in thecentre of the ion source of a bipolar reflectron ToF-MS. Thus,a positive and negative ion spectrum of a single particle areobtained. The Aerodyne High-Resolution Time-of-FlightAerosol Mass Spectrometer (HR-ToF-AMS) (Drewnick etal., 2005) focuses aerosol particles in the size range 50–600 nm quantitatively onto a hot surface (∼ 600◦C) usingan aerodynamic lens assembly (Jayne et al., 2000). Smallerand larger particles are also collected with lower efficiency.
Non-refractory particle components flash-evaporate on thehot surface; the evolving vapour is electron impact (70 eV)ionized and the ions are transported into an orthogonal ex-traction ToF-MS for high-resolution mass analysis. Particlesize information is obtained by chopping the particle beamand collecting mass spectra as a function of particle flighttime. The instrument provides 5-min averages of mass con-centrations of the non-refractory aerosol components as wellas species-resolved size distributions. A detailed descrip-tion of the instrument and its operation is given in Drewnicket al. (2005). The instrument provides quantitative massloading information on non refractory components using awell characterised series of calibrations and error estimations(Jimenez et al., 2003; Allan et al., 2003b, 2004).
The HR-ToF-AMS (DeCarlo et al., 2006) was deployed inthe standard configuration, taking both mass spectrum (MS)and particle time of flight (pToF) data. The AMS was runin “V-mode” with a mass resolution of up to 3000 m/1m al-ternatively with a “W-mode” by using a second reflectron,which increases resolution to 6000 m/1m but decreases sen-sitivity by approximately one order of magnitude. The in-struments were calibrated using 300 nm monodisperse am-monium nitrate particles. Data obtained here were validatedby comparing the AMS total mass loading with the ones de-rived by using the SMPS (by converting volume size distri-butions into mass size distributions and assumed density of1.4) and nephelometer data. The analysis of the high res-olution AMS data goes beyond the scope of this paper andwill be object of future publication. The AMS data shownhere give a general overview of the general AMS compo-nents (organics, sulphate, ammonium, MSA and nitrate) fordifferent air masses impacting Mace Head during the EU-CAARI intensive field study. Calibrations were performedduring the campaign, including particle-Time-of-Flight cali-bration to convert the particle flight times into particle diam-eters and to determine the instrument background parametersby measurements through a high efficiency particulate air fil-ter (HEPA filter) during the campaign. The unit mass reso-lution data from the V mode of the HR-TOF were analyzedusing the “fragmentation table” method described by Allanet al. (2004). This separates signals within the mass spectraaccording to chemical source by performing weighted sub-tractions and substitutions based on key identification peaksin the form 5 of matrix operators. For error estimation, themodel described by Allan et al. (2003b) was applied to theunit mass resolution data, propagated through the matrices.Beside the 4 typical aerosol components (organics, sulphate,ammonium and nitrate), MSA concentrations were also ob-tained following the same procedure described in Zhorn etal. (2008). After this calculation, MSA no longer contributesto the mass fragments of AMS “sulfate” and “organics”.
The ATOFMS collected about 600 000 single particle pos-itive and negative mass spectra. The TSI ATOFMS datasetwas imported into YAADA (Yet Another ATOFMS Data An-alyzer) and single particle mass spectra were grouped with
Atmos. Chem. Phys., 10, 8413–8435, 2010 www.atmos-chem-phys.net/10/8413/2010/

M. Dall’Osto et al.: Aerosol properties associated with air masses 8417
Adaptive Resonance Theory neural network, ART-2a (Songet al., 1999). The parameters used for ART-2a in this ex-periment were: learning rate 0.05, vigilance factor 0.85, anditerations 20. Similar clusters obtained by ART-2a were fur-ther manually merged (Dall’Osto and Harrison, 2006) so thetotal number of clusters describing the whole database wasreduced to 20. Clusters included for example sea salt, dust,Elemental carbon, biomass, Nitrate-rich and many other par-ticle types.
2.5 Off-line aerosol chemical analysis
Aerosol samples for offline chemical analyses were col-lected deploying an 8-stage Berner low pressure impactor(BI8), equipped with tedlar foils, and a high volume sam-pler, mounting quartz fiber filters. The BI8 collects particlesin eight size fractions between 0.06 and 16 µm diameter (cut-offs: 0.06, 0.125, 0.25, 0.50, 1.0, 2.0, 4.0 and 8.0 µm at 50%efficiency); however, the uppermost stage (8.0–16.0 µm) wasnot analyzed due to the very low collection efficiency ofthe impactor inlet for these sizes at wind speeds of 5 m s−1
and above. The high volume sampler segregates betweenfine (Dp < 1.5 µm) and coarse particles (1.5< Dp < 0 µm).Analyses of aerosol inorganic components and water solu-ble organic carbon (WSOC) were performed on tedlar foilsfollowing mQ water extraction, by 30 min sonication (Mattaet al., 2003). Anions were separated and quantified on aDionex ICS-2000 ion chromatograph, equipped with Ion-Pac AG11 2×50 mm Dionex guard column, IonPac AS112×250 mm Dionex separation column and ASRS ULTRA IIself-regenerating suppressor. This program allows separationof both inorganic cations (sodium, ammonium, potassium,magnesium, calcium) and methyl-, dimethyl-, trimethyl-,ethyl- and diethylammonium. WSOC analyses were per-formed deploying the instrumental setup described in Rinaldiet al. (2007).
The high volume samples were used for the determinationof Total Carbon (TC) and WSOC and for the aerosol organicfraction characterization. WSOC was determined followingthe above procedure. TC analyses were performed by anAnalytik Jena Multi N/C2100 elemental analyzer equippedwith a solid furnace module. Inside the instrument fur-nace, the sample was exposed to a constant temperature of950◦C in 100% O2 and the TC was determined as the to-tal evolved CO2 by a non-dispersive infrared (NDIR) de-tector. The aerosol water insoluble organic carbon (WIOC)content was calculated as the difference between TC andWSOC. The ratio WSOC/TC established from high volumesamples, and WSOC concentrations from impactor sampleswere combined to derive the WIOC size distribution. Pro-ton Nuclear Magnetic Resonance (1H NMR) spectroscopywas employed for functional group analysis of WSOC ex-tracted from high volume samples as described in Cavalliet al. (2004). The WSOC was converted to water solubleorganic mass (WSOM) using a factor of 1.8, based on the
functional group composition of WSOC. A conversion fac-tor of 1.4 was instead applied to convert WIOC to water in-soluble organic mass (WIOM), according to the functionalgroup composition observed by 1H NMR in sea spray or-ganic aerosols (Facchini et al., 2008b). Sea salt and nss-SO−2
4 aerosol concentrations were calculated using Na+ assea salt tracer and a standard sea salt composition (Seinfeldand Pandis, 1998).
3 Results
3.1 Meteorology: air mass classification and boundarylayer structure
Air Masses: Back trajectories of the air masses arriving atMace Head were calculated for 00:00 UTC and 12:00 UTCfor each day of the campaign, depicting the path taken bythe air mass reaching the sampling site over the previous fivedays. The back trajectories were run using the on-line HYS-PLIT model developed by the National Oceanic and Atmo-spheric Administration (NOAA). We present an overall me-teorological air mass summary of the EUCAARI campaign,categorising it into five synoptic period types. Figure 1 il-lustrates typical examples of the five back trajectory typesfor selected days: day 24th May (Continental European –denoted bycP in strict meteorological terms ), 31st May(Continental-Marine,cmP ), 7th June (Polar Marine,mP),9th June (Tropical Marine,mT) and 12th June (Arctic Ma-rine, mA). They are representative of the different periodslisted in Table 1. The local meteorological conditions (windspeed, direction, relative humidity and temperature) associ-ated with these periods are listed in Table 2. Characteristicsassociated with the different air mass categories are summa-rized as follows:
(European) Continental Polar (cP):This continental out-flow period lasted from about 16 May 08 00:00 to 29 May 0912:00 (13.5 days) and was characterized by sunny and warmconditions. Air masses originated most of the time from theEast, advecting out from central Europe, through the UK andIreland. Some days also had a northern European componentto them. The average wind speed (13.1± 5.2 m s−1) was thestrongest of the five periods, and wind direction confirmedthe strong average Easterly component (108± 59◦). The val-ues of wind speed and direction are given± one standarddeviation. In all subsequent values of parameters reported±
a range, the range corresponds to one standard deviation.Continental-Marine Polar (cmP):This modified continen-
tal/marine period lasted for about 4.5 days from 29 May 0812:00 to 03 June 08 00:00. The air stagnated as a pressuregradually strengthened and centered over Mace Head andanti-cyclonic conditions were observed for most of the timeduring this period. The lowest wind speed (6.4± 3.8 m s−1;Table 1) of the five periods occurred during this period.
www.atmos-chem-phys.net/10/8413/2010/ Atmos. Chem. Phys., 10, 8413–8435, 2010

8418 M. Dall’Osto et al.: Aerosol properties associated with air masses
Fig. 1. Typical air mass back trajectories for(a) cP, (b) cmP(c) mP, (d) mT, (e)mAair masses and(f) MODIS chlorophyll-a maps.
Table 1. Summary of the five different periods.
Period Number of days Air masses
16 May 08 00:00–29 May 08 12:00 13.5 Continental Europe (cP)
29 May 08 12:00–03 June 08 00:00 4.5 Continental-Marine (cmP)
03 June 08 12:00–08 June 08 00:00 4.5 Polar Marine (mP)
08 June 08 00:00–10 June 08 00:00 2.0 Tropical Marine (mT)
10 June 08 12:00–15 June 08 00:00 4.5 Arctic Marine (mA)
Atmos. Chem. Phys., 10, 8413–8435, 2010 www.atmos-chem-phys.net/10/8413/2010/

M. Dall’Osto et al.: Aerosol properties associated with air masses 8419
Table 2. Meteorologiacal conditions.
PERIOD WS [m/s] WD [◦] Temp [◦] RH [%]
Continental Europe (cP) 13.1± 5.2 108± 59 12.4 m± 1.7 79.9± 11.2
Continental-Marine (cmP) 6.4± 3.8 185±92 14.5± 1.7 89.6± 7.2
Polar Marine (mP) 12.6± 5.0 242± 44 12.8± 1.3 77.1± 9.5
Tropical Marine (mT) 8.58± 4.0 244± 31 14.5± 0.8 91.9± 5.4
Arctic Marine (mA) 10.4± 2.7 300± 39 13.1± 1.4 86.2± 10.4
Fig. 2. Decoupled boundary layer on JD153 (01/06/2008). Black points mark the top of the SML while the red crosses mark the top of theoverlying DRC layer (the main boundary layer – free troposphere inversion. It should be noted that the lowest 200 m represents the regionof incomplete overlap between the receiver field of view and the transmitted laser beam and should be disregarded as unusable data.
Marine Polar (mP):From 03 June 08 00:00 to 08 June 0900:00, this polar marine period (4.5 days) was subjected to airmasses emerging from polar regions around southern Green-land and advecting south-east over the North Atlantic andinto Europe (advecting through).
Marine Tropical (mT):This tropical maritime, or perhapsmore accurately sub-tropical maritime, period lasted fromabout 08 June 08 00:00 to 10 June 09 00:00 (about 2 days)and was characterized bye 5-day back trajectories indicatingan origin from the Azores high-pressure region. Whilst theaverage wind direction is similar to period 3 (242± 44◦ and244± 31◦), the temperature and the RH of period 4 (Table 2)are both higher than period 3 (polar marine) supporting thewarmer tropical or sub-tropical conditions.
Arctic Marine (mA):This Arctic marine period lasted for4.5 days from 10 June 08 12:00 to 15 June 08 00:00 with aircoming mainly form the north Scandanavian Arctic regions,advecting out over the Atlantic region towards Iceland beforeadvecting southwards to Mace Head (Table 2, WD 300± 39◦
supporting the Northerly wind conditions).Also shown in Fig. 1 is the MODIS chlorophyll-a average
mass concentration distribution over the period. It can be
seen that peak concentrations occur to the north waters andminimum to the south west approaches.
Boundary layer structure:characteristic of this region,with warm waters, the marine boundary layer is typically2-layered with a surface mixed layer (SML) and a decou-pled residual or convective layer (DRC), above which is theFree Troposphere (Kunz et al., 2002). An example of de-coupled marine boundary layer, as detected by the ceilome-ter (aerosol backscatter gradient) is shown in Fig. 2 (case01 June 2008) where the SML is sharply decoupled from theoverlying DRC layer. For all periods, by air mass category,the boundary layer structure is illustrated through a combi-nation of specific humidity profiles from the radiometer and,superimposed in Fig. 3, the SML and DRC layer heights de-rived from the ceilometer. Good agreement is seen for mostoverlapping periods using the two approaches under most airmasses (noting that because of thick stratocumulus cover inthemT case, the top of the boundary layer (or cloud top) isnot detected with the ceilometer.
From the ceilometer data, the daily averaged SML andDRC depths for all cases through the studied period areshown in Fig. 4 where the boundary layer structure exhibits
www.atmos-chem-phys.net/10/8413/2010/ Atmos. Chem. Phys., 10, 8413–8435, 2010

8420 M. Dall’Osto et al.: Aerosol properties associated with air masses
Fig. 3. Boundary Layer stratification observed from the HATPRO microwave profiler absolute humidity product with Lidar-Ceilometerderived layer structure superimposed on the humidity contour plot. The y-axis is kilometers a.g.l. where ground level is approximately 15 ma.s.l. The x-axis is Julian Day (JD).
Fig. 4. Boundary Layer (residual and convective) height and Sur-face Mixed Layer height from 15 May 2008 at Mace Head. They-axis is meters a.g.l. where ground level is approximately 15 ma.s.l. The x-axis is Julian Day (JD). The vertical lines separate thedifferent air masses: from left to right, these correspond tocP, cmP,mP, mT, mA, respectively.
a high degree of variability throughout the period as illus-trated for the higher temporal resolution data in Fig. 3. Thedaily average height of the SML layer varied from 500 m toalmost 2000 m but was more typically in the range of 700 mto 1500 m. The overlying DRC, or main Free Troposphereinversion layer, has a minimum of 1500 m and maximum of2500 m. Both layers were typically highest for thecP airmass with the highest wind speeds and lowest for themP, mTandmAair masses. Surprisingly there was no notable differ-ence between the latter three types. Further, in all air massesno significant diurnal variation was observed as is typical ofcP air masses (e.g. Nilsson et al., 2001). Further analyseswhere the daily averages over each period are analysed illus-trates differences betweenmP, mT andmAare more evidentwith decreasing average daily depth development followingthe ordercP, cmP, mP, mA, andmT.
3.2 Aerosol concentration and size distributions
The frequency distribution of 2-min average total par-ticle concentrations (D > 3 nm), shown in Fig. 5, ex-hibits four modes in log-concentration space. One mode
Atmos. Chem. Phys., 10, 8413–8435, 2010 www.atmos-chem-phys.net/10/8413/2010/
M. Dall’Osto et al.: Aerosol properties associated with air masses 8421
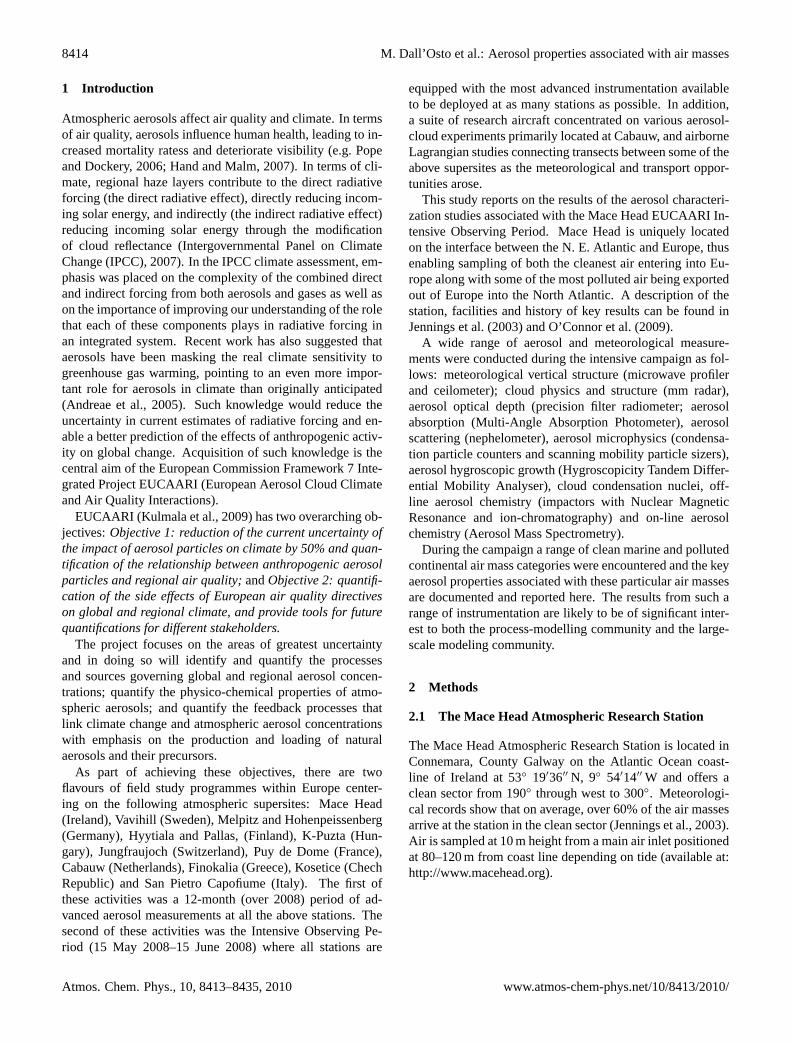
Fig. 5. Total aerosol/condensation nuclei concentrations (d > 3 nm)for all data including nucleation events (red) and all data exclud-ing nucleation events (black). The particle concentration data isaveraged over 2 min.
exists at concentrations of 400–600 cm−3, reflecting thebackground marine number concentration; a second modeat 800–900 cm−3 reflecting either modified marine air and/orclean marine air following open ocean nucleation events (dis-cussed later), a third mode at 3000–5000 cm−3. exists re-flecting the continental input and a fourth more centered on30 000–40 000 cm−3 exists, reflecting the coastal nucleationmode (O’Dowd et al., 1998).
A surface contour plot of the observed aerosol size dis-tributions (range 3.5 nm–500 nm) throughout the period isshown in Fig. 6. Overlaid on the plot are the time periodsover which the different air massed occurred and when thenucleation events were detected. Clearly, for the first two pe-riods (cP andcmP) of the campaign, a significantly higherloading of particle number concentration can be seen in theaccumulation mode. However, Mace Head is subjected tosignificant coastal, tidal-driven, nucleation events (O’Dowdet al., 1998, 1999, 2002; Grenfell et al., 1999) which influ-ence the particle number concentrations. During the inten-sive field study, 28 nucleation events were detected by thenano-SMPS/SMPS system. For the main air mass charac-teristic data presented in this study, the data were filtered toremove periods where nucleation events occurred, resultingin total data coverage of 78% for non nucleation periods, and22% of the nucleation periods. Moreover, there were few socalled special events like a biomass burning on 5th June for2 h (05:00–07:00) that were not considered in the analysis.
Average size distributions for non-nucleation periods inthe different air masses are presented in Fig. 7a. Both thecPandcmPsize distributions exhibited mono-modality witha modal diameter of 60 nm in both cases and respective av-erage concentrations of 3261 cm−3 and 3044 cm−3, althoughin the cP case, evidence of a less significant accumulationmode in the range of 200 nm–300 nm is evident. ThemTand mA cases are bimodal with an accumulation mode lo-cated at 250 nm formA and 300 nm formT cases. Both airmasses posed an Aitken mode with modal diameter of 50 nm
for mT air and 60 nm formAair. Average total particle con-centrations were 625 cm−3 and 795 cm−3 for mTandmAair,respectively.
For mPair masses, three modes were observed: an accu-mulation mode at 200 nm, an Aitken mode at 35 nm and anucleation mode (as distinct from coastal nucleation) at 15–20 nm. The number concentration associated with thesemTair masses was 625 cm−3, representing the lowest of all 5periods. FormPair, concentrations of 1025 cm−3 were high-est of the three marine cases and elevated due to the non-coastal nucleation mode. In summary, 3 size distributiongroups in non-nucleation periods in the different air masseswere found: (1) monomodality at about 60 nm forcP andcmPair masses (2) bimodality at about 50–60 nm and 250–300 nm formT andmA air masses; and trimodality at 15–20 nm, 35 nm and 200 nm formPair masses.
Previous studies conduced at Mace Head found typically,the sub-micron marine size distribution possessed a bi-modalshape, with an accumulation mode centered at 200 nm and afine mode at 40 nm (O Dowd et al., 2001). The bi-modal na-ture of the sub-micron mode is indicative of a cloud-residualaccumulation mode produced by the in-cloud growth of ac-tivated fine mode particles (Hoppel et al., 1994). O’Dowd etal. (2001) and Coe et al. (2006) reported that during anticy-clonic periods and conditions of continental outflow Aitkenand accumulation mode were enhanced by a factor of 5 com-pared to the marine sector, whilst coarse mode particles wereenhanced during westerly polar marine conditions.
The aerosol size distributions when coastal nucle-ation was occurring under the five different periods areshown in Fig. 7b. The stagnant conditions of period 2(cmP) led to highest period-average number concentration(N = 27 025 cm−3). O’Dowd et al. (2002) attributed themode extending to slightly larger sizes in polluted conditions(cP over thecmPcase) to the inter-tidal source of the pre-cursors being further from the measuring site and reflectinglonger particle growth times before detection, Periods domi-nated bymT air masses presented a different average aerosolsize distribution, with the lowest particle number concen-trations (3054 cm−3, respectively). Along with the typicalAitken mode and accumulation mode at 70 nm and 300 nm,respectively, the mode at 6 nm due to local nucleation canalso be seen. ThemAandmPperiods posses more ultrafineor nucleation modes structure representing multiple sourceregions contribution to the coastal nucleation events; how-ever, for mP air, these additional modes are likely to be alsoinfluenced by off-shore particle formation events.
www.atmos-chem-phys.net/10/8413/2010/ Atmos. Chem. Phys., 10, 8413–8435, 2010

8422 M. Dall’Osto et al.: Aerosol properties associated with air masses
Fig. 6. Aerosol size distributions from the combined nano-SMPS and SMPS. Air mass types are highlighted as are nucleation and non-nucleation events.
(a)
(b)
Fig. 7. (a) aerosol size distributions averaged by air mass and ex-cluding coastal nucleation events and(b) aerosol size distributionsaveraged by air mass during nucleation events.N in the key rep-resents total particle concentration per cm−3 from sizes between4–500 nm.
3.3 Aerosol chemical composition
3.3.1 On-line aerosol chemical composition
Black Carbon concentrations (MAAP andAethalometer)
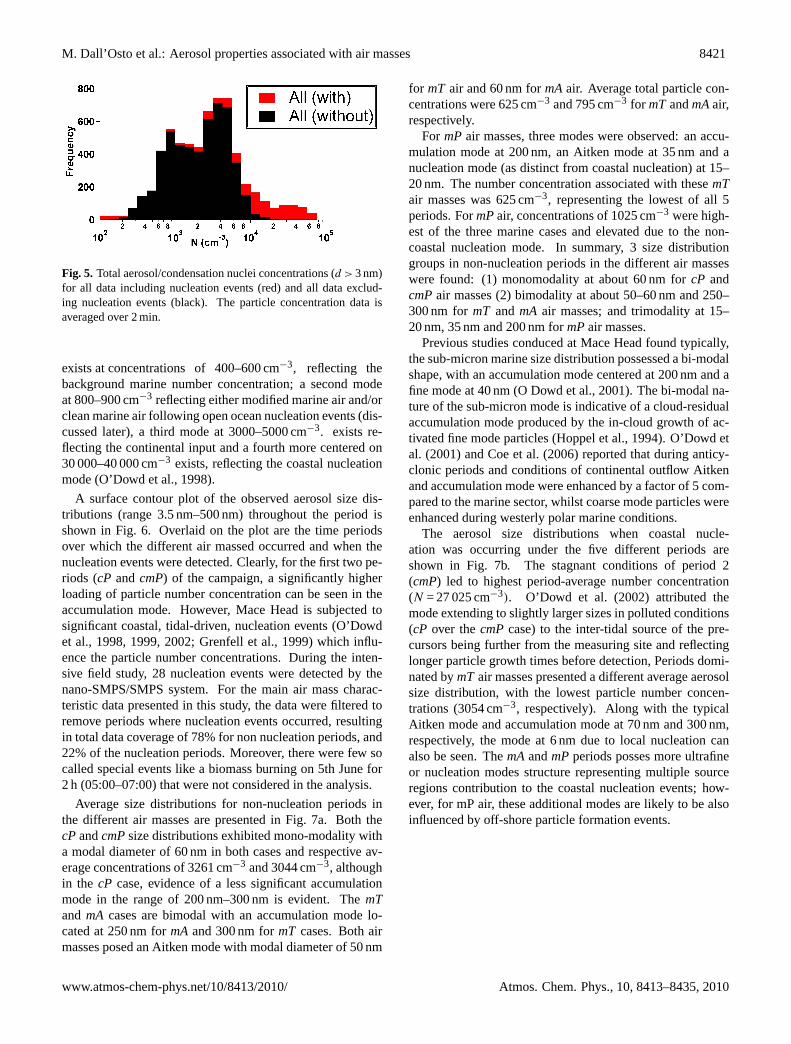
As shown in Fig. 8, the black carbon data exhibited two dis-tinct concentration groups, one representing period 1 and pe-riod 2 with concentrations above 300 ng m−3 (389± 202 and328± 115, respectively); and the other representing the last3 periods with much lower concentrations below 50 ng m−3
(25± 13, 45± 27, 17± 14 ng m−3 for period 3, 4 and 5 re-spectively), typical of clean N. E. Atlantic black carbon load-ings (O’Dowd et al., 1993). The Aethalometer showed asimilar trend, but for the polluted period (periods 1 and 2)it underestimated the MAAP concentration while in cleanair masses (periods 3, 4 and 5) it overestimated the MAAPconcentrations. These issues are discussed in more detail byJennings et al. (2008) and were attributed to the impact ofsea salt and relative humidity on the performance of AE-16;however, a conclusive explanation of the two absorption in-struments remains to be addressed.
PM2.5 mass and AMS (size resolved mass spectrometry)composition and mass
Table 3 shows the average PM2.5 concentrations for the 5different periods, including average mass concentrations ob-tained from the AMS for nitrate, sulphate, MSA, organicsand ammonium. AMS chemical concentrations are illus-trated in Fig. 9. The highest PM2.5 mass loadings wereencountered during the polluted periods, whilst the lowest
Atmos. Chem. Phys., 10, 8413–8435, 2010 www.atmos-chem-phys.net/10/8413/2010/
M. Dall’Osto et al.: Aerosol properties associated with air masses 8423
Table 3. PM mass and AMS derived sulphate, organic, MSA, nitrate and ammonium mass.
TEOM AMS AMS AMS AMS AMSPM2.5 [µ m−3] organics nitrate sulphate MSA ammonium
Continental 12.4± 11.1 1.42± 0.35 0.64± 0.16 1.31± 0.33 0.10± 0.02 0.70± 0.18Europe (cP)
Continental- 10.3± 7.2 1.75± 0.44 0.26± 0.07 1.15± 0.29 0.05± 0.01 0.48± 0.12Marine (cmP)
Polar 8.6± 6.8 0.11± 0.03 0.04± 0.01 0.67± 0.17 0.13± 0.03 0.08± 0.02Marine (mP)
Tropical 8.7± 5.2 0.17± 0.04 0.06± 0.02 1.81± 0.45 0.28± 0.07 0.24± 0.06Marine (mT)
Arctic 7.1± 6.5 0.02± 0.01 0.04± 0.01 0.93± 0.23 0.16± 0.04 0.10± 0.03Marine (mA)
Fig. 8. Aerosol black carbon mass derived from the AethalometerA-16 and the the MAAP.
during themA period. Although the AMS total mass load-ing were the lowest for themPperiod, this was not reflectedin the PM2.5 loading and it is thought to be due to the highersea salt contribution during themPperiod. Nitrate mass load-ings were higher for the polluted periods undercP andcmPair masses with 0.3± 0.5 µg m−3 and 0.12± 0.06 µg m−3, re-spectively; whilst for the other 3 periods it was found to bebelow 0.005 µg m−3. Sulphate was found to be the dom-inant species detected with the AMS during themP, mTand mA periods, with concentrations of 0.34± 0.2 µg m−3,0.93± 0.45 µg m−3 and 0.47± 0.3 µg m−3, respectively. Incontrast, duringcP andcmPperiods, sulphate was the sec-ond most abundant species after organics with average con-centration of 0.67± 0.31 µg m−3 and 0.58± 0.29 µg m−3, re-spectively. Regarding the AMS ammonium average concen-tration, when air masses were anthropogenically-influencedthere was complete aerosol neutralization. However, duringclean marine periods (3, 4 and 5) concentrations of ammo-nium were significantly smaller than the sulphate concentra-tions (see Table 3). The organic AMS average mass concen-tration was found to be 0.74± 0.44 µg m−3, with the high-est concentrations (0.89± 0.4 µg m−3) occurring for thecmP
Fig. 9. AMS-derived organic, nitrate, sulphate, MSA, and ammo-nium mass as a function of air mass.
period. The ratio of sulphate/organic mass for thecmPperiodwas also found to be higher than thecP period (1.5 vs. 1.1).The significant diversity in the average chemical mass spec-tra observed during the 5 different periods will be the sub-ject of more detailed investigations in future studies wherea detailed analysis from the high resolution ToF-AMS massspectrum will be presented.
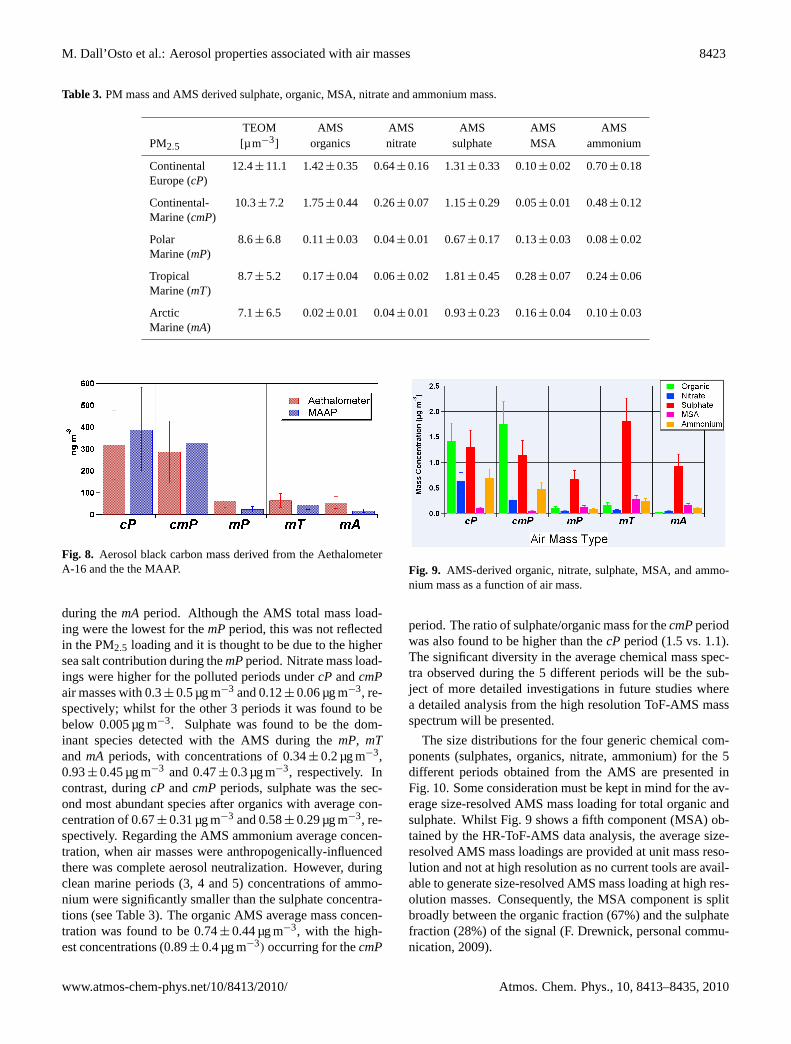
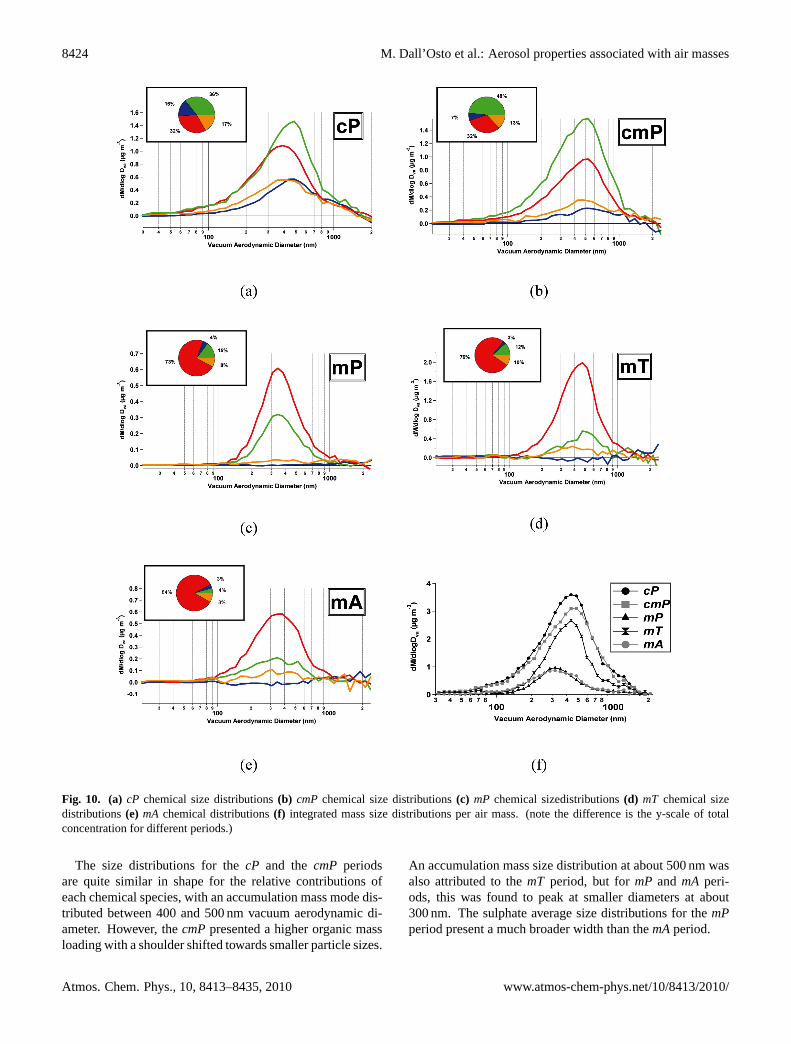
The size distributions for the four generic chemical com-ponents (sulphates, organics, nitrate, ammonium) for the 5different periods obtained from the AMS are presented inFig. 10. Some consideration must be kept in mind for the av-erage size-resolved AMS mass loading for total organic andsulphate. Whilst Fig. 9 shows a fifth component (MSA) ob-tained by the HR-ToF-AMS data analysis, the average size-resolved AMS mass loadings are provided at unit mass reso-lution and not at high resolution as no current tools are avail-able to generate size-resolved AMS mass loading at high res-olution masses. Consequently, the MSA component is splitbroadly between the organic fraction (67%) and the sulphatefraction (28%) of the signal (F. Drewnick, personal commu-nication, 2009).
www.atmos-chem-phys.net/10/8413/2010/ Atmos. Chem. Phys., 10, 8413–8435, 2010
8424 M. Dall’Osto et al.: Aerosol properties associated with air masses
Fig. 10. (a) cP chemical size distributions(b) cmP chemical size distributions(c) mP chemical sizedistributions(d) mT chemical sizedistributions(e) mA chemical distributions(f) integrated mass size distributions per air mass. (note the difference is the y-scale of totalconcentration for different periods.)
The size distributions for thecP and thecmP periodsare quite similar in shape for the relative contributions ofeach chemical species, with an accumulation mass mode dis-tributed between 400 and 500 nm vacuum aerodynamic di-ameter. However, thecmPpresented a higher organic massloading with a shoulder shifted towards smaller particle sizes.
An accumulation mass size distribution at about 500 nm wasalso attributed to themT period, but formP and mA peri-ods, this was found to peak at smaller diameters at about300 nm. The sulphate average size distributions for themPperiod present a much broader width than themAperiod.
Atmos. Chem. Phys., 10, 8413–8435, 2010 www.atmos-chem-phys.net/10/8413/2010/
M. Dall’Osto et al.: Aerosol properties associated with air masses 8425
ATOFMS (single particle mass spectrometry)
20 ATOFMS clusters were obtained by applying ART-2a al-gorithm to the ATOFMS dataset. Some of the clusters pre-sented very sharp temporal trends, including biomass eventsand nucleation processes and are not discussed here. The aimof this section is to present a general overview of the mix-ing state of different aerosol particle types under different airmasses. The main particle type represented about 50% of thepopulation and it was found to be rich in sodium, potassiumand sulphate. The ATOFMS is very sensitive to alkali metalcations (Gross et al., 2000) and since sodium and potassiumare present in large abundance in sea salt particles, it is notsurprising that these are the only peaks visible in some spec-tra. It should be noted that this particle type internally mixedwith alkali metal cations and sulphate but with no nitrate isonly typically seen by the ATOFMS deployed in remote ma-rine sites (Furutani et al., 2008). Nitrate-rich particles werefound to be associated with periodscP andcmP. This parti-cle type was internally mixed with Na, K, OC and EC. TheATOFMS mass spectra of this particle type transported fromcontinental Europe was found to be almost identical to parti-cle types previously associated with long range transport ofaerosol arriving in the bigger close British Isle (Dall’Ostoet al., 2008, 2009). Within thecP air mass period, someair masses arriving at Mace Head had travelled across main-land Europe and the UK. During our study we found twomain trends: anthropogenic influenced aerosol which passedthroughout France and Spain was rich in OC and sulphate,whilst aerosol which passed mainly throughout England andthe north part of Europe was enriched in K, EC and nitrate.During themPandmAperiods, sub micron particles detectedwith the ATOFMS were found to be mainly internally mixedwith K and OC, suggesting sea salt particles containing afraction of organic material.
Two types of clusters associated with sea salt particleswere found, named pure sea salt and aged sea salt, repre-senting 14% and 2.2% of the ATOFMS particles classified,respectively. Pure sea salt particles were detected only duringthe last 3 periods (mP, mT andmA) air masses, whilst agedsea salt particles were encountered during the first two weeksof the EUCAARI intensive campaign (cP and cmP) pre-sented. In the ATOFMS positive ion spectra of pure sea saltparticle type, peaks were present form/z23 [Na]+, m/z39[K] +, m/z46 [Na2]+, andm/z81 andm/z83 [Na2Cl]+, whilstin the ATOFMS negative spectram/z−23 [Na]−, m/z−35and−37 [Cl]− were dominant. Along with the peaks de-scribed for the pure sea salt particles, additional peaks atm/z63 [HNO3]+/ [Na2OH]+, [NO2]− (m/z −46) and [NO3]−
(m/z−62) were present for the aged sea salt particle type.There particle types were previously classified indicating thereaction between NaCl and HNO3 and the replacement ofchloride by nitrate (Gard et al., 1998; Dall’Osto et al., 2004).No pure sodium nitrate particles were found during this field
study, but all the aged sea salt particles were internally mixedwith both chloride and nitrate.
The ATOFMS revealed a main particle type for themTpe-riod. This particle type was in the coarse mode (1–2 µm insize) and it was found to be internally mixed with organic car-bon, sea salt, sulphate and MSA. Interestingly, peaks atm/z48 andm/z64 (Ti and TiO, respectively) were also presentin the ATOFMS positive mass spectrum, suggesting that dustwas internally mixed with sea salt, carbon and MSA. Tita-nium rich particles (along with aluminosilicate) were alreadyidentified during the NAMBLEX project under air masses(Dall’Osto et al., 2004) originated from the Azores high-pressure region which drawn air from North Africa. TheATOFMS used for the EUCAARI field study was equippedwith aerodynamic lens, which focuses single particles in adifferent way that the previous ATOFMS version used dur-ing the NAMBLEX project (where air is introduced into theATOFMS via a vacuum system region through a convergingnozzle followed by two differentially pumped regions sepa-rated by skimmers which finally create a narrow collimatedparticle beam). No dust Ti-rich particle types were foundduring the EUCAARI intensive field study, and the reason islikely to be due to the inefficiency of the aerodynamic lensto focusing dust particles. However, two other dust particletypes were monitored during the EUCAARI field study. Theformer dust particle type was found to be rich in iron (thisATOFMS particle type represented 0.9% of the total parti-cles sampled and its positive mass spectrum showed signalsdominated bym/z54 andm/z56). Interestingly, this parti-cle type presented similar temporal trends of the Nitrate-richparticle type, indicating transport of iron containing aerosolfrom continental Europe and likely to be important in the irondeposition in the North Atlantic (Baker and Croot, 2009).The latter represented 0.4% of the particles sampled and wasnamed V-rich after its peculiar ATOFMS positive particlemass spectrum dominated bym/z51 [V] and m/z67 [VO].Vanadium and nickel are usually used as tracers for oil com-bustion sources. This particle type was found only duringthe first two weeks of the field study, when air masses wherecoming from Continental Europe. No V-rich particle typeswere found coming from the other 3 marine air masses (mP,mA andmT) excluding a contribution from ship emissions.The fact that more V-rich particle types were found morewithin the former 2 weeks of the field study respect the lat-ter 2 weeks suggest that the Vanadium contribution from oilcombustion might be higher than the ones due to ship emis-sions.
3.3.2 Off-line chemistry
During the intense campaign seven aerosol samples for off-line chemical analyses were collected: five samples duringthecP period, one during themPperiod and one during themA period. No samples were collected for thecmPperiodand themPperiod. Concentrations referring to thecPperiod
www.atmos-chem-phys.net/10/8413/2010/ Atmos. Chem. Phys., 10, 8413–8435, 2010

8426 M. Dall’Osto et al.: Aerosol properties associated with air masses
Fig. 11. Absolute (left panel) and relative (right panel) chemicalcomposition of the aerosol samples collected incP, mPandmAairmasses.
are reported as the average of the five samples± the stan-dard deviation, while the single sample values are indicatedfor periodsmPandmA. Figure 11 shows the absolute (A) andrelative (B) chemical composition of particles collected dur-ing periodcP, mPandmAas a function of size. Continentallyinfluenced air masses were characterized by higher submi-cron particle loads than clean marine ones: total submicronanalyzed mass was 5.2± 2.0, 1.3 and 0.98 µg m−3 in cP, mPandmAair masses, respectively.
The highest supermicron particle load was observed in themPsample: 12 µg m−3, against 3.2± 1.1 and and 2.5 µg m−3
measured incP and mA air masses, respectively. Beingcoarse mass, in clean marine aerosol, determined mainly bysea salt, the high coarse particle load of themPsample mustreflect higher wind speed and rougher sea conditions duringperiodmP.
Continentally influenced aerosol presented a bimodalmass size distribution with the mass peak in the 0.25–0.5 µmsize range and a second mode centred in the 2.0–4.0 µm sizeranges; marine aerosol mass size distribution was, on the
contrary, dominated by large particles, with mass peaks in the4.0–8.0 or 2.0–4.0 µm size ranges. Similar chemical compo-sitions were observed between the two clean marine samples,while larger differences were observed between continentallyinfluenced and clean marine samples, both in fine and coarsefraction. An average submicron nss-sulphate concentrationof 1.7± 0.4 µg m−3 was observed during periodcP, account-ing for 33% of the analyzed submicron mass, while sulphateconcentrations were 0.40 (32%) and 0.45 µg m−3 (45%) dur-ing periods 3 and 5, respectively. A substantial contribu-tion of nitrate in submicron particles characterized period 1(0.53± 0.60 µg m−3, accounting for 10% of the mass), whilenitrate contribution during periods 3 and 5 was only 0.4 and1%, respectively, due to concentrations of the order of fewnanograms per cubic meter. Submicron ammonium con-centration was 0.84± 0.36 µg m−3 (16%) during period 1,0.076 µg m−3 (6%) during period 3 and 0.085 µg m−3 (9%)during period 5. Sea salt contributed to submicron mass with0.061± 0.023 (1%), 0.31 (24%) and 0.060 µg m−3 (6%) incP, mPandmAair masses, respectively.
MSA was the main organic compound identified in bothcontinentally influenced and clean marine air masses. MSAconcentration was 0.36± 0.08, 0.36 and 0.28 µg m−3 in cP,mP andmP air masses, respectively, accounting for 7% ofsubmicron mass in continentally influenced air masses and29% in both clean marine samples. Moreover, MSA ac-counted for about 50% of the water soluble organic carbonin clean marine samples and only 7% in continentally influ-enced air masses. Previously reported MSA contributions toWSOC concentrations measured in clean marine air massesat Mace Head are∼ 15% (Facchini et al., 2008a) – the cur-rent results reflect the natural variability of the N. E. Atlanticbiosphere.
For example, MSA concentrations measured during thecampaign were almost an order of magnitude higher thanthe concentrations published by Yoon et al. (2007) for thesame site, in the same period of the year, and about three-fold higher than the maximum value reported for the monthof July. In fact, preliminary evaluation of MSA levels us-ing the HR-ToF-AMS elude to concentrations 2–3 timeshigher inmT air compared to the other air masses outlinedabove. Comparably high concentrations have been reportedby other investigators (McArdle et al., 1996; Savoie et al.,2002) at Mace Head. The nssSO−2
4 /MSA molar ratio was4.7± 1.6, 1.1 and 1.6 in periodscP, mP and mP, respec-tively. Savoie et al. (2002) proposed 3.01 (± 0.53) as ma-rine biogenic nssSO−2
4 /MSA ratio at Mace Head: the lowerratio characterising the clean marine samples during the cam-paign can be attributed to the high latitude origin of the airmasses (Bates et al., 1992; Kerminem and Leck, 2001). Thepretty low nssSO−2
4 /MSA molar ratio of period 1 suggests asubstantial biogenic marine contribution also during periodcP. The nssSO−2
4 /MSA molar ratio derived from the AMSmeasurements are of the order of 2–5 times higher than forthe impactor data (Table 4), presumably due to the notable
Atmos. Chem. Phys., 10, 8413–8435, 2010 www.atmos-chem-phys.net/10/8413/2010/

M. Dall’Osto et al.: Aerosol properties associated with air masses 8427
Table 4. Ratios of nss-Sulphate to MSA for the AMS and impactormeasurements.
Period Ratio nssSO2−
4 /MSA
AMS Impactors
cP 13.3 4.7
cmP 21.4 NA
mP 5.1 1.1
mT 6.4 NA
mA 5.8 1.6
supermicron fraction of MSA in the impactor samples (seebelow) which is not characterized by the AMS.
Finally, different MSA size distributions were observedfor anthropogenic influenced and clean marine aerosol sam-ples: during periodcP, MSA was prevalently present in thesubmicron fraction, with a fine-to-coarse ratio of 8.9, whilethe ratio lowered to 1.3 and 1.9 in samples collected inmPandmAair masses, respectively. This different can be due tothe different chemical composition of the coarse fraction inclean and polluted aerosols (see below) influencing the par-titioning of MSA.
Submicron non-MSA-WSOM concentration was1.2± 0.5 (22%), 0.068 (5%) and 0.048 (5%) µg m−3 incP, mPandmAaerosol samples, respectively, while WIOMconcentration was 0.55± 0.41 (11%), 0.045 (4%) and 0.047(5%) µg m−3. The composition of WIOM has not beeninvestigated, however in anthropogenic influenced particlesit represents mainly primary emissions by fossil fuel, andeventually biomass, burning comprising also BC, not speci-ated by the employed analytical technique. In clean marinesamples the contribution of BC to WIOM can be considerednegligible and WIOM can be associated almost entirelyto primary production from the ocean surface (Facchiniet al., 2008b). The contribution of primary and non-MSAsecondary organics in clean marine aerosols during thecampaign resulted lower than reported in previous papers(O’Dowd et al., 2004; Cavalli et al., 2004).
Submicron particles acidity showed sensitive differencesbetween continentally influenced and clean marine aerosols.Following the approach of Ziemba et al. (2007), submicronaerosol acidity was estimated by the equivalent ratio betweenNH+
4 and the sum of NO−3 , SO−24 and MS−. Submicron
anthropogenic influenced aerosol resulted almost neutralized(ratio = 0.98± 0.04), while clean marine particles presentedratios of 0.35 (mP) and 0.38 (mA) typical of acid particles.Supermicron particles chemical composition was dominatedby sea salt in clean marine aerosol samples (12 µg m−3 (96%of the mass) and 2.0 µg m−3 (82%) inmPandmAair masses,respectively). Sea salt was an important component also inanthropogenic influenced aerosol (1.5± 0.9 µg m−3, 47% of
Fig. 12. 1H NMR chemical characterization of WSOC as a func-tion of the air mass origin
the mass). NO−3 was the second major component of coarseparticles during periodcP (1.1± 0.5 µg m−3, 34%), suggest-ing a significant contribution of secondary processes involv-ing coarse sea salt particle, mainly the reaction between ni-tric acid and sodium chloride, producing sodium nitrate andhydrochloric acid. Processing was evident also in clean ma-rine samples with nitrate contributing 0.10 µg m−3 (1%) and0.12 µg m−3 (4%) during periodmPandmA. A contributionfrom crustal components cannot be excluded during periodcP even though they cannot be quantified by the employedcharacterization techniques.
1H-NMR spectral features of clean marine submi-cron aerosols were remarkably different with respect tothose characterizing the anthropogenic-influenced samples(Fig. 12). In particular MSA signal accounted for up toone third of the total detected signal in clean marine sam-ples while contributed in much less extent to thecPsamples.Beside MSA, the most abundant aliphatic moieties are thosecontaining unsubstituted saturated carbon atoms (H-C) in allthree samples types, and the ratio of H-C groups to substi-tuted aliphatic groups, H-C-O and H-C-C=, is not remark-ably different formAandmPwith respect tocP, suggestinga similar degree of functionalization of aerosol WSOC char-acterizing the three air masses. However, the speciation ofaliphatic functionalities changes between samples, with themA case showing the highest proportion of alcohols/ethers(H-C-O), whilemPandcP exhibit a relatively higher contri-bution from aliphatic groups adjacent to carbonyls, carboxylsand other unsaturated structures (H-C-C=). Therefore, thesamples of clean marine air show variations in their WSOCcomposition related to air mass origin.
Anthropogenic-influenced samples present a higher frac-tion of aromatic hydrogen atoms (3.8%) with respect to clean
www.atmos-chem-phys.net/10/8413/2010/ Atmos. Chem. Phys., 10, 8413–8435, 2010

8428 M. Dall’Osto et al.: Aerosol properties associated with air masses
marine ones (0.38 and 0.55% inmP andmA respectively).The low aromatic content ofcP samples compared to “typ-ical” pollution aerosols in continental areas (7–10% accord-ing to Matta et al., 2003; Mayol-Bracero et al., 2002 andDecesari et al., 2007) can result from the mixing with marineparticulate organic compounds (which are mainly aliphatic)and possibly from oxidative degradation of the aromatic moi-eties during the transport from the source areas in Europe.HMSA (hydroxymethanesulfonate), which is formed in theatmosphere by the reaction of SO2 with formaldehyde, wasclearly detected in all the samples. Others identified singlecompounds such as acetate and formate were found in bothclean marine and anthropogenic influenced samples.
3.4 Aerosol hygroscopicity
As in the SMPS data analysis, periods with nucleation wereremoved from the H-TDMA analysis. The H-TDMA showedsignificantly different GFs for aerosols occurring under dif-ferent air masses (Fig. 13). The GF-PDF forcP and cmPair masses exhibited peaks all below 1.45 at different sizes(35 nm, 50 nm, 75 nm, 110 nm, 165 nm), whilst all the GFfor the other 3 air masses (mP, mT, andmA) show GF peaksabove 1.35 and below 1.5. This range of GFs indicates thatthe majority of particles have GFs notably less than ammo-nium sulphate for the selected sizes (Nilsson et al., 2009).With the current instrument configuration, it could not be dis-cerned what fraction of the aerosol had GFs corresponding topure sea-salt (GF = 2.2).
More specifically,cP air masses exhibit a large differ-ence in GFs (broad peaks between 1.2 and 1.5) across sizessuggesting a different chemical composition for particlesof different sizes, slowing the GF shifting towards highervalues as the particle diameter increases (progression from35 nm sizes with GF∼ 1.27± 0.05 to 165 nm sizes with GF∼ 1.38± 0.05). A second mode at about 1–1.2 can be seenin the GF-PDF for thecP case, indicating a small fraction ofvery low solubility particles.cmPair masses exhibit a dif-ferent GF-PDF distribution compared to thecP air masses,with generally lower GFs for all sizes. At least 3 particletypes with 3 different GF from 1.0 to 1.5 can be seen un-der these conditions, with a reducing GF for reducing par-ticle sizes. The contrasting and lower GFs associated withcmPair masses compared tocP air masses suggest a greateramount of less oxidized organic aerosol associated with thecmPair masses and point to more local sources of organicaerosol. mP air masses probably represented the simplestgroup, with a GF of 1.45± 0.05 for all the different sizesshowing an internally mixing state and one broad type ofparticles at least for sizes at 35 and 50 nm. The bigger sizes(110 nm and 165 nm) show a broader GF-PDF distributionacross smaller GF suggesting a contribution of a less solubleparticle type at higher sizes. ThemT period shows similarGF-PDF for mid-sized particles at 50 nm and 75 nm, withaverage GF at 1.5± 0.09, and for the smallest and largest
Fig. 13.Hygroscopic growth factors for 35, 50, 75, 110, and 165 nmdry particles forcP, cmP, mP, mT andmAair masses. Also shown,in the vertical lines are the growth factors for pure ammonium sul-phate for the corresponding colour coded dry sized particle. GrowthFactors in the measurements are limited to a maximum of 2 andtherefore do not capture Growth Factors of 2.2 associated with puresea-salt.
sizes sampled (35 nm and 165 nm) a slightly lower GF of1.47± 0.1 is observed. ThemA period, similar to themTperiod, comprises two GF modes for two groups of particlesizes: namely GF∼1.45 for 110 nm and 165 nm particles,and GF∼ 1.52 for 35, 50 and 75 nm particle sizes. A de-tectable mode at 1.1 can also be seen 35 nm particles, indi-cating a contribution of small particles with very low watersolubility.
The above GF results are indicative of significant devia-tions from a marine aerosol population dominated by nss-sulphate, although it is not possible to comment on the simi-larity to sea-salt. GFs are always notably less that of pure am-monium sulphate GFs. Depending on the size being consid-ered, significant enhancement of secondary organic aerosolamongst the smallest sizes, and significant enhancement ofprimary marine organic aerosol is consistent with the obser-vations. These GF results are in stark contrast to GF stud-ies reported in other oceanic regions, as summarized below;however, they are consistent with the emerging picture ofN. E. Atlantic marine aerosol being significantly enrichedin both water soluble and water insoluble organic aerosol(O’Dowd et al., 2004). In particular, comprehensive fieldstudies in the past include the Aerosol Characterization Ex-periments ACE 1, ACE 2 and ACE 3 which determinedthe physical, chemical, and optical properties of aerosolsin the marine boundary layer over the Pacific and SouthernOceans and over the eastern Northern Atlantic Ocean (Berget al., 1998; Swietlicki et al., 2000) and the Southern AtlanticOcean or the Indian Ocean (Massling et al., 2003).
The average GFs for the studies of Massling et al. (2003)at 90% RH ranged between 1.66 and 1.74 for 50 nm particles,between 1.80 and 1.93 for 150 nm particles, and between1.84 and 2.03 for 250 nm particles. These values agreed withthose for marine aerosols measured during experiments con-duced over the Pacific Ocean and Southern Ocean, namely,
Atmos. Chem. Phys., 10, 8413–8435, 2010 www.atmos-chem-phys.net/10/8413/2010/

M. Dall’Osto et al.: Aerosol properties associated with air masses 8429
1.66 for 50 nm particles and 1.78 for 150 nm particles (Berget al., 1998). However, the average GFs for the clean ma-rine air masses ranged between 1.66 and 1.74 (50 nm), 1.86and 1.93 (150 nm), and 1.91 and 2.03 (250 nm). In general,relatively high GFs of more hygroscopic particle fractionscorrespond well with the measured chemical inorganic com-position. For most time periods, ammonium ions and sul-fate ions dominated the molar distribution, signifying thatthe major inorganic compounds were hygroscopically activematerial, such as ammonium sulfate, ammonium bisulfate,and sulfuric acid. In addition, during clean marine air massconditions at Puerto Rico (Allan et al., 2008), the submicronaerosol was observed to be almost entirely inorganic and sup-ported by hygroscopicity observations where the GF spectrashowed a consistent mode around 1.5–1.6. This is quite closeto the GF that are predicted for ammonium sulphate. Morerecently (Allan et al., 2009) again reported GFs of about 1.6–1.8 for different particle sizes during clean marine conditionsencountered in the Eastern Atlantic area of Cape Verde.
Our study shows clearly lower GF, implying probably adifferent chemical composition, likely to be due to less sol-uble organic components. Our studies support the finding ofSellegri et al. (2009).
3.5 CCN properties
Figure 14 shows that the CCN total number concentrationshad the same trends going from polluted to progressivelycleaner air masses, showing a decrease in number concen-tration. Peak CCN concentrations of∼ 1600 cm−3 occurredin cP air masses for supersaturations of 0.5%–1%, decreas-ing to 740 cm−3 at a supersturation of 0.1%. incmPair, peakconcentrations of∼ 1300 cm−3 were observed for 0.5%–1%supersaturation, decreasing to∼ 530 cm−3 at 0.1% supersat-uration. For bothcPandmcPair masses, the concentration ofCCN between 0.5% and 1% supersaturation does not effec-tively change, indicating all CCN are activated at 0.5% super-saturation. ThemT andmAsupersaturation spectra are moreor less identical, with∼ 400 cm−3 nuclei activated at 1% su-persaturation, decreasing to∼ 200 cm−3 for 0.1% supersatu-ration (specifically 230 cm−3 and 166 cm−3 for mAandmT,respectively. In terms of CCN activation ratio (i.e. the ra-tio of CCN activated at a give supersaturation over the totalcondensation nuclei concentration at sizesd > 10 nm), thelowest ratio occurred for thecmPair mass, increasing from0.15 at 0.1% supersaturation to∼ 0.4 at 1% supersaturation.In cPair, the ratio ranges from 0.2 to 0.5 over the same rangeof supersaturations. For bothmAandmTair masses, the ratioranges from 0.4–0.7 over the same range of supersaturations.During this campaign, CCN data was not available for themPair mass period.
Fig. 14. (Top) CCN concentrations as a function of supersaturationand air mass classification. (Bottom) Ratio of CCN to total Con-densation Nuclei at sizes larger than 10 nm diameter.
3.6 Aerosol optical properties
A Black Carbon (BC) mass attenuation efficiency of16.6 m2 g−1, specified by the Aethalometer manufacturer,Magee Scientific, was used in this work to convertthe aerosol absorption data into BC mass concentra-tions. Aerosol absorption data for this intensive fieldstudy were in line with previous results (Junker et al.,2006), with aerosol light absorption of 5.2±2.66 Mm−1,4.61± 1.69 Mm−1, 0.56± 0.33 Mm−1, 0.74± 0.41 Mm−1
and 0.38± 0.26 Mm−1for cP, cmP, mP, mT andmA M, re-spectively.
Nephelometer scattering data for this field study are shownin Fig. 15 for different wavelength and different periods ofthe field study. A progressive decrease over the five periodscan be seen for all the 3 wavelengths. However, differentbehaviors can be further noticed when the ratio between thesignals obtained from different wavelength is calculated. ThemPperiod shows the highest ratio for 700 nm/450 nm wave-lengths and 550/450 wavelengths ratios, implying coarserparticles (seasalt– as seen from the impactor chemical anal-ysis). A contrasting trend is seen for thecP period, suggest-ing a higher number of smaller particles during this period.
AOD values were highest in thecP air mass with val-ues slightly in excess of 0.35 at 367.6 nm wavelength, de-creasing to∼ 0.15 at 863.1 nm wavelength. The next largestAOD values were encountered in thecmPair mass, rangingfrom ∼ 0.25 at 367.6 nm to∼ 0.1 at 863.1 nm.cP air exhib-ited AOD values ranging from∼ 0.2 at 367.6 nm to∼ 0.15at 863.1 nm. Finally,mA air exhibited AOD values rangingfrom∼ 0.15 at 367.6 nm to∼ 0.05 at 863.1 nm. The values ofAOD at 501 nm incP, cmP, mPandmAare∼ 0.25,∼ 0.17,∼ 0.15 and∼ 0.1, respectively. No AOD was recorded dur-ing mT air due to complete cloud cover through that pe-riod. The spectral shape of the continentally-influenced airmasses demonstrate a sharper fall-off in AOD at longer wave-lengths compared to the maritime air masses, suggesting alesser influence of supermicron particles on AOD. What isalso interesting is the fact that thecmPAOD is notably less
www.atmos-chem-phys.net/10/8413/2010/ Atmos. Chem. Phys., 10, 8413–8435, 2010

8430 M. Dall’Osto et al.: Aerosol properties associated with air masses
that that associated withcP air, despite the remarkable sim-ilarities in microphysical properties such as size distributionand number concentration. However, differences are moreclear in GFs between the two air mass categories in thatcmP aerosol possesses a significantly lower growth factorthat aerosol incPair masses. Average relative humidity incPair was∼ 80% while incmPrelative humidity was∼ 90%.Despite the higher relative humidity incmPair, cP aerosolcontributes to a greater AOD. Consequently, the differencein AOD between the two air masses seems to be largely dueto the aerosol GF, and consequently, chemical composition.
These results (Figs. 15 and 16) are similar to those re-ported by Mulcahy et al. (2009) who reported 501 nm AODvalues of 0.14 under marine conditions and 0.19 for conti-nentals conditions. It should be noted that in Mulcahy etal. (2009), peak AOD in clean air reached 0.4 and was at-tributed to increased sea spray under high wind conditions(Mulcahy et al., 2008) and peak AOD values in continentalair was of the order of 0.5 for the most polluted case. TheAOD in the marine cases at 500 nm is in reasonable agree-ment, although generally larger than baseline AOD values of0.07 over the Atlantic Ocean (Kaufman et al., 2001) and of0.11 over the North Atlantic Ocean as measured by Ville-valde et al. (1994).
4 Discussion
A comprehensive set of meteorological and aerosol physico-chemical measurements were undertaken as part of the EU-CAARI Mace Head Intensive Observing Period. The re-sults characterize, in the most comprehensive manner to date,aerosol properties as a function of air masses entering (im-port of hemispheric pollution) and exiting (export of pol-lution to the N. E. Atlantic) Europe. From a meteorologi-cal perspective, wind speeds, temperatures and relative hu-midities were typical of the temperate latitudes associatedwith the measurement location. Period-average wind speedsranged from 6–13 m s−1 while temperatures ranged from 13–14.5◦C and relative humidity ranged from 80–92%. Fivetypical air masses, common to the region, were encountered.Two of these were polluted continental and three were cleanmarine. During all conditions, the marine boundary layercomprised two decoupled layers – a surface mixed layerand a decoupled residual/convective layer. The surface layerranged from 500 m to 2000 m while the top of the boundarylayer (also the top of the residual layer) ranged from 1500 mto 2500 m.
The two polluted cases were associated with high pressuresystems over Europe and differed in that thecP case trans-ported significant pollution, under moderately strong easterlywinds, from central Europe to Mace Head and was likely tocomprise predominately aged pollution. In contrast, thecmPcase, with the centre of the associated high located over orclose to Mace Head, was characterized by low winds and
Fig. 15. (A) 450 nm, 550 nm, and 700 nm scattering coefficientas a function of air mass categories,(B) absorption coefficient asa function of air mass categories.(C) Aerosol Optical Dept as afunction of 368 nm, 412 nm, 501 and 863 nm wavelengths and aormass categoties.
Fig. 16. Aerosol Optical Dept spectral dependence by air masscategory.
stagnant air flow and was likely to comprise a significantfraction of local, and consequently, less aged pollution.
Both polluted air masses exhibited remarkable similaritiesin their aerosol concentrations and size distribution shapes.Concentrations were 3261 cm−3 for cP air and 3044 cm−3
for mcP, both with a dominant modal diameter at 60 nm.The chemical composition (excluding refractory sea salt)was dominated by organic matter, followed next by sulphatemass and then notable amounts of nitrate. The highest or-ganic mass occurred for thecmPcase. Black carbon mass,using the MAAP instrument, was similar for both cases withmass loadings∼ 328–388 ng m−3. Aerosol GFs were signif-icantly lower in thecmPcase and GF modes as low as 1.1were more prominent incmPair. The lower aerosol solubil-ity, inferred from the GFs, was also reflected in the CCN/CNratio being lower for thecmPcase compared to thecP case(0.14 at 0.1% supersaturation for thecmPcase increasing to0.4 at 1%, compared to 0.23 at 0.1% and 0.55 at 1% supersat-uration for thecP case). The more soluble characteristics ofcP air points to a more aged pollution aerosol as the organicfraction is likely to be more oxidized.
In terms of optical properties, the absorption coefficientwas quite similar in both cases (σ = 5.2 Mm−1 for cP air
Atmos. Chem. Phys., 10, 8413–8435, 2010 www.atmos-chem-phys.net/10/8413/2010/

M. Dall’Osto et al.: Aerosol properties associated with air masses 8431
and σ = 4.6 Mm−1 for cmP air); however, greater differ-ences were seen between the two air masses for aerosol550 nm-scattering (3.09 Mm−1 and 2.08 Mm−1, respectively,or 50%) and 501 nm-AOD (0.24 and 0.17, respectively, or40%). The significantly higher scattering and AOD levels as-sociated with the cP air mass, which is in fact characterizedby a lower relative humidity (80% compared to 90%), giventhe similarities in number concentration and spectral shape,suggests that the difference in aerosol GFs, resulting fromthe degree of aging, accounts for a significant component ofthe aerosol radiative properties.
For marine cases, tropical, polar and Arctic air masseswere encountered. All cases represented clean conditionsand low particle concentrations of between∼ 400 cm−3 and∼ 1100 cm−3, the highest concentrations occurring for themPcase. The aerosol size distributions were clearly bi-modalwith an Aitken mode between 40 and 60 nm and an accumu-lation mode between 200 and 300 nm, the larger mode diam-eter occurring formT air. The concentrations of the Aitkenand accumulation modes were very similar for all three airmasses; however, a third mode at 15 nm was observed in themP case. This third mode accounts for the∼ 30% higherconcentration associated withmP air compared tomT andmA air. This mode is a recently formed nucleation mode,thought to be formed over the open ocean. If we assume anucleation mode growth rate of 1 nm h−1, and taking the av-erage wind speed formPair of 12.5 m s−1, this would implya source region∼ 675 km off shore.
The chemical composition of the marine aerosol cases insupermicron sizes is, as expected, predominantly comprisedof sea-salt. For submicron sizes, sulphate contributed thelargest single component (up to 50% in the smallest sizes).The AMS indicates that the highest sulphate mass occursfor the mT case, although this cannot be corroborated bythe off-line measurements as the were not available formTair; however, it is consistent with previous studies (Yoon etal., 2007). As discussed, above, the AMS sulphate mass inmarine air is likely to be somewhat contaminated by MSA.From the off-line impactor chemical data, MSA is the singlemost important organic species in marine air, with concen-trations up to 40% in the smallest sizes inmP air. MSA issignificantly higher during this campaign compared to previ-ous campaigns at the same location and using the same tech-niques (Yoon et al., 2007). In addition, the water insolubleorganic mass component is also significantly less that previ-ous reports at the same location (O’Dowd et al., 2004). Blackcarbon was between 17 and 44 ng m−3, consistent with cleanair mass definitions over the N. E. Atlantic.
Differences betweenmP andmA periods were evident inthe chemical composition of the submicron aerosol wherein the former air mass, carboxylic and carbonylic structureswere the main contributors of the oxidized fraction and in thelatter air mass, alcohol structures accounted for 51% of theoxidized functional groups.
5 Conclusions
Anthropogenic air advecting out of Europe and into theN. E. Atlantic comprises aerosol concentrations of the or-der of 3000 cm−3 and a size distribution mode of the or-der of 60 nm. By comparison, marine air entering into Eu-rope via latitudes of 54◦ N, whether tropical, polar or Arc-tic, exhibit concentrations of the order of 400–600 cm−3, butwith concentrations as high as 1100 cm−3occurring in polarair. All marine air size distributions display clear bimodal-ity with an Aitken and accumulation mode. Polar air alsoexhibited a recently-formed nucleation mode at∼15 nm, in-dicative of an open ocean source of new particles. The high-est organic matter loadings occurred in the two continentalcases and dominate submicron mass loadings in both cases.Sulphate contributed less than organics in polluted air, butmore so than nitrate. MSA contributed the dominant wa-ter soluble organic fraction in marine air masses and con-tributed up to 30% of the aerosol mass at certain sizes. Waterinsoluble organic mass contributed significantly less to sub-micron aerosol mass than previously report, while the MSAfraction was at least double than previously reported (Yoonet al., 2007). All air masses exhibited hygroscopic GFs sig-nificantly less than ammonium sulphate and even more sothan sea salt. The GF-PDF peaks at 1.35–1.4 for the twocontinental cases and 1.45–1.5 for the marine cases. In bothcategories, GFs do not reflect GFs for ammonium sulphatesuggesting significant organic enrichment or coating aroundinorganic cores.
Acknowledgements.This work was funded by the European Com-mission Framework Programme 6 EUCAARI Integrated Project,Ireland Higher Education Authority Programme for Research inThird Level Institutes – Cycle 5, and the Irish Environmental Pro-tection Agency. NOAA Hysplit and MODIS Ocean Colour websiteare also acknowledged for providing air mass back trajectories andChlorophyll map.
Edited by: V.-M. Kerminen
References
Allan, J. D., Alfarra, M. R., Bower, K. N., Williams, P. I., Gal-lagher, M. W., Jimenez, J. L., McDonald, A. G., Nemitz, E.,Canagaratna, M. R., Jayne, J. T., Coe, H., and Worsnop, D.R.: Quantitative sampling using an Aerodyne aerosol mass spec-trometer 2. Measurements of fine particulate chemical com-position in two UK cities, J. Geophys. Res., 108(D3), 4091,doi:10.1029/2002JD002359, 2003.
Allan, J. D., Coe, H., Bower, K. N., Alfarra, M. R., Delia, A. E.,Jimenez, J.,L., Middlebrook, A.,M., Drewnick, F., Onasch, T. B.,Canagaratna, M. R., Jayne, J. T., and Worsnop, D. R.: Techni-cal Note: Extraction of chemically resolved mass spectra fromAaerodyne aerosol mass spectrometer data, J. Aerosol. Sci., 35,909–922, 2004.
Allan, J. D., Baumgardner, D., Raga, G. B., Mayol-Bracero, O.L., Morales-Garcıa, F., Garcıa-Garcıa, F., Montero-Martınez, G.,
www.atmos-chem-phys.net/10/8413/2010/ Atmos. Chem. Phys., 10, 8413–8435, 2010
8432 M. Dall’Osto et al.: Aerosol properties associated with air masses
Borrmann, S., Schneider, J., Mertes, S., Walter, S., Gysel, M.,Dusek, U., Frank, G. P., and Kramer, M.: Clouds and aerosols inPuerto Rico - a new evaluation, Atmos. Chem. Phys., 8, 1293–1309, doi:10.5194/acp-8-1293-2008, 2008.
Allan, J. D., Topping, D. O., Good, N., Irwin, M., Flynn, M.,Williams, P. I., Coe, H., Baker, A. R., Martino, M., Niedermeier,N., Wiedensohler, A., Lehmann, S., Muller, K., Herrmann, H.,and McFiggans, G.: Composition and properties of atmosphericparticles in the eastern Atlantic and impacts on gas phase uptakerates, Atmos. Chem. Phys., 9, 9299–9314, doi:10.5194/acp-9-9299-2009, 2009.
Anderson, T. L., Covert, D. S., Marshall, S. F., Laucks, M. L.,Charlson, R. J., Waggoner, A. P., Ogren, J. A., Caldow, R.,Holm, R. L., Quant, F. R., Sem, G. J., Wiedensohler, A.,Ahlquist, N. A., and Bates, T. S.: Performance characteristicsof a high-sensitivity, three-wavelength, total scatter/backscatternephelometer, J. Atmos. Ocean. Technol., 13, 967–986, 1996.
Andreae, M. O., Jones, C. D., and Cox, P. M.: Strong present-dayaerosol cooling implies a hot future, Nature, 435, 1187–1190,2005.
Baker, A. R. and Croot, P. L.: Atmospheric and marine controls onaerosol iron solubility in seawater, Mar. Chem., 120(1–4), 4–13,2010.
Bates, T. S., Calhoun, J. A., Quin, P. K.: Variations in the methane-sulfonate to sulfate molar ratio in submicrometer marine aerosolparticles over the South Pacific Ocean, J. Geophys. Res., 97(D9),9859–9865, 1992.
Bates, T. S., Quinn, P. K., Coffman, D. J., Johnson, J. E., and Mid-dlebrook, A. M.: Dominance of organic aerosols in the marineboundary layer over the Gulf of Maine during NEAQS 2002and their role in aerosol light scattering, J. Geophys. Res., 110,D18202, doi:10.1029/2005JD005797, 2005.
Bodhaine, B. A., Ahlquist, N. C., and Schnell, R. C.: 3-Wavelengthnephelometer suitable for aircraft measurement of backgroundaerosol scattering coefficient, Atmos. Environ., 25, 2267–2276,1991.
Berg, O. H., Swietlicki, E., and Krejci, R.: Hygroscopic growthof aerosol particles in the marine boundary layer over the Pa-cific and Southern Oceans during the first Aerosol Characteriza-tion Experiment (ACE 1), J. Geophys. Res.-Atmos., 103(D13),16535–16545, 1998.
Boers, R., Russchenberg, H., Erkelens, J., and Venema, V.:Ground-based remote sensing of stratocumulus properties duringCLARA, 1996, J. Appl. Meteor., 39, 169–181, 2000.
Boers, R., Acarreta, J. R., Gras, and J. L.: Satellite monitoringof the first indirect aerosol effect: Retrieval of droplet con-centration of water clouds, J. Geophys. Res., 111, D22208,doi:10.1029/2005JD006838, 2006.
Brandau, C. L., Russchenberg, H. W. J., and Knap, W. H.: Evalua-tion of ground-based remotely sensed liquid water cloud proper-ties using shortwave radiation measurements, Atmos. Res., 96(2–3), 366–377, 2010.
Cavalli, F., Facchini, M. C., Decesari, S., Mircea, M., Em-blico, L., Fuzzi, S., Ceburnis, D., Yoon, Y. J., O’Dowd, C.D., Putaud, J. P., and Dell’Acqua, A.: Advances in char-acterization of size-resolved organic matter in marine aerosolover the North Atlantic, J. Geophys. Res., 109, D24215,doi:10.1029/2004JD005137, 2004.
Canagaratna, M. R., Jayne, J. T., Jimenez, J. L., Allan, J. D., Al-
farra, M. R., Zhang, Q., Onasch, T. B., Drewnick, F., Coe, H.,Middlebrook, A., Delia, A., Williams, L. R., Trimborn, A. M.,Northway, M. J., DeCarlo, P. F., Kolb, C. E., Davidovits, P., andWorsnop, D. R.: Chemical and microphysical characterizationof ambient aerosols with the aerodyne aerosol mass spectrome-ter, Mass Spectrom. Rev., 26(2), 185–222, 2007.
Coe, H., Allan, J. D., Alfarra, M. R., Bower, K. N., Flynn, M.J., McFiggans, G. B., Topping, D. O., Williams, P. I., O’Dowd,C. D., Dall’Osto, M., Beddows, D. C. S., and Harrison, R. M.:Chemical and physical characteristics of aerosol particles at a re-mote coastal location, Mace Head, Ireland, during NAMBLEX,Atmos. Chem. Phys., 6, 3289–3301, doi:10.5194/acp-6-3289-2006, 2006.
Crosier, J., Allan, J. D., Coe, H., Bower, K. N., Formenti, P., andWilliams, P. I.: Chemical composition of summertime aerosol inthe Po Valley (Italy), northern Adriatic and Black Sea, Q. J. Roy.Meteror. Soc., 133, 61–75, 2007.
Dall’Osto, M., Beddows, D. C. S., Kinnersley, R. P., Harrison, R.M., Donovan, R. J., and Heal, M. R.: Characterization of individ-ual airborne particles by using aerosol time-of-flight mass spec-trometry at Mace Head, Ireland, J. Geophys. Res., 109, D21302,doi:10.1029/2004JD004747, 2004.
Dall’Osto, M. and Harrison, R. M.: Chemical characterisation ofsingle airborne particles in Athens (Greece) by ATOFMS, At-mos. Environ., 40(39), 7614–7631, 2006.
Dall’Osto, Booth, M., M. J., Smith, W., Fisher, R., and Harrison, R.M.: A study of the size distributions and the chemical character-ization of airborne particles in the vicinity of a large integratedsteelworks, Aerosol Sci. Technol., 42(12), 981–991, 2008.
Dall’Osto, M., Harrison, R. M., Coe, H., Williams, P. I., and Al-lan, J. D.: Real time chemical characterization of local andregional nitrate aerosols, Atmos. Chem. Phys., 9, 3709–3720,doi:10.5194/acp-9-3709-2009, 2009.
DeCarlo, P. F., Kimmel, J. R., Trimborn, A., Northway, M. J., Jayne,J. T., Aiken, A. C., Gonin, M., Fuhrer, K., Horvath, T., Docherty,K. S., Worsnop, D. R., and Jimenez, J. L.: Field-deployable,high-resolution, time-of-flight aerosol mass spectrometer, Anal.Chem., 78(24), 8281–8289, 2006.
Decesari, S., Mircea, M., Cavalli, F., Fuzzi, S., Moretti, F., Tagli-avini E., and Facchini, M. C.: Source attribution of water-solubleorganic aerosol by nuclear magnetic resonance spectroscopy, En-viron. Sci. Technol., 41, 2479–2484, 2007.
Drewnick, F., Hings, S. S., DeCarlo, P., Jayne, J. T., Gonin, M.,Fuhrer, K., Weimer, S., Jimenez, J. L., Demerjian, K. L., Bor-rmann, S., Worsnop, D. R.: A new Time-of-Flight Aerosol MassSpectrometer (TOF-AMS) – instrument description and first fielddeployment, Aerosol Sci. Technol. 39, 637–658, 2005.
Facchini, M. C., Decesari, S., Rinaldi, M., Mircea, M., Fuzzi, S.,Moretti, F., Tagliavini, E., Ceburnis, D., and O’Dowd, C. D.:Important Source of Marine Secondary Organic Aerosol fromBiogenic Amines, Environ. Sci. Technol., 42(24), 9116–9121,2008.
Facchini, M. C., Rinaldi, M., Decesari, S., Carbone, C., Finessi, E.,Mircea, M., Fuzzi, S., Ceburnis, D., Flanagan, R., Nilsson, E.D., de Leeuw, G., Martino, M., Woeltjen, J., and O’Dowd, C. D.:Primary submicron marine aerosol dominated by insoluble or-ganic colloids and aggregates, Geophys. Res. Lett., 35, L17814,doi:10.1029/2008GL034210, 2008b.
Frisch, A. S., Feingold, G., Fairall, C. W., Uttal, T., Snider, and J.
Atmos. Chem. Phys., 10, 8413–8435, 2010 www.atmos-chem-phys.net/10/8413/2010/

M. Dall’Osto et al.: Aerosol properties associated with air masses 8433
B.: On cloud radar and microwave radiometer measurements ofstratus cloud liquid water profiles, J. Geophys. Res., 103, 23195–23197, 1998.
Furutani, H., Dall’osto, M., Roberts G. C., and Prather, K. A.:Assessment of the relative importance of atmospheric aging onCCN activity derived from field observations, Atmos. Environ.42(13), 3130–3142, 2008.
Gard, E. E., Kleeman, M. J., Gross, D. S., Hughes, L. S., Allen, J.O., Morrical, B. D., Fergenson, D. P., Dienes, T., Galli, M. E.,Johnson, R. J., Cass, G. R., and Prather, K. A.: Direct obser-vation of heterogeneous chemistry in the atmosphere, Science,279(5354), 1184–1187, 1998.
Grenfell, J. L., Harrison, R. M., Allen, A.G., Penkett, S. A.,O’Dowd, C. D., Robertson, L., Hewitt, C. N., Davison, B.,Lewis, A., Creasey, D., Lee, J., Pilling, M. J., Carpenter, L.,and James, J.: An analysis of rapid nanoparticle production ata remote coastal site on the West Irish Coast, J. Geophys. Res.,13771–13780, 1999.
Gross, D. S., Galli, M. E., Silva, P. J., and Prather, K. A.: Rela-tive sensitivity factors for alkali metal and ammonium cations insingle particle aerosol time-of-flight mass spectra, Anal. Chem.,72(2), 416–422, 2000.
Gysel, M., McFiggans, G. B., and Coe, H.: Inversion of tandemdifferential mobility analyser (TDMA) measurements, J. AerosolSci., 40, 134–151, 2009.
Hand, J. L. and Malm, W. C. Review of aerosol mass scattering ef-ficiencies from ground-based measurements since 1990, J. Geo-phys. Res., 112, D16203, doi:10.1029/2007JD008484, 2007.
Heintzenberg, J. and Charlson, R. J.: Design and applications of theintegrating nephelometer: A review, J. Atmos. Ocean. Technol.,13, 987–1000, 1996.
Hoppel, W. A., Frick, G. M., and Fitzgerald, J. W.: Marine bound-ary layer measurements of new particle formation and the effectsnonprecipitating clouds have on aerosol size distribution, J. Geo-phys. Res., 99, 14443–14459, 1994.
Huffman, J. A., Jayne, J. T., Drewnick, F., Aiken, A. C., Onasch, T.,Worsnop, D. R., and Jimenez, J. L.: Design, modeling, optimiza-tion, and experimental tests of a particle beam width probe forthe aerodyne aerosol mass spectrometer, Aerosol Sci. Technol.,39(12), 1143–1163, 2005.
Illingworth, A. J., Hogan, R. J., O’Connor, E. J., Bouniol, D.,Brooks, M. E., Delanoe, J., Donovan, D. P., Eastment, J. D.,Gaussiat, N., Goddard, J. W. F., Haeffelin, M., Klein Baltink,H., Krasnov, O. A., Pelon, J., Piriou, J.-M., Protat, A., Russchen-berg, H. W. J., Seifert, A., Tompkins, A. M., van Zadelhoff, G.-J.,Vinit, F., Willen, U., Wilson, D. R., and Wrench, C. L.: CLOUD-NET, continuous evaluation of cloud profiles in seven operationalmodels using ground-based observations, B. Am. Meteorol. Soc.,88, 883–898, 2007.
IPCC, 2007, Climate Change 2007: Report of the Intergovernmen-tal Panel on Climate Change, Cambridge University Press, 921pp., 2007.
Jayne, J. T., Leard, D. C., Zhang, X. F., Davidovits, P., Smith, K.A., Kolb, C. E., and Worsnop, D. R.: Development of an aerosolmass spectrometer for size and composition analysis of submi-cron particles, Aerosol Sci. Technol., 33(1-02), 49–70, 2000.
Jennings, S. G., Kleefeld, C., O’Dowd, C. D., Junker, C., GerardSpain, T., O’Brien, P., Roddy, A. F., and O’Connor, T. C.: MaceHead Atmospheric Research Station-characterization of aerosol
radiative parameters, Boreal Environ. Res., 8(4), 303–314, 2003.Jennings S. G., Ceburnis D., and Kelly, B. M.: Comparison
of aerosol light absorption coefficient measurements at theMace Head atmospheric research station using a MAAP andan aethalometer, 9th International Conference on CarbonaceousParticles in the Atmosphere, 12–14 August, Berkeley, California,USA, 2008,
Jimenez, J. L., Jayne, J. T., Shi, Q., Kolb, C. E., Worsnop, D. R.,Yourshaw, I., Seinfeld, J. H., Flagan, R. C., Zhang, X. F., Smith,K. A., Morris, J. W., and Davidovits, P.: Ambient aerosol sam-pling using the Aerodyne Aerosol Mass Spectrometer, J. Geo-phys. Res., 108(D7), 8425, doi:10.1029/2001JD001213, 2003.
Junker, C., Jennings, S. G., and Cachier, H.: Aerosol light absorp-tion in the North Atlantic: trends and seasonal characteristicsduring the period 1989 to 2003, Atmos. Chem. Phys., 6, 1913–1925, doi:10.5194/acp-6-1913-2006, 2006.
Kaufman, Y. J., Smirnov, A., Holben, B. N., and Dubovik, O.:Baseline maritime aerosol: methodology to derive the opticalthickness and scattering properties, Geophys. Res. Lett., 28(17),3251–3254, 2001.
Kerminen, V.-M. and Leck, C.: Sulfur chemistry over the centralArctic Ocean during the summer: Gas-to-particle transformation,J. Geophys. Res., 106(D23), 32087–32099, 2001.
Kulmala, M., Asmi, A., Lappalainen, H. K., Carslaw, K. S., Poschl,U., Baltensperger, U., Hov, Ø., Brenquier, J.-L., Pandis, S.N., Facchini, M. C., Hansson, H.-C., Wiedensohler, A., andO’Dowd, C. D.: Introduction: European Integrated Project onAerosol Cloud Climate and Air Quality interactions (EUCAARI)- integrating aerosol research from nano to global scales, At-mos. Chem. Phys., 9, 2825–2841, doi:10.5194/acp-9-2825-2009,2009.
Kunz, G. J., de Leeuw, G., Becker, E., and O’Dowd, C. D.: Li-dar observations of atmospheric boundary layer structure andsea spray aerosol plumes generation and transport at Mace Head,Ireland (PARFORCE experiment), J. Geophys. Res., 107(D19),8106, doi:10.1029/2001JD001240, 2002.
Lance, S., Medina, J., Smith, J. N., and Nenes, A.: Mapping theoperation of the DMT Continuous Flow, CCN Counter, AerosolSci. Technol., 40, 1–13, doi:10.1080/02786820500543290,2006.
Lanz, V. A., Alfarra, M. R., Baltensperger, U., Buchmann, B.,Hueglin, C., and Prevot, A. S. H.: Source apportionment ofsubmicron organic aerosols at an urban site by factor analyti-cal modelling of aerosol mass spectra, Atmos. Chem. Phys., 7,1503–1522, doi:10.5194/acp-7-1503-2007, 2007.
Liu, B. Y. H., Pui, D. Y. H., Whitby, K. T., Kittelson, D. B.,Kousaka, Y., and McKenzie, R. L., Aerosol mobility chromato-graph – new detector for sulfuric-acid aerosols, Atmos. Environ.,12(1–3), 99–104, 1978.
Maßling, A., Wiedensohler, A., Busch, B., Neusuß, C., Quinn, P.,Bates, T., and Covert, D.: Hygroscopic properties of differentaerosol types over the Atlantic and Indian Oceans, Atmos. Chem.Phys., 3, 1377–1397, doi:10.5194/acp-3-1377-2003, 2003.
Matta, E., Facchini, M. C., Decesari, S., Mircea, M., Cavalli, F.,Fuzzi, S., Putaud, J.-P., and Dell’Acqua, A.: Mass closure onthe chemical species in size-segregated atmospheric aerosol col-lected in an urban area of the Po Valley, Italy, Atmos. Chem.Phys., 3, 623–637, doi:10.5194/acp-3-623-2003, 2003.
Matthew, B. M., Middlebrook, A. M., and, Onasch, T. B.: Col-
www.atmos-chem-phys.net/10/8413/2010/ Atmos. Chem. Phys., 10, 8413–8435, 2010
8434 M. Dall’Osto et al.: Aerosol properties associated with air masses
lection efficiencies in an Aerodyne Aerosol Mass Spectrometeras a function of particle phase for laboratory generated aerosols,Aerosol Sci. Technol., 42(11), 884–898, 2008.
Mayol-Bracero, O. L., Guyon, P., Graham, B., Roberts, G., An-dreae M. O., Decesari, S., Facchini, M. C., Fuzzi, S., and Ar-taxo, P.: Water-soluble organic compounds in biomass burningaerosols over Amazonia: 2. Apportionment of the chemical com-position and importance of the polyacidic fraction, J. Geophys.Res., 107(D20), 8091, doi:10.1029/2001JD000522, 2002.
McArdle, N., Liss, P., and Dennis, P.: An isotopic study of atmo-spheric sulphur at three sites in Wales and at Mace Head, Eire, J.c, 103(D23), 31079–31094, 1998.
McArthur, L. J. B., Halliwell, D. H., Niebergall, O. J., O’Neill, N.T., Slusser, J. R., and Wehrli, C.: Field comparison of networksun photometers, J. Geophys. Res., 108(D19), AAC 1–1, 4596,doi:10.1029/2002JD002964, 2003.
Mulcahy, J. P., O’Dowd, C. D., Jennings, S. G., and Ceburnis, D.:Significant enhancement of aerosol optical depth in marine airunder high wind conditions, J. Geophys. Res. Lett., 35, L16810,doi:10.1029/2008GL034303, 2008.
Mulcahy, J. P., O’Dowd, C. D., Jennings, and S. G.: Aerosol opticaldepth in clean marine and continental northeast Atlantic air, J.Geophys. Res., 114, D20204, doi:10.1029/2009JD011992, 2009.
Murphy, D. M.: The design of single particle laser mass spectrom-eters. Mass Spectrom. Rev., 26(2), 150–165, 2007.
Nilsson, E. D., Rannik, U., Buzorius, G., O’Dowd, C. D.: Effects ofcontinental boundary layer evolution, convection, turbulence andentrainment on aerosol formation, Tellus B, 53, 441–461, 2001.
Nilsson, E., Swietlicki, E., Sjogren, S., Londahl, J., Nyman, M.,and Svenningsson, B.: Development of an H-TDMA for long-term unattended measurement of the hygroscopic properties ofatmospheric aerosol particles, Atmos. Meas. Tech., 2, 313–318,doi:10.5194/amt-2-313-2009, 2009.
O’Connor, T. C., Jennings, S. G., and O’Dowd, C. D.: Highlightsfrom 50 years of Aerosol Measurements at Mace Head, Atmos.Res., 90, 338–355, doi:10.1016/j.atmosres.2008.08.014, 2008.
O’Dowd, C. D., Smith, M. H., and Jennings, S. G.: Submicronaerosol, radon and soot carbon characteristics over the northeastAtlantic, J. Geophys. Res., 98, 1123–1135, 1993.
O’Dowd, C. D., Geever, M., Hill, M. K., Jennings, S. G., Smith, M.H.: New particle formation: Spatial scales and nucleation ratesin the coastal environment, Geophys. Res. Letts, 25, 1661–1664,1998.
O’Dowd, C. D., McFiggens, G., Pirjola, L., Creasey, D. J., Hoell,C., Smith, M. H., Allen, B., Plane, J. M. C., Heard, D. E., Lee, J.D., Pilling, M. J., and Kulmala, M.: On the photochemical pro-duction of new particles in the coastal boundary layer, Geophys.Res. Lett., 26, 1707–1710, 1999.
O’Dowd, C. D., Lowe, J., Smith, M. H., and Kaye, A. D.: Therelative importance of sea-salt and nss-sulphate aerosol to themarine CCN population: An improved multi-component aerosol-droplet parameterisation, Q. J. Roy. Meterol. Soc., 125, 1295–1313, 1999.
O’Dowd, C. D., Becker, E., and Kulmala, M.: Mid-latitude North-Atlantic aerosol characteristics in clean and polluted air, Atmos.Res., 58(3), 167–185, 2001.
O’Dowd, C. D., Hameri, K., Makela, J. M., Pirjola, L., Kulmala,M., Jennings, S. G., Berresheim, H., Hansson, H.-C., de Leeuw,G., Allen, A. G., Hewitt, C. N., Jackson, A., Viisanen, Y., Hoff-
mann, T.: A dedicated study of new particle formation and fatein the coastal environment (PARFORCE): Overview of objec-tives and initial achievements, J. Geophys. Res., 107(D19), 8108,doi:10.1029/2001JD000555, 2002.
O’Dowd, C. D., Facchini, M. C., Cavalli, F., Ceburnis, D., Mircea,M., Decesari, S., Fuzzi, S., Yoon, Y. J., and Putaud, J. P.: Bio-genically driven organic contribution to marine aerosol, Nature,431, 676–680, 2004.
Paatero, P.: Least squares formulation of robust non-negative factoranalysis, Chemometr. Intell. Lab., 37, 23–35, 1997.
Phinney, L., Leaitch, W. R., Lohmann, U., Boudries, H., Worsnop,D. R., Jayne, J. T., Toom-Sauntry, D., Wadleigh, M., Sharma,S., and Shantz, N.: Characterization of the aerosol over the sub-arctic north east Pacific Ocean, Deep-Sea Research – Part II:Topical Studies, Oceanography, 53(20–22), 2410–2433, 2006.
Pope, C. A. and Dockery, D. W.: Health effects of fine particulateair pollution: Lines that connect, J. Air Waste Manage., 56(6),709–742, 2006.
Quinn, P. K., Kapustin, V. N., Bates, T. S., and Covert, D. S.: Chem-ical and optical properties of marine boundary layer aerosol par-ticles of the mid-Pacific in relation to sources and meteorologicaltransport, J. Geophys. Res.-Atmos., 101(D3), 6931–6951, 1996.
Quinn, P. K., Coffman, D. J., Bates, T. S., Miller, T. L., Johnson, J.E., Voss, K., Welton, E. J., and Neususs, C.: Dominant aerosolchemical components and their contribution to extinction dur-ing the Aerosols99 cruise across the Atlantic, J. Geophys. Res.-Atmos., 106(D18), 20783–20809, 2001.
Rader, D. J. and McMurry, P. H.: Application of the tandem differ-ential mobility analyzer to studies of droplet growth or evapora-tion, J. Aerosol Sci., 17(5), 771–787, 1986.
Rinaldi, M., Emblico, L., Decesari, S., Fuzzi, S., Facchini, M. C.,and Librando, V.: Chemical Characterization and Source Appor-tionment of Size-Segregated Aerosol Collected at an Urban Sitein Sicily, Water Air Soil Poll., 185, 311–321, 2007.
Savoie, D. L., Arimoto, R., Keene, W. C., Prospero, J. M., Duce,R. A., and Galloway, J. N.: Marine biogenic and anthropogeniccontributions to non-sea-salt sulfate in the marine boundary layerover the North Atlantic Ocean, J. Geophys. Res., 107(D18),4356, doi:10.1029/2001JD000970, 2002.
Seinfeld, J. H. and Pandis, S. N.: Atmospheric chemistry andphysics – from air pollution to climate change, New York, WileyInterscience, 1998.
Sellegri, K., O’Dowd, C. D., Yoon, Y. J., Jennings, S. G.,and de Leeuw, G.: Surfactants and submicron sea spraygeneration, J. Geophys. Res.-Atmos., 111(D22) , D22215,doi:10.1029/2005JD006658(AGU), 2006.
Sellegri, K., Villani, P., Picard, D., Dupuy, R., O’Dowd, C. D., andLaj, P.: Role of the volatile fraction of submicron marine aerosolon its hygroscopic properties, Atmos. Res., 90(2–4), 272–277,2008.
Smirnov, A., Holben, B. N., Eck, T. F., Dubovik, O., andSlutsker,I.: Effect of wind speed on columnar aerosol opti-cal properties at Midway Island, J. Geophys. Res., 108, 4802,doi:10.1029/2003JD003879, 2003.
Song, X. H., Hopke, P. K., Fergenson, D. P., and Prather, K. A.:Classification of single particles analyzed by ATOFMS using anartificial neural network, ART-2A, Anal. Chem., 71(4), 860–865,1999.
Swietlicki, E., Zhou, J. C., Covert, D. S., Hameri, K., Busch, B.,
Atmos. Chem. Phys., 10, 8413–8435, 2010 www.atmos-chem-phys.net/10/8413/2010/

M. Dall’Osto et al.: Aerosol properties associated with air masses 8435
Vakeva, M., Dusek, U., Berg, O. H., Wiedensohler, A., Aalto, P.,Makela, J., Martinsson, B. G., Papaspiropoulos, G., Mentes, B.,Frank, G., and Stratmann, F.: Hygroscopic properties of aerosolparticles in the northeastern Atlantic during ACE-2, Tellus B,52(2), 201–227, 2000.
Tang, I. N. and Munkelwitz, H. R.: Water activities, densities,and refractive indices of aqueous sulphates and sodium nitratedroplets of atmospheric importance, J. Geophys. Res., 99(D9),18801–18808, 1994.
Ulbrich, I. M., Canagaratna, M. R., Zhang, Q., Worsnop, D. R., andJimenez, J. L.: Interpretation of organic components from Posi-tive Matrix Factorization of aerosol mass spectrometric data, At-mos. Chem. Phys., 9, 2891–2918, doi:10.5194/acp-9-2891-2009,2009.
Villevalde, Y. V., Smirnov, A. V., Oneill, N. T., Smyshlyaev, S. P.,and Yakovlev, V. V.: Measurement of aerosol optical depth in thePacific-Ocean and the North-Atlantic, J. Geophys. Res.-Atmos.,99(D10), 20983–20988, 1994.
Wang, S. C., and Flagan, R. C.: Scanning electrical mo-bility spectrometer, Aerosol Sci. Technol., 13, 230–240,doi:10.1080/02786829008959441, 1990.
Yoon, Y. J., Cheevers, S., Jennings, S. G., and O’Dowd, C. D.: Per-formance of a venturi dilution chamber for sampling 3–20 nmparticles, J. Aerosol. Sci., 36, 535–540, 2005.
Yoon, Y. J., Ceburnis, D., Cavalli, F., Jourdan, O., Putaud,J. P., Facchini, M. C., Decesari, S. Fuzzi, S., Sellegri, K.,Jennings, S. G. and O’Dowd, C. D.: Seasonal characteris-tics of the physico-chemical properties of North Atlantic ma-rine atmospheric aerosols, J. Geophys. Res., 112, D04206,doi:10.1029/2005JD007044, 2007.
Ziemba, L. D., Fischer, E., Griffin, R. J., and Talbot, R.W.: Aerosol acidity in rural New England: Temporal trendsand source region analysis, J. Geophys. Res., 112, D10S22,doi:10.1029/2006JD007605, 2007.
Zorn, S. R., Drewnick, F., Schott, M., Hoffmann, T., and Bor-rmann, S.: Characterization of the South Atlantic marine bound-ary layer aerosol using an aerodyne aerosol mass spectrometer,Atmos. Chem. Phys., 8, 4711–4728, doi:10.5194/acp-8-4711-2008, 2008.
www.atmos-chem-phys.net/10/8413/2010/ Atmos. Chem. Phys., 10, 8413–8435, 2010