afghanistan joint market monitoring initiative (jmmi) …
TRANSCRIPT

AFGHANISTAN JOINT MARKET MONITORING INITIATIVE (JMMI) 11 - 28 August 2021
Median cost of MEB1
19,458 AFN
242.96 USD
2%2
AFGHANISTAN CASH AND VOUCHER WORKING GROUP
METHODOLOGY
Working through the Cash and Voucher Working Group (CVWG) and its partners, REACH facilitated the implementation of a partner-driven Joint Market Monitoring Initiative (JMMI) in Afghanistan. It is intended to be conducted on a monthly basis to provide longitudinal market and price data.
The JMMI assessment employed a quantitative key informant interview (KII) approach. The methodology includes surveys with purposively sampled traders (both retail and wholesale), acting as key informants (KIs) for their respective markets. Participants are selected through partner KI networks in their respective market areas.
Each KI was asked to report on general market functionality indicators, as well as prices for all relevant items that they trade. Depending on access and availability, partners conducted 4 KIIs per item with retail traders, and 2 KIIs per item for wholesale traders (for food and non-food items (NFIs)). KIs were asked for information encompassing the 30 days prior to data collection. Findings rely on the knowledge of KIs regarding their respective markets. The findings are, therefore, indicative and may not always fully reflect market activity in the assessed area.
Data from the 15th round of the JMMI was collected between August 11th and 28th.
Median cost of Food Basket 6,071 AFN
75.81 USD
7%2
7 participating agencies20 assessed provinces
185 key informant interviews (KIIs)22 commodities assessed
38% of KIs reported difficulties in restocking and obtaining commodities. The key items reportedly more difficult to obtain and restock are vegetable oil (76%), cereals (75%) and pulses (41%).
The MFI is based on a percentage calculated at district level. If 4 or more retailers in the district are interviewed, then the MFI is calculated. If less than 4 are interviewed, then there is insufficient data and the MFI is not calculated in that district.
To further inform the CVWG's JMMI in Afghanistan, REACH developed the JMMI Market Functionality Index (MFI), based on the similar index by the same name designed by the World Food Program's (WFP's) Research, Assessment & Monitoring, and Supply Chain divisions. The aim of the MFI is to assess markets' health at the district level, in order to inform the humanitarian community on whether cash and voucher assistance (CVA) may or may not be the most appropriate response to meet the beneficiaries' needs. The MFI is based on the assumption that, should the markets not be functional, beneficiaries who received the CVA may be unable to access basic commodities.
This map presents findings from rounds 14th and 15th of the JMMI's MFI, visualizing a scale of most functional assessed markets (dark shades) to the least functional ones (light shades) at the district level across Afghanistan.
For further information kindly consult the WFP technical guidance here.
The most commonly accepted payment modalities in the markets are cash (69%) and credit (49%).
Just (5%) of the KIs reported barter as a payment modality and only (3%) accepted mobily phone.
MARKET FUNCTIONALITY INDEX (MFI), BY DISTRICT

AFGHANISTAN JOINT MARKET MONITORING INITIATIVE (JMMI) – August 2021 Afghanistan Cash and Voucher Working Group 2
AFGHANISTAN MEB CONTENTS*
Basic Food BasketWheat flour (imported) 60 kg Pulses** 14 kgLocal rice 29 kg Salt 1 kgVegetable oil 6 L Sugar 6 kg
Healthcare (fixed at 3,000 AFN)
Shelter (fixed at 5,828 AFN)
Transportation (fixed at 359 AFN)
Communication (fixed at 136 AFN)
Water (20 L water drum) (fixed at 74 AFN)
Fuel and Electricity (fixed at 716 AFN)
Province MEBin AFN
MEBin USD
Changesince last round
Central 19,281 240.75 4%Kabul 19,429 242.60 5%Kapisa 19,318 241.21 1%Wardak 19,124 238.78 3%Panjsher 21,357 266.67 15%Parwan 18,920 236.24 2%CentralHighland 20,687 258.31 5%
Daykundi 20,687 258.31 0%3
East NA NA NANorth-East 19,905 248.54 6%Badakhshan 20,140 251.47 3%Kunduz 19,502 243.51 6%Takhar 20,546 256.54 9%North 19,107 238.58 2%Balkh 18,840 235.24 2%Faryab 19,298 240.97 1%Jawzjan 19,147 239.07 2%Samangan 18,979 236.98 2%South-East 19,807 247.32 0%3
Ghazni 20,082 250.76 11%Khost 19,217 239.95 2%South 21,492 268.36 6%Kandahar 22,033 275.11 9%Zabul 19,482 243.27 7%West 20,260 252.98 3%Ghor 19,655 245.42 1%Herat 20,507 256.06 4%
MINIMUM EXPENDITURE BASKET (MEB) CALCULATIONS
The Minimum Expenditure Basket (MEB) represents the minimum culturally adjusted group of items required to support an average seven-person Afghan household for one month. The cost of the MEB can be used as a proxy for the financial burdens facing households in different locations. The MEB's content was defined by the CVWG in consultation with relevant sector leads.
* The MEB cost was calculated in this factsheet using the relevant food and non-food item prices monitored. For items whose prices were not collected, calculations included the existing price used by the CVWG as a baseline. For the healthcare and shelter components, the listed fixed amount was used in the calculation. The AFN to USD conversion uses a fixed exchange rate of 78.5 AFN to 1 USD.
** Pulses in this factsheet are calculated as the average price of all three types of pulses monitored: lentils, beans, and split-peas.
*** An additional percentage has been included to take into account unmet needs which are not mentioned above (this can also include leisure and free time). The Afghanistan MEB unmet needs is defined as 10% of the total sum of the MEB.
MEDIAN MEB PRICE AT REGIONAL AND PROVINCIAL LEVEL3
MEDIAN MEB COST, BY PROVINCE IN AFN
Dignity-hygieneAntiseptic soap (95-110g)
2 pc Soft cotton cloth (2m2 piece)
2 pc
Underwear 2 pc (fixed at 80 AFN)Education (fixed at 1,200 AFN)Monthly stationary costs
multiple items
Snacks and school lunch
24 pc
School transportation 48 tickets
Uniforms (including shoes and sport clothing)
3 pc
Backpack 1 pc Documentation and school fees
fixed
Unmet needs (10% of sum of above)***

AFGHANISTAN JOINT MARKET MONITORING INITIATIVE (JMMI) – August 2021 Afghanistan Cash and Voucher Working Group 3
NATIONWIDE MEDIAN ITEM PRICE AT TIME OF INTERVIEW, AND RECORDED CHANGE (%) SINCE THE 14TH ROUND OF DATA COLLECTION
Item Unit Pricein AFN
Pricein USD
Change(%)
Food ItemsWheat flour (local) 1 kg 36 0.45 5%Wheat flour (imported) 1 kg 39 0.49 11%Local rice 1 kg 60 0.75 7%Vegetable oil 1 L 134 1.68 12%Pulses7 1 kg 60 0.75 8%Salt 1 kg 15 0.19 20%Sugar 1 kg 55 0.69 10%Tomatoes 1 kg 25 0.31 No change
NFIsPen and pencil 1 pc 10 0.12 No change
Notebook 1 pc 20 0.25 No change
Rubber 1 pc 5 0.06 No change
Cotton cloth (2m2) 1 pc 83 1.03 8%Toothbrush (adults) 1pc 27 0.33 8%Toothpaste 1 pc 40 0.50 6%Sanitary pads 1 box 50 0.62 No change
Antiseptic soap bar 1 pc 30 0.37 No change
Other NFIsSafe (drinking) waterwithout jerry can 20 L 50 0.62 17%
Coal or charcoal 1 kg 10 0.12 23%LPG 1 L 80 1.00 23%Firewood 1 kg 13 0.16 2%Cooking fuel 1 kg 75 0.94 12%
ITEM PRICE MONITORING
REPORTED CHANGE IN PRICE OF FOOD ITEMS IN 30 DAYS PRIOR TO DATA COLLECTION, AND REPORTED REASONS FOR INCREASE IN PRICE4
REPORTED CHANGE IN PRICE OF NFIs IN THE IN 30 DAYS PRIOR TO DATA COLLECTION, AND REPORTED REASONS FOR INCREASE IN PRICE4
Out of those KIs reporting an increase in food prices, the most frequently cited reasons were:
82% Increased cost of supplies
40% Increased transportation costs
4% Seasonality
% of KIs reporting change in price for food items in the 30 days prior to data collection:
0+13+86+1+A0% Decreased
13% Stayed the same
86% Increased
1% Didn't know
2+19+78+1+A2% Decreased
19% Stayed the same
78% Increased
1% Didn't know
% of KIs reporting change in price for NFIs in the 30 days prior to data collection:
Out of those KIs reporting an increase in NFIs prices, the most frequently cited reasons were:
91% Increased cost of supplies
42% Increased transportation costs
5% Seasonality
CURRENT AVAILABILITY OF ITEMS FROM SUPPLIERS
Item Available(% KIs)
Limited(% KIs)
None(% KIs)
Food ItemsWheat flour (local) 91% 7% 2%Wheat flour (imported) 96% 3% 1%Local rice 94% 4% 2%Vegetable oil 96% 3% 2%Pulses7 97% 1% 2%Salt 96% 2% 2%Sugar 96% 2% 2%Tomatoes 95% 3% 2%NFIsPen and pencil 95% 1% 4%Notebook 95% 1% 4%Rubber 98% 0% 2%Cotton cloth (2m2) 98% 0% 2%Toothbrush (adults) 98% 2% 0%Toothpaste 97% 3% 0%Sanitary pads 86% 3% 11%Antiseptic soap bar 97% 3% 0%Other NFIsSafe (drinking) waterwithout jerry can 91% 4% 4%
Coal or charcoal 98% 0% 2%LPG 100% 0% 0%Firewood 96% 2% 2%Cooking fuel 99% 1% 0%

AFGHANISTAN JOINT MARKET MONITORING INITIATIVE (JMMI) – August 2021 Afghanistan Cash and Voucher Working Group 4
MARKET SUPPLY & ACCESS CHALLENGES
LOCATION OF MAIN WHOLESALER AND RETAILER SUPPLIERS FOR FOOD ITEMS5
LOCATION OF MAIN WHOLESALER AND RETAILER SUPPLIERS FOR NFIs5
Proportion of wholesalers KIs by reported location of their main supplier of food items:
BARRIERS TO MARKET ACCESS FOR CONSUMERSProportion of KIs reporting consumers faced at least one of the mentioned barriers
to accessing the market in the 30 days prior to data collection:
64+36+A 64% Barriers to access reported
36% No barriers reported
55% of KIs reported having faced difficulties in road-based transportation of goods in the 30 days prior to data collection. The three most frequently cited difficulties were:
Proportion of retailers KIs by reported location of their main supplier of food items:
Proportion of wholesalers KIs by reported location of their main supplier of NFIs:
Proportion of retailers KIs by reported location of their main supplier of NFIs:
0% Imported from abroad
58% Different province
29% Province capital city
8% Same province
5% Same district
0% Other
3% Imported from abroad
65% Different province
24% Province capital city
4% Same province
3% Same district
1% Other
0% Imported from abroad
54% Different province
27% Province capital city
14% Same province
5% Same district
0% Other
0+580+290+80+50+0=
30+650+240+40+30+10= 0+540+270+140+50+0=
32% Financial barriers
32% Insecurity travelling to the market
10% Fear of exposure to COVID-19, and public health restrictions
Among those KIs reporting that people face barriers to accessing markets, the most frequently cited reasons were:
In the South and South-Eastern, 100% of KIs reported consumers faced at least one barrier to accessing markets in the 30 days prior to data collection, which is a relatively high percentage compared to the national average of 83%.
30+660+240+30+30+10=
3% Imported from abroad
66% Different province
24% Province capital city
3% Same province
3% Same district
1% Other
DIFFICULTIES TO MEET DEMAND AND TO TRANSPORT OR PROCURE SUPPLIES5
55% Financial constraints and inability to purchase supplies
54% Difficulties in transporting commodities
49% Limited availability of imported items and commodities
38% of KIs reported having faced difficulties obtaining enough commodities to meet demand in the 30 days prior to data collection. The three most frequently cited reasons were:
51% Conflict
31% Roadblocks
14% Restrictions from the authorities
AFGHANISTAN JOINT MARKET MONITORING INITIATIVE (JMMI) – August 2021 Afghanistan Cash and Voucher Working Group 5
TRADERS & MARKET FUNCTIONALITY
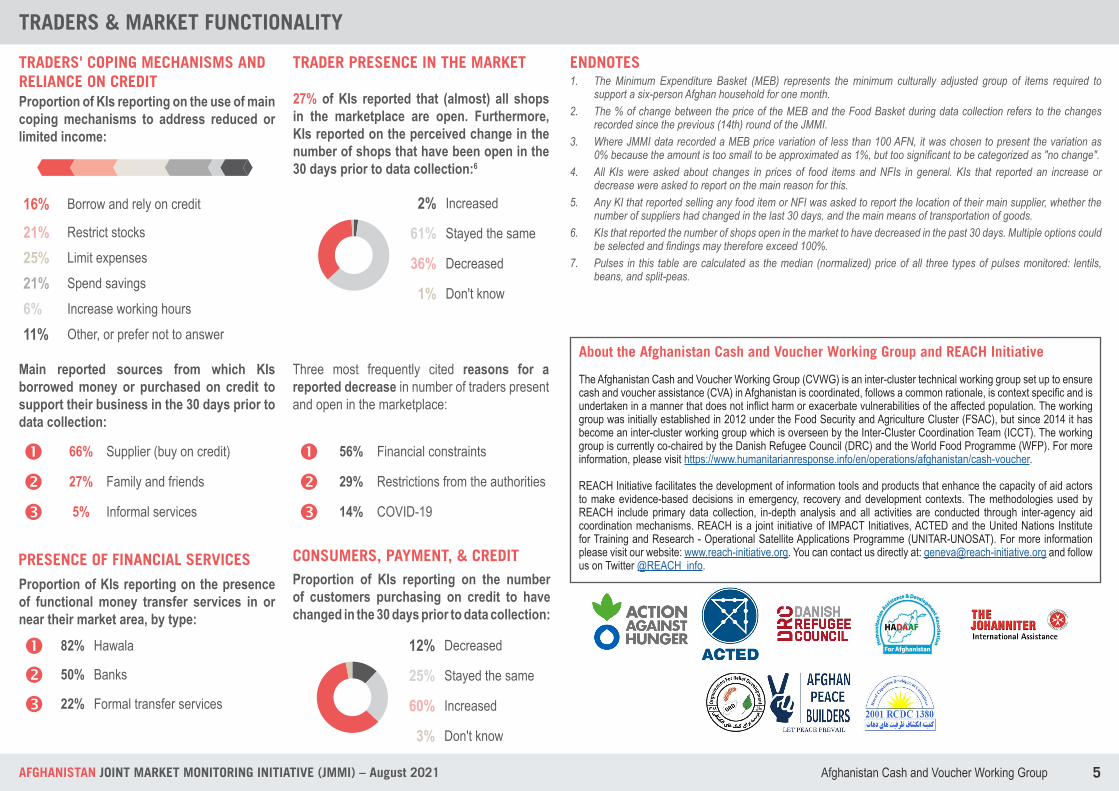
TRADER PRESENCE IN THE MARKETTRADERS' COPING MECHANISMS AND RELIANCE ON CREDIT
PRESENCE OF FINANCIAL SERVICES
Three most frequently cited reasons for a reported decrease in number of traders present and open in the marketplace:
56% Financial constraints
29% Restrictions from the authorities
14% COVID-19
Proportion of KIs reporting on the presence of functional money transfer services in or near their market area, by type:
82% Hawala
50% Banks
22% Formal transfer services
27% of KIs reported that (almost) all shops in the marketplace are open. Furthermore, KIs reported on the perceived change in the number of shops that have been open in the 30 days prior to data collection:6
CONSUMERS, PAYMENT, & CREDITProportion of KIs reporting on the number of customers purchasing on credit to have changed in the 30 days prior to data collection:
12+25+60+3+A12% Decreased
25% Stayed the same
60% Increased
3% Don't know
Main reported sources from which KIs borrowed money or purchased on credit to support their business in the 30 days prior to data collection:
66% Supplier (buy on credit)
27% Family and friends
5% Informal services
2+61+36+1+A2% Increased
61% Stayed the same
36% Decreased
1% Don't know
16% Borrow and rely on credit
21% Restrict stocks
25% Limit expenses
21% Spend savings
6% Increase working hours
11% Other, or prefer not to answer
160+210+250+210+60+110=
Proportion of KIs reporting on the use of main coping mechanisms to address reduced or limited income:
ENDNOTES1. The Minimum Expenditure Basket (MEB) represents the minimum culturally adjusted group of items required to
support a six-person Afghan household for one month.2. The % of change between the price of the MEB and the Food Basket during data collection refers to the changes
recorded since the previous (14th) round of the JMMI.3. Where JMMI data recorded a MEB price variation of less than 100 AFN, it was chosen to present the variation as
0% because the amount is too small to be approximated as 1%, but too significant to be categorized as "no change".4. All KIs were asked about changes in prices of food items and NFIs in general. KIs that reported an increase or
decrease were asked to report on the main reason for this. 5. Any KI that reported selling any food item or NFI was asked to report the location of their main supplier, whether the
number of suppliers had changed in the last 30 days, and the main means of transportation of goods.6. KIs that reported the number of shops open in the market to have decreased in the past 30 days. Multiple options could
be selected and findings may therefore exceed 100%.7. Pulses in this table are calculated as the median (normalized) price of all three types of pulses monitored: lentils,
beans, and split-peas.
About the Afghanistan Cash and Voucher Working Group and REACH Initiative
The Afghanistan Cash and Voucher Working Group (CVWG) is an inter-cluster technical working group set up to ensure cash and voucher assistance (CVA) in Afghanistan is coordinated, follows a common rationale, is context specific and is undertaken in a manner that does not inflict harm or exacerbate vulnerabilities of the affected population. The working group was initially established in 2012 under the Food Security and Agriculture Cluster (FSAC), but since 2014 it has become an inter-cluster working group which is overseen by the Inter-Cluster Coordination Team (ICCT). The working group is currently co-chaired by the Danish Refugee Council (DRC) and the World Food Programme (WFP). For more information, please visit https://www.humanitarianresponse.info/en/operations/afghanistan/cash-voucher.
REACH Initiative facilitates the development of information tools and products that enhance the capacity of aid actors to make evidence-based decisions in emergency, recovery and development contexts. The methodologies used by REACH include primary data collection, in-depth analysis and all activities are conducted through inter-agency aid coordination mechanisms. REACH is a joint initiative of IMPACT Initiatives, ACTED and the United Nations Institute for Training and Research - Operational Satellite Applications Programme (UNITAR-UNOSAT). For more information please visit our website: www.reach-initiative.org. You can contact us directly at: [email protected] and follow us on Twitter @REACH_info.