afghanistan: who and unicef estimates of immunization ... · afghanistan: who and unicef estimates...
TRANSCRIPT

Afghanistan: WHO and UNICEF estimates of immunization coverage: 2015 revision
July 6, 2016; page 1 WHO and UNICEF estimates of national immunization coverage - next revision available July 15, 2017 data as of July 5, 2016

Afghanistan - BCG
2004 2005 2006 2007 2008 2009 2010 2011 2012 2013 2014 2015Estimate 51 57 60 60 66 64 68 71 78 78 86 86
Estimate GoC • • • • • • • • • • • •Official 51 57 60 60 66 64 68 83 89 89 97 97
Administrative 65 73 77 77 85 82 87 90 94 101 101 99Survey NA 70 NA 74 NA NA 64 NA 78 NA NA NA
The WHO and UNICEF estimates of national immunization coverage (wuenic) are based on data and informationthat are of varying, and, in some instances, unknown quality. Beginning with the 2011 revision we describethe grade of confidence (GoC) we have in these estimates. As there is no underlying probability model uponwhich the estimates are based, we are unable to present classical measures of uncertainty, e.g., confidenceintervals. Moreover, we have chosen not to make subjective estimates of plausibility/certainty ranges aroundthe coverage. The GoC reflects the degree of empirical support upon which the estimates are based. It isnot a judgment of the quality of data reported by national authorities.
••• Estimate is supported by reported data [R+], coverage recalculated with an independentdenominator from the World Population Prospects: 2015 revision from the UN Popula-tion Division (D+), and at least one supporting survey within 2 years [S+]. While wellsupported, the estimate still carries a risk of being wrong.
•• Estimate is supported by at least one data source; [R+], [S+], or [D+]; and no data source,[R-], [D-], or [S-], challenges the estimate.
• There are no directly supporting data; or data from at least one source; [R-], [D-], [S-];challenge the estimate.
In all cases these estimates should be used with caution and should be assessed in lightof the objective for which they are being used.
Description:
2004: Estimate based on coverage reported by national government. Trend inofficial government estimate follows trend in administrative data. Thereis substantial uncertainty in the provisional estimate due to uncertaintyin denominator (last census in 1979) and difficulties in recording and re-porting the number of vaccinations delivered by some service providers.Estimate challenged by: D-S-
2005: Estimate based on coverage reported by national government. AfghanistanHealth Survey 2006 results ignored by working group. Survey is not na-tionally representative and does not include 5 provinces. Card retentionwas 17 percent. See comment for 2003 estimates. Estimate challenged by:D-S-
2006: Estimate based on coverage reported by national government. See commentfor 2003 estimates. Estimate challenged by: D-S-
2007: Estimate based on coverage reported by national government. National Riskand Vulnerability Assessment 2007/8: A profile of Afghanistan results ig-nored by working group. Survey shows inconsistent results between levelsof BCG and DTP coverage. See comment for 2003 estimates. Estimatechallenged by: D-S-
2008: Estimate based on coverage reported by national government. See commentfor 2003 estimates. Estimate challenged by: D-S-
2009: Estimate based on coverage reported by national government. Data qualityself-assessment conducted in 12 provinces found instances of over reportingand errors in recording and reporting. See comment for 2003 estimates.Estimate challenged by: D-S-
2010: . Afghanistan Multiple Indicator Cluster Survey 2010-2011 results ignoredby working group. Card only data suggest no drop out. Data quality self-assessment conducted in 22 provinces found instances of over reportingand errors in recording and reporting. See comment for 2003 estimates.Estimate challenged by: D-S-
2011: Following the trend in administrative levels from 2010. Apparent increasein official reported data between 2010 to 2011 is unexplained as is the in-consistency in adjustments to administrative coverage levels. See commentfor 2003 estimates. Estimate challenged by: D-R-S-
2012: Survey evidence does not support reported data. Estimate based on sur-vey results. Survey evidence of 78 percent based on 1 survey(s). Un-explained inconsistency in adjustments to administrative coverage levels.Beginning around 2012, immunization became an important indicator forperformance monitoring of the service providing NGOs and may be asso-ciated with gradual improvements in service delivery as reflected by thetrend in reported number of doses administered. See comment for 2003estimates. Estimate challenged by: D-R-S-
July 6, 2016; page 2 WHO and UNICEF estimates of national immunization coverage - next revision available July 15, 2017 data as of July 5, 2016

Afghanistan - BCG
2013: Reported data calibrated to 2012 levels. Unexplained inconsistency in ad-justments to administrative coverage levels. Beginning around 2012, immu-nization became an important indicator for performance monitoring of theservice providing NGOs and may be associated with gradual improvementsin service delivery as reflected by the trend in reported number of dosesadministered. In 2013 a multi-antigen SOS-like intervention (except BCG)was implemented in high and intermediate risk districts. See comment for2003 estimates. Estimate challenged by: D-
2014: Reported data calibrated to 2012 levels. Reported official government esti-mate is based on a recomputed target population by the Ministry of PublicHealth using a year-to-year growth rate of 2.7 percent. Estimate is basedon trend in reported number of doses administered. Beginning around2012, immunization became an important indicator for performance mon-itoring of the service providing NGOs and may be associated with gradualimprovements in service delivery. See comment for 2003 estimates. Pro-gramme reports a two month stock-out of BCG vaccine at the nationallevel. Estimate challenged by: D-
2015: Reported data calibrated to 2012 levels. See comment for 2003 estimates.Estimate challenged by: D-
July 6, 2016; page 3 WHO and UNICEF estimates of national immunization coverage - next revision available July 15, 2017 data as of July 5, 2016

Afghanistan - DTP1
2004 2005 2006 2007 2008 2009 2010 2011 2012 2013 2014 2015Estimate 72 76 75 76 75 72 72 78 78 80 82 82
Estimate GoC • • • • • • • • • • • •Official 74 80 81 84 85 84 86 94 101 98 100 109
Administrative 80 88 106 93 NA 94 99 100 106 112 120 111Survey NA 60 NA 63 NA NA 58 NA 78 NA NA NA
The WHO and UNICEF estimates of national immunization coverage (wuenic) are based on data and informationthat are of varying, and, in some instances, unknown quality. Beginning with the 2011 revision we describethe grade of confidence (GoC) we have in these estimates. As there is no underlying probability model uponwhich the estimates are based, we are unable to present classical measures of uncertainty, e.g., confidenceintervals. Moreover, we have chosen not to make subjective estimates of plausibility/certainty ranges aroundthe coverage. The GoC reflects the degree of empirical support upon which the estimates are based. It isnot a judgment of the quality of data reported by national authorities.
••• Estimate is supported by reported data [R+], coverage recalculated with an independentdenominator from the World Population Prospects: 2015 revision from the UN Popula-tion Division (D+), and at least one supporting survey within 2 years [S+]. While wellsupported, the estimate still carries a risk of being wrong.
•• Estimate is supported by at least one data source; [R+], [S+], or [D+]; and no data source,[R-], [D-], or [S-], challenges the estimate.
• There are no directly supporting data; or data from at least one source; [R-], [D-], [S-];challenge the estimate.
In all cases these estimates should be used with caution and should be assessed in lightof the objective for which they are being used.
Description:
2004: Reported data calibrated to 2003 and 2012 levels. Trend in official govern-ment estimate follows trend in administrative data. There is substantialuncertainty in the provisional estimate due to uncertainty in denominator(last census in 1979) and difficulties in recording and reporting the numberof vaccinations delivered by some service providers. Estimate challengedby: D-S-
2005: Reported data calibrated to 2003 and 2012 levels. Afghanistan Health Sur-vey 2006 results ignored by working group. Survey is not nationally repre-sentative and does not include 5 provinces. Card retention was 17 percent.See comment for 2003 estimates. Estimate challenged by: D-S-
2006: Reported data calibrated to 2003 and 2012 levels. See comment for 2003estimates. Estimate challenged by: D-S-
2007: Reported data calibrated to 2003 and 2012 levels. National Risk and Vul-nerability Assessment 2007/8: A profile of Afghanistan results ignored byworking group. Survey shows inconsistent results between levels of BCGand DTP coverage. See comment for 2003 estimates. Estimate challengedby: D-S-
2008: Reported data calibrated to 2003 and 2012 levels. See comment for 2003estimates. Estimate challenged by: S-
2009: Reported data calibrated to 2003 and 2012 levels. Data quality self-assessment conducted in 12 provinces found instances of over reportingand errors in recording and reporting. See comment for 2003 estimates.Estimate challenged by: D-S-
2010: Reported data calibrated to 2003 and 2012 levels. Afghanistan Multiple In-dicator Cluster Survey 2010-2011 results ignored by working group. Cardonly data suggest no drop out. Data quality self-assessment conducted in22 provinces found instances of over reporting and errors in recording andreporting. See comment for 2003 estimates. Estimate challenged by: D-S-
2011: Reported data calibrated to 2003 and 2012 levels. Apparent increase inofficial reported data between 2010 to 2011 is unexplained as is the incon-sistency in adjustments to administrative coverage levels. See commentfor 2003 estimates. Following the trend in administrative levels from 2010.Estimate challenged by: D-S-
2012: Survey evidence does not support reported data. Estimate based on surveyresults. Survey evidence of 78 percent based on 1 survey(s). Reported dataexcluded. 101 percent greater than 100 percent. Unexplained inconsistencyin adjustments to administrative coverage levels. Beginning around 2012,immunization became an important indicator for performance monitoringof the service providing NGOs and may be associated with gradual im-provements in service delivery as reflected by the trend in reported num-ber of doses administered. See comment for 2003 estimates. Estimate
July 6, 2016; page 4 WHO and UNICEF estimates of national immunization coverage - next revision available July 15, 2017 data as of July 5, 2016

Afghanistan - DTP1
challenged by: D-R-S-2013: Reported data calibrated to 2012 levels. Unexplained inconsistency in ad-
justments to administrative coverage levels. Beginning around 2012, immu-nization became an important indicator for performance monitoring of theservice providing NGOs and may be associated with gradual improvementsin service delivery as reflected by the trend in reported number of dosesadministered. In 2013 a multi-antigen SOS-like intervention (except BCG)was implemented in high and intermediate risk districts. See comment for2003 estimates. Estimate challenged by: D-
2014: Reported data calibrated to 2012 levels. Reported official government esti-mate is based on a recomputed target population by the Ministry of PublicHealth using a year-to-year growth rate of 2.7 percent. Estimate is based ontrend in reported number of doses administered. Beginning around 2012,immunization became an important indicator for performance monitoringof the service providing NGOs and may be associated with gradual im-provements in service delivery. See comment for 2003 estimates. Estimatechallenged by: D-
2015: Reported data calibrated to 2012 levels. Reported data excluded. 109 per-cent greater than 100 percent. See comment for 2003 estimates. Estimatechallenged by: D-
July 6, 2016; page 5 WHO and UNICEF estimates of national immunization coverage - next revision available July 15, 2017 data as of July 5, 2016

Afghanistan - DTP3
2004 2005 2006 2007 2008 2009 2010 2011 2012 2013 2014 2015Estimate 50 58 58 63 64 63 66 68 67 70 75 78
Estimate GoC • • • • • • • • • • • •Official 50 58 58 63 64 63 66 82 87 90 95 98
Administrative 66 76 69 83 NA 83 87 89 92 101 105 100Survey NA 35 NA 43 NA NA 40 NA 60 NA NA NA
The WHO and UNICEF estimates of national immunization coverage (wuenic) are based on data and informationthat are of varying, and, in some instances, unknown quality. Beginning with the 2011 revision we describethe grade of confidence (GoC) we have in these estimates. As there is no underlying probability model uponwhich the estimates are based, we are unable to present classical measures of uncertainty, e.g., confidenceintervals. Moreover, we have chosen not to make subjective estimates of plausibility/certainty ranges aroundthe coverage. The GoC reflects the degree of empirical support upon which the estimates are based. It isnot a judgment of the quality of data reported by national authorities.
••• Estimate is supported by reported data [R+], coverage recalculated with an independentdenominator from the World Population Prospects: 2015 revision from the UN Popula-tion Division (D+), and at least one supporting survey within 2 years [S+]. While wellsupported, the estimate still carries a risk of being wrong.
•• Estimate is supported by at least one data source; [R+], [S+], or [D+]; and no data source,[R-], [D-], or [S-], challenges the estimate.
• There are no directly supporting data; or data from at least one source; [R-], [D-], [S-];challenge the estimate.
In all cases these estimates should be used with caution and should be assessed in lightof the objective for which they are being used.
Description:
2004: Estimate based on coverage reported by national government. Trend inofficial government estimate follows trend in administrative data. Thereis substantial uncertainty in the provisional estimate due to uncertaintyin denominator (last census in 1979) and difficulties in recording and re-porting the number of vaccinations delivered by some service providers.Estimate challenged by: D-S-
2005: Estimate based on coverage reported by national government. AfghanistanHealth Survey 2006 results ignored by working group. Survey is not na-tionally representative and does not include 5 provinces. Card retentionwas 17 percent. See comment for 2003 estimates. Estimate challenged by:D-S-
2006: Estimate based on coverage reported by national government. See commentfor 2003 estimates. Estimate challenged by: D-S-
2007: Estimate based on coverage reported by national government. National Riskand Vulnerability Assessment 2007/8: A profile of Afghanistan results ig-nored by working group. Survey shows inconsistent results between levelsof BCG and DTP coverage. See comment for 2003 estimates. Estimatechallenged by: D-S-
2008: Estimate based on coverage reported by national government. See commentfor 2003 estimates. Estimate challenged by: D-S-
2009: Estimate based on coverage reported by national government. Data qualityself-assessment conducted in 12 provinces found instances of over reportingand errors in recording and reporting. See comment for 2003 estimates.Estimate challenged by: D-S-
2010: . Afghanistan Multiple Indicator Cluster Survey 2010-2011 results ignoredby working group. Card only data suggest no drop out.Afghanistan Multi-ple Indicator Cluster Survey 2010-2011 card or history results of 40 percentmodifed for recall bias to 58 percent based on 1st dose card or history cov-erage of 58 percent, 1st dose card only coverage of 32 percent and 3d dosecard only coverage of 32 percent. Data quality self-assessment conductedin 22 provinces found instances of over reporting and errors in recordingand reporting. See comment for 2003 estimates. Estimate challenged by:D-S-
2011: Following the trend in administrative levels from 2010. Apparent increasein official reported data between 2010 to 2011 is unexplained as is the in-consistency in adjustments to administrative coverage levels. See commentfor 2003 estimates. Estimate challenged by: D-R-S-
2012: Survey evidence does not support reported data. Estimate based on surveyresults. Survey evidence of 67 percent based on 1 survey(s). AfghanistanNational EPI Coverage Survey, 2013 card or history results of 60 percentmodifed for recall bias to 67 percent based on 1st dose card or history
July 6, 2016; page 6 WHO and UNICEF estimates of national immunization coverage - next revision available July 15, 2017 data as of July 5, 2016

Afghanistan - DTP3
coverage of 78 percent, 1st dose card only coverage of 63 percent and 3ddose card only coverage of 54 percent. Unexplained inconsistency in ad-justments to administrative coverage levels. Beginning around 2012, im-munization became an important indicator for performance monitoring ofthe service providing NGOs and may be associated with gradual improve-ments in service delivery as reflected by the trend in reported number ofdoses administered. See comment for 2003 estimates. Estimate challengedby: D-R-S-
2013: Reported data calibrated to 2012 levels. Unexplained inconsistency in ad-justments to administrative coverage levels. Beginning around 2012, immu-nization became an important indicator for performance monitoring of theservice providing NGOs and may be associated with gradual improvementsin service delivery as reflected by the trend in reported number of dosesadministered. In 2013 a multi-antigen SOS-like intervention (except BCG)was implemented in high and intermediate risk districts. See comment for2003 estimates. Estimate challenged by: D-
2014: Reported data calibrated to 2012 levels. Reported official government esti-mate is based on a recomputed target population by the Ministry of PublicHealth using a year-to-year growth rate of 2.7 percent. Estimate is based ontrend in reported number of doses administered. Beginning around 2012,immunization became an important indicator for performance monitoringof the service providing NGOs and may be associated with gradual im-provements in service delivery. See comment for 2003 estimates. Estimatechallenged by: D-
2015: Reported data calibrated to 2012 levels. See comment for 2003 estimates.Estimate challenged by: D-
July 6, 2016; page 7 WHO and UNICEF estimates of national immunization coverage - next revision available July 15, 2017 data as of July 5, 2016

Afghanistan - Pol3
2004 2005 2006 2007 2008 2009 2010 2011 2012 2013 2014 2015Estimate 50 58 58 63 64 63 66 68 67 70 75 77
Estimate GoC • • • • • • • • • • • •Official 50 58 58 63 64 63 66 82 87 90 95 97
Administrative 66 76 71 83 85 83 87 89 92 101 105 99Survey NA 70 NA 71 NA NA 48 NA 64 NA NA NA
The WHO and UNICEF estimates of national immunization coverage (wuenic) are based on data and informationthat are of varying, and, in some instances, unknown quality. Beginning with the 2011 revision we describethe grade of confidence (GoC) we have in these estimates. As there is no underlying probability model uponwhich the estimates are based, we are unable to present classical measures of uncertainty, e.g., confidenceintervals. Moreover, we have chosen not to make subjective estimates of plausibility/certainty ranges aroundthe coverage. The GoC reflects the degree of empirical support upon which the estimates are based. It isnot a judgment of the quality of data reported by national authorities.
••• Estimate is supported by reported data [R+], coverage recalculated with an independentdenominator from the World Population Prospects: 2015 revision from the UN Popula-tion Division (D+), and at least one supporting survey within 2 years [S+]. While wellsupported, the estimate still carries a risk of being wrong.
•• Estimate is supported by at least one data source; [R+], [S+], or [D+]; and no data source,[R-], [D-], or [S-], challenges the estimate.
• There are no directly supporting data; or data from at least one source; [R-], [D-], [S-];challenge the estimate.
In all cases these estimates should be used with caution and should be assessed in lightof the objective for which they are being used.
Description:
2004: Estimate based on coverage reported by national government. Trend inofficial government estimate follows trend in administrative data. Thereis substantial uncertainty in the provisional estimate due to uncertaintyin denominator (last census in 1979) and difficulties in recording and re-porting the number of vaccinations delivered by some service providers.Estimate challenged by: D-S-
2005: Estimate based on coverage reported by national government. AfghanistanHealth Survey 2006 results ignored by working group. Survey is not na-tionally representative and does not include 5 provinces. Card retentionwas 17 percent. See comment for 2003 estimates. Estimate challenged by:D-S-
2006: Estimate based on coverage reported by national government. See commentfor 2003 estimates. Estimate challenged by: D-S-
2007: Estimate based on coverage reported by national government. NationalRisk and Vulnerability Assessment 2007/8: A profile of Afghanistan re-sults ignored by working group. Survey shows inconsistent results betweenlevels of BCG and DTP coverage. See comment for 2003 estimates. Sur-vey includes doses delivered during measles control campaign. Estimatechallenged by: D-S-
2008: Estimate based on coverage reported by national government. See commentfor 2003 estimates. Estimate challenged by: D-S-
2009: Estimate based on coverage reported by national government. Data qualityself-assessment conducted in 12 provinces found instances of over reportingand errors in recording and reporting. See comment for 2003 estimates.Estimate challenged by: D-S-
2010: . Afghanistan Multiple Indicator Cluster Survey 2010-2011 results ignoredby working group. Card only data suggest no drop out.Afghanistan Multi-ple Indicator Cluster Survey 2010-2011 card or history results of 48 percentmodifed for recall bias to 71 percent based on 1st dose card or history cov-erage of 71 percent, 1st dose card only coverage of 30 percent and 3d dosecard only coverage of 30 percent. Data quality self-assessment conductedin 22 provinces found instances of over reporting and errors in recordingand reporting. See comment for 2003 estimates. Polio coverage may reflectcampaign doses. Estimate challenged by: D-S-
2011: Following the trend in administrative levels from 2010. Apparent increasein official reported data between 2010 to 2011 is unexplained as is the in-consistency in adjustments to administrative coverage levels. See commentfor 2003 estimates. Estimate challenged by: D-R-S-
2012: Survey evidence does not support reported data. Estimate based on surveyresults. Survey evidence of 67 percent based on 1 survey(s). AfghanistanNational EPI Coverage Survey, 2013 card or history results of 64 percent
July 6, 2016; page 8 WHO and UNICEF estimates of national immunization coverage - next revision available July 15, 2017 data as of July 5, 2016

Afghanistan - Pol3
modifed for recall bias to 67 percent based on 1st dose card or historycoverage of 78 percent, 1st dose card only coverage of 63 percent and 3ddose card only coverage of 54 percent. Unexplained inconsistency in ad-justments to administrative coverage levels. Beginning around 2012, im-munization became an important indicator for performance monitoring ofthe service providing NGOs and may be associated with gradual improve-ments in service delivery as reflected by the trend in reported number ofdoses administered. See comment for 2003 estimates. Estimate challengedby: D-R-S-
2013: Reported data calibrated to 2012 levels. Unexplained inconsistency in ad-justments to administrative coverage levels. Beginning around 2012, immu-nization became an important indicator for performance monitoring of theservice providing NGOs and may be associated with gradual improvementsin service delivery as reflected by the trend in reported number of dosesadministered. In 2013 a multi-antigen SOS-like intervention (except BCG)was implemented in high and intermediate risk districts. See comment for2003 estimates. Estimate challenged by: D-
2014: Reported data calibrated to 2012 levels. Reported official government esti-mate is based on a recomputed target population by the Ministry of PublicHealth using a year-to-year growth rate of 2.7 percent. Estimate is based ontrend in reported number of doses administered. Beginning around 2012,immunization became an important indicator for performance monitoringof the service providing NGOs and may be associated with gradual im-provements in service delivery. See comment for 2003 estimates. Estimatechallenged by: D-
2015: Reported data calibrated to 2012 levels. See comment for 2003 estimates.Estimate challenged by: D-
July 6, 2016; page 9 WHO and UNICEF estimates of national immunization coverage - next revision available July 15, 2017 data as of July 5, 2016
Afghanistan - MCV1
2004 2005 2006 2007 2008 2009 2010 2011 2012 2013 2014 2015Estimate 48 50 53 55 59 60 62 64 59 60 66 68
Estimate GoC • • • • • • • • • • • •Official 48 50 53 55 59 60 62 75 81 82 88 90
Administrative 60 64 68 70 75 76 79 82 85 92 97 92Survey NA 63 NA 56 NA NA 56 NA 59 NA NA NA
The WHO and UNICEF estimates of national immunization coverage (wuenic) are based on data and informationthat are of varying, and, in some instances, unknown quality. Beginning with the 2011 revision we describethe grade of confidence (GoC) we have in these estimates. As there is no underlying probability model uponwhich the estimates are based, we are unable to present classical measures of uncertainty, e.g., confidenceintervals. Moreover, we have chosen not to make subjective estimates of plausibility/certainty ranges aroundthe coverage. The GoC reflects the degree of empirical support upon which the estimates are based. It isnot a judgment of the quality of data reported by national authorities.
••• Estimate is supported by reported data [R+], coverage recalculated with an independentdenominator from the World Population Prospects: 2015 revision from the UN Popula-tion Division (D+), and at least one supporting survey within 2 years [S+]. While wellsupported, the estimate still carries a risk of being wrong.
•• Estimate is supported by at least one data source; [R+], [S+], or [D+]; and no data source,[R-], [D-], or [S-], challenges the estimate.
• There are no directly supporting data; or data from at least one source; [R-], [D-], [S-];challenge the estimate.
In all cases these estimates should be used with caution and should be assessed in lightof the objective for which they are being used.
Description:
2004: Estimate based on coverage reported by national government. Trend inofficial government estimate follows trend in administrative data. Thereis substantial uncertainty in the provisional estimate due to uncertaintyin denominator (last census in 1979) and difficulties in recording and re-porting the number of vaccinations delivered by some service providers.Estimate challenged by: D-S-
2005: Estimate based on coverage reported by national government. AfghanistanHealth Survey 2006 results ignored by working group. Survey is not na-tionally representative and does not include 5 provinces. Card retentionwas 17 percent. See comment for 2003 estimates. Estimate challenged by:D-S-
2006: Estimate based on coverage reported by national government. See commentfor 2003 estimates. Estimate challenged by: D-S-
2007: Estimate based on coverage reported by national government. NationalRisk and Vulnerability Assessment 2007/8: A profile of Afghanistan re-sults ignored by working group. Survey shows inconsistent results betweenlevels of BCG and DTP coverage. See comment for 2003 estimates. Sur-vey includes doses delivered during measles control campaign. Estimatechallenged by: D-S-
2008: Estimate based on coverage reported by national government. See commentfor 2003 estimates. Estimate challenged by: D-S-
2009: Estimate based on coverage reported by national government. Data qualityself-assessment conducted in 12 provinces found instances of over reportingand errors in recording and reporting. See comment for 2003 estimates.Estimate challenged by: D-S-
2010: . Afghanistan Multiple Indicator Cluster Survey 2010-2011 results ignoredby working group. Card only data suggest no drop out. Data quality self-assessment conducted in 22 provinces found instances of over reportingand errors in recording and reporting. See comment for 2003 estimates.Estimate challenged by: D-S-
2011: Reported data calibrated to 2010 and 2012 levels. Apparent increase inofficial reported data between 2010 to 2011 is unexplained as is the incon-sistency in adjustments to administrative coverage levels. See commentfor 2003 estimates. Following the trend in administrative levels from 2010.Estimate challenged by: D-S-
2012: Survey evidence does not support reported data. Estimate based on sur-vey results. Survey evidence of 59 percent based on 1 survey(s). Un-explained inconsistency in adjustments to administrative coverage levels.Beginning around 2012, immunization became an important indicator forperformance monitoring of the service providing NGOs and may be asso-ciated with gradual improvements in service delivery as reflected by the
July 6, 2016; page 10 WHO and UNICEF estimates of national immunization coverage - next revision available July 15, 2017 data as of July 5, 2016
Afghanistan - MCV1
trend in reported number of doses administered. See comment for 2003estimates. Estimate challenged by: D-R-S-
2013: Reported data calibrated to 2012 levels. Unexplained inconsistency in ad-justments to administrative coverage levels. Beginning around 2012, immu-nization became an important indicator for performance monitoring of theservice providing NGOs and may be associated with gradual improvementsin service delivery as reflected by the trend in reported number of dosesadministered. In 2013 a multi-antigen SOS-like intervention (except BCG)was implemented in high and intermediate risk districts. See comment for2003 estimates. Estimate challenged by: D-
2014: Reported data calibrated to 2012 levels. Reported official government esti-mate is based on a recomputed target population by the Ministry of PublicHealth using a year-to-year growth rate of 2.7 percent. Estimate is based ontrend in reported number of doses administered. Beginning around 2012,immunization became an important indicator for performance monitoringof the service providing NGOs and may be associated with gradual im-provements in service delivery. See comment for 2003 estimates. Estimatechallenged by: D-
2015: Reported data calibrated to 2012 levels. See comment for 2003 estimates.Estimate challenged by: D-
July 6, 2016; page 11 WHO and UNICEF estimates of national immunization coverage - next revision available July 15, 2017 data as of July 5, 2016

Afghanistan - MCV2
2004 2005 2006 2007 2008 2009 2010 2011 2012 2013 2014 2015Estimate 2 9 18 4 23 24 29 31 33 35 39 39
Estimate GoC • • • • • • • • • • • •Official 2 NA NA 16 39 40 46 48 54 56 60 60
Administrative 2 13 26 16 39 40 46 48 54 57 60 NASurvey NA NA NA NA NA NA NA NA NA NA NA NA
The WHO and UNICEF estimates of national immunization coverage (wuenic) are based on data and informationthat are of varying, and, in some instances, unknown quality. Beginning with the 2011 revision we describethe grade of confidence (GoC) we have in these estimates. As there is no underlying probability model uponwhich the estimates are based, we are unable to present classical measures of uncertainty, e.g., confidenceintervals. Moreover, we have chosen not to make subjective estimates of plausibility/certainty ranges aroundthe coverage. The GoC reflects the degree of empirical support upon which the estimates are based. It isnot a judgment of the quality of data reported by national authorities.
••• Estimate is supported by reported data [R+], coverage recalculated with an independentdenominator from the World Population Prospects: 2015 revision from the UN Popula-tion Division (D+), and at least one supporting survey within 2 years [S+]. While wellsupported, the estimate still carries a risk of being wrong.
•• Estimate is supported by at least one data source; [R+], [S+], or [D+]; and no data source,[R-], [D-], or [S-], challenges the estimate.
• There are no directly supporting data; or data from at least one source; [R-], [D-], [S-];challenge the estimate.
In all cases these estimates should be used with caution and should be assessed in lightof the objective for which they are being used.
Description:
Coverage estimates for the second dose of measles containing vaccine are for chil-dren by the nationally recommended age.
2004: Estimate is based on reported data. Trend in official government estimatefollows trend in administrative data. There is substantial uncertainty inthe provisional estimate due to uncertainty in denominator (last census in1979) and difficulties in recording and reporting the number of vaccinationsdelivered by some service providers. Estimate challenged by: S-
2005: Reported data calibrated to 2004 and 2008 levels. See comment for 2003estimates. Estimate challenged by: S-
2006: Reported data calibrated to 2004 and 2008 levels. See comment for 2003estimates. Estimate challenged by: S-
2007: Reported data calibrated to 2004 and 2008 levels. See comment for 2003estimates. Estimate challenged by: D-S-
2008: Estimates follows reported data calibrated based on MCV adjustment fac-tor (difference between reported administrative and official coverage). Seecomment for 2003 estimates. Estimate challenged by: D-R-S-
2009: Estimates follows reported data calibrated based on MCV adjustment factor.Data quality self-assessment conducted in 12 provinces found instances ofover reporting and errors in recording and reporting. See comment for2003 estimates. Estimate challenged by: D-R-S-
2010: Estimates follows reported data calibrated based on MCV adjustment factor.Data quality self-assessment conducted in 22 provinces found instances ofover reporting and errors in recording and reporting. See comment for2003 estimates. Estimate challenged by: D-R-S-
2011: Estimates follows reported data calibrated based on MCV adjustment factor.Apparent increase in official reported data between 2010 to 2011 is unex-plained as is the inconsistency in adjustments to administrative coveragelevels. See comment for 2003 estimates. Estimate challenged by: D-R-S-
2012: Estimates follows reported data calibrated based on MCV adjustment fac-tor. Unexplained inconsistency in adjustments to administrative coveragelevels. Beginning around 2012, immunization became an important indi-cator for performance monitoring of the service providing NGOs and maybe associated with gradual improvements in service delivery as reflectedby the trend in reported number of doses administered. See comment for2003 estimates. Estimate challenged by: D-R-S-
2013: Reported data calibrated to 2012 levels. Unexplained inconsistency in ad-justments to administrative coverage levels. Beginning around 2012, immu-nization became an important indicator for performance monitoring of theservice providing NGOs and may be associated with gradual improvementsin service delivery as reflected by the trend in reported number of doses
July 6, 2016; page 12 WHO and UNICEF estimates of national immunization coverage - next revision available July 15, 2017 data as of July 5, 2016

Afghanistan - MCV2
administered. In 2013 a multi-antigen SOS-like intervention (except BCG)was implemented in high and intermediate risk districts. See comment for2003 estimates. Estimate challenged by: D-
2014: Reported data calibrated to 2012 levels. Reported official government esti-mate is based on a recomputed target population by the Ministry of PublicHealth using a year-to-year growth rate of 2.7 percent. Estimate is based ontrend in reported number of doses administered. Beginning around 2012,immunization became an important indicator for performance monitoringof the service providing NGOs and may be associated with gradual im-provements in service delivery. See comment for 2003 estimates. Estimatechallenged by: D-
2015: Reported data calibrated to 2012 levels. See comment for 2003 estimates.GoC=No accepted empirical data
July 6, 2016; page 13 WHO and UNICEF estimates of national immunization coverage - next revision available July 15, 2017 data as of July 5, 2016

Afghanistan - RCV1
2004 2005 2006 2007 2008 2009 2010 2011 2012 2013 2014 2015Estimate NA NA NA NA NA NA NA NA NA NA NA NA
Estimate GoC NA NA NA NA NA NA NA NA NA NA NA NA
Official NA NA NA NA NA NA NA NA NA NA NA NAAdministrative NA NA NA NA NA NA NA NA NA NA NA NA
Survey NA NA NA NA NA NA NA NA NA NA NA NA
The WHO and UNICEF estimates of national immunization coverage (wuenic) are based on data and informationthat are of varying, and, in some instances, unknown quality. Beginning with the 2011 revision we describethe grade of confidence (GoC) we have in these estimates. As there is no underlying probability model uponwhich the estimates are based, we are unable to present classical measures of uncertainty, e.g., confidenceintervals. Moreover, we have chosen not to make subjective estimates of plausibility/certainty ranges aroundthe coverage. The GoC reflects the degree of empirical support upon which the estimates are based. It isnot a judgment of the quality of data reported by national authorities.
••• Estimate is supported by reported data [R+], coverage recalculated with an independentdenominator from the World Population Prospects: 2015 revision from the UN Popula-tion Division (D+), and at least one supporting survey within 2 years [S+]. While wellsupported, the estimate still carries a risk of being wrong.
•• Estimate is supported by at least one data source; [R+], [S+], or [D+]; and no data source,[R-], [D-], or [S-], challenges the estimate.
• There are no directly supporting data; or data from at least one source; [R-], [D-], [S-];challenge the estimate.
In all cases these estimates should be used with caution and should be assessed in lightof the objective for which they are being used.
July 6, 2016; page 14 WHO and UNICEF estimates of national immunization coverage - next revision available July 15, 2017 data as of July 5, 2016
Afghanistan - HepBB
2004 2005 2006 2007 2008 2009 2010 2011 2012 2013 2014 2015Estimate NA NA NA NA NA NA NA NA NA NA 4 18
Estimate GoC NA NA NA NA NA NA NA NA NA NA • •Official NA NA NA NA NA NA NA NA NA NA NA 18
Administrative NA NA NA NA NA NA NA NA NA NA 4 18Survey NA NA NA NA NA NA NA NA NA NA NA NA
The WHO and UNICEF estimates of national immunization coverage (wuenic) are based on data and informationthat are of varying, and, in some instances, unknown quality. Beginning with the 2011 revision we describethe grade of confidence (GoC) we have in these estimates. As there is no underlying probability model uponwhich the estimates are based, we are unable to present classical measures of uncertainty, e.g., confidenceintervals. Moreover, we have chosen not to make subjective estimates of plausibility/certainty ranges aroundthe coverage. The GoC reflects the degree of empirical support upon which the estimates are based. It isnot a judgment of the quality of data reported by national authorities.
••• Estimate is supported by reported data [R+], coverage recalculated with an independentdenominator from the World Population Prospects: 2015 revision from the UN Popula-tion Division (D+), and at least one supporting survey within 2 years [S+]. While wellsupported, the estimate still carries a risk of being wrong.
•• Estimate is supported by at least one data source; [R+], [S+], or [D+]; and no data source,[R-], [D-], or [S-], challenges the estimate.
• There are no directly supporting data; or data from at least one source; [R-], [D-], [S-];challenge the estimate.
In all cases these estimates should be used with caution and should be assessed in lightof the objective for which they are being used.
Description:
2014: Estimate based on reported administrative estimate. Reported official gov-ernment estimate is based on a recomputed target population by the Min-istry of Public Health using a year-to-year growth rate of 2.7 percent.Estimate is based on trend in reported number of doses administered. Be-ginning around 2012, immunization became an important indicator forperformance monitoring of the service providing NGOs and may be associ-ated with gradual improvements in service delivery. Hepatitis B birth doseintroduced during August 2014. Primarily administered to infants born inhealth facilities. GoC=Assigned by working group. Introduction periodand consistency with other vaccines.
2015: Estimate based on coverage reported by national government. Reported cov-erage using national target population. GoC=Assigned by working group..
July 6, 2016; page 15 WHO and UNICEF estimates of national immunization coverage - next revision available July 15, 2017 data as of July 5, 2016

Afghanistan - HepB3
2004 2005 2006 2007 2008 2009 2010 2011 2012 2013 2014 2015Estimate NA NA NA 63 64 63 66 68 67 70 75 78
Estimate GoC NA NA NA • • • • • • • • •Official NA NA NA 63 64 63 66 82 87 90 95 98
Administrative NA NA NA 83 NA 83 87 89 92 101 105 100Survey NA NA NA NA NA NA NA NA 60 NA NA NA
The WHO and UNICEF estimates of national immunization coverage (wuenic) are based on data and informationthat are of varying, and, in some instances, unknown quality. Beginning with the 2011 revision we describethe grade of confidence (GoC) we have in these estimates. As there is no underlying probability model uponwhich the estimates are based, we are unable to present classical measures of uncertainty, e.g., confidenceintervals. Moreover, we have chosen not to make subjective estimates of plausibility/certainty ranges aroundthe coverage. The GoC reflects the degree of empirical support upon which the estimates are based. It isnot a judgment of the quality of data reported by national authorities.
••• Estimate is supported by reported data [R+], coverage recalculated with an independentdenominator from the World Population Prospects: 2015 revision from the UN Popula-tion Division (D+), and at least one supporting survey within 2 years [S+]. While wellsupported, the estimate still carries a risk of being wrong.
•• Estimate is supported by at least one data source; [R+], [S+], or [D+]; and no data source,[R-], [D-], or [S-], challenges the estimate.
• There are no directly supporting data; or data from at least one source; [R-], [D-], [S-];challenge the estimate.
In all cases these estimates should be used with caution and should be assessed in lightof the objective for which they are being used.
Description:
2007: Estimate based on reported data. HepB vaccine introduced in 2006. Report-ing started in 2007. Trend in official government estimate follows trend inadministrative data. There is substantial uncertainty in the provisionalestimate due to uncertainty in denominator (last census in 1979) and diffi-culties in recording and reporting the number of vaccinations delivered bysome service providers. Estimate challenged by: D-S-
2008: Estimate based on reported data. See comment for 2007 estimates. Estimatechallenged by: D-S-
2009: Estimate based on reported data. Data quality self-assessment conductedin 12 provinces found instances of over reporting and errors in recordingand reporting. Estimate challenged by: D-S-
2010: . Data quality self-assessment conducted in 22 provinces found instances ofover reporting and errors in recording and reporting. Estimate challengedby: D-S-
2011: Following the trend in administrative levels from 2010. Apparent increasein official reported data between 2010 to 2011 is unexplained as is theinconsistency in adjustments to administrative coverage levels. Estimatechallenged by: D-R-S-
2012: Survey evidence does not support reported data. Estimate based on surveyresults. Survey evidence of 67 percent based on 1 survey(s). AfghanistanNational EPI Coverage Survey, 2013 card or history results of 60 percentmodifed for recall bias to 67 percent based on 1st dose card or historycoverage of 78 percent, 1st dose card only coverage of 63 percent and 3ddose card only coverage of 54 percent. Unexplained inconsistency in ad-justments to administrative coverage levels. Beginning around 2012, im-munization became an important indicator for performance monitoring ofthe service providing NGOs and may be associated with gradual improve-ments in service delivery as reflected by the trend in reported number ofdoses administered. Estimate challenged by: D-R-S-
2013: Reported data calibrated to 2012 levels. Unexplained inconsistency in ad-justments to administrative coverage levels. Beginning around 2012, im-munization became an important indicator for performance monitoring ofthe service providing NGOs and may be associated with gradual improve-ments in service delivery as reflected by the trend in reported number ofdoses administered. In 2013 a multi-antigen SOS-like intervention (exceptBCG) was implemented in high and intermediate risk districts. Estimatechallenged by: D-
2014: Reported data calibrated to 2012 levels. Reported official government esti-mate is based on a recomputed target population by the Ministry of PublicHealth using a year-to-year growth rate of 2.7 percent. Estimate is basedon trend in reported number of doses administered. Beginning around
July 6, 2016; page 16 WHO and UNICEF estimates of national immunization coverage - next revision available July 15, 2017 data as of July 5, 2016

Afghanistan - HepB3
2012, immunization became an important indicator for performance mon-itoring of the service providing NGOs and may be associated with gradualimprovements in service delivery. GoC=Assigned by working group. Con-sistent with other vaccines.
2015: Reported data calibrated to 2012 levels. Estimate challenged by: D-
July 6, 2016; page 17 WHO and UNICEF estimates of national immunization coverage - next revision available July 15, 2017 data as of July 5, 2016
Afghanistan - Hib3
2004 2005 2006 2007 2008 2009 2010 2011 2012 2013 2014 2015Estimate NA NA NA NA NA 63 66 68 67 70 75 78
Estimate GoC NA NA NA NA NA • • • • • • •Official NA NA NA NA NA 63 66 82 87 90 95 98
Administrative NA NA NA NA NA 83 87 89 92 101 105 100Survey NA NA NA NA NA NA NA NA 60 NA NA NA
The WHO and UNICEF estimates of national immunization coverage (wuenic) are based on data and informationthat are of varying, and, in some instances, unknown quality. Beginning with the 2011 revision we describethe grade of confidence (GoC) we have in these estimates. As there is no underlying probability model uponwhich the estimates are based, we are unable to present classical measures of uncertainty, e.g., confidenceintervals. Moreover, we have chosen not to make subjective estimates of plausibility/certainty ranges aroundthe coverage. The GoC reflects the degree of empirical support upon which the estimates are based. It isnot a judgment of the quality of data reported by national authorities.
••• Estimate is supported by reported data [R+], coverage recalculated with an independentdenominator from the World Population Prospects: 2015 revision from the UN Popula-tion Division (D+), and at least one supporting survey within 2 years [S+]. While wellsupported, the estimate still carries a risk of being wrong.
•• Estimate is supported by at least one data source; [R+], [S+], or [D+]; and no data source,[R-], [D-], or [S-], challenges the estimate.
• There are no directly supporting data; or data from at least one source; [R-], [D-], [S-];challenge the estimate.
In all cases these estimates should be used with caution and should be assessed in lightof the objective for which they are being used.
Description:
2009: Estimate based on reported data. Data quality self-assessment conductedin 12 provinces found instances of over reporting and errors in record-ing and reporting. Hib vaccine introduced in 2009 Vaccine presentationis DTP-HepB-Hib. Trend in official government estimate follows trend inadministrative data. There is substantial uncertainty in the provisionalestimate due to uncertainty in denominator (last census in 1979) and diffi-culties in recording and reporting the number of vaccinations delivered bysome service providers. Estimate challenged by: D-S-
2010: . Data quality self-assessment conducted in 22 provinces found instancesof over reporting and errors in recording and reporting. See comment for2009 estimates. Estimate challenged by: D-S-
2011: Following the trend in administrative levels from 2010. Apparent increasein official reported data between 2010 to 2011 is unexplained as is the in-consistency in adjustments to administrative coverage levels. See commentfor 2009 estimates. Estimate challenged by: D-R-S-
2012: Survey evidence does not support reported data. Estimate based on surveyresults. Survey evidence of 67 percent based on 1 survey(s). AfghanistanNational EPI Coverage Survey, 2013 card or history results of 60 percentmodifed for recall bias to 67 percent based on 1st dose card or historycoverage of 78 percent, 1st dose card only coverage of 63 percent and 3ddose card only coverage of 54 percent. Unexplained inconsistency in ad-justments to administrative coverage levels. Beginning around 2012, im-munization became an important indicator for performance monitoring ofthe service providing NGOs and may be associated with gradual improve-ments in service delivery as reflected by the trend in reported number ofdoses administered. See comment for 2009 estimates. Estimate challengedby: D-R-S-
2013: Reported data calibrated to 2012 levels. Unexplained inconsistency in ad-justments to administrative coverage levels. Beginning around 2012, immu-nization became an important indicator for performance monitoring of theservice providing NGOs and may be associated with gradual improvementsin service delivery as reflected by the trend in reported number of dosesadministered. In 2013 a multi-antigen SOS-like intervention (except BCG)was implemented in high and intermediate risk districts. See comment for2009 estimates. Estimate challenged by: D-
2014: Reported data calibrated to 2012 levels. Reported official government esti-mate is based on a recomputed target population by the Ministry of PublicHealth using a year-to-year growth rate of 2.7 percent. Estimate is based ontrend in reported number of doses administered. Beginning around 2012,immunization became an important indicator for performance monitoringof the service providing NGOs and may be associated with gradual im-
July 6, 2016; page 18 WHO and UNICEF estimates of national immunization coverage - next revision available July 15, 2017 data as of July 5, 2016

Afghanistan - Hib3
provements in service delivery. See comment for 2009 estimates. Estimatechallenged by: D-
2015: Reported data calibrated to 2012 levels. See comment for 2009 estimates.Estimate challenged by: D-
July 6, 2016; page 19 WHO and UNICEF estimates of national immunization coverage - next revision available July 15, 2017 data as of July 5, 2016

Afghanistan - RotaC
2004 2005 2006 2007 2008 2009 2010 2011 2012 2013 2014 2015Estimate NA NA NA NA NA NA NA NA NA NA NA NA
Estimate GoC NA NA NA NA NA NA NA NA NA NA NA NA
Official NA NA NA NA NA NA NA NA NA NA NA NAAdministrative NA NA NA NA NA NA NA NA NA NA NA NA
Survey NA NA NA NA NA NA NA NA NA NA NA NA
The WHO and UNICEF estimates of national immunization coverage (wuenic) are based on data and informationthat are of varying, and, in some instances, unknown quality. Beginning with the 2011 revision we describethe grade of confidence (GoC) we have in these estimates. As there is no underlying probability model uponwhich the estimates are based, we are unable to present classical measures of uncertainty, e.g., confidenceintervals. Moreover, we have chosen not to make subjective estimates of plausibility/certainty ranges aroundthe coverage. The GoC reflects the degree of empirical support upon which the estimates are based. It isnot a judgment of the quality of data reported by national authorities.
••• Estimate is supported by reported data [R+], coverage recalculated with an independentdenominator from the World Population Prospects: 2015 revision from the UN Popula-tion Division (D+), and at least one supporting survey within 2 years [S+]. While wellsupported, the estimate still carries a risk of being wrong.
•• Estimate is supported by at least one data source; [R+], [S+], or [D+]; and no data source,[R-], [D-], or [S-], challenges the estimate.
• There are no directly supporting data; or data from at least one source; [R-], [D-], [S-];challenge the estimate.
In all cases these estimates should be used with caution and should be assessed in lightof the objective for which they are being used.
July 6, 2016; page 20 WHO and UNICEF estimates of national immunization coverage - next revision available July 15, 2017 data as of July 5, 2016

Afghanistan - PcV3
2004 2005 2006 2007 2008 2009 2010 2011 2012 2013 2014 2015Estimate NA NA NA NA NA NA NA NA NA NA 40 66
Estimate GoC NA NA NA NA NA NA NA NA NA NA • •Official NA NA NA NA NA NA NA NA NA NA 63 89
Administrative NA NA NA NA NA NA NA NA NA NA 69 91Survey NA NA NA NA NA NA NA NA NA NA NA NA
The WHO and UNICEF estimates of national immunization coverage (wuenic) are based on data and informationthat are of varying, and, in some instances, unknown quality. Beginning with the 2011 revision we describethe grade of confidence (GoC) we have in these estimates. As there is no underlying probability model uponwhich the estimates are based, we are unable to present classical measures of uncertainty, e.g., confidenceintervals. Moreover, we have chosen not to make subjective estimates of plausibility/certainty ranges aroundthe coverage. The GoC reflects the degree of empirical support upon which the estimates are based. It isnot a judgment of the quality of data reported by national authorities.
••• Estimate is supported by reported data [R+], coverage recalculated with an independentdenominator from the World Population Prospects: 2015 revision from the UN Popula-tion Division (D+), and at least one supporting survey within 2 years [S+]. While wellsupported, the estimate still carries a risk of being wrong.
•• Estimate is supported by at least one data source; [R+], [S+], or [D+]; and no data source,[R-], [D-], or [S-], challenges the estimate.
• There are no directly supporting data; or data from at least one source; [R-], [D-], [S-];challenge the estimate.
In all cases these estimates should be used with caution and should be assessed in lightof the objective for which they are being used.
Description:
2014: Pneumococcal conjugate vaccine introduced during 2014. Estimate is basedon calibrated DTP3 level. Reported official government estimate is basedon a recomputed target population by the Ministry of Public Health usinga year-to-year growth rate of 2.7 percent. Estimate is based on trend inreported number of doses administered. Beginning around 2012, immu-nization became an important indicator for performance monitoring of theservice providing NGOs and may be associated with gradual improvementsin service delivery. Estimate challenged by: D-R-
2015: Reported data calibrated to 2014 levels. Estimate challenged by: D-
July 6, 2016; page 21 WHO and UNICEF estimates of national immunization coverage - next revision available July 15, 2017 data as of July 5, 2016
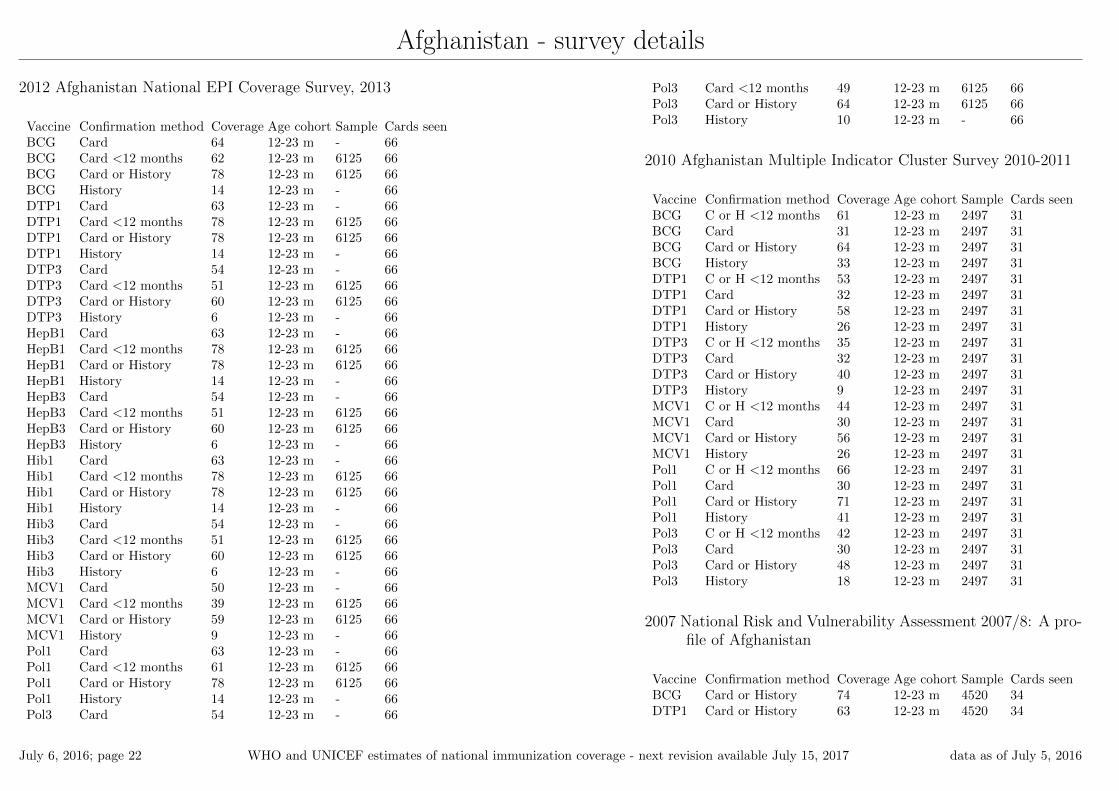
Afghanistan - survey details
2012 Afghanistan National EPI Coverage Survey, 2013
Vaccine Confirmation method Coverage Age cohort Sample Cards seenBCG Card 64 12-23 m - 66BCG Card <12 months 62 12-23 m 6125 66BCG Card or History 78 12-23 m 6125 66BCG History 14 12-23 m - 66DTP1 Card 63 12-23 m - 66DTP1 Card <12 months 78 12-23 m 6125 66DTP1 Card or History 78 12-23 m 6125 66DTP1 History 14 12-23 m - 66DTP3 Card 54 12-23 m - 66DTP3 Card <12 months 51 12-23 m 6125 66DTP3 Card or History 60 12-23 m 6125 66DTP3 History 6 12-23 m - 66HepB1 Card 63 12-23 m - 66HepB1 Card <12 months 78 12-23 m 6125 66HepB1 Card or History 78 12-23 m 6125 66HepB1 History 14 12-23 m - 66HepB3 Card 54 12-23 m - 66HepB3 Card <12 months 51 12-23 m 6125 66HepB3 Card or History 60 12-23 m 6125 66HepB3 History 6 12-23 m - 66Hib1 Card 63 12-23 m - 66Hib1 Card <12 months 78 12-23 m 6125 66Hib1 Card or History 78 12-23 m 6125 66Hib1 History 14 12-23 m - 66Hib3 Card 54 12-23 m - 66Hib3 Card <12 months 51 12-23 m 6125 66Hib3 Card or History 60 12-23 m 6125 66Hib3 History 6 12-23 m - 66MCV1 Card 50 12-23 m - 66MCV1 Card <12 months 39 12-23 m 6125 66MCV1 Card or History 59 12-23 m 6125 66MCV1 History 9 12-23 m - 66Pol1 Card 63 12-23 m - 66Pol1 Card <12 months 61 12-23 m 6125 66Pol1 Card or History 78 12-23 m 6125 66Pol1 History 14 12-23 m - 66Pol3 Card 54 12-23 m - 66
Pol3 Card <12 months 49 12-23 m 6125 66Pol3 Card or History 64 12-23 m 6125 66Pol3 History 10 12-23 m - 66
2010 Afghanistan Multiple Indicator Cluster Survey 2010-2011
Vaccine Confirmation method Coverage Age cohort Sample Cards seenBCG C or H <12 months 61 12-23 m 2497 31BCG Card 31 12-23 m 2497 31BCG Card or History 64 12-23 m 2497 31BCG History 33 12-23 m 2497 31DTP1 C or H <12 months 53 12-23 m 2497 31DTP1 Card 32 12-23 m 2497 31DTP1 Card or History 58 12-23 m 2497 31DTP1 History 26 12-23 m 2497 31DTP3 C or H <12 months 35 12-23 m 2497 31DTP3 Card 32 12-23 m 2497 31DTP3 Card or History 40 12-23 m 2497 31DTP3 History 9 12-23 m 2497 31MCV1 C or H <12 months 44 12-23 m 2497 31MCV1 Card 30 12-23 m 2497 31MCV1 Card or History 56 12-23 m 2497 31MCV1 History 26 12-23 m 2497 31Pol1 C or H <12 months 66 12-23 m 2497 31Pol1 Card 30 12-23 m 2497 31Pol1 Card or History 71 12-23 m 2497 31Pol1 History 41 12-23 m 2497 31Pol3 C or H <12 months 42 12-23 m 2497 31Pol3 Card 30 12-23 m 2497 31Pol3 Card or History 48 12-23 m 2497 31Pol3 History 18 12-23 m 2497 31
2007 National Risk and Vulnerability Assessment 2007/8: A pro-file of Afghanistan
Vaccine Confirmation method Coverage Age cohort Sample Cards seenBCG Card or History 74 12-23 m 4520 34DTP1 Card or History 63 12-23 m 4520 34
July 6, 2016; page 22 WHO and UNICEF estimates of national immunization coverage - next revision available July 15, 2017 data as of July 5, 2016

Afghanistan - survey details
DTP3 Card or History 43 12-23 m 4520 34MCV1 Card or History 56 12-23 m 4520 34Pol3 Card or History 71 12-23 m 4520 34
2005 Afghanistan Health Survey 2006
Vaccine Confirmation method Coverage Age cohort Sample Cards seenBCG Card or History 70 12-23 m 1665 17DTP1 Card or History 60 12-23 m 1665 17DTP3 Card or History 35 12-23 m 1665 17MCV1 Card or History 63 12-23 m 1665 17Pol3 Card or History 70 12-23 m 1665 17
2002 Moving Beyond 2 decades of war: Progress of Provinces
Vaccine Confirmation method Coverage Age cohort Sample Cards seenDTP3 NA 30 12-23 m - 61Pol3 NA 51 12-23 m - 61
1999 Afghanistan Multiple Indicator Cluster Survey, 2000, Eastof Afghanistan
Vaccine Confirmation method Coverage Age cohort Sample Cards seenBCG Card or History 78 12-23 m 223 -DTP1 Card or History 71 12-23 m 223 -DTP3 Card or History 45 12-23 m 223 -
MCV1 Card or History 57 12-23 m 223 -Pol1 Card or History 88 12-23 m 223 -Pol3 Card or History 58 12-23 m 223 -
1998 EPI Coverage Situation in Women and Children ofAfghanistan, Report of Post NID’s, Routine Coverage andAcceleration Campaign Survey in Afghanistan (1999)
Vaccine Confirmation method Coverage Age cohort Sample Cards seenBCG Card 40 12-23 m 1681 48BCG Card or History 70 12-23 m 1681 48BCG History 30 12-23 m 1681 48DTP1 Card 46 12-23 m 1681 48DTP1 Card or History 76 12-23 m 1681 48DTP1 History 29 12-23 m 1681 48DTP3 Card 27 12-23 m 1681 48DTP3 Card or History 47 12-23 m 1681 48DTP3 History 20 12-23 m 1681 48MCV1 Card 37 12-23 m 1681 48MCV1 Card or History 57 12-23 m 1681 48MCV1 History 20 12-23 m 1681 48Pol1 Card 46 12-23 m 1681 48Pol1 Card or History 76 12-23 m 1681 48Pol1 History 29 12-23 m 1681 48Pol3 Card 27 12-23 m 1681 48Pol3 Card or History 47 12-23 m 1681 48Pol3 History 20 12-23 m 1681 48
Further information and estimates for previous years are available at:
http://www.data.unicef.org/child-health/immunization
http://www.who.int/immunization/monitoring_surveillance/routine/coverage/en/index4.html
July 6, 2016; page 23 WHO and UNICEF estimates of national immunization coverage - next revision available July 15, 2017 data as of July 5, 2016

___________________________________________
1 This model is described in: Griffiths U., Wolfson L., Quddus A., Younus M., Hafiz R.. Incremental cost-effectiveness of supplementary immunization activities to prevent
neo-natal tetanus in Pakistan. Bulletin of the World Health Organization 2004; 82:643-651.
WHO and UNICEF estimates of national immunization coverage Data as of July 5, 2016
Afghanistan WHO/UNICEF Estimates of Protection at Birth (PAB) against tetanus
In countries where tetanus is recommended for girls and women coverage is usually reported as
"TT2+", i.e. the proportion of (pregnant) women who have received their second or superior TT
dose in a given year. TT2 + coverage, however, can under-represent the actual proportion of births
that are protected against tetanus as it does not include women who have previously received
protective doses, women who received one dose without documentation of previous doses, and
women who received doses in TT (or Td) supplemental immunization activities (SIA). In addition,
girls who have received DTP in their childhood and are entering childbearing age, may be
protected with TT booster doses.
WHO and UNICEF have developed a model that takes into account the above scenarios, and
calculates the proportion of births in a given year that can be considered as having been protected
against tetanus - "Protection at Birth".
In this model, annual cohorts of women are followed from infancy through their life. A proportion
receives DTP in infancy (estimated based on the WHO-UNICEF estimates of DTP3 coverage). In
addition some of these women also receive TT through routine services when they are pregnant
and may also receive TT during SIAs. The model also adjusts reported data, taking into account
coverage patterns in other years, and/or results available through surveys. The duration of
protection is then calculated, based on WHO estimates of the duration of protection by doses ever
received. The proportion of births that are protected against tetanus as a result of maternal
immunization reflects the tetanus immunization received by the mother throughout her life rather
than simply the TT immunizations received during the current pregnancy.
The model was used in the mid to late 2000. Currently, the coverage series developed by the
model is used as the baseline, and efforts are made to obtain data from all sources that include the
JRF and reported trend over the years, routine PAB reporting and its trend over the years, data
from surveys (DHS, MICS, EPI), whether countries have been validated for the attainment of
maternal and neonatal tetanus elimination and what the TT coverage figures are from the survey
etc and all the information is used to arrive at an estimate of the protection-at-birth from TT
vaccination.
Year PAB coverage
estimate (%)
2004 95
2005 96
2006 95
2007 84
2008 83
2009 89
2010 79
2011 60
2012 60
2013 65
2014 70
2015 70