africa energy outlook 2021
TRANSCRIPT

Africa Energy Outlook2021

2African Energy Outlook 2021
African Energy Chamber2
Published and presented by the
African Energy Chamber with de-
sign by Africa Oil & Power.
Published 2 November 2020
energychamber.org
The African Energy Chamber ex-
tends thanks to all individuals and
companies that supported the pro-
duction of this report.
Africa Energy Outlook 2021

www.energychamber.org 3
Credits
Executive ChairmanNJ Ayuk
Senior Vice PresidentVerner Ayukegba
Director of Communications and Marketing Mandisa Nduli
Director of StrategyMickaël Vogel
Digital Marketing Coordinator Amina Williams
Creative Director Giovanni Trevisson
Graphic Designers Paul Cheeseman
Heidi Sparks
With special thanks to:Dr Theophilus Acheampong
Dr Nathaniel Babajide
Doris Agbevivi
Dr Bridget Menyeh
Dr Geoffrey Mabea
Rystad Energy
Production Team
www.energychamber.org 3

4African Energy Outlook 2021
African Energy Chamber4
A letter from ourExecutive ChairmanNJ Ayuk
Introduction
High carbon emission is a threat to African competitiveness
Free cash flow and government take
Oil Markets
Gas Commodities
Market conditions
The future of expenditure investments
6
8
10
16
20
24
28
34
Exploration &Production Outlook
Contents
EnvironmentalOutlook
Investments &CommoditiesOutlook
Africa Energy Outlook 2021

www.energychamber.org 5
Market realities: Impact on fiscal terms
Energy transition contributionson industry outlook
The state of jobs
Keeping African resources competitive
Production review
Introduction
Africa’s electricity sector in 2021
Gas-to-power and Africa’s industrialization
Regulatory reforms
The energy transition and Africa’s power sector
Investing in the fight against energy poverty
44
50
58
60
66
84
86
93
96
102
104
EmploymentOutlook
IndustryOutlook
PowerOutlook
RegionalOutlook

6African Energy Outlook 2021
African Energy Chamber6
We have to cut red tape to make life easier for
hard-working Africans, businesses and investors
to work and grow the energy sector. We know
from experience this will reduce the cost of doing
business, speed up approvals and make life
better for Africans. We must never be ashamed of
supporting an industry that has brought so much
to Africa and will continue to bring people out of
poverty and reduce reliance on foreign aid.
Dear Reader,
2020 has been a year of unprecedented challenges,
and the trials and tribulations have made the African
Energy Chamber’s work more important now than
ever. We are committed to helping Africa’s oil and gas
stakeholders navigate a complex and ever-changing
global energy landscape. We will continue our mission
to support the dynamic private sector and unlock the
continent’s remarkable energy potential.
Africa’s oil and gas industry is facing extraordinary
circumstances. An ongoing energy transition and new
efforts to decarbonize the world are weighing on oil
demand. The shale revolution is exacerbating these
pressures. And of course, the COVID-19 pandemic
has wrought havoc on markets around the world,
accelerating and intensifying existing trends.
External headwinds are forcing African petroleum
producers to re-examine their strategies.
Conventional petroleum resources here should
be globally competitive, but growth has lagged
because of conditions above the ground, not
below. Restrictive fiscal regimes, inefficient and
carbon-intensive production, and difficulties in doing
business are preventing the industry from reaching
its full potential. As companies delay projects and cut
costs, planned capital expenditure in 2020-2021 has
fallen from $90 billion pre-COVID-19, to $60 billion
now. To remain competitive, African producers and
governments must adapt. But how can they do it
when the economic order is being remade?
A YearLike No Other

www.energychamber.org 7
stable growth path. We believe the short-term outlook
will improve if countries apply more competitive fiscal
regimes. Emissions can be reduced by curbing flaring
and monetizing gas, improving and future-proofing the
carbon profile of African petroleum production.
Developing gas-to-power infrastructure will increase
access to affordable energy for all sectors of the
economy, offering massive knock-on benefits and
making it easier to do business. Reducing lead times to
limit risk premiums put on long cycle projects will further
bolster the industry’s viability and growth prospects. It
will not be easy, but these reforms are necessary.
Again and again, our oil and gas sector has proven its
resilience and adaptability. The world still needs oil and
gas, and Africa still holds enormous untapped potential.
The African Energy Chamber will remain a committed
partner of choice for the industry as we advance into an
uncertain future.
Thank you,
NJ Ayuk
Executive Chairman
African Energy Chamber
In 2021, Africa will benefit greatly if we create an
investment climate that supports the development of all
energy resources. At the African Energy Chamber, we
believe supporting the energy industry, promoting free
markets, the rule of law, individual freedoms and limited
government, is a duty for all Africans.
But we must not stop there, advocating for a market
driven Afro-centric energy transition, with a specific
focus on natural gas to expand market opportunities
is something we will continue to drive. The oil and gas
industry is a force for good and we must not join those
forces that want to demonize hardworking people
whose only crime is to work hard and play by the
rules and embrace hope rather than fear mongering
and embrace economic empowerment rather than
development aid. That’s why we believe implementing
programs like local content, economic diversification
that support natural gas value chains, making fiscal terms
competitive and reducing red tape and streamlining
regulatory processes must be priorities in 2021.
Our African Energy Outlook 2021 addresses these
challenges head-on. Building on last year’s success, our
second annual report offers an even more exhaustive
and comprehensive look to the year ahead for African
oil and gas.
The 2021 outlook details all of the major challenges facing
African oil and gas stakeholders, as well as workable
solutions that will keep the industry on a strong and
A letter from our Executive Chairman, NJ Ayuk

8
African Energy Chamber8
African Energy Outlook 2021
High level take awaysTime to act!
The global energy transition and decarbonization drive are putting pressure on oil demand while shale has unlocked abundant resources. The global context forces African petroleum producers to adapt or become uncompetitive.
The coronavirus pandemic (COVID-19) has accelerated this underlying pres-sure by causing unprecedented hav-oc on global energy markets that Afri-ca is not insulated from.
Conventional petroleum resources such as those in Africa should be competitive in the global supply stack,
but above surface conditions related to fiscal regimes, carbon emissions and general difficulty of doing busi-ness are holding projects back. The CAPEX spending 2020 - 2021 outlook pre-COVID-19 was almost $90 billion for 2020 and 2021, but has been significantly reduced to about $60 billion due to project delays and cost cutting measures.
The 2021 outlook therefore appears weak on new project sanctions, but relatively stronger for jobs and drilling markets on the back of ongoing proj-ects initiated pre-COVID-19.
The impact of COVID-19 on 2021 liquids production is however not so severe as the current 2021 out-look stands at about 7.6 million bar-rels per day compared to 8.2 million barrels per day in the beginning of the year.
Outside COVID-19, regulatory mat-ters have also unnecessarily de-layed major projects in Nigeria, Kenya, Uganda and Tanzania that represent big opportunity losses for local content development, delayed job creation and further deteriorat-ed Africa’s competitive position ver-sus resources elsewhere.
The African Energy Chamber believes that the short-term outlook can be remedied by:
Applying more compet-itive fiscal regimes that can help unlock 4.4 billion barrels of liquids and $100 billion of additional invest-ments by 2030.
Curbing flaring and mone-tizing gas, which will help improving the carbon emission profile of Afri-can petroleum production that currently bottom tier among the continents.
Developing gas to power infrastructure that will in-crease access to afford-able energy to all sectors of the economy.
Reducing lead time as higher risk premiums are put on long cycle projects versus short cycle projects.

99
High level take aways | Time to act!
www.energychamber.org

10African Energy Outlook 2021
African Energy Chamber10
Gas to power push represents the most promising way to decarbonize the African upstream
Strong incentives to monetize
African gas and create new de-
mand centers, especially in pro-
moting gas to power internally,
will fasten the decarbonization
of African upstream activities.
Africa to remain at least until
2025 the least carbon efficient
oil producing frontier with over
30 kilogram CO2 emitted per
barrel of oil equivalent produced.
Continued high carbon emission
is a threat to Africa’s global com-
petitiveness.
The energy transition forces
more attention to carbon emis-
sions to attract capital.
Africa must work harder on curb-
ing flaring to remain an attrac-
tive arena for future hydrocar-
bons-related investments.
As the world is moving towards the ener-
gy transition in order to curb greenhouse
gas emissions and meet the targets in
the Paris agreement, the oil and gas in-
dustry is doing its share. While combus-
tion of hydrocarbons by off-takers and
consumers does represent around 90%
of total emissions, the remaining 10%
is what oil and gas companies are tar-
geting to cut through initiatives such as
electrification, reduced flaring and more
energy efficient extraction methods. An
often-used metric to determine hydro-
carbon production’s carbon efficiency
is to consider the amount of emissions
outside combustion per unit of produc-
tion. The lower this ratio is, the more effi-
cient your production is.
While carbon efficiency used to be
more of a corporate social responsibili-
ty (CSR) metric, the metric is now used
increasingly in financial calculations and
by global investors before they make in-
vestment decisions. The emission cost
is increasing as a function of limited car-
bon emission budget in order to stay
within the globally-stated temperature
increase target, and as such any expen-
sive hydrocarbon production with high
emissions are generally considered to
be the first in line to be curtailed. Cap-
ital is therefore facing higher and high-
er premiums to be deployed in carbon
inefficient hydrocarbon production, and
it is therefore increasingly important
to help minimize emissions in order to
have a competitive project. Unfortunate-
ly, Africa continues to operate carbon
inefficient production, which further im-
pacts its ability to raise capital for oil and
gas projects.
A data base has been built on the back
of all knowledge about emissions and
the type of hydrocarbon production (on-
shore, offshore, oil type etc.) in order to
have a view of carbon efficiency globally.
This is illustrated on Figure 1.1 where the
sum of each continent’s upstream pro-
duction and upstream emissions from
2018 are compared to each other.
While Africa benefits from conventional
and easy to extract hydrocarbons, the
inability to prevent gas flaring neverthe-
less catapults the continent to the overall
least carbon efficient continent at about
31kg CO2 emitted per barrel of oil equiv-
alent produced. European production as
a comparison is rather similar to African
production in terms of extraction emis-
sions, but has easier and more cost-effi-
cient methods to handle associated gas
than flaring on the back of a big demand
center that can create value from gas.

www.energychamber.org 11
Gas to power push represents the most promising way to decarbonize the African upstream
Figure 1.1: Upstream emissions | Continent comparisonFlaring varies globally and contributes significantly to upstream emissions intensity
13
18
31
21
9
30
14
3
17
11
5
16
7
7
14
13
2
15
Upstream CO2 emissionintensity 2018(kgCO2/boe)
Afric
a
Sout
h Am
eric
a
Nor
th A
mer
ica
APAC
Mid
dle
East
Euro
pe
59
80
139
71
31
102
206
47
253
192
90
283
111
111
223
38
543
Upstream CO2emmision 2018
(Mt Co2)
Afric
a
Sout
h Am
eric
a
Nor
th A
mer
ica
APAC
Mid
dle
East
Euro
pe
Oil & GasProduction 2018
(mmboe/d)
Afric
a
Sout
h Am
eric
a
Nor
th A
mer
ica
APAC
Mid
dle
East
Euro
pe
Extraction
Flaring
Total
Production 2018by hydrocarbon type
(percentage)
Afric
a
Sout
h Am
eric
a
Nor
th A
mer
ica
APAC
Mid
dle
East
Euro
pe
20%
0%
40%
60%
80%
100%
Production 2018by supply segment
(percentage)
Afric
a
20%
0%
40%
60%
80%
100%
Sout
h Am
eric
a
Nor
th A
mer
ica
APAC
Mid
dle
East
Euro
pe
Offshore Deepwater
Offshore Shelf
Shale/Tight Oil
OtherOnshore
OilSands
Heavy Oil 15-19
Heavy Oil 20-23
Sour (<3%)
Regular
Light
Condensate
NGL
Gas & LNG
APAC includes Russia, East Asia, South Asia, and OceaniaData Source: Rystad Energy Research & Analysis

12African Energy Outlook 2021
African Energy Chamber12
Fig. 1.2 Historical Oil & GasProduction(mmboe/d)
Africa1960 - 2018
South America1940 - 2018
North America1920 - 2018
APAC1960 - 2018
Middle East1950-2018
Europe1950 - 2018
1920
1930
1940
1950

www.energychamber.org 13
1960
1970
1980
1990
2000
2010
2018
0%10
%20
%30
%40
%50
%60
%70
%80
%90
%10
0%
Gas to power push represents the most promising way to decarbonize the African upstream

14African Energy Outlook 2021
African Energy Chamber14
Figure 1.2 breaks down the top 20 oil produc-
ers globally on how much flaring represents
in terms of emissions versus the emission
from the extraction process. Ideally, the flaring
component is as small as possible.
Of four African countries on the list (Algeria,
Libya, Nigeria and Angola) none of the coun-
14
tries are in the upper half with Angola as the
best performer of the group. It is primarily the
North African countries Algeria and Libya that
have poor performance with regards to flaring
emissions.
2018 is currently the last year with high quality
data, but projections towards 2025 neverthe-
Figure 1.3: Upstream Flaring Emissions | Large differences in flaringBetween 5085% of total upstream for oil fields
Algeria
Iran
Iraq
Libya
Russia
Kazakhstan
Nigeria
Mexico
Oman
Venezuela
Angola
United States
Kuwait
UAE
United Kingdom
Colombia
China
Saudi Arabia
Brazil
Norway
Canada
40%20%
Extraction
60%

www.energychamber.org 15
less points to Africa overall not improving
its position with emissions remaining above
30 kg CO2 per barrel of oil equivalent.
While flaring is and upstream emissions are
not always easy to reduce, it nevertheless
does represent an enormous opportuni-
ty for Africa to reduce its carbon emission
per production unit and thereby increase
the resources’ competitiveness in a world
with increasingly constrained carbon emis-
sion budget. In this context, political will and
industry compliance will be key. Initiatives
such as the Nigerian Gas Flare Commer-
cialization Program are extremely positive
steps in that direction and must be encour-
aged and supported by all stakeholders.
100%80%60%
Flaring
Gas to power push represents the most promising way to decarbonize the African upstream
Data Source: Rystad Energy Research & Analysis; NOAA/World Bank

16African Energy Outlook 2021
African Energy Chamber16
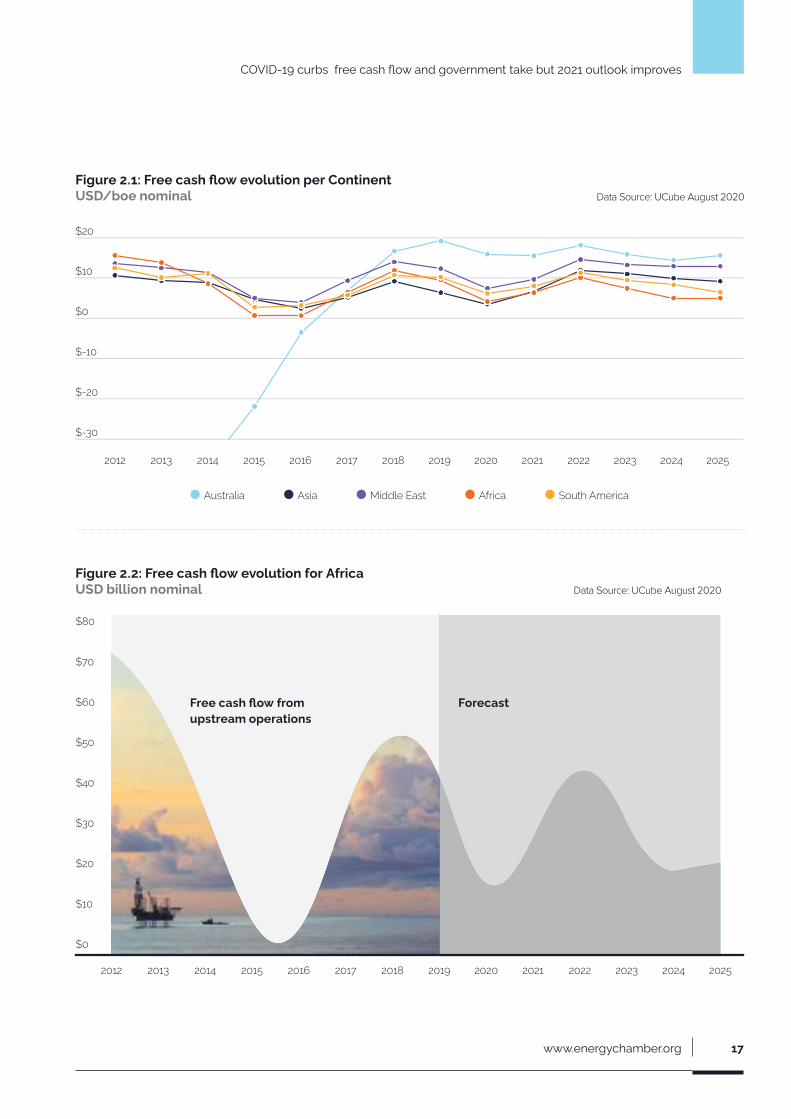
COVID-19 curbs free cash flow and government take but 2021 outlook improves
Generated free cash flow and
government take is expected
to decline by north of 50% in
2020 from approximately $10/
boe nominal in 2019 to $4/boe
nominal in 2020.
Improved outlook for 2021 at
$6/boe nominal on the back of
curbed expenditure and higher
commodity prices.
Continued impact of COVID-19
on demand and commodity pric-
es will be crucial to short-term
forecast and expectations
The goal of any project within the oil
and gas world is to create value by
generating sufficient revenue to recu-
perate all cost and generate sufficient
free cash flow to justify the required
rate of return. Multiple parameters influ-
ence the free cash flow generation, but
chief among them is commodity pric-
es that determine how much revenue
is generated. As projects are evolving
through their life cycles at different
points in time, the sum of all cash flows
across all projects create trends. Ver-
sus other continents, Australia has and
is expected to generate on average the
highest free cash flow per barrel of oil
equivalent from 2018 to 2025 (Figure
2.1). African performance is however in
line with other continents and exhibits
similar volatility on the back of the in-
dustry’s typical boom and bust cycles.
Analyzing free cash flow from all Afri-
can projects, one notices that 2012 and
2013 remain some of the most profit-
able years in history on the back of high
commodity prices and capital programs
ramping up (Figure 2.2). In 2014, the
commodity prices started to decline to
thereby decrease free cash flow genera-
tion, but more impactful were the numer-
ous giant projects initiated from 2012 to
2014 that represented enormous capital
expenditure. It was these locked-in cap-
ital programs, together with the drop in
commodity prices, that caused free cash
flow generation to be highly constrained
during 2015 and 2016.
From 2017 onwards, the capital pro-
grams were completed, the projects
started to produce and generate reve-
nue, and commodity prices increased.
The result was an improving free cash
flow that grew to $55 billion in 2018.
The industry had effectively responded
to the commodity price shock in 2014
and rebalanced spending and revenue
to be more sustainable than what was
the case in 2015 and 2016.
www.energychamber.org 17
Figure 2.1: Free cash flow evolution per ContinentUSD/boe nominal
COVID-19 curbs free cash flow and government take but 2021 outlook improves
Figure 2.2: Free cash flow evolution for AfricaUSD billion nominal
Free cash flow fromupstream operations
Forecast
2012 2013 2014 2015 2016 2017 2018 2019 2020 2021 2022 2023 2024 2025
$-30
$-20
$-10
$0
$10
$20
Australia Asia Middle East Africa South America
2012 2013 2014 2015 2016 2017 2018 2019 2020 2021 2022 2023 2024 2025
$0
$10
$20
$30
$40
$50
$60
$70
$80
Data Source: UCube August 2020
Data Source: UCube August 2020

18African Energy Outlook 2021
African Energy Chamber18
Under normal circumstances, this new
balance was expected to continue,
but the impact of COVID-19 has cre-
ated many similarities to 2015 and
2016 whereby free cash flow will be
squeezed on the back of reduced rev-
enue and locked in capital programs. As
such, the industry will once again have
to rebalance its spending and revenue
which typically implies curbing explora-
tion activity and deferring new invest-
ment decisions. While 2020 free cash
flow is not expected to decline towards
the same depth as during 2015 and
2016, the spend curtailment and expect-
ed higher commodity prices are antici-
pated to create a rebound into 2021.
With more free cash flow generated in
2021, the scene is set for a new cycle of
investments with activity picking up for
deferred projects and exploration activ-
ity. For the same reason, we can expect
most key final investment decisions (FID)
on African projects to be taken in 2021.
While fiscal parameters such as depre-
ciation and royalties can cause distor-
tions versus the observed free cash flow
generated for companies, the general
relationship between commodity prices
and locked in capital programs will also
influence government take. From a gov-
ernment perspective, 2020 is potentially
the worst year since at least 2012 with
only about $55 billion in government
take (Figure 2.3). However, as commod-
ity prices are expected to increase and
the balance between revenue and cost
improves, so will also expected govern-
ment take towards 2021 and onwards.
Figure 2.3: Government take evolution for AfricaUSD billion nominal
$200
$160
$120
$80
$40
2012 2014 2016 2018 2020 2022 2024
$0
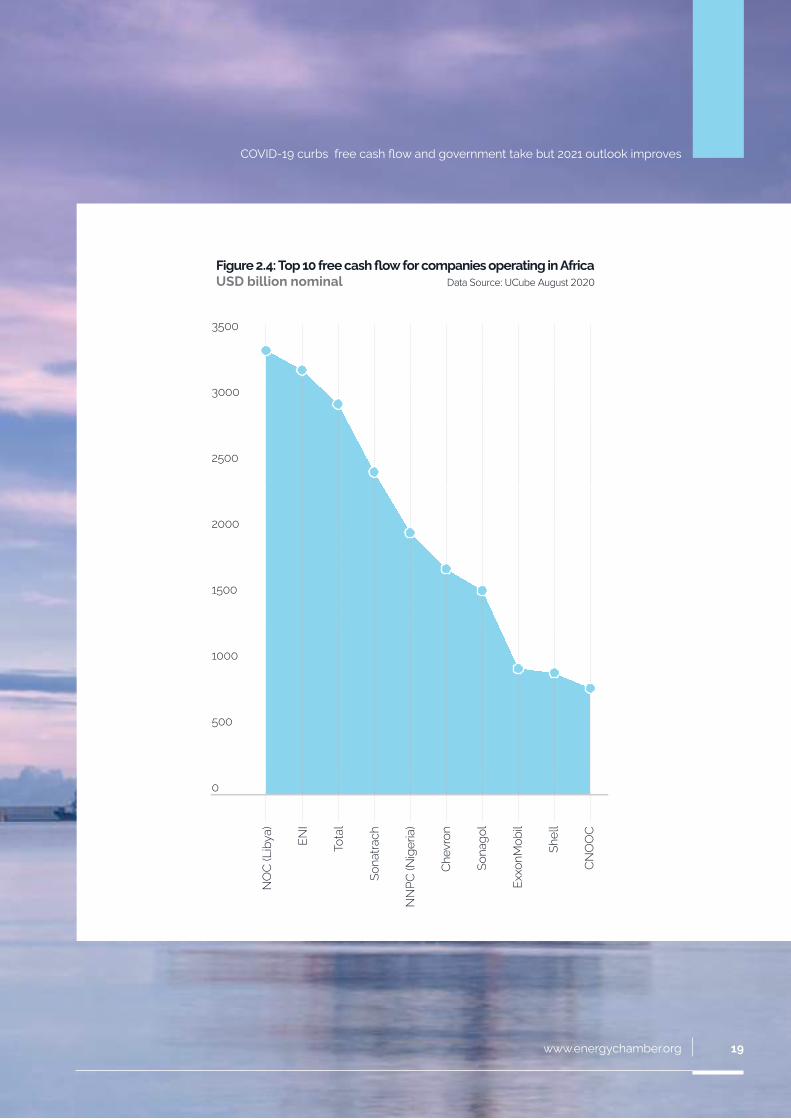
The rebound by 2021 in free cash
flow and government take described
above is dependent on increasing
commodity prices in order to gen-
erate more revenue. For instance,
scenarios where oil remains at $50/
bbl or below implies that free cash
flow and government take will be un-
able to reach 2019 levels. Figure 2.4
breaks down the expected 2021 free
cash flow per top 10 companies with
activity in Africa. The list is dominated
by majors and national oil companies
(NOCs), which is to be expected giv-
en the player landscape on the con-
tinent. CNOOC is the sole exception
at 10th place, representing growing
Chinese interest in African resources.
The economies of the hydrocar-
bon-producing African nations are
heavily reliant on their respective out-
put to meet both domestic energy
needs and exports. For example, Nige-
ria had previously set its 2020 capital
budget based on its plans to produce
2.1 million barrels per day of oil in 2020
at a crude price of $57 per barrel. An
extended period of the current price
scenario will therefore prove detrimen-
tal to the health of these economies.
The African OPEC nations may soon
lose the capacity to produce at their
desired levels if upstream operators
and international majors stop investing
and delay the sanctioning of projects.
While Angola or Gabon have been
implementing a strong enabling envi-
ronment for their oil and gas investors
in recent years, policy uncertainty and
in some cases the unchecked use by
African policy-makers of the oil & gas
sector as a cash cow could adversely
affect the continent’s production out-
look and competitiveness.
Data Source: UCube August 2020
www.energychamber.org 19www.energychamber.org 19
Figure 2.4: Top 10 free cash flow for companies operating in AfricaUSD billion nominal Data Source: UCube August 2020
NO
C (L
ibya
)
ENI
Tota
l
Sona
trach
NN
PC (N
iger
ia)
Chev
ron
Sona
gol
Exxo
nMob
il
Shel
l
CNO
OC
0
500
1000
1500
2000
2500
3000
3500
COVID-19 curbs free cash flow and government take but 2021 outlook improves

20African Energy Outlook 2021
African Energy Chamber20
COVID-19 causes unprecedented oil market turmoil
High uncertainty around short-
term outlook for 2021 due to the
COVID-19 pandemic.
COVID-19 caused unprecedented
disruption in the oil market, exem-
plified by reference prices trading
at negative values
Reference prices recovery for
2021 ($49/bbl) and 2022 ($70/
bbl) expected to mimic global eco-
nomic recovery
2020 has been one of, if not the most,
volatile years in oil price history. The
COVID-19 pandemic has ravaged the
global energy markets, and as such
global liquids demand that has typically
increased by about 1 to 1.5 million bar-
rels per day year-over-year, is current-
ly expected to see an annual average
contraction of 10 million barrels per day
from 2019 to 2020.
The impact on average oil price per
year is real, and best estimate projec-
tion towards 2025 do not expect the
$70/bbl threshold to be reached be-
fore 2022 (Figure 3.1).
Figure 3.1: Oil price outlookBrent USD/bbl nominal
$112B $109B $100B $54B $44B $55B $72B $64B $40B $49B $70B $66B $66B $68B
2020
2019
2018
2017
2016
2015
2014
2013
2012
2025
2024
2023
2022
2021
Data Source: UCube August 2020

www.energychamber.org 21
It was in particular April 2020 that saw un-
precedented market turmoil as the full im-
pact of various economies entering lock-
down, and thereby reducing demand, as
well as OPEC and Russia increasing pro-
duction, and thereby increasing supply, re-
sulted in an oversupply situation of about
23 million barrels per day (Figure 3.2).
At this rate of oversupply, the global stor-
age capacity was rapidly filling up leading
to negative pricing for various reference
prices. In particular, the negative West
Texas Intermediary price at -$37.63/bbl
on 20 April 2020 will remain a testament
to the extraordinary circumstances the
market was subject to.
Figure 3.2: Global oil products (liquids) demand forecast by scenarioMillion barrels per day
-2.4
-6.3
-10.6
-23.2
-17.2
-12.1
-10.0-9.1
-8.0 -8.2-7.7
-7.0-5.9
-5.4-4.5 -4.4
-3.8 -3.5 -3.1 -2.7 -2.2 -2.0 -1.9 -1.5
Jan-
20
Mar
-20
May
-20
Jul-2
0
Sep-
20
Nov
-20
Jan-
21
Mar
-21
May
-21
Jul-2
1
Sep-
21
Nov
-21
Jet fuel
Maritime (bunkers)
Other fuels
Petrochemical (LPG and naphtha)
Road diesel
Road gasoline
Previous
Second wave scenario-24 000
-22 000
-20 000
-18 000
-16 000
-14 000
-12 000
-10 000
-8 000
-6 000
-4 000
-2 000
0
2 000
Second Wave Scenario
Base Case Scenario
Data Source: Rystad Energy research and analysis
COVID-19 causes unprecedented oil market turmoil

22African Energy Outlook 2021
African Energy Chamber22
Globally, suppliers responded to the
oversupply situation and negative pric-
es by curtailing production. The big-
gest reduction came from OPEC+ that
decided on a 9 million barrels per day
production cut to help balance the mar-
ket, and to which several African OPEC
and non-OPEC nations rallied.
Also, other countries instituted govern-
ment mandated production cuts such
as Norway while other countries saw
market forces forcing production cur-
-1
2019
-10
2 4 12 25 6
2019
-11
2019
-12
2020
-01
2020
-02
2020
-03
2020
-04
2020
-05
2020
-06
2020
-07
2020
-08
2020
-09
2020
-10
2020
-11
2020
-12
-1-1-175
80
85
90
95
100
5
0
10
15
20
25
Draws in June and July helped support sturdy oil prices in $40s
Implied Stock Change
Liquids supply (rhs)
Products demands (rhs)
History Forecast
tailments such as the oil sand produc-
tion in Canada. Overall, production was
reduced with about 12.5 million bpd
from March 2020 to June 2020.
Africa was also impacted by the pro-
duction cuts with up to 460,000 barrels
of oil per day (bopd) curtailed in May
and June 2020. OPEC members Alge-
ria and Nigeria have faced the majority
of the production cuts with about 40
percent each, followed by non-OPEC
members Sudan and South Sudan.
OPEC members Angola and Libya did
not face the same production cuts as
the Angolan production is declining,
and Libya faces domestic unrest.
The initial turmoil caused by COVID-19
stabilized over the summer months as
demand bounced back following lock-
down measures being removed and
the supply being curtailed.
The Brent oil price subsequently increased
from sub $20/bbl to over $40/bbl.
Figure 3.3: Global liquids supply and demand balances | Current base case Million barrels per day
Data Source: Rystad research and analysis; OilMarketCube

www.energychamber.org 23
Going forward towards 2021, there re-
mains high uncertainty around how the
virus outbreak will unfold, how economies
will react and ultimately what the impact
will be on oil markets. Figure 3.3 illus-
trates a potential view of what can happen
should a second wave of COVID-19 mani-
fest itself and see the reinstatement of the
draconian lockdowns from spring 2020.
The base view is a gradual increase in de-
mand throughout the remainder of 2020
and throughout 2021 to reach the pre-
COVID-19 demand levels by late 2021.
2020
2025
2030
2035
2040
2045
2050
$45
$50
$55
$60
$65
$70
$75
$80
$85
Equinor | $80 (2030+)
Woodside | $65 (2025+)
Repsol | $59.6 (2020 - 2050) Shell, ENI | $60 (2023+)
Total | $56.8 (2021 - 2050)BP | $55 (2021 - 2050)
Petronas | $50 (2025+)
Should the demand outlook unfold similar
to the base view, the oil price is expect-
ed to see a similar gradual increase. By
2022, assuming the virus is under control
and normalcy has returned, there is a risk
of spiking oil prices above $70/bbl as the
dearth of investments throughout 2020
and 2021 may lead to a constrained sup-
ply outlook. Beyond 2022, the expecta-
tion is for the oil price to stabilize around
$60-65/bbl. Benchmarked versus the
oil price expectations of leading E&Ps
the general consensus appears to be a
downwards revision in oil price outlook,
but nevertheless an expectation that the
price will remain north of $50/bbl. Figure
3.4 compares the communicated oil price
outlooks from the latest Q2 2020 updates.
For African nations, such price outlook will
notably call for much more competitive
frameworks on deep water developments
and projects, which continue to represent
a substantial share of the continent’s pro-
duction but are also the most expensive
and most uneconomically feasible ven-
tures given this outlook.
Figure 3.4: Long-term oil price assumptions vary widely across companies USD per barrel
Data Source: Rystad research and analysis
COVID-19 causes unprecedented oil market turmoil

24African Energy Outlook 2021
African Energy Chamber24
2021 to see a renewed push towards domestic gas monetization as Global LNG glut continues to depress prices
Depressed global gas prices and
the ever-increasing demand for
affordable power offer a unique
environment for Africa to push for
further domestic gas monetization.
COVID-19 also caused gas demand
disruption. While less prominent
than for oil, it was nevertheless suf-
ficient to further depress prices.
As a result, all major reference
prices have converged as a glut of
LNG has to be absorbed.
Africa is expected to increase its
gas exports once big LNG facil-
ities are on-stream, ultimately
increasing African exposure to
global gas market.
Over the last five years, the global sup-
ply and demand for gas has grown rap-
idly. Demand has been spearheaded by
growth in North America and Asia while
supply growth has come from North
America through the vast growth in hydro-
carbon production from shale formations.
2017, 2018 and 2019 in particular saw
strong growth with an average growth
of 170 billion cubic meters per year (Fig-
ure 4.1). However, global gas production
is expected to decline in 2020 on the
back of production curtailments in North
America and Russia. It will be the first
time since 2009 that global gas produc-
tion experiences a decline.
Gas markets are not insulated to COVID-19,
but are less exposed than the oil market
as a result of COVID-19 curtailing trans-
portation more than anything else. Gas is
less used in transportation, and as a result
less impacted by COVID-19. The gas mar-
ket was nevertheless already facing a glut
of LNG even before COVID-19, resulting
in even more depressed prices as the
pandemic’s impact on demand started to
manifest in the spring of 2020.
As a result, key reference prices in
Europe, North America and Asia all
have experienced negative pressure
since the start of 2020.
Figure 4.1: Global gas supplygrowth by continentBillion cubic meters
200
100
0
-100
2015 2016 2017 2018 2019 2020 2021 2022 2023 2024 2025
Australia
Asia
Middle East
Africa
South America
North America
Europe
Russia
Total
Data Source: UCube August 2020

www.energychamber.org 25
Data Source: UCube August 2020
2021 to see a renewed push towards domestic gas monetizationas Global LNG glut continues to depress prices
Looking forward, expectations for the
global market fundamentals are to re-
main loose through 2021 on the back
of weak COVID-19 induced demand
and continued high supply of LNG
before prices tighten significantly as
LNG demand growth will outpace liq-
uefaction capacity due to more delays
in project sanctioning (Figure 4.2). The
forecast points to a tight LNG balance
between 2023 and 2025, and along
with it, a price spike. Following this pe-
riod, there is a downside risk in prices
for 2026 and 2027 driven by the po-
tential of seeing a new wave of sanc-
tioning activity during 2021 and 2022.
www.energychamber.org 25
2010
0
10
20
Loose market due to new LNG capacity coming on-line to prevail for a longer period.
Peak in prices pushed back one year as san-tioning of new liquefaction plants is postponed
Downside rish still expected towards 2026 as new supply come on line. How-ever, the drop in prices is more limited due to fewer projects being sanctioned.
Asia oil-index
NE Asia spot LNGTTF
Henry Hub
2020
2030
2040
Figure 4.2: Gas reference prices moving forwardUSD per million Btu
Data Source: GasMarketCube August 2020

26African Energy Outlook 2021
African Energy Chamber26
Only gas-friendly policies can further unlock Africa’s gas potential
Domestic use of gas on the Afri-
can continent would have many
positive benefits. Including:
Minimize flaring and improve
carbon emission metrics for up-
stream production
Capture more value from the natu-
ral resources for the local economy
Create more jobs and activity relat-
ed to use of gas across industries
Improve project economics if the
gas otherwise would be flared.
Given the gas glut on global markets
with corresponding depressed prices,
there may now be an opportunity to
stimulate to more domestic gas con-
sumption. Expanding infrastructure to
displace diesel, increased use of gas in
the power mix and gas for industrial pur-
poses are all initiatives that would bene-
fit from the low cost of gas.
In this regard, Figure 4.3 illustrates ex-
pectations on production, demand and
net export of gas from the African con-
tinent. Supply and demand have overall
experienced a similar pace of growth to
maintain a net export capacity of about
100 billion cubic meters per year. Post
2025, gas production is expected to
accelerate on the back of big new de-
velopments in East Africa coming on-
stream. Domestic gas consumption is
still not expected to follow this growth
acceleration unless strong gas-friendly
policies are adopted and result in the
expansion of African gas infrastruc-
ture, which implies increased exports
towards 2030. Only sustained political
will, friendly legislation and strong indus-
try support can unlock the true potential
African gas can have within Africa.
A source of African gas currently not
used is flared gas from oil production.
Figure 4.4 illustrates estimated flaring
2010
2014
2016
2018
2020
2022
2024
2026
2028
2030
60
100
140
180
220
260
300
340
Figure 4.3: Africa gas net gasproduction balanceBillion cubic meters
Gas Demand Base Case
Gas Production
Net Gas Import
Data Source: UCube August 2020

www.energychamber.org 27
Only gas-friendly policies can further unlock Africa’s gas potential
levels for the continent split on key
countries. Overall flaring is expected to
decline in line with the oil production,
but nevertheless represents significant
resources that could be utilized for in-
dustrial purposes for example.
The African gas trade balance would
shift should all the flared gas be uti-
lized (Figure 4.5). The gas could either
represent an uplift in domestic de-
mand and maintain expected export
capacity, or it could represent addition-
al export capacity in the case of fixed
domestic demand. It would result in
a 13 percent uplift of demand or a 28
percent uplift in net export capacity.
Figure 4.4: Estimated African gas flaringBillion cubic meters
Figure 4.5: Potential Africa gas net gas productionbalance with flaring includedBillion cubic meters
Gas Demand Base Case
Gas Production
Net Gas Import
2012
2013
2014
2015
2016
2017
2018
2019
2020
2021
2022
2023
2024
2025
Nigeria
Algeria
Libya
Angola
Egypt
Other Countries
Flaring add to production
Extra export capacity
Extra domestic demand
2012
2013
2014
2015
2016
2017
2018
2019
2020
2021
2022
2023
2024
2025
300
250
200
150
100
50
0
-50
-100
-150
9
7
9
7
8
8
8
8
7
8
8
8
7
8
7
7
6
6
6
6
6
6
6
6
6
5
5
5
6 4 3 22
44
3
2 5 5 55
5
5
5
6
6
6666
22
2222
22
22
3
33
3
3
33
3
332
2223
344
44
44 2
3
Data Source: UCube August 2020
Data Source: UCube August 2020

28African Energy Outlook 2021
African Energy Chamber28
COVID-19 capex cuts expected to impact drilling activity in 2021
Drilling activity expected to
fall below 800 wells per year
in 2021 versus the 966 wells
drilled in 2019 pre-COVID-19
Offshore rig demand expected to
drop year-on-year in 2020 by 30
percent with 2021 expected to
experience a slight increase from
2020, spelling out a tough environ-
ment for drilling service providers
High impact exploration drilling
may create new opportunities
that can drive drilling demand
on a mid-term basis
Overall environment favorable
for increased local procurement
of goods and services to cut cost.
Wells drilled on the African continent
and its continental shelves ultimate-
ly represent the activity that ensures
hydrocarbon recovery from its under-
ground deposits. An estimated 1,850
wells were drilled during 2012 with
about 1,350 or 73 percent drilled on-
shore and the remaining 500 or 27 per-
cent drilled offshore (Figure 5.1).
The trend since 2012 has been a de-
clining number of wells drilled per year,
and in particular since the oil price drop
in late 2014 which exacerbated this
trend. As a result, the 2019 estimate of
wells drilled was almost 1,000, a drop
of about 45 percent in activity versus
2012. Reduced drilling activity onshore
Libya and Egypt are the main drivers
behind this decline.
Going into 2020, the activity is expected
to decline further as a result of COVID-
Limited Outlook Figure 5.1: Estimated number of wells drilled in Africa
Onshore
Offshore
2012
2013
2014
2015
0
0.2K
0.4K
0.6K
0.8K
1K
1.2K
1.4K
1.6K
1.8K

www.energychamber.org 29
19’s impact on global and African energy
supply. The current estimate points to only
about 800 wells to be drilled, represent-
ing a year over year decline of about 20
percent versus 2019 Beyond 2020, there
is limited respite expected until 2024 with
COVID-19 capex cuts expected to impact drilling activity in 2021
www.energychamber.org 29
2016
2017
2019
2021
2018
2020
2022
2023
2024
2024
the number of wells hovering around
700 per year. By 2024, as a result of
new projects being sanctioned for de-
velopment on the back of a higher oil
price, activity is expected to increase
again towards 800 wells per year.
Data Source: WellCube August 2020

30African Energy Outlook 2021
African Energy Chamber30
The number and type of wells can be
translated into rig demand expecta-
tions. In other words, how many drilling
rigs have to be operational for a year in
order to drill the wells. Figure 5.2 illus-
trates the offshore rig demand split by
jack-ups and floaters. Jack-ups are typ-
ically used in shallow water with water
depth up to 125 meters while floaters
serve drilling demand in deeper waters.
From a high level of demand in 2012 to
2014 of about 80 rig years, the late 2014
oil price collapse reduced drilling de-
mand significantly. By 2018, demand was
down to 35 rig years implying a reduction
of 56%. 2019 was in that respect a more
promising year as demand increased
towards 45 rig years, representing an in-
crease of almost 30 percent.
At the start of 2020, the demand was
not expected to decline towards and
below 2018 levels again, but the ex-
traordinary impact of COVID-19 means
that estimates for 2020 and 2021 are
pointing to record low rig demand of
less than 30 rig years. It is in particu-
lar floating rigs that will be impacted by
lower demand versus the 2019 actuals.
Offshore Rig Demand
African Energy Outlook 2021
Figure 5.2: Offshore rig demand evolutionRig years
2012
0
10
20
30
40
50
60
70
80
90
4140
2013
4140
2014
4640
2015
3033
2016
2122
2017
1622
2018
1620
2019
2026
2020
918
2021
1116
2022
1420
2023
1519
2024
1928
2025
2426
FloaterJackup
Data Source: RigCube August 2020

www.energychamber.org 31
However, from 2022 onwards the expec-
tation is for rig demand to rebound slight-
ly as drilling programs associated with
projects currently under development
are initiated and a higher oil price expec-
tation help revive exploration activity.
However, the expected growth to-
wards 50 rig years in 2025 is obvious-
ly contingent on new projects being
sanctioned (Figure 5.3). Based on the
oil price outlook presented under the
oil market section, the combined po-
Figure 5.3: Offshore rig demand evolution per life cycleRig years
Figure 5.4: Cumulative offshore rig demand 2020-2025 per country Rig years
2012
2013
2014
2015
2016
2017
2018
2019
2020
2021
2022
2023
2024
2025
80
70
60
50
40
30
20
10
0
tential of these new projects and fur-
ther exploration activity will be able to
increase demand towards its highest
level since 2015. However, should the
oil price not recover, it would jeopar-
dize about 50 percent of the expected
2025 rig demand.
Breaking down cumulative offshore
rig demand from 2020 to 2025 per
country reveals Egypt as the most ac-
tive country in Africa with almost 60 rig
years, followed by Angola and Nigeria.
In that regard, Figure 5.4 provides the
breakdown of the top 10 countries by
rig demand with associated split on
what resource class is supporting the
rig demand. For Angola, about 35 per-
cent of the demand is related to con-
tingent resources which means that rig
demand in this particular area is sensi-
tive to investment decisions expected
over the next years. Ghana also has a
large share of contingent demand on
the back of the big Pecan project that
may be sanctioned for development.
Reserves rig demand
Contingentresources
rig demand
Exploration rig demand
Egypt Angola Nigeria Gabon Ghana Mozambique Libya Senegal Congo Namibia0
10
20
30
40
50
Exploration Rig Demand
Contingent Resources rig demand
Reserves rig demand
Data Source: RigCube August 2020
Data Source: RigCube August 2020
COVID-19 capex cuts expected to impact drilling activity in 2021

32African Energy Outlook 2021
African Energy Chamber32
The southwestern coast of Africa, in-
cluding Namibia and South Africa, is
home to perhaps the most anticipat-
ed wildcats in 2020 and 2021 global-
ly. The prospects, if successful, could
open new basins for development
and trigger big new investments to-
wards the latter half of the 2020s.
High impact wells have been com-
municated by various participants
from Angola all the way down to
South Africa (Figure 5.5). French ma-
jor Total is in the driving seat of this
exploration where high impact and
record setting wells will be drilled
in those waters. In Angola, the well
planned in block 48 will be the deep-
est on record in terms of water depth
measuring about 3,600 meters. The
Venus prospect in Namibia has per-
haps the biggest impact potential as
its size and remote location can be
High impact well reason
Frontier basin:
The basin with little or no exploration
Large prospective resources:
The pre-drill estimates by the company are quite significant.
Focus for Company:
The wells which are highly talked and strategically important for companies.
Emerging Basin:
The basins where some significant recent exploration has taken place.
Play Opening:
The well targeting a new play or area within the province or basin.
South West Africa Exploration
the trigger to extend West African
offshore petroleum activity further
south from Angola. Finally, the follow
up activity to the breakthrough 2019
Brulpadda discovery in South Africa
has commenced in the second half
of 2020 with the Luiperd prospect,
where a significant gas discovery
was made in Q4 2020.
Total is here hoping to find more liq-
uids and confirm the South African
offshore resource potential to further
support a development agenda to-
wards the latter half of the decade.
Other companies have also com-
municated their intention to drill in
the area with the Orange Basin on
the border between Namibia and
South Africa as the most activity
area, and by extension, presum-
able also the most promising area.
Total (50%), Sonangol (50%)
Kaombo area well in 3600 meters water depth
Lower Congo basin
Play opener potential
Ondjaba-1Angola
Maurel & Prom (42.5%),
Azinam (42.5%), Namcor (8%),
Livingstone (4%), Frontier (3%)
Aurora prospect2
Albian sand fan and Cenomanian-Conia-cian slope channel, Walvis basin
>1000 MMboe potential
Aurora-1XNamibia
Total (40%), QP (30%), Impact (20%),
Namcor (10%)
Venus prospect3
Cretaceous fan, Orange basin
1000 MMboe potential
VenusNamibia
Eco Atlantic (57.5%), Azinam (32.5%)
Namcor (10%)
Osprey prospect2
Albian toe of slope fan, Walvis basin
800 MMboe potential
OspreyNamibia
Figure 5.5: High impact wells inSouth West Africa

www.energychamber.org 33
DRC
ANGOLAZAMBIA
BOTSWANA
SOUTHAFRICA
NAMIBIA
Shell (45%), Kosmos (45%),
Namcor (10%)
Graff prospect4
Cretaceous fan, Orange basin
GraffNamibia
Maurel & Prom (42.5%),
Azinam (42.5%), Namcor (8%),
Livingstone (4%), Frontier (3%)
Aurora prospect2
Albian sand fan and Cenomanian-Conia-cian slope channel, Walvis basin
>1000 MMboe potential
WolfSouth Africa
Total (45%), Qatar Petroleum (25%),
CNRL (20%)
Luiperd & Blassop prospects2
M. Cretaceous submarine fan,Outeniqua Basin
50% bigger than Brulpadda
Luiperd-1South Africa
Africa Energy (90%), Crown Energy (10%)
Gazania prospect3
Fluvio-deltaic interbedded sand,Orange basin
350 MMboe potential
Gazania-1South Africa
www.energychamber.org 33
Data Source: Rystad research and analysis
COVID-19 capex cuts expected to impact drilling activity in 2021
Figure 5.5: High impact wells inSouth West Africa

34African Energy Outlook 2021
African Energy Chamber34
Upstream investments expected
to fall below $30 billion in 2020
and 2021
Rebound in investments can be
strong, but depends on projects to
be sanctioned in particular related
to the East African LNG facilities
Most service segments expect-
ed to see a decline in market size
with the exception of EPCI ben-
efitting from mega LNG projects.
Investments are required to convert re-
sources in the ground to revenue and val-
ue. The investments represent jobs and
business for a plethora of African service
providers and is therefore an important
metric to the wider activity level around
the oil and gas industry. From 2020 to
2025, up to $80bn of capital expenditure
(CAPEX) remains contingent and is pend-
ing the taking of FID on new projects from
discovered fields (Figure 6.1).
$80bn can be unlocked by2025 pending market conditionsand policy reforms
Such pre-FID expenditures represent
about 33 percent of CAPEX expected
during the next five years. This remains
a heavy share of uncertain spending, and
one that could translate into jobs and lo-
cal content growth if approved. Put sim-
ply, African regulators, policy-makers and
governments have the power to unlock
an additional $80bn of investment by
2025 if the right measures are taken and
the right policies are put in place.
2020’s 30% CAPEX drop expected to be recovered in 2022 on the back of mega LNG projects

www.energychamber.org 35
2020’s 30% CAPEX drop expected to be recovered in 2022 on the back of mega LNG projects
2012
2
2013
2
2014
2
2015
1
2016
1
2017
37
46 2956635851
2018
34
2019
1
2020
18
2021
17
2022
19
2023
19
2024
19
2025
204
301
27
15
5
11
6912
119
2
1
8
3
2
0
10
20
30
40
50
60
70
Abandoned Producing Under Developement Discovery Undiscovered
Figure 6.1: African upstream capital expenditureBillion USD nominal Data Source: UCube August 2020

36African Energy Outlook 2021
African Energy Chamber36
Many global E&P players, including
the international majors, are looking at
significant cuts to their capital spend-
ing and operational expenditure. To-
tal slashed its 2020 exploration and
production budget by up to $2.5 bil-
lion and targets $800 million in sav-
ings in operating costs. The French
major will also suspend its previously
announced $2 billion buyback pro-
gram, and the other majors are doing
the same. Independents with a strong
presence in Africa like Kosmos Energy
(Kosmos) and Tullow Oil (Tullow) have
also reviewed their 2020 spending
plans. Kosmos has cut its CAPEX in
2020 by 30 percent with no plans for a
rebound in 2021. Kosmos seeks to be-
come cash-flow neutral in a $35/bbl oil
price environment. Tullow has also re-
duced its investment budget by about
a third this year and cut its exploration
spending by almost half to weather the
oil price storm.
From the peak in 2014 at about $65
billion, CAPEX in Africa has steadily
declined to under $40 billion by 2019.
This decline is a result of lower activity
from new projects, general cost com-
pression in the industry and friction in
getting new projects sanctioned due
to external influences such as export
route disagreements and fiscal parame-
ters. Going into 2020, the expenditure
is expected to drop to below $30 billion
representing an almost 30 percent drop
versus 2019. The impact of COVID-19 is
the main factor as it has deferred FID on
many projects (Figure 6.2).
Moreover, expensive deep-water
projects are most prone to the re-
duced outlook on investments (Figure
6.3), a key factor to take into account
given that the largest discoveries and
prospects on Africa’s Atlantic coast
are in deep water acreages.
2020
0
10K
20K
30K
40K
50K
60K
20202021 20212022 20222023 20232024 20242025
Before COVID-19 After COVID-19
2025
Figure 6.2: Impact of Covid-19 and price crashReduced sanctioning and delayed greenfield spendingMillion USD
Producing Pre-FIDUnder Developement
Data Source: Rystad Energy UCube

www.energychamber.org 37
The deferred projects and the projects
originally slated for investments from
2022 onwards will together have the
potential to contribute to a significant
growth potential. Should the projects
materialize, the potential cumulative ex-
penditure may increase to above $50
billion by 2024.
However, as Figure 6.4 illustrates, lower
oil price expectations may shave of the
growth potential as projects are not com-
mercially viable and/or further deferred.
With the oil price at $50/bbl, investments
are expected to only barely rebound in
real terms to 2019 levels by 2024.
Producing Pre-FIDUnder Developement
2020
0
10K
20K
30K
40K
50K
60K
20202021 20212022 20222023 20232024 20242025
Before COVID-19 After COVID-19
2025
Figure 6.3: Impact of Covid-19 and price crashOffshore, especially deepwater projects taking the brunt of CAPEX cutsMillion USD
Figure 6.4: Investment outlook sensitivity based on oil priceMillion USD Nominal
2019 2020 2021 2022 2023 2024 2025
Economics Mid Case
Economics Low Case
Economics Low Low Case
Economics30K
40K
50K
60K
2020’s 30% CAPEX drop expected to be recovered in 2022 on the back of mega LNG projects
Data Source: Rystad Energy UCube
Data Source: UCube August 2020

38African Energy Outlook 2021
African Energy Chamber38
38African Energy Outlook 2021
African Energy Chamber38
Figure 6.5: Contingent investment spending per project typeBillion USD Nominal
0
2
4
6
8
10
12
14
16
18
20
Subs
ea ti
e ba
ck
Ons
hore
Ons
hore
LN
G p
lant
Stee
l pla
tfor
m
FPSO
FLN
G
Fixe
d an
d flo
ater
Oth
er c
once
pts
Data Source: UCube August 2020

www.energychamber.org 39
Out of all contingent projects yet
to make FID between 2020 and
2025, investments related to sub-
sea tiebacks is the single great-
est category, reaching almost $20
billion across the period (Figure
6.5). Subsea tiebacks are likely to
be more and more common as it
makes commercial sense to pig-
gyback smaller hydrocarbon accu-
mulations on existing infrastructure.
The breakeven therefore achieved
from such a development solution
is typically also very competitive.
The offshore-related part of LNG
Subsea Tiebacks and LNG Projects Remain Pillars of Future Industry Spending
www.energychamber.org 39
developments further boosts this
category in light of the mega-proj-
ects expected in Mozambique.
The second biggest category is all in-
vestments related to onshore produc-
tion. Continued drilling of new wells
and other improvements are needed
to arrest production decline in the ma-
ture areas of African onshore produc-
tion. Big investments are also expect-
ed in Uganda and Kenya related to
the greenfield onshore development
of Lake Albert and the Lokichar Basin.
Such greenfield developments may
be amongst the last big conventional
onshore projects in the world.
The third biggest category of upcom-
ing projects, at almost $15 billion, re-
lates to investments in onshore LNG
facilities. It is in particular the East
African gas resources that is likely to
trigger these investments. In terms
of resource size, these projects are
the biggest and most important in
Africa, and they will also help bring
activity to a part of Africa that previ-
ously had not seen much hydrocar-
bons-related developments.
2020’s 30% CAPEX drop expected to be recovered in 2022 on the back of mega LNG projects

40African Energy Outlook 2021
African Energy Chamber40
Figure 6.6: Upcoming Liquids projects in Africa and their timeline and recoverable reserves estimates
Project Country Operator FID* Start-Up Resources (MMboe)
Tilenga Uganda Total 2022 2025
Bosi Nigeria ExxonMobil 2025 2029
Bonga North Nigeria Shell 2026 2031
Bonga Southwest | Aparo Nigeria Shell 2024 2028
Owowo West Nigeria ExxonMobil 2024 2027
Etan | Zabazaba Nigeria Eni 2028 2032
Pecan Ghana Aker Energy 2022 2025
Chissonga Angola Total 2024 2029
Kingfisher South Uganda CNOOC 2022 2025
Agogo FFD Angola Eni 2022 2025
SNE Senegal Woodside 2020 2023
South Lokichar Phase 1 Kenya Tullow Oil 2023 2025
Egina South | Preowei Nigeria Total 2023 2026
Palas | Astraea | Juno (PAJ) Angola BP 2022 2025
Alho | Cominhos, Cominhos East (ACCE) Angola Total 2023 2027
945
790
700
630
550
520
335
290
270
245
220
220
190
140
85
Out of upcoming major projects in Africa,
the top six gas projects are all bigger in
terms of oil equivalents than the oil proj-
ects (Figures 6.6 and 6.7). Taking into
account all cumulative investments per
country, Mozambique remains in clear
lead which further emphasizes how im-
portant the LNG projects are for the Afri-
can investment outlook (Figure 6.8).
The majority of the projects in Africa that
were up for sanctioning were planned
assuming an oil price of between $55
and $60/bbl. The oil price currently hov-
ering around $40/bbl therefore spells bad
news, especially as the top upcoming FIDs
in Africa have a breakeven crude price of
over $45/bbl, with some even close to
$60/bbl. ENI and ExxonMobil have both
stated that they will focus on developing
projects with a breakeven crude price
of less than $35/bbl. The ENI-operated
Agogo full field development off Ango-
la now faces getting delayed due to its
breakeven price of $45/bbl.
In its latest announcement, Shell dis-
tanced itself from deep-water mega-proj-
ects off the coast of Nigeria, placing the
Bonga Southwest-Aparo, a 150,000 bpd
FPSO development that was soon com-
ing up for FID, on the backburner for now.
Tullow is expected to delay the South Lo-
kichar development off Kenya.
The Palas-Astraea-Juno (PAJ) margin-
al fields development operated by BP
in Angola is another project that could
see delays due to a relatively high
breakeven price and BP’s commit-
ments to other parts of the world and
to the energy transition.
Upcoming gas projects will also take
a hit and run a risk of delays. Although
Nigeria approved the development of
NLNG train 7 last year, the upstream
gas developments that were planned
to supply feedgas to this development
might now take a back seat. The FID for
the Area 4 LNG project in Mozambique
(Rovuma LNG), which was to be sanc-
tioned this year, has now spilled over
to 2021 at best. The Ahmeyim and Ya-
kaar gas hubs off the coast of Maurita-
nia and Senegal and a few other nat-
ural gas projects in the northern and
eastern regions of the African conti-
nent may have their FIDs postponed to
2022–2023 as part of Kosmos’s plans
to trim down its capital expenses.
The investments for the above projects
will now see a timeline shift or even a
spending cut altogether, which will ul-
timately impact production levels in
this region. Current estimate is that the
timeline delays for these pre-FID proj-
ects in Africa could lead to a 200,000
bpd drop in liquids production on aver-
age between 2021 and 2025.
The impact could be much higher in the
longer term, with liquids production set
to drop on average by close to 1.185 mil-
lion bpd over the years 2026 to 2030.
Data Source: Rystad Energy UCube Liquids Gas

www.energychamber.org 41
Project Country Operator FID* Start-Up Resources (MMboe)
MZLNG Joint Development (T1 - T2) Mozambique ExxonMobil 2025 2030
Area 1 LNG (T1 - T2) Mozambique Total 2019 2025
Area 4 LNG (T1 - T2) Mozambique ExxonMobil 2022 2026
Yakaar - Teranga LNG Hub Senegal BP 2027 2032
NLNG Seven Plus Nigeria Shell 2019 2025
Greater Tortue Ahmeyim LNG Hub Mauritania BP 2024 2028
Djibouti FLNG T1 Ethiopia
Poly GCL PetroleumInvestment
Ltd
2022 2025
Assa North Nigeria Shell 2025 2028
Tinrhert Gas Project Algeria Sonatrach 2023 2025
Fortuna FLNGEquatorial
GuineaLukoil 2025 2029
Quiluma/ Maboqueiro(Northern Gas Complex)
Angola Eni 2021 2024
Yakaar (domestic) Senegal BP 2023 2025
HA Nigeria Shell 2022 2026
Ima gas Nigeria AMNI 2023 2028
Sanha Lean Gas Angola Chevron 2023 2026
4625
3590
2330
2145
1450
1480
520
415
385
250
250
215
210
185
115
Figure 6.7: Upcoming Natural gas projects in Africa and their timeline and recoverable reserves estimates
Figure 6.8: Contingent invest-ment spending per countryBillion USD Nominal
Other Countries25%
Mozambique23%
Nigeria15%
Angola11%Ghana
9%
Libya8%
Uganda5%
Algeria5%
2020’s 30% CAPEX drop expected to be recovered in 2022 on the back of mega LNG projects
Data Source: Rystad Energy UCube
Data Source: UCube August 2020
Liquids Gas

42African Energy Outlook 2021
African Energy Chamber42
With the CAPEX and expected type
of projects defined, it is possible to
forecast opportunities offered to the
services industry. EPCI companies are
expected to benefit the most from fu-
ture spending (Figure 6.9), followed
by well services contractors.
Services sector impact
As a result, EPCI is the only segment
expected to buck the trend of declining
expenditure on the back of the LNG facil-
ities expected to be constructed towards
2025 (Figure 6.10). The relative worst per-
forming sector across the periods is drill-
ing contractors. This segment benefited
from high activity and high contract rates
from 2010 to 2014 while subsequent years
saw a reduction in both activity and rates.
The segment is also adversely impacted
by the large share of gas developments
towards 2025 as gas projects are a lot
less drilling intensive than oil projects.
Figure 6.9: African upstream capital expenditure per service segmentBillion USD Nominal
2012
2013
2014
2015
2016
2017
2018
2019
2020
2021
2022
2023
2024
2025
0
10
20
30
40
50
60
EPCI
Well Services and Commodities
Internal and other
Subsea
Maintenance and Operations
Drilling Contractors
Seismic
Data Source: UCube August 2020

www.energychamber.org 43
Figure 6.10: Cumulative capital expenditure per periodBillion USD Nominal
EPCI Well Services & Commodities
Internal &other
Subsea Maintenance &Operations
DrillingContractors
Seismic
2010-2014
2015-2019
2020-2024
0
10
20
30
40
50
60
70
80
www.energychamber.org 43
2020’s 30% CAPEX drop expected to be recovered in 2022 on the back of mega LNG projects
Data Source: UCube August 2020

44African Energy Outlook 2021
African Energy Chamber44
New market realities for 2021 expected to drive reviews of fiscal terms to improve competitiveness
Projected market conditions for
2021 do not indicate a return to
high commodity prices, implying
that the super profit era of petro-
leum is over.
The industry cost base has been
adjusted, but African fiscal re-
gimes are often lagging behind
and remain uncompetitive in this
new environment.
Many African governments will take
steps to adjust the fiscal regimes in
2021 to improve competitiveness.
Using a UK-type fiscal regime
can help unlock $100 billion in-
vestments in a $50/bbl scenario.
Petroleum resources and the extraordi-
nary profit they have typically generated
in the past have resulted in various fiscal
regimes. The fiscal regimes are designed
in some way or another to ensure that
part of this profit is collected by the state.
Depending on the rules of the fiscal re-
gime, there might be impacts on the in-
vestment metrics used by private compa-
nies on executing new projects.
A common example of such a metric is
breakeven, or what revenue is required,
as a function of quantity and price, to
cover all cost, pay all government take
and generate sufficient return. Ideally this
breakeven should be as low as possible
to improve the likelihood of the project
generating positive financial returns.
As such, the rules and parameters of the
fiscal regime is often very important, per-
The end of thesuper-profit era?
haps even more important than the ac-
tual resource base created by nature, in
terms of influencing the FID of a new proj-
ect. When the oil price was above $100/
bbl, these fiscal regime rules could be fa-
vorable towards the state as the breakev-
en would in any case be low enough to
secure an investment decision. However,
with an oil price at $50/bbl and below,
the surplus that can be distributed is like-
ly much smaller. From a post-tax point
of view, it may then be difficult to justify
new investments as the fiscal regime is
too strict to make the project commercial-
ly viable even if the intrinsic value of the
resource base would otherwise imply so.
The result is therefore a pressure on cost
compression in fiscal terms similar to
what the industry has experienced with
investments and operational expenditure
in order to unlock new potential projects.

www.energychamber.org 45
New market realities for 2021 expected to drivereviews of fiscal terms to improve competitiveness
To investigate the potential on African
production and investments from al-
tering fiscal regimes, a simulation has
been made whereby all projects with
an expected FID by 2026 are subject
to both their original fiscal regime as
well as the United Kingdom’s (UK) fiscal
With better fiscal regimes, Africa could unlock $100bn in investment and 1 million bpd in additional output by 2030
regime, regarded as one of the most
favorable globally.
Figure 7.1 illustrates African liquids pro-
duction towards 2030 under different
breakeven thresholds. The thresholds
imply that any pre-FID project with a
0
5K
10K
Figure 7.1: African liquids production at different BE cutoffsMillion bbls/day
2010
2011
2012
2013
2014
2015
2016
2017
2018
2019
2020
2021
2022
2023
2024
2025
2026
2027
2028
2029
2030
breakeven higher than the threshold
will not be allowed to reach production.
The difference between the $35/bbl
threshold and the $50/bbl threshold is
therefore all projects that can contrib-
ute with production with a breakeven
between $35 and $50 /bbl.
Data Source: UCube

46African Energy Outlook 2021
African Energy Chamber46
4.4 billion bbl4.2 billion bbl
3.9 billion bbl
2000
4000
6000
8000
10 0
00
0
$10
$20
$30
$40
$50
$60
$70
$80
$90
$100
Figure 7.2: Cost of Supply implication of fiscal changesUSD per barrel
By sorting and stacking all projects ac-
cording to their breakeven on the Y axis
and the resource base on the X axis, the
cost of supply can be determined. This
is illustrated in figure 7.2 where all 231
projects with an approval date before
2026 are sorted by their breakeven and
add up to a cumulative 8 billion barrels
of liquids. The sorting and stacking can
also be done for all the projects in the
theoretical situation where the UK fis-
cal regime is applied instead. The cost
of supply curve will thereby shift down
as lower break evens are generated via
the terms in the UK fiscal regime versus
the original fiscal regime.
By then adding horizontal lines accord-
ing to the breakeven values of $35, $40
and $50 /bbl on the Y axis, it is possible
to assess how much of the resource po-
tential on the X axis that will be added as
you move from the original fiscal regime
to the simulated UK fiscal regime. For
the $35, $40 and $50 /bbl thresholds
this corresponds to enabling 3.9 billion
barrels of liquids, 4.2 billion barrels of
liquids and 4.4 billion barrels of liquids
respectively of additional resources.
Figure 7.3 illustrates how production
outlook will change if all the enabled re-
sources from using the UK fiscal regime
are included. In 2030, it will correspond
to a production uplift of almost 1 million
barrels per day. Note that this is only
production uplift by the 231 projects in-
cluded in the analysis. Any new projects
added by exploration etc. can further in-
crease the production outlook uplift.
Contingent African resources with possible approval before 2026 using UK fiscal regime
Contingent African resources with possible approval before 2026 using original fiscal regime
2010
2011
2012
2013
2014
2015
2016
2017
2018
2019
2020
2021
2022
2023
2024
2025
2026
2027
2028
2029
2030
5K
6K
7K
8K
9K
10K
Figure 7.3: African liquids production uplift potentialMillion bbls/day History
High Case
Mid Case
Low Case
Original High
Original Mid
Original Low
Data Source: UCube Economic Model August 2020
Data Source: UCube

www.energychamber.org 47
Production does not come for free
however, figure 7.4 illustrates how
much more capital expenditure that
will be enabled in order to support
the projects unlocked by using the UK
fiscal regime. Over the 2020-2030
period, the additional capital expendi-
ture is estimated at $49 billion at the
$35 /bbl threshold increasing towards
$100 billion as the $50/bbl threshold
is approached.
2010
2011
2012
2013
2014
2015
2016
2017
2018
2019
2020
2021
2022
2023
2024
2025
2026
2027
2028
2029
2030
History
High Case
Mid Case
Low Case
Original High
Original Mid
Original Low
Breaking down the uplift in additional re-
sources produced and the additional cap-
ital expenditure unlocked reveals Nigeria
as the country with most potential. Figure
7.5 illustrates the additional barrels of liq-
uids produced and capital expenditure
spent between 2020 and 2030 in a $50/
bbl threshold scenario. Nigeria will effec-
tively be able to produce about 2 billion
barrels more than otherwise while justify-
ing $10 billion more investments.
Mozambique is an outlier in terms
of investments as most of the cap-
ital expenditure will enable the LNG
production with only a fraction of the
resource base representing liquids
and thereby not driving Mozambique
to top 10 on additional liquids produc-
tion. The same concept nevertheless
applies that fiscal terms is a method
that can be deployed to make re-
sources more competitive.
20K
30K
40K
50K
60K
70K
Figure 7.4: Expected uplift in expenditureBillion USD nominal
Data Source: UCube
New market realities for 2021 expected to drivereviews of fiscal terms to improve competitiveness
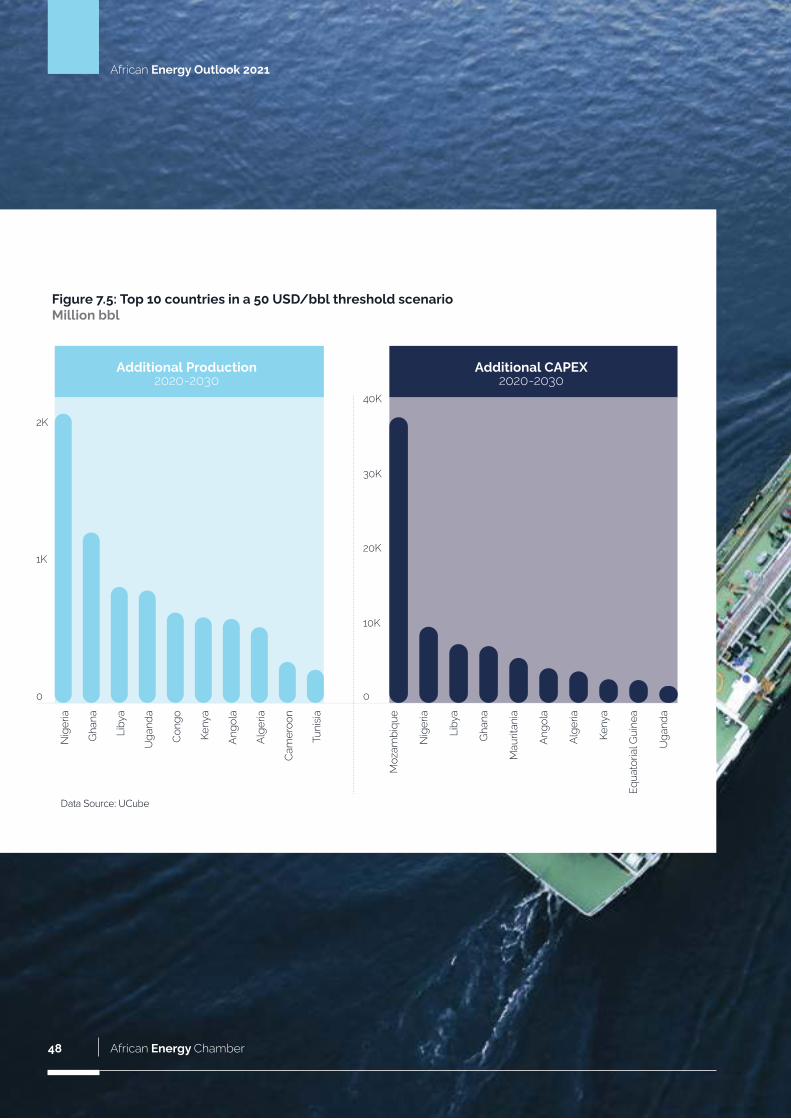
48African Energy Outlook 2021
African Energy Chamber48
Figure 7.5: Top 10 countries in a 50 USD/bbl threshold scenarioMillion bbl
Nig
eria
Moz
ambi
que
Nig
eria
Liby
a
Gha
na
Mau
ritan
ia
Ango
la
Alge
ria
Keny
a
Equa
toria
l Gui
nea
Uga
nda
Gha
na
Liby
a
Uga
nda
Cong
o
Keny
a
Ango
la
Alge
ria
Cam
eroo
n
Tuni
sia
0
1K
2K
0
10K
20K
30K
40K
Additional Production2020-2030
Additional CAPEX2020-2030
48African Energy Outlook 2021
African Energy Chamber48
Data Source: UCube

www.energychamber.org 49
Bottom line for Africa:It is time for bold fiscal reforms
Most African producers understand the
challenges posed by their existing fiscal
regimes in the current price environment
and are currently engaged in making
amendments accordingly. Africa’s larg-
est oil producer Nigeria, is currently in
the final stages of passing its Petroleum
Industry Bill.
The bill will replace the current petroleum
profit tax with a Nigerian Hydrocarbon
Tax (NHT). The NHT rates are 50 percent
for petroleum operations onshore and in
shallow waters and 25 percent for off-
shore operations. Companies involved in
upstream operations are also expected
to pay an income tax rate of 30 percent.
Most importantly, it is hoped that this new
bill will usher in transparency, simplicity,
reduce disputes between companies
and the government and ultimately lead
to a spike in upstream activity in Nigeria.
Africa’s second largest producer Angola
is also expected to follow suit. Angola’s
National Oil, Gas and Biofuel’s Agency
(ANPG) is currently undergoing a review
of its fiscal terms vis-a-vis other major
producers with a view of enacting chang-
es that will encourage more drilling in An-
gola from 2021 onwards.
Changing fiscal regimes do however
come with challenges. It causes un-
certainty, it distorts the expected reve-
nue profile for the state, and it is hard
to arrive at what the fiscal parameters
should be. Capital is nevertheless fun-
gible and to attract capital to possible
future projects, African nations with pe-
troleum resources will most likely have
to adapt their fiscal regimes similar to
how other nations have adapted them
in light of the new era with more supply
and less demand. Failing to do so can
lead to stranded resources and out-
competed projects.
www.energychamber.org 49
New market realities for 2021 expected to drivereviews of fiscal terms to improve competitiveness

50African Energy Outlook 2021
African Energy Chamber50
COVID-19 in the short term and energy transition in the long term are the most significant determinants of the industry outlook
COVID-19 is undoubtedly per-
haps the biggest shock in the his-
tory of the oil and gas sector.
Demand collapse has caused
investments of $690bn to disap-
pear globally
The impact of the energy transi-
tion on long-term demand out-
look colors capital allocation and
decision-making today.
2020 has likely challenged the industry
unlike any year in its history. A relative-
ly stable growth in liquids demand has
indeed been observed over the last 20
years. Even during the financial meltdown
in 2008 and 2009, the demand overall
was very resilient. In 2020 however, de-
mand is currently expected to be about 10
million barrels of liquids less per day than
pre-COVID-19 expectations (Figure 8.1).
Intra year, this difference is even more
extreme as the brunt of this reduction
occurred during the widespread lock-
down in the second quarter to halt the
coronavirus outbreak.
Such a dramatic change to demand
created shockwaves into the markets
by putting enormous negative pressure
on prices. Most notably, the West Tex-
as Intermediary reference price even
ended up trading at negative levels
as there simply was no ability to store
more oil. The market forces therefore
led to widespread production shut ins
in North America as well as an OPEC
agreement to cut production by about
10 million barrels per day.

www.energychamber.org 51
COVID-19 in the short term and energy transition in the long term are the most significant determinants of the industry outlook
Strong economic growth following dot-com bubble
FinancialCrisis
Steady demandgrowth
Steady y-o-y growth observed 2011-2018 with annual average growth around 14 mmbbl/d
Forecast
Pre-
Coro
na e
xpec
tatio
ns
Near termand history
+0.8
+1.8
+1.5
+3.1
+1.4
+1.0
+1.2
+2.8
-0.9
-0.5
+0.6
+1.2
+1.9
+1.3
+2.0
+1.3
+1.7
+1.2
+0.7
+0.8
-10.
1
Figure 8.1: The demand recovery that didn’t come:We expected +0.8mmbbl/d in 2020, but will get -12
www.energychamber.org 51
Data Source: Rystad Energy OilMarketCube; Rystad Energy research and analysisData Source: Rystad Energy OilMarketCube; Rystad Energy research and analysis

52African Energy Outlook 2021
African Energy Chamber52
As such, the oil markets have now re-
balanced but with significant available
capacity offline. COVID-19 has triggered
a big short-term negative revision in oil
price expectation while the mid to long
term outlook still points to an oil price at
least north of $50/bbl (Figure 8.2), based
on the assumption that a solution will be
2009 2010 2011 2012 2013 2014 2015 2016 2017 2018 2019 2020 2021 2022 2023 2024 2025
300K
400K
500K
600K
700K
800K
Figure 8.3: A stable investment outlook hasturned into two years of capex contraction
February 2020Forecast
Current Forecast
OPEC+ Regulating the market, could help avoid price spike in 2020
44
54
100
55
72
64
40
49
7066 66
68
100
90
80
70
60
50
40
20152014 2016 2017 2018 2019 2020 2021 2022 2023 2024 2025
Figure 8.2: Changes to oil price expectations since February 2020
found to the current COVID-19 pandemic,
pushing global economic activity towards
pre-COVID-19 levels. As a consequence
of less revenue, the various operators
in the world have also slashed their in-
vestment outlooks considerably. The
combined reduction for 2020 to 2025
in expected global upstream CAPEX is
of $690 billion compared to the initial
expectation in February 2020 before
COVID-19 was declared a pandemic (Fig-
ure 8.3). The reduction is front loaded im-
plying that it is 2020 and 2021 where one
should expect to see the biggest chang-
es with almost 30 percent lower spend
than pre-COVID-19 expectations.
Data Source: UCube, Rystad Energy
Data Source: Rystad Energy UCube August 2020

www.energychamber.org 53
In absolute terms, it is conventional on-
shore activity that is expected to see the
biggest reduction with about $115 billion
removed from the 2020 and 2021 period
(Figure 8.4). On a relative basis howev-
er, it is shale that is expected to see the
biggest reduction with about 40 percent
across 2020 and 2021. This outcome is
consistent with shale’s short cycle nature
and continuous reliance on drilling imply-
ing that activity can be rapidly curtailed
or boosted. Offshore is typically more in-
fluenced by multi-year capital programs
that are inflexible and hence short-term
changes should be more muted.
Beyond the calamity created by COVID-19
in the short-term outlook, perhaps the in-
dustry’s biggest challenge and opportuni-
ty is the outlook on liquids demand as well
as the drive to curb carbon emissions. De-
mand and emissions are ultimately linked,
and is expected to be main structural driv-
er over the mid to long term.
For the industry, where you have to make
decision on capital allocation that may
have a 20-year horizon, it is very important
to have a view on the outlook. The lowest
demand scenarios effectively imply that
no additional exploration is required and
only the most competitive projects will be
allowed to mature to production. Should
the demand trajectory move similar to the
pace observed over the last 20 years im-
plying continued growth of north of 1 mil-
lion barrels per day, the business case for
exploration and maturing less competitive
resources is much more compelling.
What nevertheless is a trend that has
gained traction over the last year is the
view that the corporate strategy has to
move toward energy transition. So far,
this has manifested itself particularly in the
European majors allocating capital to re-
newable energy projects such as offshore
wind and solar as well as committing to
reduction of net emissions.
This trend was further reinforced in Q2
2020 when impairments were taken on
the back of revised outlooks for commod-
ity prices (Table 8.5).
2018 20182019 20192020 20202021 2021
0
40K
80K
120K
160K
200K
240K
0
40K
80K
120K
160K
0
40K
80K
120K
160K
2018 2019 2020 2021
Figure 8.4: Upstream capex by sensitivity to oil priceBillion USD, real
Base case SeptemberOther Onshore
Base case SeptemberShale
Base case SeptemberOffshore
-115 BUSD
-110 BUSD
-75 BUSD
Best case February
Best case February
Best case February
COVID-19 in the short term and energy transition in the long term are the most significant determinants of the industry outlook
Data Source: Rystad Energy ServiceDemandCube February and August releases

54African Energy Outlook 2021
African Energy Chamber54
141
Target for installed
renewable power
generation to 50 GW
by 2030
We have been invest-
ing in renewables for
many years. Our focus
is on biofuels, biopow-
er, wind energy and
solar energy.
Figure 8.5: The Europeans havestarted the energy transition, while the Americans are lagging behind
Renewables148
Interest in wind energy
with capacity 9 GW. No
communicated renew-
able goal
We invest in low-car-
bon energy solutions
such as biofuels, hy-
drogen, wind and solar
power, and in other
opportunities linked to
the energy transition.
358
Target for installed
renewable power
generation to >25 GW
by 2025
The Group has diver-
sified its activities and
is positioning itself in
solar and wind power,
sustainable biofuels and
electricity.
Renewable mentionedin annual report
Renewablecapacity goal
Quote
168
Net zeroby 2050
BP is working with
peers on a range of
fronts, in particular
to tackle methane
emissions and create
opportunities for car-
bon capture, utilization
and storage.
Emissions155
Net zeroby 2050
We are seeking cost-ef-
fective ways to manage
GHG emissions… Such
as Carbon capture
and Storage, replace
coal by natural gas,
developing new fuels
for transport.
261
Net zeroby 2050
The Group aims to both
reduce the environ-
mental footprint and
the CO2 emissions of
its operations
CO2 mentioned in annu-al report
GHG emission reduction goal
Quote
Data Source: Rystad Energy research and analysis; ServiceDemandCube; Operators’ annual reports and websites

www.energychamber.org 55
2
No communicated
renewable goal
Today, our world faces a
dual challenge: meeting
growing demand for en-
ergy while also reducing
environmental impacts...
ExxonMobil is commit-
ted to doing our part.
42
Increase renewable
power capacity to 5
GW by 2025
Eni’s decarbonization strategies are the growth of low carbon sources, an increase of the zero emission sources and a circular approach which maxi-mizes waste…
2
No communicated
renewable goal
Chevron continues its
commitment to under-
standing and evaluating
the economic viability of
renewable-energy sourc-
es, including solar, wind,
geothermal and biofuels.
116
Increase renewable
power capacity tenfold
to 4-6 GW by 2026
…there will have to be
significant changes in
the energy markets,
and our portfolio will
change accordingly to
remain competitive.
71
Increase capacity in
“low carbon power” to
7.5 GW by 2025
We are positioning
ourselves in the new,
low-emission energy
market with renewable
energies and natural
gas combined cycles.
COVID-19 in the short term and energy transition in the long term are the most significant determinants of the industry outlook
14
No GHG goal. Commu-
nicated methane and
flaring goals
By applying advanced
analytics to this
abundance of data,
we can identify new
approaches to run sites
more efficiently and
potentially with fewer
emissions.
212
Net zeroby 2030
Scope 1, upstream
Ambition to lead the
company to become
carbon neutral in the
long term by maximiz-
ing efficiency, reduce
direct emissions
through the compensa-
tion of residual emission
10
No GHG goal. Commu-
nicated methane and
flaring goals
100 million fund that
does investments on
electric vehicle charging
network, novel battery
technology and direct
capture of carbon diox-
ide from the air.
86
Net zeroby 2030
The ambition to
reduce net carbon
intensity by at least
50% by 2050 takes
into account scope 1,2
and 3 emissions, from
initial production to final
consumption.
183
20% Net zeroby 2030 by 2050
Repsol will reinforce
its strategy to reduce
its carbon footprint,
enabling us to reduce
CO2 emissions by 2.1
million tons in 2020,
compared to 2014
levels.

56African Energy Outlook 2021
African Energy Chamber56
American, Russian and big NOCs are
typically less clear on their energy
transition strategy, with no clear target
for renewable capacity and emission
reductions. A potential reason for this
different approach versus the Europe-
an companies could be the access to
resources. Americans have better and
more access to the vast shale resourc-
es in North America while the NOCs in
Figure 8.6: Indications that long cycle projects are at risk of discrimination versus short cycle projectsRequired Hurdle rate from investors to invest in project IRR
Russia and the Middle East still have a
vast potential in its competitive conven-
tional petroleum resources.
Capital markets are also influencing
how the companies are behaving. Ac-
cording to a study by the Oxford Insti-
tute for Energy Studies, investors are
putting a higher premium on fossil fuel
developments than renewables as il-
lustrated in Figure 8.6. In particular,
long-cycle fossil fuel developments
command a higher risk premium. Ev-
erything else equal this change in risk
premium improves the competitive po-
sition of renewables and short-cycle
fossil fuel projects and deteriorates
the competitive position of long-cycle
fossil fuel projects, thereby also influ-
encing how capital is allocated.
QUESTION:
What base case Internal Rates of Return (IRR), or hurdle rate, must a new energy project generate, for you to prefer reinvestment in that project rather than further growth in dividends and buybacks?
40K
40K
40K
40K
40K
40K
40K
40K
40K
6%
DM
Win
d /
Sola
r
EM W
ind
/So
lar
LNG
US
Shal
e
US
Dee
pwat
er
EM M
ega
Proj
ect
Punishment of long cycled invest-ments - aka offshore mega projects
Coa
l
Data Source: Oxford Institute for Energy Studies

www.energychamber.org 57
COVID-19 in the short term and energy transition in the long term are the most significant determinants of the industry outlook
Africa is a PowerhouseJoin us at the forefront of the African energy industry.
We draw on the experience, expertise and collective strength of our members to actively lead on shaping policies, sharing best practice and using resources to create value for Africans.
Together, we can shape Africa’s energy future.
Email us at [email protected]
Find out more www.energychamber.org/members
www.energychamber.org

58African Energy Outlook 2021
African Energy Chamber58
Pre-Covid projects and ongoing East African LNG terminals expected to prevent massive job destruction
Inflexible capital programs help sus-
tain overall employment through
COVID-19.
Mega-LNG projects in East Africa
are particularly important to sup-
port jobs creation in the industry.
Job creation potential greatest if
Africa can harness its natural gas
and downstream industrial po-
tential by transforming and mon-
etizing its resources at home.
To arrive at an estimate for the numbers
of jobs supported by the African up-
stream industry, the relationship between
spend on petroleum activity and hard la-
bor data in the United States has been
used as a proxy. Figure 9.1 illustrates
both American and African number of
jobs as a result of the mixture of spend
segments driving jobs and what their la-
bor intensity is in the American market.
The African numbers point to a reduc-
tion of jobs from the peak in 2012 of
about 550 000 until the trough of about
300 000 jobs in 2018. The reduction
is on the back of big capital program
being completed and construction
sites being demobilized. The produc-
tion phase of these projects only has
a fraction of the labor requirement of
the development phase. For the same
reason, African job numbers do not ap-
pear to see big immediate impact from
COVID-19 in 2020 and 2021 as the initi-
ated capital programs in 2018 and 2019
are ongoing and ramping up activity.
This is in particularly the case for the
mega greenfield projects in Mozambique
requiring north of 10 000 employees.
Figure 9.1: Africa upstream employeesNumber of full time equivalents
2012
300 000
500 000
700 000
900 000
1 100 000
2025
USA
Africa
Data Source: BLS, UCube August 2020

www.energychamber.org 59
Towards 2025, the numbers of jobs are
expected to decline again on the back
of new projects in 2020 and 2021 not
being sanctioned due to COVID-19.
The American numbers have a different
pattern in 2020 and 2021 as a function
of the short-cycle nature of shale which
means that activity and consequently
employment can be much faster adjust-
ed to market conditions than the me-
ga-projects more prominent in Africa.
The jobs created by the petroleum in-
dustry have been an attractive second-
ary effect that has helped boost com-
munities around the globe. The pattern
for jobs in the petroleum industry fol-
lows that of other primary industries
in that activity is more capital intensive
than labor intensive.
As such, the amount of jobs created di-
rectly related to the upstream activity is
relatively limited versus the jobs created
as tertiary effects on the services around
the upstream jobs.
Figure 9.2 illustrates the estimate from
the American Bureau of Labor Statistics
on job creation per million dollar of output
in different economic sectors. While pe-
troleum activity is only expected to gen-
erate around one job per million dollars,
the education sector is producing north
of 25 jobs.
This is one of the drivers for many Persian
Gulf and African countries to expand their
economies beyond just oil and gas ex-
traction for subsequent export as the job
creation is effectively exported as well.
Using the stimulus afforded by the nat-
ural resources to stimulate jobs in other
economic sectors with higher labor inten-
sity is where a significant amount of jobs
can be created.
Pre-Covid projects and ongoing East African LNG terminalsexpected to prevent massive job destruction
Figure 9.2: Number of jobs per Mil-lion Dollar of output
Petroleum & Coal Products Manufacturing
Oil & Gas Extraction
Health Care & Social Assistance
Retail Trade
Accommodation & Food Service
Education
0
5
10
15
20
25
Data Source: Bureau of Labor Statistics 2012

60African Energy Outlook 2021
African Energy Chamber60
Relentless work required to keep African resources competitive
Africa’s share of global produc-
tion is declining while share of
spend remain stable, indicating
lost competitiveness.
Africa is not insulated from global
turmoil, investments of $80 billion
could be deferred or lost by 2025.
Africa’s exposure to increas-
ing long-cycle risk premiums
is mitigated by a high share of
gas resources.
The outlook in the energy sector points
to short-term difficulties created by
COVID-19 and long-term sustainability
questions raised by energy transition
and carbon emission requirements.
The African oil and gas sector is not in-
sulated to these trends and must learn
to evolve and stay competitive within
new and shifting global dynamics for
investment and capital allocation.
Africa’s share of global production
has declined and is expected to con-
tinue its decline towards 2025 (Figure
10.1). Strong growth in North America
through its unconventional resource
base is the main reason for the reduced
production share. Another explana-
tion is the continued policy uncertainty
that has plagued most African produc-
ing nations for year: while some have
made remarkable efforts to provide
an enabling environment for investors,
others remain marked by red tape and
never-ending policy debates. Without
strong political will and policy reforms,
Africa’s share of global oil and gas pro-
duction will continue its steady decline,
and ultimately limit economic growth
and jobs creation on the continent.

www.energychamber.org 61
Relentless work required to keep African resources competitive
2012 2013 2014 2015 2016 2017 2018 2019 2020 2021 2022 2023 2024 2025
0
20 000
40 000
60 000
80 000
100 000
120 000
140 000
160 000
North America
Middle East
Russia
Asia
Africa
South America
Europe
Australia
Figure 10.1: Global petroleum production per continentMillion boe/d
Data Source: UCube August 2020

62African Energy Outlook 2021
African Energy Chamber62
From a spend perspective, that is all
money spent on investments and op-
erations, we can expect a more stable
outlook for Africa’s share (Figure 10.2).
While Africa is projected to consistent-
ly represents about 8-9 percent of the
global spend between 2012 and 2025,
its share of global production is also ex-
pected to decline over the same period.
Figure 10.2: Global upstream spend per continentMillion boe/d
North America
Middle East
African Share
Russia
Asia
Africa
South America
Europe
Australia
0
0.4M
0.8M
1.2M
1.6M
2012
2013
2014
2015
2016
2017
2018
2019
2020
2021
2022
2023
2024
2025
Unfortunately, the only conclusion
to be drawn from such facts is once
again that of a deteriorating compet-
itive position for African petroleum
resources. With the exception of a
few jurisdictions, producing a barrel
of oil from African soil remains less
competitive than producing the same
barrel elsewhere.
The detrimental impact of COVID-19
on global energy markets is also ex-
pected to have an impact on African
activity. Compared to pre-COVID19
expectation, about $80 billion less
investments are expected in Africa
towards 2025, with the years 2020 to
2022 carrying the brunt of the differ-
ence (Figure 10.3).
Data Source: UCube August 2020

www.energychamber.org 63
Figure 10.3: Contraction in African investment outlookBillion USD, nominal
20
30
40
50
60
70
80
2009
2010
2011
2012
2013
2014
2015
2016
Current Forecast
February 2020Forecast
-80 BUSD
2017
2018
2019
2020
2021
2022
2023
2024
2025
Relentless work required to keep African resources competitive
Data Source: Rystad Energy UCube August 2020

64African Energy Outlook 2021
African Energy Chamber64
Out of these $80 billions, Nigeria is by
far the most adverse impacted country
with about $24 billion moving out of the
2020-2025 window (Figure 10.4).
Where Africa has performed well over
the last years is in exploration. In par-
ticular, gas has been discovered in
vast quantities outside Mozambique,
Egypt, Senegal, Mauritania and South
Africa. Together, these discoveries are
sufficient to put Africa at the top spot
in terms of discovered conventional re-
sources per continent (Figure 10.5).
It was in particular for the period 2012 to
2015 that relatively big discoveries were
made, while 2020 so far has failed to
extend previous performance. Between
2012 and 2015, the amount of resources
discovered in Africa averaged over 34 0 Nig
eria
Liby
a
Ango
la
Mau
ritan
ia
Alge
ria
Equa
toria
l Gui
nea
Gha
na
Cong
o
Sene
gal
Cote
d’Iv
oire5 000
10 000
15 000
20 000
25 000
Figure 10.4: Top 10 lost upstream investment vs. pre-COVIDBillion USD nominal
Figure 10.4: Discovered conventionial resources per continentMillion USD nominal
2012
5 000
0
10 000
15 000
20 000
25 000
30 000
35 000
2013 2014 2015 2016 2017 2018 2019 2020
Africa
North America
South America
Asia
Middle East
Russia
Europe
Australia
African Share
Data Source: UCube August 2020
Data Source: UCube August 2020

www.energychamber.org 65
percent of all resources discovered
globally over the same period. Re-
duced exploration activity as a func-
tion of lost cash flow can partly explain
this outcome. There are also high im-
pact wells expected to be completed
before the end of 2020 that may turn
around the current situation, especial-
ly in South Western Africa.
On a longer-term perspective, the
energy transition and reported higher
premium put on long-cycle projects
may be detrimental the competitive-
ness of such projects, which typically
include new platforms, FPSO, LNG
facilities etc. South America has the
highest share of these long cycle proj-
ects on the back of the vast resource
base in Brazil’s pre-salt reservoirs and
the emerging Guyana basin.
The Middle East technically also has
a big share of long cycle projects, but
these projects are typically additional
phases of existing mega fields with
highly competitive positions.
On its side, Africa also has a large
share of its contingent resources in
long cycle projects which ultimate-
ly is a result of the exploration suc-
cess experienced earlier in the de-
cade, similar to the South American
situation (Figure 10.6). There is a
risk that these projects may have to
sustain a higher risk premium this
decade than the previous decade
on the back of the long-term trends
previously discussed.
However, a risk mitigating factor for
Africa is the high share of gas re-
sources which does not share the
same immediate deteriorating de-
mand outlook as many of the liquids
scenario outlooks are projecting. In
other words, the aforementioned risk
premium is more relevant to liquids
rich projects rather than new gas de-
velopments. Africa’s relatively high
gas share of contingent resources
gives it an edge over other regions
with similar or higher contingent re-
sources such as South America.
We cannot repeat it enough: it’s time for Africa to fully develop and harness its natural gas potential!
www.energychamber.org 65
Relentless work required to keep African resources competitive
Figure 10.6: Share of contingent resources inlong cycle projectsBillion USD nominal
0
10
20
30
40
50
60
Russ
ia
Asia
Nor
th A
mer
ica
Euro
pe
Aust
ralia
Afric
a
Mid
dle
East
Sout
h Am
eric
a
Data Source: UCube August 2020

66African Energy Outlook 2021
African Energy Chamber66
RegionalProduction ReviewProduction Outlook
2021 overall hydrocarbons out-
put expected at a slightly higher
level than 2020 as OPEC’s sanc-
tions ease on the member na-
tions, domestic struggle in Libya
becomes less intense, and Alge-
ria and Egypt see an increased
level of natural gas output
Post the 2021 increase, liquids
output currently estimated to
decline down to 2020 levels and
back again by 2025
Natural gas production is ex-
pected to stay roughly flat going
into mid-2020s, after an expect-
ed increase in 2021
Sub-Saharan African countries vs
North African hydrocarbon split
expected to reverse from 55%-
45% in 2020 to 45%-55% in 2025
Africa’s 2020 hydrocarbons production is
estimated at about 10.456 million barrels
of oil equivalent per day (boepd), includ-
ing 65% liquids and 35% of natural gas,
with crude oil output only estimated at
close to 5.74 million barrels per day (bpd).
As OPEC+’ production sanctions on the
member nations are lifted, sub-Saharan
African (SSA) countries and Libya will
pick up crude oil production, and 2021
crude oil output can be anticipated at
a higher level of 6.6 million bpd, with
overall output forecast at 11.55 million
boepd (66% liquids – 34% natural gas).
As a result of this, the overall liquids
production is expected to increase
from 6.8 million bpd in 2020 to a much
higher 7.645 million bpd in 2021.
However, as natural decline takes its
course and projects get pushed out,
the liquids output from Africa is ex-
pected to gradually decrease to 2020
levels of 6.84 million bpd by 2025.
2020 natural gas production from the
entire continent is estimated at close
to 620 million cubic meters per day
(mmcm/d). As the output from Algeria,
Egypt and Libya settles at a higher rate
going into 2020s, the overall natural
gas production from the continent is
estimated to hit 663 mmcm/d in 2021
and average output for the years 2021
– 2025 is expected at 671 mmcm/d.

www.energychamber.org 67
Regional Production Review | Production Outlook
Fig. 1: Africa | Liquids declining into 2020s with natural gas output expected to stay flattsLiquids: Thousand barrels per day | Natural Gas: Million cubic meters per day
Fig. 2: Overall overview of Africa hydrocarbon output.West African producers decline while North African countries ramp upLiquids: Thousand barrels per day | Natural Gas: Million cubic meters per day
Liquids Natural Gas
2020 2020 2022 2023 2024 20252021 2022 2023 2024 2025
0
2000
4000
6000
8000
0
7000
14 000
21 000
28 000
2021
Crude Oil Condensate NGL Natural Gas
2020 2020 2022 2023 2024 20252021 2022 2023 2024 2025
0 0
2 500 10 000
5 000 20 000
7 500 30 000
2021
Nigeria
Angola
Congo
Nigeria
Angola
Equatorial Guinea
Rest of SSA
Algeria
Egypt
Mozambique
Rest of SSA
Algeria
Libya
Others
Egypt
Libya
Others
Major Natural Gas ProducersMajor Crude Producers
Data Source: Rystad Energy UCube
Data Source: Rystad Energy UCube

68African Energy Outlook 2021
African Energy Chamber68
The overall hydrocarbons production split
between the SSA countries and North
Africa reverses from 2020 to 2025. The
SSA countries contributed to close to 55%
of the overall continent’s output in 2020,
while the North African countries are esti-
mated to contribute to close to 55% of the
production by 2025. The main reasons for
this trend reversal are:
Declining production from the major
producers in SSA
Libya expected to recover from the
ongoing civil war and produce a larger
chunk of the overall crude production
from the continent
Higher natural gas output from Alge-
ria and Egypt
Nigeria 26% Angola 14%
Rest of SSA 16%
Alg
eria
24%
Eg
ypt 15%
Libya 4%
SSA 56%
Res
t of A
frica
44%
Figure 3:SSA vs Rest of Africa Production split to be reversed from
2020 to 2025 as Nigeria and Angola
decline, and Algeria, Libya and Egypt
projects take majority share.
2020Production Split
Data Source: Rystand Energy UCube
68African Energy Outlook 2021
African Energy Chamber68

www.energychamber.org 69
Data Source: Rystand Energy UCube
Regional Production Review | Production Outlook
Nigeria 21% Angola 10%
Rest of SSA 16% A
lgeria 24%
Egy
pt 1
4%
L
ibya 15%
SSA 46%
Res
t of A
frica
54%
2025Production Split
www.energychamber.org 69

70African Energy Outlook 2021
African Energy Chamber70
| Crude Oil| Condensates| NGL| Gas
| Crude Oil| Condensates| NGL| Gas
| Crude Oil| Condensates| NGL| Gas
Figure 4
Production Centres in Africa2020/2021 In thousand barrels per day
Heavily dominated by West and North Africa
| Crude Oil| Condensates| NGL| Gas
Algeria ‘20 ‘21
9491802111161
9851762031199
| Crude Oil| Condensates| NGL| Gas
Tunisia ‘20 ‘21
267441
248641
| Crude Oil| Condensates| NGL| Gas
Libya ‘20 ‘21
228469164
10757414311
| Crude Oil| Condensates| NGL| Gas
Egypt ‘20 ‘21
464114101009
426116101103
| Crude Oil| Condensates| NGL| Gas
Niger ‘20 ‘21
6000
5000
| Crude Oil| Condensates| NGL| Gas
Chad ‘20 ‘21
116000
111000
| Crude Oil| Condensates| NGL| Gas
Sudan ‘20 ‘21
67000
77000
| Crude Oil| Condensates| NGL| Gas
SouthSudan
EquatorialGuinea
SouthAfrica
‘20 ‘21
181000
212000
Crude OilCondensates NGL Gas
‘20 ‘21
371132
332031
| Crude Oil| Condensates| NGL| Gas
Ghana ‘20 ‘21
1763036
1758042
| Crude Oil| Condensates| NGL| Gas
Nigeria ‘20 ‘21
149930064809
155825264778
‘20 ‘21
1093316102
943019106
| Crude Oil| Condensates| NGL| Gas
Cameroon ‘20 ‘21
632034
562033
| Crude Oil| Condensates| NGL| Gas
Gabon DRC‘20 ‘21
190003
175002
| Crude Oil| Condensates| NGL| Gas
‘20 ‘20‘21 ‘21
3373227
24000
3053326
22000
| Crude Oil| Condensates| NGL| Gas
Angola ‘20 ‘21
12701640115
12651442115
| Crude Oil| Condensates| NGL| Gas
Tanzania ‘20 ‘21
00034
00036
| Crude Oil| Condensates| NGL| Gas
Mozambique ‘20 ‘20‘21 ‘21
00072
00017
00067
00015
Côted’Ivoire
Republicof Congo
Data Source: Rystand Energy UCube

www.energychamber.org 71
Regional Production Review | Production Outlook
Nigeria and Angola continue to be the
biggest drivers of crude oil production
North African countries: Algeria, Egypt
and Libya take the lion’s share of gas
output
The above five countries expected to
round off the top five overall hydro-
carbon producers in the continent for
most of the next decade
Figure 4
Production Centres in Africa2021
Crude Oil
Condensates
NGL
Gas
African crude oil output is heavily dom-
inated by the West African giants and the
North African countries of Algeria, Egypt
and Libya. 2020 – 2021 output follows the
same trend. Close to 85% of the crude oil
output from the continent during this period
comes from Nigeria, Angola, Algeria, Egypt,
Libya, Congo and South Sudan. A further
10% – 12% of production comes from Ga-
bon, Ghana, Chad and Equatorial Guinea.

72African Energy Outlook 2021
African Energy Chamber72
These countries are expected to continue
to be the crude oil power houses in the
continent. Nigeria and Angola are expect-
ed to remain the top 2 crude oil produc-
ers in Africa, despite the OPEC-imposed
production cuts. However, as the internal
tensions subside and production picks
up, Libya is expected to displace Algeria
as the third largest crude oil producer in
2021. At the current assumptions which in-
clude the impact of COVID-19 on the glob-
al supply and demand of crude oil and
project delays, wherever applicable, only
Libya is expected to see growth in crude
oil output in Africa as it recovers from do-
mestic conflicts. The rest of Africa is cur-
rently expected to decline in production
going into mid-2020s.
The same top 5 crude oil producers –
Nigeria and Angola from the west; and,
Algeria, Egypt and Libya from North
Africa complete the top 5 natural gas
producers for 2020 and 2021. These
five countries contribute to about 90%
of the overall natural gas output from
the continent for both the years and the
expected forecast suggests their shares
will remain the same going into the mid-
2020s. Equatorial Guinea remains an
important contributor throughout the
period and Mozambique is expected to
break into the scene by 2025 – 2026.
The west African nations of Senegal and
Mauritania housing huge volumes of re-
coverable natural gas are currently only
developing 2.5 mtpa of LNG export ca-
pacity and are not estimated to bring on-
line their LNG hubs (up to 30 mtpa) before
later in the next decade as these projects
are hit by delays in the post-pandemic era.

www.energychamber.org 73
Declining crude output owing to de-clining reservoirs and lack of new start-ups.
Majority of the crude output driven by Nigeria and Angola.
Increased focus on monetization of natural gas hoping to reap rewards in the longer term.
Nigeria driving majority of the natu-ral gas production from the region while the Senegal – Mauritania gas hubs currently face headwinds.
West Africa
2020 2021 2022 2023 2024 2025 2020 2021 2022 2023 2024 2025
0 0
800 1 600
1 600 3 200
2 400 4 800
3 200 6 400
4 000 8 000
Nigeria
Angola
Nigeria
Angola
Chad
Others
Congo
Ghana
Cameroon
Côte d’Ivoire
Gabon
Equatorial Guinea
Major Crude ProducersThousand barrels per day
Major Natural Gas ProducersThousand barrels per day
Congo
Mauritania
Equatorial Guinea
Ghana
Fig. 5: West AfricaNigeria and Angola, although declining continue to be major producers
Regional Production Review | Production Outlook
Data Source: Rystand Energy UCube

74African Energy Outlook 2021
African Energy Chamber74
Nigeria, a member of both OPEC and
the Gas Exporting Countries Forum
(GECF), is currently the largest crude oil
producer in Africa. 2020 overall oil and
gas output is estimated at 2.67 million
boepd, out of which liquids production
expected to be 1.862 million bpd and
crude oil production 1.5 million bopd.
Crude oil output is expected to slight-
ly increase to 1.56 million bopd in 2021
but this increase will be short-lived, and
Nigeria’s oil output is estimated to de-
cline to 1.235 million bopd by 2025.
Similarly, 2020 natural gas output is
estimated at 137 mmcm/d and is es-
timated to drop down to 132 mmc-
m/d in 2021. Efforts are being put into
place to increase monetization of gas,
but new developments are clearly re-
quired to reverse the declining natural
gas output. 65% of the 2020 crude oil
production comes from offshore proj-
ects and in contrary, 75% of the year’s
natural gas output comes from onshore
fields. Post approval of NLNG Train 7
in 2019, no major projects were sanc-
tioned for development in 2020. The
First E&P-operated Anyala–Madu proj-
ect on OMLs 83 and 85 has been the
year’s major start-up, apart from the Se-
plat-operated Sapele Shallow develop-
ment on OML 41.
No significant projects are expected to
be approved or come online in Nigeia
in 2021, as the country has taken a hard
hit due to the COVID-19 pandemic and
the subsequent global crude oil de-
mand drop and crude price crash that
came with it. Many high profile projects
like the Shell-operated Bonga North
and Bonga Southwest–Aparo deepwa-
ter developments, and the Eni-operated
Etan–Zabazaba project, also in deep-
water, are now expected to be delayed
further as such investment intensive
projects have come on the chopping
block as IOCs and operators across the
world are now focused on cutting down
investments and delaying projects with
a high breakeven oil price.
The petroleum industry in Nigeria was
already plagued with existing issues
like the long-delayed Petroleum Indus-
try Bill (PIB), which later transformed
into the Petroleum Industry Gover-
nance Bill (PIGB). In September 2020,
President Buhari resubmitted the bill to
the National Assembly, hoping to pass
it by the end of 2020, although when
or if this action will occur is unclear. To
add to this, Nigeria also passed in late
2019 a revision to the 1993 deep water
PSCs which increases the royalties on
deep water fields from existing 0% to a
possible 12.5% at current oil price.
While few other West African countries
are taking initiatives to provide fiscal
incentives to bring in and retain long-
term investments in deep water proj-
ects, Nigeria has taken a step in an-
other direction in a gamble to increase
government revenues, but in doing so,
has created an unattractive fiscal envi-
ronment for upstream investors.
The latest development in Nigeria’s up-
stream sector has been the announce-
ment of the 2020 Marginal Fields Bid-
ding Round for which as many as 57
marginal fields are up for bidding. The
round includes:
22 fields wrested from concessions held
by Shell Petroleum Development Compa-
ny (SPDC)
12 fields left dormant by Chevron
11 fields held by ExxonMobil now wrested
Five fields held by Total now wrested
Two fields under concession by ENI
An additional five more have been added
to those offered by the Department of Pe-
troleum Resources (DPR)
Largest crude oil and natural gas pro-ducer in the region and expected to retain this status for a long period
2020 crude oil output plagued by pro-duction cuts imposed by OPEC while 2021 crude production expected at a higher level as OPEC sanctions ease down, but declining going forward
COVID-19 led capital expenditure cuts and revised crude price forecasts from operators leading to a large number of offshore project delays
Marginal fields bidding round garner-ing a lot of interest and impact to be seen in the next few months
PIB/PIGB saga still an ongoing pro-cess even after a decade The entire process right from registration
to award is expected to be done electron-
ically, due to the coronavirus outbreak. All
the technical and commercial bids were
expected to be submitted by August 2020.
Under the DPR Guidelines, the entire pro-
cess is not expected to take longer than six
months, from date of announcement and
commencement to signing of Farm-out
agreement with the OML holders. Mean-
while, there is dissent building up in the host
communities with Indigenous Ijaw rights ac-
tivists saying that a minimum of 25% equity
stake in upcoming marginal field awards
has to be allocated to host and transit com-
munities in the oil producing Edo and Delta
States. Some militant bodies have warned
any award arising from the 2020 Marginal
Field Licensing Round that fails to consider
the interest of host communities will be an
exercise in futility as farm-in allottees will not
be allowed access. While the decision to
conduct the bid-round is a step in the right
direction and has generated a lot of buzz,
the development of these oil fields in a post
COVID-19 world may be challenging, given
the oil price collapse in the international
market, and the unfavourable fiscal regime
for marginal field operations in the country.
Nigeria

www.energychamber.org 75www.energychamber.org 75
Regional Production Review | Production Outlook
Made large scale natural discov-eries which put the region on the global hydrocarbons map
Aspirations to set up 30 million tonnes per annum (mtpa) LNG ca-pacity through three hubs, and also power the gas-to-power industry in Senegal
Facing headwinds due to COVID-19, leading to revisions in strategies by the partners of the gas hubs
Long-term LNG plans now facing uncertainty while domestic supply plans are expected to face delays
The West African countries of Senegal
and Mauritania saw many discoveries
during the years 2014, 20 15 and 2016.
The Ahmeyim – Yakaar – Teranga dis-
coveries turned heads with huge vol-
umes of gas discovered in the years
2015 to 2017 and are gearing up to
put the region on the global LNG map
along with the Bir Allah (Marsouin) find
and the recent 2019 Orca discovery.
Senegal also saw the FAN and SNE
crude oil discoveries during the same
period. These exploration successes
are finally seeing the light of develop-
ment. The phase 1 of the Greater Tortue
Ahmeyim (GTA) FLNG project was
approved in 2018 and the 2.45 mtpa
project is expected to see a delayed
start-up by 2023 due to the ongoing
coronavirus pandemic. The GTA LNG
hub, along with the Bir Allah LNG hub
in Mauritania and the Yakaar–Teranga
LNG hub in Senegal are expected to
be developed in the zone, and could
ultimately reach a cumulative export
capacity of 30 mtpa. This development
is expected to see some delays as Kos-
mos now aims to decrease its stakes
in the long-term LNG developments,
and as BP revises its global investment
strategy to become net zero by 2050.
On the crude oil side, the first phase of
the Sangomar (SNE) offshore oil project
was approved earlier this year and the
start-up is now expected by 2023. The
later phases are expected to be devel-
oped post the start-up of phase-1.
Being minnows in the region in terms
of oil and gas production, both coun-
tries have been hit hard by the ongoing
COVID-19 pandemic and the future of
their mega LNG hubs is highly depen-
dent on the operators’ decisions. With
the long-lasting changes that the coro-
navirus has brought in the oil and gas
market, the future of these LNG hubs
and the natural gas aspirations of both
Mauritania and Senegal seem to be
facing very strong headwinds.
Senegal | Mauritania
Regional Production Review | Production Outlook

76African Energy Outlook 2021
African Energy Chamber76
Algeria and Egypt quietly taking over the continent’s output while Libya has the capacity to become one of the largest crude oil produc-ers if the civil war is resolved
North Africa
2020 20202021 20212022 20222023 20232024 20242025 2025
0 0
1 000 5 000
2 000 10 000
3 000 15 000
4 000 20 000
Egypt
Libya
Egypt
Libya
Tunisia
Algeria
Tunisia
Algeria
Morocco
Sudan
Morocco
Sudan
Fig. 6: North AfricaAlgeria, Egypt and Libya driving the production
Major Liquid ProducersThousand barrels per day
Major Natural Gas ProducersThousand barrels per day
Data Source: Rystand Energy UCube

www.energychamber.org 77
Regional Production Review | Production Outlook
A member of OPEC and GECF, Libya in
2011 was cruising towards raising its daily
production above the 2 million threshold.
But as General Gaddafi’s regime ended
and civil war broke out throughout the
country, it has been unable to even main-
tain a sustainable oil production capacity
around 1 million bpd. With continued civil
unrest, force majeure has been imposed
on oil exports in the country from January
2020. Due to this, Libya’s oil production
has currently plummeted to almost 10% of
Libyaits capacity. Prior to January 2020, Libya
had been able to recover from lows of
600–800,000 bpd and was maintaining
its oil production over 1.1m bpd.
Talks had started to initiate new major oil
and gas projects like the development
of the offshore structure A&E in Block
NC-041 which was pegged at producing
30 to 35,000 bpd of condensate and
19.8 to 20 mmcm/d of gas at its plateau.
Investment scenario was also getting
better with IOCs like Total, BP, and ENI
increasing their investment in the Libyan
E&P sector. Currently, Libya is struggling
hard to bring back its offline capaci-
ty which would itself require $600 to
$800m just to restore production back
to January 2020 capacity and further
billions of dollars to start ramping up its
capacity and raise it to 2 million bpd. But
given the current situation, IOCs are re-
luctant to invest in Libya, which is further
putting more pressure on the already
cash-strapped Libyan National Oil Com-
pany. In the current scenario, the 2020
crude oil output is estimated close to
230,000 bpd and 2021 production is
expected to surpass 1 million bpd, pro-
viding the situation does not deterioate.
Egypt became self-sufficient in meeting its
gas consumption in 2018, after projects like
ENI’s Zohr and BP’s West Nile Delta (WND)
started contributing to domestic gas pro-
duction. The country not only met its grow-
ing domestic gas needs, but also exported
4 billion cubic meters of LNG in 2019 from
its Idku LNG plant. Egypt’s domestic gas
production reached 68 billion cubic meters
in 2019, the highest in this decade. Howev-
er, the global drop in gas prices have dras-
tically reduced 2020 LNG export volumes
and the Covid-19 pandemic has exacer-
bated the problem by reducing domestic
demand as well, leading to production
caps on many projects. Zohr, the country’s
largest offshore project, is expected to pro-
Egyptduce way below its nameplate capacity
of 84 million cubic meters per day as the
nation faces a supply surplus. Current esti-
mate is for Egypt to produce 62 billion cubic
meters of gas in 2020, out of which only 1-2
billion cubic meters might be exported as
LNG. In terms of upcoming projects, Raven,
part of the third phase of BP’s WND project,
is expected to commence production next
year. Based on current supply demand bal-
ances, Egypt is expected to experience a
gas deficit post 2024, when the domestic
consumption outpaces the local produc-
tion again. The country has been actively
planning new licensing rounds to discover
more resources. Recently, the results were
declared for the Red Sea round, while
those for the West Mediterranean round
are yet to be announced. Majors are likely
to be awarded concessions as the sector is
frontier, and the nation hoping to discover
another Zohr.
Although Egypt has been able reverse
the direction of its gas output, the story
is not the same when it comes to crude,
as it struggles to discover more oil. The
country’s crude oil output remains on a
decline, with major production coming
from the Western Desert and the Gulf of
Suez. The country is estimated to have
produced ~490,000 bpd of crude oil
in 2019, and continues to import what it
needs to meet its domestic demand. The
2018 Licensing Round resulted in many
concessions being awarded in Western
Desert to international majors and inde-
pendents, but it is yet to be seen if the
concessions offered will result in addi-
tional discoveries.
Algeria, an OPEC as well as GECF mem-
ber, is a major African crude oil and gas
exporter. The country produces close
to 1 million bopd, although recent cuts
in line with the OPEC+ deal have led
to output falling below 850,000 bopd.
The country has suffered a huge blow
as the oil export revenue has dropped
drastically due to the oil price cash. The
impact of this is quite significant as Al-
geria depends heavily on oil and gas
export revenue to support its state bud-
get. Algeria is also a major pipeline gas
exporter to Europe and LNG exporter
Algeriato East Asian and European markets.
Current estimates are for the country to
export 37 billion cubic meters of gas, out
of which 15 billion cubic meters would
be LNG exports. Algeria is estimated to
have produced 86 billion cubic meters
of gas in 2019.
Spain and Italy are the major import-
ers of Algerian pipeline gas, although
due to reduced gas demand as a con-
sequence of the pandemic and lower
gas prices, pipeline exports have also
been reduced in 2020. This is on top
of yet another drop from 2019 levels of
26 billion cubic meters compared to 39
billion cubic meters of pipeline gas ex-
ports in 2018. The country also had to
signed new export contracts last year
which expired recently. These new con-
tracts were signed with lower volumes,
as Algeria might struggle to maintain its
short-term gas exports as its domestic
gas consumption increases. With no
major discoveries being witnessed, the
country also introduced a new hydro-
carbon law, hoping to attract further in-
vestments by foreign companies. This
has led to Sonatrach to sign several
MoUs related to exploration opportu-
nities under the new law with majors
and independents including ExxonMo-
bil, Chevron, ENI, OMV, Cepsa, Lukoil,
TPAO and Zarubezhneft.

78African Energy Outlook 2021
African Energy Chamber78
2020
East & South Africa
Most of current liquids production comes from South Sudan
The Region includes potential up-coming natural gas hubs catering to both domestic and export markets in Mozambique, Ethiopia, South Af-rica and Tanzania
Mozambique could overtake Nige-ria in the next decade as Africa’s biggest LNG exporter
20202021 20212022 20222023 20232024 20242025 2025
Egypt
Libya
Egypt
Libya
Tunisia
Algeria
Tunisia
Algeria
Morocco
Sudan
Morocco
Sudan
0 0
75 500
150 1000
225 1500
300 2000
Major Liquid ProducersThousand barrels per day
Major Natural Gas ProducersThousand barrels per day
Fig. 7: South & East Africa South Sudan remains the crude oil producers as Natural gas projects inMozambique, Tanzania and South Africa start ramping up
Data Source: Rystand Energy UCube

www.energychamber.org 79
Mozambique had an amazing beginning
of the decade with a successful explo-
ration campaign during the period 2010
– 2014. The country reported many dis-
coveries like the Golfinho, Atum, Coral,
Windjammer, or Mamba South finds which
Before South Sudan gained indepen-
dence in 2011, its combined oil pro-
duction with Sudan was around 450
to 480,000 bpd. Years of unrest and
civil war have damaged wells and pro-
duction facilities and South Sudan cur-
rently produces around 280,000 bpd
resulted in the conceptualization of new
LNG hubs in the country. The ENI-oper-
ated 3.4 mtpa Coral FLNG development
(Area 4) was approved in 2017 and is ex-
pected to come online by 2023. The first
two trains of the onshore Mozambique
LNG project, headed by Total in Area 1,
were approved last year and are expected
to bring online 12.88 mpta of LNG output
with a target of bringing back output to
350,000 bpd. The country still relies on
its northern neighbour’s oil export infra-
structure to monetize its reserves. After
independence, Sudan started charging
South Sudan in per barrel terms to facili-
tate oil export, and this oil revenue shar-
ing has always remained an unsolved
issue between these two nations. As
part of OPEC+ group both Sudan and
Mozambique
South Sudan
in 2025. ExxonMobil is also expected to
approve the development of the first two
trains of its Rovuma LNG project in 2022
(Area 4). These two trains are expected to
bring online a peak output of 15.2 MMtpa
of LNG. Future phases operated by these
majors could come online at a later time-
line, with Total’s Area 1 alone able to sup-
port 43 mtpa of LNG export capacity.
South Sudan have pledged to cut down
their oil production. Sudan seems to be
adhering to their quota, but South Su-
dan has not been compliant throughout
the cuts and is now expected to further
ramp-up its production by Q4 2020. On
the exploration front, South Sudan has
started to pick some momentum and is
expected to relaunch its bidding round
initially planned for 2020 in Q1 2021
Other countries in the South and East-
ern regions of Africa are awaiting the ap-
proval of their upcoming projects or kick
starting their exploration campaigns.
Uganda’s Tilenga project is one of them,
with Total expecting to take a final in-
vestment decision (FID) in the near fu-
ture. The sanctioning of the project has
slipped into 2021, and first oil is expect-
ed by 2024-2025. Similarly, the South
Lokichar development onshore Kenya
has now slipped into 2023 as impact of
COVID-19 and fiscal framework issues
have led Tullow Oil to call force ma-
jeure on the project for several weeks in
2020. In the landlocked nation of Ethio-
pia, the PolyGCL-operated Calub-Hilala
fields’ development, from where natural
gas is planned to be piped off to a FLNG
unit offshore Djibouti is expected to be
approved in 2022 with start-up expect-
ed by the middle of the decade.
Offshore South Africa, French major To-
tal has started an exploration campaign
close to its Brulpadda gas and conden-
sate discovery with the spudding of the
Luiperd-1X well in late August 2020.
August 2020, and announced a signif-
Rest of East &South Africa
icant gas discovery a few months later.
Somalia also launched its first offshore
licensing round. The round initially in-
cluded 15 blocks, but was reduced to
seven – Block 204 off Kismayo, contig-
uous blocks 177 and 178 off Mogadishu
and neighbouring blocks 165 and 153 off
the coastal towns of Cadale and Ceeld-
heere. The process is expected to be
completed by March 2021. However,
significant challenges still remain as the
province of Puntland, the state of Jub-
baland and the Republic of Somaliland
have not agreed to legitimise the licens-
ing exercise and have denied the re-
vised Petroleum law or the control of the
Somali Petroleum Authority (SPA).
Regional Production Review | Production Outlook

80African Energy Outlook 2021
African Energy Chamber80
The mid-level producers of Africa
Congo, Gabon, Ghana, Equatorial Ghana, Chad and Cameroon con-stitute a strong group of mid to low level African producers
Congo’s crude oil exports have been hit by the cuts imposed on OPEC member nations but Equa-torial Guinea and Gabon remain unaffected as the production lev-els are already low
Majors including Total, Chevron, Eni and ExxonMobil, and indepen-dents including Tullow Oil and Pe-renco drive majority of the output in these countries
In a new normal COVID-19 hit world, these countries fight their own battles to stabilize their re-spective oil and gas industry sit-uation
These set of sub-Saharan African countries along with their much bigger hydrocarbon producing counterparts are heading towards a transformation, driven by possi-ble divestments from majors with the aim of decarbonising their portfolios and positioning them-selves for the energy transition
Largest crude oil producer in this group of mid to low level hydrocar-bon producers and the third-largest oil producer in sub-Saharan Africa after Nigeria and Angola
Most of the production comes from the offshore projects operated by majors and independents
Being an OPEC member, the country’s 2020 crude exports have been im-pacted by the OPEC+ agreement cuts
Production going forward is ex-pected to decline but the Govern-ment aspires to drill 125 wells in the next three years – most of them in low-cost-intensive shallow-water or onshore locations
Congo has crude oil reserves of more
than 3 billion barrels and gas reserves
of about 400bn cubic metres, accorg-
ing to the government. The country’s
crude oil production increased from
about 256,000 bpd in 2015 to a peak of
almost 370,000 bpd last year, making
it one of the few African countries with
rising production among sub-Saha-
Congoran African oil producers. The OPEC+
sanctions put the country’s 2020
crude oil output at about 335,000 bpd
and 2021 production is expected to
fall to 305,000 bpd. Congo is indeed
facing a steep production decline as
the past five years of exploration have
failed to turn up any viable discoveries
and near-future developments have
been delayed due to the low oil price
environment and the COVID-19 pan-
demic. The decline means Congo’s
production will be back at pre-2015
levels by the mid-2020s and will have
dropped by more than 40% from last
year’s peak by the early 2030s.
Congo’s economy is highly depen-
dent on the oil industry, which ac-
counts for 55% of gross domestic
product (GDP), 85% of exports and
80% of tax revenue. Before the pan-
demic, Congo’s GDP was projected
to increase by around 4.6% this year
– now it is instead expected to enter
recession with a 7.2% GDP contrac-
tion in 2020. Considering the central
role of oil and gas in the country’s
economy, the government has little
choice but to focus on mitigating the
production decline through new de-
velopments and discoveries in a bid
to shore up its national finances.
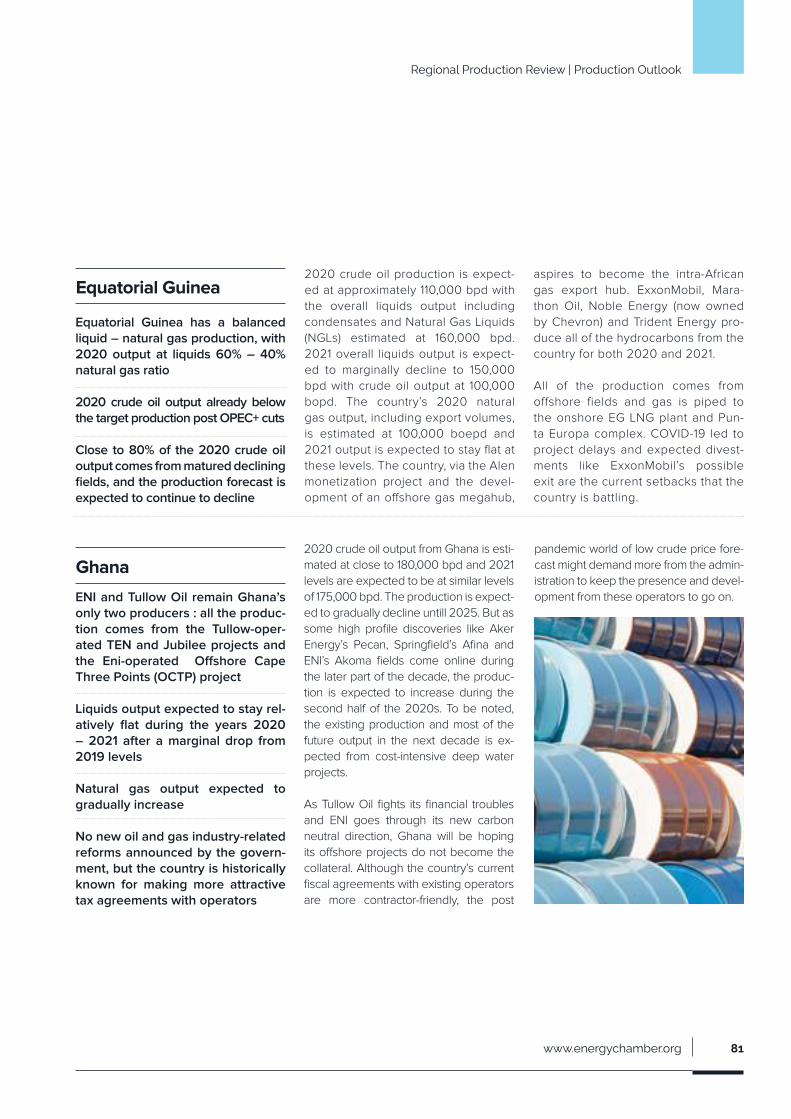
www.energychamber.org 81
2020 crude oil production is expect-
ed at approximately 110,000 bpd with
the overall liquids output including
condensates and Natural Gas Liquids
(NGLs) estimated at 160,000 bpd.
2021 overall liquids output is expect-
ed to marginally decline to 150,000
bpd with crude oil output at 100,000
bopd. The country’s 2020 natural
gas output, including export volumes,
is estimated at 100,000 boepd and
2021 output is expected to stay flat at
these levels. The country, via the Alen
monetization project and the devel-
opment of an offshore gas megahub,
2020 crude oil output from Ghana is esti-
mated at close to 180,000 bpd and 2021
levels are expected to be at similar levels
of 175,000 bpd. The production is expect-
ed to gradually decline untill 2025. But as
some high profile discoveries like Aker
Energy’s Pecan, Springfield’s Afina and
ENI’s Akoma fields come online during
the later part of the decade, the produc-
tion is expected to increase during the
second half of the 2020s. To be noted,
the existing production and most of the
future output in the next decade is ex-
pected from cost-intensive deep water
projects.
As Tullow Oil fights its financial troubles
and ENI goes through its new carbon
neutral direction, Ghana will be hoping
its offshore projects do not become the
collateral. Although the country’s current
fiscal agreements with existing operators
are more contractor-friendly, the post
Equatorial Guinea has a balanced liquid – natural gas production, with 2020 output at liquids 60% – 40% natural gas ratio
2020 crude oil output already below the target production post OPEC+ cuts
Close to 80% of the 2020 crude oil output comes from matured declining fields, and the production forecast is expected to continue to decline
ENI and Tullow Oil remain Ghana’s only two producers : all the produc-tion comes from the Tullow-oper-ated TEN and Jubilee projects and the Eni-operated Offshore Cape Three Points (OCTP) project
Liquids output expected to stay rel-atively flat during the years 2020 – 2021 after a marginal drop from 2019 levels
Natural gas output expected to gradually increase
No new oil and gas industry-related reforms announced by the govern-ment, but the country is historically known for making more attractive tax agreements with operators
Equatorial Guinea
Ghana
aspires to become the intra-African
gas export hub. ExxonMobil, Mara-
thon Oil, Noble Energy (now owned
by Chevron) and Trident Energy pro-
duce all of the hydrocarbons from the
country for both 2020 and 2021.
All of the production comes from
offshore fields and gas is piped to
the onshore EG LNG plant and Pun-
ta Europa complex. COVID-19 led to
project delays and expected divest-
ments like ExxonMobil’s possible
exit are the current setbacks that the
country is battling.
pandemic world of low crude price fore-
cast might demand more from the admin-
istration to keep the presence and devel-
opment from these operators to go on.
Regional Production Review | Production Outlook

82African Energy Outlook 2021
African Energy Chamber82
Gabon’s 2020 crude oil production is
expected at 190,000 bpd, and is esti-
mated to drop marginally to 180,000 bpd
in 2021. The country is hardly impacted
by the OPEC+ cuts as the 2020 output
is already close to the target output post
the cuts. Gabon is heavily reliant on its
oil exports and the petroleum industry
accounts for 30% of GDP, 79% of exports
and 36% of government budget revenue.
Before the pandemic and the associated
oil price crash, Gabon’s GDP was project-
ed to increase by around 3.7% this year
– now it is instead expected to enter a
recession with a 3.8% GDP contraction
The landlocked country of Chad is ex-
pected to produce close to 110,000
bpd of crude oil in 2020 and the pro-
duction levels are expected to remain
at this level in 2021 as well.
Cameroon is the smallest producer
among this group of countries with mid
to low level hydrocarbon output in Africa.
2020 crude oil production is expected
to be about 65,000 bpd and to margin-
ally drop to 55,000 bpd day in 2021. The
country also produces natural gas from its
Golar Kribi FLNG, Sanaga Sud and Logba-
ba fields. 2020 – 2021 natural gas output
55% of the 2020 crude output comes from offshore shelf fields and the rest from onshore fields, with 3/4th of overall production coming from matured declining fields
French major Total, independent Perenco and Carlyle Group-backed Assala Energy produce close to 70% of current output
Gabon
Chad
Cameroon
in 2020 and a further 1.4% reduction in
2021. Counter measures to the declin-
ing oil output and COVID-19 pandemic
include extension on the closing date for
the ongoing 12th Licensing Round. The
authorities are also offering more than
65 000 square kilometres of 3D seismic
and over 21 000 kilometres of 2D seismic
data along with available well-specific
data for 167 wells across the 35 offered
blocks. This will provide a further oppor-
tunity for potential bidders to integrate
new data into their evaluation of open
blocks and help in the assessment of
prospectivity and play potential.
Most of the current production comes
from the CNPC-operated Permit H (Area
I, II and III); and the Chad Export Project
on the Chari block and Mangara – Ba-
dila block operated by ExxonMobil and
Glencore respectively. The country
does not have many upcoming projects
in the pipeline and the production is ex-
is expected to stay flat at about 35,000
boepd. Perenco is the leading producer
in the country and is expected to retain
that position as the top producing opera-
tor through the next decade.
All of Cameroon’s production comes from
its offshore projects in shelf water depths.
As no new major crude oil developments
are expected to come online in the next
decade, the country’s crude oil output
is expected to gradually decline to less
pected to be driven by the existing pro-
ducing fields through the next decade.
As a result, it is expected to gradually
decline to half the current levels by the
end of the next decade. A potential exit
of ExxonMobil from the country is on the
cards as the US major is trying to divest
its 40% stake in the Chari block.
than 20,000 bpd going into the early
2030s. The natural gas output, however,
is expected to average a relatively higher
level of about 40,000 boepd through the
2020s as few projects like the Victoria Oil
and Gas’ Logababa Phase 2 and Noble
Energy’s YoYo come online.
The major upcoming project in the coun-
try is New Age-operated Isongo Marine,
but this is plagued with a few issues and
the start-up currently delayed.

www.energychamber.org 83
Regional Production Review | Production Outlook
www.energychamber.org 83
84African Energy Outlook 2021
African Energy Chamber84
terawatt-hours (TWh) by 2025,
2035 and 2040 respectively.
The Chamber assesses natural
gas use in power generation is
likely to increase in several Afri-
can countries like Nigeria, as sup-
porting infrastructure and mone-
tisation options continue to grow.
SDG 7 goal which seeks to
ensure “access to afford-
able, reliable, sustainable
and modern energy for all”
has produced modest gains
in electricity access in Africa.
Nonetheless, 565 million peo-
ple still lack access to electric-
ity on the continent, mostly in
Sub-Saharan Africa.
Putting Power at the Centre of Africa’s Economic and Industrial Revival
A bold and ambitious post-
COVID recovery plan involving
significant investments in Afri-
ca’s electricity sector is needed
as part of the policy responses
by governments and the private
sector to the pandemic.
Energy-intensive industrial ac-
tivities such as value-additive
mining will serve as key drivers
of demand growth, account-
ing for 45 percent of total con-
sumption by 2030. The African
Energy Chamber forecasts that
electricity generation on the
continent will increase by 25
percent, 55 percent and 141
percent of 2020 baseline levels
to reach 1,057, 1,138 and 2,047
Africa’s energy transition is
likely to emphasise energy se-
curity (access) and energy pov-
erty (affordability), resulting in
an increasing use of natural gas
for domestic power generation
and LNG exports, an increase
in the share of renewable ener-
gy within the continent’s gen-
eration mix, and an increased
focus on decentralised off-grid
energy initiatives for remote
communities.
Climate change considerations
in Africa have to take into con-
sideratiojn the equally import-
ant energy poverty and associ-
ated economic challenges that
are of major concern to Africans

www.energychamber.org 85
Putting Power at the Centre of Africa’s Economic and Industrial Revival
Africa’s rapid economic development is
directly linked to the reliable modern en-
ergy services provision, primarily electric-
ity. However, access to reliable power is
consistently identified as one of the most
significant constraints to doing business
on the continent (Figure 1 – Getting elec-
tricity indicators). The continent’s rapid
economic growth since 2010 has been
driven by the expansion of the services
and extractives sectors. This development
has been catalysed by rising electricity de-
mand, which is estimated to be growing at
between 3-5 percent per annum.
The African Energy Chamber firmly
believes in the continent’s potential,
especially the opportunities that a
post-COVID economic recovery pres-
ents for Africa’s rapid industrialisation.
This will increase domestic production
and consumption, boost intra-regional
trade through the African Continental
Free Trade Area (AfCTA) and develop
regional value chains.
All these, of course, catalysed by the
continent’s young and dynamic popu-
lation as well as increasing digitalisation
(formalisation) of several economic sec-
tors and government services.
For example, a 5 percent economic
growth between 2020 and 2040 will in-
crease the continent’s economic output
by 922 percent from the current US$1.76
trillion to US$18 trillion in 2040 with man-
ufacturing making up 24 percent of val-
ue-added from the current 19 percent,
according to EIA forecasts. Attaining
these lofty benchmarks will require the
availability of affordable and reliable en-
ergy, particularly electricity.
East Asia &Pacific
Europe &Central Asia
Latin America& Caribbean
Middle East &North Africa
OECD high income
SouthAsia
Sub-SaharanAfrica
0
20
40
60
80
100
Getting Electricity Score Time (days) Time (days)Fig. 1: Doing Business ScoresGetting Electricity
Data source: World Bank 2020 Doing Business Indicators

86African Energy Outlook 2021
African Energy Chamber86
Africa’s ElectricitySector in 2021
Total electricity generation in Africa
stood at 870 terawatt-hours (TWh) in
2019, an increase of 2.9 percent from
846 TWh in 2018. Africa’s electrici-
ty generation capacity has grown at
an average of 4.8 percent per annum
since 2008, compared to 2.7 percent
globally. Nonetheless, Africa’s share of
global electricity generation has been
around 3 percent since 2000.
The African Energy Chamber forecasts
that 2021 generation is likely to range
between 870-900 TWh if demand
picks up aggressively throughout the
year following the gradual removal of
COVID-19 lockdown restrictions and
economies opening more fully to in-
ternational trade. Our base case fore-
cast using a conservative 4.5 percent
yearly growth (current stated policies)
shows that electricity generation on the
continent will increase by 25 percent,
55 percent and 141 percent of 2020
baseline levels to reach 1,057, 1,138 and
2,047 TWh by 2025, 2035 and 2040
respectively. This increases to 1,520 in
2030 and 2,700 TWh in 2040 in a more
African Power Demand to KeepRising Between 4-5%/y
aggressive push to expand capacity at
6 percent per annum (Dashboard 1 –
electricity indicators).
The latter assessment is premised on
Africa aggressively pushing to expand
electricity supply and modern energy
services within the framework of the
Africa Agenda 2063 on energy and
infrastructure development. This will
ensure that generation expansion will
outpace population growth on the
continent (Africa will have 1.8 and 2.45
billion people by 2040 and 2050).
Oil42%
Natural Gas 27%
Coal 22%
Residential 55%
Transport 20%
Commercial and public services 4%
Agriculture 2%Others 5%
Industry 15%Nuclear Energy 1%
Hydro Electric 6% Renewables 2%
Dashboard 1: Africa’s total primary energy consumption (TPEC) by fuel
Dashboard 1: Africa’s total primary energy consumption (TPEC) by sector
Data Source: IEA

www.energychamber.org 87
Regarding the supply mix, natural gas
(39 percent) constitutes the largest el-
ement in Africa’s electricity generation
mix, followed by coal (29 percent), hy-
dro (15 percent) and oil (10 percent).
While nuclear energy accounted for
another 2 percent, the share of renew-
ables (RE) in Africa’s generation mix is
growing, albeit at a lower pace than in
other regions (5 percent). Most of the
RE growth comes from solar, wind and
geothermal power plants, and this ex-
pected to continue into 2030. Africa
generated 830 megawatts (MW), 5,748
MW and 7,236 MW of geothermal, wind
and solar installed capacity in 2019, sig-
nifying growth rates of 17.4 percent, 26.1
percent and 60.2 percent respectively
since 2010. Nonetheless, most of these
RE developments on the continent are
limited primarily to Northern (Morocco,
Egypt) and South-Eastern Africa (South
Africa, Kenya). Given the declining costs
of key RE technologies along with ris-
ing concerns over CO2 emissions, the
level of renewables deployment, partic-
ularly solar and wind energy is expect-
ed to increase by 1.5 percent annually
over the next decade to 2030.
Regarding sectoral electricity consump-
tion, the industrial sector remains the
continent’s largest user (41 percent) fol-
lowed by residential (33 percent), com-
mercial and public services (18 percent)
and agriculture (4 percent). Transport
consumes a small proportion (approxi-
mately 1 percent) while the remaining 3
percent was accounted for by other sec-
tors. At a sub-regional level, North Africa
and South Africa account for more than
70 percent of Africa’s electricity demand.
Sub-Saharan Africa’s per capita elec-
tricity consumption has decreased
by more than 4 percent since 2010 to
around 486 kWh per capita, over six
times lower than the global average of
3,133 kWh per capita. The value is much
lower in most parts of Africa – for exam-
ple, below 100 kWh per capita in Niger,
Ethiopia and Benin. Further compound-
ing these are the high electricity trans-
mission and distribution losses in many
countries due to derelict infrastructure
from years of underinvestment. Trans-
mission and distribution losses range
from about 21 percent in DR Congo,
Ghana (23 percent), Gabon (28 per-
cent), Namibia (36 percent), Niger (42
percent) to as high as 70 percent in
Libya and Togo, according to EIA and
World Bank statistics; this compares to
a global average of 8 percent.
2000 2005 2010 2015 2020 2025
Forecast
2030 2035 2040
500, 000
1, 000, 000
1, 500, 000
2, 000, 000
2, 500, 000
0
Dashboard 1: Electricity generation in Africaby scenario, 2018-2040
Base case (status quo)generation @ 4.5% per annum growth (GWh)
Expanded generation@ 6% per annum growth (GWh)
Putting Power at the Centre of Africa’s Economic and Industrial Revival
Historical data source: IEA; Forecasts independenly produced

88African Energy Outlook 2021
African Energy Chamber88
NorthAmerica
SouthAmerica
Europe
NorthernAfrica
SouthernAfrica
WesternAfrica
CentralAfrica
Dashboard 1:
World Energy Consumption per Capita2000 - 2009Gigajoule (GJ) per Capita
230230
48
122 138 100
280
58
144 160 155
North America
South America
Europe CIS Middle East
Data Source: IEA

www.energychamber.org 89
AsiaPacific
CISMiddle East
Europe
NorthernAfrica
EasternAfrica
SouthernAfrica
WesternAfrica
CentralAfrica
30 5
65 6
Asia Pacific Western Africa
140
3
180
4
Northern Africa
Eastern Africa
3
5
Central Africa
3
5
Southern Africa
Putting Power at the Centre of Africa’s Economic and Industrial Revival

90African Energy Outlook 2021
African Energy Chamber90
Despite the continent’s enormous ener-
gy resources, access to modern energy
services in Africa remains limited. Almost
600 million of the continent’s population
(almost 46 percent of the population)
lack access to electricity and about 730
million lack access to clean fuels and fa-
cilities for cooking, according to IEA and
World Bank statistics. There is, however, a
varied regional picture: while North Africa
Fighting Energy Povertyis a Necessity
has 99 percent electricity access rate, the
situation by far remains low in West Africa
(52 percent), Southern Africa (48 percent),
East Africa (37 percent) and Central Africa
(27 percent) as of 2018. As at the end of
0
20
40
60
80
100
Figure 2: Population access to electricity, 2018 % of population
Alge
ria
Ango
la
Beni
n
Bots
wan
a
Burk
ina
Faso
Buru
ndi
Cabo
Ver
de
Cam
eroo
n
Cent
ral A
frica
n Re
publ
ic
Chad
Com
oros
Cong
o D
em. R
ep.
Cong
o Re
p.
Cote
d’Iv
oire
Djib
outi
Egyp
t
Equa
toria
l Gui
nea
Eritr
ea
Ethi
opia
Gab
on
Gam
bia
Gha
na
Gui
nea
Gui
nea-
Biss
au
Keny
a
Esw
atin
i
Libe
ria
Liby
a
Mad
agas
car
Mal
awi
Mal
i
Mau
ritan
ia
Mau
ritiu
s
Mor
occo
Moz
ambi
que
Nam
ibia
Nig
er
Nig
eria
Rwan
da
Sao
Tom
e an
d Pr
inci
pe
Sene
gal
Seyc
helle
s
Sier
ra L
eone
Som
alia
Sout
h Af
rica
Sout
h Su
dan
Suda
n
Tanz
ania
Togo
Tuni
sia
Uga
nda
Zam
bia
Zim
babw
e

www.energychamber.org 91
2019, the electrification rate in some African
countries, including Chad, Burundi, Liberia,
Niger, DR Congo and Malawi was as low as
10–20 percent (Figure 2: population access
to electricity). In addition, most of the rural
population in Africa continues to rely on
traditional biomass and waste (principally
firewood, charcoal, and crop residues) for
meeting their domestic needs, deepening
energy poverty and health inequalities.
This is a challenge that the continent must
adequately address to lift people out of
poverty by creating sustainable livelihood
opportunities, catalysed by the availability
of cleaner forms of energy and natural gas.
Alge
ria
Ango
la
Beni
n
Bots
wan
a
Burk
ina
Faso
Buru
ndi
Cabo
Ver
de
Cam
eroo
n
Cent
ral A
frica
n Re
publ
ic
Chad
Com
oros
Cong
o D
em. R
ep.
Cong
o Re
p.
Cote
d’Iv
oire
Djib
outi
Egyp
t
Equa
toria
l Gui
nea
Eritr
ea
Ethi
opia
Gab
on
Gam
bia
Gha
na
Gui
nea
Gui
nea-
Biss
au
Keny
a
Esw
atin
i
Libe
ria
Liby
a
Mad
agas
car
Mal
awi
Mal
i
Mau
ritan
ia
Mau
ritiu
s
Mor
occo
Moz
ambi
que
Nam
ibia
Nig
er
Nig
eria
Rwan
da
Sao
Tom
e an
d Pr
inci
pe
Sene
gal
Seyc
helle
s
Sier
ra L
eone
Som
alia
Sout
h Af
rica
Sout
h Su
dan
Suda
n
Tanz
ania
Togo
Tuni
sia
Uga
nda
Zam
bia
Zim
babw
e
Average Access Rate
55%
Putting Power at the Centre of Africa’s Economic and Industrial Revival
Data source: World Bank 2020

92African Energy Outlook 2021
African Energy Chamber92
Africa remains among the least CO2 (and other
greenhouse gases) emitters in the world. The con-
tinent emitted 1,308 Million tonnes of CO2 in 2019,
representing a 2 percent growth in the decade be-
tween 2008-18, and representing only 2 percent
to the global energy-stimulated CO2 emissions.
However, the impacts of climate change are being
felt, and they are unevenly distributed across the
continent in the form of drought-induced conditions
and reduced rainfall for hydroelectric power gener-
ation, among others.
Already, some variations in rainfall patterns have al-
tered the viability of installed hydropower plants in
several countries, notably Zambia and Zimbabwe. Hy-
dro-based electricity generation has provided base-
load power with low running costs for many countries
in Africa over the years. In about 11 countries, large hy-
dro (at least 50MW capacity) has accounted for about
50 percent total installed generation.
As we advance, the Chamber notes that hydropower
capacity factors will be impacted by climate change,
making it a serious concern for the reliability of elec-
tricity supply. Studies indicate that hydropower plants
in Ethiopia, Ghana, Sudan, Morocco and Egypt will
experience fluctuations for decades even after 2050.
However, the degree of variability or change is linked
to the GHG concentrations and will vary across coun-
tries, requiring a tailored approach in each state. As
a result, we still note several ongoing and planned
hydropower projects (estimated at more than 15 GW).
Along with a commitment to low-carbon transitions
and universal energy access, the share of hydro is
predicted to increase by 7.5 percent (by 2025) and
reach 23 percent share by 2040.
Climate Change Poses a Threat to Baseload Hydropower
92African Energy Outlook 2021
African Energy Chamber92
www.energychamber.org 93
Africa’s gas industry holds enormous potential.
The continent was estimated to have between
527-558 trillion cubic feet (Tcf ) of gas as at the
end of 2019, making Africa the fourth-largest gas
reserves holder in the world after North America
(7.5 percent of proven global reserves), according
to BP and OPEC statistics. Over 90 percent of all
recent gas discoveries in Africa were made by
nascent players like Mozambique, Tanzania, Mau-
ritania and Senegal. The Chamber believes that
these changes highlight a potential new age for
gas supply diversification in Africa as several new
producers come on board.
Gas-to-Power is Key to Unlocking Africa’s Industrialization
Putting Power at the Centre of Africa’s Economic and Industrial Revival
Although the continent’s ‘old guards’ in the hydro-
carbon industry like Algeria (159 Tcf), Egypt (78 Tcf),
Libya (53 Tcf) and Nigeria (203Tcf) still account for sig-
nificant (89 percent) gas reserves, it is worth noting
that discoveries from the new entrants (‘new guards’)
would potentially account for a more significant share
of actual usage by 2030. Of all gas produced in Af-
rica in 2019, 3.6 Tcf (40 percent) was exported while
another 5.3 Tcf (60 percent) was consumed domes-
tically, mostly for power production. The largest con-
sumption (demand) countries are Algeria, Egypt, Ni-
geria and South Africa and significant scope remains
to increase gas demand across sub-Saharan Africa.
Gas-to-Power: the Ideal Pillar to Africa’s Energy Transition
This decline in consumption is, however, not the
case in Africa as increased gas discoveries and low-
er production costs will make gas the primary fuel
of choice in power generation. The continent has
embraced natural gas as a primary fuel for electricity
generation. The Chamber assesses this trend is like-
ly to continue until the 2030s, subject to the avail-
ability of supporting infrastructure and monetisation
options in several countries. A closer look at Africa’s
electricity generation mix over the past five years
shows a dominant and strong appeal for natural gas
as the preferred fuel for electricity generation.
With an expanded pipeline network in West, East and
Southern Africa, regional gas movements could more
than double by 2030, further displacing coal in some
markets. The main challenge for Africa in the next de-
cade is its ability to increase gas supply as the primary
fuel in electricity generation to increase electricity ac-
cess and productive economic uses of electricity. Ensur-
ing the reliability of power supply and reducing electrici-
ty generation costs depends mainly on Africa’s ability to
navigate infrastructure and affordability challenges. For
example, South Africa’s state utility ESKOM will require
a reliable and constant supply of gas, most likely from
Mozambique or newly-discovered domestic fields, as
it plans to phase out coal power and resolve electricity
challenges that have led to crippling load shedding in
the country. In West Africa, Nigeria can export additional
gas to several coastal countries in the Gulf of Guinea re-
gion up to Cote d’Ivoire if the West African Gas Pipeline
(WAGP) is extended beyond Takoradi in Ghana.

94African Energy Outlook 2021
African Energy Chamber94
World proven natural gas reserves by
geographical grouping (Tcf)
World marketed production of natural
gas by geographical grouping (Bcf)Key
Latin America
270
338
1368
6889
1211
270
Western Europe
263
3867
84729278
18092
1697715454
9975
7481
96
NorthAmerica
40455
237
3851
25721
36012
3642
7334
572
Dashboard 2:
World Natural Gas2000-2019Reserves, production, export, import and demand
Data Source: IEA
Africa
61
432
4524

www.energychamber.org 95
Western Europe 18092
16977
96
Putting Power at the Centre of Africa’s Economic and Industrial Revival
World natural gas exports by
geographical grouping (Bcf)
World natural gas imports by
geographical grouping (Bcf)
World natural gas demand by
geographical grouping (Bcf)
Asia &Pacific
414
3572
9236
10034
23170
30047
529
2 774
14076
EasternEurope & Eurasia
1869
4768
7975
21402
24609
13054
32846
2402
4267
Middle East
1385
5996
24760
7381
6778
284
Africa
61
432
4524
450
558
3659
5282
8899
96African Energy Outlook 2021
African Energy Chamber96
Regulatory Reforms and Regionalisation Must Become Priorities
Regulatory reforms aim to ensure quality
and reliable power supply, improve the
financial and operational performance
of utilities in the sector and ensure pri-
vate sector participation. Most African
countries have established indepen-
dent energy sector regulators. In 2019,
the average Electricity Regulatory Index
(ERI) score was 0.572 for thirty-four Afri-
can countries, indicating a medium level
of regulatory development. That is, there
exists a supportive regulatory frame-
work, but implementation is constrained
by legal and institutional gaps, including
low regulatory capacity. At a respective
country level, Uganda had the highest
ERI score of 0.748 while Liberia scored
the lowest ERI score of 0.267. However,
African reforms continue to face internal and external threats
no country in Africa has so far reached a
score of 0.8, which is the optimal level.
Key threats in the regulatory reform are
shown in the figure below. Internally,
(1) the unpredictability of the tariffs and
non-reflective end-user tariffs in the
overall transmission investment portfo-
lio leads to a considerable sector cash
deficit; (2) some regulatory reforms cre-
ate room for renegotiation of conces-
sions contract and often cause undue
pressure on independent power pro-
ducers, curtailing further investment;
and (3) poor governance, pressure from
labour unions and macroeconomic is-
sues have hindered critical energy sec-
tor reforms in several African countries.
Externally, climate change, a non-Africa
centric demand for energy transition
and extreme weather events pose a
growing threat to the continents power
market, making it increasingly vulnera-
ble regarding the security of supply. Ac-
cess to finance is another major threat
to the power sector in Africa.
Lack of access to funding such con-
cessional loans to meet the needs of
universal energy access delays the
development of infrastructure. Similarly,
political instability delays the develop-
ment of regional markets, regional reg-
ulators, power pools and cooperation
amongst the member countries in initi-
ating cross-border projects.

www.energychamber.org 97
Internal Threats External Threats
Non-cost reflective end-user tariffs in the overall
transmission investment portfolio leads to a con-
siderable sector cash deficit
Regulatory reforms create room for renegotiation
of concessions and may sometimes cause undue-
fiscal burden on IPPs
Standard reforms models do not explicitly link the
provision of electricity to economic welfare needs
Climate change
Access to adequate finance
Inadequate infrastructure
Slow development of regional regulatorsand re-
gional power pools
non-Africa centric demand for energy transition
Putting Power at the Centre of Africa’s Economic and Industrial Revival
www.energychamber.org 97
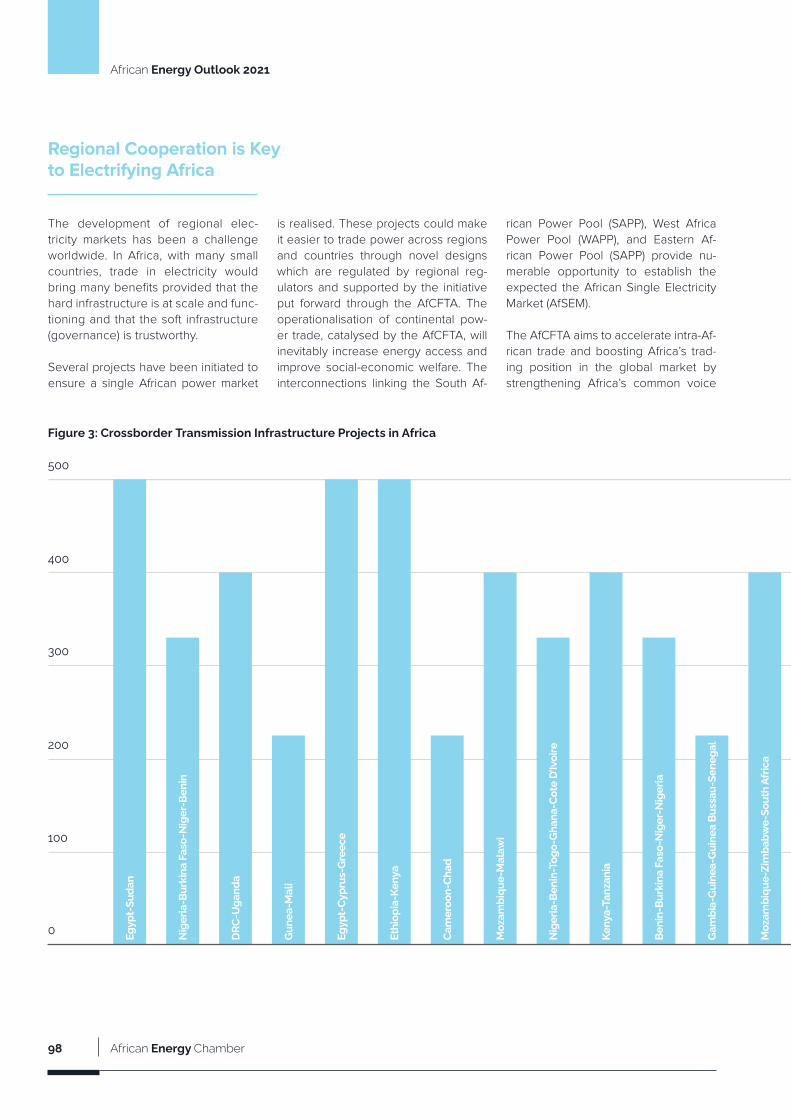
98African Energy Outlook 2021
African Energy Chamber98
Regional Cooperation is Keyto Electrifying Africa
0
100
200
300
400
500
Figure 3: Crossborder Transmission Infrastructure Projects in Africa
The development of regional elec-
tricity markets has been a challenge
worldwide. In Africa, with many small
countries, trade in electricity would
bring many benefits provided that the
hard infrastructure is at scale and func-
tioning and that the soft infrastructure
(governance) is trustworthy.
Several projects have been initiated to
ensure a single African power market
is realised. These projects could make
it easier to trade power across regions
and countries through novel designs
which are regulated by regional reg-
ulators and supported by the initiative
put forward through the AfCFTA. The
operationalisation of continental pow-
er trade, catalysed by the AfCFTA, will
inevitably increase energy access and
improve social-economic welfare. The
interconnections linking the South Af-
rican Power Pool (SAPP), West Africa
Power Pool (WAPP), and Eastern Af-
rican Power Pool (SAPP) provide nu-
merable opportunity to establish the
expected the African Single Electricity
Market (AfSEM).
The AfCFTA aims to accelerate intra-Af-
rican trade and boosting Africa’s trad-
ing position in the global market by
strengthening Africa’s common voice
Egyp
t-Su
dan
Nig
eria
-Bur
kina
Fas
o-N
iger
-Ben
in
DRC
-Uga
nda
Gun
ea-M
ali
Egyp
t-Cy
prus
-Gre
ece
Ethi
opia
-Ken
ya
Cam
eroo
n-Ch
ad
Moz
ambi
que-
Mal
awi
Nig
eria
-Ben
in-T
ogo-
Gha
na-C
ote
D’Iv
oire
Keny
a-Ta
nzan
ia
Beni
n-Bu
rkin
a Fa
so-N
iger
-Nig
eria
Gam
bia-
Gui
nea-
Gui
nea
Buss
au-S
eneg
al
Moz
ambi
que-
Zim
babw
e-So
uth
Afric
a
Gha
na-B
urki
na F
aso
Cote
d’Iv
oire
-Lib
eria
-Sie
rra
Leon
e-G
uine
a
Zam
bia-
DRC
Zam
bia-
Tanz
ania
-Ken
ya
Nig
eria
-Ben
in
Uga
nda-
Sout
h Su
dan
Mau
ritan
ia-S
eneg
al
Keny
a-Et
hiop
ia
Nig
eria
-Ben
in
Buru
ndi-D
RC-K
enya
-Rw
anda
-Uga
nda
Zim
babw
e-Za
mbi
a-Bo
tsw
ana-
Nam
ibia
Nig
er-N
iger
ia
Zam
bia-
Mal
awi
Gha
na-T
ogo-
Beni
n

www.energychamber.org 99
Egyp
t-Su
dan
Nig
eria
-Bur
kina
Fas
o-N
iger
-Ben
in
DRC
-Uga
nda
Gun
ea-M
ali
Egyp
t-Cy
prus
-Gre
ece
Ethi
opia
-Ken
ya
Cam
eroo
n-Ch
ad
Moz
ambi
que-
Mal
awi
Nig
eria
-Ben
in-T
ogo-
Gha
na-C
ote
D’Iv
oire
Keny
a-Ta
nzan
ia
Beni
n-Bu
rkin
a Fa
so-N
iger
-Nig
eria
Gam
bia-
Gui
nea-
Gui
nea
Buss
au-S
eneg
al
Moz
ambi
que-
Zim
babw
e-So
uth
Afric
a
Gha
na-B
urki
na F
aso
Cote
d’Iv
oire
-Lib
eria
-Sie
rra
Leon
e-G
uine
a
Zam
bia-
DRC
Zam
bia-
Tanz
ania
-Ken
ya
Nig
eria
-Ben
in
Uga
nda-
Sout
h Su
dan
Mau
ritan
ia-S
eneg
al
Keny
a-Et
hiop
ia
Nig
eria
-Ben
in
Buru
ndi-D
RC-K
enya
-Rw
anda
-Uga
nda
Zim
babw
e-Za
mbi
a-Bo
tsw
ana-
Nam
ibia
Nig
er-N
iger
ia
Zam
bia-
Mal
awi
Gha
na-T
ogo-
Beni
n
Putting Power at the Centre of Africa’s Economic and Industrial Revival
and policy space in international trade
negotiations. The agreement also aims
to remove non-tariff barriers by creating
a single market of about 1.2 billion per-
sons for trading in goods and service.
AfCTA encompasses both top-bottom
and bottom-up approach in support-
ing regulation at the regional level.
Through its support, coordination of
policies, harmonisation of regulations
and, to the extent possible, harmonisa-
tion of legal institutions can be realised,
hence deepening regional integration.
Through the AfCFTA, cross-border
power trade can be enhanced through
the effort made to spearhead the de-
velopment of a regulatory and legal
framework to establish a single and
liberalised market for goods, persons,
capital and services. This also opens
opportunities for innovative ways to
finance cross-border power transmis-
sion infrastructure. One such novel
approach could be to introduce pub-
lic-private partnerships (PPPs) in financ-
ing cross-country and cross-regional
transmission networks. These models,
though new in Africa, could significantly
contribute to the faster development of
power markets and give opportunities
to the private sector to participate in
the otherwise monopoly subsector.
Data Source: IEA

100African Energy Outlook 2021
African Energy Chamber100
Adressing Africa’s Growing Funding Requirements
Africa’s power markets have been funded by var-
ied sources. These include equity-debt mix linked to
contractual offtake arrangements, non-recourse debt,
credit enhancement schemes, and developer techni-
cal assistance, among others. Other sources of funding
power infrastructure include Sovereign wealth funds,
Africa50
AfricanDevelopment
Bank
ATIAfrican Trade
Insurance Agency
Eastern and Southern
Africa Trade & Development
Bank
World Bank Group
Canada
EU
France
Japan
Two transmission projects totalling 500 kilometres in Africa
US$4.5 billion to advance power generation investment and transmis-
sion. It is also supporting policy reforms, advisory services and provid-
ing financial guarantees for power projects on the continent.
Developing 400 MW energy generation in 13 ATI members countries
Providing US$400 million power sector
investments in the COMESA region
Investing US$5 billion in the energy sector by 2024 as follows:
• Adding 3.3 GW-hours of energy storage;
• Supporting 60 million new connections by 2030;
• Adding 5,000 kilometres (km) of transmission line infrastructure
constructed or rehabilitated by 2030
• Supporting 30,000 MW of new energy generation by 2030.
Pledge of US$150 million and deepen coordination on the implementa-
tion of commitments under the Africa Renewable Energy Initiative (AREI).
€2.5 billion (US$2.8 billion) of financing for sustainable energy activi-
ties by 2025.
US$2.15 billion funding in support of Power Africa through the Africa Re-
newable Energy Initiative (AREI).
Finance 1,000 km of transmission lines.
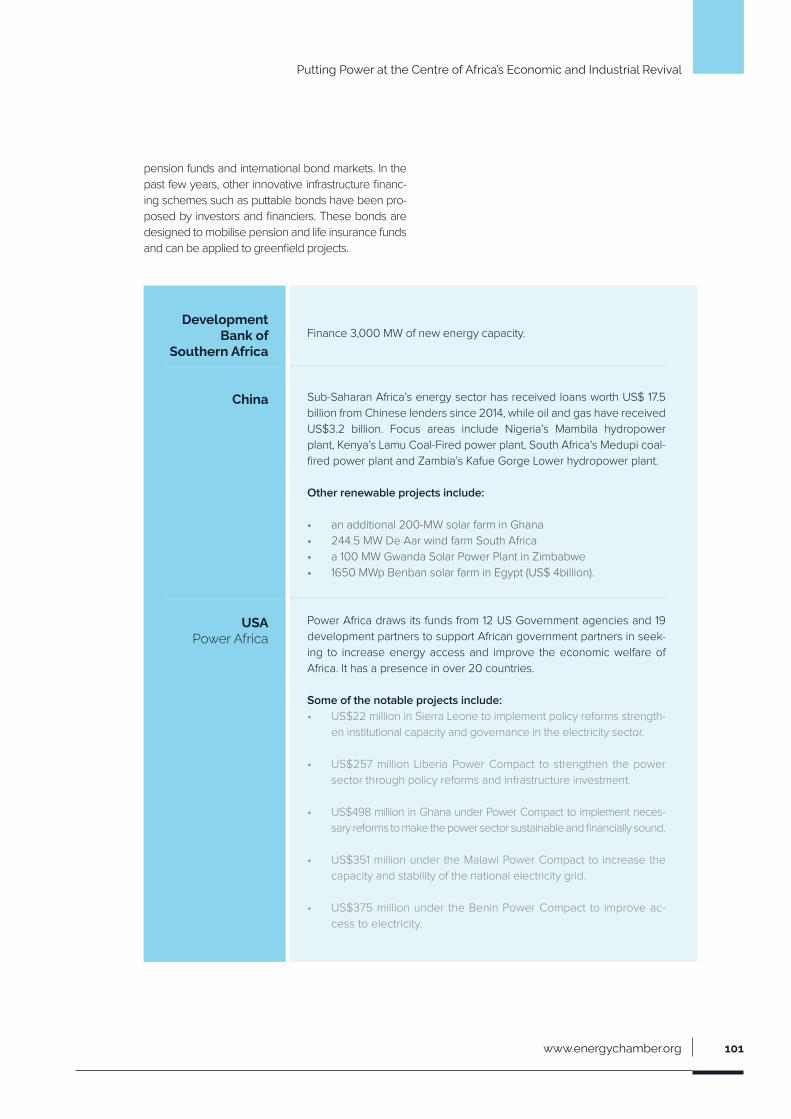
www.energychamber.org 101
Development Bank of
Southern Africa
China
USAPower Africa
Finance 3,000 MW of new energy capacity.
Sub-Saharan Africa’s energy sector has received loans worth US$ 17.5
billion from Chinese lenders since 2014, while oil and gas have received
US$3.2 billion. Focus areas include Nigeria’s Mambila hydropower
plant, Kenya’s Lamu Coal-Fired power plant, South Africa’s Medupi coal-
fired power plant and Zambia’s Kafue Gorge Lower hydropower plant.
Other renewable projects include:
• an additional 200-MW solar farm in Ghana
• 244.5 MW De Aar wind farm South Africa
• a 100 MW Gwanda Solar Power Plant in Zimbabwe
• 1650 MWp Benban solar farm in Egypt (US$ 4billion).
Power Africa draws its funds from 12 US Government agencies and 19
development partners to support African government partners in seek-
ing to increase energy access and improve the economic welfare of
Africa. It has a presence in over 20 countries.
Some of the notable projects include:
• US$22 million in Sierra Leone to implement policy reforms strength-
en institutional capacity and governance in the electricity sector.
• US$257 million Liberia Power Compact to strengthen the power
sector through policy reforms and infrastructure investment.
• US$498 million in Ghana under Power Compact to implement neces-
sary reforms to make the power sector sustainable and financially sound.
• US$351 million under the Malawi Power Compact to increase the
capacity and stability of the national electricity grid.
• US$375 million under the Benin Power Compact to improve ac-
cess to electricity.
pension funds and international bond markets. In the
past few years, other innovative infrastructure financ-
ing schemes such as puttable bonds have been pro-
posed by investors and financiers. These bonds are
designed to mobilise pension and life insurance funds
and can be applied to greenfield projects.
Putting Power at the Centre of Africa’s Economic and Industrial Revival

102African Energy Outlook 2021
African Energy Chamber102
What the Energy TransitionMeans for Africa’s Power Sector
The energy transition refers to the trans-
formation of the global energy sector
from fossil-based production and con-
sumption of fuels such as oil, natural
gas and coal to zero-carbon emission
fuels by 2050. This is primarily driven
by the need to reduce CO2 emissions
from energy sources or decarbonising
the energy sector to contain the nega-
tive impacts of climate change. It entails
increasing renewable and clean energy
sources such as solar, wind, geothermal
and water, among others into the ener-
gy supply mix. At the core is a need limit
the increase in global average tempera-
tures to well below 2°C above pre-in-
dustrial levels while pursuing efforts
to limit global warming to 1.5°C above
pre-industrial levels. This, encapsulated
in the Paris Agreement, was adopted by
195 nations at the 21st Conference of the
Parties (COP21) in December 2015.
CO2 emissions from energy sources
including from power generation, have
risen by an average of 1 percent per
annum since 2010, according to IRENA
data. This is notwithstanding the fact
that the COVID-19 pandemic and as-
sociated economic slump temporarily
suppressed emissions in 2020. Global
emissions are forecasted to rebound
over the medium term from 2021 as sev-
eral economies open once again on the
prospect of a COVID-19 vaccine becom-
ing widely available for the global pop-
ulation. It remains likely that the world
may not be able to meet the minimum
2°C pathway by 2050 if the current
business-as-usual or stated policies
scenario, are continued without radi-
cal or aggressive change in approach.
The primary enablers or drivers for the
energy transition at a global level will
be increasing renewable energy sup-
ply, electrification and improvements
in energy storage, all geared towards
significantly cutting CO2 emissions.
IRENA’s forecasts indicate that about
65 percent of total final energy use will
be met by renewables in 2050 while
about 86 percent of electricity gener-
ation will also come from RE sources
of which 60 percent of electricity to be
supplied by solar PV and wind.
Energy Transition presents challenges
as well as opportunities for Africa. One
challenge is that several of Africa’s hy-
drocarbon resources, particularly oil,
are unlikely to be developed as initial-
ly planned. Many international banks
for example, in response to pressure
groups promoting an aggressive decar-
bonization push are retreating from fi-
nancing the development of oil and gas
projects in Africa. This would significantly
reduce government revenues, especial-
ly for the less diversified commodity-de-
pendent economies. This is also due to
the declining share of oil in the global
energy demand by 2050 (decarbonised
world) if the 2°C pathway is aggressively
pursued. On the other hand, the energy
transition in Africa presents an opportu-
nity to emphasise energy security (ac-
cess) and energy poverty (affordability).
This encompasses: (1) increasing the use
of Africa’s natural gas for domestic pow-
er generation and LNG exports given the
potential declining share of oil in global
energy demand by 2050; (2) increasing
the RE share of the generation mix; and
(3) pursuing decentralised off-grid ener-
gy initiatives. Hence, policy responses
by governments and investment inflows
into the continent’s power sector will be
driven by these considerations in addi-
tion to others such as post-pandemic
economic diversification.
To bridge the energy access gap in
Africa, governments will require a
successful mix of strategies that in-
tegrate grid extension and improve-
ment, mini-grids and standalone gen-
erating systems. Kenya for example,
has announced grid extensions to pro-
vide 299,601 connections at the cost of
US$382 million by 2022 when the coun-
try plans to achieve universal access.
Off-grid renewable energy options, no-
tably standalone systems and mini-grids
are projected to see strong sustained
growth in the coming decade, in re-
sponse to demand for energy in areas
unlikely to be serviced by national grids.
Towards 2030, standalone systems and
mini grids could provide almost 50 per-
cent of the new electricity access as
this represents the least cost solution to
connect about 450 million (41 percent of
the population) people on the continent.

www.energychamber.org 103
The relevance of mini grids in address-
ing the access challenge is spurred
on by the increasing competitiveness
of solar and battery storage, not for-
getting improved energy efficiency of
appliances. Key markets for mini-grid
development include Ethiopia, Nigeria,
Tanzania, Uganda and Kenya.
Undoubtedly, the post-COVID econom-
ic environment globally further compli-
cates the access to finance challenge.
Owing to the heightened importance
that the COVID-19 pandemic has put on
access to affordable and reliable energy,
short to medium term recovery planning
by most governments is highly likely to
prioritise expanding access to areas the
grid is yet to reach to reduce vulnerabil-
ity and improve resilience. For example,
Nigeria’s government has detailed in its
2020 Economic Sustainability Plan a so-
lar power strategy that it seeks to install
five (5) million solar-home systems and
mini-grids for communities and health
clinics. The recovery plan also states a
commitment to support private installers
with low-cost financing and a require-
ment for solar equipment manufacturers
to create additional job opportunities by
setting up production facilities in Nigeria.
Emerging disruptor technologies
Technology will continue to play an in-
creasingly important role in the African
energy sector. Digital technologies like
the internet of things (IoT), artificial intel-
ligence (AI), big data, and blockchain are
being developed globally to meet spe-
cific demands imposed by an increas-
ingly complex future power system.
These digital technologies are expect-
ed to affect how power is consumed
and supplied globally, including in Africa.
The granularity of information available
to organisations such as utilities will
increasingly be used in fashioning how
goods and services are produced and
marketed to consumers. For the power
sector in Africa, these technologies have
the potential to enhance the economics
of off-grid solutions, inform infrastructure
planning and support grid operations.
In Africa, mobile connectivity, coupled
with the use of mobile money, has cre-
ated opportunities to improve electric-
ity access by leveraging mobile IoT. At
present, providers of electricity via solar
home systems and microgrids leverage
mobile IoT for accurate metering and bill-
ing of consumers as well as collecting
data about power supply and demand.
The use of mobile IoT is likely to grow as
millions gain access to electricity towards
2030. Although many African countries
acknowledge the importance of mod-
ernising the grid and improving system
flexibility through smart grids, the high
costs and degree of market develop-
ment will be a barrier in the next decade.
Sola
r Hom
e Sy
stem
s
Min
igrid
s
Grid
Ext
entio
ns
45 29 109
123
92 78
Capital Expenditure 2020-2030 | Billion USD
Million Households Connected
www.energychamber.org 103
Putting Power at the Centre of Africa’s Economic and Industrial Revival
Data source: Bloomberg NEF
Figure 4: Technology use andcapital expenditure to attainuniversal access by 2030

104African Energy Outlook 2021
African Energy Chamber104
Power Sector Investment Outlook
The EIA estimates indicate that annual
energy investment needs in Africa will
have to increase by 100 percent from
the current USD 60 billion per annum
(1.8 percent of the continents GDP) to
USD 120 billion (2.4 percent of GDP) in
order to attain universal access (Dash-
board 3). This will go into both expand-
ing generation capacity and upgrading
the electricity network. This is corrobo-
rated by the IEA estimates, which indi-
cate that annual power supply invest-
ments would need to increase to USD
120 billion per year until 2040.
COVID-19 has negatively impacted Af-
rican economies across the board; this
includes both commodities exporting
ones and largely diversified ones. One
impact of COVID-19 is the decline in
electricity demand due to decreased
industrial activity. Additional responses
undertaken to mitigate the impact of
the pandemic on the continent include
the provision of free electricity, waiver
of bill payments, and VAT exemptions
on electricity bills, among others.
However, the Chamber assesses
these measures to be short termist,
and the focus should be on the eco-
nomic stimulus that would propel the
investment in the power sector. Indica-
tors such as the reopening of several
economies point to the fact that invest-
ment flows are highly likely to pick up
in 2021 driven by the fundamental
need to electrify the continent which
will, in turn, deepen energy access,
and reduce poverty and inequality.
African countries have a historical op-
portunity to coordinate their post-pan-
0
20
40
60
80
100
120
2018 Stated Policies Africa CaseExpanded
Generation
Electricity Network
Africa annual power investment needs(USD billions)
Data Source: EIA 2018
demic recovery initiatives to increase
their efforts in achieving SDG 7 goals.
This implies building more robust and
efficient energy infrastructure systems as
well as implementing decentralised ener-
gy solutions using both natural gas and
renewable energy sources. Natural gas
has the ability not only to meet baseload
capacity needs of the region but also as
a complement to hydro in the short term.
However, because the cost advantage of
gas as a natural baseload for power gen-
eration depends entirely on the location
of gas power generation and its distance
from gas supplies, investments in pipe-
line infrastructure are very much needed.
Some of the key measures to mitigate
the impact of COVID-19 and to initiate a
robust recovery plan include prioritising
the development of natural gas and re-
newable energy, the adoption of realistic
market driven and cost reflective tariffs,
and the leveraging the AfCTA so the
private sector can invest in the regional
power projects and pools.

www.energychamber.org 105
2019
SDS 2025-2030
0
5
10
15
20
25
Africa power generation investment in 2019 compared with annual investment needs in the Sustainable Development Scenario2025-2030 (USD billions)
Fossil fuels without carbon capture, utilsa-
tion and storage
Gro
wth
Ra
te-5
7%
Gro
wth
Ra
te2
80
0% G
row
th R
ate
175
%
Nuclear Solar PV and Wind
Hydro and other
renewables
30
Putting Power at the Centre of Africa’s Economic and Industrial Revival
Data Source: IEA 2019


www.energychamber.org 107
At the African Energy Chamber, we believe that deal-making is all about relationships. The Chamber boasts an unmatched capability to bring together key stakeholders in industry, government and with a clear focus on forging new ground in africa’s energy sector. in this feature, we profile some of the key individuals and organisations that we expect to see at the forefront of our industry in 2021.
v
Movers& Shakers to Watch
1.NICOLAS TERRAZPresident for AfricaTotal Exploration & production
In charge of Total’s upstream portfolio
across Africa, Nicolas Terraz is expected
to deliver on a lot of historic firsts for the
continent, including bringing Uganda’s
Tilenga project to financial close and to
first oil, building a 1,443km pipeline to
Tanzania, and ensuring that the conti-
nent’s biggest ongoing LNG project gets
executed on time and on budget in Mo-
zambique. Meanwhile, Total is anticipat-
ed to deliver on three high-impact wells
in South Africa, Namibia and Angola. Will
he be able to face current headwinds
and deliver on expectations in each of
these frontier markets?
www.energychamber.org 107

108African Energy Outlook 2021
African Energy Chamber108
When he assented to the Deep Off-
shore and Inland Basin Production
Sharing Contract (Amendment) Act
in late 2019, President Muhammadu
Buhari put in jeopardy billions of dol-
lars of investments into Nigerian deep
water fields. However, strong political
will to support the Nigerian economic
recovery could translate in 2021 into
the passing, adoption and signing of
the long-awaited Petroleum Industry
Bill (PIB). As a result, President Buhari’s
ability to rally stakeholders and push
for much-needed reforms could actual-
ly inaugurate the start of a new era for
Nigeria’s energy industry in 2021.
LUKOIL is one of Russia’s most inter-
national energy companies with in-
vestments all across the world and a
growing investment portfolio in Africa.
As Russia commits to grow its presence
across the continent, LUKOIL could be
a next major investor for Africa’s up-
stream and infrastructure industries.
The company is already participating
in key projects such as Cameroon’s
Etinde development, and its recent ac-
quisition of Cairn Energy’s stake in Sen-
egal’s Sangomar oil project, though un-
successful, showed a strong appetite
for investing in African hydrocarbons.
Where will Vagit Alekperov invest next?
5.VAGIT ALEKPEROVPresidentand CEOPJSC LUKOIL
2.MUHAMMADU BUHARIPresidentFederal Republic of Nigeria
3.YURYSENTURYINSecretary-GeneralGECF
6.FÉLIX ANTOINETSHISEKEDITSHILOMBOPresidentDemocratiRepublic of Congo
4.GUIDOBRUSCOUpstream DirectorEni
7.TONYATTAHManagingDirector/CEONigeria LNG
As Africa turns to natural gas to pow-
er its industries and generate revenue
for its economies, the role of global or-
ganisations such as the Gas Exporting
Countries Forum (GECF) is set to take
a more prominent place. In November
2019, the Declaration of Malabo reaf-
firmed the GECF’s resolve to promote
natural gas as an affordable, abundant
and reliable source of energy by en-
couraging the expansion of natural gas
utilization domestically and internation-
ally. As more African nations start ex-
porting LNG and seek to attract capital
into gas infrastructure, will the GECF
prove to be an efficient catalyst to sup-
port Africa’s gas revolution?
In charge of Total’s upstream portfolio
across Africa, Nicolas Terraz is expect-
ed to deliver on a lot of historic firsts for
the continent, including bringing Ugan-
da’s Tilenga project to financial close
and to first oil, building a 1,443km pipe-
line to Tanzania, and ensuring that the
continent’s biggest ongoing LNG proj-
ect gets executed on time and on bud-
get in Mozambique. Meanwhile, Total is
anticipated to deliver on three high-im-
pact wells in South Africa, Namibia and
Angola. Will he be able to face current
headwinds and deliver on expectations
in each of these frontier markets?
Eni’s former Executive Vice President
for Sub-Saharan Africa now manages
the global upstream portfolio of the Ital-
ian major and will have strategic deci-
sions to make on rationalising the com-
pany’s upstream spend. From Egypt all
the way down to Angola, Eni is one of
Africa’s major international player and
sits on strategic fields and acreages
from Zohr in Egypt, OCTP in Ghana,
Area 4 in Mozambique, onshore gas-
rich licenses in Nigeria and Block 15/06
in Angola. As the company enters the
global energy transition, the impact the
move has on its upstream develop-
ments in Africa could shape the conti-
nent’s E&P industry for years.
As the head of Nigeria LNG, Tony Attah
is currently piloting one of Africa’s most
strategic liquefied natural gas (LNG)
projects, NLNGSevenPlus. Its plans
notably include a $6.5bn project con-
sisting of a new 4.2 mtpa Train 7 and
the debottlenecking of existing trains
to add a further 3.4 mtpa of LNG lique-
faction and export capacity to sub-Sa-
haran Africa’s biggest LNG export
terminal. The execution of the project
has the power to support Nigeria’s
economic recovery and local content
development, while further positioning
NLNG as an African gas success story.

www.energychamber.org 109
8.JOÃOLOURENÇOPresidentRepublicof Angola
11.HRH PRINCEABDUL AZIZ BIN SALMANMinister of EnergyHead of OPECDelegation
9.ABBASMAHAMAT TOLLIGovernorBank of theCentral AfricanStates (BEAC)
12.BENOÎT DE LA FOUCHARDIERECEOPerenco
10.MELE KOLOKYARIGroup ManagingDirector,Nigerian NationalPetroleumCorporation (NNPC)
13.REBECCA MIANOCEOKenya ElectricityGeneratingCompany PLC(KenGen)
President João Lourenço’s direct in-
volvement in reforming and reviving
Angola’s oil & gas sector is bearing
fruits. His presidential decrees have
made lots of difference over the past
three years for operators and inves-
tors, and provided the right enabling
environment to make Angola a com-
petitive African jurisdiction to invest in.
As Angola recovers from the Covid-19
pandemic and yet another economic
crisis, President Lourenço’s leadership
is more important than ever to further
support sector recovery and boost lo-
cal content development.
LUKOIL is one of Russia’s most inter-
national energy companies with in-
vestments all across the world and a
growing investment portfolio in Africa.
As Russia commits to grow its presence
across the continent, LUKOIL could be
a next major investor for Africa’s up-
stream and infrastructure industries.
The company is already participating
in key projects such as Cameroon’s
Etinde development, and its recent ac-
quisition of Cairn Energy’s stake in Sen-
egal’s Sangomar oil project, though un-
successful, showed a strong appetite
for investing in African hydrocarbons.
Where will Vagit Alekperov invest next?
Abbas Mahamat Tolli overseas the mon-
etary policy over Central African states,
including Cameroon, Central African Re-
public, Congo-Brazzaville, Gabon, Equa-
torial Guinea and Chad. All these nations
are heavily dependent on oil & gas to fuel
economic recovery post-Covid19. Howev-
er, strict foreign exchange regulations im-
posed by the Bank of the Central African
States (BEAC) have severely and nega-
tively impacted the attractiveness of these
countries for foreign investment. Will Ab-
bas Mahamat Tolli open up to public and
private sector calls to reform the region’s
foreign exchange policy and bring back
much-needed investors in the region?
While relatively discrete, the
French-British independent Perenco
pilots strategic assets and projects
across Central Africa. More important-
ly, the company’s focus on strategic
gas developments in countries such
as Cameroon, Gabon or the Demo-
cratic Republic of Congo could just be
what the region need to diversify away
from oil and develop a robust natural
gas value chain. Benoît de la Fouchar-
diere’s leadership will thus have long-
term implications for the gas and LNG
industry of Central Africa: can Perenco
become the investor the region needs
to unlock its natural gas potential?
At the head of one of Africa’s biggest
national oil companies, Mele Kolo
Kyari is expected to remain one of the
industry’s leading figures in 2021 and
beyond. As the Nigerian National Pe-
troleum Corporation (NNPC) embarks
on several strategic programmes and
projects to boost refining capacity, cut
upstream operational costs, develop
energy infrastructure and unlock Ni-
geria’s gas potential, Mele Kolo Kyari’s
actions and decisions can profound-
ly impact the short and medium-term
outlook for Africa’s biggest oil & gas
producing country.
LUKOIL is one of Russia’s most inter-
national energy companies with in-
vestments all across the world and a
growing investment portfolio in Africa.
As Russia commits to grow its presence
across the continent, LUKOIL could be
a next major investor for Africa’s up-
stream and infrastructure industries.
The company is already participating
in key projects such as Cameroon’s
Etinde development, and its recent ac-
quisition of Cairn Energy’s stake in Sen-
egal’s Sangomar oil project, though un-
successful, showed a strong appetite
for investing in African hydrocarbons.
Where will Vagit Alekperov invest next?
Top 25 Movers & Shakers to Watch 2021

110African Energy Outlook 2021
African Energy Chamber110
As a strong African energy advocate,
Damilola Ogunbiyi has become a key fig-
ure of the global fight against energy pov-
erty. Her ability to bridge gaps, form new
partnerships and scale up private sector
involvement around key issues such as
energy access, off-grid renewables and
LPG promotion could go a long way in
supporting Africans’ access to clean and
affordable energy. As CEO and Special
Representative of the UN Secretary-Gen-
eral for Sustainable Energy for All and
Co-Chair of UN-Energy, Damilola’s work
has the power to transform the way Afri-
cans access and consume energy.
Morocco is at strategic cross roads as it
massively increases renewable energy
generation while securing domestic gas
to become self-sufficient and develop its
first ever liquefied natural gas (LNG) export
and import projects. As the Director Gen-
eral of the National Office of Hydrocarbons
and Mines (ONHYM), Amina Benkhadra
is spearheading the country’s efforts to
reach self sufficiency in gas and decrease
the country’s overall carbon footprint. Her
guidance and support will tell if Morocco
is able to succeed in its journey to build a
vibrant domestic gas industry.
At the head of the USTDA’s Africa oper-
ations, Heather is piloting several US in-
vestments supporting key gas and ener-
gy projects on the continent, especially
in the areas of midstream gas infrastruc-
ture and gas-to-power. As the continent
further puts natural gas at the forefront
of industrialisation and economic growth
priorities, Heather can become a pillar
of a renewed and successful US-African
energy cooperation that supports capi-
tal and technology transfers across Afri-
ca’s natural gas value chain.
In Ghana, Khadija Amoah is piloting one
of the country’s most strategic upstream
ventures, the development of the Pecan
field. Discovered in the early 2010s by
American independent Hess Corporation,
Pecan is now operated by Aker Energy
and will be Ghana’s next major offshore oil
& gas project, with an expected peak of
110,000 bopd. With Covid-19 putting initial
development plans in jeopardy, can Khad-
ija work on a new solution for the field’s
development and carry it through to final
investment decision (FID)?
China’s EXIM Bank is one of the most
significant investors in African energy
infrastructure projects, especially when
it comes to the financing of power gen-
eration facilities. In a post Covid-19 era,
what strategic direction and guidance
will Hu give the bank in Africa? Sever-
al massive African energy projects are
already in negotiations with the bank
across energy sources, and their sanc-
tioning could significantly contribute to
increasing power generation capacities
across the continent and further sup-
port industrialisation.
As Minister of Energy and Mineral Devel-
opment, Mary Goretti Kitutu is directing
Uganda’s energy sector at a crucial time
for the country. After several years of de-
lay, the Tilenga oil project operated by
Total, and the Kingfisher one operated
by CNOOC, are set to move forward and
produce first oil before 2030. Both are set
to be developed along with a 60,000 bpd
refinery and a 1,443km export pipeline to
Tanzania. With multi-billion dollar invest-
ments taking shape in Uganda, how will
she manage to support the execution of
multi-billion dollars projects while ensuring
they benefits to the local economy?
14.DAMILOLAOGUNBIYICEO and SpecialRepresentative ofthe UN Secretary-General forSustainable Energyfor All and Co-Chairof UN-Energy
17.AMINABENKHADRADirector GeneralNational Office ofHydrocarbons and Mines (ONHYM)
15.HEATHER K.LANIGANRegional Director, sub-SaharanAfrica, U.S. Tradeand Development Agency
18.KHADIJAAMOAHCountry DirectorAker EnergyGhana
16.HU XIAO LIANChairwomanThe Export-Import Bank of China
19.MARY GORETTI KITUTUMinister of Energyand MineralDevelopment,Uganda

www.energychamber.org 111
As the United States increases its invest-
ment in Africa, key government agencies
such as the U.S. International Development
Finance Corporation (DFC) will be playing a
key role in securing the capital and invest-
ment Africa needs to expand its energy in-
frastructure. Set up to replace the Overseas
Private Investment Corporation (OPIC), the
DFC has launched a regional team in Africa,
headed by Vibhuti Jain. The DFC is a pow-
erful partner for Africa to have as it seeks
to attract the best capital and technology
partners it needs to fight energy poverty.
Will be the DFC’s future strategic invest-
ments in Africa successfully address the
continent’s energy needs?
BP’s new charismatic CEO has made it
clear he intends to take BP into the glob-
al energy transition by setting an ambi-
tion for net zero by 2050. This notably
includes achieving net zero on carbon
in BP’s oil and gas production on an ab-
solute basis by 2050 or sooner, a 50%
cut in the carbon intensity of products BP
sells by 2050 or sooner, and an increase
in the company’s proportion of invest-
ment into non-oil and gas businesses
over time. Can Bernard Looney leverage
on the organisation’s new energy transi-
tion strategy to reinvent itself in Africa?
To find a long-lasting solution to its nev-
er-ending power crisis, Nigeria has
formed in 2018 the Presidential Power
Initiative in partnership with Germany,
and to be executed by Siemens. As the
programme kicks off, Siemens’ ability to
execute it will now determine the future
of investments into Nigeria’s power in-
dustry. Heading Siemens’ operations in
Nigeria since 2020, Seun Suleiman is
now in charge of rolling out an ambitions
project to upgrade the country’s trans-
mission and distribution systems, increas-
ing the overall national system’s capacity
from 5 to 7 GW first, before ramping up to
11 GW and ultimately 25 GW.
Hit hard by the Covid-19 pandemic, South
Africa’s economy is in desperate need of
a strong recovery agenda backed up by
private sector investment. Its energy in-
dustry has been identified as a key pillar of
the country’s economic recovery moving
forward, and Minister Gwede Mantashe
will be expected to pilot several strategic
programmes to boost investment and
further diversity the country’s energy mix.
Chief amongst them is the launch and ex-
ecution of the long-delayed fifth window
of the Renewable Energy Independent
Power Producer Procurement (REIPPP)
programme. Can he carry it through to
aid economic recovery while supporting
upcoming upstream and midstream gas
developments in the country?
Niger remains one of Africa’s most
attractive onshore energy frontiers,
significantly de-risked by previous ex-
ploration programmes carried out by
Chinese operators. The ongoing con-
struction of the Niger-Benin oil export
pipeline will be opening up a new route
to monetize such reserves and could
result in a profound transformation of
Niger’s economy by as soon as 2025.
Can Minister Gado manage the exe-
cution of the pipeline and deliver on
promises of an oil boom?
As Mozambique prepares to ship its first
cargoes of liquefied natural gas (LNG)
to global markets in a few years, the
country’s Minister of Energy and Miner-
al Resources, Ernesto Elias Tonela, has
strategic decisions ahead of him. Be-
tween preparing the domestic market
for a gas revolution and ensuring local
content development and jobs creation
don’t get lost in the process, he over-
sees Mozambique’s energy sector at a
crucial time in the country’s history. His
leadership and guidance will be cen-
tral to turning Mozambique’s resourc-
es into economic growth.
Top 25 Movers & Shakers to Watch 2021
20.VIBHUTI JAINRegional Directorfor AfricaU.S. InternationalDevelopmentFinanceCorporation
23.BERNARDLOONEYCEO, BP
21.SEUNSULEIMANManagingDirector and CEOSiemens Nigeria
24.GWEDEMANTASHEMinister of Mineraland EnergyResourcesSouth Africa
22.FOUMAKOYEGADOMinister ofPetroleumNiger
25.ERNESTO MAXELIAS TONELAMinister of Energyand MineralResources,Mozambique
