outlook 2021 - teagasc
TRANSCRIPT
Outlook 2021 Economic Prospects for Agriculture
CONTRIBUTORS
Cathal Buckley, Emma Dillon, Trevor Donnellan, Kevin Hanrahan, Tom Houlihan,
Anne Kinsella, John Lennon, Jason Loughrey, Michael McKeon, Brian Moran and Fiona Thorne
Agricultural Economics and Farm Surveys Department
Teagasc
Dec 1th 2020 ISBN 978-1-84170-670-2

ANNUAL REVIEW AND OUTLOOK 2021
Outlook 2021 | Contents i
CONTENTS Page Executive Summary ii Dairy 1 Cattle 17 Sheep 37 Tillage 51 Pigs 66 Forestry 73 Sustainability 96


ANNUAL REVIEW AND OUTLOOK 2021
Outlook 2021 | Executive Summary v
Outlook 2021 and Brexit
This Outlook report was produced in November of 2020 in the absence of knowledge on whether a post Brexit trade deal would be agreed between the UK and EU before the UK’s transition period comes to an end on Dec 31st 2020.
Therefore it was necessary to set out assumptions in relation to the trading arrangements between the UK and EU that would come into force in 2021. Consistent with the Government of Ireland’s operating assumption, no trade deal is assumed.
2021 - Trade Post Brexit
Brexit Assumption: A No Trade Deal Brexit
• No Trade Deal is in place between the EU and UK (as of Dec 1st 2020)
• UK Brexit Transition period ends on Dec 31st 2020
• In 2021 UK exports to EU subject to EU WTO MFN Tariff Schedule
• In 2021 EU exports to UK subject to UK Global Tariff Schedule
Price impacts emerge, but there is no immediate supply response
• Trade with the UK would be greatly reduced and for some tariff lines trade could cease
• Imposition of tariffs will have market price impacts
• In the short run (2021) no supply response is assumed in Ireland
• Trade diversion takes place
• Products otherwise destined for the UK are absorbed in other markets (at lower price levels)
• Some Irish exporters have already taken action to avoid the very short term implication of WTO MFN tariffs
• e.g. exporting production in 2020 and placing it in storage in the UK (e.g. cheddar)
Policy response to Brexit
Analysis assumes no Brexit specific support is provided in the event of a No Trade Deal
Brexit
We know that both EU and Irish Government have plans to provide short term income
support in the event of No Trade Deal Brexit
However, we do not know the level of support that would be received by Irish and other EU
farmers
The income analysis for 2021 in the event of a No Trade Deal Brexit provides an indication of
the scale of the support that would be needed to mitigate the impact of Brexit on Irish
farming incomes

ANNUAL REVIEW AND OUTLOOK 2021
vi Executive Summary| Outlook 2021
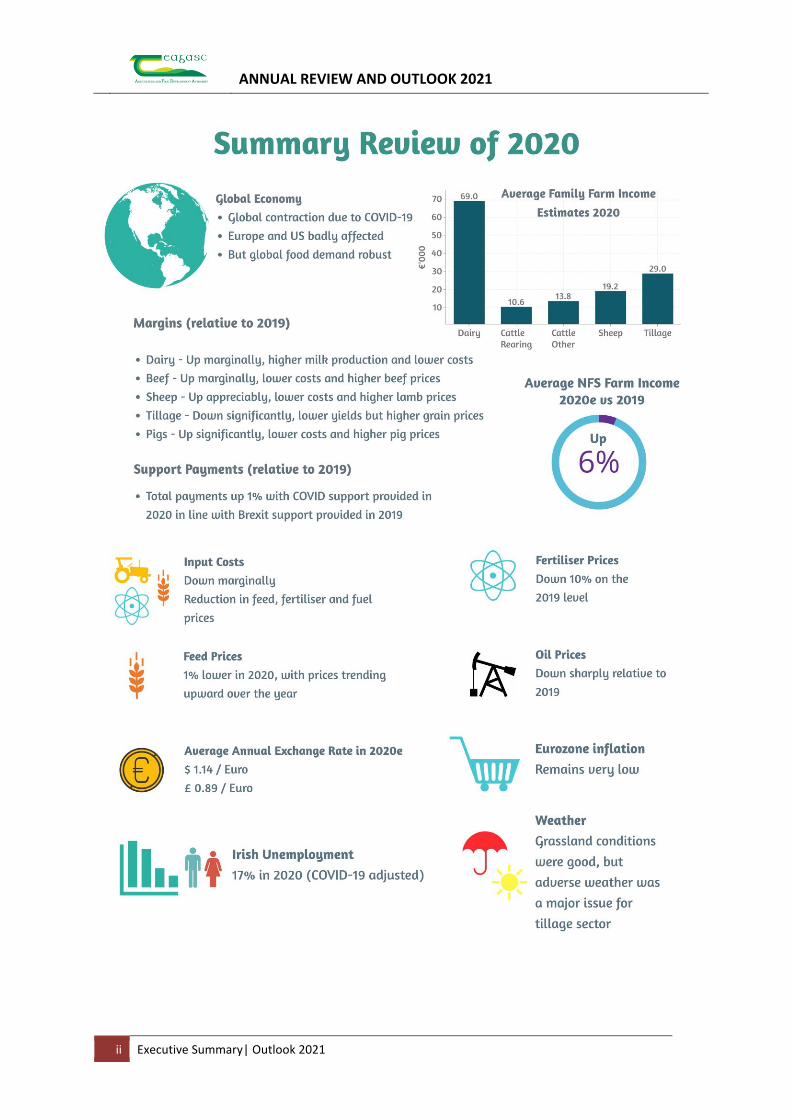
Overall Sector: Summary Review of 2020
Output Value Input Spend Support Payments Income
Up Down Stable Up
Weather conditions in 2020 were favourable for
grassland systems, but quite difficult for many
cereal producers.
Total production costs decreased in 2020 due to
a lower feed, fertiliser and fuel prices, in the
presence of relatively stable input usage
volumes.
Averaged over the year, there was no change in
milk prices in 2020, with VAT inclusive prices
averaging at 34.4 cent per litre (actual fat and
protein. Irish milk production is estimated to
have expanded by a further 3 percent in 2020.
In 2020 stable milk prices and lower milk
production costs resulted in an increase in
average dairy net margin of 5 percent to an
estimated 10.5 cent per litre.
Prices for finished cattle increased by 0.5 percent
in 2020. Steer prices increased by 1 percent while
heifer prices declined by 1 percent. Weanling
prices increased by 5 percent, while prices of
store cattle increased by 2.5 percent relative to
the 2019 level.
The average gross margin on the single suckling
enterprise increased by 11 percent in 2020. The
average gross margin on the cattle finishing
enterprise declined by 3 percent in 2020.
In the absence of the BEEP-S scheme, the average
gross margin on the single suckling enterprise
would have increased by just 1 percent in 2020.
In the absence of the BFP scheme, the average
gross margin on the cattle finishing enterprise
would have decreased by 15 percent in 2020.
Higher marketed output values in 2020 resulted
in substantially higher margins on the average
mid-season lowland lamb enterprise. The
positive margins were further influenced by the
receipt of payments from the Sheep Welfare
Scheme, while total costs declined marginally.
The gross margin earned in 2020 is estimated to
have increased by over 43 percent.
In 2020 Irish cereal yields for major crops were
down on 2019 yields, with the decrease varying
by crop. Cereal prices at harvest in Ireland were
up on the 2019 level, due to a lower domestic,
European and international harvest.
Cereal direct costs decreased in 2020, due mainly to a decrease in fuel, fertiliser and seed expenditure. Whilst harvest cereal prices were higher in 2020, lower yields led to a decrease in cereal margins in 2020.
With African Swine Fever continuing to affect
global supplies, Irish pig prices increased by a
further 4 percent in 2020.
A marginal fall in pig feed prices led to a small
reduction in pig production costs. In
combination, the higher pig prices and lower feed
costs led to an increase in the margin over feed
from pig production to 65 cent per pig, an
increase on the 58 cent per pig margin in 2019.
Figure E1: Monthly Price Index of Fertiliser in Ireland from 2014 to 2020
Source: CSO (various years)
Figure E2: Change in Output Prices 2020 vs 2019
Source: Authors’ estimates
70
80
90
100
110
Jan-16 Jan-17 Jan-18 Jan-19 Jan-20
Ind
ex 2
01
5 =
10
0
-10
-5
0
5
10
15
20
ann
ual
% c
han
ge

ANNUAL REVIEW AND OUTLOOK 2021
Outlook 2021 | Executive Summary vii
Overall Sector: Outlook for 2021
Output Value Input Spend Support Payments Income
Down Up Stable Down
The outlook for Irish agriculture in 2021 is
conditioned by the assumption of normal
weather.
The UK’s post Brexit transition period ends on
December 31st 2020. A hard Brexit, with the
imposition of trade tariffs is assumed in the
absence of an EU/UK trade deal.
For the year as a whole, feed prices are forecast
to increase by about 3 percent in 2021.
Fertiliser prices are forecast to increase by
about 5 percent in 2021, with no change in
fertiliser volume assumed.
Fuel prices are forecast to rise by 3 percent in
2021, with a slight increase in crude oil prices
and a further carbon tax increase.
In 2021 average Irish milk prices are projected
to fall by 7 percent. Feed and fertiliser prices
are forecast to rise slightly and dairy production
costs should therefore increase slightly in 2021.
Under the No Trade Deal Brexit outcome, prices
of finished cattle are forecast to decrease by 19
percent in 2021. Prices of weanlings and stores
are forecast to decrease by 19 percent in 2021.
Under the No Trade Deal Brexit outcome, the
average gross margin on the single suckling
enterprise and cattle finishing enterprise are
forecast to decrease by 36 percent and 41
percent respectively in 2021.
In 2021, increased output value owing to the
relatively positive outlook for lamb prices, with
a slight increase in input expenditure forecast,
margins on sheep farms are forecast to
increase from the level estimated for 2020.
Gross margins are forecast to increase circa 9
percent on average, to €976 per hectare.
EU winter planted area figures for the 2021
harvest are forecast to be up on 2020 harvest
levels, due to more favourable weather
conditions at winter sowing time. Irish cereal
prices at harvest in 2021 will be highly
dependent on supply and demand conditions
globally.
On the assumption that EU and global yields are
normal, supply and stock levels in 2021 are
forecast to increase slightly relative to the 2020
level. Irish cereal prices are forecast to
decrease slightly relative to harvest 2020.
Overall costs on cereal farms look set to
increase slightly. With a normal yield forecast
and a decrease in prices, margins for most
crops in 2021 will increase only very slightly on
the 2020 levels.
Pig prices are forecast to fall by 10 percent in
2021 to 158 cent per kg dwt. With pig feed
prices likely to be up by 2 percent, margin over
feed is forecast to fall to 49 cent per kg, down
from the estimated 65 cent per kg in 2020.
Figure E3: Dairy and Beef Feed Use 2013 – 2021
Source: Authors’ estimates derived from DAFM and CSO data Note: e = estimate f= Forecast
Figure E4: Forecast Change in Output Prices 2021 vs 2020 (No Trade Deal Brexit)
Source: Authors’ forecasts
0
200
400
600
800
1,000
1,200
1,400
2013 2015 2017 2019e
kg p
er c
ow
-25
-20
-15
-10
-5
0
5
10
ann
ual
% c
han
ge

ANNUAL REVIEW AND OUTLOOK 2021
viii Executive Summary| Outlook 2021
Dairy: Review of 2020
Output Value Input Spend Income
Up Down Up
The annual average national milk price for 2020
is estimated to have been unchanged on the
2019 figure at 34.4 cent per litre (CSO definition,
actual fat and protein).
It is estimated that aggregate Irish milk
production increased by 3 percent in 2020.
Dairy cow numbers are estimated to have
increased by 4 percent to 1.57m in June of 2020.
On a per cow basis, dairy feed usage is estimated
to have increased by 2 percent in 2020 to about
1,136 kg.
In spite of the increase in cow numbers and
increase in milk production, due to lower feed
prices, there was no change in dairy concentrate
feed expenditure in 2020 on a per hectare basis,
and a 1 percent decrease on a per litre basis.
Fertiliser use increased marginally in 2020, but
there was a substantial fall in fertiliser prices.
This is estimated to have resulted in a substantial
decrease in pasture and forage costs, on both a
per hectare and per litre basis.
While there was a fall in direct costs in 2020, it is
estimated that there was an offsetting increase
in overhead costs for the average dairy
enterprise. Total milk production costs are
estimated to have increased marginally in 2020
on a per hectare basis, with a 2 percent decrease
recorded on a per litre basis (to 24.4 cent per
litre).
The fall in production costs per litre, a stable milk
price and an increase in milk production, resulted
in an estimated net margin per litre of 10.5 cent
per litre in 2020. This represents a 5 percent
increase on the 2019 level.
With an estimated 2 percent increase in milk
production per hectare, it is estimated that the
net margin per hectare increased 5 percent to a
national average of €1,302 in 2020.
Figure E5: Irish Dairy Cow feed use 2014 to 2020
Source: Authors’ estimates derived from DAFM and CSO data. Note: e = estimate.
Figure E6: Average Total Milk Production Costs (cent per litre) in Ireland: 2014 to 2020
Source: Teagasc National Farm Survey and Authors’ Estimate.
Figure E7: Monthly European Dairy Product Prices Jan 2016-to Sept 2020
Source: USDA.
600
700
800
900
1,000
1,100
1,200
1,300
1,400
2011 2013 2015 2017 2019
kg p
er c
ow
0
5
10
15
20
25
30
2014 2015 2016 2017 2018 2019 2020e
cen
t p
er li
tre
Concentrate Feeds Pasture and ForageOther Direct Costs Energy & FuelLabour Other Fixed Costs
-
1,000
2,000
3,000
4,000
5,000
6,000
7,000
Jan-16 Jan-18 Jan-20
Euro
per
to
nn
e
Butter SMP Cheddar

ANNUAL REVIEW AND OUTLOOK 2021
Outlook 2021 | Executive Summary ix
Dairy: Outlook for 2021
Output Value Input Spend Income
Down Up Down
Global dairy supply and demand are expected to
be in balance in 2021. Leading to limited
movement in international dairy product prices.
With the assumption (November 2020) of a hard
Brexit, it is forecast that the annual average Irish
milk price will decline by 7 percent in 2020
relative to the average 2019 level. This would
represent an annual average milk price of around
32 cent per litre (CSO actual fat and protein).
Assuming normal weather conditions in 2021,
feed use per head on dairy farms is expected to
remain unchanged. Feed prices are expected to
increase by 3 percent.
Expenditure on fertiliser will increase in 2021,
with fertiliser prices expected to rise by 5
percent. No change in fertiliser sales volume is
anticipated.
With oil prices expected to increase slightly, fuel
prices are forecast to increase marginally in 2021,
due in part to an increase in the carbon tax.
Following the estimated 3 percent increase in
production in 2020, further growth of 3 percent
is forecast in 2021.
In 2021, total costs per hectare are forecast to
increase by 3 percent. With a forecast increase
in milk production of 3 percent, total costs on a
per litre basis in 2021 are forecast to increase by
less than 1 percent.
On a per litre basis, the average net margin per
litre is forecast to decrease by 21 percent in 2021
relative to the 2020 level, to an average of 7.9
cent per litre.
Dairy farmers expanding production are assumed
to benefit from some economies of scale. Based
on a milk production volume increase of 3
percent, with a milk price decline of 7 percent,
the forecast average net margin per hectare in
2021 is €1,004, a decrease of 23 percent on the
estimated 2020 level.
Figure E8: Irish Dairy Cow feed use: 2015 to 2021
Source: Authors’ estimates derived from DAFM and CSO data. Note: e = estimate. f= forecast
Figure E9: Average Total Milk Production Costs (cent per litre) in Ireland: 2015 to 2021
Source: Teagasc National Farm Survey, Authors’ Estimate for 2020 and Authors’ Forecast for 2021.
Figure E10: Dairy Gross Output and Net Margin 2016-2021
Source: Teagasc National Farm Survey, Authors’ Estimates for
2020 and Authors’ Forecast for 2021
600
800
1,000
1,200
1,400
2015 2017 2019 2021f
kg p
er c
ow
0
10
20
30
2015 2017 2019 2021f
cen
t p
er li
tre
Concentrate Feeds Pasture and ForageOther Direct Costs Energy & FuelLabour Other Fixed Costs
0
10
20
30
40
50
2016 2017 2018 2019 2020e 2021f
cen
t p
er li
tre
Gross Output Net Margin

ANNUAL REVIEW AND OUTLOOK 2021
x Executive Summary| Outlook 2021
Cattle: Review of 2020
Output Value Input Spend Income
Mixed Down Up on Average
In 2020, prices for prime finished cattle were
similar to the average levels reported in 2019.
In 2020, prices for younger cattle were higher
relative to 2019 leading to an increase in market
output value on Single Suckling enterprises.
The market output value on the average Cattle
Finishing enterprise declined in 2020 as a result
of higher prices for purchased cattle.
The introduction of the BEEP-S scheme has
contributed positively to Gross Output on Single
Suckling farms.
The introduction of the BFP scheme has
contributed to Gross Output on Cattle Finishing
enterprises.
Small decreases in feed usage have contributed
towards lower feed expenditures on Cattle
Finishing enterprises.
In 2020, the average gross margin per hectare
earned on Single Suckling enterprises is
estimated to be €472 per hectare, an 11 percent
increase on the 2019 level.
In 2020, the average gross margin per hectare
earned on Cattle Finishing enterprises is
estimated to be €462 per hectare in 2019, 3
percent down on the 2019 level.
Figure E11: Finished Cattle and Young Cattle Prices
Source: 2008-2019 DG Agri, CSO, 2020 Authors’ estimate
Figure E12: Costs of Production Single Suckling (SS)
Source: 2014-2019 Teagasc NFS, 2020 Authors’ Estimate
Figure E13: Cost of Production Cattle Finishing (CF)
Source: 2014-2019 Teagasc NFS, 2020Authors’ Estimate
Figure E14: Output and Gross Margin
Source: 2014-2019 Teagasc NFS, 2020 Authors’ Estimate
0
50
100
150
200
250
300
0
100
200
300
400
500
2007 2010 2013 2016 2019
euro
/10
0 k
g liv
e w
eigh
t
€ p
er 1
00
kg
carc
ass
wei
ght
R3 Steer Weanling
0
200
400
600
800
1,000
1,200
1,400
2014 2015 2016 2017 2018 2019 2020e€
per
ha
Concentrates Pasture & Forage
Other Direct Costs Energy
Other Overhead Costs
0
300
600
900
1,200
1,500
1,800
2014 2016 2018 2020e
€ p
er h
a
Concentrates Pasture and Forage
Other Direct Costs Energy
Other Overhead Costs
0
250
500
750
1,000
1,250
2014 2015 2016 2017 2018 2019 2020e
€ p
er h
a
SS Output CF outputSS Gross Margin CF Gross Margin

ANNUAL REVIEW AND OUTLOOK 2021
Outlook 2021 | Executive Summary xi
Cattle: Outlook for 2021
Output Value Input Spend Income
Down Up Down
EU beef supply is forecast to decline in 2021.
Under a No Trade Deal Brexit outcome, the Irish
finished cattle prices and young cattle prices are
found to be 19 percent lower in 2021 relative to
the 2020 level.
Input expenditures on a per hectare basis in 2021
are forecast to increase on the 2020 levels due to
higher feed and fertiliser prices.
Direct costs of production on Single Suckling
enterprises are forecast to increase by
approximately 2 percent.
Direct costs of production on Cattle Finishing
enterprises are forecast to increase by
approximately 3 percent.
In 2021, the average gross margin per hectare on
Single Sucking enterprises decreases by 36
percent to €302 per hectare under a No Trade
Deal Brexit outcome.
In 2021, the average gross margin per hectare on
Cattle Finishing enterprises decreases by 41
percent to €272 per hectare under a No Trade
Deal Brexit outcome.
Figure E15: Irish Beef Export by Volume in 2020
Source: Eurostat COMEXT (year through August)
Figure E16: Cattle prices with forecast for 2021
Source: Authors’ forecast
Figure E17: Single Suckling (SS) and Cattle Finishing (CF) Output and Gross Margin per ha
Source: 2014 to 2019 Teagasc NFS, 2020 Authors’ estimate, 2021 Authors’ forecast
UK47%
Other EU14%
FR8%
NL8%
IT6%
ROW16%
0
50
100
150
200
250
300
0
100
200
300
400
500
2007 2010 2013 2016 2019
euro
/10
0 k
g liv
e w
eigh
t
€ p
er 1
00
kg
carc
ass
wei
ght
R3 Steer Weanling
0
500
1,000
1,500
2014 2016 2018 2020e
€ p
er h
a
SS Output CF outputSS Gross Margin CF Gross Margin

ANNUAL REVIEW AND OUTLOOK 2021
xii Executive Summary| Outlook 2021
Sheep: Review of 2020
Output Value Input Spend Income
Up Marginal change Up
EU sheep meat exports from Jan to Sept 2020 are
up 4 percent on same period in 2019. For the
year as a whole exports are expected to stay
relatively stable. This follows on an almost 10
percent increase in EU exports in 2019.
Globally, modest output growth is predicted for
sheep meat for 2020.
With EU sheep meat production forecast to
marginally decline over the year as a whole, the
expectation is that EU consumption for 2020 as a
whole will decline, circa 4 percent.
Prices on the European lamb market in 2020 are
higher than in 2019, with prices for heavy lamb
up on average 12 percent year to date.
It is expected that the average lamb price in
Ireland for 2020 for the year as a whole will be
higher than in 2019. The year on year price
change is estimated at 9 percent.
Total direct costs of production for Irish mid-
season lowland lamb enterprises are estimated
to have increased marginally in 2020, up by just
over 1 percent in 2020.
Overhead costs of production are estimated to
have decreased marginally, by 2 percent.
Gross margins per hectare for Irish mid-season
lowland lamb producers are estimated to have
increased in 2020 by almost 43 percent, owing to
much higher marketed output values in 2020.
The receipt of Sheep Welfare Scheme direct
payments boosted margins in 2020.
In the absence of the coupled payment received
from the Sheep Welfare Scheme, margins in 2020
would have increased by 33 percent relative to
2019. In 2020 the average gross margin on mid-
season lowland enterprises are estimated to be
€898 per hectare.
Figure E18: Irish Lamb price 2005-2019, with estimate for 2020
Source: European Commission DG AGRI and author estimate 2020
Figure E19: Average Sheep production costs 2016 --2019 and estimate for 2020
Source: Teagasc NFS 2016- 2019, Authors’ Estimate for 2020
Figure E20: Average Sheep output 2016-2019 & margin estimate for 2020
Source: Teagasc NFS 2016-2019, 2020 Authors’ Estimate
0
100
200
300
400
500
600
2005 2008 2011 2014 2017 2020e€
per
10
0 k
g cw
e
0
250
500
750
1,000
1,250
1,500
2016 2017 2018 2019 2020e
€ p
er h
a
Concentrates Pasture and Forage
Other Direct Costs Energy
Other Overhead Costs
0
300
600
900
1,200
1,500
2016 2017 2018 2019 2020e
€ p
er h
a
Output Gross Margin

ANNUAL REVIEW AND OUTLOOK 2021
Outlook 2021 | Executive Summary xiii
Sheep: Outlook for 2021
Output Value Input Spend Income
Up Up Up
The outlook for Irish and EU lamb prices for 2020
is positive. Global sheep meat prices are forecast
to remain high.
Sheep meat exports face an uncertain outlook in
2021. Under a no trade deal Brexit, UK exports
to the EU will collapse. This will create export
opportunities for Irish sheep meat and will
support prices in 2021.
Sheep feed expenditure is forecast to increase.
With concentrate prices forecast to increase by
circa 3 percent, the volume of feed use is forecast
to remain relatively stable.
Fertiliser prices are forecast to increase relative
to 2020. With no change forecast in fertiliser
usage, pasture and forage costs are expected to
increase in 2021.
With higher costs of production in 2020 coupled
with positive prices increasing output value,
gross margins for mid-season lowland lamb
enterprises in 2021 are expected to increase by
circa 7 percent.
The coupled Sheep Welfare Scheme payment in
2021 will continue to support margins from mid-
season lowland lamb production.
In 2021 the average gross margin per hectare
earned by Irish mid-season lowland lamb
enterprises is forecast to increase to €976 per
hectare.
Figure E21: Irish Sheep and Lamb Meat Exports (Volume) by Destination in 2020
Source: Eurostat COMEXT (Volume, year to end September 2020)
Figure E22: Sheep price forecast for 2021
Source: DG Agri 2009-2019; Authors’ Estimate 2020; Authors’ forecast 2021
Figure E23: Sheep production costs forecast 2021
Source: Teagasc NFS 2015-2018, Authors’ Estimate 2020, Authors’ Forecast 2021
Figure E24: Average Sheep output & margins with forecast for 2021
Source: Teagasc NFS 2016-2018, Authors’ Estimate 2020, Authors’ Forecast 2021.
BE7% Other EU
10%
DE10%
SE11%
ROW9%
UK22%
FR31%
200
250
300
350
400
450
500
550
2008 2010 2015 2017 2019 2021f
€ p
er 1
00
kg
cwe
0
250
500
750
1,000
1,250
1,500
2016 2017 2018 2019 2020e 2021f
€ p
er h
a
Concentrates Pasture and Forage
Other Direct Costs Energy
Other Overhead Costs
0
500
1,000
1,500
2,000
2016 2017 2018 2019 2020e 2021f
€ p
er h
a
Output Gross Margin

ANNUAL REVIEW AND OUTLOOK 2021
xiv Executive Summary| Outlook 2021
Cereals: Review of 2020
Output Value Input Spend Net Margin per ha
Down Down Down
A decrease in wheat and maize production across
the key growing regions of the world, and a
consequent forecast decrease in ending stocks in
the EU, led to an increase in cereal prices at
harvest 2020, with on account Irish harvest prices
increasing by up to 20 percent in some cases.
However, there was a decrease in yields of the
main cereal crops in Ireland in 2020. Irish spring
barley yields decreased by 11 percent on a per
hectare basis, while winter wheat yields
decreased by 14 percent per hectare, compared
to 2019.
Direct costs of production on Irish cereal farms
decreased in 2020 compared to 2019. The largest
decreases were for fuel related costs, fertiliser
and seed at minus 10 percent, minus 10 percent
and minus 7 percent respectively.
On average direct costs of production decreased
by 4 percent in 2020 on a per crop basis. Overall,
overhead costs remained relatively static in 2020.
The net effect of the change in output value and
input costs was a decrease in the average gross
margin for most cereal crops in 2020. The gross
margin per hectare for spring barley, winter
barley and winter wheat were down €90, €70 and
€25 respectively.
There remains a wide variation in terms of the
economic performance of individual cereal farms
nationally. It is estimated that the average cereal
enterprise on specialist tillage farms will return a
negative market based net margin in 2020.
But behind this average figure is a range, with the
bottom one- third of farms earning a negative
market based net margin of more than minus
€400, while the top one-third of farms earned
nearly €300 per hectare.
Overall, there was a €75 per hectare decrease in
the average market based net margin in 2020,
relative to 2019. This can be attributed to
significant decreases in cereal and straw yields,
which were large enough to negate the impact of
any increase in cereal price at harvest, despite
some top up loyalty bonuses paid by merchants.
Figure E25: Gross Margin for Main Cereal Crops
Source: Teagasc, National Farm Survey Data & Author’s estimate for 2020.
Figure E26: Cereal Enterprise Net Margin on Specialist Tillage Farms
Source: Teagasc, National Farm Survey Data & Author’s estimates for 2020.
0
200
400
600
800
1,000
Sbarley
Wwheat
Wbarley
Mbarley
Woats
S oats
€ p
er h
ecta
re
2019 2020e
-500
-400
-300
-200
-100
0
100
200
300
400
500
Low margin Moderatemargin
High margin
€ p
er h
ecta
re
2019 2020e

ANNUAL REVIEW AND OUTLOOK 2021
Outlook 2021 | Executive Summary xv
Cereals: Outlook for 2021
Output Value Input Spend Net Margin per ha
Up Up Up
EU grain production decreased in 2020. In terms
of market supply and demand, there is a lot of
uncertainty at present, as stocks to use ratios are
variable across wheat, barley and maize.
However the ending stocks to use ratio for wheat
and maize in particular in 2020/21 are lower than
in recent years.
Current (November 2020) futures markets
indicate that 2021 harvest prices will be slightly
lower than those that prevailed at harvest 2020,
by about 5 percent. This downward movement
in prices can be explained by the increase in
winter cereal planting levels across the EU, an
expected reversion to trend yields in 2021 and a
forecast for a slightly higher ending stock position
for the 2021 harvest.
A return to 5 year trend yields in Ireland in 2021
would mean only a slight yield increase for most
cereal crops in 2021.
Direct costs of production on cereal farms are
expected to increase slightly in 2021, with key
inputs such as fertiliser and seed expected to
increase slightly.
Little movement in prices for overhead cost items
is expected in 2021, given that little change in
fuel price is expected, which is a key driver of
many overhead cost items in cereal production.
The net effect of the forecast changes in output
value and input expenditure mean that 2021
gross margins for most cereals are forecast to
increase over 2020 levels.
The average gross margin for spring barley is
forecast to increase by approximately €10 per
hectare. The average winter barley and winter
wheat gross margins are forecast to increase by
about €50 and €125 per hectare respectively.
The cereal enterprise market based net margin
on specialist tillage farms in 2020 is forecast to
increase on the 2020 level. It is forecast that the
average specialist tillage farm will still struggle to
return a positive market based net margin in
2021.
It is forecast that approximately 45 percent of
specialist tillage farmers will return a negative
market based net margin in 2021.
Figure E27: Gross Margin for Main Cereal Crops (2020 estimate & 2021 forecast)
Source: Teagasc, National Farm Survey Data & Author’s estimate for 2020 & forecast for 2021.
Figure E28: Cereal Enterprise Net Margin on Specialist Tillage Farms, 2021 forecast
Source: Teagasc, National Farm Survey Data & Author’s estimate for 2020 & forecast for 2021.
0
200
400
600
800
1,000
1,200
S barley W wheat W barley
€ p
er h
ecta
re2019 2020e 2021f
-500
-400
-300
-200
-100
0
100
200
300
400
500
Low margin Moderatemargin
High margin
€ p
er h
ecta
re
2019 2020e 2021f

ANNUAL REVIEW AND OUTLOOK 2021
xvi Executive Summary| Outlook 2021
Pigs: Review of 2020
Output Value Input Spend Income
UP Down Up
The prices of the main pig feed ingredients
increased in Q3 and Q4 in 2020.
The annual average feed cost in 2020 is
estimated to be 108 cent per kg dwt. That is 2
percent lower than 2019 and marginally higher
than the 5 year average of 107 cent per kg dwt.
At 173 cent per kg, the 2020 Irish pig price was
significantly higher than the 168 cent per kg
average for 2019. This increase was primarily
attributed to the pigmeat deficit in China due to
ASF, resulting in a higher volume of Irish exports.
The estimated 2020 average pig price of 173
cent per kg is significantly above the five year
average (2016-2020) of 159 cent per kg.
The 2020 ‘Margin Over Feed’ (MOF) per kg is
estimated to be 65 cent/kg dwt. During 2020 the
monthly MOF decreased from a 20 year high (88
cent per kg) to a moderate 50 cent/kg in Q4. For
comparison, the five and ten year average for
MOF were 52 cent per kg and 44 cent per kg
respectively.
The volume of Irish pigs slaughtered increased
marginally to 3.8m in 2020, which was an
increase of 0.1m pigs on the 2019 level. In 2020,
of the 3.8m pigs of Irish origin that were
slaughtered, 0.45m were slaughtered in
Northern Ireland.
In 2020, pig slaughter volumes in the principal
European pig producing countries decreased by
0.5 percent when compared to 2019. The
countries with the largest decreases were
Germany (5.5 percent) and the Netherlands (1.3
percent).
The average Irish slaughter weight continued to
trend upward in 2020, with an average sale
weight of 114 kg. This is an increase of 11 kg
since 2010.
Figure E29: Irish Compound Pig Feed Price 2011 to 2020
Source: Teagasc Pig Development Department, estimate for 2020
Figure E30: Monthly Irish Pig Prices 2019 – 2020
Source: Teagasc Pig Development Department, estimate for 2020
Figure E31: Margin Over Feed: Historical Comparison with 2020
Source: Teagasc Pig Development Department
70
80
90
100
110
120
130
140
cen
t p
er k
g d
wt
120
140
160
180
200
220
Jan Apr Jul Oct
cen
t p
er k
g d
wt
30
40
50
60
70
2020 5 Yr 10 Yr 15 Yr
cen
t p
er k
g d
wt

ANNUAL REVIEW AND OUTLOOK 2021
Outlook 2021 | Executive Summary xvii
Pigs: Outlook for 2021
Output Value Input Spend Income
Down Up slightly Down
The November 2020 composite pig feed price of
€307 per tonne will increase in Q1 of 2021.
In Q3 2021, forecasted higher harvest yields in
the UK, France and U.S. may decrease pig
ingredient cereal prices by 5-8 percent compared
with 2020.
Forecasts for the 2021 South American (SA)
soyabean harvest suggest it will increase relative
to 2020 but will not attain the 133mt previously
forecasted.
A decrease in the SA harvest in 2020, allied to a
poor U.S. 2020 harvest will keep the soyabean
price elevated for Q1 & Q2 2021.
The outlook for 2021 is for the annualised
composite pig feed price to marginally increase
by 1 percent when compared to 2020. On a cent
per kg this will be equivalent to 108 (2020) vs 109
(2021).
In 2021 the EU sow herd size is likely to remain
static in the main pig producing countries, with
the exception of Spain. The Spanish herd is
expected to increase by 2 to 3 percent.
In 2021, the size of the Irish sow herd is expected
to remain unchanged, but the volume of Irish pigs
being slaughtered is expected to increase by 1
percent to 3.81 million.
The average Irish pig sale weight is expected to
increase by 2 percent in 2021 to 115kg.
The level of China’s imports of pigmeat from the
EU will have an important influence on the Irish
pig price. It is expected that China’s import level
will decrease as the year progress due to their
recovery and greater U.S. competition
African Swine Fever will continue to feature in
2021. Germany will struggle to prevent further
cases due to infected wild boars crossing their
border from eastern Europe
In 2021, the Irish pig price is forecast to be a
moderate 1.58c/kg but this forecast is highly
influenced by COVID-19 and Brexit factors.
After recent high years of profitability the Irish
pig sector will experience more moderate profit
margins in 2021.
Figure E32: Historical Compound Pig Feed Price and forecast for 2021
Source: Teagasc Pig Development Department estimate for 2020 & forecast for 2021
Figure E33: Historical Irish Pig Prices and forecast for 2021
Source: Teagasc Pig Development Department estimate for 2020 & forecast for 2021
200
250
300
350
400
2011 2013 2015 2017 2019 2021
euro
per
to
nn
e
100
110
120
130
140
150
160
170
180
2011 2013 2015 2017 2019 2021
cen
t p
er k
g d
wt

ANNUAL REVIEW AND OUTLOOK 2021
xviii Executive Summary| Outlook 2021
Forestry Sector: Review of 2020
Afforestation levels
Below 2019 levels
Actual Timber demand
Up due to licencing/timber supply issues
Timber prices
Up due to licencing/timber supply restrictions
Annual afforestation figures have declined below
2019 levels, with 2,258 hectares (ha) planted by
November, 2020. Indications are that the end of
year figure will be between 2,300 and 2,400 ha,
which is just over 25 percent of target levels.
Planting of native woodlands is projected to
reach 450 ha.
Both the forestry licencing regime and the
appeals system have come under major pressure
during 2020. This has led to significant backlogs
in the issuing of permits for afforestation, road
construction and timber harvesting activities.
Legislation has been passed to help address this
and the Department of Agriculture, Food and the
Marine are adding additional resources.
The total number of felling licences issued to
September 30, 2020 is 3,856, a decrease of 71
percent on the same period in 2019.
A total of 81 km of forest roads have been
completed and funded up to October 2020.
Feedback from seven of the main timber
processors indicates sawnwood production of
almost 1.0 million m3 in 2019 with an estimated
551,000 m3 exported to the UK.
Timber markets remain buoyant during 2020,
reflecting increasing demand.
The Irish timber sector remains dependant on the
export market, worth €430 million in 2019, a 1.0
percent increase in value terms on 2018 figures
and an increase of 13 percent in volume terms.
With timber supply restricted due to licencing
and appeals issues, log imports have increased
significantly in 2019 to maintain supply to
processors.
The level of Irish house completions for 2020 is
estimated to reach 17,000 units.
Ireland’s forests have removed (sequestered) an
average of 4.3 Mt of carbon dioxide equivalents
(CO2 eq.) per year from the atmosphere over the
period 2007 to 2017.
Figure E34: Annual planting 2013 to 2019, with projection for 2020
Source: DAFM/Forest Service, various years
Figure E35: Monthly Felling Licences issued in 2019 vs 2020
Source: DAFM, Forestry Section Monthly Reports (2019/20) and Forestry Dashboard (17 November, 2020).
Figure E36: Irish Sawnwood Production and Trade to the UK (000’s m3) in 2018/2019 for 7 of the main sawmills
Source: Based on interviews with 7 of main sawmills in RoI
0
2,000
4,000
6,000
8,000
2014 2016 2018 2020 (F)
hec
tare
s
0
300
600
900
1,200
Jan March May July Sept Nov
2019 2020
1076995
470 444506 466
91 85
0
500
1,000
1,500
2018 2019Total Production Domesetic RoIExports to GB Exports to NI

ANNUAL REVIEW AND OUTLOOK 2021
Outlook 2021 | Executive Summary xix
Forestry Sector: Outlook for 2021
Afforestation levels
Up
Timber demand
Anticipated increasing demand
Timber prices
Linked to easing of supply issues
The Government budget allocation for the
Forestry Programme in 2021 is €100 million.
This allocation reflects funding to establish
8,000 ha of new forests, an ambitious target set
out in the Climate Action Plan.
Increasing planting rates towards target levels
will continue to be a significant challenge,
requiring a sustained increase in the flow of
afforestation approvals to support the 2020/21
planting programme. There is also a need to
support farmers and land-owners in building
confidence regarding the merits of farm
forestry and re-engaging with appropriate
forestry options as a complementary land use.
The export-oriented sawmilling sector will
continue to compete in a challenging market
environment, with EU/UK-related
developments likely to have significant impacts
in 2021.
Forecasts indicate that the net realisable
volume (NRV) from private sector in Ireland will
increase from 1.25 million m3 in 2020 to 1.36
million m3 in 2021.
Timber harvesting and supply is projected to
increase subject to a significant improvement in
the flow of roading and felling licence approvals
in 2021.
The level of Irish house completions for 2021 is
suggested to be 20,000 - 21,000.
Continued sustainable management of forests,
including timely thinning operations as
appropriate, will help optimise forest
productivity whilst also facilitating ongoing
mobilisation of the timber resource.
A focus on the rapid expansion of forest
certification in the private forest sector is
necessary to position it for timber market
requirements.
Figure E37: Forecast of Total Net Realisable Volume Production to 2035 (000m3)
Source: All-Ireland Roundwood Production Forecast 2016-2035 (COFORD, 2016)
Figure E38: Housing Completions RoI (actual and forecast) 2015-2021
Sources: CSO and ESRI 2020
0
2,000
4,000
6,000
8,000
10,000
2016 2020 2024 2028 2032
volu
me
00
0 m
3 o
verb
ark
Private IRLPrivate NICoillteDARD FSTotal Volume
0
5,000
10,000
15,000
20,000
25,000
2015 2016 2017 2018 2019 2020 2021
Actual Forecast


ANNUAL REVIEW AND OUTLOOK 2021
3 Dairy | Outlook 2021
Review of Dairy Farming in 2020 and Outlook for 2021
Trevor Donnellan and Emma Dillon Agricultural Economics and Farm Surveys Department, Teagasc
1. Introduction
This paper looks back on dairy farm performance in 2019, reviews the outcomes for 2020 and looks ahead to the prospects for 2021. Data from the Teagasc NFS are used in our review of 2019. The milk price and key input cost estimates for 2020 are used to produce an overall estimate of Dairy enterprise margins for 2020. Finally, in the concluding sections of the paper, the forecast for milk price, production costs and dairy farm margins in 2021 are presented. At the time of writing (November 2020) it is unclear whether a Brexit related trade agreement between the EU and UK can be reached and this creates uncertainty for the outlook in 2021. While adverse weather drove up input expenditure in 2018, by contrast 2019 was a relatively uneventful year, with a dry period in mid summer the only event of note. Consequently the usage of feed, silage and fertiliser fell in 2019 leading to a notable fall in production costs of 7 percent per litre of milk on average. On average purchased concentrate expenditure decreased by 17 percent per litre of milk, with feed volume dropping back to an average of 1,148kg per dairy cow. The fall in the use of concentrate feed on farms in 2019 will have varied across farms, as they would not have experienced a uniform increase in input use in the drought
conditions of 2018. Expenditure on bulky feed also decreased on dairy farms in 2019, down 8 percent per litre on average. Fertiliser and contracting expenditure also fell in 2019 down by 6 percent per litre on average. Factoring in a year-on-year milk price decline of 3 percent in 2019, the decline in production cost was still sufficient to produce an overall increase in the average Family Farm Income (FFI) recorded through the Teagasc National Farm Survey (NFS). At €65,828, in 2019, this represented an increase of 7 percent in the average FFI on dairy farms.
2. Review of the Economic Performance of Dairy Farms in 2019
Results from the Teagasc NFS 2019 for dairy farms are summarised here. Figure 1 presents the average FFI on Specialist Dairy farms over the years 2013 to 2019. Average FFI on Irish Dairy farms fell from 2014 to 2016 due to the lower milk price, despite the further increased in milk production. A dramatic recovery in FFI was evident in 2017, due to a strong milk price and the increase in milk production. However, difficult production conditions, elevated costs and a reduced milk price, together resulted in a substantial decline in average dairy FFI in 2018. A
Brexit Assumptions: No post Brexit Trade Deal has been agreed between the EU and UK (as of Dec 1st 2020)
UK Brexit Transition period ends on Dec 31st 2020
Without a trade deal, EU – UK trade post 2020 will be based on mutual application of
MFN tariff schedules
Trade and price impacts would occur
but no immediate supply response is assumed in 2021
Income projections for 2021 do not reflect any possible policy response
While the EU and the Irish Government will likely respond to a No Deal outcome with
increased sectoral support, this is not factored in the 2021 income projections
Forecasts of the farm income reduction in 2021 are therefore indicative of the resources
required to mitigate the economic impact of Brexit on farm incomes

ANNUAL REVIEW AND OUTLOOK 2021
Outlook 2021 | Dairy 4
return to normal weather in 2019 allowed for a recovery in FFI.
Figure 1: Average Income on Irish Specialist Dairy Farms 2013 to 2019
Source: Teagasc National Farm Survey (various years).
To further explore the economic performance of dairy farms in 2019, we next look at how margins have changed over the course of the past few years. Table A1 (see appendix) presents the average gross output, gross margin and net margin per litre of milk produced in 2018 and 2019. Farms producing mainly liquid milk are excluded from the sample, as are herds of 10 cows or less. The gross output measure includes the value of milk and calf sales minus replacement costs. The data indicates that gross output per litre declined by 4 percent in 2019 relative to 2018, due mainly to the reduced milk price year-on-year. Prices and usage volumes of key inputs such as feed and fertiliser decreased in 2019, leading to a general decrease in production costs. On average, total direct costs (per litre) decreased by 11 percent year-on-year with just a marginal reduction in fixed costs of 1 percent year-on-year. The average dairy gross margin in 2019 increased to 20.8 cent per litre. Overall, there was a 4 percent increase in average net margin in 2019, to just under 10 cent per litre. Table A2 (in the appendix) presents gross output, total costs and net margin per hectare of forage area allocated to the Dairy enterprise for 2018 and 2019. In 2019, milk production per hectare increased by 5 percent. Net margin, on a per hectare basis, increased by 9 percent for the average Dairy enterprise in 2019, due mainly to increased production per hectare and substantially lower production costs which primarily associated with the decline in input usage levels. The cost and margin data in Table A3 (in the appendix) allow us to examine the variability in economic performance across dairy farms in 2019.
Farms are classified on the basis of gross margin per hectare: the best performing one-third of farms (Top), the middle one-third (Middle) and the least best performing one-third (Bottom). On a per litre basis, total production costs for the Bottom group (26.8 cent) were 18 percent higher than for the Top group (22.8 cent). The net margin for the Bottom group (6.6 cent) is less than half that of the Top group (13.4 cent). This reflects a slight narrowing in the profitability differential between the Top and Bottom groups in 2019 relative to 2018. Figure 2 indicates that total milk production costs decreased by 7 percent on average in 2019 to 24.9 cent per litre. Alongside lower feed expenditure, spending on inputs such as fertiliser, electricity, fuel and contracting all decreased in 2019.
Figure 2: Total Milk Production Costs (cent per litre) in Ireland: 2013 to 2019
Source: Teagasc National Farm Survey Data.
3. Review of 2020 Estimated Performance
This section of the paper presents a review of Irish dairying in 2020. Actual Teagasc NFS results for 2020 will not be available until the middle of 2021. Therefore, it is necessary to estimate the price and volume of inputs and outputs in 2020, in order to estimate the outcome for margins in 2020. The following section of the paper first addresses cost estimates for 2020, looking at both input prices and input usage volumes. A cost assessment based on the average farm nationally is then given. Finally, the development of dairy product markets in 2020, in terms of both price and volume changes, is discussed.
3.1 Estimated Input Usage and Price 2020
It is not yet possible to offer a comprehensive assessment of the precise changes in production
0
20,000
40,000
60,000
80,000
100,000
2013 2015 2017 2019
euro
0
10
20
30
2012 2014 2016 2018
cen
t p
er li
tre
Concentrate Feeds Pasture and Forage
Other Direct Costs Energy & Fuel
Labour Other Fixed Costs

ANNUAL REVIEW AND OUTLOOK 2021
5 Dairy| Outlook 2021
costs at the farm level in 2020. In this analysis, it is assumed that the average dairy farm increased its milk production by 3 percent in 2020.
3.1.1 Feedstuff – usage and price 2020
Purchased feed (concentrates) is an important element of dairy production costs in Ireland, typically accounting for about 20 percent of total production costs, although this varies by farm and by year. Although official aggregate feed sales data for the full year are not yet available, the trend in feed use in 2020 is up marginally on the 2019 level. Department of Agriculture, Food and the Marine (DAFM) feed sales data for dairy farms for Q1 2020 show an increase of 4 percent compared to the same period in 2019. Data for Q2 and Q3 show an increase of 3 percent and 8 percent respectively relative to the same period in 2019. The Irish dairy cow population is estimated to have increased by 4 percent in 2020. The average milk yield per cow in 2020 is estimated to have declined by 1 percent relative to 2019. Figure 3 shows the average volume of compound feed use per cow in recent years, including an estimate for 2020.
Figure 3: Compound Feed Purchases per Dairy Cow in Ireland: National Average for 2011 to 2020e
Source: Author estimates derived from DAFM and CSO data. Note: e = estimate.
These data are derived from DAFM figures on feed sales to the end of Q3 and estimates for Q4 2019 by the authors, along with Central Statistics Office (CSO) data on animal numbers. For the average dairy farm, expanding milk production by 3 percent in 2020, feed use per cow, is estimated at approximately 1,136kg, a 1.4 percent increase in volume terms relative to 2019. Due to a reduction in winter cereal planting and less than favourable weather at growing time, a reduction in the EU grain harvest and ending stocks has created upward pressure on feed prices in Q4 of
2020. However, 2019 cereal prices were generally low, with a lag evident in the transmission of lower cereal prices into the feed market in 2020. Hence, for the year as a whole, feed prices in 2020 are down only marginally on 2019 levels. Figure 4 shows an index of monthly Irish cattle feed prices from 2016 to 2020. The annual average feed price for 2020 is estimated to be down 1 percent on the 2019 level.
Figure 4: Monthly Price Index of Cattle Meal in Ireland 2016 to 2020
Source: Central Statistics Office (Various Years).
On a per litre basis, the expenditure on feed is estimated to have declined by almost 1 percent in 2020 compared to the 2019 level. Feed costs, measured on a per hectare basis, are estimated to have increased by less than 1 percent on the average farm producing 3 percent more milk in 2020.
3.1.2 Fertiliser – usage and price 2020
Pasture and forage costs typically comprise about 20 percent of total production costs on Dairy farms. Fertiliser purchases comprise about half of the pasture and forage cost element, with contractor costs accounting for most of the remainder. Figure 5 charts the Irish monthly index of farm level fertiliser prices from 2016 through to 2020.
Figure 5: Monthly Price Index of Fertiliser in Ireland for 2016 to 2020
Source: Central Statistics Office (Various Years).
600
700
800
900
1,000
1,100
1,200
1,300
1,400
2011 2013 2015 2017 2019
kg p
er c
ow
80
90
100
110
120
Jan-16 Jan-18 Jan-20
Ind
ex 2
01
5 =
10
0
70
80
90
100
110
Jan-16 Jan-17 Jan-18 Jan-19 Jan-20
Ind
ex 2
01
5 =
10
0

ANNUAL REVIEW AND OUTLOOK 2021
Outlook 2021 | Dairy 6
Energy prices have decreased appreciably in 2020, contributing to a reduction in the price of nitrogen based fertilisers. A 10 percent decrease in fertiliser prices in 2020 is estimated relative to 2019. Fertiliser use on dairy farms has been following an upward trend in recent years. Data from the NFS indicates that usage fell in 2019, following the sharp increase in 2018 required to address the fodder shortage that emerged during 2018. DAFM sales figures for 2020, as reported in Figure 6, indicate a 3 percent increase in nitrogen (N) phosphorus (P) and potassium (K) sales volume relative to 2019. Overall, taking account of the stable level of fertiliser sales and the 10 percent reduction in price, fertiliser expenditure per hectare on the average dairy farm in 2020 is estimated to have decreased by 10 percent compared to 2019.
Figure 6: Irish Fertiliser Sales by Compounders 2012 to 2020 (Oct-Sept)
Source: DAFM (various years).
3.1.3 Contractor Costs - usage and price 2020
Contractor costs comprise the remaining 50 percent of the pasture and forage cost element. While no official figures are available, it is assumed that there has been a marginal increase in contractor prices in 2020.
3.1.4 Pasture and Forage – usage and price 2020
Fertiliser expenditure declined in 2020 relative to 2019, with expenditure on contracting estimated to have increased marginally. Therefore, expenditure on pasture and forage has declined by 5 percent on a per hectare basis and 9 percent on a per litre basis on farms where milk production has increased by the national average of 3 percent.
3.1.5 Electricity and Fuel – usage and price 2020
Energy (electricity and fuel) is a less important input than feed and fertiliser, comprising less than 10 percent of total costs on dairy farms. Electricity typically comprises about 30 percent of the total expenditure on energy on dairy farms, with motor fuel accounting for the remaining 70 percent. Crude Oil and Motor Fuel Prices: The global oil market has seen dramatic price movements in 2020, reflecting the emergence of COVID-19, the immediate contraction in global economic activity and the weaker economic outlook. Brent crude oil prices began the year just below US$64 per barrel (pb). With the emergence of COVID-19, oil prices declined sharply to a monthly average of US$23 in April, before recovering somewhat to a little over US$40 in Q3 and increasing further in Q4 of 2020. Crude oil prices are presented in Figure 7. The annual average Brent price for 2020 will be a little over US $41 pb, which represents a decrease of 36 percent on the average oil price in 2019 (US €64 pb).
Figure 7: Monthly Average Brent Crude oil prices in Euro and US dollar from 2012 to 2020
Source: St Louis Fed.
In 2020 the euro remained stable against the US dollar in H1, but the euro appreciated noticeably in H2. The euro rose from a high of US$1.09 in May 2020 towards US$1.20 near year end. For 2020 on average there was a 2 percent increase in the value of the euro against the US dollar compared with its 2019 level. This appreciation of the euro accentuated the fall in crude oil prices when expressed in euro terms. Hence, the estimated average crude oil price for 2020 was over €36 pb, a decrease in euro terms of about 37 percent on the 2019 value of a little over €57 pb. Overall, farm level fuel costs in Ireland decreased in 2020, with fuel
0
100
200
300
400
500
2012 2014 2016 2018 2020
'00
0 t
on
nes
N P K
0
25
50
75
100
125
150
Jan-12 Jan-14 Jan-16 Jan-18 Jan-20
pri
ce p
er b
arre
l
US Dollar Euro
ANNUAL REVIEW AND OUTLOOK 2021
7 Dairy| Outlook 2021
prices approximately 10 percent lower in 2020 relative to the average level in 2019. Electricity Prices: Electricity prices change infrequently in Ireland due to price regulation. Monthly prices fell slightly over the course of 2020. For 2020 as a whole, electricity prices are likely to be 1 percent lower than in 2019. Fuel and Electricity Volumes: Demand by farmers for fuel and electricity tends to be relatively inelastic with respect to price. It is difficult to determine to what extent incremental increases in milk production impact on energy and fuel requirements. Given that milk production is estimated to have increased nationally by 3 percent, this suggests that the volume of electricity and fuel use may have increased marginally in 2020. However, due to the fall in prices, for the average dairy farm the overall expenditure on both electricity and fuel is estimated to be down 6 percent on a per hectare basis in 2020, with a 12 percent decrease when measured on a per litre of milk basis.
3.1.6 Other Direct and Fixed Costs–usage and price 2020
It is estimated that there was a 1 percent increase in agricultural wages in Ireland in 2020. It is assumed that the quantity of hired labour used on farms is likely to have increased marginally to cater for increased milk production. The price of other input cost items increased by 1 percent in 2020. It is assumed that usage volume of these input items increased by 1 percent. The assessment of fixed costs in the Teagasc NFS is quite complex and definitive information on how fixed costs have changed in 2020 will not be available until the Teagasc NFS results for 2020 are published in 2021. Factoring in the stable milk price in 2020 and the increase in milk production, the value of milk output will have increased. Hence the share of fixed costs allocated to the Dairy enterprise on dairy farms is estimated to have increased by 3 percent in 2020.
3.1.7 Estimate of Total Input expenditure for 2020
Even though there was a marginal reduction in milk yields in 2020, the 4 percent increase in dairy cow numbers, was sufficient to result in an overall increase in Irish milk production in Ireland, estimated at 3 percent.
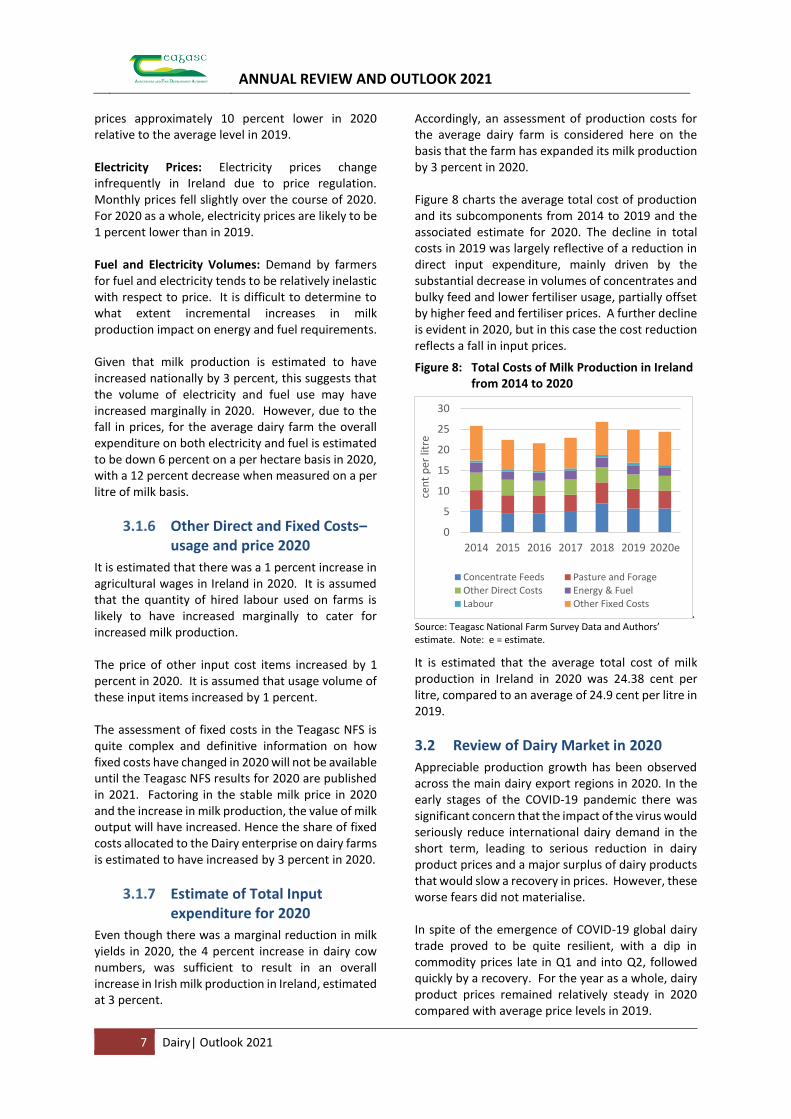
Accordingly, an assessment of production costs for the average dairy farm is considered here on the basis that the farm has expanded its milk production by 3 percent in 2020. Figure 8 charts the average total cost of production and its subcomponents from 2014 to 2019 and the associated estimate for 2020. The decline in total costs in 2019 was largely reflective of a reduction in direct input expenditure, mainly driven by the substantial decrease in volumes of concentrates and bulky feed and lower fertiliser usage, partially offset by higher feed and fertiliser prices. A further decline is evident in 2020, but in this case the cost reduction reflects a fall in input prices.
Figure 8: Total Costs of Milk Production in Ireland from 2014 to 2020
Source: Teagasc National Farm Survey Data and Authors’ estimate. Note: e = estimate.
It is estimated that the average total cost of milk production in Ireland in 2020 was 24.38 cent per litre, compared to an average of 24.9 cent per litre in 2019.
3.2 Review of Dairy Market in 2020
Appreciable production growth has been observed across the main dairy export regions in 2020. In the early stages of the COVID-19 pandemic there was significant concern that the impact of the virus would seriously reduce international dairy demand in the short term, leading to serious reduction in dairy product prices and a major surplus of dairy products that would slow a recovery in prices. However, these worse fears did not materialise. In spite of the emergence of COVID-19 global dairy trade proved to be quite resilient, with a dip in commodity prices late in Q1 and into Q2, followed quickly by a recovery. For the year as a whole, dairy product prices remained relatively steady in 2020 compared with average price levels in 2019.
0
5
10
15
20
25
30
2014 2015 2016 2017 2018 2019 2020e
cen
t p
er li
tre
Concentrate Feeds Pasture and ForageOther Direct Costs Energy & FuelLabour Other Fixed Costs
ANNUAL REVIEW AND OUTLOOK 2021
Outlook 2021 | Dairy 8
Irish farm gate milk prices in 2020 did dip briefly in Q1, but prices stabilised in Q2 and began to recover in Q3. In an EU context, in spite of the disruption created by the COVID-19 pandemic, milk production growth has been relatively strong in 2020. Milk production in the EU could increase by 1.5 percent in 2020, which is the product of continuing yield growth and a modest reduction in the size of the EU dairy cow herd. This would represent an increase in EU milk production of about 2.1 mt relative to the 2019 level. European butter prices declined significantly in Q2 of 2020, but this was followed by a rapid rebound in Q3. By November of 2020 European butter prices had reached €3,500 per tonne. European SMP prices also fell sharply in Q2 of 2020, but the recovery in prices in Q3 and into Q4 has been weaker than in the case of butter. European SMP has been trading at around €2,100 per tonne in Q4 of 2020. In contrast to butter and SMP, European Cheddar prices have moved over a fairly narrow range over the last 12 months, averaging close to €3,000 per tonne. Stable European prices have also been observed for other cheese varieties in 2020. Milk production in New Zealand (NZ) has exhibited very little growth over the last six years. In the 2019/20 season production fell by 0.4 percent. However, production conditions in the current (20/21) production season have been excellent, leading to higher milk yields. This will allow an increase in production in the 2020 calendar year of 1 to 2 percent (0.2 to 0.4mt) In spite of considerable COVID-19 related milk price volatility, US milk production has continued to increase in 2020. There was strong growth in US milk production in Q1 2020, however growth slowed in Q2 as COVID-19 took hold in the US. Growth resumed again in Q3 and for the full calendar year, US milk production should be up by close to 2 percent (1.7mt) in 2020. High input costs have contributed to a contraction in the size of the Australian dairy cow herd in recent years. Australia recorded its lowest milk production in over 20 years in the 2018/19 season, but milk production stabilised in the 2019/20 season and has been trending upwards in 2020/21 season. Overall, for the calendar year 2020 Australian production should show an increase of 3 to 4 percent (0.3 to 0.4 mt).
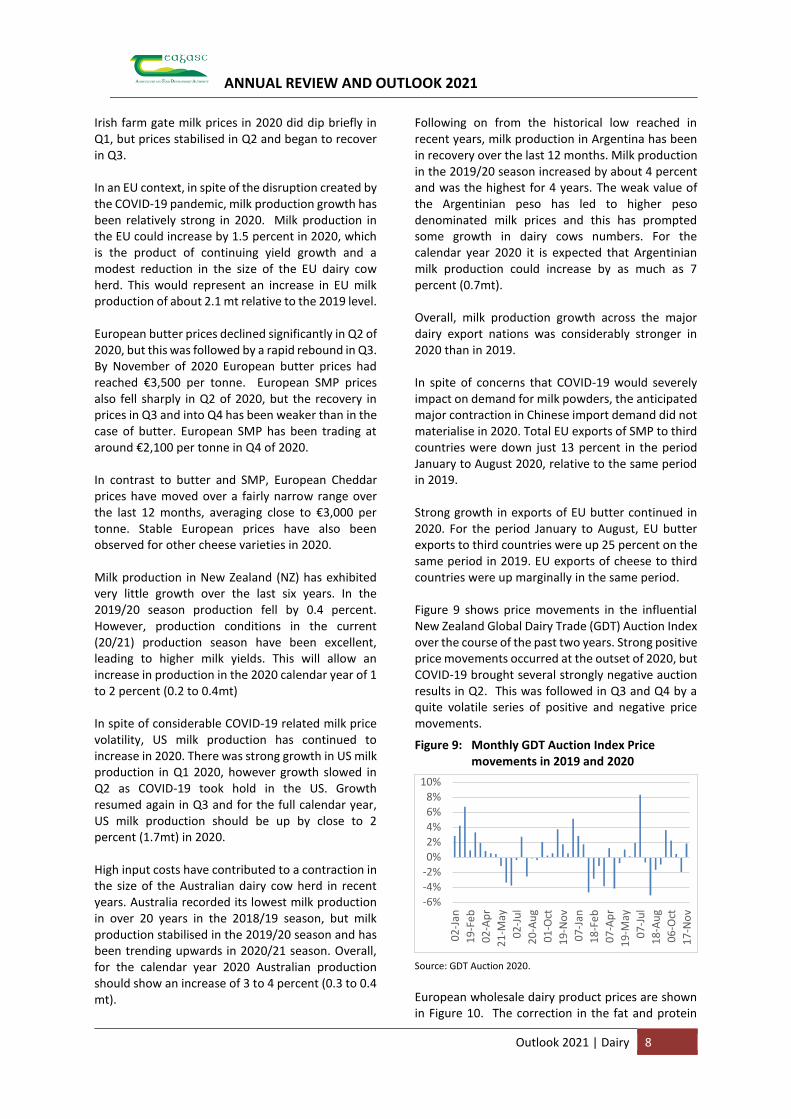
Following on from the historical low reached in recent years, milk production in Argentina has been in recovery over the last 12 months. Milk production in the 2019/20 season increased by about 4 percent and was the highest for 4 years. The weak value of the Argentinian peso has led to higher peso denominated milk prices and this has prompted some growth in dairy cows numbers. For the calendar year 2020 it is expected that Argentinian milk production could increase by as much as 7 percent (0.7mt). Overall, milk production growth across the major dairy export nations was considerably stronger in 2020 than in 2019. In spite of concerns that COVID-19 would severely impact on demand for milk powders, the anticipated major contraction in Chinese import demand did not materialise in 2020. Total EU exports of SMP to third countries were down just 13 percent in the period January to August 2020, relative to the same period in 2019. Strong growth in exports of EU butter continued in 2020. For the period January to August, EU butter exports to third countries were up 25 percent on the same period in 2019. EU exports of cheese to third countries were up marginally in the same period. Figure 9 shows price movements in the influential New Zealand Global Dairy Trade (GDT) Auction Index over the course of the past two years. Strong positive price movements occurred at the outset of 2020, but COVID-19 brought several strongly negative auction results in Q2. This was followed in Q3 and Q4 by a quite volatile series of positive and negative price movements.
Figure 9: Monthly GDT Auction Index Price movements in 2019 and 2020
Source: GDT Auction 2020.
European wholesale dairy product prices are shown in Figure 10. The correction in the fat and protein
-6%
-4%
-2%
0%
2%
4%
6%8%
10%
02
-Jan
19
-Fe
b
02
-Ap
r
21
-May
02
-Ju
l
20
-Au
g
01
-Oct
19
-No
v
07
-Jan
18
-Fe
b
07
-Ap
r
19
-May
07
-Ju
l
18
-Au
g
06
-Oct
17
-No
v

ANNUAL REVIEW AND OUTLOOK 2021
9 Dairy| Outlook 2021
price relativity which has been ongoing since the middle of 2018 is now complete, with butter now trading at a price level that would be considered normal with respect to SMP. In 2020 prices for butter and powders dipped due to COVID-19 and while they later recovered, they remain below the pre COVID-19 level.
Figure 10: European Dairy Product Prices 2016-20
Source: MMO 2020.
3.3 Estimated Output Values 2020
Irish milk production continued to increase in 2020. Monthly milk deliveries are shown in Figure 11 and are reflective of continuing growth in dairy cow numbers in 2020. For 2020 as a whole, milk production is likely to be about 3 percent up on the 2019 level. Irish dairy cow numbers, as recorded in June 2020 increased to almost 1.57 million, compared with 1.5 million in 2019, an increase of 4.2 percent (CSO, 2019). This means that the increase in June Irish dairy cow numbers since 2010 is over 44 percent.
Figure 11: Monthly Irish Milk Deliveries 2017 to 2020
Source: CSO, DAFM 2020.
Figure 12 presents monthly Irish milk prices recorded by the CSO from January 2012 through to August 2020. In Ireland the average 2020 manufacturing milk price is estimated to be broadly in line with the 2019 level. Some farmers will have milk in fixed price contracts and therefore may not obtain the spot
prices quoted. The annual average national milk price (CSO definition) is estimated to be approx. 34.4 cent per litre (vat inclusive) in 2019 on an actual fat and protein basis (estimated to be 4.19 percent fat and 3.55 percent protein).
Figure 12: Irish Farm Gate Milk Prices Actual fat (vat incl.) Jan 2012 – Aug 2020
Source: CSO. Note: Actual fat (VAT inclusive).
The anticipated emergence of SMP intervention stocks, when COVID-19 took hold earlier in 2020 did not materialise, as the impact of COVID-19 on EU SMP exports was limited. COVID-19 had a limited impact on other dairy product prices. In addition to the growth in milk production volumes, there has been an increase in both fat and protein levels in Irish milk deliveries in recent years. The butterfat content in Irish milk deliveries is shown in Figure 13. For 2020 as a whole, fat levels should increase by 0.03 percentage points relative to 2019.
Figure 13: Butterfat in Irish Milk Deliveries 2013 and 2020
Source: CSO.
3.4 Review of Dairy Enterprise Net Margins in 2020
The review of milk prices showed that the average milk price for 2020 was more or less unchanged on the 2019 level. The review of input costs concluded that for the average farm, having expanded its milk
-
1,000
2,000
3,000
4,000
5,000
6,000
7,000
Jan-16 Jan-18 Jan-20
euro
per
to
nn
e
Butter SMP Cheddar
0
300
600
900
1,200
Feb
Mar
Ap
r
May Jun
Jul
Au
g
Sep
Oct
No
v
Dec
mill
ion
litr
es
2017 2018 2019 2020
15
20
25
30
35
40
45
50
Jan-12 Jan-14 Jan-16 Jan-18 Jan-20
cen
t p
er li
tre
3.5
3.8
4.0
4.3
4.5
4.8
5.0
Jan Apr Jul Oct
bu
tter
fat
per
cen
tage
2013 2020

ANNUAL REVIEW AND OUTLOOK 2021
Outlook 2021 | Dairy 10
production by 3 percent, total production costs on a per litre basis are estimated to have declined by 2 percent in 2020 relative to 2019. The margin per hectare is described before examining margin on a per litre basis. Figure 14 presents the estimated average gross output, production costs and net margin per hectare for 2020 in comparison to recent years, on the basis of a 3 percent increase in milk production in 2020. For 2020 the net margin for milk production averaged €1,302 per hectare. This means that the average net margin in 2020 has risen by about €66 per hectare relative to 2019. This represents an increase of over 5 percent year-on-year.
Figure 14: Average Gross Output, Costs & Margins per hectare for Irish Milk Production in 2015-2019 & estimate for 2020
Source: Teagasc National Farm Survey Data and Authors’ estimates. Note: e = estimate.
Estimated average gross output per litre in 2020 is shown in Figure 15, on the basis of a 3 percent increase in milk production.
Figure 15: Average Gross Output, Costs & Margins per litre for Irish milk production in 2016-2019 and estimates for 2020
Source: Teagasc National Farm Survey Data and Authors’
estimates. Note: e = estimate.
Average gross output per litre is estimated to be 34.8 cent per litre in 2020, representing no change on the gross output figure for 2019. See Table A5 (in the appendix) for estimates of output, costs and margins on a per litre basis for a farm that has achieved a 3 percent expansion in milk production in 2020.
4. Dairy Outlook for 2021
For the purposes of this analysis, a 3 percent increase in total Irish milk production in 2021 is forecast, with a slight increase of 1 percent in the dairy enterprise’s land base. A further increase in production in 2021 can be expected to lead to a marginal increase in input usage on farms where expansion takes place.
4.1 Outlook for Input Expenditure 2021
In this analysis of likely changes in production costs in 2021, for simplicity it is assumed that the average farm increases its milk production by 3 percent in 2021. This is in line with the forecast percentage increase in Irish national milk production in 2021.
4.1.1 Feed - usage and price 2021
Irish animal feed prices are driven by a combination of Irish cereal harvest prices (for the previous year and current year) and the prices of imported feed. Irish cereal prices at harvest 2020 were up by between 10 and 20 percent on the 2019 level. The EU-28 balance sheet for wheat, barley and maize production was down in aggregate by about 7 percent, year on year. Feed prices in 2021 will depend in part on cereal prices for harvest 2021, but the main determinant will be harvest prices in 2020. On a monthly basis there has been upward movement in feed prices over the course of 2020, with prices in early 2021 likely to be about 7 percent higher than at the outset of 2020. Cereal prices are forecast to fall in 2021 as the harvest comes in, which suggests that monthly feed prices in Ireland will move downwards over the second half of 2021. Averaging across the full year, feed prices are forecast to increase by 3 percent in 2021 relative to the average price for 2020. The volume of dairy feed used changed only marginally in Ireland in 2020 on a per head basis. With the assumption of normal weather in Ireland in 2021, feed volume requirements per head for grassland enterprises are expected to remain largely unchanged.
0
1,000
2,000
3,000
4,000
5,000
2015 2016 2017 2018 2019 2020e
euro
per
hec
atre
Gross Output Total Costs Net Margin
0
10
20
30
40
50
2016 2017 2018 2019 2020e
euro
per
hec
tare
Gross Output Direct Costs Gross Margin
Fixed Costs Net Margin

ANNUAL REVIEW AND OUTLOOK 2021
11 Dairy| Outlook 2021
Given the assumed 3 percent farm level increase in milk output, this would mean that expenditure on concentrate feed is estimated to increase by 3 percent on a per litre basis in 2021.
4.1.2 Fertiliser & Contracting Costs– usage and price 2021
Fertiliser prices are forecast to increase in 2021 by 5 percent compared with the 2020 level. On the assumption of normal weather, it is forecast that fertiliser use in 2021 will be unchanged on the 2020 level. With fertiliser prices rising and usage levels unchanged, this would mean that the total expenditure on fertiliser in 2021 would increase by 5 percent on a per hectare basis. A marginal increase in agricultural contracting charges and the volume of activity is forecast in 2021. Overall, this would leave total pasture and forage costs per hectare up about 5 percent in 2021 relative to 2020. However, with a forecast increase in milk production of 3 percent, fertiliser and contracting charges in aggregate would increase by a more modest 3 percent on a per litre basis in 2021.
4.1.3 Electricity and Fuel – usage and price 2021
As of November 2020, prospects are for relatively little movement in the US$/euro exchange rate in 2021. For the purposes of this outlook, a rate of $1.18 to the euro is assumed for 2021, an appreciation of 4 percent on the 2020 average level of $1.14. An analysis of futures prices indicates that Brent crude oil should rise in price over the course of 2021 to an annual average of just over US$45 (but that futures price is a little volatile). This would represent an increase of 9 percent. At a US$/euro exchange rate of $1.18, the forecast annual Brent crude oil price for 2021 would be €45 pb, which would leave the annual average Brent crude oil price up 5 percent in euro terms in 2021 relative to the average for 2020. Given that there will also be an increase in the carbon tax in 2021, this suggests that there would be an increase of about 3 percent in farm level fuel prices in 2021 compared with the average for 2020. Electricity prices are assumed to remain unchanged in 2021. This would mean expenditure per hectare on electricity and fuel in 2021 would be up 2 percent.
4.1.4 Other Direct and Fixed Costs – usage and price 2021
Projections relating to the macroeconomy in 2021 are conditioned by two significant unknowns, in the form of COVID-19 and Brexit. To date COVID-19 has had a larger negative impact on employment in Ireland. It has also have a large negative impact on output in some sectors, notably transport and service sectors serving the Irish market. Meanwhile some export oriented sectors have proved quite resilient, with some recording substantial output growth. As a result, Ireland will record one of the smallest reductions in GDP and GNP in the Europe in 2020. At the time of writing (November 2020) it remains unclear whether a Brexit trade deal will be negotiated in the short term to prevent trade disruption between the UK and EU in 2021. In spite of COVID-19 and Brexit, real GDP in Ireland is projected to grow in 2021, with the size of that increase dependent on whether a hard Brexit is avoided. Employment in Ireland is projected to recover in 2021, but unemployment will remain well above pre COVID-19 levels (ESRI, 2020). An increase in wage rates in 2021 of 1 percent is forecast. The increase in general inflation affecting other farm costs in 2021 is also forecast to be 1 percent on a per hectare basis. Allowing for an increase in milk production of 3 percent, this would correspond with a 2 percent increase in other direct costs in 2021 relative to 2020 on a per hectare basis. However, on a per litre basis, these other direct costs would be unchanged in 2021 relative to 2020. At an overall farm level, fixed costs on dairy farms are estimated to change only marginally in 2021.
4.1.5 Estimate of Total Input expenditure for 2021
Overall, direct costs per hectare are forecast to increase by 4 percent in 2021, but remain unchanged on a per litre basis. Fixed costs are forecast to remain unchanged on a per hectare basis and decline by 1 percent on a per litre basis. Overall, total production costs per hectare are forecast to increase by 3 percent per hectare and are forecast to increase by 1 percent per litre in 2021.
4.2 The Outlook for Dairy Markets in 2021
Dairy market prospects for 2021 suggest no dramatic movement in international dairy product prices.

ANNUAL REVIEW AND OUTLOOK 2021
Outlook 2021 | Dairy 12
Barring further COVID-19 disruption, global milk supply and demand should stay in balance, leading to limited international dairy price movements. EU milk production is likely to continue to increase in 2021 by 0.8 percent (1.2mt). Although EU dairy cow numbers are likely to continue to fall by a further 0.1m head in 2021, the contraction in cow numbers should be more than offset by stronger growth in milk yields (European Commission, 2020). For 2021, latest forecasts suggest a further 1.5 percent (1.5mt) increase in US milk production. This increase would reflect a combination of increased milk yields and a growth in cow numbers (USDA, 2020). New Zealand milk production has enjoyed a strong start to the 2020/21 production season, which may increase the possibility of continued modest growth in calendar year 2021, perhaps by 1 percent (0.2 mt). With international dairy product demand growth set to continue in 2021, it is likely that global milk supply growth and milk demand growth will generally be in balance in 2021, meaning there will not be substantial changes in dairy product prices. Outside of general global supply and demand movements there are specific Irish concerns relating to the dairy outlook due to Brexit. At the time of writing (November 2020) no post Brexit trade deal has been reached between the EU and UK. The UK’s transition period ends on December 31st 2020. Thereafter the UK becomes a third country with respect to the EU and if no trade deal emerges then tariffs will apply on trade between the EU and UK. In the dairy sector the announced UK Global Tariff Schedule suggests that the UK will set its no deal dairy tariffs at a similar level to those that would be applied by the EU. In the absence of a trade deal, tariffs of this magnitude would significantly reduce EU/UK dairy trade. From an Irish dairy perspective this is principally a concern with respect to exports of Irish cheddar to the UK, as it could be challenging to find alternative markets for these exports. However, the market impact of trade tariffs on Irish cheese prices is unlikely to be immediate. Substantial stocks of Irish cheese have already been placed in the UK ahead of the December 31st ending of the UK transition period, and those stocks would not be subject to tariffs when marketed. Should UK/EU tariffs come into force, some cheddar which could
not be exported to the UK could be absorbed in other markets (and cheddar could also be channelled to the processed cheese market), where the returns would be lower. In a hard Brexit, it is assumed that the annual average Irish milk price in 2021 is likely to be down 7 percent on the 2020 level, leading to an annual average milk price (CSO definition) of about 32 cent per litre, on an actual fat, vat inclusive, basis, a fall of almost 2.5 cent per litre compared with 2020. It is important to note that milk prices reductions due to a hard Brexit would be processor specific and dependent on their exposure to the UK market.
4.3 The Outlook for Milk Production in 2021
Irish milk production continued to rise in 2020, by an estimated 3 percent. This increase was driven by an increase in dairy cow numbers. It is reasonable to expect that, even with a no deal Brexit, some growth in milk production will occur in 2021. A national increase in Irish milk production of 3 percent in 2021 is forecast relative to the 2020 level.
4.4 The Outlook for Dairy Enterprise Net Margins in 2021
This section considers the impact of changes in milk prices and production costs on gross and net margins on dairy farms in 2021. Price increases for feed and fertiliser are forecast for 2021. It is assumed that further milk expansion in 2021 takes place on a 1 percent larger land area than in 2020. It is also assumed that, on average, milk production per hectare will increase by 3 percent in 2021 relative to 2020. In 2021, profitability per hectare, as measured by net margin on the average dairy farm, producing 3 percent more milk per hectare, is forecast to decrease. Average net margin per hectare is estimated to be €1,302 for 2020, but is forecast to fall to €1,004 (23 percent) in 2021, as illustrated in Figure 16. Additional milk production is assumed to be produced at a low marginal cost, which contributes to the margin achieved per hectare. Production costs for the marginal litres are lower since some cost items do not increase in a linear fashion when production increases, e.g. fertiliser expenditure, other direct costs, energy and hired labour and, in particular, fixed costs.

ANNUAL REVIEW AND OUTLOOK 2021
13 Dairy| Outlook 2021
Figure 16: Average Gross Output and Net Margin per hectare for 2016 to 2020 with Forecast for 2021
Source: Teagasc National Farm Survey Data and Authors’
estimates. Note: e = estimate f= forecast.
Figure 17 presents a margin forecast on a per litre basis for the average dairy farm, where production increases by 3 percent in 2021 relative to the 2020 level.
Figure 17: Average Gross Output and Net Margin per litre in Ireland 2016 to 2020, with Forecast for 2021
Source: National Farm Survey Data (Various Years) and Authors’ estimates. Note: e = estimate f = forecast.
Given the forecast of a 7 percent decrease in milk price in 2021, and the forecast increase of 1 percent in production costs, gross and net margins are forecast to decrease in 2021. Net margin per litre is forecast to decrease by 21 percent in 2021, to an average of 7.9 cent per litre.
5. Concluding Comments
Following the return to normal weather in 2019, a substantial reduction in production costs took place, principally due to lower feed and fertiliser usage. Production costs fell further in 2020, with the reduction driven by lower input prices.
Despite early fears of a significant reduction in milk price in 2020, COVID-19 has not had a substantial impact on dairy demand or supply. Milk prices in 2020 were in line with the 2019 level. Overall, there was an improvement in net margin per hectare and per litre of milk produced in 2020. On average, it is estimated that dairy enterprise net margin per hectare increased by 5 percent in 2020 to €1,302. In 2021 the annual average milk price is forecast to fall 7 percent relative to the 2020 level due to the absence of a Brexit deal. On the assumption that normal weather is experienced in 2021, input usage should remain relatively unchanged, with a marginal increase in input prices, leading to slightly higher production costs. Factoring in a 3 percent increase in milk production in 2021, it is forecast that total production costs will rise by about 1 percent to 24.6 cent per litre. In the absense of a Brexit trade deal between the EU and UK, dairy farm margins in 2021 will decrease, with the average net margin per hectare likely to be down 23 percent on the 2020 level at €1,004 or 7.9 cent per litre, a fall of 21 percent on the 2020 level.
References
AHDB (2020) AHDB Dairy www.dairy.ahdb.org.uk
Central Statistics Office (2020) Statbank [accessed at www.cso.ie ]
DAFM (2020) Quarterly Summary Report for Feed Usage (Various Issues).
DAFM (2020) Quarterly Fertiliser Sales (Various Issues).
Donnellan, T., Moran B., Lennon, J. and Dillon, E. (2020) Teagasc National Farm Survey 2018. Teagasc, Rural Economy Development Programme Athenry Ireland. Available to download at: https://www.teagasc.ie/media/website/publications/2020/TeagascNFS2019-Preliminary-Results.pdf
Dillon, E., Donnellan T., Hanrahan K., Houlihan T, Kinsella A. Loughrey, J., McKeon M., Moran B. and Thorne F (2019) Outlook 2019 Economic Prospects for Agriculture, Teagasc.
ESRI (2020) ESRI Quarterly Economic Commentary, Autumn 2018, Dublin.
European Commission (2020). EU Milk Market Observatory:
0
1,000
2,000
3,000
4,000
5,000
2016 2017 2018 2019 2020e 2021f
euro
per
hec
atar
e
Gross Output Net Margin
0
10
20
30
40
50
2016 2017 2018 2019 2020e 2021f
cen
t p
er li
tre
Gross Output Net Margin

ANNUAL REVIEW AND OUTLOOK 2021
Outlook 2021 | Dairy 14
https://ec.europa.eu/agriculture/market-observatory/milk_en
Global Dairy Trade (2020). Event Results. https://www.globaldairytrade.info/en/product-results/
St. Louis Fed (2020). FRED database:
https://fred.stlouisfed.org/
Teagasc (2020) Teagasc National Farm Survey Results 2019: Dairy Enterprise Fact Sheet. Available to download at: https://www.teagasc.ie/media/website/publicat ions/2020/NFS2019-Dairy-Enterprise-Factsheet.pdf
USDA (2020). Foreign Agricultural Service: https://www.fas.usda.gov/
Acknowledgements
The authors would like to acknowledge Brian Moran and John Lennon and the Farm Recorders of the Teagasc National Farm Survey for the provision of data. The authors also appreciate the contributions made by many colleagues and a number of anonymous industry representatives. Any errors or omissions remain the sole responsibility of the authors.
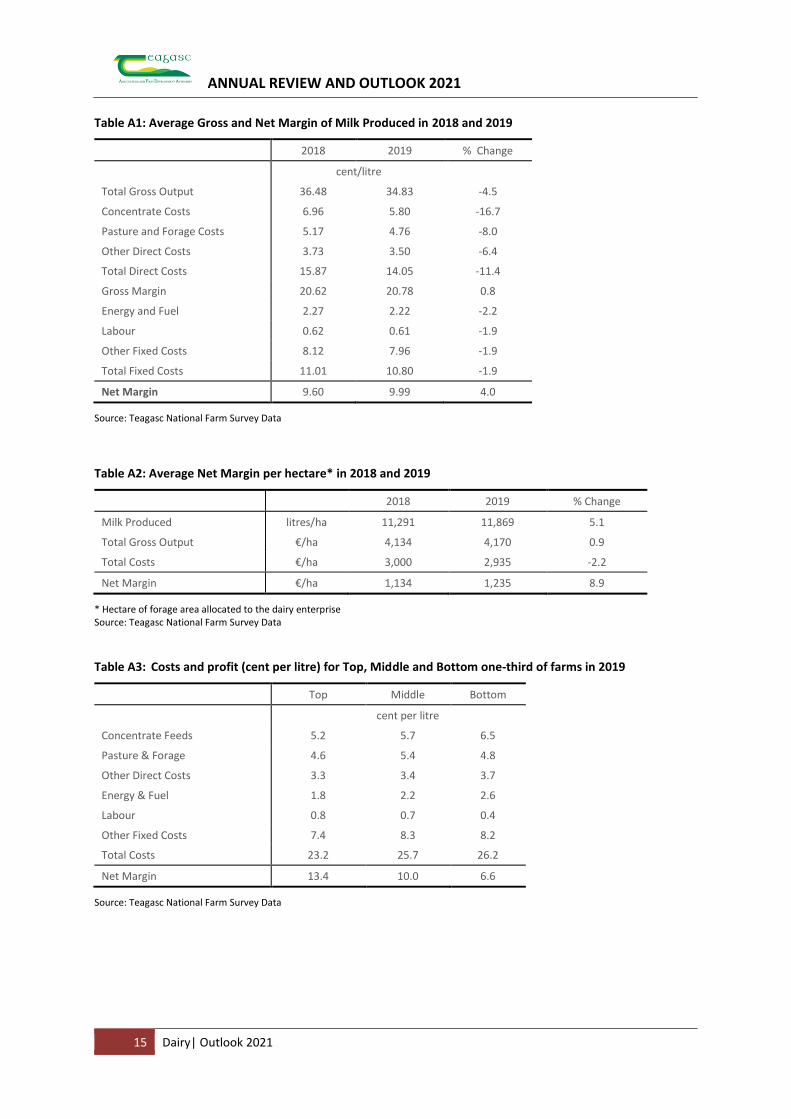
ANNUAL REVIEW AND OUTLOOK 2021
15 Dairy| Outlook 2021
Table A1: Average Gross and Net Margin of Milk Produced in 2018 and 2019
2018 2019 % Change
cent/litre
Total Gross Output 36.48 34.83 -4.5
Concentrate Costs 6.96 5.80 -16.7
Pasture and Forage Costs 5.17 4.76 -8.0
Other Direct Costs 3.73 3.50 -6.4
Total Direct Costs 15.87 14.05 -11.4
Gross Margin 20.62 20.78 0.8
Energy and Fuel 2.27 2.22 -2.2
Labour 0.62 0.61 -1.9
Other Fixed Costs 8.12 7.96 -1.9
Total Fixed Costs 11.01 10.80 -1.9
Net Margin 9.60 9.99 4.0
Source: Teagasc National Farm Survey Data
Table A2: Average Net Margin per hectare* in 2018 and 2019
2018 2019 % Change
Milk Produced litres/ha 11,291 11,869 5.1
Total Gross Output €/ha 4,134 4,170 0.9
Total Costs €/ha 3,000 2,935 -2.2
Net Margin €/ha 1,134 1,235 8.9
* Hectare of forage area allocated to the dairy enterprise Source: Teagasc National Farm Survey Data
Table A3: Costs and profit (cent per litre) for Top, Middle and Bottom one-third of farms in 2019
Top Middle Bottom
cent per litre
Concentrate Feeds 5.2 5.7 6.5
Pasture & Forage 4.6 5.4 4.8
Other Direct Costs 3.3 3.4 3.7
Energy & Fuel 1.8 2.2 2.6
Labour 0.8 0.7 0.4
Other Fixed Costs 7.4 8.3 8.2
Total Costs 23.2 25.7 26.2
Net Margin 13.4 10.0 6.6
Source: Teagasc National Farm Survey Data

ANNUAL REVIEW AND OUTLOOK 2021
Outlook 2021 | Dairy 16
Table A4: Output and profit per hectare for Top, Middle and Bottom one third of farms in 2019
Top Middle Bottom
Stocking rate cows/ha 2.55 2.09 1.69
Milk sold litres per ha 15,601 11,694 8,345
Concentrates fed per cow kg 1138 1132 1174
Concentrates fed per litre of milk produced kg 0.182 0.199 0.225
Gross output € per ha 5,634 4,071 2,818
Direct Costs € per ha 2,017 1,643 1,354
Gross Margin € per ha 3,618 2,428 1,464
Source: Teagasc National Farm Survey Data
Table A5: Average Gross and Net Margin per litre of Milk Produced 2018-2021
2018 2019 2020e 2021f
cent per litre
Total Gross Output 36.48 34.83 34.83 32.40
Concentrate Costs 6.96 5.80 5.79 5.96
Pasture and Forage Costs 5.17 4.76 4.35 4.48
Other Direct Costs 3.73 3.50 3.53 3.53
Total Direct Costs 15.87 14.05 13.67 13.97
Gross Margin 20.62 20.78 21.17 18.43
Energy and Fuel 2.27 2.22 1.94 1.96
Hired Labour 0.62 0.61 0.68 0.68
Other Fixed Costs 8.12 7.96 8.09 7.93
Total Fixed Costs 11.01 10.80 10.72 10.58
Total Costs 26.88 24.85 24.38 24.55
Net Margin 9.60 9.99 10.45 7.85
Source: Teagasc National Farm Survey Data. Figures for 2020 are estimates, Figures for 2021 are forecasts.
Note: Forecast for 2021 assumes a no deal Brexit


ANNUAL REVIEW AND OUTLOOK 2021
19 Cattle| Outlook 2021
Review of Cattle Farming in 2020 and Outlook for 2021 Jason Loughrey and Kevin Hanrahan
Agricultural Economics and Farm Surveys Department, Teagasc
1. Introduction
This paper presents estimates for the returns from cattle production in 2020. The paper contains a review of the economic performance of Irish cattle farms in 2019 based on data provided by the Teagasc National Farm Survey (Donnellan et al. 2020). In this year’s outlook for cattle, the situation in relation to Brexit has provided a unique set of challenges. Based on the available information and the potential economic impact to the sector, we present forecasts based on the most adverse No Trade Deal Brexit scenario as described previously in (Hanrahan, Donnellan and Thorne 2019). Finished cattle prices were volatile in 2020. Despite this volatility, the average price for most categories of finished cattle was similar in 2020 relative to the levels reported for 2019. In 2020, average steer prices increased by approximately 1 percent while average heifer prices declined by approximately 1 percent relative to 2019. In early Q1 2020, Irish finished cattle prices showed improvement from the poor performance observed in Q3 and Q4 2019. However, the onset of the coronavirus (COVID-19) pandemic led to the closure of the European foodservice industry impacting negatively on demand. The immediate increase in retail beef demand was not sufficient to offset the
decline in foodservice demand (European Commission 2020a). Sharp declines in both finished cattle prices and beef production resulted. In March, Government health restrictions were introduced in order to protect the public health. The COVID-19 pandemic reduced the production capacity of meat plants but production declined during this time primarily in response to reduced demand. Beef production eventually recovered in June and remained above 2019 levels in the following months as EU and UK food service markets reopened. Finished cattle prices also recovered during the summer months with some reversion to lower levels in the autumn. In 2020, the volume of prime cattle slaughtered increased by approximately 1 percent relative to 2019. The average weight of finished prime cattle increased by approximately 1.5 percent relative to 2019. The total volume of prime beef production is therefore notably higher in 2020 despite the COVID-19 pandemic. Average weanling prices increased by approximately 5 percent relative to the levels reported for 2019. Average store prices increased by between 2 and 3 percent relative to the levels reported for 2019.
Brexit Assumptions: No post Brexit Trade Deal has been agreed between the EU and UK (as of Dec 1st 2020)
UK Brexit Transition period ends on Dec 31st 2020
Without a trade deal, EU – UK trade post 2020 will be based on mutual application of MFN
tariff schedules
Trade and price impacts would occur
but no immediate supply response is assumed in 2021
Income projections for 2021 do not reflect any possible policy response
While the EU and the Irish Government will likely respond to a No Deal outcome with
increased sectoral support, this is not factored in the 2021 income projections
Forecasts of the farm income reduction in 2021 are therefore indicative of the resources
required to mitigate the economic impact of Brexit on farm incomes

ANNUAL REVIEW AND OUTLOOK 2021
Outlook 2021 | Cattle 20
The timing of live cattle sales proved important in 2020. In late March, the coronavirus pandemic resulted in the suspension of public auctions at marts (DAFM 2020c). In the following weeks, store and weanling prices declined but recovered in mid-May. Marts adopted alternative methods to facilitate transactions between buyers and sellers. Some marts introduced online bidding and online sales continued during this time. Marts reopened for auctions in late June. Prices in the autumn were particularly strong with weanling prices 6 to 7 percent higher than the levels observed during autumn 2019. Level 5 restrictions were introduced from October 22nd onwards and marts relied on online auctions to facilitate transactions. Prices for dairy calves decreased by approximately 10 percent compared with 2019. Prices for beef calves performed well in the autumn and were approximately 10 percent higher relative to 2019. Overall, the price dynamics suggest a narrowing in the gap between the price of finished cattle and the price of cattle purchased through the marts. The average Gross Output on Irish cattle farms in 2020 was boosted by the introduction of the Beef Finishers Payment (BFP) and the Beef Environmental Efficiency Programme - Suckler (BEEP-S) schemes. These two schemes contribute to our estimate of gross output value in 2020. Grass-growing conditions varied during the course of 2020 but were particularly favourable in the autumn. This influenced the economic performance of Irish cattle production with a 3 percent decrease estimated in the quantity of concentrates for the average Cattle finishing enterprise. The quantity of concentrate usage on cattle rearing enterprises is likely to be similar to 2019. The average gross margin on Single Suckling farms are estimated to have increased by approximately 11 percent in 2020. The introduction of the BEEP-S scheme has supported Gross margins on cattle rearing farms participating in the scheme. The receipt of payments under the Beef Data Genomics Programme (BDGP) continued to support Gross Margins on Cattle Rearing farms. On average however, Single Suckling farms are estimated to have earned a negative net margin of -€28 in 2020. The average gross margin per hectare on the average Cattle Finishing enterprise is estimated to have declined slightly in 2020 with an estimate of
€462 per hectare. Declines in motor fuel costs have contributed to reducing overhead costs. On average, Cattle Finishing farms are estimated to have earned negative net margins in 2020. The average Cattle Finishing enterprise net margin is estimated to be -€42 per hectare in 2020. The per capita quantity demand for beef in the EU is estimated to be marginally lower in 2020 (European Commission 2020). In the United Kingdom, the foodservice purchases of beef are estimated to have declined heavily between April and August 2020 (AHDB 2020d). At the same time, recent retail data shows an increase in UK beef retail consumption with increases being reported in the consumption of roast beef and steaks (AHDB 2020b). In 2020, UK consumer prices for sirloin/rump steak declined after more significant declines in 2019 (Office for National Statistics 2020a). EU beef supplies increased between 2012 and 2018 but this trend has been reversed in 2019 and 2020 and further declines are forecasted over the short to medium term. The dynamics behind the recent decrease can be attributed to a number of factors including the increasing milk yields of the EU dairy cow herd. The decline in the EU herd can also be partly attributed to the low milk prices in 2016 and the effects of the summer drought in North Western Europe during 2018. These recent events are responsible for reducing the size of the breeding herd and subsequent beef production. At a global level, there continues to be an important shift in the demand for beef. In 2020, the domestic consumption of beef and veal is estimated to have increased by 8 percent in China but declined in the European Union, Argentina and Brazil. Global consumption of beef and veal is estimated to be approximately 1 percent lower in 2020 relative to 2019 (USDA, 2020). Global beef demand is expected to grow in 2021 with China, Brazil and India contributing to rising consumption levels and helping to underpin global beef prices (USDA, 2020). Global production of beef is expected to increase by 1.5 percent in 2021 (USDA, 2020). The forecast increase in global meat production is largely driven by developments in Brazil and India with declines forecast for the European Union and Argentina. The price analysis for 2021 is based on the FAPRI Ireland aggregate sector model, which is a partial

ANNUAL REVIEW AND OUTLOOK 2021
21 Cattle| Outlook 2021
equilibrium agricultural commodity model. Under the No Trade Deal Brexit outcome, the FAPRI-Ireland analysis (Donnellan, Hanrahan and Thorne 2019) finds a decline of 19 percent in Irish cattle prices relative to 2020. Under this adverse scenario, prices for weanlings and stores decline by a similar percentage. For 2021, we consider the ongoing impact of COVID-19 on beef demand and consequently beef prices at the farm level in Ireland. In 2020, the Beef Finishers Payment (BFP) provided an important source of financial support to the beef sector in response to the COVID-19 shock. We assume that the value of the BFP continues to support cattle enterprises in 2021 and therefore continues to mitigate against the adverse impact of COVID-19 on farm incomes. The BDGP and the recently announced Beef Environmental Efficiency Pilot - Suckler (BEEP-S) schemes will continue to provide exchequer support to participating farmers to enable them to improve the genetic merit of their beef animals and thereby lower the greenhouse gas intensity of their beef production. The BDGP involves a payment of approximately €85 per cow for participating farmers. However, not all suckler cows are farmed by participating farmers. This means that the average value of the BDGP per cow to suckler cow farmers will be lower than the headline rate. Total BDGP payments were approximately €41.5 million in 2019 (DAFM 2020e). For this analysis, we have estimated that the average suckler farmer will receive a payment of €41 per hectare from the BDGP in 2020 and 2021. Budget 2020 led to the introduction of the Beef Environmental Efficiency Programme-Suckler (BEEP-S) scheme. This scheme builds on the previous pilot scheme entitled the Beef Environmental Efficiency Pilot (BEEP) scheme. As in the case of the BDGP programme, not all suckler cows are farmed by participating farmers. As in the case of the BEEP scheme, costs may be incurred by participating farmers e.g. weighing cattle, and these costs may vary by herd size and according to the availability on farms of weighing scales. Taking all available information into account, we have assumed that the average suckler farmer will earn an additional €44 per hectare from the BEEP-S programme in 2020 and 2021. Unless stated otherwise, all figures referred to in this paper are in nominal terms and all enterprise
output and profit estimates exclude the value of decoupled income support payments and are expressed per hectare.
2. Review of the Economic Performance of Beef Farms in 2019
The trends in average family farm income (FFI) for the two types of cattle farms identified in the Teagasc NFS over the period 2012 to 2019 are shown in Figure 1. In 2019, the average FFI on Teagasc NFS Cattle Other farms decreased by 6 percent compared with 2018 levels while the average FFI on Teagasc NFS Cattle Rearing farms increased by 11 percent compared with 2018 levels. Figure 1 illustrates that the gap in average FFI earned by farms in the Cattle Rearing system and Cattle Other system narrowed in 2019 relative to 2018. In this year’s enterprise analysis, we continue to present results based on the two way categorisation of Irish cattle enterprises: Single Suckling and Cattle Finishing enterprises first used in Breen and Hanrahan (2012) and the Teagasc NFS cattle enterprise fact sheets (Teagasc, 2020a and 2020b).
Figure 1: Family Farm Income on Cattle Rearing and Cattle Other Farm Systems: 2013 to 2019
Source: 2019 Teagasc National Farm Survey (2020)
Single Suckling enterprises in the analysis that follows are enterprises with more than 10 cows, while the Cattle Finishing enterprises analysed are those with more than 10 livestock units where more than 70 percent of the animals sold off the farm were sold for slaughter. In total, these two enterprises were present on more than 40,000 farms nationally.
0
5,000
10,000
15,000
20,000
2013 2015 2017 2019
euro
Cattle Rearing Cattle Other

ANNUAL REVIEW AND OUTLOOK 2021
Outlook 2021 | Cattle 22
2.1 Irish Beef Enterprise Performance in 2019
This section discusses the cost structure of Single Suckling and Cattle Finishing enterprises in Ireland. Farms with these enterprises have been ranked on the basis of gross margin earned per hectare and each farm enterprise group has been broken into three equally sized sub-groups, which we have termed farms that are least profitable, those that have average profitability and those that are most profitable. Single Suckling: In 2019, the average direct cost of production per hectare for Single Suckling enterprises varied from €468 per hectare, on those farms with the lowest average gross margin, to €563 per hectare on the top third of profitable farms (see Figure 2). The cost of concentrate feed, along with the cost of pasture and winter forage typically accounts for approximately 80 percent of the direct costs of production on these farms. The average expenditure on concentrate feed varied from €137 per hectare on the middle third of farms to €152 per hectare on the most profitable farms.
Figure 2: Variation in Total Production Costs and Gross Output on Single Suckling enterprises in 2019
Source: 2019 Teagasc National Farm Survey (2020)
There was considerably more variability in the average gross output per hectare between the least profitable and most profitable farms. The most profitable third of Single Suckling enterprises earned an average gross output of €1,297 per hectare, compared with an average gross output of €623 per hectare on the least profitable one third of Single Suckling enterprises. This variability in average gross output is largely due to higher average stocking on the more profitable farms. In 2019, the most profitable Single Suckling
enterprises had an average stocking rate of 1.73 livestock units (LU) per hectare compared with 1.10 LU per hectare on those Single Suckling enterprises with the lowest levels of profitability. The capacity of farms to operate at high stocking rates is limited by the quality of the land farmed. In 2019, 63 percent of the most profitable Single Suckling enterprises farmed very good soils, whereas the proportion of the least profitable Single Suckling farms on very good soils was considerably lower at 40 percent.
The most profitable one third of Single Suckling enterprises in 2019 had an average gross output per hectare that was over 200 percent higher than the average output per hectare on the least profitable one third of enterprises, while average direct costs per hectare were just 20 percent higher. Cattle Finishing: The second cattle enterprise category analysed is the Cattle Finishing enterprise. The enterprises analysed were again ranked on the basis of gross margin per hectare and assigned to three equally sized groups termed least, average and most profitable.
Average direct costs of production per hectare were highest on the most profitable farms and lowest on those farms with lower levels of profitability (see Figure 3). Total expenditure on concentrate feed is substantially higher on Cattle Finishing enterprises than on Single Suckling enterprises. The most profitable one third of Cattle Finishing enterprises had a gross output of €1,806 per hectare compared with €473 per hectare on the least profitable Cattle Finishing enterprises.
Relative to the Single Suckling enterprise, there is a larger degree of heterogeneity in gross output per hectare across the Cattle Finishing enterprises analysed. This diversity reflects the differing levels of production intensity on these farms. The average stocking rate on the least profitable Cattle Finishing enterprises was 1.02 LU per hectare, while the average stocking rate on the most profitable one third of Cattle Finishing enterprises was 1.80 LU per hectare. In general, more profitable Cattle Finishing enterprises were on farms with better soil, 75 percent of the most profitable Cattle Finishing enterprises farmed very good soils, while 63 percent of the least profitable farms farmed very good soils.
The results presented in Figure 2 and Figure 3 highlight the differences in costs per hectare on Single Suckling and Cattle Finishing enterprises.
0
200
400
600
800
1,000
1,200
1,400
1,600
MostProfitable
AverageProfitability
LeastProfitable
euro
per
hec
tare
Concentrate Feeds Pasture and Forage
Other Direct Costs Gross Output

ANNUAL REVIEW AND OUTLOOK 2021
23 Cattle| Outlook 2021
However, it is important to recall that there is even greater variation in gross output across different farm enterprises. While higher levels of gross output per hectare are in general associated with high levels of direct costs of production and farming on better than average soils, the difference in technical performance and productivity between the top one third and bottom one third of Cattle Finishing enterprises remains striking.
Figure 3: Variation in Total Production Costs and Gross Output on Cattle Finishing Enterprises in 2019
Source: 2019 Teagasc National Farm Survey (2020)
Average overhead costs per hectare on the Cattle Finishing and Single Sucking enterprises were €512 and €508 per hectare respectively (see Appendix Table A1 and Table A2 at the end of this paper). In 2019, the overhead expenditure per hectare on Cattle Finishing and Single Sucking enterprises are therefore similar. On a whole farm basis, the total overhead expenditures tend to be higher on Cattle Finishing enterprises due to the relative larger farm size.
On average, Cattle Finishing enterprises in 2019 earned a better net margin per hectare relative to the average Single Suckling enterprise. However, an average negative net margin is reported for both enterprises in 2019.
On Single Suckling farms, the net margins improved slightly in 2019 relative to 2018. However, the average net margin in 2019 was significantly below the levels reported from 2015 to 2017. The improvement in the performance of the Cattle Finishing enterprises can largely be attributed to the decrease in feed expenditure and the introduction of the BEAM scheme.
Figure 4 shows the net margins earned on the two cattle enterprises analysed and illustrates that in
2019 only the most profitable one thirds of Single Suckling and Cattle Finishing enterprises earned positive net margins and that the level of these margins was relatively low.
Figure 4: Cattle Enterprise Net Margins per hectare in 2019
Source: 2019 Teagasc National Farm Survey (2020)
3. Estimated Performance of Irish Cattle Farms in 2020
This section of the paper presents a review of the economic performance of Irish cattle enterprises in 2020. A discussion of the estimated changes in input usage and input costs in 2020 is first presented and this is followed by a discussion of estimated changes in output value. Estimates of margins earned by Single Suckling and Cattle Finishing enterprises in 2020 are then presented. Estimates for 2020 margins (which are presented in Section 4) are based on relatively small changes in the intensity of production per hectare on the average cattle finishing farm. The impact of changes in the intensity of production on individual enterprises would be expected to vary from farm to farm. In some cases, a change in intensity may increase profitability, in others it could give rise to lower margins. In 2020, aggregate production of beef in Ireland is estimated to have increased. Suckler cow inventories in 2020 have declined relative to 2019 (DAFM 2020e).
3.1 Estimated Input Usage and Price 2020
3.1.1 Feedstuffs
Purchased feed is an important element of the direct costs of beef production in Ireland. Typically this cost item accounts for approximately 30 percent of total direct costs on Single Suckling
0
500
1,000
1,500
2,000
2,500
MostProfitable
AverageProfitability
LeastProfitable
euro
per
hec
tare
Concentrate Feeds Pasture and Forage
Other Direct Costs Gross Output
-300
-200
-100
0
100
200
300
MostProfitable
AverageProfitability
LeastProfitable
Average
euro
per
hec
tare
Single Suckling Cattle Finishing

ANNUAL REVIEW AND OUTLOOK 2021
Outlook 2021 | Cattle 24
enterprises and 45 percent of direct costs on Cattle Finishing enterprises. Weather conditions varied over the course of 2020 with particularly high rainfall in February and a long warm dry spell from mid-March until June. Over 2020 as a whole, rainfall levels were significantly lower in the eastern counties relative to most other parts of Ireland. Grass growing conditions were particularly favourable in the autumn. The improvement in grass growing conditions contributed to lower volumes of concentrate feed purchases by Irish beef farmers. The aggregate volume of purchased feed used by Irish cattle farms in 2020 is estimated to have been lower than in 2019. Overall, it is estimated that feed use per head will be lower in 2020 relative to 2019. The decline in feed use is attributed to farms engaged in cattle finishing. Figure 5 presents the CSO monthly price index for cattle feed stuffs for the period January 2015 to August 2020. For 2020 as a whole, we estimate that cattle feed prices are unchanged relative to 2019.
Figure 5: Monthly Price Index of Cattle Meal in Ireland 2015 to 2020
Source: CSO (2020)
With relatively small changes in livestock numbers on a per hectare basis and limited decrease in feed prices, we estimate that expenditure on concentrates by cattle finishing farms in 2020 will be lower as compared to 2019. On Single Suckling farms, the estimated decline in feed expenditures is just 1 percent.
3.1.2 Fertiliser in 2020
Figure 6 presents data on fertiliser prices over the past seven years. Fertiliser prices declined in early 2020 and this decline continued through the first half of 2020.
Figure 6: Monthly Price Index of Fertiliser in Ireland from 2014 to 2020
Source: CSO (2020)
The decline in Irish fertiliser prices will mean that overall fertiliser expenditure on Irish cattle farms will be lower in 2020.
3.1.3 Energy and Fuel in 2020
In 2020, the average price for Brent crude oil will be about US $41 per barrel (pb), which represents a decrease of approximately 36 percent on the average oil price in 2019 (US $64 pb). In H2 2020, the value of the euro increased against the US dollar. The euro strengthened from US$1.09 in May to about US$1.17 by year end. For 2020 as a whole there was a 2 percent increase in the value of the euro against the US dollar compared with its 2019 level. This appreciation of the euro accentuated the fall in oil prices when expressed in euro terms. Hence, the estimated average crude oil price for 2020 was over €36 pb, a decrease in euro terms of about 37 percent on the 2019 value of a little over €57 pb. As a result of the decline in oil prices and the inelastic nature of farmer demand for fuel, fuel expenditure on Irish cattle farms is estimated to have decreased by 10 percent in 2020 relative to the 2019 level. The smaller decrease in farm level fuel costs as compared to crude oil prices reflects the impact of taxes and other activity along the energy supply chain. While no official data on contractor charges exists, we estimate that for 2020, farmer contracting charges on cattle farms will have remained largely unchanged as compared to 2019. When combined with lower expenditure on fertiliser, this means that overall expenditure on pasture and forage by cattle
80
85
90
95
100
105
110
115
Jan-15 Jan-16 Jan-17 Jan-18 Jan-19 Jan-20
ind
ex 2
01
5=1
00
50
60
70
80
90
100
110
Jan-14 Jan-16 Jan-18 Jan-20
Ind
ex 2
01
5 =
10
0
Straight fertilisers
NPK fertilisers

ANNUAL REVIEW AND OUTLOOK 2021
25 Cattle| Outlook 2021
farmers in 2020 is estimated to have been lower relative to 2019. Electricity costs have decreased in 2020. On an annual average basis, prices in 2020 are estimated to have decreased by 1 percent compared to 2019.
3.1.4 All Other Direct and Overhead Costs– usage and price 2020
Wages in Ireland are estimated to have increased by 1 percent in 2020; however, given the low usage of hired labour on Irish cattle farms, this development does not have a major impact on costs of production. Increased veterinary costs contribute towards an estimated 1 percent increase in other direct costs for 2020. In the case of the Single Suckling enterprise, there are some additional costs associated with adhering to the conditions of the BEEP-S scheme. Motor fuel prices are estimated to have declined by approximately 10 percent thereby reducing machinery operating costs and total overhead costs during 2020.
3.1.5 Estimate of Total Direct Costs for 2020
Figure 7 compares the average direct costs of production for the Single Suckling and Cattle Finishing enterprises in 2019 with the estimated direct costs for 2020.
Figure 7: 2019 Direct Costs and Estimated 2020 Direct Costs for Single Suckling (SS) and Cattle Finishing (CF) Enterprises
Source: Teagasc National Farm Survey (2020) and Author’s Estimates
On average, total direct costs on Single Suckling enterprises are estimated to have decreased by only 2 percent while direct costs on Cattle Finishing enterprises are estimated to have decreased by 3 percent. The relatively larger decrease on Cattle
Finishing enterprises is primarily due to the decrease in concentrate usage. Lower fuel costs in 2020 contributed towards reducing overhead costs. The overall costs of production in 2019 are estimated to have decreased by 2 percent on Single Suckling farms and by 3 percent on Cattle Finishing farms.
3.2 Estimated Output Values 2020
The market value of gross output on Single Suckling enterprises is estimated to have increased in 2020, with higher prices for young cattle observed throughout most of 2020 and particularly during the autumn. The average Gross Output will be higher than the levels observed in 2019. In 2020, the value of output per hectare on Single Suckling farms is estimated to be €973. The market value of gross output on Cattle Finishing enterprises is estimated to be lower in 2020 relative to 2019. The market value of output is influenced by the price of cattle sold and cattle purchased. Crucially, the price of purchased cattle is higher in 2020 relative to 2019 and this reduces gross output on farms buying in cattle. As described in the Teagasc beef budgets for 2020/21, the squeeze between sales price and purchase price may be most acute for winter finishers who purchased weanlings in the autumn 2020 (Murray 2020). Steer prices are 1 percent higher in 2020 while heifer prices are 1 percent lower than 2019. In 2020, the market value of output per hectare on Cattle Finishing farms is estimated to be €1,029.
Figure 8 presents average R3 steer and weanling prices for the period 2007 to 2019 and an estimate for 2020. The weanling price refers to the value of bullocks in the 300-349 kg weight bracket.
Figure 8: Irish Cattle Prices 2007 to 2020
Source: DG Agri. and CSO; * Author’s estimate 2020.
0
100
200
300
400
500
600
700
SS 2019 SS 2020 CF 2019 CF 2020
euro
per
hec
tare
Concentrate Feeds
Pasture and Forage
Other Direct Costs
0
50
100
150
200
250
300
0
100
200
300
400
500
2007 2010 2013 2016 2019
euro
/10
0 k
g liv
e w
eigh
t
€ p
er 1
00
kg
carc
ass
wei
ght
R3 Steer Weanling

ANNUAL REVIEW AND OUTLOOK 2021
Outlook 2021 | Cattle 26
The estimated average R3 base steer price for 2020 of around €382/100kg (Including VAT) represents a 1 percent increase on the price level in 2019. The estimated average weanling price (300-349kg) is estimated to be approximately 4 percent higher in 2020 relative to 2019. The increase in weanling prices is stronger for lighter weanlings with weaker price growth evident for heavier weanlings. Gross output per hectare on Single Suckling farms varies according to the level of profitability. The most profitable one third of Single Suckling enterprises, due to higher stocking rates and other factors, continue to achieve significantly higher output per hectare (€1,358 per hectare) as compared to the middle-third (€927 per hectare) and least profitable (€662 per hectare) enterprise groups. Gross output per hectare in 2020 was on average higher on Cattle Finishing enterprises than on Single Suckling enterprises. This largely reflects the higher stocking density per hectare on these farms. The average level of gross output per hectare for Cattle Finishing enterprise in 2020 is estimated to be €1,029 (a decrease of 3 percent on the level in 2019).
Figure 9: 2019 Gross Output for Single Suckling (SS) and Cattle Finishing (CF) Enterprises and Estimate for 2020
Source: 2019 National Farm Survey (2020) and Author’s Estimates 2020
In our estimates and forecasts for 2019 and 2020, we have incorporated the payments made to cattle farmers under the Government’s BEAM, BFP, BDGP and BEEP-S schemes. The payments under many of these schemes are contingent on farmers undertaking specified measures. In the case of the BDGP and BEEP-S schemes, these may involve additional costs.
Nevertheless, payments under the BDGP and BEEP-S are still likely to add to participant’s output value. However, not all farmers with suckler cows will be able or want to participate in the BEEP-S programme. Current information indicates that approximately 23,000 farms participated in the BDGP programme. The BDGP has an annual spend of approximately €41.5m (DAFM 2020e). We estimate that coupled payments will provide an additional €97 per hectare in 2020 and 2021 to the average Single Suckling enterprise.
The above estimates represent the estimates for all cattle rearing farmers. However, some cattle farmers with suckler cows are not participating in these schemes and receive no payments on a per hectare basis. Some farmers may be participating in a subset of these schemes but not all of the schemes. For recipients of these schemes, the actual payments per hectare are therefore significantly larger than the average estimates suggests.
There is a large degree of variation in the value of gross output per hectare between the least profitable, average profitability and most profitable groups of Cattle Finishing enterprises. The most profitable Cattle Finishing enterprises are estimated to have produced an average level of gross output per hectare (€1,752 per hectare) that was 380 percent higher than the average value of output per hectare on the least profitable group of Cattle Finishing enterprises (€458 per hectare).
3.3 Beef Enterprise Margin Estimates for 2020
As shown in Figure 7, the estimated expenditure on concentrate feed by finished cattle enterprises decreased in 2020. Decreased concentrate feed expenditures and a decrease in bulky feed prices are estimated to have led to significantly lower overall expenditure on overall feed. The reduced feed expenditure plays a role in helping to improve margins for cattle finishing enterprises. For Single Suckling enterprises, the higher mart prices and the introduction of the BEEP-S schemes are the main factors in the improved margins earned. On both the Single Suckling and Cattle Finishing enterprises, the expenditure on pasture and forage costs decreased in 2020. Total direct costs on both enterprises are estimated to have decreased in 2020.
800
900
1,000
1,100
1,200
Single Suckling Cattle Finishing
euro
per
hec
tare
2019 2020

ANNUAL REVIEW AND OUTLOOK 2021
27 Cattle| Outlook 2021
On Single Suckling enterprises in 2020, the margins improved relative to 2019 but the net margin remains negative. Single Suckling enterprises in 2020, are on average estimated to have earned a negative net margin of €28 per hectare and farmers that are not participating in the BDGP or BEEP-S are likely to have incurred larger negative net margins. For the average Cattle Finishing enterprise, gross margins are estimated to have declined in 2020 due to the increase in price for younger cattle purchased mainly through the marts. Cattle Finishing enterprises are estimated to have earned a negative net margin of €42 per hectare. Table A1 and Table A2 decompose the Single Suckling and Cattle Finishing population into 3 groups of equal number on the basis of profitability (gross margin per hectare) and presents estimates of gross output, direct costs, gross margin and net margin for 2020. For both the Cattle Finishing and Single Suckling enterprises, only the top one third of farmers are estimated to have earned positive net margins in 2020. For both the Cattle Finishing and Single Suckling enterprises, the middle and bottom third of farmers experienced negative net margins. This highlights the persistent profitability challenges in Irish beef production.
4. Outlook for 2021
In this section, we forecast the expenditure for various input items and the beef price that is most likely to prevail in 2021 under a No Trade Deal Brexit scenario. We provide an estimate of the incomes from the production of cattle in 2021 under this scenario (Donnellan, Hanrahan and Thorne, 2019).
4.1 The Outlook for Input Expenditure
4.1.1 Feedstuffs in 2021
Global cereal and oilseed futures market prices point to some increase in feed prices in 2021. Cereal and other feed ingredient input prices have begun to increase in H2 2020. The 2020 harvest price for cereals and oilseeds will affect the price of feed in the back end of 2021. At this stage, our estimate for world cereal and oilseed prices in 2021 is for a significant increase relative to 2020. For 2021, our feed use forecasts are based on an assumption of normal grass growing conditions. We
therefore forecast no significant change in feed use per livestock unit in 2021. Cattle feed prices are forecast to be slightly higher in 2021, our forecast is for a 3 percent increase in overall feed expenditure on Cattle Finishing enterprises. It is estimated that a 3 percent increase in overall feed expenditure will occur on Single Suckling enterprises during 2021.
4.1.2 Fertiliser in 2021
Given the developments in global supply and global demand, the outlook for international fertiliser prices in 2021 is for prices for most fertilisers to increase relative to 2020 levels. This will mean that fertiliser prices in 2021 are forecast to be on average 5 percent higher than in 2020. In our 2021 forecast, we assume that on average fertiliser use will be down approximately 5 percent relative to the 2020 level. With higher prices and a reduction in fertiliser usage, our forecast for total expenditure on fertiliser is for no change in fertiliser expenditure relative to 2020. Under the No Trade Deal Brexit outcome, total expenditure on pasture and forage by Irish cattle farmers in 2021 is forecast to be unchanged relative to 2020.
4.1.3 Energy and Fuel in 2021
Fuel costs in 2021 will depend mainly on the evolution of crude oil prices. Current futures prices suggest that crude oil prices will increase slightly in 2021 relative to 2020 prices, leading to a 3 percent increase in fuel prices.
4.1.4 Other Direct and Fixed Costs in 2021
The cost of labour is forecast to increase by 1 percent in 2021. However, on the average Irish cattle enterprises hired labour costs are very small and inflation in labour costs is not expected to have a major impact on costs of production. General inflation is likely to continue to be low and lead to an increase in other direct costs of 1 percent. Other overhead (fixed) costs are forecast to remain unchanged in 2021.
4.2 The Outlook for Cattle and Beef Markets 2021
Ireland exports close to 90 percent of its beef production (CSO 2020c). Conditions in markets to which Irish beef and cattle are exported largely determine Irish cattle prices; though supply

ANNUAL REVIEW AND OUTLOOK 2021
Outlook 2021 | Cattle 28
developments in Ireland can cause Irish cattle prices to deviate from export market prices over the short run. Figure 10 illustrates the destinations of Irish beef exports in 2020 (year to end of August). The dominance of the UK in Ireland’s beef exports is clear as is the relatively minor role of extra-EU markets in the current Irish beef export mix. The dominance of the UK largely reflects the proximity and relative profitability of the UK as an export destination.
Figure 10: Estimate of Irish Beef Export Markets by Volume in 2020
Source: Eurostat COMEXT, January to August (2020)
In 2020, a significant increase in the share of exports to the rest of the world (ROW) is evident with this share rising from 11 percent in 2019 to 16 percent in 2020. The increase in exports to the North America and the Philippines contributes to this rising share of ROW exports. This increase has occurred despite the suspension of exports to China. A resumption of beef exports to China and a continuation of the growth in beef exports to the South-East Asia region can contribute to the demand for Irish beef over the medium to longer term. The growth in exports to EU markets is evident in recent years. Given the challenges posed by Brexit, consumer demand for beef in other EU27 member states will increasingly determine Irish cattle prices. The quantity demand for beef is declining in the EU (European Commission 2020b). However, there is some evidence of rising consumer prices for beef in many EU member states. For instance, in the Netherlands, there is evidence of rising beef and veal consumer prices since 2016 (Statistics Netherlands 2020). Bord Bia identifies the Dutch beef market as being particularly important
for beef stewing cuts (Bord Bia 2020). In Germany, beef and veal prices have increased slightly in recent years (Federal Statistics Office Germany 2020). A similar pattern is evident in Italy (ISTAT 2020). In France, more significant price increases are observed for steak, roast beef and mince beef up to 2019 (INSEE France 2020a, 2020b). In the UK, the pattern has been quite different. According to the Office for National Statistics, the current average consumer price for rump steak is 14 percent below the peak level observed during 2016 (ONS 2020a). The current average consumer price for beef mince is 25 percent below the peak level observed during 2014 (ONS 2020b). In addition, the retail sector in the UK has continued to display an increasing preference for beef products that are British sourced (AHDB 2020c). In Ireland, the domestic consumption of beef is a small proportion of domestic production. At the same time, beef consumption per capita is well above the EU average. As in the United Kingdom, there is evidence of declining consumer prices for beef in Ireland. For instance, the average consumer price for sirloin steak is currently 12 percent lower than the peak observed in 2013. Similar price declines are observed in relation to roast beef and other beef cuts (CSO 2020d). In recent years, beef prices in the United Kingdom have declined in sterling terms and to an even greater extent in euro terms. Developments in the sterling exchange rate since the calling of the UK Brexit referendum have dramatically reduced the euro value of Irish beef exports to the UK market (relative to what they would have been if the referendum had not been called). It is well established that the introduction of barriers (tariff and non-tariff barriers) to trade between the UK and Ireland (and other EU member states) will be reflected in lower Irish cattle prices. In the short run, the outlook for prime beef supplies in Ireland are determined by the current inventories of animals aged 1-2 years. Data from the Department of Agriculture, Food and the Marine (DAFM) AIMS database provide insights into developments in these inventories. Inventories for animals aged 18-24 months of age are significantly lower than the levels observed in 2019. At the same time, inventories for animals aged 12-18 months of age are slightly higher than the levels observed in 2019.
UK47%
Other EU14%
FR8%
NL8%
IT6%
ROW16%
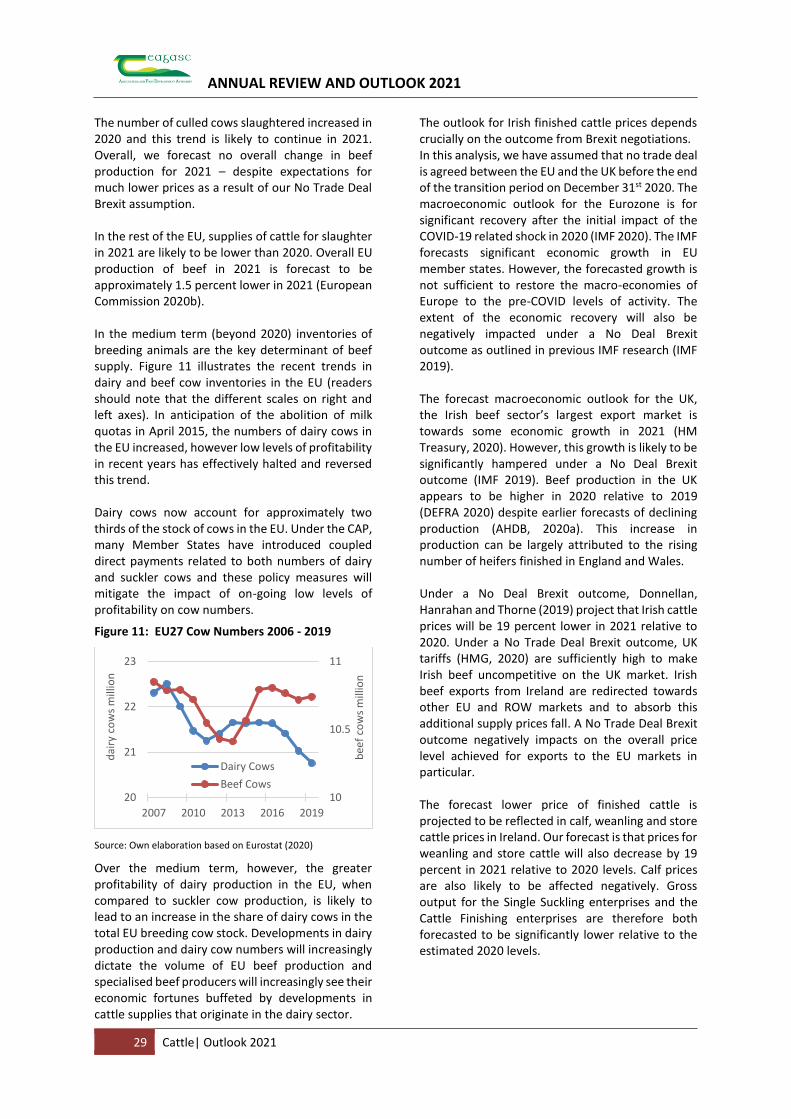
ANNUAL REVIEW AND OUTLOOK 2021
29 Cattle| Outlook 2021
The number of culled cows slaughtered increased in 2020 and this trend is likely to continue in 2021. Overall, we forecast no overall change in beef production for 2021 – despite expectations for much lower prices as a result of our No Trade Deal Brexit assumption. In the rest of the EU, supplies of cattle for slaughter in 2021 are likely to be lower than 2020. Overall EU production of beef in 2021 is forecast to be approximately 1.5 percent lower in 2021 (European Commission 2020b). In the medium term (beyond 2020) inventories of breeding animals are the key determinant of beef supply. Figure 11 illustrates the recent trends in dairy and beef cow inventories in the EU (readers should note that the different scales on right and left axes). In anticipation of the abolition of milk quotas in April 2015, the numbers of dairy cows in the EU increased, however low levels of profitability in recent years has effectively halted and reversed this trend. Dairy cows now account for approximately two thirds of the stock of cows in the EU. Under the CAP, many Member States have introduced coupled direct payments related to both numbers of dairy and suckler cows and these policy measures will mitigate the impact of on-going low levels of profitability on cow numbers.
Figure 11: EU27 Cow Numbers 2006 - 2019
Source: Own elaboration based on Eurostat (2020)
Over the medium term, however, the greater profitability of dairy production in the EU, when compared to suckler cow production, is likely to lead to an increase in the share of dairy cows in the total EU breeding cow stock. Developments in dairy production and dairy cow numbers will increasingly dictate the volume of EU beef production and specialised beef producers will increasingly see their economic fortunes buffeted by developments in cattle supplies that originate in the dairy sector.
The outlook for Irish finished cattle prices depends crucially on the outcome from Brexit negotiations. In this analysis, we have assumed that no trade deal is agreed between the EU and the UK before the end of the transition period on December 31st 2020. The macroeconomic outlook for the Eurozone is for significant recovery after the initial impact of the COVID-19 related shock in 2020 (IMF 2020). The IMF forecasts significant economic growth in EU member states. However, the forecasted growth is not sufficient to restore the macro-economies of Europe to the pre-COVID levels of activity. The extent of the economic recovery will also be negatively impacted under a No Deal Brexit outcome as outlined in previous IMF research (IMF 2019). The forecast macroeconomic outlook for the UK, the Irish beef sector’s largest export market is towards some economic growth in 2021 (HM Treasury, 2020). However, this growth is likely to be significantly hampered under a No Deal Brexit outcome (IMF 2019). Beef production in the UK appears to be higher in 2020 relative to 2019 (DEFRA 2020) despite earlier forecasts of declining production (AHDB, 2020a). This increase in production can be largely attributed to the rising number of heifers finished in England and Wales. Under a No Deal Brexit outcome, Donnellan, Hanrahan and Thorne (2019) project that Irish cattle prices will be 19 percent lower in 2021 relative to 2020. Under a No Trade Deal Brexit outcome, UK tariffs (HMG, 2020) are sufficiently high to make Irish beef uncompetitive on the UK market. Irish beef exports from Ireland are redirected towards other EU and ROW markets and to absorb this additional supply prices fall. A No Trade Deal Brexit outcome negatively impacts on the overall price level achieved for exports to the EU markets in particular. The forecast lower price of finished cattle is projected to be reflected in calf, weanling and store cattle prices in Ireland. Our forecast is that prices for weanling and store cattle will also decrease by 19 percent in 2021 relative to 2020 levels. Calf prices are also likely to be affected negatively. Gross output for the Single Suckling enterprises and the Cattle Finishing enterprises are therefore both forecasted to be significantly lower relative to the estimated 2020 levels.
10
10.5
11
20
21
22
23
2007 2010 2013 2016 2019
bee
f co
ws
mill
ion
dai
ry c
ow
s m
illio
n
Dairy Cows
Beef Cows

ANNUAL REVIEW AND OUTLOOK 2021
Outlook 2021 | Cattle 30
4.2.1 Outlook for Beef Enterprise Net Margins in 2021
Figure 12 compares the estimated and forecast average direct costs per hectare in 2020 and 2021 for the Single Suckling and Cattle Finishing enterprises. On both enterprises, the pasture and forage expenditures are expected to be unchanged in 2021. The forecasted increases in the price of fertiliser are offset by lower volumes of fertiliser usage. Concentrate feed prices are forecast to increase by three percent with no change in the quantity of concentrated feed usage. Expenditures on concentrate feed are therefore forecast to be 3 percent higher on both cattle enterprises in 2021.
Figure 12: Estimated Direct Costs for 2020 and Forecast Direct Costs for 2021
Source: Author’s Estimates 2020 and Forecasts 2021
Figure 13 shows the estimated gross margin on both cattle enterprises in 2020 and the forecasted gross margins for 2021. Under a No Trade Deal Brexit outcome, the estimated gross margin for the average Single Suckling enterprise declines dramatically by approximately 36 percent. Under a No Trade Deal Brexit outcome, the estimated gross margin for the average Cattle Finishing enterprise declines by approximately 41 percent.
Net margins for the Single Suckling enterprise are forecast to also decline dramatically in 2021. On the Single Suckling enterprise, a negative average net margin per hectare of €200 is forecast. Net margins on average on Cattle Finishing farms are forecast to decline in 2021, with a forecast average negative net margin of €236 per hectare.
Figure 13: 2020 Gross Margin for Single Suckling (SS) and Cattle Finishing (CF) Enterprises and Forecasts for 2021 under the No Trade Deal Brexit Outcome
Source: Author’s Estimates for 2020 and Forecasts for 2021
5. Concluding Comments
The onset of the COVID-19 pandemic has delivered a new set of challenges for the beef sector. However, Brexit has the potential to cause enormous damage to the beef sector in Ireland. Under a No Trade Deal Brexit outcome, cattle farms in Ireland are expected, in the absence of very significant Brexit specific income support, to lose very large amounts of farm income with average farm income falling by approximately 40 percent relative to 2020. In 2020, there are mixed outcomes in relation to incomes on cattle farms in Ireland. With the inclusion of the BEEP-S payments, the average cattle rearing farm has significantly higher income in 2020 relative to 2019. In the Cattle Other system, there appears to be no change in the average farm income although there is some variability within this broad cattle production system. Prices for younger cattle increased in 2020 relative to 2019 with increases most significant for light weanlings. At the same time, prices for finished steers increased by just 1 percent while the average price for finished heifers declined by 1 percent. Overall, the gap between factory sales prices and purchased mart prices narrowed in 2020. The introduction of the BFP and BEEP-S schemes helped support gross output and gross margins on Single Suckling farms and Cattle Finishing farms. The BFP was introduced to compensate farmers for poor
0
100
200
300
400
500
600
700
800
SS 2020 SS 2021 CF 2020 CF 2021
euro
per
hec
tare
Concentrate Feeds Pasture and Forage
Other Direct Costs
0
100
200
300
400
500
Single Suckling Cattle Finishing
euro
per
hec
tare
2020 2021

ANNUAL REVIEW AND OUTLOOK 2021
31 Cattle| Outlook 2021
prices as a result of the COVID-19 shock that occurred during Q1 and Q2. Relative to recent years, feed costs played a limited role in influencing the change in farm incomes. On Cattle Finishing farms, we estimate a small decline in feed expenditure with no change estimated for Single Suckling enterprises. In 2020, we estimate that the net margin earned on the average Cattle Finishing enterprise remains negative at approximately €42 per hectare. In addition, we estimate that the net margin earned on the average Single Suckling enterprise remains negative in 2020 at approximately €28 per hectare. Based on a No Trade Deal Brexit outcome, our forecast for 2020 is for a significant reduction in Irish cattle prices. The beef sector in Ireland has traditionally depended on the UK market for a significant share of exports. Under the No Trade Deal Brexit outcome, exports previously destined for the UK market are uncompetitive and are redirected to other markets. The levels of profit forecast for the Cattle Finishing enterprises are lower than the average observed over the period 2015-2019. In the case of the Single Suckling enterprises, the levels of profit forecast are above the average of the period 2015-2019. The profitability of the average Single Suckling and Cattle Finishing enterprise, when decoupled direct payments are excluded, has for most of the recent past been negative. On Single Suckling enterprises, the farmers’ output value for most years (2015 was an exception) has been lower than the total costs of production. While the top one third of both Single Suckling and Cattle Finishing enterprise often earn positive net margins, most enterprises are persistently failing to cover their costs of production with the value of output sold. This on-going lack of profitability reflects the structure of the industry and its high costs. The ongoing chronic profitability challenge faced by Irish beef farmers, and especially by Single Suckling farmers will be dramatically exacerbated by the impact of Brexit with or without a trade deal between the EU and the UK. In the event of there not being a trade deal agreed, the No Trade Deal scenario, incomes on Irish beef farms will drop dramatically in the absence of very significant support from the EU and the Irish Government.
The urgent challenge facing the wider Irish beef industry will be to develop new markets for Irish beef that reduce the dependence of the industry on the UK market that has traditionally been Ireland’s second “home” market. Even with a trade deal the returns on that market will decline and if the tariffs as announced by the UK Government are imposed (HMG, 2020) then Irish exports to the UK are likely to collapse dramatically in 2021. Throughout 2020, public health has taken priority in the response to the COVID-19 pandemic. With some prospect for the delivery of vaccines for COVID-19 that could mitigate the impact of the virus on economic activity in 2021, prospects for the Irish beef industry in 2021 will primarily turn on the outcome with respect to the ongoing negotiations over the nature of the future EU-UK trade relationship. If as assumed in our analysis no trade deal is agreed, EU-UK trade will be governed by the respective MFN tariff schedules of the EU and the UK. Irish exports to the UK, Irish cattle prices and incomes on Irish cattle farms will in this scenario decline dramatically. There will be an urgent need for short-term income support in this eventuality. While an agreement between the EU and the UK on a trade deal would significantly mitigate the negative economic impact of Brexit on the Irish beef sector, non-tariff barriers to trade with the UK would still result in lower cattle prices in 2021. Ongoing Teagasc analysis will provide insights on this outcome and will be published in 2021.
References AHDB (2020a) Outlook for the UK beef market, July
2020, Issue 2. Available to download at https://ahdb.org.uk/(A('xTcrINcvSX))/knowledge-library/cattle-market-outlook
AHDB (2020b) Beef carcase balance in retail
improves. Available to download at https://ahdb.org.uk/news/consumer-insight-beef-carcase-balance-in-retail-improves
AHDB (2020c) Red Meat Country of Origin Audit.
Available to download at https://ahdb.org.uk/beef-lamb-pork/red-meat-country-of-origin-audit
AHDB (2020d) A second lockdown: What it means
for consumer demand. Available to download at https://ahdb.org.uk/news/consumer-insight-a-second-lockdown-what-it-means-for-consumer-demand
ANNUAL REVIEW AND OUTLOOK 2021
Outlook 2021 | Cattle 32
Bord Bia (2020) Farmer Newsletter – Autumn 2020.
Available to download at https://www.bordbia.ie/globalassets/bordbia2020/farmers--growers/agri-market-insights/newsletters/bord-bia-farmer-newsletter-autumn-2020.pdf
Breen, J.P. and K. Hanrahan (2012) “Situation and
Outlook for Cattle 2012/2013” in Outlook 2013: Economics of Agriculture. Edited by A. Kinsella. Teagasc. Available to download at
http://www.teagasc.ie/publications/2010/891/Outlook2010.pdf
CSO (2020a) Agricultural Price Indices 2020.
Available to download at https://www.cso.ie/en/statistics/agriculture/ag
riculturalpriceindices/ CSO (2020b) Agricultural Price Indices – Preliminary
Estimates 2020 November 2020. Available to download at https://www.cso.ie/en/releasesandpublications/er/apipe/agriculturalpriceindices2020-preliminaryestimates/
CSO (2020c) Meat Supply Balance Sheet 2019
Available to download at https://www.cso.ie/en/releasesandpublications/er/msb/meatsupplybalance2019/
CSO (2020d) National Average Price by Consumer
Item and Month, Available to download at https://statbank.cso.ie/px/pxeirestat/statire/SelectVarVal/Define.asp?Maintable=CPM12&PLanguage=0
DAFM (2015) “2015 – 2020 Beef Data Genomics
Programme” Department of Agriculture, Food and the Marine Information Presentation, October and November, 2015. Available to download at http://www.agriculture.gov.ie/media/migration/farmingschemesandpayments/beefdataprogrammebdp/2015/BDGPPresentation2015051115.pptx
DAFM (2020a) Quarterly Summary Report for Feed
Usage (Various Issues). DAFM (2020b) Meat Market Report- various weeks.
Meat and Milk Policy Division, Department of Agriculture, Food and the Marine. https://www.agriculture.gov.ie/farmingsectors
/beef/beeffactorypricesweeklyreports/2020/meatmarketreportsweeklyupdates/
DAFM (2020c) Press Release - Minister Creed
confirms latest DAFM supports for Farmers during COVID-19 response
https://www.agriculture.gov.ie/press/pressreleases/2020/march/title,141149,en.html
DAFM (2020d) Age Profile for Dairy and Beef
animals. Available to download at https://www.agriculture.gov.ie/animalhealthwelfare/animalidentificationmovement/aimbovinestatisticsannualreports/bovinebirthandmovementsmonthlyreports/
DAFM (2020e) Scheme Payments Update.
Available to download at https://www.gov.ie/en/publication/ceea9-scheme-payments-update/
DEFRA (2020) United Kingdom Slaughter Statistics –
October 2020. Available to download at https://www.gov.uk/government/statistics/cattle-sheep-and-pig-slaughter
Donnellan T., Moran B., Lennon J. and E. Dillon
(2020) Teagasc National Farm Survey Preliminary Results 2019. Agricultural Economics and Farm Surveys Department, Teagasc. Available to download at https://www.teagasc.ie/publications/2020/teagasc-national-farm-survey-2019-preliminary-results.php
European Commission (2020a) Short-Term Outlook
for EU Agricultural Markets in 2020, Spring 2020, Edition No. 26. Available to download at https://ec.europa.eu/info/sites/info/files/food-farming-fisheries/farming/documents/short-term-outlook-spring-2020_en.pdf
European Commission (2020b) Short-Term Outlook
for EU Agricultural Markets in 2020 and 2021, Autumn 2020, Edition No. 28. Available to download at https://ec.europa.eu/info/sites/info/files/food-farming-fisheries/farming/documents/short-term-outlook-autumn-2020_en.pdf
Hanarahan K., Donnellan T. and F. Thorne (2019)
Outlook 2020: Brexit – Situation Update and Key Challenges. Available to download at https://www.teagasc.ie/rural-economy/teagasc-communications-on-brexit/

ANNUAL REVIEW AND OUTLOOK 2021
33 Cattle| Outlook 2021
HM Treasury (2020) “Forecasts for the UK economy:
a comparison of independent forecasts” No. 400, November 2020. Available to download at https://www.gov.uk/government/statistics/forecasts-for-the-uk-economy-november-2020
IMF (2019) World Economic Outlook, April 2019 Growth Slowdown, Precarious Recovery. Available
to download at https://www.imf.org/en/Publications/WEO/Issues/2019/03/28/world-economic-outlook-april-2019
IMF (2020) World Economic Outlook, October
2020: A Long and Difficult Ascent. Available to download at https://www.imf.org/en/Publications/WEO/Issues/2020/09/30/world-economic-outlook-october-2020
INSEE France (2020a) Consumer Price Index – Beef
and Veal, Available at https://www.insee.fr/en/statistiques/series/102342213?COICOP2016=2318949
INSEE France (2020b) Average Retail Prices -
Results by product, Available at https://www.insee.fr/en/statistiques/series/103157792
ISTAT Italy (2020) Consumer Prices for the Whole
Nation – Beef and Veal, Available at http://dati.istat.it/Index.aspx?QueryId=23048&lang=en
Murray A. (2020) Teagasc Beef Budgets - Winter
Finishing Steers, Available to download at https://www.teagasc.ie/publications/2020/winter-finishing-steers.php
Office for National Statistics (2020a) RPI: Ave price
-Beef: home-killed, rump steak, Available to download at https://www.ons.gov.uk/economy/inflationandpriceindices/timeseries/czpf/mm23
Office for National Statistics (2020b) RPI: Ave price
- Beef: home-killed, best beef mince, per Kg, Available to download at https://www.ons.gov.uk/economy/inflationandpriceindices/timeseries/czpf/mm23
Federal Statistical Office of Germany (2020) Consumer Prices – Beef and Veal. Available to download at
https://www.destatis.de/EN/Themes/Economy/Prices/Consumer-Price-Index/_node.html#sprg266060
Statistics Netherlands (2020a) Consumer prices;
average prices of consumer goods, 2000 – 2018. Available to download at https://opendata.cbs.nl/#/CBS/en/dataset/80346eng/table?ts=1605631989632
Statistics Netherlands (2020b) Consumer prices-
Beef and Veal, Available to download at https://opendata.cbs.nl/#/CBS/en/dataset/83131ENG/table
Teagasc (2020a) Teagasc National Farm Survey
Results 2019: Single Suckling Enterprise Fact Sheet. Available to download at https://www.teagasc.ie/publications/2020/nfs2019-single-suckling-enterprise-factsheet.php
Teagasc (2020b) Teagasc National Farm Survey
Results 2019: Cattle Finishing Enterprise Fact Sheet. Available to download at https://www.teagasc.ie/publications/2020/nfs2019-cattle-finishing-enterprise-factsheet.php
USDA (2020) Livestock and Poultry: World Markets
and Trade. United States Department of Agriculture – Foreign Agricultural Service. October 2020. Available to download at https://apps.fas.usda.gov/psdonline/circulars/livestock_poultry.pdf
Acknowledgements The authors would like to thank the staff and recorders of the National Farm Survey, in particular Brian Moran and John Lennon, for their assistance in conducting the analysis contained in this paper, industry contacts that provided valuable feedback on input and output market developments and Agricultural Economics and Farm Surveys Department colleagues who provided valued criticism. Any errors or omissions remain the sole responsibility of the authors.

ANNUAL REVIEW AND OUTLOOK 2021
Outlook 2021 |Cattle 34
Table A1: 2019 and Estimated 2020 Financial Performance per hectare: Single Suckling Enterprise
Most Profitable Average
Profitability
Least Profitable Average
euro per hectare
Gross Output 2019 1,297 879 623 931
Direct Costs 2019 563 494 468 508
Concentrate Costs 152 137 147 145
Pasture and Forage Costs 274 255 235 255
Other Direct Costs 137 102 86 108
Gross Margin 2019 734 385 155 423
Overhead Costs 2019 626 505 395 508
Net Margin 2019 108 -120 -240 -85
Gross Output 2020 1,358 927 662 973
Direct Costs 2020 556 486 461 500
Concentrate Costs 151 135 145 144
Pasture and Forage Costs 263 245 226 244
Other Direct Costs 142 106 90 112
Gross Margin 2020 802 441 202 472
Overhead Costs 2020 617 497 389 500
Net Margin 2020 186 -57 -187 -28
Source: Teagasc National Farm Survey Single Suckling Enterprise Fact Sheet 2019 (Teagasc NFS, 2020a) and Authors’ Estimates 2020
Table A2: 2019 and Estimated 2020 Financial Performance per hectare: Cattle Finishing Enterprise
Most Profitable Average
Profitability
Least Profitable Average
euro per hectare
Gross Output 2019 1,806 945 473 1,063
Direct Costs 2019 856 555 363 587
Concentrate Costs 474 204 145 271
Pasture and Forage Costs 273 261 172 235
Other Direct Costs 109 90 46 81
Gross Margin 2019 950 390 109 476
Overhead Costs 2019 729 437 381 512
Net Margin 2019 222 -46 -272 -36
Gross Output 2020 1,752 915 458 1,029
Direct Costs 2020 749 498 350 568
Concentrate Costs 377 156 138 260
Pasture and Forage Costs 262 251 165 225
Other Direct Costs 110 91 47 82
Gross Margin 2020 1,003 418 108 462
Overhead Costs 2020 718 430 375 504
Net Margin 2020 285 -13 -267 -42
Source: Teagasc National Farm Survey Cattle Finishing Enterprise Fact Sheet 2019 (Teagasc NFS, 2020a) and Authors’ Estimates 2020

ANNUAL REVIEW AND OUTLOOK 2021
35 Cattle| Outlook 2021
Table A3: Forecast 2021 Single Suckling Enterprise Financial Performance per hectare
Average
euro per hectare
Gross Output 2021 806
Direct Costs 2021 505
Concentrate Costs 148
Pasture and Forage Costs 244
Other Direct Costs 112
Gross Margin 2021 302
Overhead Costs 2021 502
Net Margin 2021 -200
Source: Authors’ forecast 2021
Table A4: Forecast 2021 Cattle Finishing Enterprise Financial Performance per hectare
Average
euro per hectare
Gross Output 2021 848
Direct Costs 2021 576
Concentrate Costs 268
Pasture and Forage Costs 225
Other Direct Costs 83
Gross Margin 2021 272
Overhead Costs 2021 507
Net Margin 2021 -236
Source: Authors’ forecast 2021


ANNUAL REVIEW AND OUTLOOK 2021
39 Sheep| Outlook 2021
Review of Sheep Farming in 2020 and Outlook for 2021 Anne Kinsella and Kevin Hanrahan
Agricultural Economics and Farm Surveys Department, Teagasc
1. Introduction
For this paper, data from farms in the Teagasc National Farm Survey (NFS), which have a mid-season lowland lamb enterprise, are used together with data from the Central Statistics Office (CSO), European Commission DG Agri and Eurostat to analyse the financial performance of Irish sheep farms. Estimates of enterprise margins for 2020 are based on 2019 Teagasc NFS data and on CSO price indices for the year to date (CSO, 2020a) and preliminary CSO estimates for 2020 (CSO, 2020b). Forecasts for sheep enterprise margins for 2021 are based on our estimates of margins for 2020, and our forecasts of input and output price and volume changes in 2021. We begin the paper with a brief review of the outturn for Family Farm Income (FFI) for the Teagasc NFS mainly sheep farms in 2019. A detailed assessment of the 2019 mid-season lowland lamb enterprise margins is then presented in section 3. This is followed by an overview of the current short term outlook for European and Irish sheep markets in section 4. Estimates and forecasts of margins for the mid-season lowland lamb enterprise for 2020 and 2021 are then presented in sections 5 and 6. The mid-season lowland lamb enterprise is the predominant lowland sheep system in Ireland. In
our analysis we have limited the sample analysed to those enterprises with more than 20 breeding ewes. In our analysis of enterprise margins for 2021 we have assumed that the Sheep Welfare Scheme payment will continue in 2021. As in 2020, we have assumed that the payment will be paid on a per ewe basis, at a rate of €10 per ewe. At an average stocking rate of approximately 7 ewes per hectare, this is equivalent to about €70 per hectare. However, based on average actual payments per hectare over the past few years an estimate of €60 is applied. This payment is incorporated in estimates of enterprise output for 2020 and forecasts for 2021 as it is linked to production.
2. Review of the Economic Performance of Sheep Farms in 2019
FFI on those farms classified by the Teagasc NFS as mainly sheep farms increased by 11 percent in 2019, to an average of €14,780. The average FFI earned on these farms for the period 2013 through 2019 is shown in Figure 1. The increase in FFI on sheep farms in 2019 can be explained by a decrease in concentrate feed expenditure of 18 percent. Overall total direct costs of production declined by an average of 5 percent while total overhead costs declined by over 2
Brexit Assumptions: No post Brexit Trade Deal has been agreed between the EU and UK (as of Dec 1st 2020)
UK Brexit Transition period ends on Dec 31st 2020
Without a trade deal, EU – UK trade post 2020 will be based on mutual application of
MFN tariff schedules
Trade and price impacts would occur
but no immediate supply response is assumed in 2021
Income projections for 2021 do not reflect any possible policy response
While the EU and the Irish Government will likely respond to a No Deal outcome with
increased sectoral support, this is not factored in the 2021 income projections
Forecasts of the farm income reduction in 2021 are therefore indicative of the resources
required to mitigate the economic impact of Brexit on farm incomes

ANNUAL REVIEW AND OUTLOOK 2021
Outlook 2021 | Sheep 40
percent. Overall for 2019, the value of sheep output remained relatively stable, with a small reduction in lamb and sheep prices.
Figure 1: Average Income on Mainly Sheep Farms in Ireland: 2013 to 2019
Source: Teagasc National Farm Survey (various years)
The mixed nature of most Irish sheep farms means that developments affecting non-sheep enterprise profitability can significantly influence the income performance of sheep farms. It is important to note that farms classified as Mainly Sheep include both specialist sheep and also a sub category of farms on which sheep and cattle are combined. Of the total gross output on these mainly sheep farms for 2019 year almost one half pertains to gross output from the various cattle enterprises. For the 2019 year the mainly sheep farm gross output will also be inclusive of payments to farmers under the Beef Exceptional Aid Measure (BEAM) and Beef Environmental Efficiency Pilot (BEEP) schemes. Direct payments in 2019 were up slightly year-on-year to €19,495 on average. This increase is largely as a result of BEAM payments to farmers with qualifying cattle. The provision of these additional supports that compensated for a period of exceptionally low cattle prices in 2019 also benefitted incomes on those sheep farms that also have cattle. In 2019 the value of cattle output on farms classified as sheep farms by the Teagasc NFS increased, while crop output value declined and the output value of sheep production remained relatively stable. In the remainder of this paper we focus exclusively on the mid-season lamb enterprise as the unit of analysis. This allows us to isolate the impact of developments in sheep output prices and related costs of production on the profitability of Irish sheep production. All enterprise margins are exclusive of direct payments that are decoupled from production. However, enterprise margins for mid-season lowland lamb do include coupled
payments related to sheep production. In 2020 and 2021, payments to farmers participating in the Sheep Welfare Scheme will boost the value of gross output and margins per hectare.
3. Sheep Margins in 2019
Changes in the value of output, costs and gross margin per hectare for the mid-season lowland lamb enterprise in 2019 are shown in Table A1 of the Appendix to this paper. For 2019, the value of gross output for mid-season lamb enterprises declined by 2 percent. The main driver of this output value decline were lower lamb prices as compared to 2018. The volume of carcass output per hectare increased in 2019, due to a decline in lamb mortality and higher numbers of ewes per hectare in 2019. In 2019 the stocking rate of ewes per hectare increased by 2 percent. When combined with a 4 percent increase in the weaning rate per ewe, overall estimated lamb carcass per ha increased by 6 percent. In 2019 total direct costs per hectare on the average mid-season lamb enterprise decreased by 2 percent. Pasture and forage costs declined by 2 percent relative to 2018, while expenditure on concentrate feed declined by 6 percent. Gross margins in 2019 decreased by 3 percent relative to 2018, due to growth in the other direct costs of production which outpaced the decline in concentrate and pasture and forage costs and lower output value that was driven by lower lamb prices. Gross output value per hectare declined despite an 18 percent increase in coupled payments per hectare year on year. Historically, there has been a wide range in the profitability of sheep farms operating the mid-season lamb system. In part, this range in profitability is reflective of differing agronomic conditions such as soil quality which limit the capacity of some farms to increase their intensity of production For comparison purposes, in Table A2 mid-season lowland lamb enterprises are ranked on the basis of gross margin per hectare, and assigned to three equally sized groups which we have termed least profitable, average and most profitable. The average levels of output, direct costs and gross and net margin per hectare, as well as indicators of technical performance across these three groups, can then be compared.
0
5,000
10,000
15,000
20,000
2013 2014 2015 2016 2017 2018 2019
euro
per
far
m
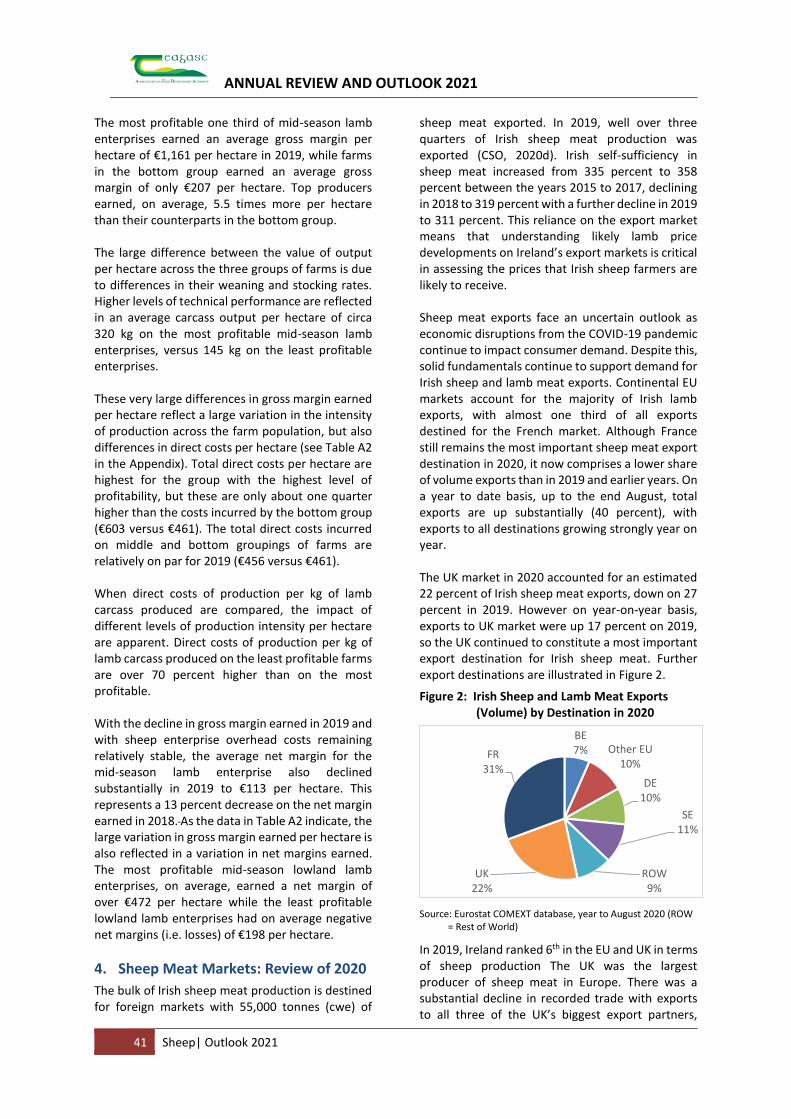
ANNUAL REVIEW AND OUTLOOK 2021
41 Sheep| Outlook 2021
The most profitable one third of mid-season lamb enterprises earned an average gross margin per hectare of €1,161 per hectare in 2019, while farms in the bottom group earned an average gross margin of only €207 per hectare. Top producers earned, on average, 5.5 times more per hectare than their counterparts in the bottom group. The large difference between the value of output per hectare across the three groups of farms is due to differences in their weaning and stocking rates. Higher levels of technical performance are reflected in an average carcass output per hectare of circa 320 kg on the most profitable mid-season lamb enterprises, versus 145 kg on the least profitable enterprises. These very large differences in gross margin earned per hectare reflect a large variation in the intensity of production across the farm population, but also differences in direct costs per hectare (see Table A2 in the Appendix). Total direct costs per hectare are highest for the group with the highest level of profitability, but these are only about one quarter higher than the costs incurred by the bottom group (€603 versus €461). The total direct costs incurred on middle and bottom groupings of farms are relatively on par for 2019 (€456 versus €461). When direct costs of production per kg of lamb carcass produced are compared, the impact of different levels of production intensity per hectare are apparent. Direct costs of production per kg of lamb carcass produced on the least profitable farms are over 70 percent higher than on the most profitable. With the decline in gross margin earned in 2019 and with sheep enterprise overhead costs remaining relatively stable, the average net margin for the mid-season lamb enterprise also declined substantially in 2019 to €113 per hectare. This represents a 13 percent decrease on the net margin earned in 2018. As the data in Table A2 indicate, the large variation in gross margin earned per hectare is also reflected in a variation in net margins earned. The most profitable mid-season lowland lamb enterprises, on average, earned a net margin of over €472 per hectare while the least profitable lowland lamb enterprises had on average negative net margins (i.e. losses) of €198 per hectare.
4. Sheep Meat Markets: Review of 2020
The bulk of Irish sheep meat production is destined for foreign markets with 55,000 tonnes (cwe) of
sheep meat exported. In 2019, well over three quarters of Irish sheep meat production was exported (CSO, 2020d). Irish self-sufficiency in sheep meat increased from 335 percent to 358 percent between the years 2015 to 2017, declining in 2018 to 319 percent with a further decline in 2019 to 311 percent. This reliance on the export market means that understanding likely lamb price developments on Ireland’s export markets is critical in assessing the prices that Irish sheep farmers are likely to receive. Sheep meat exports face an uncertain outlook as economic disruptions from the COVID-19 pandemic continue to impact consumer demand. Despite this, solid fundamentals continue to support demand for Irish sheep and lamb meat exports. Continental EU markets account for the majority of Irish lamb exports, with almost one third of all exports destined for the French market. Although France still remains the most important sheep meat export destination in 2020, it now comprises a lower share of volume exports than in 2019 and earlier years. On a year to date basis, up to the end August, total exports are up substantially (40 percent), with exports to all destinations growing strongly year on year. The UK market in 2020 accounted for an estimated 22 percent of Irish sheep meat exports, down on 27 percent in 2019. However on year-on-year basis, exports to UK market were up 17 percent on 2019, so the UK continued to constitute a most important export destination for Irish sheep meat. Further export destinations are illustrated in Figure 2.
Figure 2: Irish Sheep and Lamb Meat Exports (Volume) by Destination in 2020
Source: Eurostat COMEXT database, year to August 2020 (ROW = Rest of World)
In 2019, Ireland ranked 6th in the EU and UK in terms of sheep production The UK was the largest producer of sheep meat in Europe. There was a substantial decline in recorded trade with exports to all three of the UK’s biggest export partners,
BE7% Other EU
10%
DE10%
SE11%
ROW9%
UK22%
FR31%
ANNUAL REVIEW AND OUTLOOK 2021
Outlook 2021 | Sheep 42
France, Germany and Ireland, declining 23, 27 and 31 percent respectively. UK export prices (when denominated in sterling) were 29 percent higher year on year, and this was reflected in higher domestic UK (GBP) farm gate prices. The year to date volume of exports are circa 9 percent lower than in 2019, while the value of UK exports value nearly 10 percent higher owing to the higher prices achieved during 2020. UK sheep slaughterings, January to October 2020, were down over 3 percent on 2019. AHDB estimate that for 2020 year as a whole that lamb and ewe slaughter will be down 4 and 9 percent respectively, with the breeding flock to continue to contract. This follows on from a 2 percent decline in breeding flock last year. While sheep meat volumes imported last year by UK from New Zealand and Australia were the lowest for some years, the 2020 year saw an increase albeit from lower levels, with volumes from NZ and Australia increasing by 57 and 102 percent respectively up to September. The strong price margin over the preceding few weeks most likely drove this increase with increased volumes expected to carry into October data. At a global level Australia and New Zealand (NZ) maintain their dominance in 2020 as the largest exporters of sheep and goat products (at over 300 thousand tonnes on average up to September), followed well behind by UK (c. 50 thousand tonnes), EU, USA and Kenya. NZ sheep numbers have fallen over 2 percent year on year in 2020 (to 26.21m head), predominantly due to poor climatic conditions earlier in the year which has resulted in a reduction in the number of young stock held as replacements. The decline in the sheep flock will see NZ lamb kill drop further in 2021. Farm gate prices in NZ are set to drop from record highs experienced over the previous two seasons owing to in particular reduced demand for higher value cuts, which are highly reliant on foodservice. Tight NZ supplies (as in Australia), combined with robust domestic and Chinese demand is expected to maintain midpoint 2020-21 forecast prices above the five year average price levels. However the long term trend of declining NZ supplies is expected to continue into the 2021 season. The production outlook into 2021 year for New Zealand sheep meat is for a slight decline in sheep meat (Rabobank, Global animal protein Outlook 2021).
In Australia, despite the smallest sheep flock in over 75 years, better breeding conditions and an increasing focus on lamb production are expected to be reflected in increased lamb slaughter in 2021. As a result, production and exports should increase. This follows on from the lowest slaughter numbers for 8 years in 2020. Domestic demand for sheep and flock rebuilding are expected to remain firm. While export demand for lamb will be key for Australian prices, weaker domestic economic conditions are expected to result in lower prices than those that prevailed in 2020. The average prices for lamb are forecast to decline by 9 percent in 2020–2021. The economic impact of COVID-19 will reduce global and domestic (Australian) demand for sheep meat, placing downward pressure on prices. The weaker price outlook is likely to be augmented by an expected appreciation of the Australian dollar that will further reduce global demand for Australian sheep. Overall Australian sheep meat exports are forecast to fall by 4 percent in 2020–21 (ABARES 2020). In 2021 the impact of African swine fever on domestic pig herds will continue to drive Chinese consumer demand for other proteins, including sheep meat. China (incl. Hong Kong) continued in 2020 to be the largest importer of sheep meat globally. However, according to the U.S. Meat Export Federation, around 65 percent of sheep meat is consumed outside the home in China so that further delays in reopening the food service industry due to subsequent waves of COVID-19 are likely to continue to constrain demand in 2021. EU sheep meat imports of sheep and goat meat and live animals (COMEXT Trade figures) have continued to decline in 2020. EU sheep meat exports from Jan to September in 2020 increased almost 8 percent while live exports declined over 2 percent. In 2020 EU production of sheep meat is estimated to have remained relatively stable following a decline of circa 4 percent year on year for the first half of 2020 year. EU production was supported by a steady EU domestic demand. EU meat consumption per capita is expected to decline modestly in 2020. EU self-sufficiency in sheep and goat meat is forecast by DG Agri to be in the region of 95 percent. This is an increase of 1 percent on 2019 year and up from 90 percent in 2018, so that over past decade EU self-sufficiency has been increasing.
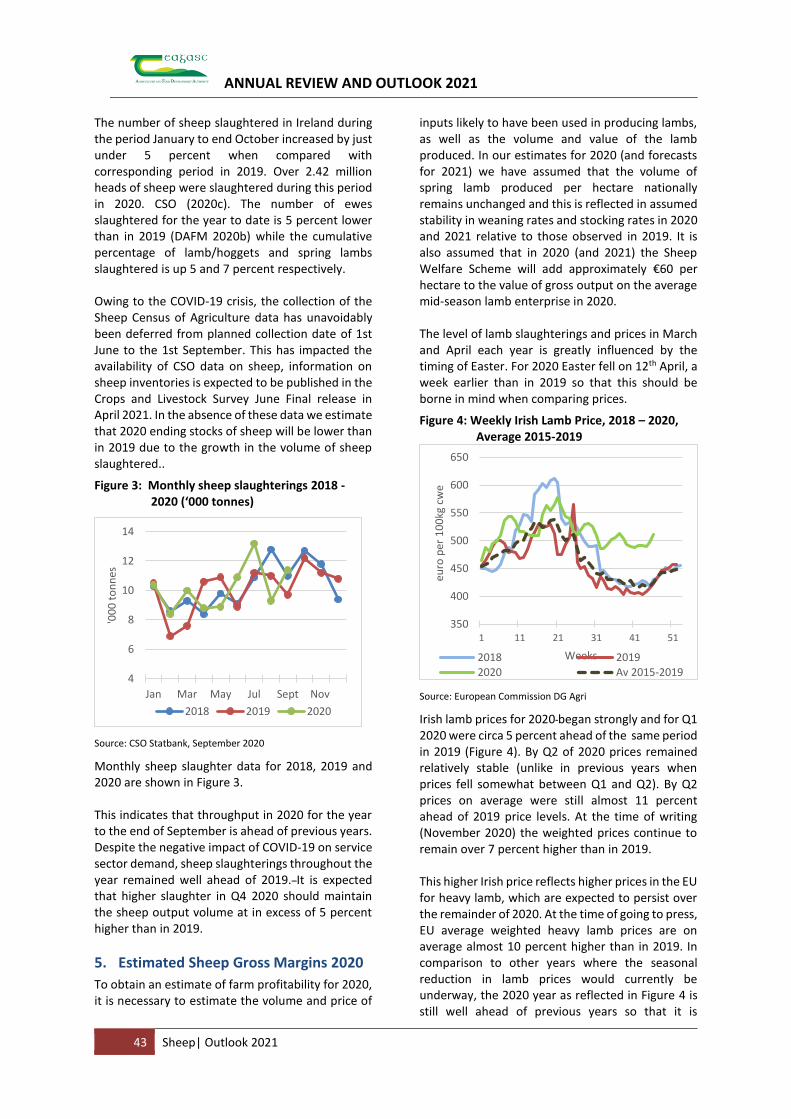
ANNUAL REVIEW AND OUTLOOK 2021
43 Sheep| Outlook 2021
The number of sheep slaughtered in Ireland during the period January to end October increased by just under 5 percent when compared with corresponding period in 2019. Over 2.42 million heads of sheep were slaughtered during this period in 2020. CSO (2020c). The number of ewes slaughtered for the year to date is 5 percent lower than in 2019 (DAFM 2020b) while the cumulative percentage of lamb/hoggets and spring lambs slaughtered is up 5 and 7 percent respectively. Owing to the COVID-19 crisis, the collection of the Sheep Census of Agriculture data has unavoidably been deferred from planned collection date of 1st June to the 1st September. This has impacted the availability of CSO data on sheep, information on sheep inventories is expected to be published in the Crops and Livestock Survey June Final release in April 2021. In the absence of these data we estimate that 2020 ending stocks of sheep will be lower than in 2019 due to the growth in the volume of sheep slaughtered..
Figure 3: Monthly sheep slaughterings 2018 - 2020 (‘000 tonnes)
Source: CSO Statbank, September 2020
Monthly sheep slaughter data for 2018, 2019 and 2020 are shown in Figure 3. This indicates that throughput in 2020 for the year to the end of September is ahead of previous years. Despite the negative impact of COVID-19 on service sector demand, sheep slaughterings throughout the year remained well ahead of 2019. It is expected that higher slaughter in Q4 2020 should maintain the sheep output volume at in excess of 5 percent higher than in 2019.
5. Estimated Sheep Gross Margins 2020
To obtain an estimate of farm profitability for 2020, it is necessary to estimate the volume and price of
inputs likely to have been used in producing lambs, as well as the volume and value of the lamb produced. In our estimates for 2020 (and forecasts for 2021) we have assumed that the volume of spring lamb produced per hectare nationally remains unchanged and this is reflected in assumed stability in weaning rates and stocking rates in 2020 and 2021 relative to those observed in 2019. It is also assumed that in 2020 (and 2021) the Sheep Welfare Scheme will add approximately €60 per hectare to the value of gross output on the average mid-season lamb enterprise in 2020. The level of lamb slaughterings and prices in March and April each year is greatly influenced by the timing of Easter. For 2020 Easter fell on 12th April, a week earlier than in 2019 so that this should be borne in mind when comparing prices.
Figure 4: Weekly Irish Lamb Price, 2018 – 2020, Average 2015-2019
Source: European Commission DG Agri
Irish lamb prices for 2020 began strongly and for Q1 2020 were circa 5 percent ahead of the same period in 2019 (Figure 4). By Q2 of 2020 prices remained relatively stable (unlike in previous years when prices fell somewhat between Q1 and Q2). By Q2 prices on average were still almost 11 percent ahead of 2019 price levels. At the time of writing (November 2020) the weighted prices continue to remain over 7 percent higher than in 2019. This higher Irish price reflects higher prices in the EU for heavy lamb, which are expected to persist over the remainder of 2020. At the time of going to press, EU average weighted heavy lamb prices are on average almost 10 percent higher than in 2019. In comparison to other years where the seasonal reduction in lamb prices would currently be underway, the 2020 year as reflected in Figure 4 is still well ahead of previous years so that it is
4
6
8
10
12
14
Jan Mar May Jul Sept Nov
'00
0 t
on
nes
2018 2019 2020
350
400
450
500
550
600
650
1 11 21 31 41 51
euro
per
10
0kg
cw
e
Weeks2018 20192020 Av 2015-2019

ANNUAL REVIEW AND OUTLOOK 2021
Outlook 2021 | Sheep 44
estimated that the average prices for 2020 as a whole will be significantly higher than the 2019 level.
Figure 5: Irish Lamb Price, 2005 to 2020e, 2021f
Source: European Commission DG AGRI and author estimate
2020, forecast 2021
Our estimate is that Irish lamb prices in 2020 will be on average over 9 percent higher than in 2019. While average carcass weights are back circa 2 percent compared to 2019, this will confer a slight limiting factor off the growth in the higher lamb prices. The volume of lamb output per hectare is assumed to remain stable in 2020. Consequently, our estimated higher lamb price is fully reflected in higher output value per hectare in 2020. The main direct costs of production for Irish sheep farms are purchased feed, pasture and forage costs. Overall, input costs are estimated to have increased only marginally in 2020. Purchased concentrate feed accounts for 40 percent of total direct input expenditure on the average mid-season lowland lamb system. Over the course of 2020, the trend in feed usage is marginally up on 2019 and this coupled with a forecast decline in concentrate feed prices, circa 1 percent, means that concentrate feed costs will be higher than in 2019 on sheep farms. The Department of Agriculture, Food and Marine feed sales data for Q1 2020 show an increase of 5 percent compared to same period in 2019 while data for Q2 and Q3 show an increase of 6 and 21 percent respectively. Overall concentrate costs are estimated to increase by almost 7 percent in 2020 on the average mid-season lowland lamb enterprise. Pasture and forage costs typically account for 30 percent of total direct costs on the mid-season lowland lamb system. Fertiliser prices are estimated to have declined by 10 percent in 2020 so that fertiliser costs on sheep farms in 2020 will be well
below 2019 levels. In our estimates for 2020 we have assumed a slight increase in the volume of fertiliser used by mid-season lowland enterprises in 2020 Spending on contracting charges in 2020 is estimated to remain on par with 2019, with overall expenditure on pasture and forage estimated to have declined by 7 percent, compared to 2019. In 2020, total direct costs of production on the mid-season lowland lamb enterprise are estimated to have increased slightly, by just over 1 percent on 2019 levels. Fuel and electricity are the main items contributing to overhead cost changes in 2020. Prices of fuel and electricity are estimated to decline, by 10 and 1 percent respectively, with usage on mid-season lowland sheep farms expected to remain on par with 2019 levels. Overall, overhead costs on the mid-season lamb enterprise are estimated to have decreased by almost 2 percent relative to 2019 Lower costs of production coupled with the receipt of payments from the Sheep Welfare Scheme and higher marketed output values in 2020 are estimated to have resulted in substantially higher margins on the average mid-season lowland lamb enterprise. The gross margin earned in 2020 is estimated to have increased by almost 43 percent to €898 per hectare (see Table A3 in the Appendix). The receipt of payments from participation in the Sheep Welfare Scheme boosted the estimated gross margin earned from the mid-season lowland lamb enterprise in 2020. In the absence of this coupled payment, the estimated increase in gross margins would have been closer to 30 percent. Slight declines in overhead costs in 2020 mean that the enterprise net margin on the mid-season lowland lamb enterprise is also estimated to have increased strongly with the level in 2020 over 190 percent higher than that in 2019. The estimated average net margin per hectare on mid-season lowland sheep farms in 2020 is €328 per hectare.
6. Outlook for the Sheep Enterprise Gross Margin in 2021
In 2021, Irish lamb prices are forecast to increase by 7 percent on the estimated 2020. Continental EU markets account for the majority of Irish lamb and although economic disruptions from the COVID-19 pandemic continue to impact consumer demand, solid fundamentals continue to support demand for Irish sheep and lamb meat exports.
0
100
200
300
400
500
600
2005 2008 2011 2014 2017 2020e
euro
per
10
0 k
g cw
e

ANNUAL REVIEW AND OUTLOOK 2021
45 Sheep| Outlook 2021
The outlook for input expenditure in 2021, from the perspective of Irish sheep farmers, is not as positive as in 2020, with prices of the key inputs to sheep production forecast to increase, albeit small increases. The volume of inputs used in 2021 is forecast to remain unchanged (on a per hectare basis), so that total direct and overhead costs of production are forecast to increase relative to 2020. Concentrate prices are forecast to increase in 2021. The volume of feed use is forecast to remain comparable with 2020 levels, so that expenditure on concentrates in 2021 is forecast to increase by 3 percent. The price of fertiliser is forecast to increase in 2021. Expenditure on contractor charges is expected to remain stable in 2021. Overall, pasture and forage costs on Irish lowland mid-season lamb enterprises are forecast to increase by almost 5 percent in 2021. Table A3 (in the Appendix) summarises our forecasts of output, costs and margins for the mid-season lamb enterprise for 2021. Given a positive outlook for lamb prices in 2021, coupled with a forecast increase in direct costs of production, the average gross margin earned from sheep farming is expected to increase in 2021. The forecast 2021 gross margin per hectare for the mid-season lamb system is €976 per hectare, an almost 9 percent increase on our 2020 estimate. In 2021, margins earned on the mid-season lowland lamb enterprise will continue to be boosted by the receipt of the coupled Sheep Welfare Scheme payment. Total overhead costs for the average mid-season lamb enterprise are forecast to increase marginally in 2020. As a result of the forecast increases in input prices for 2021, total costs of production are expected to be 2 percent higher in 2021 than in 2020. With increased output value forecast, net margin per hectare for the average sheep enterprise is expected to increase in 2021 to €404 per hectare.
7. Concluding Comments
The average gross margin earned by mid-season lamb producers in 2020 is estimated to have increased compared to that earned in 2019. Higher lamb prices, higher throughput volume and consequently higher gross output values more than offset only slightly higher total direct costs of production. Savings from lower input prices almost
offset slightly higher input use volumes. Direct payment receipts associated with participation in the Sheep Welfare Scheme added to the positive margin story on sheep farms for 2020. The scheme provides a significant financial boost at the individual farm level with an additional year of the Scheme opening in February 2021. Our forecast is that 2021 Irish lamb prices will remain positive and circa 7 percent above 2020 levels. Output volume is assumed to remain constant, based on 2020 levels. Gross margins earned by the average mid-season lamb enterprise in 2021 are forecast to increase relative to those estimated for 2020, due to positive lamb prices continuing into 2021 lamb season. The gross margin forecast for 2021 is €976 per hectare, a 9 percent increase on the estimated gross margin for 2020. Average net margins are also forecast to also increase, with the average mid-season lamb enterprise forecast to earn a net margin of €404 per hectare in 2021 that is 43 percent higher than that estimated for 2020.

ANNUAL REVIEW AND OUTLOOK 2021
Outlook 2021 | Sheep 46
References
ABARES (2020). Agricultural Commodities: September Quarter 2020, Australian Bureau of Agricultural and Resource Economics and Sciences, Canberra. Available to download at
https://www.agriculture.gov.au/abares/research-topics/agricultural-outlook/data#agricultural-commodities
AHDB (2020). UK Sheep Outlook, July 2020
Available to download at
https://projectblue.blob.core.windows.net/media/Default/Market%20Intelligence/lamb/MS/2020%20CSW/06%20June/Sheep%20outlook%20Iss%201%20Jul%202020.pdf
July 2019 http://beefandlamb.ahdb.org.uk/wp-content/uploads/2019/08/Sheep-outlook-Iss-3-Jul-19-FINAL.pdf
Beef & Lamb New Zealand (2020). New Season Outlook 2019-20. Beef + Lamb New Zealand Economic Service P19019B
https://beeflambnz.com/sites/default/files/data/files/B%2BLNZ%20New%20Season%20Outlook%202020-21.pdf
Beef & Lamb New Zealand (2020). Stock Number Survey. 30 June 2020 Beef + Lamb New Zealand Economic Service P19019B
https://beeflambnz.com/sites/default/files/data/files/Stock-Number-Survey-30-June-2020.pdf
CSO (2020a). Agricultural Price Indices August 2020. Available to download at
https://www.cso.ie/en/releasesandpublications/er/api/agriculturalpriceindicesaugust2020/
CSO (2020c). Livestock slaughterings, September 2020. Available to download at
https://www.cso.ie/en/releasesandpublications/er/ls/livestockslaughteringsseptember2020/
CSO (2020d). Meat supply balance, October 2020. Available to download at
https://www.cso.ie/en/releasesandpublications/er/msb/meatsupplybalance2019/
CSO (2020e). Crops and Livestock Survey, June 2020 Provisional. Available to download at
https://www.cso.ie/en/releasesandpublications/er/clsjp/cropsandlivestocksurveyjuneprovisional2020/
Note: Sheep: Due to COVID-19 crisis, the collection of the Census of Agriculture has unavoidably
been deferred from planned collection date of 1st June to 1st September. This has impacted the availability of the 2020 results for sheep data. This data is due to be published in the Crops and Livestock Survey June Final release in April 2021.
https://pdf.cso.ie/www/pdf/20190918121039_Crops_and_Livestock_Survey_June_Provisional_2019_full.pdf
CSO (2020f) Livestock Survey, December 2019. Available to download athttps://www.cso.ie/en/releasesandpublications/er/lsd/livestocksurveydecember2019/
DAFM (2020a). Quarterly Summary Report for Feed Usage (Various Issues).
DAFM (2020b). Meat Market Report (various issues). Department of Agriculture, Food and the Marine. Available to download at https://www.agriculture.gov.ie/farmingsectors/beef/beeffactorypricesweeklyreports/2020/meatmarketreportsweeklyupdates/
DEFRA (2020). United Kingdom Slaughter Statistics, Nov 2020. Available to download at
https://assets.publishing.service.gov.uk/government/uploads/system/uploads/attachment_data/file/934535/slaughter-statsnotice-12nov20.pdf
Donnellan, T., and Kinsella, A. (2019). Outlook 2020, TResearch , Winter 2019, volume 14 no.4 . Available to download at https://www.teagasc.ie/media/website/publications/2019/TResearch_Winter2019_Outlook2020_Web.pdf
Donnellan, T., Moran B., Lennon, J. and Dillon, E., (2020). Teagasc National Farm Survey 2019. Teagasc, Rural Economy Development Programme Athenry Ireland. Available to download at: https://www.teagasc.ie/media/website/publications/2020/TeagascNFS2019-Preliminary-Results.pdf
Donnellan T., Hanrahan K., Kinsella A. Lennon, J., Moran B. and Thorne F (2020). Situation and Outlook for Irish agriculture, July 2020, Teagasc. https://www.teagasc.ie/media/website/publications/2020/Situation-and-outlook-for-Irish-Agriculture.pdf
Dillon, E., Donnellan T., Hanrahan K., Houlihan T, Kinsella A. Loughrey, J., McKeon M., Moran B. and Thorne F (2019). Outlook 2020 Economic Prospects for Agriculture, Teagasc.

ANNUAL REVIEW AND OUTLOOK 2021
47 Sheep| Outlook 2021
https://www.teagasc.ie/publications/2019/outlook-2020.php
Hanrahan, J.P. (2006). “Observations on variation in weight and classification of carcasses for Irish lambs” Irish Grassland Association Journal, 2006.
Kinsella, A. and Hanrahan, K. (2019). “Review of Sheep Farming in 2019 and Outlook for 2020” In Outlook 2020: Economic Prospects for Agriculture. Teagasc. Available to download at https://www.teagasc.ie/media/website/publications/2019/Outlook2020.pdf
U.S. Meat Export Federation,
https://www.usmef.org/chinas-sheep-meat-market-weak-due-to-increased-domestic-and-foreign-supplies/
Acknowledgements
The authors would like to thank the staff and recorders of the Teagasc National Farm Survey for their assistance in conducting the analysis contained in this paper, industry contacts who provided valuable feedback on input market developments and Agricultural Economics and Farm Surveys Department colleagues who provided valued criticism. Any errors or omissions remain the sole responsibility of the authors.
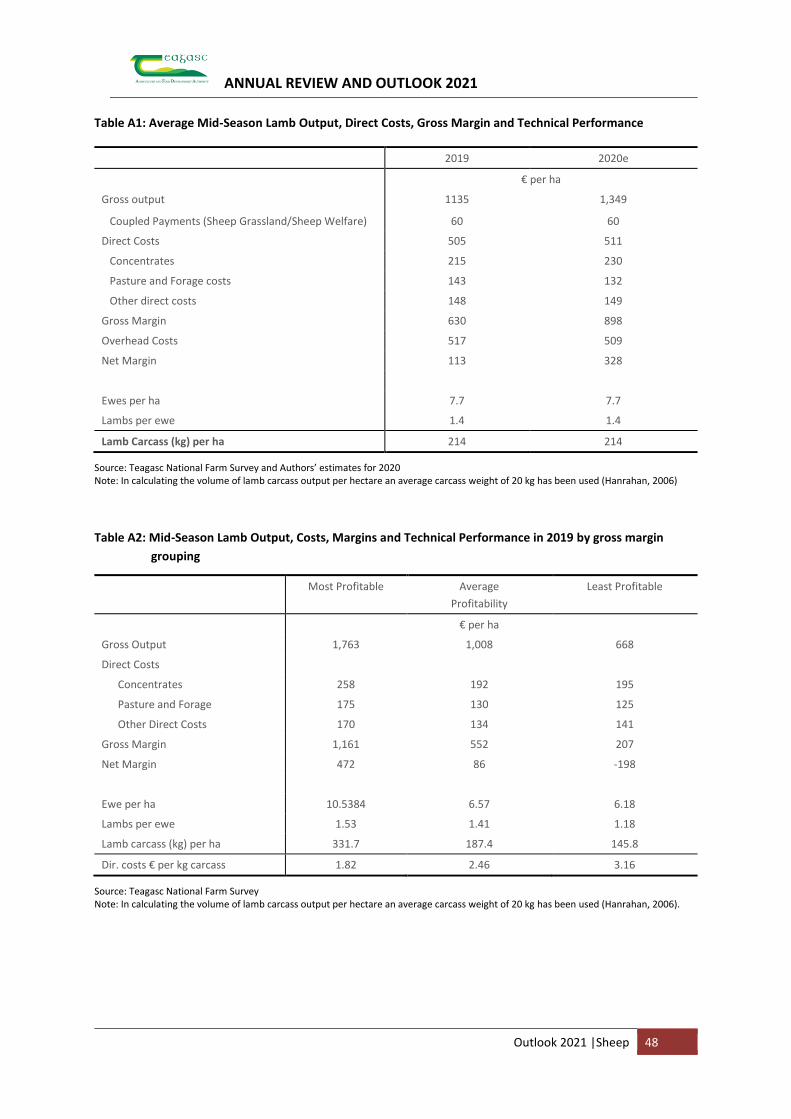
ANNUAL REVIEW AND OUTLOOK 2021
Outlook 2021 |Sheep 48
Table A1: Average Mid-Season Lamb Output, Direct Costs, Gross Margin and Technical Performance
2019 2020e
€ per ha
Gross output 1135 1,349
Coupled Payments (Sheep Grassland/Sheep Welfare) 60 60
Direct Costs 505 511
Concentrates 215 230
Pasture and Forage costs 143 132
Other direct costs 148 149
Gross Margin 630 898
Overhead Costs 517 509
Net Margin 113 328
Ewes per ha 7.7 7.7
Lambs per ewe 1.4 1.4
Lamb Carcass (kg) per ha 214 214
Source: Teagasc National Farm Survey and Authors’ estimates for 2020 Note: In calculating the volume of lamb carcass output per hectare an average carcass weight of 20 kg has been used (Hanrahan, 2006)
Table A2: Mid-Season Lamb Output, Costs, Margins and Technical Performance in 2019 by gross margin
grouping
Most Profitable Average
Profitability
Least Profitable
€ per ha
Gross Output 1,763 1,008 668
Direct Costs
Concentrates 258 192 195
Pasture and Forage 175 130 125
Other Direct Costs 170 134 141
Gross Margin 1,161 552 207
Net Margin 472 86 -198
Ewe per ha 10.5384 6.57 6.18
Lambs per ewe 1.53 1.41 1.18
Lamb carcass (kg) per ha 331.7 187.4 145.8
Dir. costs € per kg carcass 1.82 2.46 3.16
Source: Teagasc National Farm Survey Note: In calculating the volume of lamb carcass output per hectare an average carcass weight of 20 kg has been used (Hanrahan, 2006).
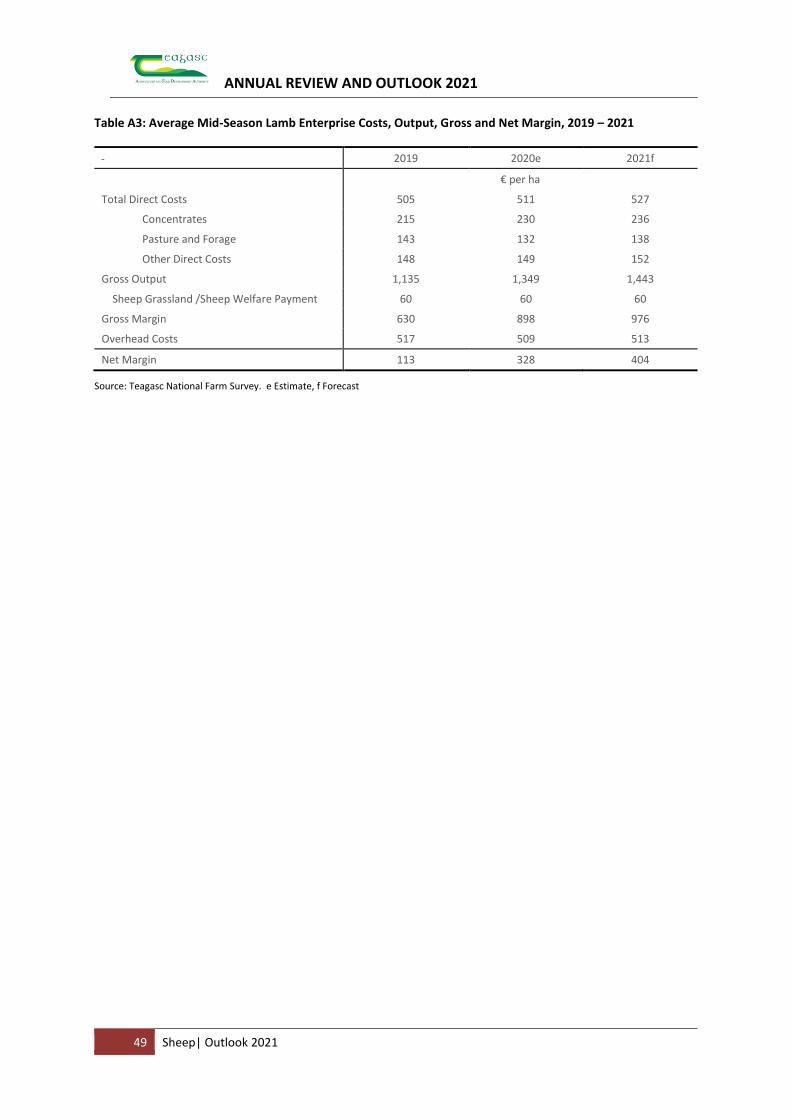
ANNUAL REVIEW AND OUTLOOK 2021
49 Sheep| Outlook 2021
Table A3: Average Mid-Season Lamb Enterprise Costs, Output, Gross and Net Margin, 2019 – 2021
2019 2020e 2021f
€ per ha
Total Direct Costs 505 511 527
Concentrates 215 230 236
Pasture and Forage 143 132 138
Other Direct Costs 148 149 152
Gross Output 1,135 1,349 1,443
Sheep Grassland /Sheep Welfare Payment 60 60 60
Gross Margin 630 898 976
Overhead Costs 517 509 513
Net Margin 113 328 404
Source: Teagasc National Farm Survey. e Estimate, f Forecast


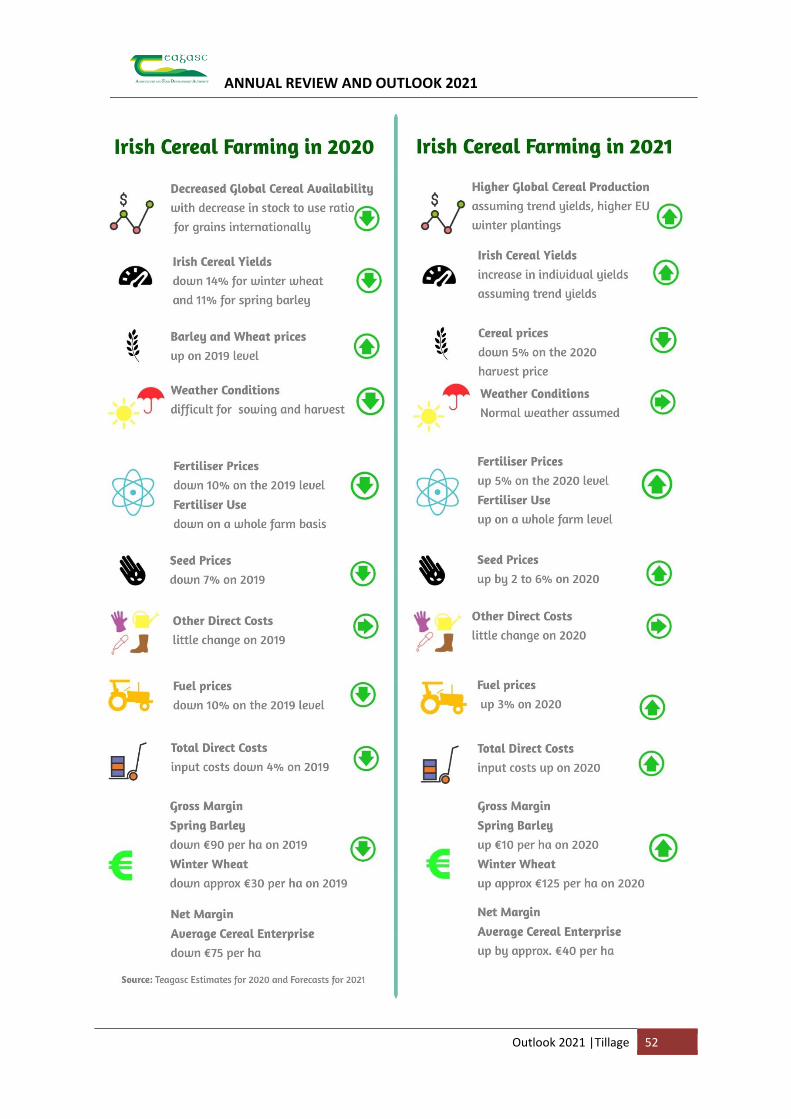

ANNUAL REVIEW AND OUTLOOK 2021
53 Tillage| Outlook 2021
Review of Tillage Farming in 2020 and Outlook for 2021
Fiona Thorne
Agricultural Economics and Farm Surveys Department, Teagasc
1. Introduction
Harvest prices in the cereals sector in 2020 were higher than those achieved in 2019. Straw prices were also generally higher in 2020. However, yields for the majority of Irish cereal crops were lower than those achieved at harvest 2019. Taken together these developments resulted in lower gross output values on a per hectare basis in 2020 relative to 2019. There was some expenditure reductions in 2020, associated with the decrease in winter cereal crops sown and a decrease in fuel related costs. The upward movement in cereal prices at harvest 2020 was associated with several factors, the most important of which was a decrease in the production estimates in key cereal producing regions internationally. Lower EU production, especially in wheat markets, resulted in a decrease in stocks and a more constrained EU supply and demand balance in 2020/21. This paper will consider whether the price increases of the 2020 harvest can be considered atypical or whether prices will continue at these levels into the 2021 harvest. The paper uses Irish Teagasc National Farm Survey (NFS) data to conduct a review of the financial performance of tillage farms in 2019. Following this, prices and costs are estimated for 2020 and these are used to produce an estimate of
net margin for the 2020 harvest year. In the concluding sections of the paper, forecasts for 2021 are presented.
2. Review of the Economic Performance of Tillage Farms in 2019
Approximately 6,900 specialist tillage farms were represented by the Teagasc NFS in 2019. Income on tillage farms decreased by 19 percent year-on-year. Gross output on a whole farm basis increased by 11 percent, while direct payments increased by 5 percent. Direct costs and overhead costs increased on a whole farm basis, by 5 percent and 6 percent respectively, despite virtually no change in farm size reported in the sample represented by the Teagasc NFS. Overall, total costs on a whole farm basis increased by 6 percent on average. These changes resulted in an average Family Farm Income (FFI) in 2019 of €32,700, which is equivalent to a 4 percent decrease on the five year average FFI on tillage farms.
Brexit Assumptions: No post Brexit Trade Deal has been agreed between the EU and UK (as of Dec 1st 2020)
UK Brexit Transition period ends on Dec 31st 2020
Without a trade deal, EU – UK trade post 2020 will be based on mutual application of MFN
tariff schedules
Trade and price impacts would occur
But no immediate supply response is assumed in 2021
Income projections for 2021 do not reflect any possible policy response
While the EU and the Irish Government will likely respond to a No Deal outcome with increased
sectoral support, this is not factored in the 2021 income projections

ANNUAL REVIEW AND OUTLOOK 2021
Outlook 2021 | Tillage 54
Figure 1: Average Income on Irish Specialist Tillage Farms 2015 to 2019
Source: Teagasc, National Farm Survey (various years).
To understand the economic performance of tillage farms in 2019, we begin with a review of the cost and return structure of the main cereal crops using NFS data. Figure 2 disaggregates the direct costs of production for the principal cereal crops grown on Irish farms in 2019.
Figure 2: Composition of Direct Costs for Cereal Crops, 2019
Source: Teagasc, National Farm Survey.
Figure 2 shows that in general, direct costs are higher for winter sown crops compared to spring sown crops, due to the higher fertiliser and crop protection costs incurred in growing winter crops. However, given that yields are generally higher in winter sown crops, the more appropriate comparative economic indicator is gross margin per hectare, as shown in Figure 3. Figure 3 shows that the average gross margin per hectare for all winter crops is higher than the gross margin for equivalent spring sown crops. Winter wheat, followed closely by malting barley recorded the highest gross margins and spring barley the lowest margin of all cereal crops examined in 2019 (see Table A1 in the appendix to this paper for further details). The gross margin per hectare for the two main cereal crops, spring barley and winter
wheat decreased in 2019 relative to 2018, by over €100 and €300 respectively.
Figure 3: Gross Margins per hectare for Cereal Crops, 2019
Source: Teagasc, National Farm Survey Data.
While gross margin estimates are useful for comparative purposes, it is also worthwhile to examine the shift in net margin over time. However, for cereal crops it is particularly difficult to allocate overhead costs and straw output to individual crops using NFS data. For this reason, the analysis looks at the net margin of the cereal enterprise of the entire NFS specialist tillage farming population and this is shown in Figure 4.
Figure 4: Cereal Enterprise on Specialist Tillage System Farms: Net Margin Distributions, 2019
Source: Teagasc, National Farm Survey Data.
To examine the variation in net margins earned by tillage farms, the sample was divided into three groups. Farms were classified on the basis of net margin per hectare; the best performing one-third of farms labelled high margin, the middle one-third labelled moderate margin and the poorest performing one-third labelled as low margin. The variation in margins across Irish tillage farms is readily apparent from Figure 4. The net margin per hectare for the cereal enterprise on high margin
0
10,000
20,000
30,000
40,000
50,000
2014 2015 2016 2017 2018 2019
euro
0
250
500
750
1,000
Winterwheat
Winteroats
Winterbarley
Springoats
Springbarley
Maltingbarley
euro
per
hec
tare
fertiliser seedscrop prot. hired machineryother direct costs
0100200300400500600700800900
1,000
Wwheat
Woats
Wbarley
Soats
Sbarley
Mbarley
euro
per
hec
tare
-373
50
405
36
-500
-400
-300
-200
-100
0
100
200
300
400
500
Lowmargin
Moderatemargin
Highmargin
Average
euro
per
hec
tare
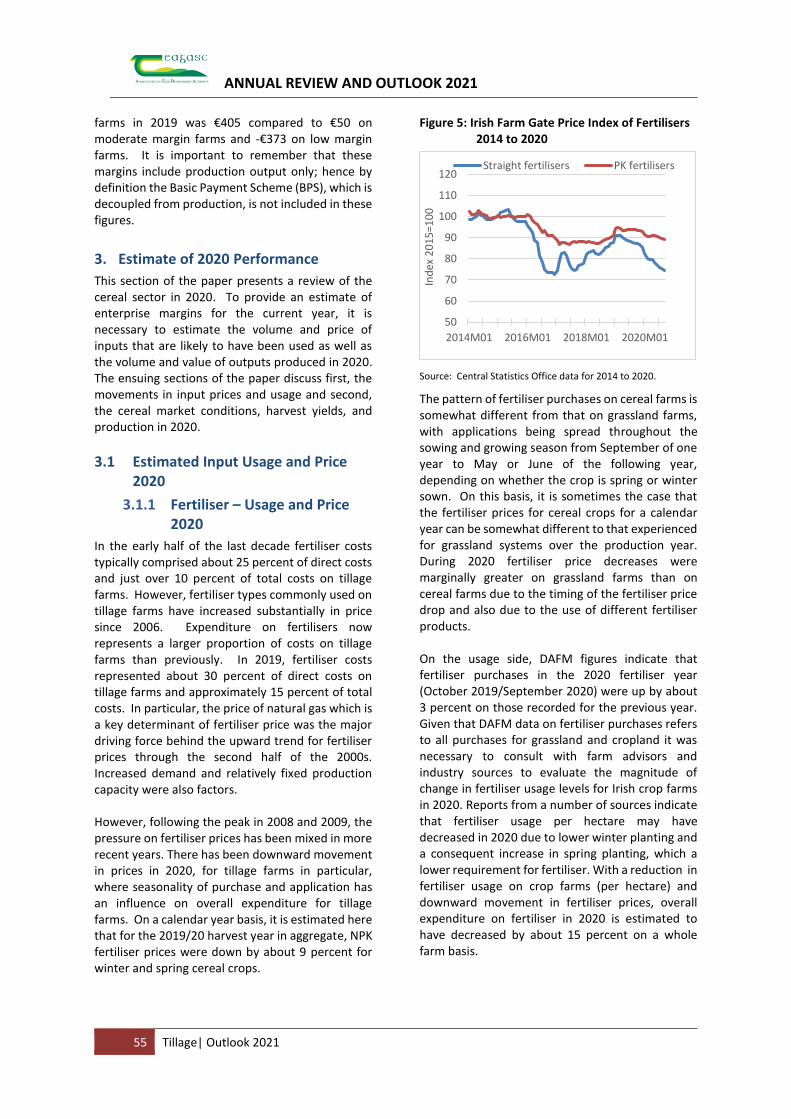
ANNUAL REVIEW AND OUTLOOK 2021
55 Tillage| Outlook 2021
farms in 2019 was €405 compared to €50 on moderate margin farms and -€373 on low margin farms. It is important to remember that these margins include production output only; hence by definition the Basic Payment Scheme (BPS), which is decoupled from production, is not included in these figures.
3. Estimate of 2020 Performance
This section of the paper presents a review of the cereal sector in 2020. To provide an estimate of enterprise margins for the current year, it is necessary to estimate the volume and price of inputs that are likely to have been used as well as the volume and value of outputs produced in 2020. The ensuing sections of the paper discuss first, the movements in input prices and usage and second, the cereal market conditions, harvest yields, and production in 2020.
3.1 Estimated Input Usage and Price 2020
3.1.1 Fertiliser – Usage and Price 2020
In the early half of the last decade fertiliser costs typically comprised about 25 percent of direct costs and just over 10 percent of total costs on tillage farms. However, fertiliser types commonly used on tillage farms have increased substantially in price since 2006. Expenditure on fertilisers now represents a larger proportion of costs on tillage farms than previously. In 2019, fertiliser costs represented about 30 percent of direct costs on tillage farms and approximately 15 percent of total costs. In particular, the price of natural gas which is a key determinant of fertiliser price was the major driving force behind the upward trend for fertiliser prices through the second half of the 2000s. Increased demand and relatively fixed production capacity were also factors. However, following the peak in 2008 and 2009, the pressure on fertiliser prices has been mixed in more recent years. There has been downward movement in prices in 2020, for tillage farms in particular, where seasonality of purchase and application has an influence on overall expenditure for tillage farms. On a calendar year basis, it is estimated here that for the 2019/20 harvest year in aggregate, NPK fertiliser prices were down by about 9 percent for winter and spring cereal crops.
Figure 5: Irish Farm Gate Price Index of Fertilisers 2014 to 2020
Source: Central Statistics Office data for 2014 to 2020.
The pattern of fertiliser purchases on cereal farms is somewhat different from that on grassland farms, with applications being spread throughout the sowing and growing season from September of one year to May or June of the following year, depending on whether the crop is spring or winter sown. On this basis, it is sometimes the case that the fertiliser prices for cereal crops for a calendar year can be somewhat different to that experienced for grassland systems over the production year. During 2020 fertiliser price decreases were marginally greater on grassland farms than on cereal farms due to the timing of the fertiliser price drop and also due to the use of different fertiliser products. On the usage side, DAFM figures indicate that fertiliser purchases in the 2020 fertiliser year (October 2019/September 2020) were up by about 3 percent on those recorded for the previous year. Given that DAFM data on fertiliser purchases refers to all purchases for grassland and cropland it was necessary to consult with farm advisors and industry sources to evaluate the magnitude of change in fertiliser usage levels for Irish crop farms in 2020. Reports from a number of sources indicate that fertiliser usage per hectare may have decreased in 2020 due to lower winter planting and a consequent increase in spring planting, which a lower requirement for fertiliser. With a reduction in fertiliser usage on crop farms (per hectare) and downward movement in fertiliser prices, overall expenditure on fertiliser in 2020 is estimated to have decreased by about 15 percent on a whole farm basis.
50
60
70
80
90
100
110
120
2014M01 2016M01 2018M01 2020M01
Ind
ex 2
01
5=1
00
Straight fertilisers PK fertilisers

ANNUAL REVIEW AND OUTLOOK 2021
Outlook 2021 | Tillage 56
3.1.2 Seed – Usage and Price 2020
Expenditure on purchased seed on crop farms comprises between 11 and 21 percent of direct costs for cereal production. In terms of the composition of total costs, seed represented about 5 percent of total costs in 2019. In 2020, cereal farmers experienced a slight decrease in seed costs relative to the previous year due to a decrease in prices for the main cereals at harvest 2019. In autumn 2019, when seed supplies were purchased for the 2020 harvested winter crops, blue label seed costs were trading at around €520 per tonne, which is about 7 percent lower than 2019 prices. This seed price decrease was also assumed in 2020 for spring sown crops, however there was some anecdotal reports that spring cereal seed prices were slightly higher in price due to supply issues.
3.1.3 Crop protection – Usage and Price 2020
The expenditure on crop protection by specialist tillage farms in 2019 accounted for 20 percent of direct costs and 10 percent of total costs. However, the contribution of crop protection to the composition of costs can vary significantly depending on the crop; the percentage spent on crop protection for winter crops is higher than that for spring crops. For example, for the winter wheat crop in 2019, crop protection costs accounted for 33 percent of direct costs, as compared to 23 percent for spring barley.
Figure 6: Price Index of Plant Protection products in Ireland 2014- 2020
Source: Central Statistics Office and Author’s own estimates.
Compared to other significant costs on tillage farms, the increase in the prices of crop protection products listed by the CSO has been limited over the recent past. Figure 6 shows that the increase in the price of crop protection products from 2014 to 2020 was approximately 4 percent and that between
2019 and 2020 prices are estimated to have increased by less than 1 percent. However, on a whole farm basis, the expenditure on crop protection products is expected to have been negative in 2020, given the switch to less crop protection intensive spring crops.
3.1.4 Energy and Fuel – Usage and Price 2020
Energy and fuel are important inputs in crop production. Given that a number of direct and overhead costs are directly influenced by energy and fuel prices, the trend in energy prices is of significance for tillage farmers. In this analysis it is assumed that hired machinery/contracting and transport costs, which are components of direct costs, and fuel and lubricants which are components of overhead costs, are directly influenced by energy inflation. These cost items represented approximately 15 percent of total costs on tillage farms in 2019. Based on the CSO estimates presented in Figure 7, the farm level price of fuel has decreased by 9 percent between 2014 and 2019 (the last full year for which data is available). As a result of a sharp decrease in Brent crude oil prices due to the demand shock associated with COVID-19, and an appreciation in the value of the euro against the dollar for the year as a whole, fuel prices on Irish tillage farmers decreased by about 10 percent in 2020 relative to 2019.
Figure 7: Price Index of Fuel products in Ireland 2014 – 2020
Source: Central Statistics Office and Author’s own estimates.
This estimate is based on a comparison of the agricultural motor fuel index from the CSO for 2019 and the first nine months of 2019. Demand for these input items tends to be relatively inelastic with respect to price and therefore it is assumed that
80
90
100
110
120
2014M01 2016M01 2018M01 2020M01
Ind
ex 2
01
5 =
10
0
0
20
40
60
80
100
120
140
2014M01 2016M01 2018M01 2020M01
Ind
ex 2
01
5 =
10
0

ANNUAL REVIEW AND OUTLOOK 2021
57 Tillage| Outlook 2021
usage in 2020 will have been similar to the 2019 level. Overall expenditure on fuel related items is likely to be 10 percent lower in 2020 relative to 2019.
3.1.5 All other direct and overhead costs – Usage and Price 2020
Based on CSO estimates for the first nine months of 2020 compared to the same time period in 2019, it is estimated that ‘other direct costs’ have increased marginally by about 1 percent. The average cost of land rental in 2019 on specialist tillage farms represented 6 percent of total costs. Given that farm gate cereal prices and margins decreased in 2019, there could be some basis for assuming a slight decrease in land rental prices in 2020. However, the increase in dairy farm incomes in 2019 may have mitigated a decrease in land rental prices in 2020, with dairy farmers perhaps more likely to bid up the price of rented land. Hence, it is assumed that the average land rental price per hectare did not change in 2020. The methods employed here, which reflect costs per crop hectare, do not capture changes in the volume of land rented. For 2020, on a total farm basis, the actual impact of any changes to total cereal area (rented or otherwise) will only be fully reflected in the final Teagasc NFS figures for 2020, which will be published in mid-2021.
3.1.6 Estimate of Total Input expenditure for 2020
Total expenditure on all input items is estimated to have decreased in 2020 relative to 2019. The most significant decrease in expenditure on a per hectare basis occurred for fertiliser and fuel, which are estimated to have decreased by 10 percent. Seed prices also decreased by 7 percent in 2020 and feed prices are estimated to have fallen by 3 percent (which is relevant for subsidiary enterprises on tillage farms). On average, the estimated decrease in total direct costs was approximately 4 percent in 2020 relative to the 2019 level, on a per hectare, per crop basis. The estimates, provided on a per hectare basis for individual cereal crops, do not take into account changes in area devoted to individual cereal crops. The significant shift to spring sown cereals and the related decline in winter sown cereals was also take into consideration, see Figure 8, where whole farm direct and overhead costs on specialist tillage farms
in 2019 and the estimate for 2020 are presented. Overall, it is estimated that total costs declined by 4 percent on a per farm basis, with direct costs declining by 8 percent and overhead costs declining by 1 percent.
Figure 8A: Direct Costs in Major Crops in Ireland 2019 and Estimates for 2020
Figure 8B: Direct Costs in Minor Crops Ireland 2019 and Estimates for 2020
Source: Teagasc, National Farm Survey Data and Author’s estimates for 2020.
3.2 Estimated Output Values 2020
3.2.1 Price, yield and moisture levels in 2020
In 2019, the European balance sheet for cereals and coarse grains returned an increase in production levels and higher ending stock positions. This then resulted in a significant decrease in farm gate cereal prices at harvest 2019 (see Figure 9). In 2020 significant decreases in national cereal volumes in particular have resulted in slight upward movement in farm gate harvest prices compared to 2019, despite a comfortable European balance
0
200
400
600
800
1,000
Sbarley
19
Sbarley
20e
Wwheat
19
Wwheat
20e
Wbarley
19
Wbarley
20eeu
ro p
er h
ecta
re
fertiliser seeds
crop protection hired machinery
other costs
0
200
400
600
800
1,000
Sbarley
19
Sbarley
20e
Wwheat
19
Wwheat
20e
Wbarley
19
Wbarley
20e
euro
per
hec
tare
fertiliser seeds
crop protection hired machinery
other costs
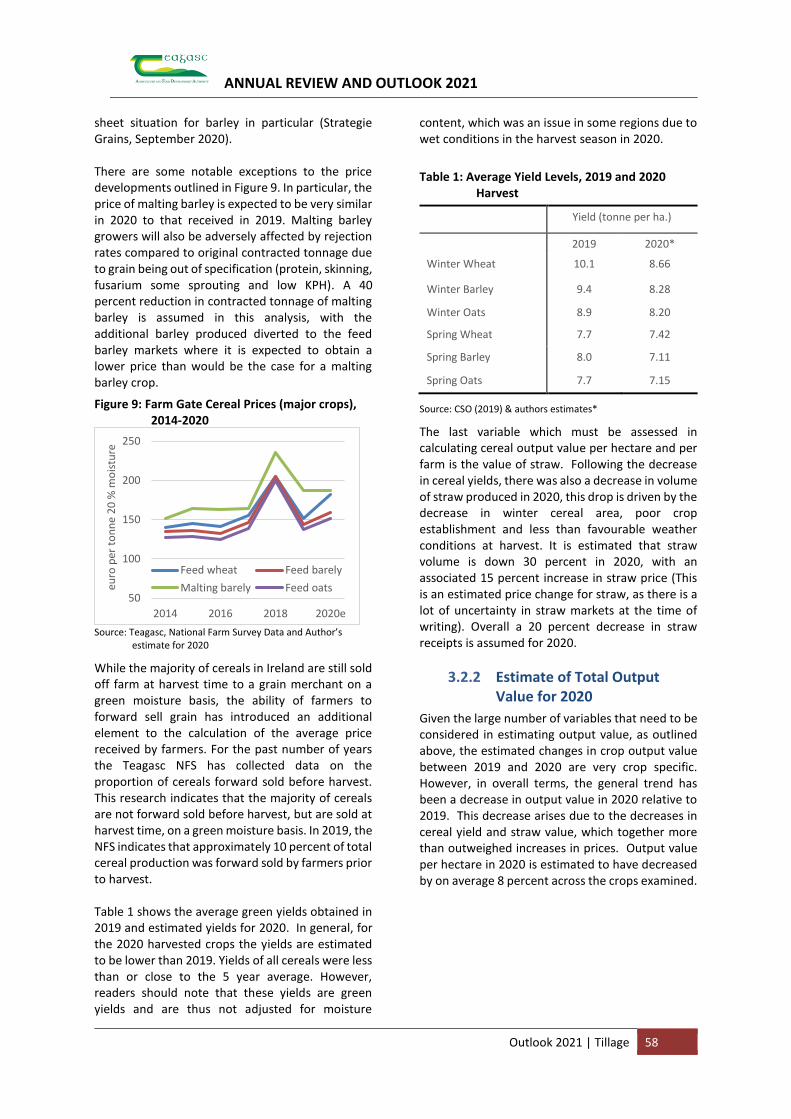
ANNUAL REVIEW AND OUTLOOK 2021
Outlook 2021 | Tillage 58
sheet situation for barley in particular (Strategie Grains, September 2020). There are some notable exceptions to the price developments outlined in Figure 9. In particular, the price of malting barley is expected to be very similar in 2020 to that received in 2019. Malting barley growers will also be adversely affected by rejection rates compared to original contracted tonnage due to grain being out of specification (protein, skinning, fusarium some sprouting and low KPH). A 40 percent reduction in contracted tonnage of malting barley is assumed in this analysis, with the additional barley produced diverted to the feed barley markets where it is expected to obtain a lower price than would be the case for a malting barley crop.
Figure 9: Farm Gate Cereal Prices (major crops), 2014-2020
Source: Teagasc, National Farm Survey Data and Author’s
estimate for 2020
While the majority of cereals in Ireland are still sold off farm at harvest time to a grain merchant on a green moisture basis, the ability of farmers to forward sell grain has introduced an additional element to the calculation of the average price received by farmers. For the past number of years the Teagasc NFS has collected data on the proportion of cereals forward sold before harvest. This research indicates that the majority of cereals are not forward sold before harvest, but are sold at harvest time, on a green moisture basis. In 2019, the NFS indicates that approximately 10 percent of total cereal production was forward sold by farmers prior to harvest. Table 1 shows the average green yields obtained in 2019 and estimated yields for 2020. In general, for the 2020 harvested crops the yields are estimated to be lower than 2019. Yields of all cereals were less than or close to the 5 year average. However, readers should note that these yields are green yields and are thus not adjusted for moisture
content, which was an issue in some regions due to wet conditions in the harvest season in 2020.
Table 1: Average Yield Levels, 2019 and 2020 Harvest
Yield (tonne per ha.)
2019 2020*
Winter Wheat 10.1 8.66
Winter Barley 9.4 8.28
Winter Oats 8.9 8.20
Spring Wheat 7.7 7.42
Spring Barley 8.0 7.11
Spring Oats 7.7 7.15
Source: CSO (2019) & authors estimates*
The last variable which must be assessed in calculating cereal output value per hectare and per farm is the value of straw. Following the decrease in cereal yields, there was also a decrease in volume of straw produced in 2020, this drop is driven by the decrease in winter cereal area, poor crop establishment and less than favourable weather conditions at harvest. It is estimated that straw volume is down 30 percent in 2020, with an associated 15 percent increase in straw price (This is an estimated price change for straw, as there is a lot of uncertainty in straw markets at the time of writing). Overall a 20 percent decrease in straw receipts is assumed for 2020.
3.2.2 Estimate of Total Output Value for 2020
Given the large number of variables that need to be considered in estimating output value, as outlined above, the estimated changes in crop output value between 2019 and 2020 are very crop specific. However, in overall terms, the general trend has been a decrease in output value in 2020 relative to 2019. This decrease arises due to the decreases in cereal yield and straw value, which together more than outweighed increases in prices. Output value per hectare in 2020 is estimated to have decreased by on average 8 percent across the crops examined.
50
100
150
200
250
2014 2016 2018 2020e
euro
per
to
nn
e 2
0 %
mo
istu
re
Feed wheat Feed barely
Malting barely Feed oats

ANNUAL REVIEW AND OUTLOOK 2021
59 Tillage| Outlook 2021
Figure 10: Actual Gross Output per Hectare 2019 & Estimated Gross Output per Hectare 2020
Source: Teagasc, National Farm Survey Data and Author’s estimates for 2020.
3.2.3 International Production Estimates for 2020
While production estimates for Irish cereals are important from a national supply, demand and balance sheet perspective, it is primarily developments in the EU and international supply and use balance for cereals that affect price developments in Ireland. For this reason a review of EU and international ending stocks for cereals are more informative when near term price developments are concerned. The Strategie Grains estimates (Strategie Grains, November 2020) show that EU total grain production for the 2020/21 marketing year differs somewhat from the international balance sheet situation. Latest estimates for EU total grain production for the 2020/21 marketing year are down on the previous year’s levels (Strategie Grains, November 2020). EU total production of wheat, barley and maize were down 7 percent on the previous year. Whilst total grain production on the international balance sheet is up very slightly on the previous year, what is most noteworthy is that there is a decline in the stocks/use ratio for barley and maize internationally. Another noteworthy point regarding production and stock estimates for 2020/21 is the downward revision in ending stocks, with revised figures produced for October and November. As harvest estimates were firmed up in the past few weeks, EU and global ending stocks were revised downwards. This downward revision in ending stocks since September can be attributed to an increase in EU
wheat export competitiveness in the animal feed sector, even greater Chinese demand for barely than expected and downward revisions for the world maize harvest, which leaves a tighter than expected outlook for maize despite the negative impacts of the COVID-19 pandemic on ethanol demand. As a result, grain prices have increased on the world market since harvest time.
3.3 Review of Tillage Enterprise Margins in 2020
The review of cereal output value showed that the average value of output received by farmers was lower in 2020 compared to 2019. The review of input costs concluded that total direct costs were lower in 2020 compared to 2019, due mainly to a decrease in fuel and fertiliser prices. Figure 11 presents the effect of these estimates on the estimated gross margin for each of the main Irish cereal crops.
Figure 11 shows a negative story in terms of the relative change in gross margin in 2020 relative to 2019. The relative shift in yields, crop prices, straw returns and input expenditure has been negative for all cereal crops between 2019 and 2020. In terms of the major crops, the gross margin for spring barley was down by over €90 per hectare and the winter barley gross margin is estimated to be down by over €70 per hectare, while the gross margin for winter wheat is estimated to be down by nearly €30 per hectare. It should be noted that the average gross margin figures presented above are market based gross margins and therefore exclude all decoupled payments and overhead costs.
Figure 11: Actual Gross Margin in 2019 & Estimated Gross Margin for 2020 for each of the Main Crops
Source: Teagasc, National Farm Survey Data and Author’s estimates for 2020.
0
500
1,000
1,500
2,000
Sbarley
Wwheat
Wbarley
Mbarley
W oats S oats
euro
per
hec
tare
Gross Output 2019 Gross Output 2020
0
200
400
600
800
1,000
S barley Wwheat
Wbarley
Mbarley
W oats S oats
euro
per
hec
tare
2019 2020

ANNUAL REVIEW AND OUTLOOK 2021
Outlook 2021 | Tillage 60
The estimated net margins for 2019 are presented for the average cereal enterprise on specialist tillage farms, with the NFS sample disaggregated into one-third groupings based on net margins per hectare obtained.
Figure 12: Actual Net Margin 2019 and Estimated Net Margin for 2020 for the Cereal Enterprise on Specialist Tillage Farms
Source: Teagasc, National Farm Survey Data and Author’s estimates for 2020.
Figure 12 shows the cereal enterprise net margin estimates for 2020 relative to 2019, for the average specialist tillage farm, in addition to the net margins for the low, moderate and high margin groupings of tillage farms. The estimate of net margins for the typical cereal enterprise in 2020 is lower than in 2019 given downward movement in gross margins per hectare and less significant movement in overhead costs. For the best performing one-third of tillage farms, the estimated net margin for 2020 was approximately €290 per hectare compared to the average, where the net margin was approximately minus €40 per hectare. It is important to remember that these figures exclude decoupled direct payments. Furthermore, it is important to note that owing to the methods employed in this estimation, changes in cropping choice or area cannot be fully captured and will only be clear when the final Teagasc NFS figures become available for 2020.
4. Outlook for 2021
In this section forecasts are provided for expenditure on various input items in 2021, the likely farm gate cereal price that will prevail at harvest 2021 and the likely net margin of tillage farms in 2021.
4.1 The Outlook for Input Expenditure
4.1.1 Fertiliser – usage and price 2021
A number of factors need to be considered when forecasting price and volume changes for fertiliser on crop farms in 2021. CSO official monthly price indices for fertilisers for 2020 are only available up until the end of September. Market report data coming from the fertiliser industry at present point to a more robust demand situation for nitrogen, phosphorus and potassium based products in 2021. Market sources are indicating that the price of nitrogen based products in particular could move upwards from the prices observed at the end of September 2020 due to upward price pressure from the demand side and slight movement on energy costs. Taking all of these issues into account, including seasonality of purchases, it is forecast that the increase in fertiliser price for cereal crops in 2020/21 will be between 1 and 5 percent. Fertiliser usage on a whole farm basis in 2021 on crop farms could be expected to increase due to higher levels of winter crop sowing due to autumn weather conditions. Overall, it can be expected that fertiliser expenditure will be about 5 percent higher per hectare for specific crops on cereal farms in 2021 relative to the 2020 level, but will be about 11 percent up on a whole farm basis due to the increase in winter cereal sowing in autumn 2020 relative to autumn 2019.
4.1.2 Seed – usage and price 2021
As mentioned previously, cereal farmers experienced a decrease in seed costs in 2020 relative to the previous year due to cereal price decreases at harvest 2019. Given that cereal prices at harvest increased in 2020 relative to 2019, this price increase has been transmitted to seed prices, with blue label seed costing around €550 per tonne for wheat and €530 per tonne for barley, which is between 2 and 6 percent higher than 2020 seed prices.
4.1.3 Crop protection – usage and price 2021
The increase in crop protection costs in 2021 relative to 2020 is forecast to be of a similar magnitude to the changes seen in each of the last three years. Price changes have been minimal, at about 1 percent per year. Taking volume and price changes into account, based on recent data from the Teagasc NFS, a 1 percent increase in crop
-500
-400
-300
-200
-100
0
100
200
300
400
500
Low margin Moderatemargin
High margin
euro
per
hec
tare
2019 2020e

ANNUAL REVIEW AND OUTLOOK 2021
61 Tillage| Outlook 2021
protection expenditure per crop per hectare is forecast for 2021. This 1 percent increase on a per crop basis will be slightly higher on a whole farm basis, reflecting the increase in winter cereal planting, with a higher requirement for crop protection compared to spring sown cereal crops.
4.1.4 Energy and Fuel – usage and price 2021
Fuel costs in 2021 will depend mainly on the evolution of crude oil prices. Current futures prices suggest that crude oil prices will increase slightly in 2021 relative to 2020 prices, leading to a 3 percent increase in fuel prices.
4.1.5 All other direct and overhead costs 2021
All other direct costs are forecast to increase by about 1 percent in 2021, in line with price changes of such items in recent years. This early in the tillage production season anecdotal evidence on land rental prices for 2021 is mixed. However, due to the decrease in income on tillage farms in 2020, it is assumed that there will be no change in land rental prices in 2021.
4.2 The Outlook for Markets 2021
The cereals market has experienced significant volatility in recent years, and particularly so since harvest 2020. Planting decisions by farmers will be influenced by expected farm gate cereal prices (and margins) in 2021. A number of factors must be taken into consideration when making price forecasts for the coming harvest. To formally evaluate the risk associated with predicting the 2021 harvest price, an econometric analysis was conducted to predict the probability that the 2021 farm gate price will be higher or lower than the 2020 price. This analysis was based on the November 2020 MATIFF futures prices for November 2021 contracts. The regression analysis examined the historic relationship between (i) predicted futures price for the following harvest, made from the previous November/December when planting decisions were been made, and (ii) the actual farm gate price paid at harvest one year hence. This regression analysis enables a forecast to be made of the 2021 Irish farm gate cereal price for wheat, taking into consideration the differences between the historic predicted values (MATIFF) and the actual outcomes.
Figure 13 outlines the probability of achieving various harvest prices in September 2021. Based on the econometric model developed, it shows that there is significant uncertainty concerning the predicted harvest price for September 2021. This predicted range is based on current (MATIFF) futures trading prices (November 2020), and the spread around the mean value is based on how right or wrong futures markets have been in recent times in predicting prices one season ahead.
Figure 13: Probability Distribution of the predicted 2021 Wheat Harvest Price
Source: Author’s own estimates.
Based on market reports on forward prices and the probabilities of achieving different harvest prices, the average predicted value for the farm gate wheat price is approximately €175 per tonne at 20 percent moisture, which is approximately a 5 percent decrease over harvest prices paid in 2020. However, there is a significant variance surrounding this figure. Based on a 90 percent confidence interval, it is forecast that the figure could be as low as €140 per tonne or as high as €240 per tonne (Figure 15). The latest edition of Strategie Grains (November 2020) outlines a more positive picture in terms of production potential in the EU for the 2021/22 marketing year. In the last couple of weeks (November 2020), favourable weather conditions for winter cereal sowing have continued across much of the western and northern parts of the EU, increasing the area of winter cereals farmers have been able to plant relative to last year. Whilst early on in the winter sowing period some delays were experienced in central Europe, improved weather conditions materialised into November which aided winter sowing rates. In total soft wheat area in the EU28 is estimated to increase by 9 percent to 24Mha (22Mha in 2020/21)
0
0.2
0.4
0.6
0.8
1
0 100 200 300
pro
bab
ility
€ per tonne (2021 forecast)

ANNUAL REVIEW AND OUTLOOK 2021
Outlook 2021 | Tillage 62
despite some reductions from north European countries which is to be offset by small increases for France and Romania. Total EU28 barley acreage is expected to decrease slightly (11.9Mha compared to 12.6Mha in 2020/21), with winter barley acreage very low across the EU and spring barley expected to decline even more sharply. Grain maize area is forecast to decrease very slightly (8.5 Mha in 2021/22 compared to 9 Mha in 2020/21). The change in cereal area (in the EU) is coupled with an assumption of achievement of trend yields in 2021 (see Appendix A3 for further details on forecast changes in arable crop areas in the EU28 for 2021/2022). An achievement of trend yields internationally, ceteris paribus, is assumed to have a negative impact on price, given the anticipated increase in production in 2021. The slight decrease in farm gate cereal prices at harvest 2021 which is borne out in futures trading prices at the moment, is largely based on an anticipated increase in supply in key growing regions internationally, due to an increase in winter plantings and an increase in yields over those achieved in 2020. However, it also assumes that supply conditions, which are relatively more ‘informed’ at this time of the year, are more price bearish than demand conditions, which are less well informed at this time of the year. Possible bullish factors which could impact on prices at harvest 2021 include:
significant weather events,
exchange rate movements,
considerable changes in demand from feed and food sources, most notably Chinese demand for the increasing sow herd,
and a no Deal Brexit.
Whilst all of the afore mentioned supply and demand factors are assumed to be considered in the futures trading environment at the moment, the overriding supply side factors ae considered most important in determining the futures trading price for harvest 2021. But it is still very early to forecast what might happen to these additional variables and futures markets tend to move closely in line with first production estimates and exchange rate forecasts, with improved reliability of estimates coming in late spring of the harvest year.
Figure 14: Historic, Estimated & Forecast Farm Gate Feed Wheat Price (1997– 2021)
Source: Author’s own estimates, 2021 forecast, at 90 percent confidence interval.
Based on the futures market forecast, average loyalty top ups in recent years from merchants, and moisture and KPG adjustments, our forecast is that farm gate cereal prices will decrease by about 3 percent at harvest 2021.
4.3 The Outlook for Tillage Enterprise
Margin in 2021
Direct costs are forecast to be slightly higher in 2021 relative to 2020, due to the forecast increase in fertiliser expenditure, seed costs and fuel prices in 2021. Whilst all other direct costs of production are forecast to either remain the same (machinery hire and other direct costs) or increase only very slightly (crop protection costs), overall direct costs in 2021 should be slightly higher than 2019 levels, on a per hectare basis. Furthermore, output value on average is forecast to be higher than 2020 levels, due to the forecast increase in cereal yields when trend yields are assumed, coupled with less significant decrease in cereal prices. Figure 15 presents the actual gross margin for each of the main cereal crops in 2019, and the respective estimates and forecasts for 2020 and 2021.
The net effect of input price, output price and volume movements is forecast to have a positive effect on gross margins for 2021. For example, gross margins for winter wheat and winter barley are forecast to increase by approximately €125 and €50 per hectare respectively, while gross margins for spring barley are forecast to increase by approximately €10 per hectare. The overall story for the 2021 forecast is for a slight increase in gross margins as a result of achievement of trend yields, a slight decrease in cereal prices and a slight
0
100
200
300
1997 2000 2003 2006 2009 2012 2015 2018 2021
€ p
er t
on
ne
(20
% m
ois
ture
)
Historic pricesPredicted 2021 priceLow 2021 forecastHigh 2021 forecast

ANNUAL REVIEW AND OUTLOOK 2021
63 Tillage| Outlook 2021
increase in direct costs. The main driver for the magnitude of gross margin change is the effect of trend yield outcomes in 2021, with winter wheat forecast to experience the highest increase in yield in 2021, assuming 5 year trend yields are achieved.
Figure 15: Actual 2019, Estimate 2020 and Forecast 2021, for Cereal Crop Gross Margins
Source: Teagasc, National Farm Survey Data and Author’s estimates for 2020 & forecast for 2021.
Similar to the format used to present margins in 2019 and 2020 earlier in the paper, the forecast net margins for 2021, are presented for the cereal enterprise on specialist tillage farms, as well as the population of such farms disaggregated into one-third groupings based on margins obtained. Figure 16 shows that the forecast net margins for the cereal enterprise in 2021 are slightly higher than in 2020, but still lower than 2019. The slight upward movement in margins (compared to 2020) is associated with the yield estimates for 2021 and an increase in higher yielding winter cereal sowing rates. It is important to note that the overhead costs allocated to the cereal enterprise in 2021 are forecast to increase as a result of the allocation methods used (based on proportion of gross output) and the decline in gross output forecast in the subsidiary beef enterprise due to the assumption of a no deal Brexit outcome. Overall, the net margin for the average cereal enterprise in 2021 is forecast to increase by about €40 per hectare relative to 2020. This leaves net margins for the cereal enterprise significantly less than the dairy enterprise and on a par with beef margins.
Figure 16: Net Margin Actual 2019, Estimate 2020 and Forecast 2021 for the Cereal Enterprise on Specialist Tillage Farms
Source: Teagasc, National Farm Survey Data and Author’s estimates for 2020 & forecast for 2021.
5. Concluding Comments
The 2019/2020 production year saw downward movement in cereal gross margins and net margins for the main cereal crops. In 2020, there was a significant decrease in winter cereal area and yields at harvest time, coupled with some increase in harvest price and a decrease in direct costs, taken together these factors were not sufficient to negate a downward movement in margins and income. The gross margin per hectare for spring barley, winter barley and winter wheat are estimated to be down by over €90 per hectare, €70 per hectare and nearly €30 per hectare respectively. The forecast for net margins on tillage farms in 2021 is for a slight increase in margins, despite futures trading prices at the moment showing a 5 percent decrease in cereal prices at harvest 2021, owing to a return to trend yields and a slight decrease in whole farm direct costs. The overall picture for cereal crops is that in general margins will be very tight in 2021, with any upward movement in margins forecast for 2021 not sufficient to return positive net margins on approximately 50 percent of all specialist tillage farms in 2021.
0
200
400
600
800
1,000
1,200
S barley Wwheat
Wbarley
Mbarley
W oats S oats
euro
per
hec
tare
2019 2020e
-500
-400
-300
-200
-100
0
100
200
300
400
500
Low margin Moderatemargin
High margin
euro
per
hec
tare
2019 2020e 2021f

ANNUAL REVIEW AND OUTLOOK 2021
Outlook 2021 | Tillage 64
References Central Statistics Office (2020). Statbank various
series accessed at: www.cso.ie
Donnellan, T., Moran B, Lennon, J. and Dillon, E. (2020). National Farm Survey 2019. Teagasc, Rural Economy Research Centre Athenry Ireland. Available to download at: http://www.teagasc.ie/publications
Teagasc (2020). Teagasc Harvest Report 2020, November 2020 .
Strategie Grains (2020). November 2020 Bulletin.
Acknowledgements The author would like to thank the staff and recorders of the Teagasc National Farm Survey, in particular Brian Moran, for their assistance in conducting the analysis contained in this paper, industry contacts that provided valuable feedback on input and output market developments and Agricultural Economics and Farm Surveys Department colleagues who provided valued comments. Any errors or omissions remain the sole responsibility of the author.
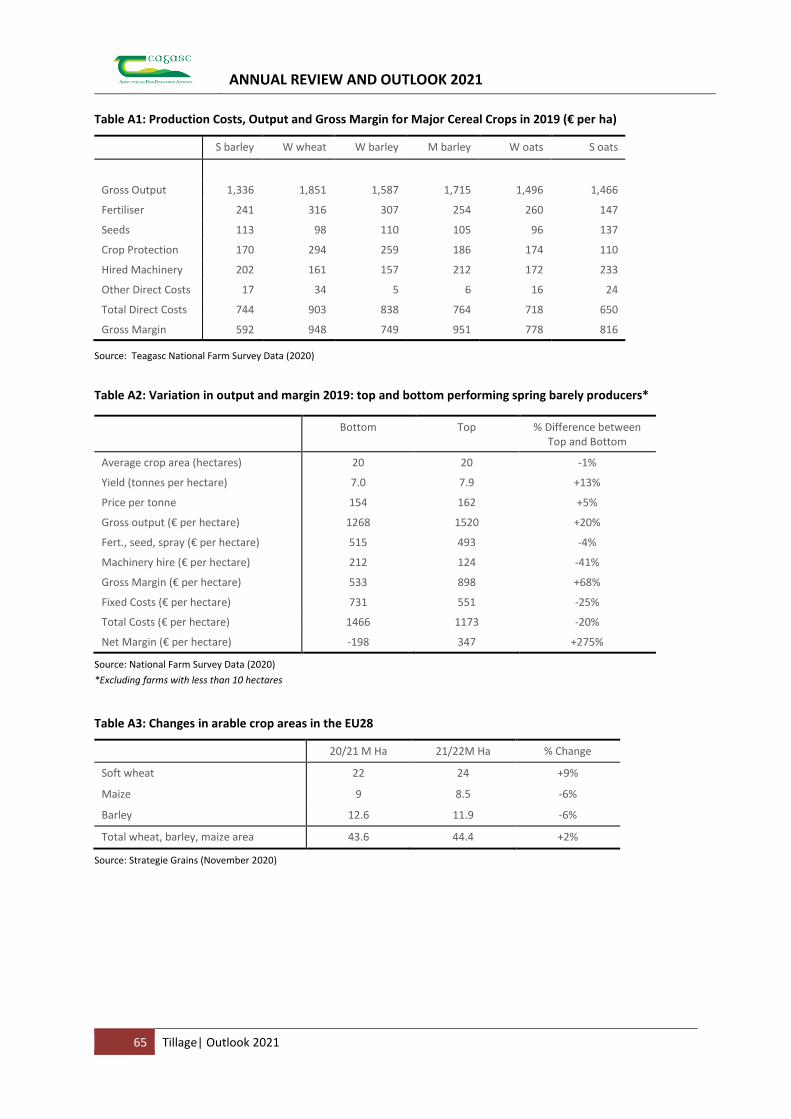
ANNUAL REVIEW AND OUTLOOK 2021
65 Tillage| Outlook 2021
Table A1: Production Costs, Output and Gross Margin for Major Cereal Crops in 2019 (€ per ha)
S barley W wheat W barley M barley W oats S oats
Gross Output 1,336 1,851 1,587 1,715 1,496 1,466
Fertiliser 241 316 307 254 260 147
Seeds 113 98 110 105 96 137
Crop Protection 170 294 259 186 174 110
Hired Machinery 202 161 157 212 172 233
Other Direct Costs 17 34 5 6 16 24
Total Direct Costs 744 903 838 764 718 650
Gross Margin 592 948 749 951 778 816
Source: Teagasc National Farm Survey Data (2020)
Table A2: Variation in output and margin 2019: top and bottom performing spring barely producers*
Bottom Top % Difference between Top and Bottom
Average crop area (hectares) 20 20 -1%
Yield (tonnes per hectare) 7.0 7.9 +13%
Price per tonne 154 162 +5%
Gross output (€ per hectare) 1268 1520 +20%
Fert., seed, spray (€ per hectare) 515 493 -4%
Machinery hire (€ per hectare) 212 124 -41%
Gross Margin (€ per hectare) 533 898 +68%
Fixed Costs (€ per hectare) 731 551 -25%
Total Costs (€ per hectare) 1466 1173 -20%
Net Margin (€ per hectare) -198 347 +275%
Source: National Farm Survey Data (2020)
*Excluding farms with less than 10 hectares
Table A3: Changes in arable crop areas in the EU28
20/21 M Ha 21/22M Ha % Change
Soft wheat 22 24 +9%
Maize 9 8.5 -6%
Barley 12.6 11.9 -6%
Total wheat, barley, maize area 43.6 44.4 +2%
Source: Strategie Grains (November 2020)
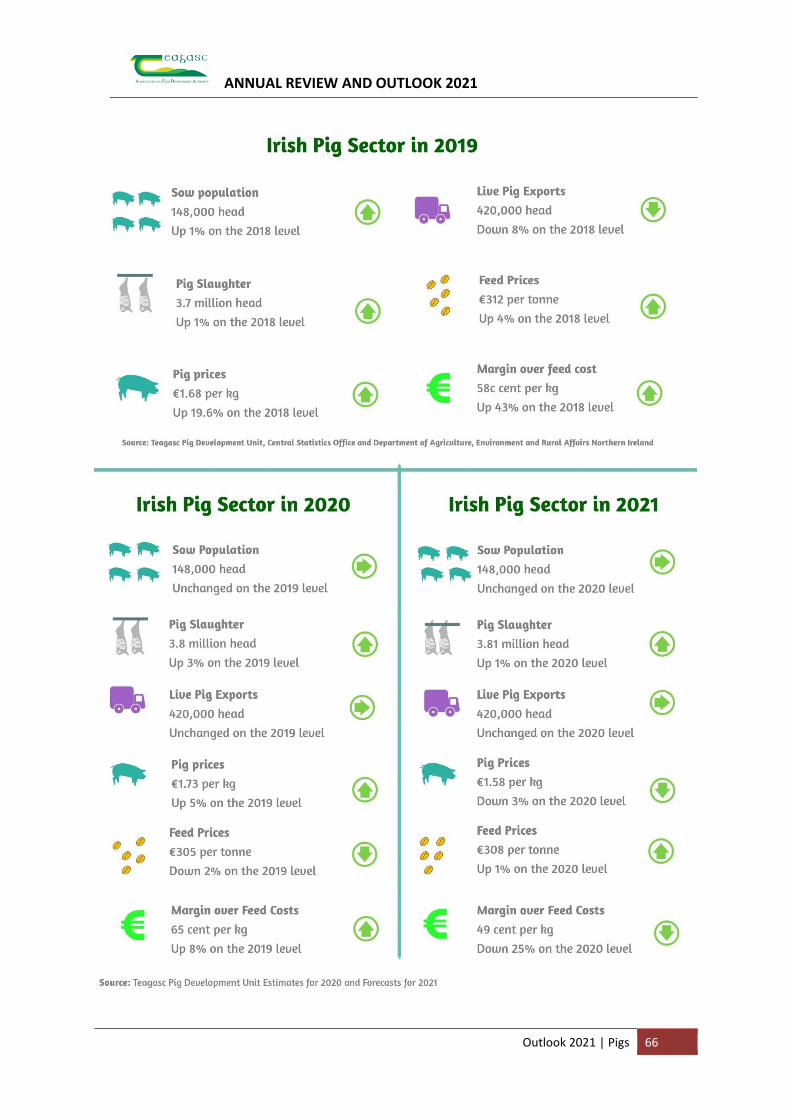

ANNUAL REVIEW AND OUTLOOK 2021
67 Pigs| Outlook 2021
Review of Pig Sector in 2020 and Outlook for 2021
Michael McKeon
Pig Development Department, Teagasc
1. Introduction
The Irish pig industry enjoyed a buoyant period of profitability in the second half of 2019 which was predicted to continue into 2020. While 2020 did remain profitable unfortunately it didn’t reach the levels forecast as, with other sectors, COVID-19 had a detrimental impact.
2. Review of Irish Pig Sector in 2020
2.1 Pig Production Costs
The cost of producing pigs in Ireland can be broken into feed cost and non-feed costs. Feed currently constitutes 63-65 percent of the total cost of producing a pig, with the non-feed inputs contributing the remaining 35-37 percent.
2.2 Irish Pig Feed Costs 2020
Annual Irish composite pig feed prices are shown in Figure 1, expressed in terms of the cost per kg deadweight (dwt.). Feed prices were largely stable from January to April 2020 with a composite pig feed price of €301. The expectation of a poor harvest yield from poor EU planting conditions in autumn 2019 and US crops having difficulties, resulted in ingredient prices rising from May 2020 on-wards. Increases in wheat, barley and soya ingredient prices in autumn 2020 should have translated into higher feed prices. However,
increased competition between mills havs moderated the expected feed rise. The current composite feed price is €307 per tonne (November 2020) and the 2020 annualised price is estimated to be €305 per tonne. The 2020 composite feed price of €305 per tonne represents a 2 percent decrease when compared to 2019 (€311) primarily due to the lower prices from Jan.-June 2020.
Figure 1: Irish pig feed cost 1995-2020
Source: Teagasc Pig Development Department
When the composite feed price is examined over a longer time period, the 2020 price of €305 is midway between the 5 year average (2016-2020) and 10 year average (2011-2020), €300 and €311 respectively. The annualised feed cost of 108 cent per kg dwt. is marginally higher than the five year average of 107 cent per kg. The highest feed cost in
108
70
80
90
100
110
120
130
1995 2000 2005 2010 2015 2020
cen
tp
er k
gd
wt
Brexit Assumptions: No post Brexit Trade Deal has been agreed between the EU and UK (as of Dec 1st 2020)
UK Brexit Transition period ends on Dec 31st 2020
Without a trade deal, EU – UK trade post 2020 will be based on mutual application of MFN
tariff schedules
Trade and price impacts would occur
but no immediate supply response is assumed in 2021
Income projections for 2021 do not reflect any possible policy response
While the EU and the Irish Government will likely respond to a No Deal outcome with
increased sectoral support, this is not factored in the 2021 income projections
Forecasts of the farm income reduction in 2021 are therefore indicative of the resources
required to mitigate the economic impact of Brexit on farm incomes

ANNUAL REVIEW AND OUTLOOK 2021
Outlook 2021 | Pigs 68
recent years was in 2012 at 132 cent per kg and the lowest was in 1999 at 76 cent per kg.
2.3 Non-feed costs in Irish Pig Production
There are currently 80,000 sows on the Teagasc eProfit Monitor (ePM) database from a national herd of an estimated 148,000 (55 percent of total). The non-feed costs quoted are based on the national 2019 ePM data, (2020 data not yet available). Changes from year-to year are generally minimal. Non-feed costs (excluding building depreciation and financial costs) are itemised in Table 1.
Table 1: Non-Feed Costs in ePM Recorded Herds
Cost Item 2019 2015-2019
cent per kg dwt.
Healthcare 6.2 6.2
Heat, Power Light 3.8 4.1
Transport 1.9 1.4
AI 1.9 19
Manure 1.8 1.7
Labour/Management 15.1 14.1
Repairs 2.7 2.6
Administration 1.2 1.0
Environment 0.5 0.5
Insurance 1.3 1.1
House rental 1.7 1.8
Contract Costs 2.3 2.1
Water 0.5 0.5
Dead Pigs Disposal 0.7 0.8
Stock Depreciation 2.1 1.9
Miscellaneous 1.2 1.2
Total 44.9 42.7
Source: Teagasc ePM Report 2019
2.4 Financial Costs in Irish Pig Production in 2020
These costs include interest payments and building depreciation and vary greatly from unit to unit depending on the age of the unit and the level of capital investment undertaken in the business in recent years. Financial costs are itemised in Table 2.
We estimate that the cost of building depreciation and interest is significantly lower than the true level required for a healthy pig industry. This reflects the
sector’s reduced capital investment in recent years due to the low profitability of the sector.
Table 2: Financial Costs in ePM recorded herds
Cost Item 2019 2015-2019
cent per kg dwt.
Interest 4.3 4.5
Building Depreciation 1.4 1.5
Total 5.7 5.9
Source: Teagasc Pigsys Report 2019
2.5 Total Cost of Irish Pig Production in 2020
The estimated annualised cost of production in 2020 (based on 2019 non-feed costs and 2020 feed costs) was 158.6 cent per kg dwt. (2019; 159.1) for pigs delivered to the slaughter plant.
2.6 Irish Pig Prices in 2020
The estimated average pig price in 2020 was 173 cent per kg dwt., which was 5 cent per kg dwt. higher than in 2019 (168 cent per kg dwt) and 23 percent higher than 2018 (141 cent per kg dwt) which was significantly higher than the five year average (2016-2020) of 159 cent and 10 year average (2011-2020) of 157 per kg dwt. respectively. The monthly pig price in January began the year at a very high level of 195 cent per kg dwt. but then began to slide from February as the scale of the COVID-19 outbreak in China began to emerge. The Chinese lockdown in February and March was followed by refrigerated container logistical difficulties and then by European COVID-19 lockdowns. The pig price decreased from February (197c/kg dwt.) to reach 163 cent per kg dwt by August and plateaued at this price before falling sharply in November. The EU pig price in 2020, as per the Irish price, decreased primarily due to the effect of COVID-19 on demand and logistical supply difficulties in slaughter plants. The EU market was further disrupted by the outbreak of African Swine Fever (ASF) in wild boar in Germany. The outbreak of this pig disease prohibited any German pigmeat exports to China which resulted in a collapse of their pig price to 119 cent per kg dwt. Some EU slaughter plants also lost their Chinese export licenses due to COVID-19 outbreaks, resulting in large backlogs of pigs to be slaughtered
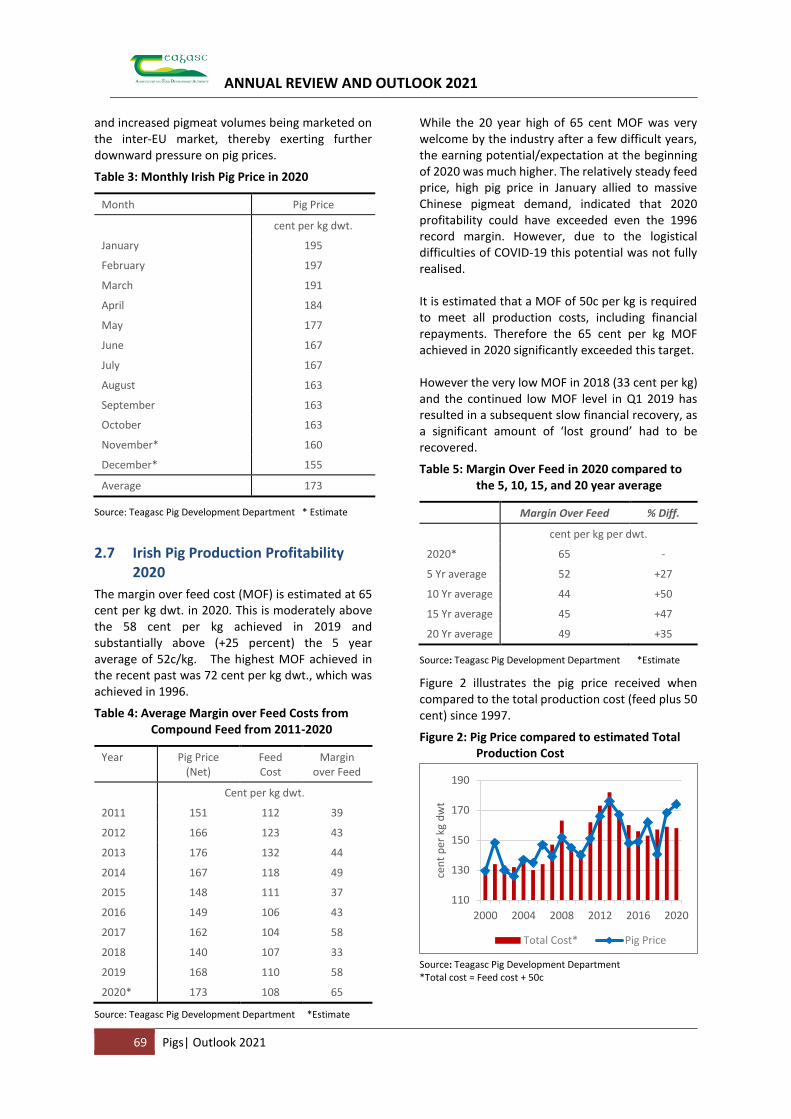
ANNUAL REVIEW AND OUTLOOK 2021
69 Pigs| Outlook 2021
and increased pigmeat volumes being marketed on the inter-EU market, thereby exerting further downward pressure on pig prices.
Table 3: Monthly Irish Pig Price in 2020
Month Pig Price
cent per kg dwt.
January 195
February 197
March 191
April 184
May 177
June 167
July 167
August 163
September 163
October 163
November* 160
December* 155
Average 173
Source: Teagasc Pig Development Department * Estimate
2.7 Irish Pig Production Profitability 2020
The margin over feed cost (MOF) is estimated at 65 cent per kg dwt. in 2020. This is moderately above the 58 cent per kg achieved in 2019 and substantially above (+25 percent) the 5 year average of 52c/kg. The highest MOF achieved in the recent past was 72 cent per kg dwt., which was achieved in 1996.
Table 4: Average Margin over Feed Costs from Compound Feed from 2011-2020
Year Pig Price (Net)
Feed Cost
Margin over Feed
Cent per kg dwt.
2011 151 112 39
2012 166 123 43
2013 176 132 44
2014 167 118 49
2015 148 111 37
2016 149 106 43
2017 162 104 58
2018 140 107 33
2019 168 110 58
2020* 173 108 65
Source: Teagasc Pig Development Department *Estimate
While the 20 year high of 65 cent MOF was very welcome by the industry after a few difficult years, the earning potential/expectation at the beginning of 2020 was much higher. The relatively steady feed price, high pig price in January allied to massive Chinese pigmeat demand, indicated that 2020 profitability could have exceeded even the 1996 record margin. However, due to the logistical difficulties of COVID-19 this potential was not fully realised. It is estimated that a MOF of 50c per kg is required to meet all production costs, including financial repayments. Therefore the 65 cent per kg MOF achieved in 2020 significantly exceeded this target. However the very low MOF in 2018 (33 cent per kg) and the continued low MOF level in Q1 2019 has resulted in a subsequent slow financial recovery, as a significant amount of ‘lost ground’ had to be recovered.
Table 5: Margin Over Feed in 2020 compared to the 5, 10, 15, and 20 year average
Margin Over Feed % Diff.
cent per kg per dwt.
2020* 65 -
5 Yr average 52 +27
10 Yr average 44 +50
15 Yr average 45 +47
20 Yr average 49 +35
Source: Teagasc Pig Development Department *Estimate
Figure 2 illustrates the pig price received when compared to the total production cost (feed plus 50 cent) since 1997.
Figure 2: Pig Price compared to estimated Total Production Cost
Source: Teagasc Pig Development Department *Total cost = Feed cost + 50c
110
130
150
170
190
2000 2004 2008 2012 2016 2020
cen
t p
er k
g d
wt
Total Cost* Pig Price

ANNUAL REVIEW AND OUTLOOK 2021
Outlook 2021 | Pigs 70
2.8 Irish Pig and Sow Numbers in 2020
The Irish commercial sow herd census in 2020 is estimated at 148,000 and this has remained unchanged in the last 5 years despite considerable financial fluctuations in the sector within this time.
The estimated number of pig slaughtering’s in 2020 are illustrated in Table 6. The 2020 disposals are estimated to be 3.80 million pigs which is marginally higher (2 percent) than in 2019, reflecting the continuing improvements in sow prolificacy.
Table 6: Irish born pigs slaughtered: 2017-2020
Year 2017 2018 2019 2020*
million head
Slaughter Pigs 3.68 3.84 3.70 3.79
Source: Teagasc Pig Department *estimate
The 10 year trend (Table 7) illustrates a 15 percent increase in slaughtering’s over this period which reflects the increased efficiencies and output of the sector. The decline in exports of Irish born pigs to Northern Ireland (N.Ire.) has stabilised in the last two years, but remains at a lower level than in previous years. In the period from 2011 to 2020 the pig exports to N.Ire. have fallen by 35 percent. In 2020 N.Ire. exports contributed to 12 percent of the total Irish born pig slaughtering’s which may be an important factor in the case of a no-agreement Brexit.
Table 7: Slaughter and Live Export to N. Ireland of Irish Born Pigs from 2011-2020
Year Licensed Export Plants
in Ireland
Exports to Northern Ireland
Exports as % of Total
million head %
2011 2.847 0.610 18
2012 2.907 0.612 17
2013 2.829 0.570 20
2014 2.940 0.519 18
2015 3.132 0.514 16
2016 3.221 0.414 13
2017 3.295 0.433 13
2018 3,337 0.463 14
2019 3,273 0.425 12
2020* 3,343 0.451 12
Source: DAFM & DARDNI *estimate
The combination of high sow prolificacy and higher sale weight has combined to significantly increase the annual volume of Irish pigmeat being produced year-on-year. Table 8 illustrates a 10 percent output increase over the last 5 years without any increase in the national sow herd size.
Table 8: Irish annual pigmeat output 2016-2020
Year Total Pigs Slaughtered
Ave Dead wt #
Total Pigmeat Produced
Million Head Kg Tonnes
2016 3.63 83.0 301,290
2017 3.68 84.6 311,328
2018 3.84 86.2 331,008
2019 3.70 86.7 320,790
2020* 3.79 87.7 332,383
Source: DAFM & DARDNI * Estimated ^Irish born # ePM
The level of pig disposals in some of the principal pig exporting countries are shown in Table 9. The sow herd declines in Germany and the Netherlands have reduced slaughter numbers by 2.4 million and 0.2 million pigs respectively. The increase in Danish slaughterings is a reflection of increased herd prolificacy, reduced live exports due to economic and ASF logistical difficulties.
The ‘stand-out’ data point in Table 9 is the continuous increase in the Spanish slaughter numbers. To illustrate this continuous increase, Spain slaughter number (44 weeks) increased from 31.8 million pigs (2016) to 36.6 million pigs (2020) an increase of 4.8 million pigs (15 percent) over a five year period.
Table 9: Selected European & North American Pig Disposals
2019* 2020* Change
Country Million head %
Germany 40.2 37.8 -5.5
Spain 35.0 36.6 +4.6
France 16.2 16.1 -0.7
Denmark 13.7 14.2 +3.8
Netherlands 12.9 12.7 -1.3
Total 118.0 117.4 -0.5
U.S. 107.8 109.1 +1.2
Canada 17.1 17.7 +3.4
*Based on 44 weeks of production Source: MPB 2020

ANNUAL REVIEW AND OUTLOOK 2021
71 Pigs| Outlook 2021
This rate of expansion is the reason why Spain has now taken over from Germany, Netherlands and Denmark, as the ‘powerhouse’ of European pig production.
3. EU Pigmeat Exports in 2020
In 2018 the outbreak of ASF in China led to a reduction in the China’s sow herd of 40 percent and a reduction in the total pig herd of 220 million pigs. As pork constitutes 60 percent of the total volume of meat consumed in China, this is a significant deficit by global standards. The Chinese sow herd is in a rebuilding phase but it will be another 12 months before it approaches pre-ASF 2018 levels. The data in Table 10 reports on a moderate increase in EU pigmeat exports to China from January-August 2020 (+13 percent) but the US increase is more significant (+17 percent) as this does not include the effect of Germany being excluded from the Chinese market from September onwards. The annualised US pigmeat export volume to China is expected to show a year-on-year increase in excess of 20 percent. The EU loss of market share may be difficult to reclaim in the coming years as the Chinese import requirement decreases.
Table 10: Pigmeat exports from selected countries
Country 2019* 2020* change
million tonnes %
EU 3.53 3.98 +13
USA 1.70 1.99 +17
Canada 0.83 0.98 +17
Brazil 0.47 0.68 +43
Total 6.53 7.63 +17
Source: MDP * Jan-Aug
4. Outlook for Irish Pig Sector in 2021
The outlook for the pig sector is a reflection of global pig feed and pig price market trends.
4.1 Irish Pig Feed Price Outlook in 2021
The estimated composite compound pig feed price in November 2020 is €305 per tonne. The increase in harvest cereal prices reflected the poor planting conditions across Europe in autumn 2019. As a result, the French and UK harvest yields were both substantially lower in 2020 than in 2019, especially for wheat. The Irish winter cereals were estimated
to be 40 percent down compared to the five year average The forecast for the 2021 Irish cereal harvest is for cereal prices to decrease marginally in Q3 and Q4 2021. This is based on a range of factors. Firstly the Australian harvest is forecast to be the biggest in recent years due to good rainfall in the eastern states. The estimated 29MT harvest would be 14 MT higher than the previous drought stricken harvest and would allow approximately 20-21MT for export. Nearer home the E.U. winter planting for wheat and barley has gone well and the harvest is expected to at a minimum to reach five year average output. The South American soyabean planting has being more problematic. Drought conditions in September and October delayed planting by nearly a month in many parts of Brazil. Although the crop has now being planted and received some rain, the moisture deficit in Mato-Grosso, Brazil’s largest soya state, is still very high. The industry had forecast a Brazilian harvest of 133MT but this is now unlikely due to the late planting and continued poor growing conditions. The current high soyabean price of €420 (Nov. 2020) looks set to continue for much of 2021 until easing with the arrival of the 2021 U.S. harvest. Overall the outlook for the composite pig feed price is an increase during the spring by €10/tonne and then reduce by €20/tonne as the northern hemisphere cereal and soybean harvest arrives. The average pig feed price is forecast to be 109c/kg dwt.
4.2 Pig Prices in 2021
The outlook for the Irish pig price is going to be driven by three main factors; Chinese demand, detrimental effects of COVID-19 and a no-agreement Brexit. The Chinese sow herd recovery has been reported to be within 10-12 percent of pre-ASF levels but this appears to be very optimistic. This sceptical view is underlined by the fact that Chinese pig slaughter numbers in September 2020 were still 33 percent below pre-ASF levels and during the six month period (Mar 2020-Sept 2020) the deficit had only reduced by 4 percent (37 percent to 33 percent). A current sow herd recovery to 20 percent of pre-ASF levels seems more realistic/probable. If this assumption is correct then the Chinese pigmeat

ANNUAL REVIEW AND OUTLOOK 2021
Outlook 2021 | Pigs 72
production deficit will reduce as 2021 progresses thereby cooling their domestic pig price and import demand. However Irish export volumes to China in 2021, even at a lower volume, will still play an important role in supporting our pig price. COVID-19 is currently (Nov. 2020) causing significant logistical problems. Germany and Denmark have estimated pig slaughter backlogs of 700,000 and 100,000 respectively due to COVID-19 working restrictions in slaughter plants. Furthermore COVID-19 cases within factories are resulting in the loss of individual factory export licenses to China. This pig meat is then placed on the European market, depressing prices. The imminent arrival of human COVID-19 vaccines will hopefully help to gradually reduce cases globally. However it may be mid-2021 before the levels in the general population decrease significantly. If food-chain personnel/slaughter plant workers are considered ‘priority essential workers’, and receive priority vaccination, then the reduction in COVID-19 incidences in personnel working in the pig sector may be accelerated. Brexit negotiations between the EU and the UK are still on-going (Nov.2020). However, in the case of no-agreement the WTO rules will commence in March 2021. The UK market is a very import market for Ireland as it is an export destination for 45-50 percent of our pigmeat exports (€500M) and also 12 percent of our ROI born pigs are slaughtered in Northern Ireland. The UK itself has been estimated to be only 55 percent self-sufficient for pigmeat therefore it will still require large pigmeat import volumes irrespective of an agreement or not. Teagasc economists have estimated that pigmeat prices would reduce by 4-5 percent in the case of a no-agreement Brexit. These combined factors make it difficult to predict a pig price for 2021. However, we estimate it will be in the region of 155-160c/kg if a Brexit agreement is reached and 147-152 c/kg if no-agreement.
4.3 Pig Sector Profitability in 2021
The significant drop in pig prices during 2020 will continue into the first quarter of 2021. This allied to an increase in feed cost will result in tightening margins during Q1 & Q2. A moderate decrease in
feed prices in Q3 &Q4 and a moderate pig price increase will see margins recover in the later-half of 2021 but below the heights of 2019 & 2020.
Overall it is estimated that the MOF in 2021 will be 49 c/kg which will be a decrease of 25 percent on the 2020 average.
Table 11: Pig & Feed Price Forecast 2021
Year Pig Price (Net)
Feed Cost
Margin over Feed
cent per kg dwt.
2020* 173 108 65
2021^ 158 109 49
Source: Teagasc Pig Development Department *Estimate ^ Forecast
5. Conclusion
The Irish pig sector enjoyed high profitability in 2019 and 2020, but the outlook for 2021 is for much tighter margins due to a cooling Chinese market resulting in a much lower pig price.

ANNUAL REVIEW AND OUTLOOK 2021
73 Forestry| Outlook 2021
Review and Outlook for Forestry 2021
Tom Houlihan
Forestry Specialist Forestry Development Department,
Teagasc, Killarney, Co. Kerry
1. Introduction
Ireland’s forest sector is evolving, but is highly important to rural economies and from a national perspective. Since 1980, almost 19,000 farmer applicants have received support to establish forests (DAFM, 2020). Private forests established during the 1980’s and 1990’s are now approaching maturity and this timber resource is projected to deliver a major supply increase to the market in the coming years. This projected increase will be a driver for many associated benefits in terms of sectoral growth and wider employment potential (McAuley, 2020). Forests also play an increasingly important role in the provision of ecosystems services, including climate change mitigation. The challenge and ambition is to ensure measures contributing to achieving timber and non-timber benefits equitably address the economic, environmental and social benefits that forests can deliver (Teagasc, 2020).
2. Major Challenge in Licencing/Appeals
2020 has been a year during which the intensification of delays in issuing of forestry licences has seriously challenged the sector (Hurley, 2020). Both the forestry licencing regime and the appeals system have come under major pressure. This followed the introduction of new procedures for the screening and approval of licenced forestry operations. It has led to significant backlogs in the issuing of permits for afforestation, road construction and timber harvesting activities (O’Halloran, 2020). The forest industry is reliant on a continuous flow of approvals through the licencing system. Feedback from stakeholders across the forest sector highlights the critical need to rapidly address the licencing backlog and dramatically increase the supply of licences for the key forestry activities in December 2020 and into 2021, while at the same time ensuring due process. These actions are essential to support the viability of the forest and
forest products industry which provides essential employment in rural economies.
3. COVID 19/Brexit Challenges
The importance of the forest sector is reflected in the fact that it was deemed an essential service during the COVID-19 restrictions in April/May 2020. Despite a challenging environment, many stakeholders across the forestry chain continued to operate, albeit at a reduced capacity/output. The COVID-19 lockdown significantly impacted on sales to the construction market. The production of essential palletwood was a focus by some processors where opportunities arose (Magner, 2020). A recent move towards recovery stemmed from the restart of construction, both domestically and in the UK. However, security of timber supply for processing to meet buoyant demand remains a serious and urgent challenge for sawmills. Brexit negotiations continue to present uncertainties to the forest sector. There is broad consensus that clarity in terms of favourable future trading arrangements would boost confidence and aid future investment and construction growth. Brexit issues are further covered in section 10.
4. Financial Supports
In 2019, €86.7 million of capital expenditure was invested by the Department of Agriculture, Food and the Marine (DAFM) in forestry development, 92 percent of which went towards afforestation grants and premiums. An additional €6.63 million was spent on other support schemes for forestry, woodland reconstitution and development projects (DAFM, 2020a). In its 2020 budget, the Government allocated €100 million (including a capital carryover) for the Forestry Programme for 2021. This provides funding to establish 8,000 hectares (ha) of new forests in 2021, as set out in the Climate Action Plan (DCCAE, 2019). However, achieving this annual target represents a considerable challenge as

ANNUAL REVIEW AND OUTLOOK 2021
Outlook 2021 | Forestry 74
afforestation levels have steadily decreased over the last number of years (DAFM 2020a).
4.1 Planting in 2019/2020
In 2019, payments were made by DAFM in relation to the planting of 3,550 hectares (ha) of land, down from 4,025 ha in 2018. Current indications are that by the end of 2020, grant aided afforestation is likely to be between 2,300 and 2,400 ha (Figure 1). Engagement with forestry stakeholders indicates how this declining trend in afforestation is a major source of concern. It also frames the serious challenge to progressing towards the achievement of stated planting targets in the future.
Figure 1: Annual Planting 2013 to 2019, with Projection for 2020
Source: DAFM (Forestry Division), various years
The achievement of these planting targets is critical not only for Ireland’s indigenous forestry sector, but also in terms of its vital role in supporting rural economies and rural development, renewable energy provision and climate change mitigation (COFORD, 2018b). Teagasc research highlights the significant gains from planting that may be generated on land classified as limited or very limited for agricultural use (Ryan et al., 2016). The current average forest size of 6.4 ha indicates that, where farmers consider the forestry option, they are planting part, but not all, of their holdings. There are clear opportunities for new forests, incorporating the right trees in the right place with appropriate objectives, to provide a complementary rather than competing enterprise on many farms. The potential returns from forest enterprises are explored further in section 5.
4.2 The Decision to Plant
The Teagasc National Farm Survey (NFS) collects information annually on a sample of farms with a forest enterprise. The sample is statistically
weighted to represent the national farming population. Of the 92,507 farms represented by the survey in 2019 (Donnellan et al., 2020), 8,598 farms contain forests (almost 9.3 percent), with an average ownership of 10.6 ha per farm. Those farmers participating in the Teagasc NFS have forests spread over a range of age classes. An analysis by NFS farm system, indicating the extent to which farms and farming systems include forests, is shown in Table 1.
Table 1: Forestry Representation on Irish Farms
Source: Donnellan et al. 2020
The 2019 Teagasc NFS data indicate that the largest populations of farms with forests continue to be those with cattle systems (cattle rearing/cattle other). It is evident that farms with sheep enterprises contain the highest average forest area per farm, reflecting a relatively high average farm size in the survey (48 ha). Despite the above trends, forestry is shown to have a significant representation in sectors such as dairy and tillage within the 2019 Teagasc NFS (Table 1). Ryan and O’Donoghue (2016) describe how the conversion of land from agriculture to forest involves a complex decision making process. They identify physical, economic and behavioural drivers that are relevant to the decision. These drivers include the permanence of the land use change from agriculture to forestry and socio-cultural attitudes towards the decision, soil quality and the opportunity cost of planting. The potential relative returns to agriculture and forestry was also found to be a significant driver of the afforestation decision in the study. The Forest Land Availability Implementation Group Report (COFORD, 2018b) identifies factors perceived as currently impacting (both negatively
System Farm
Population
Farms with
forest
% with forest
Average forest area per farm
(ha)
Dairy 16,146 1,422 8.8 8.1
Cattle Rearing
25,837 2,286 8.8 9.7
Cattle Other
28,182 2,793 9.9 11.9
Sheep 14,322 988 6.9 13.5
Tillage 6,879 1,049 15.3 9.9
Mixed Livestock
1,140 59 5.2 6.1
ALL 92,507 8,598 9.3 10.6
0
2,000
4,000
6,000
8,000
2014 2016 2018 2020 (F)
hec
tare
s

ANNUAL REVIEW AND OUTLOOK 2021
75 Forestry| Outlook 2021
and positively) on afforestation and overall confidence in the sector. Though not exhaustive, the following factors were identified:
Agri-environment schemes which favour short-term decisions and depending on land parcel selection, may result in penalties for those wishing to move between schemes;
Measures encouraging long-term land leasing for agriculture (although this may be desirable from a land mobility/agriculture expansion perspective);
The appeals process and adverse publicity around this;
Financial claw-backs on land already planted in certain cases;
The requirement for forestry site notices;
Delays in scheme payment relating to forestry parcels in the Basic Payment Scheme (BPS);
Ash Dieback and recent storm events and publicity around these;
CAP post-2020 and the perceived need to continue to ‘farm actively’;
Current negative narrative in relation to certain types of afforestation;
Prevailing timber prices.
4.3 Addressing Challenges
Addressing the challenge of falling afforestation levels will require implementation of a range of co-ordinated actions. Feedback from the sector highlights the urgent need to substantially increase the flow of afforestation approvals to support the 2020/21 planting programme. There is also a need to support farmers and land-owners in terms of re-engaging with the forestry option as a viable and complementary land use and building confidence on the merits of planting. Improved alignment between agricultural support schemes and afforestation, to remove any barriers to planting, is also a focus. (DAFM 2020a). In announcing a budget allocation of €100 million for forestry for 2021, Minister of State with responsibility for Land Use and Biodiversity, Senator Pippa Hackett, outlined her ambition to ‘get forestry moving again’ and ensuring it ‘works for all’. The Minister also described her desire to use the budget allocation to deliver a range of schemes and incentives which will deliver diversity of planting, climate action and biodiversity as well as supporting a healthy industry (DAFM 2020b). The Forestry (Miscellaneous Provisions) Act 2020 commenced on enactment on October 6. The secondary legislation required to give effect to the
main provisions of the Act came into force on October 7. It provides a legal basis to allow for the better management of forestry appeals in the system (DAFM, 2020). In parallel with these developments, fees have been introduced for forestry applications, submissions and appeals. Magner (2020), reporting on recent DAFM data, suggests a recent fall in forestry appeals as a positive in terms of the planting and felling programme, while also referencing the very high number of licence applications currently in the system awaiting approval. DAFM have committed to tackling the current licence backlog through a dedicated project plan, which operates to key performance indicators. A project manager is in place and a Project Management Board is reported as overseeing and monitoring weekly licence delivery. Ten additional forestry inspectors have been recruited to help deliver on the plan. Sixteen full-time equivalent ecologists are in place and further staff resources are proposed (DAFM, pers. comm.). Grant aiding of Natura Impact Statements as part of the pre-licencing assessment process is currently being considered. A forestry portal, with all applications and site details available on a single website, has been developed to help ensure more visible and transparent access to the forest licencing process (DAFM, 2020). Minister of State, Senator Pippa Hackett recently announced the appointment of Ms Jo O’Hara to advise on implementation of the MacKinnon Report, commissioned by the DAFM. Ms. O’Hara, brings valuable experience which includes leading the implementing of the Scottish MacKinnon report. She is tasked with advising on actions to support the successful delivery of the ‘ways forward’ identified in the Review of Approval Processes for Afforestation in Ireland (Mackinnon 2019). Minister Hackett has also brought together a grouping to inform and support future forest policy. This Forest Policy Group incorporates a broad range of stakeholders including from those from industry, the environment, state agencies as well as farmer and community representatives. It has had its initial meeting in November 2020. Teagasc, in conjunction with the DAFM and the forest industry, will continue to actively engage in awareness-raising of the benefits of well-planned and sustainable farm, through a multi-faceted promotional effort. A sustained and co-ordinated

ANNUAL REVIEW AND OUTLOOK 2021
Outlook 2021 | Forestry 76
approach from all stakeholders is a further essential requirement in terms of helping achieving desired impacts.
5. Forestry Returns
The Teagasc Forest Investment Valuation Estimator (FIVE) informs decision making in relation to potential land use and forestry. The application uses discounted cash flow (DCF) analysis to model indicative financial returns for forestry land-use options. FIVE provides indicative analysis and decision support, particularly in relation to reviewing pre-planting options and comparing criteria such as species, yield classes and forest rotation lengths according to landowners’ preferences and objectives.
Figure 2: Indicative Forest Returns for 1 ha of Mainly Conifer Forest (GPC 3)
Source: Teagasc, FIVE (2020) Assumptions: Grant and Premium Category 3 (70% spruce (yield class 24), 15% broadleaf species, 15% retain area for biodiversity enhancement), forest cycle 33 years, discount rate 5%, 10-year average timber prices used.
Potential timber revenues are generated by FIVE through the selection of forest criteria and management regimes. A range of variables are used as inputs in a typical analysis. These include species, site productivity, rotation length, relevant premium payments, establishment and on-going management costs as well as potential thinning and clearfell timber volumes and revenues. Future cost and revenue streams from forestry are generated in FIVE which are then discounted to present day values and presented as net present values (NPVs). The NPV refers to the net returns to forestry over one (or more) forest rotation(s). In order to compare forestry with other farm enterprise options (at an indicative level), the FIVE tool allows different forest crop rotations to be expressed on an annual per hectare basis by generating the Annual Equivalent Value (AEV) for each forest
scenario. The AEV expresses the NPV as a series of equal cash flows over the forest rotation.
Figures 2 and 3 present indicative financial returns for one hectare of a mainly conifer (GPC 3) and broadleaf forest (GPC 5) respectively based on FIVE analysis. GPC refers to the relevant Grant and Premium Category of the DAFM Afforestation Scheme. A summary of the comparative financial outputs for these two afforestation categories is also presented in Table 2. The respective AEVs are €514 /ha/year for GPC 3 and €326 /ha/year for GPC 5. If all costs and revenues associated with forestry land use are compared with all costs and revenues associated with agricultural land use (after adjusting to present values and the one-year cycle per annum basis) then the Forestry AEV per ha and family farm income are conceptually equivalent.
Figure 3: Indicative Forest Returns for 1 ha of Broadleaf Forest (GPC 5)
Source: Teagasc, FIVE (2020) Assumptions: Grant and Premium Category 5 (85% sycamore (yield class 8), 15% retain area for biodiversity enhancement), forest cycle 33 years, discount rate 5%, 10-year average timber prices used.
Table 2: Comparative per Hectare Financial Outputs for GPC’s 3 and 5
GPC
Financial outputs
Grant and Premium
Category 3
Grant and Premium
Category 5
Total revenues (€) 29,499 19655
Total costs (€) 5,949 7,739
Net Present Value (€/ha) 8,219 5,898
Annual Equivalent Value* (AEV) €/ha/year
514 326
Source: Teagasc, 2020
It should also be borne in mind that this analysis compares observed agricultural incomes with projected future forestry income flows discounted
-€5,000
€0
€5,000
€10,000
€15,000
€20,000
2020 2025 2030 2035 2040 2045 2050 2055
Costs Revenues
-€5,000
€0
€5,000
€10,000
€15,000
€20,000
2020 2030 2040 2050 2060 2070
Costs Revenues

ANNUAL REVIEW AND OUTLOOK 2021
77 Forestry| Outlook 2021
to today’s values and converted to annual equivalent. This allows indicative rather than absolute comparison. On that basis, forestry returns can be very competitive when compared to some agricultural enterprises. FIVE cannot account for uncertainties such as potential subsidies that agricultural and forestry land will attract in the future or what new values may emerge for the services produced by agricultural and forestry land uses.
6. Timber Harvest and Processing
6.1 Felling Licence Process
The DAFM have responsibility for regulation and licencing of tree felling in Ireland. The Forestry Act (2014) requires applicants to provide notice of intention to fell trees and provides for a single felling licencing process. Felling licences may be valid for up to 10 years duration; this may be extended by the DAFM for one or more further periods, as appropriate.
Figure 4: Monthly Felling Licences issued 2019 vs 2020
Source: DAFM, Forestry Section Monthly Reports (2019/20) and Forestry Dashboard (17 November, 2020).
The number of felling licences (FLs) issued annually is reported as a sectoral figure, combining licence numbers issued for Coillte and private forest owners (DAFM, 2020e). The total number of felling licences issued to September 30, 2020 is 3,856, a decrease of over 70 percent on the same period in 2019 (Figure 4). Hurley (2020) describes the timber supply situation with being at critically low level with a need to triple the current licencing rate. Similar to the sectoral requirement for a sustained flow of afforestation licences, feedback from timber processors highlights the urgent need to substantially increase the flow of approvals for both forest roading and harvesting operations. These are
essential elements required to maintain a functioning timber supply chain.
6.2 Timber Harvest
In 2019, Coillte recorded the highest ever timber sales volume of 2.72 million m3 (Coillte, 2020). While corresponding data is not as yet available for private sector timber harvest, industry sources suggest a 2019 private harvest levels close to that achieved in 2018 (Table 3 and Figure 5).
Table 3: Total Roundwood Harvest in the Republic of Ireland (2015-2019)
Source: DAFM & Drima Market Research 2019 (*2019 private harvest is an estimate).
Figure 5: Private Sector Roundwood Harvest 2015 to 2019 (000 m3)
Source: DAFM & Drima Market Research, 2019 (The figure for 2019 is a forecast)
Over 90 percent of Irish sawmilling output comes from eight companies. These eight companies supply the main markets for sawlog and stakewood assortments coming from Irish forests. Feedback from the industry suggests that that the volume of private timber harvested in 2020 will be significantly below 2018/2019 levels. Significant volumes of timber have also been imported during 2020 to address domestic timber supply deficits.
0
200
400
600
800
1,000
1,200
Jan March May July Sept Nov
2019 2020
0
500
1,000
1,500
2,000
2,500
3,000
2015 2016 2017 2018 2019
Coillte Private
2015 2016 2017 2018 2019
000’s m3 Overbark
Coillte 2,470 2,377 2,714 2,658 2,720
Private 780 622 828 1,027 1,000*
Total 3,250 3,355 3,542 3,685 3,720

ANNUAL REVIEW AND OUTLOOK 2021
Outlook 2021 | Forestry 78
7. Timber Markets
7.1 Sectoral Demand/Supply
The COFORD Wood Mobilisation and Production Forecasting Group (CWMPFG) published an updated forecast of roundwood demand (2020-2025) in Q4 2018. Despite a forecast doubling of realisable roundwood volumes on an all-Ireland basis to 7.68 million m3 by 2035, an existing supply deficit is forecast as likely to increase significantly over the period up to 2025 and beyond, with wood energy demand being a key driver. The rates of growth in demand for raw material are directly linked to the expected growth in product demand. (CWMFG, 2018).
7.2 Domestic Demand
The Ulster Bank Purchasing Managers Index (PMI) tracks changes in total construction activity over time. The index fell to 28.9 in March 2020 from 50.6 in the previous month, pointing to the sharpest contraction in the sector in 11 years. This was due to coronavirus outbreak and associated containment measures (Figure 6).
Figure 6: Five-Year Construction PMI
Source: Ulster Bank
Civil engineering activity saw the steepest rate of decline, followed by commercial building work and residential activity. Overall, new orders reportedly fell to the greatest extent since April 2009, due to the cancellation of projects and company shutdowns. Construction continues during the October/November Level 5 COVID-19 restrictions and is considered an essential service. The Economic and Social Research Institute (McQuinn et al., 2020) outlines how, despite Ireland’s GDP decline being relatively benign compared to other countries, disruption to many domestic sectors including the construction sector during the COVID-19 lockdown was high by European standards. The lockdown in April and May
contributed to a decline of 30 percent in housing completions in Q2 compared to the same period the previous year. McQuinn et al also report how building capacity is likely to remain below pre-pandemic levels due to social distancing measures and additional safety protocols which have been put in place. Going forward, it is suggested that supply may remain subdued as investment is curtailed where there is an environment of uncertainty. Figure 7 shows the number of housing completions in the State since 2015 with forecasts for 2020 and 2021. While pre-pandemic forecasts suggested 28,000 house completions in 2021, this has been reduced to just over 20,000 (McQuinn et al., 2020). In its analysis of the Irish home building market, a 2020 report by the Irish Homebuilders Association found that up to 36,000 new homes will be required in future years to cater for demand over the next two decades.
Figure 7: Housing Completions RoI (actual and forecast) 2015-2021
Sources: CSO and ESRI 2020
7.3 Timber Supply in 2020
Domestic timber supply was restricted during 2020 due to significant backlogs arising from the licencing and appeals systems. Feedback from some of the main timber processors indicate that the five-week COVID-19 lockdown in spring conserved a level of timber stocks in sawmills that would normally have been processed during that time. This was as a result of builders and builders’ merchants closing during the lockdown period. Since the April/May COVID-19 lockdown restrictions, as timber stocks became depleted, the reported shortage of licences to harvest domestic timber necessitated the importation of timber logs. Feedback from some of the main timber processors describes the ongoing need for weekly boatloads of timber from Scotland to meet timber supply deficits
0
10
20
30
40
50
60
70
2015M10 2017M10 2019M10
ind
ex
0
5,000
10,000
15,000
20,000
25,000
2015 2016 2017 2018 2019 2020 2021
ho
use
s
Actual Forecast
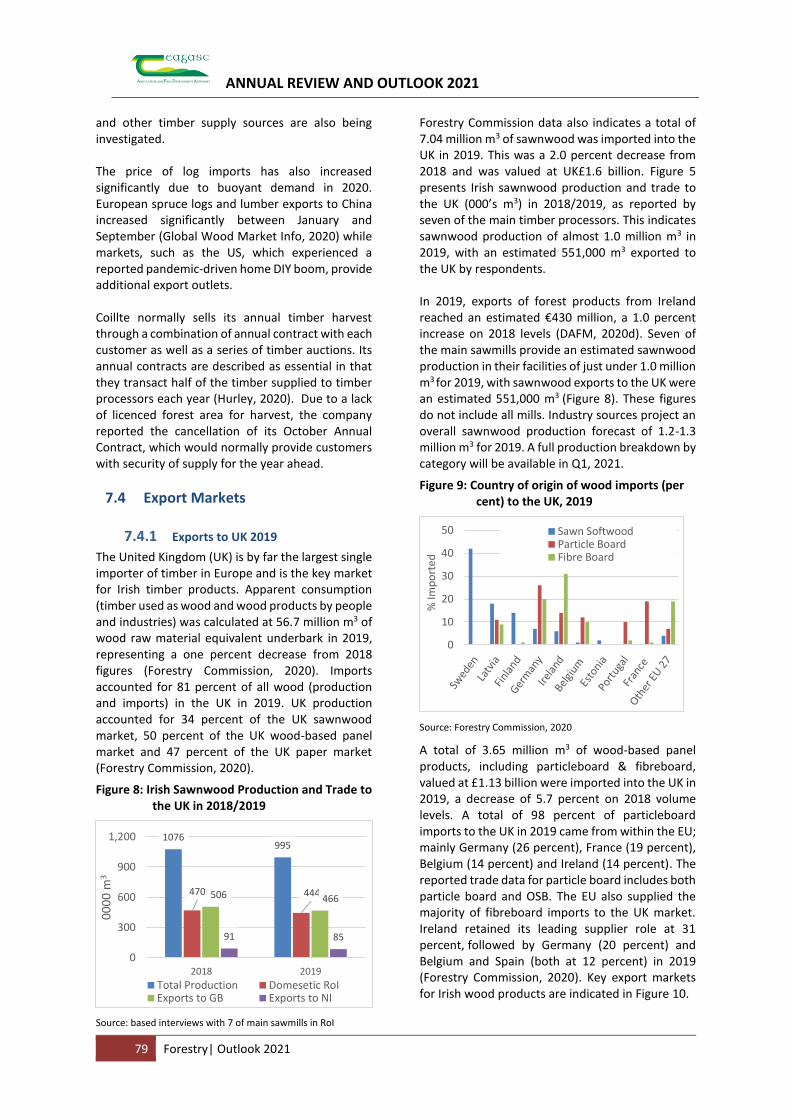
ANNUAL REVIEW AND OUTLOOK 2021
79 Forestry| Outlook 2021
and other timber supply sources are also being investigated. The price of log imports has also increased significantly due to buoyant demand in 2020. European spruce logs and lumber exports to China increased significantly between January and September (Global Wood Market Info, 2020) while markets, such as the US, which experienced a reported pandemic-driven home DIY boom, provide additional export outlets. Coillte normally sells its annual timber harvest through a combination of annual contract with each customer as well as a series of timber auctions. Its annual contracts are described as essential in that they transact half of the timber supplied to timber processors each year (Hurley, 2020). Due to a lack of licenced forest area for harvest, the company reported the cancellation of its October Annual Contract, which would normally provide customers with security of supply for the year ahead.
7.4 Export Markets
7.4.1 Exports to UK 2019
The United Kingdom (UK) is by far the largest single importer of timber in Europe and is the key market for Irish timber products. Apparent consumption (timber used as wood and wood products by people and industries) was calculated at 56.7 million m3 of wood raw material equivalent underbark in 2019, representing a one percent decrease from 2018 figures (Forestry Commission, 2020). Imports accounted for 81 percent of all wood (production and imports) in the UK in 2019. UK production accounted for 34 percent of the UK sawnwood market, 50 percent of the UK wood-based panel market and 47 percent of the UK paper market (Forestry Commission, 2020).
Figure 8: Irish Sawnwood Production and Trade to the UK in 2018/2019
Source: based interviews with 7 of main sawmills in RoI
Forestry Commission data also indicates a total of 7.04 million m3 of sawnwood was imported into the UK in 2019. This was a 2.0 percent decrease from 2018 and was valued at UK£1.6 billion. Figure 5 presents Irish sawnwood production and trade to the UK (000’s m3) in 2018/2019, as reported by seven of the main timber processors. This indicates sawnwood production of almost 1.0 million m3 in 2019, with an estimated 551,000 m3 exported to the UK by respondents. In 2019, exports of forest products from Ireland reached an estimated €430 million, a 1.0 percent increase on 2018 levels (DAFM, 2020d). Seven of the main sawmills provide an estimated sawnwood production in their facilities of just under 1.0 million m3 for 2019, with sawnwood exports to the UK were an estimated 551,000 m3 (Figure 8). These figures do not include all mills. Industry sources project an overall sawnwood production forecast of 1.2-1.3 million m3 for 2019. A full production breakdown by category will be available in Q1, 2021.
Figure 9: Country of origin of wood imports (per cent) to the UK, 2019
Source: Forestry Commission, 2020
A total of 3.65 million m3 of wood-based panel products, including particleboard & fibreboard, valued at £1.13 billion were imported into the UK in 2019, a decrease of 5.7 percent on 2018 volume levels. A total of 98 percent of particleboard imports to the UK in 2019 came from within the EU; mainly Germany (26 percent), France (19 percent), Belgium (14 percent) and Ireland (14 percent). The reported trade data for particle board includes both particle board and OSB. The EU also supplied the majority of fibreboard imports to the UK market. Ireland retained its leading supplier role at 31 percent, followed by Germany (20 percent) and Belgium and Spain (both at 12 percent) in 2019 (Forestry Commission, 2020). Key export markets for Irish wood products are indicated in Figure 10.
1076995
470 444506 466
91 85
0
300
600
900
1,200
2018 2019
00
00
m3
Total Production Domesetic RoIExports to GB Exports to NI
0
10
20
30
40
50
% Im
po
rted
Sawn SoftwoodParticle BoardFibre Board

ANNUAL REVIEW AND OUTLOOK 2021
Outlook 2021 | Forestry 80
The Forestry Commission trade statistics for 2019 show that Ireland supplied 6 percent of the UK sawn timber products market, similar to 2018 levels, while Sweden with 42 percent, Latvia with 17 percent and Finland with 14 percent provided the majority of sawn softwood imports (Figure 9). Ireland supplied 14 percent of the fibreboard and 31 percent of the particleboard imports to the UK in 2019.
7.4.2 Current UK Timber Market
The UK timber products market is subject to cyclical price fluctuations, reflecting trends in the UK economy. Sawn softwood, particleboard, fibreboard, paper and paperboard were overwhelmingly imported from EU countries in 2019 (Forestry Commission, 2020). During 2019, the market environment was reported challenging, particularly in the second half of the year. In its annual report, Coillte outlines how its forest and MEDITE SMARTPLY businesses faced significant headwinds in the core UK market. This was due to continued Brexit uncertainty combined with an excess supply of forest products caused by bark beetle damage in Central Europe. This manifested in significant downward price pressure for sawnwood, MDF and OSB, with all product categories suffering sales price declines of 15 to 20 percent from their highpoint at the end of Q1 2019 (Coillte, 2020).
Figure 10: Top destination countries for forestry exports in 2019
Source: Central Statistics Office, Trade Statistics 2019
Brexit uncertainly and weak exchange rates also affect margins in a market which is extremely competitive at the best of times. Figure 11 presents the Euro-Sterling (UK£/€) relationship between January 2016 and November 2020. The average monthly value for Sterling against the Euro showed
a continuous decline between March and August of 2020, reflecting the growing uncertainty that has persisted. The euro/sterling exchange rate continue to remain challenging. Unfavourable exchange rates in UK end markets and consequent reductions in end-market prices flow upstream through the supply chain to Irish growers and contractors. Sterling has been trading between 0.87 and 0.93 over since May 2020, in a reasonably narrow range. If a Brexit trade deal is completed, the expectation is for the exchange rate to be in the order of 0.87 or 0.88 which is what exporters may be hoping for. In the event of no trade deal, exchange rates in the order of 0.95 to 0.97 may be inevitable (Finn, 2020). The effect on timber prices is analysed in section 8.
Figure 11: Euro- Sterling Exchange Rate Jan 2016 to Oct 2020
Source: European Central Bank, 2020
7.4.3 UK Economy
UK gross domestic product (GDP) is estimated to have contracted by 19.8 percent in Q2 (April to June) 2020. This is the largest quarterly contraction in the UK economy since records began in 1955. It marked the second consecutive quarterly decline after a fall of 2.5 percent in Q1. The major decline in GDP in the second quarter reflects widespread falls in output across many sectors including construction. UK construction output fell by 35.7 percent in Q2 which followed a decline in of 2.8 percent in Q1. Altogether, the cumulative fall in in construction output in the first six months of 2020 was 37.6 percent (Officer for National, Statistics, 2020). The April IHS Markit UK Construction PMI reported ‘a rapid downturn in overall construction output’ following COVID-19-related business closures (Figure 12). There was a recovery in the UK construction sector in subsequent months, with growth evident in total
0.70
0.75
0.80
0.85
0.90
0.95
2016M1 2018M1 2020M1
po
un
d p
er e
uro
United Kingdom
81%
Netherlands 6%
Belgium 3%
Germany 2%
France 2% USA 1% Sweden 1%
Other 4%

ANNUAL REVIEW AND OUTLOOK 2021
81 Forestry| Outlook 2021
output since June 2020. This growth is reflected in the IHS Martkit/CIPS Construction PMI, with values above 50 since the month of June (Figure 12). Quarter 3, 2020 showed increases in construction output of 17.2 percent in July and 3.0 percent in August. However, the output in August remained 10.8 percent below February’s pre-coronavirus levels, which emphasises the challenges ahead (Timber Trade Federation, 2020).
Figure 12: IHS Markit/CIPS UK Construction PMI Oct 2019 to Oct 2020
Source: Tradingeconomics.com
The October PMI index reflected the slowest rate of expansion in the construction sector in five months. Looking ahead, construction companies reported optimism towards their prospects for the next 12 months (Trade Economics, 2020). However, the Timber Trade Federation also highlights the precarious nature of the recovery, and point to a comprehensive trade agreement with the EU as one of the best available ways for the recovery to be supported.
8. Timber prices
8.1 Coillte Timber prices
Coillte currently supplies about 75 percent of timber to the Irish processing sector. It sells timber through both its timber sales electronic auctioning system and contract sales. The standing timber price is the price paid to the forest owner by the buyer for timber standing in the forest. The buyer then incurs the costs of harvesting and extraction. Figure 13 shows available Coillte quarterly contracted standing sales (€ per m3) for selected average size categories between Quarter 1 (Q1) 2018 and Q3 2020. Prices provided are based on auction sales. Timber prices are recorded in terms of 16 categories of average tree size (volume). For simplicity of analysis, palletwood and sawlog timber
assortments are represented by the 0.275 to 0.324 m3 and 0.500 to 0.599 m3 average size categories respectively. Sales of smaller logs (pulpwood and energy wood) are not represented in Coillte data, as such logs are generally retained in the company’s own Medite Europe and Smartply Europe panel board mills, located in Clonmel and Waterford respectively.
Figure 13: Coillte Quarterly Contracted Standing Sales: Q1 2018 to Q3 2020
Source: www.itga.ie, www.teagasc.ie
Timber prices have performed very well during 2020, despite issues such Brexit and COVID-19. Prices are not available for Q1 as no auction took place due to the shortage of felling licence approvals. Coillte timber prices show an upward trend for both sawlog and palletwood categories (as represented) over Q2 and Q3, 2020 (Figure 13). Magner (2020) reported a rise of 30 percent when average prices for the third quarters of 2019 and 2020 are compared. However increased prices have not been matched by increased timber sales. Magner (2020) also reports that the high prices achieved reflect an artificial market situation created by a major fall in timber availability since 2019. The dearth of felling licences and current backlog of over 2,000 licences (including afforestation) awaiting approval is describe as a major problem for the forestry and forest products sector.
8.2 Private timber prices
Prices arising from private timber sales are available for each quarter through the Wood Price Quarterly (WPQ) collated by University College Dublin in conjunction with the Irish Timber Growers Association (ITGA). While the availability of private timber sale data has improved with the introduction of the WPQ, the normally larger volume of Coillte sales makes their prices more robust than current private sales data. Coillte prices
0
10
20
30
40
50
60
Oct-19 Jan-20 Apr-20 Jul-20 Oct-20
ind
ex
0
20
40
60
80
2018 Q1 2019 Q1 2020 Q1
euro
per
m 3
Palletwood Sawlog

ANNUAL REVIEW AND OUTLOOK 2021
Outlook 2021 | Forestry 82
generally represent larger sale lots than the private sector. Figure 14 presents quarterly private standing prices (€ per m3) for selected average size categories between Q 1, 2018 and Q 3, 2020. It should be note that this price data is based on a significantly smaller sample, it includes some pulpwood prices (represented here by average tree size category up to 0.074 m3) from the private sector which are absent from the Coillte price data.
Figure 14: Private Quarterly Roundwood prices: Q1 2018 to Q2 2020
Source: www.itga.ie
Analysis of price trends from private sales is more difficult due to data gaps in some assortment categories. However, an increase in price for both palletwood and, to a lesser extent sawlog, is evident between Q1 and Q2, 2020, reflecting the general trend in Coillte prices. Magner (2020) reports an increase of 40 percent in average prices for small log categories (0.074m3 to 0.174m3) recorded for Q3 2019 compared to the same period this year. He also reports solid demand for pulpwood for both wood-based panels and energy production. WPQ prices in Figure 14 indicates are that timber prices have strengthened since Q3 2019, though further data is required to establish more robust trends. The differential between Coillte and private sector prices may be attributed to a number of factors. A higher proportion of Coillte sawlog is sourced from clearfell operations compared with that of the private sector which produces more from thinning. Harvesting costs in thinning operations are significantly greater than those in clearfell operations. In addition, private sales are generally advertised in smaller lots than in Coillte sales. The resultant costs of moving harvesting and forwarding machinery to a multiple of smaller sites impacts on overall prices. Opportunities now exist
to develop economies of scale through forest owner co-operation and can have a double benefit of increasing woodlot size and reducing costs. Private timber prices are indicative and can fluctuate according to factors such as region, forest type, harvest type, timber quality, woodlot size and access in the prices offered for private timber sales. The Irish Farmer’s Association (IFA) Farm Forestry Timber Price survey comparing the period April-June for 2019 and 2020 is shown in Table 4.
Table 4: IFA Farm Forestry Timber Price Surveys, Comparing April-June 2019 and 2020
Source: IFA Farm Forest Timber Price Surveys 2020, Note: Prices are roadside and expressed as € per tonne
A comparison of roadside prices indicates broadly similar price ranges for the main timber assortments for this respective period over 2019 and 2020. It should also be noted that the price ranges provided are indicative rather than absolute. Prices are expressed as roadside sales (where the timber is sold to the buyer on the forest road and the harvesting contractor is paid by the forest owner) and in € per tonne.
9. Factors influencing timber supply and demand
9.1 Long term supply/demand
The current COFORD timber supply forecast to 2035 for the entire island of Ireland include both private and public forests. The total net realisable volume (the estimated roundwood volume that will potentially be available to the end user) will increase from 4.5 million m3 in 2020 to 7.86 million m3 in 2035 (Phillips et al., 2016). This significant increase in roundwood supply volumes is forecast to come almost exclusively from privately-owned forest in Ireland and primarily in the larger size assortments (Figure 15).
0
10
20
30
40
50
60
70
2018 Q1 2019 Q1 2020 Q1
euro
per
m3
Palletwood Sawlog PulpProduct Length
(m)
Diameter
(cm)
Roadside Price
April-June 2019
(€/tonne)
(ex VAT)
Roadside Price
April-June 2020
(€/tonne)
(ex VAT)
Pulp 3 < 7 20-34 28-32
Stake 1.6 >8 <15 38-45 40-44
Pallet 2.5 14+ 40-50 46-50
3.1 14+ 48-58 52-57
3.4 14+ 56-60 56-60
3.7 14+ 56-64 56-60
Sawlog 4.9 20+ 78-82 75-80

ANNUAL REVIEW AND OUTLOOK 2021
83 Forestry| Outlook 2021
Figure 15 also indicates that any real increase in the timber volume produced in Ireland to 2035 will necessitate a mobilisation of the private forest timber resource. In contrast, the Coillte Roundwood Supply Forecast 2011-2025 projected an increase in the thinning volume and a decrease in the clearfell area and volume in the period 2021- 2025 for the Coillte timber resource (Coillte, 2011). An updated COFORD timber supply forecast is currently being finalised and is expected to be published in Q1, 2021.
Figure 15: Forecast of Total Net Realisable Volume Production to 2035
Source: All-Ireland Roundwood Production Forecast 2016-2035 (COFORD, 2016)
In their October construction industry forecasts, the UK Construction Products Association’s (CPA) main scenario for construction output in 2020 is a 14.5 percent fall, while the construction industry shows recent promising signs of recovery from the coronavirus pandemic. Demand for new private housing and private housing repair, maintenance and improvement, as well as strong reported in the infrastructure sector, are expected to support recovery for the industry towards the end of 2020, and into 2021 following historic falls in output during lockdown (CPA, 2020). The CPA’s Autumn Scenarios continue to expect a ‘tick-shaped’ economic recovery as the most likely outcome, with output for construction rising by 13.5 percent in 2021. The easing of lockdown measures over the summer of 2020 was accompanied by a reported rush to meet pent-up demand, particularly with private housing and refurbishment work. (CPA 2020). Private housing continues to be a key sector of growth for the UK construction industry. There is considerable scope for expansion in the sector. Timber frame houses
and offsite construction are under-used particularly in England (DAFM & Drima Market Research, 2019). The forecast increase in domestic demand for Irish construction timber will, if realised, provide a welcome additional outlet for increasing supply. It is likely to take some pressure off exports in the medium term.
9.2 Renewable Energy
The European Renewable Energy Directive (2009/28/EC) is the current driver for policy in renewable energy. It set out targets for 2020 on an EU basis. The target for Ireland is for renewable sources to account for 16 percent of gross final energy consumption. To this end, the Government set targets of 12 percent heat and 40 percent electricity to come from renewable sources by 2020. A 2020 SEAI report, based on 2018 data, shows that Ireland was below the EU average in terms of the progress each member state had made towards meeting its 2020 targets in 2018, having reached 69 percent of the overall 2020 target. Forestry has a significant role to play in supporting Ireland’s future ambitions and approach to land-based climate change mitigation and its transition to a low carbon economy by reducing dependence on fossil fuels. The Support Scheme for Renewable Heat (SSRH) is a government funded initiative designed to increase the energy generated from renewable sources in the heat sector. The second phase of the SSRH was launched in June 2019. It provides ongoing operational support/tariffs for businesses, farms and other non-domestic heat users for the ongoing use of biomass as well as anaerobic digestion systems. The scheme is designed to support up to 1,300GWh of renewable heat per year. This is equivalent to the heating requirements for circa 120,000 homes (DCCAE, 2019). The SSRH is beginning to increase demand for small logs and wood chip with increasing interest in the SSRH Scheme in 2020 (Gavigan, 2020 pers. comm.). While there is a growing supply of forest-based biomass forecast to become available over the period to 2035, a key challenge in future years will be to develop and ensure a balanced approach that optimises development of the country’s wood resource. This approach is one which best meets the needs of both the wood processing and energy sectors. This challenge comes against the backdrop of an increasing overall wood supply deficit (CWMPFG, 2018). It is essential that the most efficient use is made of domestic forest-based
0
2,000
4,000
6,000
8,000
10,000
2016 2020 2024 2028 2032
volu
me
00
0 m
3o
verb
ark
Private IRLPrivate NICoillteDARD FSTotal Volume

ANNUAL REVIEW AND OUTLOOK 2021
Outlook 2021 | Forestry 84
biomass, both from an emissions and heating perspective (DAFM and Drima Market Research, 2019). The rapidly developing bioeconomy will also offer potential and potential demand for biomass side streams.
10. Brexit
The current Brexit transition will end on December 31 2020. Regardless of the outcome of the ongoing negotiations between the EU and the UK (at the time of writing November 2020) on their future relationship, the end of the transition period will bring substantive changes for companies importing or exporting to Britain, or who have supply chains transiting through the UK (DAFM, 2020). The UK will be a third country operating outside the EU’s Custom Union and Single Market.
Regardless of a trade deal, there will be additional customs requirements on goods, including timber/timber products, from Great Britain or going to Great Britain from 1 January 2020. Exporters will need to declare goods being transported by hauliers between Ireland and Great Britain with a custom declaration form. Documentary identity and physical checks will form part of these new regulations. Differences in rules will apply between Northern Ireland and Great Britain.
New commodity codes will apply to timber products being exported to the UK (DAFM 2020). Irish exporters will require an Economic Operator Registration and Identification (EORI) number. A further requirement is that businesses will need to plan for custom declarations duties. Business will also need to consider how it will administer the sale of goods and services across borders as well as planning for any potential VAT implications, due diligence requirements and any potential administrative burdens. From January 1 2021, unless a trade agreement is reached, new UK Global Tariff (GT) duty rules will apply on exports to the UK. In this scenario, most wood products would remain duty free while certain products would attract UK GT rates. The latter would include particleboard, oriented strand board (OSB) and medium density fibreboard (MSF) (Timber Trade Federation, 2020). The forest sector is increasingly concerned at the prospect of a "hard Brexit". Approximately 60 percent of Irish forest products are exported to the UK. Any disruption to supply chains would likely have significant employment impacts. The panel products sector would be subject to UK tariffs of 6 percent, thereby
significantly undermining their competitiveness against domestic UK suppliers (Hurley, 2020).
10.1 EU Timber Regulation/ Forest Law Enforcement, Governance and Trade (FLEGT)
There are potential impacts to industries involved with import of timber or timber products if, following the Brexit transition period, full regulatory alignment of the Timber Regulation and FLEGT-licensing no longer applies. These include the following.
UK buyers may seek more extensive supply chain information from Irish exporters if a UK timber regulation comes into force.
Irish importers’ due diligence obligations will extend to imports of timber/timber products from the UK.
Wood packaging material (WPM), including pallets, crates and dunnage, used in the transport of good moving from Ireland to the UK is not required to meet current obligations under the ISPM No. 15 international phytosanitary plant health measure. In the event of a no-deal Brexit, all WPM moving between the UK and EU will be required to meet the ISPM15 standards by undergoing heat treatment and marking. All WPM may be subject to official checks upon or after entry to the EU.
11. Bioeconomy Opportunities
The substitution of fossil resources with sustainably produced biomass to facilitate decarbonisation and continued economic growth is central to the concept of the bioeconomy. A move from fossil resources toward biomass also improves resilience and has strong potential for revitalising rural economies. The aim of the 2018 European Bioeconomy Strategy is to link sustainable use of renewable biological resources with the protection and restoration of biodiversity, ecosystems and natural capital across land and water. This is to be achieved with social, environmental and economic sustainability and circularity at its core. The 2017 COFORD report, ‘Growing the Irish Forest Bioeconomy’, brings forward 12 proposals for the development of a vibrant bioeconomy in Ireland. These include positioning forestry as a central pillar of Ireland’s National Policy for the Bioeconomy, embedding the cascading use principle for wood resource management, developing an integrated carbon and land-use policy and ensuring a long-term, consistent and growing supply of roundwood to the processing industry.

ANNUAL REVIEW AND OUTLOOK 2021
85 Forestry| Outlook 2021
Ireland’s forests already make a significant contribution to the economy and society. However, due to our relatively low forest cover, the age structure of our forest estate and the emergence of new scientific and technological developments, there is potential to substantially increase this contribution in the years to come (COFORD, 2017). There is very significant opportunity to advance the sector through the use of new wood products and building systems using wood as a mass market-construction material (McAuley, 2020). There are also emerging opportunities to use wood fibre across a range of innovative new products and ecosystem services. Processing the abundant timber raw material will allow high value bio-based products to be developed from forestry fibre to replace petrochemical plastics in a range of industries. Barrett (2020) cites examples such as ongoing investigation of the potential application of forestry resources to provide a bio-based component for wind turbines.
12. Forests and Climate Change
Forests play a key role in climate change mitigation and adaptation. The mitigation opportunities provided by the forest sector include afforestation/reforestation, sustainable forest management, reduced deforestation, increased use of wood products and use of forest products for bioenergy to replace fossil fuel (COFORD, 2020). Changing weather patterns will have significant effects on vegetation periods, vegetation growth, vegetation conditions, tree distribution and forest ecosystems.
12.1 Climate Change Mitigation
The forest sector provides opportunities to mitigate rises in greenhouse gas levels, not only through the sustainable management of existing forests and the creation of new ones, but also in the active storage of carbon in harvested wood products. A further key mechanism, not currently accounted, involves the substitution of energy-intensive products derived from aluminium, concrete and steel by wood products. This substitution can significantly reduce the energy cost of buildings and providing sustainable solutions for the building sector (O’Toole, 2020 pers. comm.).
A COFORD Working Group on Forests, Climate Change Mitigation and Adaption has regularly convened during 2019/2020. The group objective is to highlight and promote the role that forests and forest products play in climate mitigation. The group is also working to raise awareness of the
impacts of climate change on forests and forest practice. A COFORD statement on forests and their role in national policies to mitigate climate change is currently being finalised.
Afforestation is a highly significant land-based climate change mitigation measure available to Ireland. Potentially it could contribute to well over 50 percent or at least 14 – 16 million tonnes of LULUCF removals over the 2021-2030 period when taking into account current deforestation rates (COFORD, 2020). It should also be noted that this amount may be discounted further depending on the level of harvest and the rate of deforestation over the period 2021-2030. However if deforestation rates are reduced and forests replanted there will be a significant projected increase in removals of CO2 and every effort must be made to maintain areas in forests (COFORD, 2020).
A greatly expanded and sustained afforestation programme of between 8000 and 16,000 ha per year, coupled with significant reduction in agricultural emissions and increased carbon removals in other land uses over the coming three decades is necessary for Ireland to approach carbon neutrality in land use by mid-century in accordance with the Paris goals (COFORD, 2020). Additional to the afforestation programme is the need to greatly expand the use of wood products in the built environment and elsewhere while increasing ambition in terms of using wood to substitute for carbon intensive building and other materials. Among the most important rules in forest sink accounting is that afforested land transitions over time to managed forest land (MFL), and in effect ceases to be a source of compliance credits. The 30-year transition that Ireland will be using from 2021 would imply that, by the end of 2050, if accounting rules stay as they are, that only forest planted from 2021 will be used in the calculation of carbon neutrality. This rule has important implications for the target rate of afforestation envisaged in the
Climate Action Plan (COFORD, 2020).
EU member states are required to submit national forestry accounting plans (NFAP), including forest reference levels (FRL), to the European Commission. The FRL represents an estimate of the average annual net emissions and removals resulting from managed forest land (MFL) within the territory of a Member State in the periods from 2021 to 2025, based on the continuation of sustainable forest management practice, as

ANNUAL REVIEW AND OUTLOOK 2021
Outlook 2021 | Forestry 86
documented in the period from 2000 to 2009, with regard to dynamic age-related forest characteristics, using the best available data. The MFL area includes all forest lands established before 1990 and afforested land which will transition to the FRL area following a transition period of 30 years. The MFL area represents 54 percent of the total forest area in 2017, increasing to 66 percent by 2025 (DAFM 2020a).
Ireland’s total forest area is a substantial sink for carbon dioxide compared to other land uses. Although older forests are projected to be a small net source of approximately 0.1 million tonnes of CO2 per year, when harvested wood products are included, over the period 2021-2025, projections indicate that the entire forest estate will remain a net sink over the entire period from 2021 to 2050. However, the net greenhouse balance of the estate is strongly dependent on the level of harvest, deforestation and afforestation. If deforestation levels of 2034-2037 followed current patterns, the entire forest estate could be a small net emitter of greenhouse gases. However such a trend would subsequently be reversed with increases in net removals so that by 2050 the entire forest estate is estimated to sequester about 3.0 M tCO2 per year as the age class structure normalises (COFORD, 2020) The use of wood biomass energy in Ireland results in GHG emission savings from the displacement of fossil fuels. In 2018, the output of the forest-based biomass energy sector declined by 11 percent over 2017 levels. The saving in 2018 was estimated at over 0.88 million tonnes of carbon dioxide equivalent. Reduced output from the sawmill and wood based panel sectors and the reduction in demand at for wood biomass in Edenderry Power contributed to this decline (DAFM & Drima Market research, 2019).
12.2 Climate Change Adaption
At landscape level, forests can influence adaptation positively by the way in which they regulate the climate, protect against landslides and avalanches, reduce flood risks and protect against soil erosion and degradation. The sector’s capacity to adapt to climate change is key to ensuring the future sustainability and competitiveness of forestry in Europe (Climate-ADAPT (Europa EU), 2017). The agriculture, forest and seafood sectors are heavily impacted by the weather; therefore, it is important
that these sectors are ready to deal with future changes in our climate (DAFM, 2018). The COFORD Working Group on Forests, Climate Change Mitigation and Adaption is also currently completing a report on climate change impacts and adaption. The objective is to identify knowledge gaps and make recommendations to improve knowledge and awareness of the benefits of forests in relation to climate change mitigation and the impacts of climate change on forests and forest ecosystems leading to possible adaptation measures.
13. Forest Certification
Forest certification is a voluntary process available to forest owners and timber processors to reassure consumers that the wood and wood products they buy come from sustainably managed forests. Voluntary forest certification schemes are run by international non-governmental organisations to promote good forest practice. There are currently two certifying schemes available in Ireland: the Programme for the Endorsement of Forest Certification (PEFC) and the Forest Stewardship Council (FSC). Voluntary forest certification links the demand for forest products to environmental and social standards to producers who to show that wood or wood products come from certified forests. All major Irish sawmills are certified. The management of the Coillte estate, which comprises just over fifty percent of the national forest estate, is certified by both the FSC and PEFC. Coillte first obtained certification in 2001 from FSC and became certified in 2014 when the company received PEFC certification. As harvesting in the private sector increases, certification is predicted to be an issue for private forest owners in the near future. Currently 11,181ha of private forest is certified; of which 4,590ha is certified by PEFC and 6,771ha by FSC. There are 180ha certified by both schemes (DAFM, 2020a). Barriers to forest certification for private forest owners include the cost and complexity of achieving this accreditation (DAFM 2018a). Many thousands of hectares of private woodland are approaching the stage of first and subsequent thinnings, resulting in a sharp increase in supply of logs from this source in the near future. There is a current limit of 30 percent of uncertified material that sawmills and panel mills can absorb and the supply of timber coming from private uncertified

ANNUAL REVIEW AND OUTLOOK 2021
87 Forestry| Outlook 2021
forests means that the mills are now close to exceeding this figure (DAFM, 2018). A forest certification initiative by DAFM resulted in the establishment of two certification groups to help foster a national certification network. This initiative also provided certification templates. Mechanisms for on-going progress and the need for growing membership of further certification groups are now essential for forest owners. Meeting certification standards involves a chain of custody recording and compliance with environmental and social principles. There are financial costs associated with certification, both in terms of administration and changes in management practices. Although certification may not translate into higher timber prices, it will provide better access to national and international markets, providing a competitive advantage.
14. Forest Health
Ireland’s Plant Health and Biosecurity Strategy 2020-2025 (DAFM, 2019) outlines the importance of plant health biosecurity as well as highlighting risks to plant health and the roles and responsibilities of stakeholders in terms of risk reduction. It sets out Ireland’s response to a number of critical factors including emerging threats from growing global trade in plants and plant products with the associated movement of new and emerging plant pests and diseases. The strategy is underpinned by key strategic principles around anticipating risk, implementing surveillance and management as well as building awareness and communication. A range of recommendations are made under the headings of preparedness, capacity and awareness. These are designed to form the basis of a detailed action and implementation plan. In this the International Year of Plant Health, the theme ‘Protecting Our Trees and Forests’ provided the focus for the 2020 National Forestry Conference (Wood Marketing Federation and Society of Irish Foresters, 2020) which examined existing and potential threats. The potential entry of the eight-toothed spruce bark beetle (Ips typographus) through log imports was highlighted as a significant threat to our forest resource in this and other for a (Magner, 2020b).
In her conference interview and programme foreword, Minister of State Pippa Hackett, acknowledged the need for increased felling licence
output to reduce the reliance on imported timber from areas that have harmful insect pests. Minister Hackett confirmed the awareness of the consequential possibility of importing roundwood from Germany and other countries. Minister Hackett also outlined how the approach to licences would allow sufficient home grown timber to reach timber processors and reduce the threat of importing damaging pests and diseases.
Ireland’s forest health status is overall relatively good and the forest resource is not subject to the range of pests and diseases that are endemic in Continental Europe and further afield. However, specific tree species remain seriously challenged by fungal based disease. The following updates exemplify such challenges.
14.1 Ash dieback
Ash Dieback, the disease caused by the fungus, Hymenoscyphus fraxineus, continues to develop across the island of Ireland. Ireland’s ash resource, particularly the first rotation woodlands, is quite unique and is at particular risk from Ash Dieback. Figure 16 indicates trends in the spread of the disease between 2012 and 2019 in a 10km square grid basis. Feedback from owners and foresters indicated of significant further disease spread during 2020.
Figure 16: Ash Dieback findings 2012-2019 on a 10km square grid basis.
Source: DAFM, 2020b
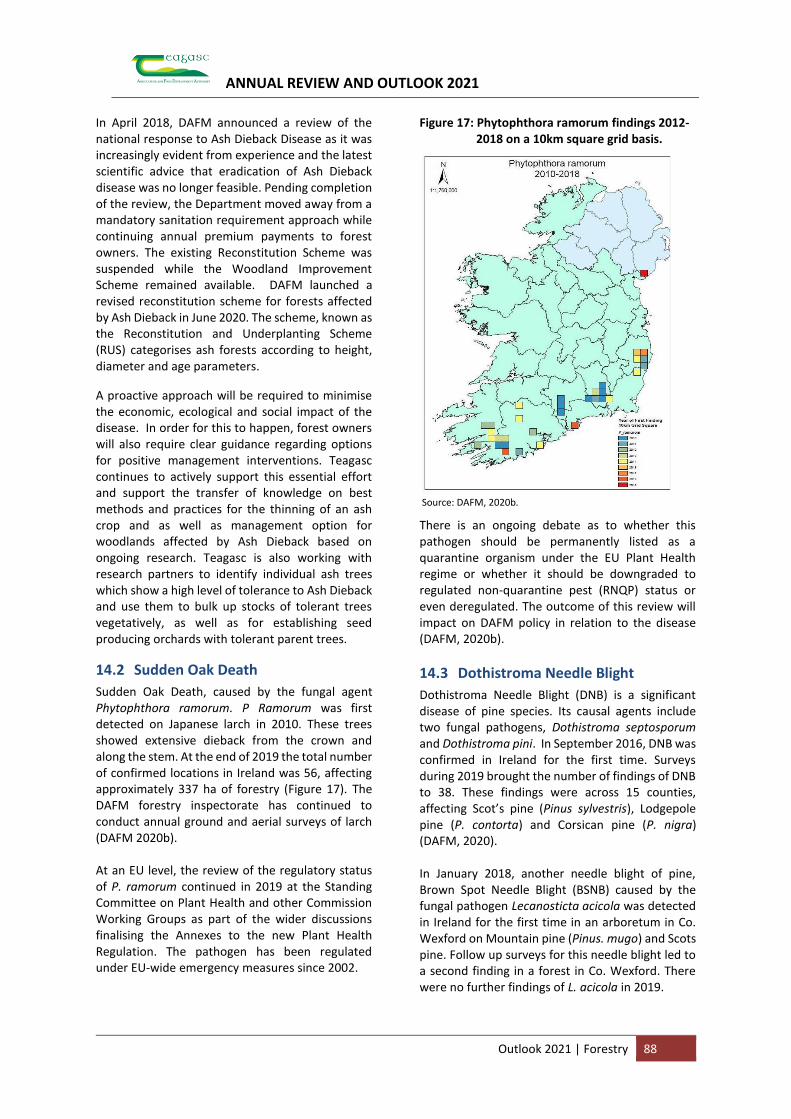
ANNUAL REVIEW AND OUTLOOK 2021
Outlook 2021 | Forestry 88
In April 2018, DAFM announced a review of the national response to Ash Dieback Disease as it was increasingly evident from experience and the latest scientific advice that eradication of Ash Dieback disease was no longer feasible. Pending completion of the review, the Department moved away from a mandatory sanitation requirement approach while continuing annual premium payments to forest owners. The existing Reconstitution Scheme was suspended while the Woodland Improvement Scheme remained available. DAFM launched a revised reconstitution scheme for forests affected by Ash Dieback in June 2020. The scheme, known as the Reconstitution and Underplanting Scheme (RUS) categorises ash forests according to height, diameter and age parameters.
A proactive approach will be required to minimise the economic, ecological and social impact of the disease. In order for this to happen, forest owners will also require clear guidance regarding options for positive management interventions. Teagasc continues to actively support this essential effort and support the transfer of knowledge on best methods and practices for the thinning of an ash crop and as well as management option for woodlands affected by Ash Dieback based on ongoing research. Teagasc is also working with research partners to identify individual ash trees which show a high level of tolerance to Ash Dieback and use them to bulk up stocks of tolerant trees vegetatively, as well as for establishing seed producing orchards with tolerant parent trees.
14.2 Sudden Oak Death
Sudden Oak Death, caused by the fungal agent Phytophthora ramorum. P Ramorum was first detected on Japanese larch in 2010. These trees showed extensive dieback from the crown and along the stem. At the end of 2019 the total number of confirmed locations in Ireland was 56, affecting approximately 337 ha of forestry (Figure 17). The DAFM forestry inspectorate has continued to conduct annual ground and aerial surveys of larch (DAFM 2020b). At an EU level, the review of the regulatory status of P. ramorum continued in 2019 at the Standing Committee on Plant Health and other Commission Working Groups as part of the wider discussions finalising the Annexes to the new Plant Health Regulation. The pathogen has been regulated under EU-wide emergency measures since 2002.
Figure 17: Phytophthora ramorum findings 2012-2018 on a 10km square grid basis.
Source: DAFM, 2020b.
There is an ongoing debate as to whether this pathogen should be permanently listed as a quarantine organism under the EU Plant Health regime or whether it should be downgraded to regulated non-quarantine pest (RNQP) status or even deregulated. The outcome of this review will impact on DAFM policy in relation to the disease (DAFM, 2020b).
14.3 Dothistroma Needle Blight
Dothistroma Needle Blight (DNB) is a significant disease of pine species. Its causal agents include two fungal pathogens, Dothistroma septosporum and Dothistroma pini. In September 2016, DNB was confirmed in Ireland for the first time. Surveys during 2019 brought the number of findings of DNB to 38. These findings were across 15 counties, affecting Scot’s pine (Pinus sylvestris), Lodgepole pine (P. contorta) and Corsican pine (P. nigra) (DAFM, 2020). In January 2018, another needle blight of pine, Brown Spot Needle Blight (BSNB) caused by the fungal pathogen Lecanosticta acicola was detected in Ireland for the first time in an arboretum in Co. Wexford on Mountain pine (Pinus. mugo) and Scots pine. Follow up surveys for this needle blight led to a second finding in a forest in Co. Wexford. There were no further findings of L. acicola in 2019.

ANNUAL REVIEW AND OUTLOOK 2021
89 Forestry| Outlook 2021
Pine species account for an estimated 10.7 percent of the stocked forest area in Ireland. These species include Lodgepole pine (9.6 percent) with the remainder being made up of Scots pine (1.1 percent) and small areas of Monterey and Corsican pine (DAFM 2018a). Sitka spruce, the most common species in commercial forests, is deemed to have a low susceptibility to the disease. The DAFM carries out on-going surveys for DNB presence within pine forests and in pine-producing nurseries. The diseases outlined can have both direct and indirect effects on timber supply and demand. These effects include the cost of eradication/ containment, the opportunity cost associated with suspended or restricted planting of specific tree species and the price effect on a diminishing supply of a particular species. There is also less potential opportunity for diversification of tree species and a need to constantly scan for suitable replacement species. It is likely that the long term biotic threat will increase, partly due to increased levels of free trade and personal travel and the possible increase in disease risk due to climate change. Horizon scanning for future potential risks must continue to be a focus area for the Irish forest industry.
14.4 First finding of Oak Processionary Moth (OPM)
In July 2020, DAFM announced the first finding of the Oak Processionary Moth (Thaumetopoea procesionea) on the island of Ireland. A single OPM nest was found on one imported, recently planted amenity oak tree in a public park in Dublin. The nest was removed and destroyed. A subsequent wider intensified DAFM survey has not yielded additional findings to date (DAFM 2020f). OPM defoliates and weakens oak trees and also can be a hazard to human and animal health through direct contact with the hair so caterpillar which can provoke allergic reactions. Health problems can occur even if the larvae are not handled as the hairs break off readily and are dispersed in air currents. Professional operators are asked to be extremely vigilant for the presence of this pest, especially where oak trees are established. Controls for the importation of oak are in place. Pre-notification of the importation of all oak is set out in S.SI 30 of 2020 and Trader Notice 1 of 2020.
14.5 Pest Risk analysis
Pest risk analysis (PRA) is an essential tool to help assess the potential risk that future pests can pose, identify suitable measures to exclude them and, where appropriate, provide the necessary evidence direct to the EU to support the regulation of such pests and pathways. In her paper ‘Pest risk analysis in protecting commercial forests’ at the 2020 National Forestry Conference (Wood Marketing Federation and Society of Irish Foresters, 2020), Dr Melanie Tuffin draws upon her relevant work within Teagasc on the DAFM-funded FORM project. The introduction of pests and diseases to new regions globally is directly linked to the globalisation of trade. Most introductions are likely to occur in association with imported commodities such as plants, timber, packaging material and seeds. The impacts of new pest arrivals can have serious consequences from an economic, environmental or social perspective. The FORM (FORest Management) project was funded by the Department of Agriculture, Food and the Marine to build capacity in the areas of tree improvement and forest health research in Ireland. The project identified pest risks in relation to Sitka spruce. Its outputs included the development of an appropriate PRA scheme and the production of the first Irish pest risk analysis for Sitka spruce. This PRA is a very valuable resource and can act as a template for other forestry species.
15. Programme for Government
The Programme for Government – Our Shared Future was published in June 2020. The Programme highlights the multiple functions that forests can fulfil and a range of supports and initiatives that will be provided to the sector. These include publishing a successor forestry programme to deliver an ambitious afforestation plan reviewing grant and premium rates across all categories in this area, with a particular focus on an increased farmer rate of support. It also includes the incorporation of afforestation into the new CAP to provide incentives for farmers to plant woodlands on their farm, acting as a carbon store, helping to promote wildlife corridors and providing a fuel source for households. The Programme also seeks to actively promote and support farm forestry and incentivise the option of small scale forestry. It also puts a focus on protection forests (providing a buffer that can mitigate sediment or nutrient runoff to rivers and

ANNUAL REVIEW AND OUTLOOK 2021
Outlook 2021 | Forestry 90
lakes), increased support for agroforestry/silvopasture on Irish farmlands as well as the potential of afforestation on state-owned and public lands as urban tree planting and community forests.
16. Knowledge Transfer Groups
Over 600 forest owners participated in an ongoing Forest Knowledge Transfer Group the Scheme throughout the country in 2019 (DAFM, 2020). Feedback indicates that participants gained significant practical knowledge to better manage their forest(s) and maximise returns from their resource. A further KTG Scheme was launched in May 2020. This was a conditional launch in light of the existing public health restrictions on group meetings at the time. The launch was to facilitate organisers in securing KTG participants and completing the necessary preparations to be ready to commence meetings, as appropriate, if and when public health guidelines allowed. While interest in KTG participation remains high in 2020, ongoing disruption due to COVID-19 necessitated the cancellation or deferral of the scheduled meetings for up to 30 forestry KT groups.
17. Outlook for 2021 and beyond
17.1 EU Outlook
The European Commission’s publication of the European Green Deal in December 2019 set out aims regarding several forest-relevant initiatives. Already the European Climate Law proposal has been submitted the European Council to be considered by Member States and to the European Parliament. The European Commission will also prepare a new EU Forest Strategy. Building on the 2019 ‘Communication on Stepping up EU Action to Protect and Restore the World’s Forests’, the Commission has announced that it will investigate potential measures to promote products and value chains not involved in deforestation and forest degradation (DAFM, 2020a).
17.2 CAP Post 2020
The structure of the new CAP is current being negotiated and this provides an opportunity to ensure that a positive framework is in place to support afforestation at national and farm level in the coming years. CAP post-2020 and the review of
state aid rules will have a significant influence on measures and targets contained in the next forestry programme. It is vital that provisions for support of Ireland’s forestry sector are maintained and where appropriate, enhanced. This is particularly so in relation to sustainable farm forestry and timber mobilisation objectives. In its Forestry Submission with regards to CAP Post 2020, the COFORD Promotion and Afforestation Working (PAW) Group highlights the essential need for full integration of forestry with CAP as well as its strong representation in order to deliver a range of key national and international objectives. The Group emphasise the benefits of setting ambitious targets for forestry, addressing barriers to forestry uptake and outlined a range of proposed measures to structure and flexibility to allow for the future design of national schemes that support forestry in conjunction with the other elements of Ireland’s agriculture and rural economy.
17.3 Future Forest Policy
In his address to the Joint Oireachtas Committee on Agriculture and the Marine, McAuley (2020) outlined how the forest sector was calling for ‘a renewed vision for forestry in Ireland – one based on economic development, climate change goals, biodiversity, and social values’. He described the need for a stakeholders to come together and agree a way forward. Minister of State for Land Use and Biodiversity Senator Pippa Hackett recently announced the bringing together a grouping to inform future forest policy. This Forest Policy Group incorporating a broad range of stakeholders including from those from industry, the environment, state agencies as well as farmer and community representatives.
17.4 Afforestation
There is now a clear urgency to sustainably increase afforestation rates and make progress towards stated planting targets in 2021 and future years. This is critical not only to our forestry sector but also in terms of its vital role in climate change mitigation rural development, renewable energy provision and. The Government budget allocation for the Forestry Programme in 2021 of €100 million reflects funding to establish 8,000 ha of new forests, a challenging target set out in the All of Government Climate Action Plan. The need to substantially increase the flow of afforestation approvals to support the 2020/21 planting programme is a key priority identified by stakeholders. A range of actions and a fully co-ordinated approach by all

ANNUAL REVIEW AND OUTLOOK 2021
91 Forestry| Outlook 2021
stakeholders is required to help ensure an upward trend in planting levels. There is also an identified need to support farmers and land-owners in building confidence in the merits new planting and re-engaging with the forestry option as a viable and complementary land use. All forest types (conifer, broadleaf and mixed forests) have a role to play in contributing to the full range of ecosystem services required by society. The challenge is to enable the many services that these forests provide at the landscape level to be realised over the period to 2050 and beyond (COFORD, 2020).
The Mackinnon Report, carried out by Mr Jim MacKinnon, former chief planner with the Scottish Government, reviewed the forestry approval process and related issues Ireland. It includes ’22 ways forward across a range of relevant issues’. The recent announcement of the appointment of Ms, Jo O’Hara to advise on the implementation of the MacKinnon Report has been welcomed by industry stakeholders. It is seen as an essential element to support the successful delivery of the ‘ways forward’ identified in the Review of Approval Processes for Afforestation in Ireland (Mackinnon 2019). A Forestry Programme Implementation Group has been convened to enhance representation to help advice on implementation of the national programme. The group had its initial meeting in November 2020. The FLAIG Report (2018) proposes a range of actions to enhance future afforestation rates. These include actions relating to promotion and education, environmental actions and relevant measures on income and future land use. In addition to the above, a number of research actions with potential to impact on planting rates are proposed. Teagasc, in conjunction with the forest industry continue to raise awareness of the benefits of well-planned, sustainable forestry and its role as a complementary farm enterprise. This promotion seeks to address key proposals from FLAIG (2018), including the further integration of forestry into agricultural education, annual support for a Farm Forestry category in the RDS Forest and Woodland Awards and awareness-raising of forest carbon-related benefits.
17.5 Timber Mobilisation
The export-oriented sawmilling sector will continue to compete in a challenging market environment,
with EU/UK-related developments likely to have significant impacts post 2020. Strategic investments in processing capacity continues to be made. Private timber production from Irish forests is forecast to increase from 1.36 million m3 in 2021 to over 3.2 million m3 by the end of the decade (COFORD, 2016). The prediction that, by and large, growth in the sawmill and wood based panel demand can be met on the island of Ireland by 2025 is based on an increase state investment in forestry and country roads, as well as continued and sharp focus on the reduction or elimination of other barriers to identified wood mobilisation (COFORD, 2018c). Engagement with the timber processing sector indicates strong confidence in their ability to process the available timber forecast to come on the market in future years. However, by far the biggest current challenge has been the slowdown in granting of felling and roading licences to both Coillte and private forest owners. These are essential to enable sustainable wood mobilisation and supply to domestic and export timber markets (Magner, 2020).
Timber harvest and mobilisation from first and subsequent thinnings is likely to continue to be the major component of the wood-based panel (WBP) sector and the growing wood biomass sector. It is essential that appropriate and timely thinning continue to be facilitated in private forests that are suitable for this important silvicultural practice. Teagasc, in co-operation will all sectors of the forestry industry, seeks encourage and support appropriate mobilisation of the private forest resource. This is facilitated through dissemination of research, training and the building of familiarity with and confidence in the harvesting and marketing of the timber resource. The empowerment of private forest owners through a range of knowledge transfer events and initiatives, capacity building and a sense of ownership is central to the realisation of private timber mobilisation, achievement of its production potential and the optimisation of ecosystem services. While domestic sawmilling demand is forecast to increase by 3.5 percent year-on-year, the sawmilling sector will continue to be dependent on its strong presence in the highly competitive UK market, as well as in Europe. The Irish forest products sector is largely export oriented. The Irish timber sector remains dependent on the export market, worth €430 million in 2019, a 1.0 percent

ANNUAL REVIEW AND OUTLOOK 2021
Outlook 2021 | Forestry 92
increase in value terms on 2018 figures and an increase of 13 percent in volume terms (DAFM, 2020a). Key markets are Northern Ireland, the UK and the Benelux Countries. The UK is the single most important export market for (O’Toole, pers. comm.) and this situation is likely to continue into the future. The potential consequences of Brexit and its impact on the timber export market are still unclear at this stage. Its constraint on Irish growth prospects in the short term remains a significant concern. Engagement with timber buyers provides insights into the continued demand for timber to meet the on-going requirements of the processing sector. Enhanced timber prices can be paid for well managed forests with good quality timber, adequate road access and felling licences in place, proximity to markets, and economically advantageous plantation size. The on-going development of forest owner entities will continue to help facilitate additional thinning and harvesting capacity and supply. The current DAFM-supported Knowledge Transfer Group (KTG) scheme, modelled on DAFM’s existing KTGs for beef, sheep and other sectors of agriculture, aims to increase the level of forest management activity among participating forest owners and to increase their awareness of the value of their forests. Mechanisms and funding to progress private certification following the successful pilot project to develop a group certification template for private forest owners are necessary by relevant industry stakeholders. The wood energy market continues to develop as technologies are adapted or introduced to optimise the contribution of forestry to the bioeconomy. The forecasted deficits in wood biomass supply to 2020 and 2025 present a significant challenge to existing timber processing sectors. Other non-timber benefits of forestry such as ecosystem services, tourism and recreation have potential added-value in the longer term.
17.6 Brexit Challenges
From a positive viewpoint and despite challenges, Ireland is well positioned geographically to capitalise on existing and future market opportunities in the UK, which imported 7.04 million m3 of sawnwood and 3.65 million m3 of wood based panels in 2019 (Forestry Commission, 2020). A flexible, responsive and market focused approach will be required to guide the industry through current market challenges but there is a positivity from processors that these challenges can be met if required Irish timber supplies can resume.
17.7 Forest Investment Scenarios
The trading of semi-mature forest properties and related investment packages continue to evolve. Such packages include propositions on the forward selling of timber harvest rights. This is a relatively new development in the private forest sector and may involve a range of investment scenarios and options for private forest owners (Irish Farmers Journal, 2016). A robust analysis of such investment scenarios from an economic and legal perspective is central to exploring the merits of this expanding forest investment sector. In certain cases, interest in semi-mature plantations may provide options to address landowners concerns over the perceived long production cycles and reduced asset liquidity associated with forestry. References Barrett, P. (2020). Creating and shaping the development of Ireland’s bioeconomy. The Teagasc ConnectEd Signpost Series; pointing the way to low impact agriculture. Available at: https://www .youtube.com/watch?v=7U0yiLQ7hTI Climate-ADAPT Europa EU (2017). European Climate Adaptation Platform; Climate-ADAPT factsheet. Available at: https://climate-adapt.eea.europa.eu /eu-adaptation-policy/sector-policies/forestry/forestry-sector-factsheet-formatted_final.pdf COFORD, (2018a). COFORD Forest Policy Review Group report on ‘Forest products and people – Ireland’s forest policy – a renewed vision’ (2014). A Report on Policy with Recommendations. Department of Agriculture Food and the Marine, Dublin. COFORD, (2018b). COFORD Forest Land Availability Implementation Group. Department of Agriculture, Food and the Marine, Dublin. Available at: http://www.coford.ie/media/coford/content/publications/2018/2COFORDForestLandAvailabilityImplementationGroupReport121218.pdf COFORD (2018c). Wood Supply and Demand on the Island of Ireland to 2025. COFORD Wood Mobilisation and Production Forecasting Group, Department of Agriculture, Food and the Marine, Dublin, Ireland. Available at: http://www.coford.ie /media/coford/content/publications/2018/3COFORDWoodSupplyandDemand121218.pdf COFORD (2020). Statement on forests and their role in national policies to mitigate climate change.

ANNUAL REVIEW AND OUTLOOK 2021
93 Forestry| Outlook 2021
COFORD Working Group on Forests, Climate Change Mitigation and Adaptation. In print. Coillte (2020). Forests for Our Future. Annual Report 2019. Available at: https://www.coillte.ie/ media/2020/05/Coillte-Annual-Report-2019.pdf Coillte (2011). Roundwood Supply Forecast 2011- 2025. Construction Products Association, (2020). Crucial winter ahead for construction according to CPA’s latest scenarios. CPA Press Release, October 2018. Available at: https://www.constructionproducts .org.uk/news-media-events/news/2020/october/ crucial-winter-ahead-for-construction-according-to-the-cpa-s-latest-scenarios/ DAFM (2014). Forests, products and people. Ireland’s forest policy – a renewed vision. Department of Agriculture Food and the Marine, Dublin. DAFM (2015). Phytophthora ramorum Factsheet- Understanding Phytophthora ramorum in Irish larch forests. Available at: www.agriculture. gov.ie/media/migration/forestry/forestservicegeneralinformation/foresthealthandseeds/PHYTOFORPramorumfactsheet220915 DAFM (2018), Ireland’s National Forest Inventory 2017 – Main Findings. Department of Agriculture, Food and the Marine, Dublin. Available at: https://www.agriculture.gov.ie/nfi/nfithirdcycle2017/nationalforestinventorypublications2017/ DAFM (2018a). Tree diseases- ash dieback Chalara. Available at: https://www.agriculture.gov.ie/ forestservice/treediseases/ashdiebackchalara/ DAFM (2018b). Dothistroma Needle Blight (DNB) Available at: https://www.agriculture.gov.ie/ forestservice/treediseases/dothistromaneedleblight/ DAFM (2020a) Annual Review and Outlook for Agriculture, Food and the Marine 2020. Department of Agriculture Food and the Marine, Dublin. Available at: https://www.agriculture.gov.ie/media /migration/foodindustrydevelopmenttrademarkets/agri-foodandtheeconomy/publications/aro2020 /Ch4%20Forestry.pdf DAFM (2020b). Forest Statistics Ireland 2020. Prepared by the Department of Agriculture Food and the Marine. Available at:
https://www.agriculture.gov.ie/media/migration/forestry/ForestStatisticsIreland2020210820.pdf DAFM (2020d) Trade Factsheet, Full Year 2019. Available at: https://www.agriculture.gov.ie/media /migration/foodindustrydevelopmenttrademarkets/agri-foodandtheeconomy/publications/Trade FactsheetFullyear2019230420.pdf DAFM (2020f). Oak Processionary Moth (Thaumeetopoea processionea). Department of Agriculture Food and the Marine, Circular 10/2020. Available at: https://www.agriculture.gov.ie/dont riskit/pestsdiseases/currentissues/hereseverythingyouneedtoknowabouttheoakprocessionarymothtreepest/ DAFM (2020g). Minister Hackett announces the commencement of the Forestry (Miscellaneous Provisions) Act 2020. Department of Agriculture Food and the Marine press release. Available at: https://www.agriculture.gov.ie/press/pressreleases/2020/october/title,151085,en.html DAFM and Drima Market Research (2019). UNECE Forestry and Timber Market Report for Ireland 2019. Department of Agriculture, Food and the Marine, Dublin. Available at: https://www.unece. org/fileadmin/DAM/timber/country-info/ statements/ireland2019.pdf DCCAE (2019). Climate Action Plan. Government of Ireland 2019. Available at: https://www.dccae .gov.ie/en-ie/climate-action/publications/ Docume nts/16/Climate_Action_Plan_2019.pdf Donnellan, T., Moran, B., Lennon, J. and Dillon, E., (2020). Teagasc National Farm Survey 2019 Preliminary Results. Agricultural Economics and Farm Surveys Department, Rural Economy Development Programme. Available at: https://www.teagasc.ie/media/website/publications/2020/TeagascNFS2019-Preliminary-Results.pdf Finn B. (2020). Sterling could drop to 97p against the euro if no trade deal struck. RTE News Business October 27, 2020. Available at: https:// www.rte.ie/news/business/2020/1027/1174120-sterling-could-drop-to-97p-if-no-trade-deal-struck/ Forest Service (2014). Forestry Divn. Monthly Report, December. Forest Service, Department of Agriculture, Food and the Marine, Dublin. Forest Service (2015b). Forestry Programme 2014- 2020: Ireland, 22/01/2015. Department of

ANNUAL REVIEW AND OUTLOOK 2021
Outlook 2021 | Forestry 94
Agriculture, Food and the Marine, Dublin IRL-DAFM-FS.023 Forest Service (2015c). Forestry Divn. Monthly Report, December. Forest Service, Department of Agriculture, Food and the Marine, Dublin. Forest Service (2016a). Forestry Divn. Monthly Report, September. Forest Service, Department of Agriculture, Food and the Marine, Dublin. Forest Service (2016b). Ireland’s Forests-Annual Statistics 2016. Forest Service, Department of Agriculture, Food and the Marine, Dublin. Available at: https://www.agriculture.gov.ie/ media/migration/forestry/forestservicegeneralinformation/AnnualForestSectorStatistics2016281216.pdf Forest Service (2017) Forestry Divn. Monthly Report, December. Forest Service, Department of Agriculture, Food and the Marine, Dublin. Forestry Commission (2020). Forestry Statistics 2020. Chapter 3: Trade. Available at: file:///C:/Users/tom.houlihan/Downloads/Ch3_Trade_FS2020.pdf Global Wood Markets Info, (2020). European spruce logs and lumber exports see strong rise in Jan-Sept, 2020. Wood industry news at GWMI, November 2020. Hurley, I. (2020). Opening statement in addressing the Oireachtas Joint Committee on Agriculture and the Marine, Thursday 17 November, 2020. Available at: https://data.oireachtas.ie/ie/oirea chtas/committee/dail/33/joint_committee_on_agriculture_and_the_marine/submissions/2020/2020-11-17_opening-statement-imelda-hurley-chief-executive-coillte-cga_en.pdf Irish Farmers Journal (2016). Forestry investment fund targets 18,000 ha. 1st October edition. Irish Timber Growers Association (ITGA) (2019). Irish Timber Growers Association Yearbook 2018, in association with University College Dublin. Mackinnon, J. (2019). Review of the Approval Process for Afforestation in Ireland. Available at: https://www.agriculture.gov.ie/media/migration/publications/2019/ReviewApprovalProcessesforAfforestationIrelandMackinnonNovember2019291119.pdf
Magner, D. (2020). Forestry uncertainty but still most at work. Irish Farmers Journal, 8th April, 2020. Available at: https://www.farmersjournal.ie/forest ry- uncertainty-but-most-still-at-work-538232 Magner, D. (2020a). Challenge to restore viable afforestation and programme. Irish Farmers Journal, 21st September, 2020. Available at: https://www.farmersjournal.ie/plough-on-challen ge-to-restore-viable-afforestation-and-programme -566067 Magner, D. (2020b). Conference on forest protection examines existing and potential threats. Irish Farmers Journal, 14th October 2020. Available at: https://www.farmersjournal.ie/conference-on-forest-protection-examines-existing-and-potential-threats-576679 Magner, D. (2020c). Light at the end of the licence tunnel. Irish Farmers Journal, 18th November 2020. Available at: https://www.farmersjournal.ie/light-at-the-end-of-the-licence-tunnel-583781 Markit Economics (2020). UK construction activity expands sharply in September. HIS Markit /CIPS UK Construction PMI, November 04, 2019, Available at: https://www.markiteconomics.com/Public/Home/PressRelease/8351b43a17a444819738880c435e1ac7 McAuley, M. (2020). Opening statement in addressing the Oireachtas Joint Committee on Agriculture and the Marine, Thursday 03 November, 2020. Available at: https://data. oireachtas.ie/ie/oireachtas/committee/dail/33/joint_committee_on_agriculture_and_the_marine/submissions/2020/2020-11-03_opening-statement-mark-mcauley-director-forest-industries-ireland-ibec_en.pdf McQuinn, K., O’Toole, C., Allen-Coughlan, M and Coffey, C. (2020). ERSI Quarterly Economic Commentary, Macro Economic Forecasting October 2020 Available at: https://www. esri.ie/system/files/publications/QEC2020AUT_0.pdf O’Halloran (2020). Backlog of forestry licence appeals is costing jobs, committee hears. Irish Times, Nov 3, 2020. Available at: https://www.irishtimes.com/business/energy-and-resources/backlog-of-forestry-licence-appeals-is-costing-jobs-committee-hears-1.4399235

ANNUAL REVIEW AND OUTLOOK 2021
95 Forestry| Outlook 2021
Office for National Statistics, (2020). GDP quarterly national accounts, UK: April to June 2020. Available at: https://www.ons.gov.uk/economy/gross domesticproductgdp/bulletins/quarterlynationalaccounts/apriltojune2020 Phillips. H., Corrigan, E., McDonagh, M., Fairgrieve, M., Farrelly, N., Redmond, J., Barrett, F., and Twomey, M. (2016) All Ireland Roundwood Production Forecast 2016-2035. COFORD, Department of Agriculture, Food and the Marine, Dublin. Ryan. M., O’Donoghue and Kinsella, A (2016). Returns on afforestation of agricultural land. TResearch, Vol 11, No. 4, Winter 2016. Available at: https://www.teagasc.ie/media/website/publications/2016/TResearch-Winter-2016.pdf Ryan, M. and O’Donoghue, C. (2016). Socio-economic drivers of farm afforestation decision making. Irish Forestry. Volume 73, Nos. 1&2. Teagasc Greenhouse Gas Working Group (2018). An Analysis of Abatement Potential of Greenhouse Gas Emissions in Irish Agriculture 2021- 2030. Teagasc, Oak Park, Carlow. Available at: https:// www.teagasc.ie/media/website/publications/2018/An-Analysis-of-Abatement-Potential-of-Greenhou se-Gas-Emissions-in-Irish-Agriculture-2021-2030.pdf Teagasc (forthcoming). 2027 Sectoral Roadmap: Forestry. Timber Trade Federation (2020). Brexit and the Timber Supply Chain. TTF webinar, Tuesday 24 November, 2020.
Acknowledgements The contributions of Teagasc colleagues in the Forestry Development Department and Rural Economy and Development Programme as well as many contributors from across the Irish forestry sector are gratefully acknowledged.

ANNUAL REVIEW AND OUTLOOK 2021
Outlook 2021 | Sustainability 96
Review of Farm level Sustainability Environmental Dimension 2020
Cathal Buckley Agricultural Economics and Farm Surveys Department, Teagasc
1. Introduction
As depicted in Figure 1, the sustainability of a farm is based on the intersection between the economic, environmental, social and innovation dimensions of that farm. The sustainability of a farm is dependent on the strength of these dimensions, much like a four legged stool. Failure on any single dimension can threaten the long term sustainability of a farm.
Figure 1: Dimensions of Sustainability
Other chapters in this report have focused on the economic outlook for different farm types. This chapter looks at the environmental sustainability of farms, with a specific focus on gaseous emissions. This covers the greenhouse gas emissions (GHG) and ammonia emissions (NH3) emitted at farm level.
Farm level emissions are estimated based on activity data multiplied by an emission factor. The 2019 Teagasc Sustainability Report (Buckley & Donnellan, 2020a) sets this out in greater detail and reports results for 2019, as well as a number of preceding years. This sustainability analysis uses activity data from the Teagasc National Farm Survey (NFS) (Donnellan et al., 2020) and emission factors from the national inventory accounting methodologies for GHG (Duffy et al., 2020) and ammonia (NH3) (Duffy et al., 2019). Emission factors are revised as new scientific evidence
emerges. Similarly the calculation of emissions becomes more detailed, when scientific research provides data that allow for more sophisticated emissions calculations. Hence, GHG and NH3 emission projections for 2020 in this chapter are based entirely on changes in farm activity levels, with no changes made to the methodology used. Farm based activity levels in 2020 are estimated with reference to the Teagasc NFS, using 2019 as the base year.
The Teagasc NFS which is part of the EU Farm Accountancy Data Network (FADN) is a representative sample of almost 900 farms across Ireland. The survey collects data on an annual basis for livestock numbers, cropping area, inputs and outputs, assets and liabilities, direct payment under the CAP and then derives family farm income. This dataset is primarily collected to report farm income levels to the European Commission (an EU member state obligation) but the dataset has been expanded in Ireland in recent times to report on the environmental sustainability of Irish farms.
The Teagasc NFS is based on a nationally representative random sample which is selected in conjunction with the Central Statistics Office (CSO). Each farm is assigned a weighting factor so that the results of the survey are representative of the national population of farms (over 90,000 farms are represented by the Teagasc NFS in 2019). Within the Teagasc NFS, farms are classified into major farming systems according to the standardised EU typology, as prescribed by the European Commission. Results for GHG and ammonia emission across the four main land based farm systems in Ireland, namely, dairy, cattle, tillage and sheep are reported here.
2. Methodological approach to estimating 2020 farm level gaseous emissions
From an activity level perspective the two things that most significantly influence emissions in the short term, are animal numbers and type and quantity of chemical N fertiliser applied to land.

ANNUAL REVIEW AND OUTLOOK 2021
97 Sustainability | Outlook 2021
Animal Number Projections for 2020: The CSO publishes bovine animal numbers held on farms each June (CSO 2020). Results from the CSO June 2020 survey were compared with those from 2019 and this showed an increase in overall cattle numbers of 1.47 percent, as observed in Table 1 However, this increase was not uniform across the different categories of cattle. Dairy cow numbers and cattle under 1 years of age increased by 4.18 percent and 5.43 percent between June 2019 and June 2020 respectively. This implies that increases in livestock numbers were driven by the dairy sector, as other cows and cattle 1-2 years of age declined by between 1.64-2.82 percent and cattle 2 years plus number were relatively static (increase of 0.66 percent).
Table 1: Changes in cattle numbers 2019 vs 2020
Animal inventories 2019 vs 2020
% change
Total cattle 1.47
Dairy cows 4.18
Other cows -1.64
Bulls -4.92
Cattle: 2 years and over 0.66
Cattle: 1-2 years -2.82
Cattle: under 1 year 5.43
Source: CSO (2020)
No CSO survey of sheep numbers took place in June 2020 due to COVID-19 restrictions. For 2020 these ovine numbers, ewe numbers are projected to remain relative static with other sheep categories increasing by 3 percent (Hanrahan, 2020). These national level changes in livestock inventories (by category) are applied proportionately across dairy, cattle and sheep farms within the 2019 NFS to provide a 2020 estimate of animal numbers. Land area is assume to remain static.
Chemical N Projections for 2020: The second major element that could likely impact farm level emissions is the volume and type of chemical fertiliser applied on farms. Different emission factors are associated with different fertiliser types (e.g. CAN, conventional urea, protected urea) and a higher level of application of a given fertiliser will lead to higher levels of emissions from that fertiliser type.
Table 2 is constructed from fertiliser sales data (DAFM, 2020) based on a September to October sales year. This indicates that total N (elemental) increased by 3.75 percent year on year between 2019 & 2020. Straight CAN and NPK compounds
were the most common fertilisers purchased in volume terms and these increased in 2020. Sales of protected urea fertiliser almost doubled in volume terms between 2020 compared to 2019, but this increase is from a low base. Protected urea is associated with lower GHG emission (relative to CAN) and lower ammonia emission (relative to straight urea).
Changes in chemical N fertiliser applied at farm level are assumed to be reflective of the national level changes, as outlined in Table 2. However additional adjustments were undertaken, based on changes in farm level stocking rates, as estimated from the animal numbers projections made and historical rates of fertilisation at farm level.
Table 2: Total tonnes of Chemical N sold 2019-2020
2019* 2020* % change
% change
Straight CAN 121,502 122,167 0.55
Straight Urea 44,765 43,976 -1.76
Protected Urea 11,012 19,984 81.48
NK Compounds 3,848 3,600 -6.44
NP Compounds 2,204 2,003 -9.12
NPK Compounds 179,404 184,625 2.91
Other N Fertilisers 3,323 3,162 -4.84
Total 362,734 376,355 3.75
*September to October sales year (Source: DAFM 2020)
3. Results
It is important to appreciate that some factors influencing the various indicator measures presented here are partially within the control of an individual farmer (e.g. input use efficiency), whereas others factors are outside of an individual farmer’s control (e.g. farm output prices, weather conditions, soil quality). Since farming is influenced by weather conditions, which vary from year to year, and which therefore may affect the level of production or the level of input utilisation in a given year, this limits the inferences that can be drawn from one year movements in such time series, as this contains both the signal and noise components. The use of a three year rolling average based measure would allow for the signal component of the indicator to be more apparent and that is the approach adopted here when reporting results.

ANNUAL REVIEW AND OUTLOOK 2021
Outlook 2021 | Sustainability 98
3.1 GHG Emissions
Agriculture is the largest contributor to Irish greenhouse gas emissions by sector, with 34 percent of the national emissions total in 2018 (Environmental Protection Agency, 2020). The agricultural sector is required to reduce its emissions in the context of Ireland’s commitment to reduce national GHG emissions. The National Climate Action Plan has set an emissions reduction target for 2030 of between 10-15 percent for the agriculture sector (Government of Ireland, 2019). The Climate Action and Low Carbon Development (Amendment) Bill 2020 (Government of Ireland, 2020) proposes a net-zero greenhouse gas emissions by 2050 for the State.
The GHG emissions’ indicators in this analysis are estimated following the IPCC methodology accounting conventions and Irish emission factors, as employed in the 2018 National Inventory Report for Ireland (Duffy et al., 2020). The three main agricultural emissions categories are methane (CH4) emissions from enteric fermentation (EF) by ruminant livestock, CH4 and nitrous oxide (N2O) emissions from the manure management (MM) (production and storage of livestock manures) and N2O emissions resulting from the application of manures and chemical fertilisers to agricultural soils. Additional CO2 emissions associated with liming and urea application are also included in the analysis but represent minor elements. For reporting purposes, all non-carbon dioxide (CO2) emissions are converted to CO2 equivalents (CO2e) using appropriate IPCC based global warming potentials for CH4 and N2O.
Figure 2 presents historical results by emission category from 2014 to 2019 on a 3 year rolling average basis (e.g. 2014-2016 is the average of the years 2014, 2015 and 2016).
The 2018-2020e results includes an estimate for emissions in 2020 based on projected changes in activity levels, as set out in section 2 above. Results from Figure 2 show an increasing trend in per hectare GHG emissions on dairy farms. As outlined by Buckley & Donnellan (2020b), this is due to increases in average herd size overriding GHG efficiency gains per unit of product. This is reflected in the increasing trend in per hectare CO2e emissions from Enteric Fermentation (EF) which directly relates to animal numbers. Increases in animal numbers are also reflected in manure management (MM) and fertilisers applied to agricultural soils categories.
Figure 2: Dairy Farm GHG Emissions by emission category - Rolling 3 year average
Figure 3 presents GHG per hectare results by emission category on cattle farms. In contrast to the dairying results, per hectare GHG emission have been declining on cattle farms since the middle of the study period, as observed in Figure 3.
Figure 3: Cattle Farm GHG Emissions by emission category - Rolling 3 year average
Figure 4 reports GHG emissions per hectare by emission category on sheep farms. Similar to cattle farms results indicate that per hectare GHG emissions have been declining on sheep farms since the middle of the study period. This has been primarily driven by reductions in the Enteric Fermentation component.
GHG per hectare results by emission category on tillage farms are presented in Figure 5. In contrast to other farm systems, GHG emissions per hectare have been steadily declining on tillage farms over the study period.
0
2
4
6
8
10
2014-2016 2016-2018 2018-2020e
Ton
nes
CO
2 e
qv
per
hec
tare
EF (3.A)
MM(3.B)
Ag. soils(3.D)
Liming(3.G)
Urea(3.H)
All Ag.GHG
0
1
2
3
4
5
2014-2016 2016-2018 2018-2020e
Ton
nes
CO
2eq
v p
er h
ecta
re
EF(3.A)
MM(3.B)
Ag.soils(3.D)Liming(3.G)
Urea(3.H)

ANNUAL REVIEW AND OUTLOOK 2021
99 Sustainability | Outlook 2021
Figure 4: Sheep Farm GHG Emissions by emission category - Rolling 3 year average
Figure 5: Tillage Farm GHG Emissions by emission category - Rolling 3 year average
Figure 6 illustrates trends in total GHG emissions per hectare across the different farm types.
Figure 6: Total GHG Emissions (CO2e) per hectare by farm type - Rolling 3 Year average
On a per hectare basis dairy farms tended to emit GHG emissions that were 2-2.5 times higher than cattle and sheep farms respectively and 4 times that of tillage farms over the study period. As observed in Figure 6, GHG emissions have been increasing on dairy farms over the study period, whereas for the other farm types emissions have tended to be declining since the start/middle of the study period.
Figure 7 interacts the economic and environmental dimensions of sustainability by exploring the kg of CO2e per euro of gross output generated across the different farm types. Due to the lower revenue generating capacity of cattle and sheep farms they have higher level of GHG emission per euro of output generated over the study period. Although dairy farms generate the highest level of absolute emissions (as observed in Figure 7), they also have high revenue generating capacity, which means they are only second behind tillage when it comes to GHG emission per euro of output. Tillage farms have the lowest absolute levels of GHG emissions per hectare and have the second highest revenue generating capacity (behind dairying). Hence, this combination leads to the lowest GHG emission per euro of output being associated with tillage farms.
Figure 7: Total GHG Emissions (CO2e) per euro of gross output by farm type - Rolling 3 Year average
3.2 Ammonia Emissions
Ammonia (NH3) is an air pollutant contributing to eutrophication and acidification of terrestrial and aquatic ecosystems. It is also an indirect source of a potent greenhouse gas N20 (Sutton et al., 1992). The EU and its Member States are parties to the Convention on Long-Range Transboundary Air Pollution, which regulates trans-boundary air pollutants, including NH3. Within the EU, NH3
0
1
2
3
4
2014-2016 2016-2018 2018-2020e
Ton
nes
CO
2eq
v p
er h
ecta
re
EF (3.A)
MM(3.B)
Ag. soils(3.D)
Liming(3.G)
Urea(3.H)
All Ag.GHG
0
1
2
3
2014-2016 2016-2018 2018-2020e
Ton
nes
CO
2eq
v p
er h
ecta
re
EF (3.A)
MM(3.B)
Ag. soils(3.D)
Liming(3.G)
Urea(3.H)
All Ag.GHG
0
3
5
8
10
2014-2016 2016-2018 2018-2020e
Ton
nes
CO
2eq
v p
er h
ecta
re
Dairy
Cattle
Sheep
Tillage
0
1
2
3
4
5
6
2014-2016 2016-2018 2018-2020e
kg C
O2
eqv
euro
Gro
ss O
utp
ut Dairy
Cattle
Sheep
Tillage

ANNUAL REVIEW AND OUTLOOK 2021
Outlook 2021 | Sustainability 100
emissions are regulated through the National Emissions Ceiling (NEC) Directive (EU, Commission 2016). Over 99 percent of Ireland’s ammonia emissions originate within agriculture, with their source being animal waste (manure management) and the application of chemical fertilisers (Environmental Protection Agency, 2019). The fact that ammonia emissions in Ireland come almost exclusively from agriculture, means that any future national ammonia reduction target for Ireland would de facto represent a reduction target to be achieved by the agriculture sector.
The national inventory accounting methodology, as applied by the Environmental Protection Agency (Duffy et al., 2019) in conjunction with the projected activity data for NFS farms in 2020 (as set out in section 2) is used for estimating NH3 emission indicators across different farm types for 2020. Results are again presented on a 3 year rolling average basis.
Figure 8 outlines the amount (in kg) of NH3 emissions per hectare on dairy farms. The manure management (MM) category, linked to manure generated from animals during the winter housing period, is the largest category of NH3 emissions. This covers the housing, storage and land spreading phases of manure management.
Figure 8: Dairy Farm NH3 emissions by category - Rolling 3 Year average
This category of emissions, as well as that associated with the application of chemical N fertilisers, increased over the study period. However, it should be noted that the effect of transition to low emission slurry spreading (LESS) that may have occurred in 2020 is not included in this analysis.
NH3 emissions on cattle farms are outlined in Figure 9. The emission profile is similar to that on dairy
farms in terms of the relative contribution of different emission categories (all be it total emission are significantly lower. In contrast to dairy farms, total per hectare NH3 emissions have be in decline since the middle of the study.
Figure 9: Cattle Farm NH3 emissions (kg NH3 ha-1) by category - Rolling 3 Year average
Figure 10 reports kg of NH3 emission per hectare on sheep farms. The emission profile is similar to that of cattle farms (overall per hectare emissions are however lower). Again, similar to cattle farms, average per hectare NH3 emissions on sheep farms have declined since the middle of the study period.
Figure 10: Sheep Farm NH3 emissions by category - Rolling 3 Year average
NH3 emissions on tillage farms are reported in Figure 11. Although these farms are classified as specialist tillage farms, on average, they have a significant cattle or sheep enterprises (or both) and this is reflected in the emission profile in Figure 11. In contrast to the other farm types, NH3 emissions per hectare has tended to follow a declining trend over the study period on tillage farms.
0
10
20
30
40
50
2014-2016 2016-2018 2018-2020e
kg N
H3
per
hec
tare
M.M.
ChemicalN
Grazing
Total
0
5
10
15
20
25
2014-2016 2016-2018 2018-2020e
kg N
H3
per
hec
tare
M.M.
ChemicalN
Grazing
Total
0
3
6
9
12
15
2014-2016 2016-2018 2018-2020e
kg N
H3
per
hec
tare
M.M.
ChemicalN
Grazing
Total

ANNUAL REVIEW AND OUTLOOK 2021
101 Sustainability | Outlook 2021
Figure 11: Tillage Farm NH3 emissions by category - Rolling 3 Year average
Figure 12 illustrates trends in total NH3 per hectare across the different farm types. Dairy farms on average tended to have NH3 emissions per hectare that were 2 times greater than that cattle farms, 4 times that of sheep farms and 5.5 times that of tillage farms. As observed in Figure 12, NH3 emissions have been increasing on dairy farms over the study period, whereas for the other farm types emissions have tended to be declining since the start/middle of the study period.
Figure 12: Total NH3 Emissions (kg per hectare) by farm type - Rolling 3 Year average
Figure 13 again interacts the economic and environmental dimensions by examining the amount (in kg) of NH3 emissions per euro of gross output generated across the different farm types.
Due to the lower revenue generating capacity on cattle farms and relatively higher levels of NH3
emissions (compared to sheep and tillage farms) as observed in Figure 13 cattle farms have the highest
level of NH3 emissions per euro of output over the study period.
Figure 13: Total NH3 Emissions per € output by farm type - Rolling 3 Year average
Similar to the situation with GHG emissions, dairy farms generate the highest level of absolute NH3 emissions (as observed in Figure 13) but they also have the highest revenue generating capacity. Consequently, it was found that dairy farms had significantly lower NH3 emissions per euro of output compared to cattle farms and their NH3 emissions per euro of output were at a level similar to sheep farms. Tillage farms had the lowest levels of NH3 emissions per euro of output generated, mirroring the findings in respect of their GHG emissions per unit of output.
4. Summary conclusion
Per hectare GHG and NH3 emissions across dairy farms tended to increase across the study period to 2020.
Per hectare GHG and NH3 emissions on cattle and sheep farms tended to decline from the middle to the end of the period to 2020.
GHG and NH3 emission per hectare on tillage farms steadily declined over the course of the study period.
Dairy farms on average had GHG emissions per hectare that were 2-4 times higher than cattle, sheep and tillage farms respectively over the period examined.
Cattle farms generated the highest level of GHG emission per euro of output generated, followed by sheep farms. On average dairy farmers had the second lowest level of GHG
0
2
4
6
8
10
2014-2016 2016-2018 2018-2020e
kg N
H3
per
hec
tare
M.M.
ChemicalN
Grazing
Total
0
10
20
30
40
50
2014-2016 2016-2018 2018-2020e
kg N
H3
per
hec
tare
Dairy
Cattle
Sheep
Tillage
0.00
0.01
0.02
0.03
2014-2016 2016-2018 2018-2020ekg
NH
3p
er e
uro
Gro
ss O
utp
ut
Dairy
Cattle
Sheep
Tillage

ANNUAL REVIEW AND OUTLOOK 2021
Outlook 2021 | Sustainability 102
emission per € of output, with tillage farms being the lowest.
NH3 emissions per hectare on dairy farms were 2, 4 and 5.5 times higher than those of cattle, sheep and tillage farms respectively.
Cattle farms had the highest level of NH3 emission per euro of output generated. Conversely, tillage farms generated the lowest level of NH3 emissions per euro of output, with sheep and dairy farms falling in between cattle and tillage farms on this metric.
References
Buckley, C and Donnellan, T., 2020a. Teagasc National Farm Survey 2019 Sustainability Report.https://www.teagasc.ie/media/website/publications/2020/NFS-2019-Sustainability-Report.pdf
Buckley, C and Donnellan, T., 2020a Teagasc National Farm Survey 2019 Sustainability presentation.https://www.teagasc.ie/media/website/publications/2020/Teagasc-National-Farm-Survey-2019-Sustainability-Report-Presentation.pdf
Central Statistics Office, 2020. Number of Cattle in June by Type of Cattle, Year and Region and County. https://statbank.cso.ie/px/pxeirestat/Statire/SelectVarVal/Define.asp?maintable=AAA09&PLanguage=0
Department of Agriculture, Food and the Marine, 2020. Fertiliser Sales from 1st October 2019 to 30th September 2020.
Donnellan, T., Moran, B., Lennon, J., Dillon, E., 2020. Teagasc National Farm Survey 2019 Preliminary Results.
https://www.teagasc.ie/media/website/publications/2020/TeagascNFS2019-Preliminary-Results.pdf
Duffy, P., Hyde, B., Ryan, A.M. Murphy, J., Quirke, B. & Fahey, D., 2019. Informative inventory report 2019 air pollutant emissions in Ireland 1990–2017 reported to the secretariat of the unece convention on long-range transboundary air pollution and to the European Union. https://www.epa.ie/pubs/reports/air/airemissions/airpollutantemissions/iir2019/IIR_2019_Final%2001.05.19_Cover.v2.pdf
Duffy, P., Black, K., Fahey, D., Hyde, B., Kehoe, A., Murphy, J., Quirke, B., Ryan, A.M. & Ponzi, J. 2020. Ireland National inventory report 2020 greenhouse gas emissions 1990 - 2018 reported to the United Nations framework convention on climate change. Available at: http://www.epa.ie/pubs/reports/air/airemissions/ghg/nir2020/NIR%202020_Merge_finalv2.pdf
European Commission, 2016. Directive 2016/2284 of the European Parliament and of the Council of 14 December 2016 on the reduction of national emissions of certain atmospheric pollutants, amending Directive 2003/35/EC and repealing Directive 2001/81/EC. https://eur-lex.europa.eu/legal-content/EN/TXT/PDF/?uri=CELEX:32016L2284&from=EN
Environmental Protection Agency, 2019. Ireland’s transboundary gas emissions 1990-2030. Environmental Protection Agency. https://www.epa.ie/pubs/reports/air/airemissions/irelandsairpollutantemissions2017/Irelands%20Air%20Pollutant%20Emissions%202017.pdf
Environmental Protection Agency, 2020. Environmental Indicators. Climate – Greenhouse gas by sector. Available at: https://www.epa.ie/ghg/indicatorsprogresstotargets/#:~:text=Ireland's%20emissions%20profile%20has%20changed,total%20national%20emissions%20in%202018*
Government of Ireland, 2019, Climate Action Plan. Available: https://assets.gov.ie/25419/c97cdecddf8c49ab976e773d4e11e515.pdf
Government of Ireland, 2020, Climate Action and Low Carbon Development (Amendment) Bill 2020.
https://www.gov.ie/en/publication/984d2-climate-action-and-low-carbon-development-amendment-bill-2020/
Hanrahan, K., 2020. Personal communication.
Sutton, M.A., Moncrieff, J.B. & Fowler, D., 1992. Deposition of atmospheric ammonia to moorlands. Environmental Pollution, 75, 15–24.
ANNUAL REVIEW AND OUTLOOK 2021
103 Sustainability | Outlook 2021
Acknowledgements
The author would like to acknowledge the staff of the Teagasc National Farm Survey for the collection and provision of data. The authors also appreciate the contributions made from colleagues. Any errors or omissions remain the sole responsibility of the author.
